


Foreword

Introduction
Medway p4-7
Test & Itchen p8-13
Warwickshire Avon p14-17
Nidd p18-20

Foreword
Introduction
Medway p4-7
Test & Itchen p8-13
Warwickshire Avon p14-17
Nidd p18-20
Our freshwater habitats are in crisis — a fact now widely recognised by the public, politicians, and regulators Of course, many of us anglers already knew this, having witnessed the decline in water quality at our favourite fishing spots.
It is a great honour for me to introduce this 2nd annual report, which analyses data collected between July 2023 and July 2024 by our outstanding community of volunteer testers the driving force behind the network.
Since our last report, a new government has taken office, bringing with it a raft of legislation that will shape the future of our freshwater environments for better or worse.
Anglers have admirably stepped up to the challenge. This report sheds further light on the dire state of our rivers and shows how anglers are using data to deepen our understanding of water pollution and to influence the future of river management when recognised as legitimate stakeholders in decisionmaking processes.
Glyn Marshall, WQMN Volunteer:
“I am amazed at how quickly the WQMN has expanded It is now recognised as a powerful group looking after our waterways. Regular discussions are taking place with regulators, local councils and other interested parties, as anglers lead the way in fighting for our rivers.”
The network has demonstrated that being armed with data is the first step towards putting effective plans in place to protect and restore polluted rivers. Across the country, anglers have used their WQMN data to press politicians from parish councillors to Cabinet members into action. The data is informing campaigns and shaping conversations with water companies, industrial representatives, farming groups, and the media. In short, the data is driving change.
I hope this report gives you a sense of what the Angling Trust & Fish Legal are doing to support the fight against pollution. If you care about the health of our waters but aren’t yet a member of the Angling Trust & Fish Legal, why not become a member, support the WQMN, and help protect your local river, estuary, or lake?
Jamie Cook, CEO, Angling Trust & Fish Legal
For decades, a deadly cocktail of pollutants has entered our rivers as agricultural chemicals and human waste flows into waterways. More than 3.6 million hours of untreated sewage flooded our rivers in 2024 alone.
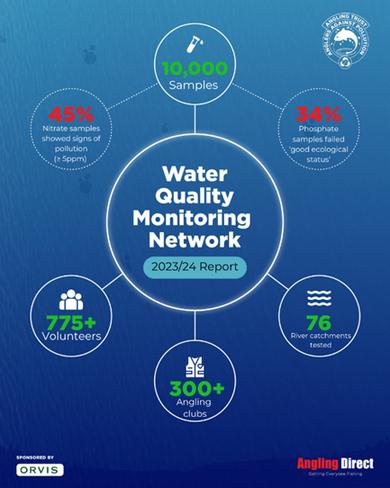
Under the Water Framework Directive (WFD), Phosphate concentration remains the Environment Agency’s (EA) main metric for assessing chemical health. The conservative upper limit of good ecological status (GES) for Phosphate is 0.306ppm, which was breached by 34% of the nearly 4000 samples analysed in this report
Whilst the WFD does not set an upper limit of Nitrate concentration in freshwaters, it does play a significant role in eutrophication, with harmful effects on natural habitats. Our volunteers are provided with the guidance that Nitrate concentrations of 5ppm or more is excessive, which was exceeded by 45% of samples
As the WQMN approaches 10,000 samples collected in England and Wales, we have built up a detailed picture of pollution That pollution is not evenly spread - 100% of regularly monitored sites in the Medway catchment and 86% site in Avon Warwickshire failed to meet good ecological status.
The WQMN continues to grow on rivers and beyond. It has recently expanded into estuaries, and will soon spread into still waters.
showing sample locations
When recognised as stakeholders at the catchment scale, anglers and other environmental groups can drive change in the management of their previous rivers. The case studies which follow highlight 4 of their stories
This report paints a picture of the continued ill health of our rivers and the systemic failure to make the rapid shifts in governance needed to bring them back to life. Listening to citizen science initiatives like this one is essential to this process
Analysis was prepared by Dr Eleanor Kean (Independent Environmental Researcher) and Dr Liz Bagshaw (Associate Professor, University of Bristol). Additional analysis, mainly on Nitrate pollution was performed by the Angling Trust
Alex Farquhar - Angling Trust, Campaigns & Advocacy Officer
The database collected by WQMN volunteers does not sit idly in a spreadsheet – it is used to deliver campaigns which make a tangible impact on our waterways Four case studies celebrate the remarkable achievements of anglers and other environmental groups, who have collaborated with government, regulators and water companies to turn the tide on pollution.
Before diving into the case studies, two stories help capture the essence of what the WQMN’s campaigning can deliver.
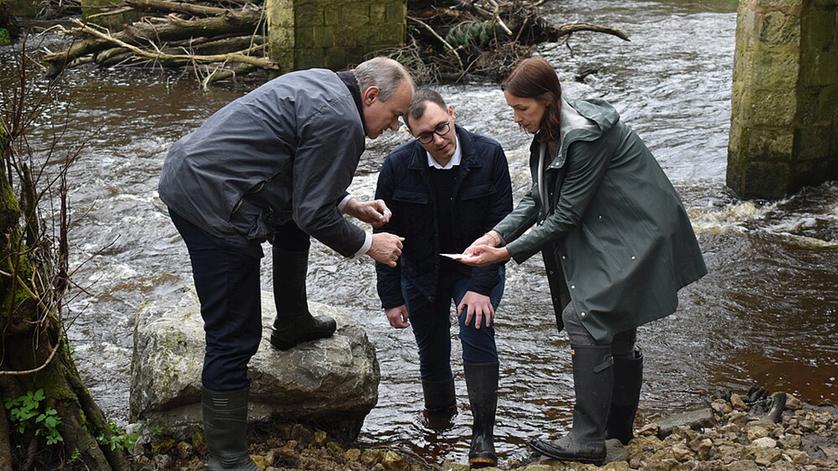
The Test and Itchen Association (T&IA) was formed in 1907 to promote fly fishing on both rivers. 116 years later, they joined the WQMN having seen drastic declines in river health In March 2024, they joined a coalition of riverkeepers to protest Southern Water’s rampant sewage dumping at the Fullerton Waste Water Treatment Works
The site had been operating to permit, not capacity, and was being overrun by water tankered in from leaky pipes.
“In our catchment there is a common goal amongst anglers, environmental groups, and many others, in improving the health of our rivers as they are the lifeblood of the natural environment and our local economy.”
- Paul Vignaux, Executive Director of the
T&IA
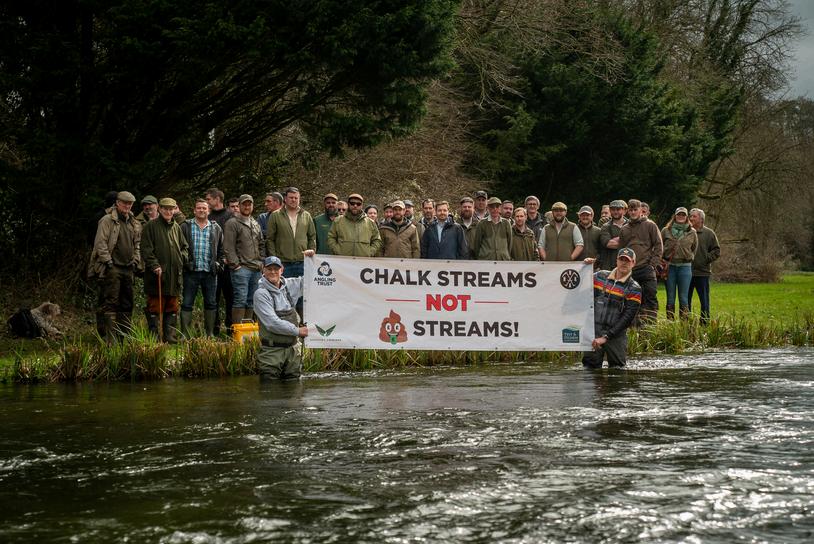
protest, March 2024
Following the protest, Southern Water increased the capacity by 60%, drastically reducing sewage spills. Water companies working to permit, not capacity is an absurd issue nationwide. Campaigners on the River Test have shown that sanity can prevail when local groups identify, understand, and protest against the polluters responsible.
The Nidd Action Group (NAG) sprung out of local fly-fishermen’s concern about deteriorating water quality. Widespread concern was ignited by WQMN volunteers’ work, which revealed the extent of pollution in the Nidd. Working with Harrogate MP Tom Gordon, they successfully campaigned to achieve bathing water status for the Lido at Knaresborough
NAG, along with many groups across England and Wales, have used citizen science to establish themselves as stakeholders in decision making processes Working with politicians, regulators, universities and a community of campaigners, they demonstrate the power of data-driven, collaborative campaigns.
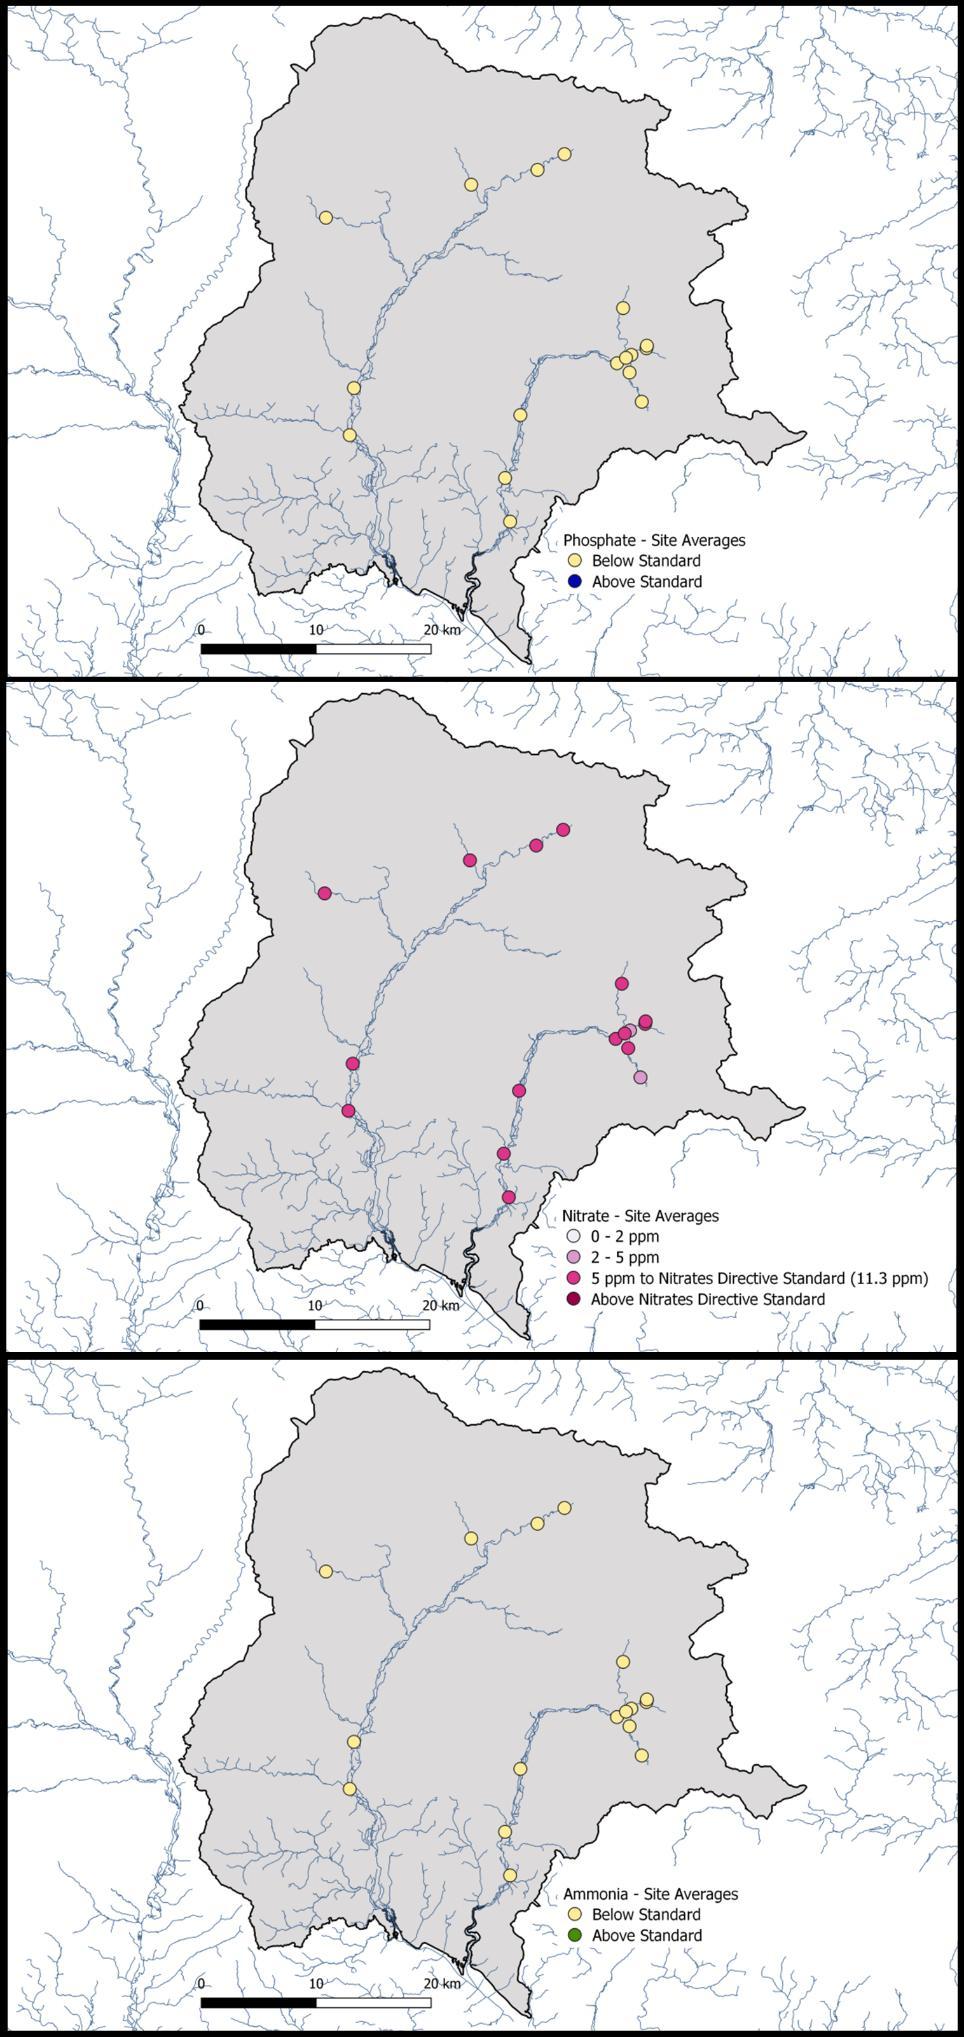
15 sites in the Medway catchment were monitored at least 8 times between July 2023 – July 2024. EVERY SINGLE ONE breached the upper limit for good ecological status (GES) due to high Phosphate levels. The Royal Tunbridge Wells Angling Society (RTWAS) helped reveal this startling fact, and have taken tortuous steps to earn the ear of the Environment Agency and Southern Water. The message is clear: Clean up our rivers!
The RTWAS is a small angling club of around 350 members and has stewardship of some 10+ miles of the upper River Medway catchment, including Medway , Kentish Eden, River Grom, Eridge Stream on the Kent/Sussex boarders.
Thanks to RTWAS and other groups’ commitment to monthly samples for nearly 3 years, the data set they have collected is extremely robust.
Analysis by our independent researchers of their 279 samples between July 2023 - July 2024 revealed extreme pollution concerns:
100% of 14 phosphate site averages in the Medway catchment were above GES for Phosphate. Yes, 100%!
8 records of visible pollution, including 5 algal blooms
Sky high Ammonia and Phosphate readings
On 4 rivers monitored by RTWAS within the Medway catchment, the Angling Trust found: The average Phosphate reading was 0.672 – more than double the upper limit under the WFD
45% of Nitrate readings were above 5ppm.
These figures make for tough reading, and no doubt, a tough life underwater for surviving wildlife Wanting to gain an even deeper understanding of their rivers, RTWAS have expanded their
testing arsenal to monitor a total of 10 key indicators of water quality: Phosphate, Nitrate, electrical conductivity, temperature, Ammonia, E coli, turbidity, pH, dissolved oxygen, and Riverfly invertebrate studies.
It took a long time for the EA to recognise the RTWAS and the issues they identified, as their standard answer was always “runoff” causing the issues. At one point the EA questioned their methods and results and stated that their results were considerably different to the EA’s. It transpired that the EA were measuring Phosphate where RTWAS were measuring Orthosphosphate. A simple conversion rate was applied and all results then came with 2% of each other!
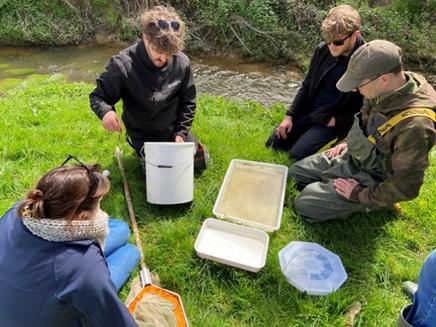
There are two lessons here. First, citizen science methods produce reliable data, which closely track that produced by the EA. Second, to learn from citizen scientists, the first step was the EA to actually listen. To reveal the correspondence between WQMN results and the EA, the RTWA created a joint monitoring group. They employed the “one bucket” approach in that they met at a location where the EA had been sampling, took one large sample and all tested it. Pollution levels were high, but the results the same.
The failure of the EA to listen to citizen scientists continues today, but they have started to give more recognition to the vital role citizen science can play. Perhaps nowhere is this shift more apparent than on the Medway It took some time but the RTWAS and EA eventually proved, without doubt, that >90% of pollution issues were from direct outputs and outflows from waste water treatment works and CSO’sboth of which are the responsibility of Southern Water.
On the strength of the data, the EA agreed to place 24/7 monitoring equipment up and downstream of
a treated sewage outfall. This was in place for 6 months over the winter with huge amount of data, good and bad, obtained. The EA are interrogating this now and actions are planned.
“Due to the very significant amount of information, reporting and data we provided to the EA we believe we were instrumental in the appointment of a new Senior Environmental Monitoring Officer/Citizen Science Lead. Since they have been in post, we now have an extremely close working relationship and are actively working
Despite several attempts and the amount of data they provided, it took over a year to get Southern Water (SW) to talk to RTWAS on a formal basis Since opening a dialogue through regular meetings and a direct line with staff, they have made the first steps forward:
With RTWAS’s input, SW have changed their pollution reporting system from a “helpline” phone number that was all but impossible to get through on to a user-friendly online reporting and feedback system. The jury is out but indications are that this is a workable system
Secured a 5 figure grant for enhanced WQ test equipment
The elephant in the room remains the fact that >90% of pollution issues were traced to outputs from Southern Water’s waste water treatment works and CSO’s. Now that they are recognised as stakeholders at the catchment level, RTWAS will continue to work with regulators, local government, water companies and other campaign groups to drive forward the radical change needed to curb the death by a thousand cuts their beloved rivers face.
Not one regularly monitored site in the Medway catchment met good ecological status – there is a mammoth task ahead. Groups like RTWAS offer a glimmer of hope, as revealing the scale of the problem is the first step to finding a solution. The RTWAS now have the ear of the EA and Southern Water, who are jointly responsible for the failure to protect our rivers. They are also a recognised stakeholder in the Medway Catchment Partnership.
Following RTWAS’s partnership with Sussex University’s Ripple Effect Citizen Science project, the whole of the Upper Medway is now covered. Groups are not only collecting, but sharing data measuring 10 parameters across the Medway catchment.
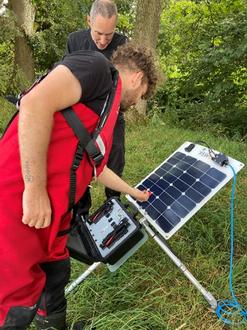
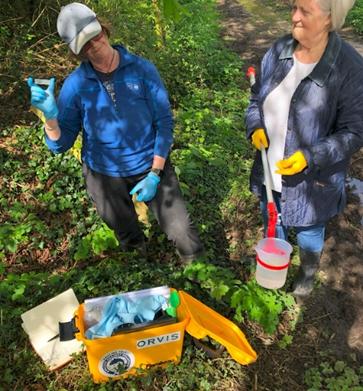
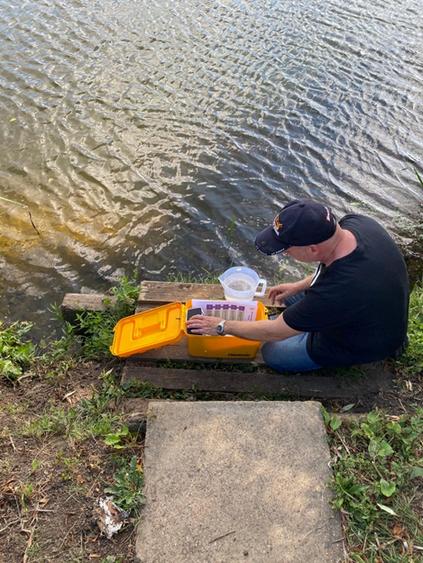
Volunteers using their impressive array of monitoring equipment
Anglers and other groups are collecting hundreds of water samples in the catchment every year. Common sense demands the powers that be to hear their voices when making decisions about rivers they not only care for but understand so deeply. The RTWAS have fought to get in the room with water companies and regulators, and will carry on the fight for the radical changes which are so desperately overdue.
Our thanks goes to the dozens of volunteers in the Medway catchment for their dedication to regular water sampling and their campaigning to push citizen science up the agenda. Special thanks to Ian Tucker for sharing the RTWAS’s story with us in this piece.
The rivers in the Test and Itchen Catchment are iconic chalk fishing streams with flora and fauna that are highly adapted to the unique conditions: constant temperature, alkaline pH, ground water fed. They are the most biodiverse of the English rivers
The Test and Itchen Association (T&IA) was formed in 1907 to promote fly fishing on both rivers. 118 years later, they are at the heart of a thriving network of groups in the catchment who monitor, campaign for, and directly restore the rivers they call home.
A healthy chalk stream is very sensitive to any reductions in flow, water quality or disruptions to the river’s form and habitat The 60% decline in fly life since 1960 and the rapid reduction in returning salmon numbers are indicators that all is not well and is causing alarm on the rivers. Whilst idyllic in the rural chalk downs of Hampshire, the rivers have been highly modified over centuries to support agriculture, milling and navigation They also suffer pressures from heavy abstraction, farming practices and road run off - our chalk streams are not in a good condition.
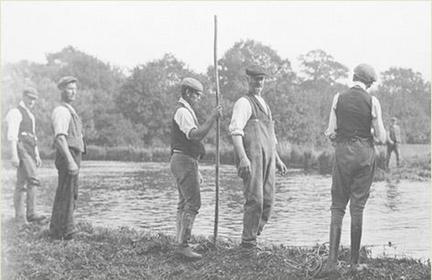
River work – Mottisfont 1910, from T&II website.
There have been some severe pollution events from sewage treatment works (STWs) on the rivers which flow through highly urbanized areas such as Andover, Winchester and Southampton. Southern Water (SW) has been fined several times for these events and there are ongoing cases.
“In our catchment there is a common goal amongst anglers, environmental groups, and many others, in improving the health of our rivers as they are the lifeblood of the natural environment and our local economy.”
-
Paul Vignaux, Executive Director of the T&IA
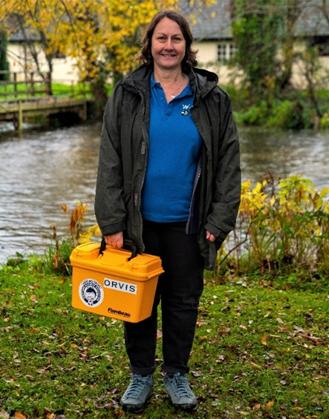
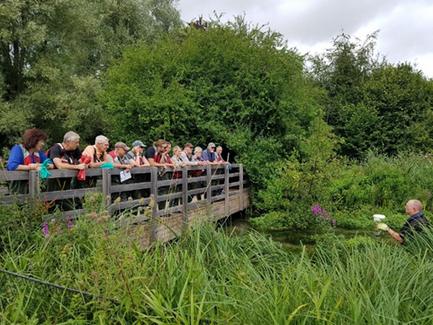
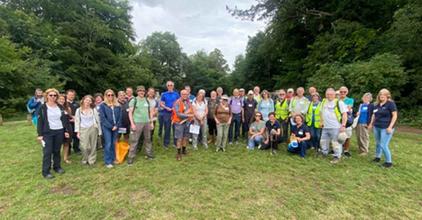
Kathryn Boler, Project Manager for the Watercress and Winterbournes on WQMN launch day
Seeing river health decline, a network of river keepers and other Wildlife Trust volunteers were already doing river fly sampling and in partnership with WildFish before the WQMN was established. T&IAhave been involved with invertebrate species sampling at numerous sites on the Test and Itchen since 2015.
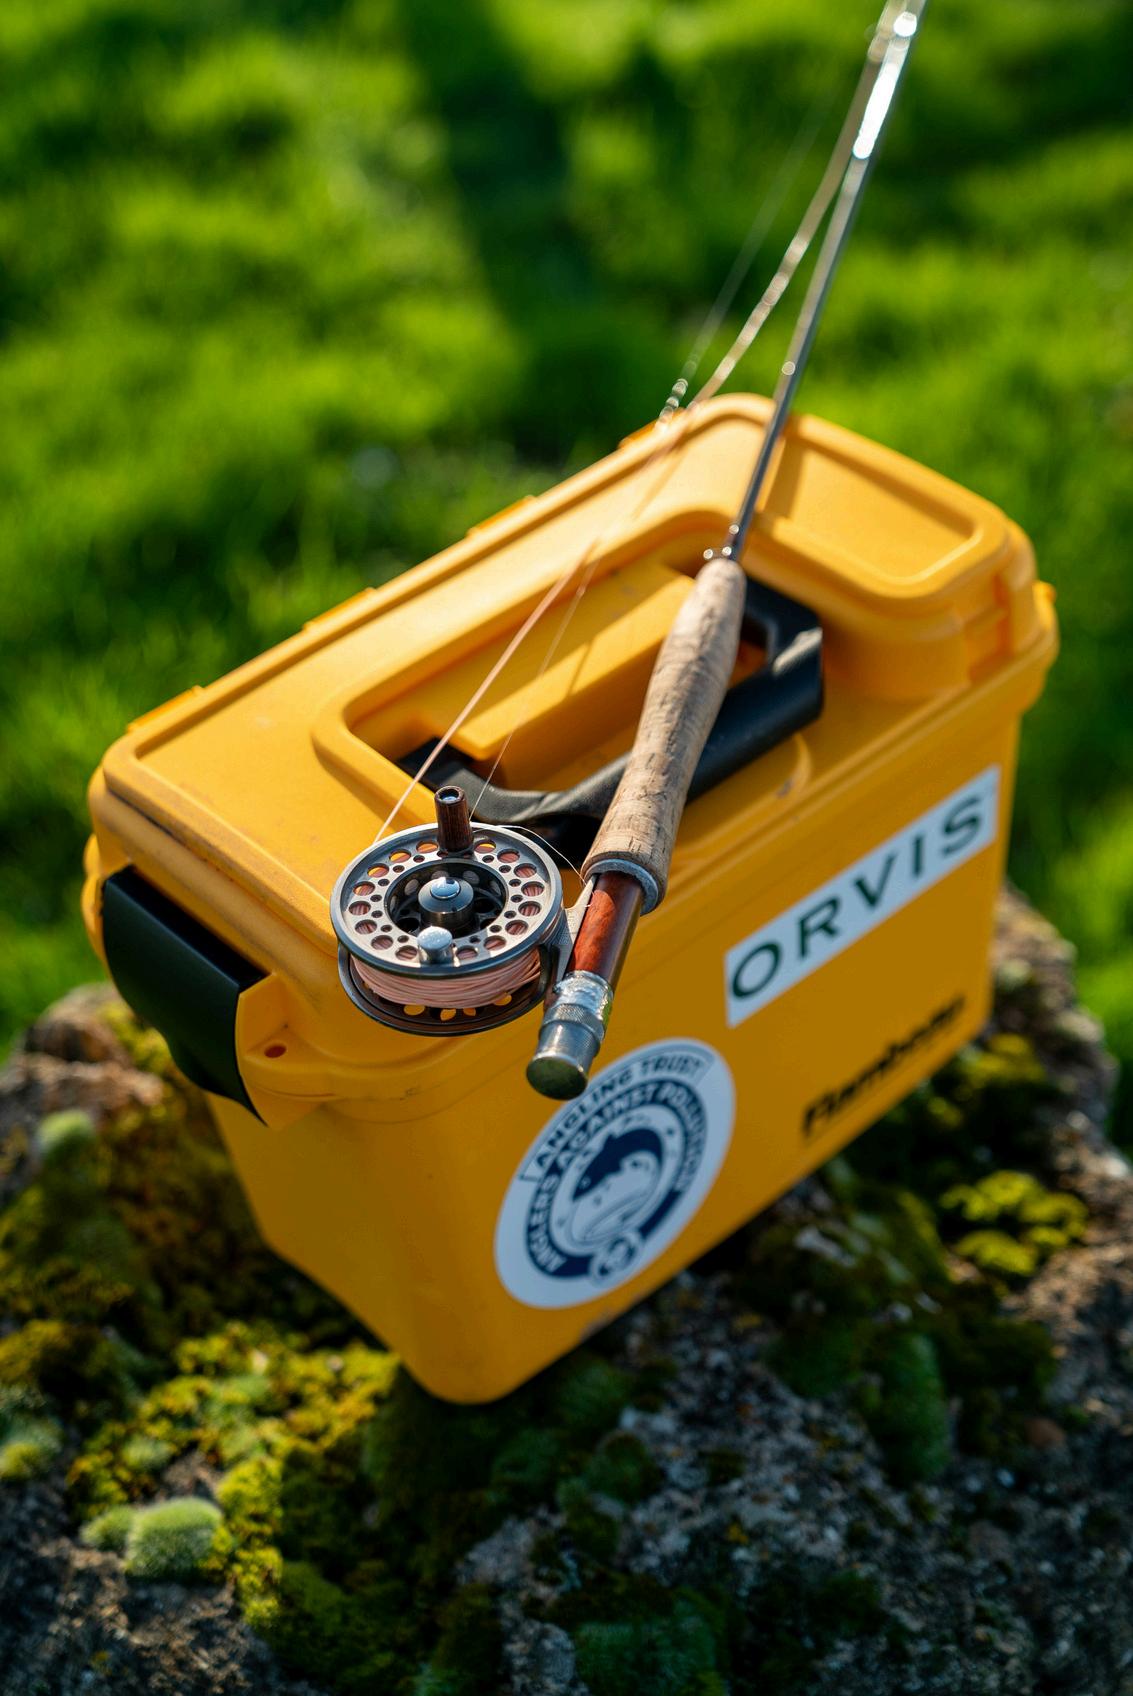
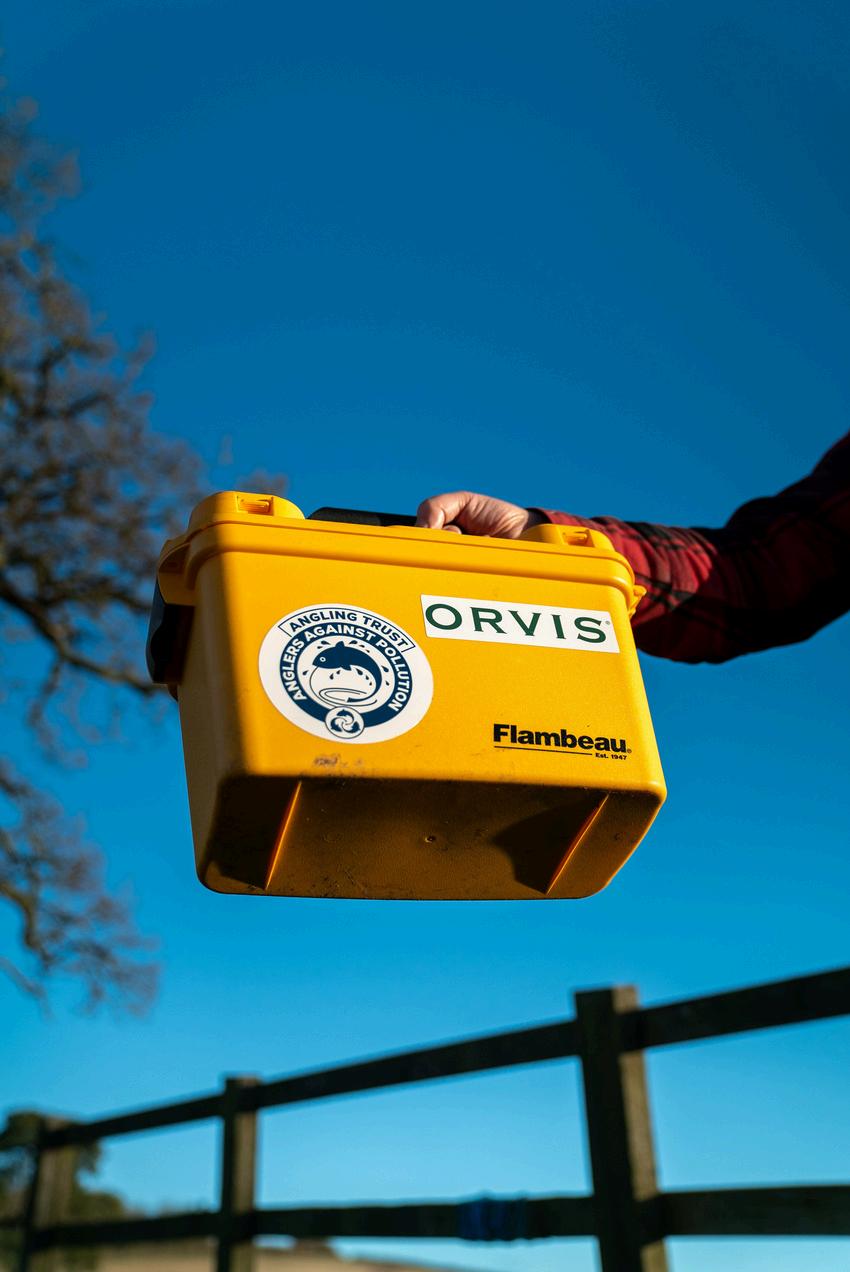
Against this backdrop there was a ready pool of volunteers to establish a WQMN network In Dec 2023 the T&IA and the Watercress and Winterbournes (a National Lottery funded Landscape Partnership Scheme working on the headwaters in the catchment), in partnership with Orvis UK and the Angling Trust,
established a comprehensive source to sea network on the two principle rivers and several of the tributaries along with some on the River Meon
The Angling Trust provided training for the 45 volunteers, who formed the first catchment-wide monitoring network from source to sea. They are now monitoring 30 sites every month, analysing their data, and campaigning extensively to ease the pressure on the Test and Itchenboth of which are designated SSSIs.
Between July 2023 - July 2024, volunteers took 286 water samples, which the Angling Trust analysed, revealing extremely high Nitrate levels and other pollution indicators:
89.47% of site averages in the Test & Itchen catchment showed worrying levels of Nitrate pollution (≥5ppm).
Average Nitrate reading on the River Test of 7.12ppm, where 95% of Nitrate readings showed signs of pollution
79.76% of Nitrate readings on the River Itchen were ≥5ppm. 9 64% of Phosphate samples failed GES for Phosphate on the Test and 7.06% on the Itchen.
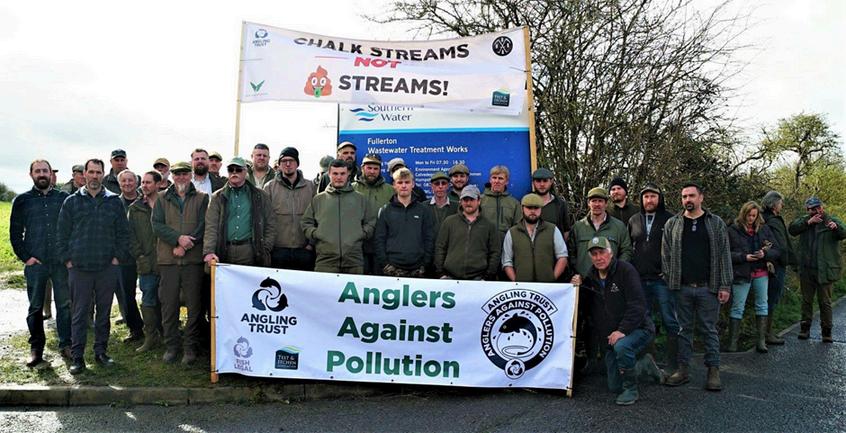
Hampshire River Keepers making their views clear at Fullerton, March ‘24
In early 2024, the Hampshire River Keepers Association (HRKA), Activist Anglers and the T&IA successfully protested and stopped Southern Water from over-pumping sewage from local village highstreets straight into the River Test.
The same group, along with the help of the Angling Trust, came together with WildFish and local villages in March 2024 at the Fullerton Waste Water Treatment Plant to protest ongoing sewage spills into the rivers. These protests were widely covered in local and national media and caused a huge shift in Southern Water’s treatment process, as Southern Water’s CEO described.
Speaking to Environmental Audit Committee, Southern Water CEO, Lawrence Gosden:
“The site, under the permitting regulations, was doing what it was supposed to do, but just because it was doing what it was supposed to do does not mean that that is right for the environment. It was overflowing because of the groundwater point that we related earlier We have taken proactive action We have been able to ramp up the sewage treatment works to increase its capacity and we are now preventing all of those overflows. We did that directly working with local communities, so that we could understand their concerns and take action to stop it.”
The Pilhill Pan Parish Forum, a cluster of eight parish councils for villages around the north of Andover, galvanized Southern Water to solve the problem of pumping and then tankering away (by road) the seasonal influx of groundwater infiltrating into the sewage pipes in their villages. Instead of patch fixing pipes, SW lined the pipes with a twopart compound which solved the problem. In 2020/21 there were 38 tankers per day, in 2024 there were none, despite the record high water levels.
This initiative has dramatically reduced pressure on the Fullerton Waste Water Treatment Plant. By combining forces, local groups are bringing pressure to bear to reduce pollution.
The number of environmental groups in the catchment has boomed in recent years. Watercress and Winterbournes has provided a series of training courses around invertebrate sampling and river habitat management This has greatly supported existing local groups such as the Cheriton Conservation Volunteer Group and The Anton River Conservation Association (TARCA) and developing groups such as the Pillhill Brook Association, the Upper Itchen Restoration Group and the Itchen Invertebrates Group
These groups are now recognised as stakeholders in decision-making processes at the catchment level. The Test and Itchen Catchment Partnership (TICP), co-chaired by Wessex Rivers Trust and Hampshire and Isle of Wight Wildlife Trust has been working hard to protect and restore these SSSI/SAC rivers. Citizen science monitoring and data interpretation has been rising up the agenda and a local EA Citizen Science Lead works closely with local groups to provide support and a vital link with the EA
Matt Owen-Farmer delivering a Riverfly training session
Houghton Parish Council set up the Pan Parish River Pollution Forum in 2024 bringing together a number of villages on the Test concerned about all forms of pollution. They have had local politicians and the MP down to account for themselves and an ongoing dialogue with Southern Water. They also installed their own mobile sonde, with sensors testing temperature, salinity, ammonia, dissolved solids, PH, dissolved oxygen levels, humidity and conductivity.
The HRKA and the T&IA are helping broker the SW roll out of sondes for the Section 82 Continuous Water Quality Monitoring upstream and downstream of storm overflows and outflows from treatment plants.
This local upswell of outrage, curiosity and action has galvanized many across the catchment to work together and this also happens when lobbying politicians in Town Hall meetings, local plan
consultations and getting things done on the river. One such example is Cllr Geoff Cooper securing an undertaking from SW to fund 15 additional sondes over and above the Section 82 sondes for the HRKA to site on the rivers.”
– John Vignaux, Executive Director of the T&IA
T&IA and others continue to use WQMN kits to build monitor river health. Their research methods have broadened out to include several exciting projects Research funded by T&IA and others by PhD researcher Ros Robinson during 2021-2025 found 121 chemicals in the rivers. Of these 61 were from pharmaceuticals and personal care products and 60 from pesticides As a result of those findings, The Upper Itchen Restoration Group, a Community Interest Company, have recently prepared a report on chemical pollution in rivers arising from household cleaning products
The aim is to highlight the hidden chemicals in our household wastewater and to run a campaign on what local householders can do to reduce their use of potentially 12
harmful products and thus protect our chalk streams, particularly in areas and communities with septic tanks The group hope to get local retailers to stock aquatic-friendly household cleaning products. In addition, the group are conducting research with the University of Brighton on the occurrence of micro-plastics in the Upper Itchen. The research is funded by the Watercress & Winterbournes Project and Southern Water. Additional work is also ongoing into road runoff into the upper Itchen chalk streams, in collaboration with the EA, the Hampshire and Isle of Wight Wildllife Trust and the Highways Agency.
Recently the T&IA has set up a Water Expert Group to triangulate all the citizen science data and improve coordination of the training and work of our volunteers.It also aims to help coordinate and fund those university students conducting valuable research on our rivers. This a great addition to the Pilhill Brook Association’s website, which makes all their data accessible to the local community and provides a great foundation for future information sharing.
More than a dozen groups are fighting for the Test and Itchen. This remarkable coalition of river lovers stands as a testament to the power of communities working together to fight those responsible for pollution, and work collaboratively to find solutions. Our thanks goes to all those who monitor, campaign, and fight for their rivers, and those who took the time to share their experiences campaigning for the catchment.
From no fish on the line to a place at the table: How data is used to fight for rivers
In November 2021, several matches on the Avon near Fladbury blanked Testing found Phosphate levels to be 0.91 mg/l – more than 3 times the upper limit for good ecological status (GES). Since this first test, the WQMN has exploded, with 50+ volunteers now monitoring water quality in the Warwickshire Avon catchment.
Nutrient pollution continues today and stretches far beyond Fladbury This annual report reveals that 86.4% of sites regularly sampled in 2023/24 showed average Phosphate readings beyond GES. Note: The groups discussed in this case study operate on the Warwickshire Avon, which sits within the wider Avon Warwickshire catchment.
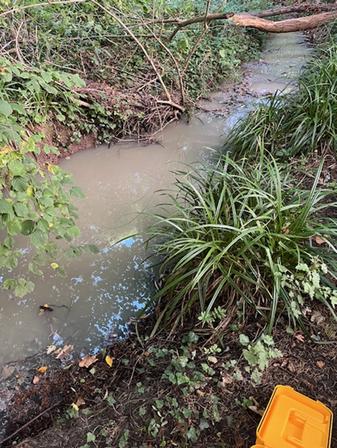
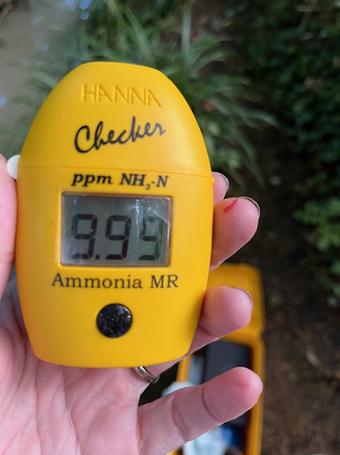
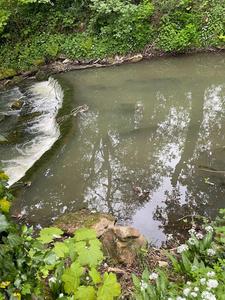
How to report an environmental incident: 19 August 2024 on Basil Brook, Cropthorne. th
Avon River Action Group Water Quality Testing volunteer, Caroline Warren noticed that Basil Brook, Cropthorne which normally runs clear is cloudy and smells of sewage. She found an Ammonia reading over 9.99 and Phosphate reading over 2.5 These findings were immediately reported to the Severn Trent, who responded, found a blockage, and cleared it. Without volunteers reporting clear evidence through the WQMN, this positive response would not have occurred.
317 samples were collected in the Avon Warwickshire catchment between July 2023-July 2024
86.4% of Phosphate site averages breached the upper limit for good ecological status (GES) under the Water Framework Directive (WFD). This is significantly higher than the national average, with 34% of all Phosphate samples being beyond good ecological status
9% of samples were above the extremely high threshold of 11 3ppm set under the Nitrates Directive – the 6 highest percentage out of 102 catchment analysed th
At Fladbury, where testing in the catchment began, 100% of Phosphate readings breached GES and only 1/24 samples showed no signs of Nitrate pollution
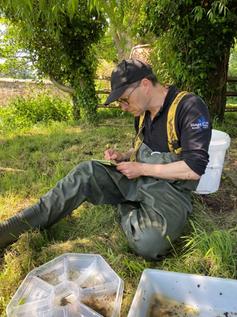
Andy Hammerton water sampling. To date, Andy has taken 46 water samples on the Warwickshire Avon!
“I have lived in the locality for 35 years and as a keen angler have fished the River Avon in this area literally 100s of times. There is clearly a direct correlation between the constant pollution in our area and the decline in fish population, evidenced by the water quality monitoring which I, and many other volunteers have been carrying out over the past three years
River fishing is my passion and being able to pursue this life-long hobby more frequently was always my ultimate goal when I retired from work. I retired last year and now have more time to go fishing, but the devastating reality is that the fish are no longer there in any numbers. I know many river anglers like me will feel deprived of the opportunity to enjoy this pass-time ” - Andy Hammerton, WQMN Volunteer with the Girling Angling Society
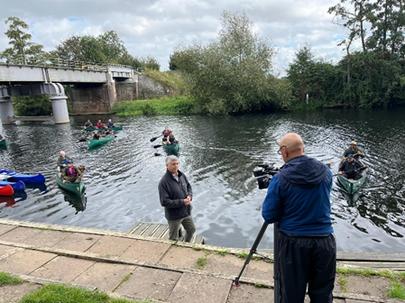
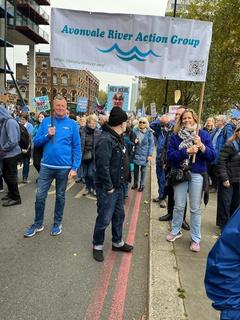
River Avon Action Group filming for local news.
Groups haven’t let data sit idly in a spreadsheet, but used it to inform decision making processes, by collaborating with the wider community, local government, regulators, and water companies. Louise Bugg, founder of the Avonvale River Action Group shares data on their testing, which includes not only WQMN sampling, but will soon be expanded to E coli testing
The Safe Avon shares data between groups to maximise knowledge and impact. They share weekly data reports, gathered and analysed by volunteers seeking to understand the extent of pollution and work to clean it up
Groups like the Girling Angling Society and Avonvale River Action Group are leading the way in not only collecting and sharing data, but shouting from the rooftops in the media to ensure their river’s plight is heard. They have appeared several times in local newspapers and television, including sharing their outrage at the findings of this report Just in the period covered by this report, volunteers
racked up at least 200 hours of monitoring time, and their time is being amplified by the extensive efforts made by local groups to highlight the findings of the large network of citizen scientists.
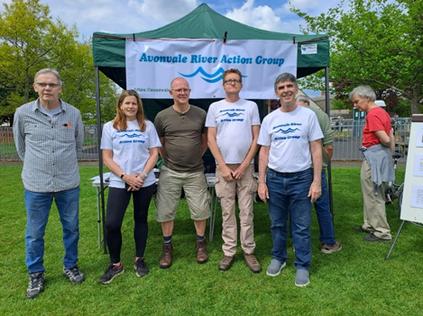
River Avon Action Group sharing information at a local event
“Avonvale River Action Group and others have worked hard to engage with local communities and councils, Severn Trent, The Environment Agency (EA) and the River Severn Partnership We continue to contribute water quality data to an important national citizen science database, and we also respond to incidents discovered by volunteers and residents in our catchment often reporting them to Severn Trent and the EA Our goal remains to improve the health of the River Avon in the Vale of Evesham so that the river is a thriving home for wildlife and a safe environment for us all to enjoy”
Louise Bugg, Founder of Avonvale River Action Group.
Glyn Marshall, WQMN volunteer, and Alex Farquhar, Angling Trust
When they met a few years ago, local groups had one foot in the door of water companies, regulators, and the council They now sit firmly at the table and are making their voice heard in decision-making processes at the catchment level.
Groups in the Warwickshire Avon catchment have a long history of raising incident reports with the EA and WCs[SS1] Perhaps unsurprisingly, given the 86.4% ecological status failure rate in the catchment, there have been plenty of environmental incidents in recent years. Groups have consistently raised them with the EA through their incident reporting hotline, and water companies directly.
They have built up direct contacts with both the EA and Severn Trent Water, which has increased the chances of a response from staff and allowed an open dialogue about the cause of pollution incidents which have devastated fish populations. They are under no illusions that a conversation with water companies and regulators is not the final destination - it is the first step on a long road to river rescue.
“The crash in the fish stocks is clearly due to the irresponsible management of our vital and essential river systems. Many long-standing fishing clubs are struggling to survive due to declining membership and how can we expect to attract young anglers to natural venue river fishing if they are unable to catch fish? While our efforts to force the water companies and EA to improve may be perceived by some to be too little too late, and personally I doubt improvement on any grand scale will be achieved in my lifetime, but my hope is that by applying the pressure now, that my grandchildren will benefit from a clean and safe natural river environment where wildlife and fish will once again flourish” - Andy Hammerton
Rampant sewage pollution, mouth-watering water company profits, continuous sewage discharges, and collapsing fish stocks – a familiar combination of issues led the Harrogate Flyfishers Club (HFC) to join the WQMN in 2022. They’ve contributed to a huge dataset in the Nidd, Swale, and Upper Ouse Catchment, which was analysed by our independent researchers and the Angling Trust.
Across the wider catchment, including the Swale, Nidd and Upper Ouse, volunteers amassed 220 samples between July 2023-July 2024. 16 sites were tested 8 times or more across the catchment, providing a robust dataset for data analysis. We found:
6 out of 16 site averages showed elevated Nitrate levels (≥ 2 ppm) 1 out of 16 site averages was above the WFD Phosphate standard for GES (≥0.306)
Some rivers were significantly worse, with 76.8% of phosphate readings on the Ouse failing to meet GES for phosphates
Large group training session run by the NAG. Image courtesy of the Stray Ferret website
The Nidd Action Group (NAG) sprung out of local fly-fishermen’s concern about deteriorating water quality They have 3 simple aims: Make rivers safe for all, stop sewage pollution, and raise the bar Working with their local MP, councillors, and regulators, their achievements in 2024 were extensive:
Achieved bathing water status for The Lido at Knaresborough, with the support of local Harrogate MP Tom Gordon!
Established volunteer training opportunities to restore the river.
Continued to work with the Environment Agency and other stakeholders to identify pollution hotspots
Won research grants to investigate the Nidd with York University
NAG have been deeply involved in the People’s Commission on the Water Sector Led by 4 academics, it aims to broaden the scope of the governments Independent Commission, primarily by considering alternatives to the privatised model of water provision, which is ruled out by the government’s commission
The People’s Commission is centred on citizen involvement in water reform, and has featured events held by various citizen groups, including the NAG on 31 March 2025. Not least through their commitment to the WQMN, the NAG’s members are experts in their local river They are uniquely positioned amongst stakeholders, because of their intimate ties to the river itself, which many have been fishing for during the years of river health decline
The meeting focused on questions about how to achieve resilient water systems, and brought together local
“The Nidd is getting some attention now , which it wasn't when NAG started The joint efforts over some years of a large number of individuals and groups, including anglers stimulated by the Angling Trust's WQMN project, have made some progress. Now comes the hard part! We need to work with all the agencies involved to develop and make real a sustainable plan for the whole Nidd catchment, making it safe for people and all the life forms in its diverse ecologyl Citizens will need to be at the centre of that plan, not marginalized as they are currently. That will take work - tact, pressure and investment of time and effort. It will be worth it!” David Clayden.
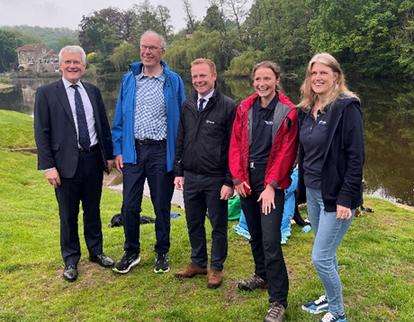
Andrew Jones MP and the then Secretary of State for Water, at the designation of The Lido, Knaresborough as a Bathing water 2024 (with two representatives of the Yorkshire Dales Rivers Trust) local citizens, and industry experts from environmental policy, science and engineering sectors. The knowledge gained through their involvement in this process will be valuable in the years to come, as the NAG continues to fight for the Nidd which risks dying a death by a thousand cuts as Yorkshire Water’s sewage spills continue
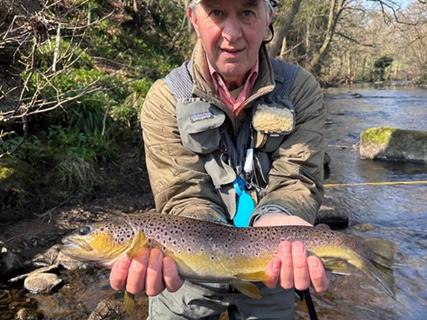
It’s not all bad news! David Clayden with a recent catch
The NAG released their own annual report, which states their objectives for 2025. Whilst they have achieved bathing water status for the Lido at Knaresborough Lido, its water quality has been designated as ‘poor’ In the wider catchment, freshwaters are predominantly classified as in moderate ecological health, but some remain in poor condition.
To fight the situation, they have 6 key objectives:
1) Review and improve the habitats and biodiversity of the Nidd.
2) Reduce pollution of the River Nidd to safe levels through citizen science work.
3) Monitor and impact planning processes and lobby for raised standards
4) Preserve the river as a beautiful place to be, increasing engagement with local communities and the river culturally.
5)Develop a robust NAG committee to implement an action plan and maintain a viable group of volunteers over a period of years.


Data owners:
This report summarises the voluntary work of hundreds of WQMN monitors. The monitoring would not be possible without their efforts.
Report authors:
Dr Eleanor Kean, Independent Environmental Researcher www.eleanorkean.com
Dr Nia Thomas, Independent Environmental Researcher
Dr Liz Bagshaw, Associate Professor, University of Bristol
Version control
Initial draft
Inclusion of updated site averages
Liz Bagshaw review comments incorporated
Angling Trust confirmed last details
The Water Quality Monitoring Network (WQMN) is an initiative of The Angling Trust launched in 2022 to support anglers in understanding the quality of their local waters and to empower them to seek improvements. This report summarises the progress made in the second year of the WQMN, with some focal catchment results mapping for volunteers, local catchment managers and others to visualise local spatial trends.
Using low-cost, and tried and tested, water quality monitoring methods, in this second-year volunteers have made almost 4000 measurements of nitrate, phosphate, ammonia, electrical conductivity, temperature and turbidity on 76 catchments across England and Wales, along with visual observations and photographs. The majority of nutrient measurements were within ranges thought to not be indicative of pollution, and visual records of algal blooms and pollution were uncommon. However, comparison with the upper limit of standards used by the Environment Agency statutory monitoring for the Water Framework Directive (WFD) showed that overall 34% of phosphate readings were of concern, very similar to the first year of the project (35%). For some catchments the percentage was much higher e.g. the Medway or the Avon Warwickshire where 59.9% and 78.2% and of all phosphate readings, and 100% and 86.4% of site averages (based on 8 or more samples within the year) indicated some evidence of pollution. Nitrate and ammonia concentrations exceeded standards (EU Nitrates Directive and Environment Agency WFD respectively) far less frequently It should be noted that there are five classification categories under the WFD: High, Good, Moderate, Poor and Bad. Therefore measurements or site averages in this report which are identified as above the upper limit of WFD good standard are not necessarily in “bad” condition.
Four focus catchments demonstrate how the data might be used to identify areas of concern. Distribution maps of those four focus catchments highlight the importance of visualising the distribution of samples across a catchment, as catchment summary data (as given in Appendix 1) are misleading where sampling has not been widespread and is concentrated on particular subcatchments. Spatial data visualisation shows how monitoring can be clustered or skewed across catchments, and hence where more monitoring is needed. The next step is to integrate these valuable data with existing datasets that can provide context and help understand the patterns displayed – such as rainfall, river levels, land use or sewage overflows, to identify drivers of poor water quality within catchments, and track the efficacy of any watercourse management.
The WQMN dataset serves as testament to the widespread concern about river health, and the dedicated efforts of angling clubs. In the first-year report it was identified that citizen science data could be further utilised by the statutory bodies and water companies as an early warning system of polluting events or regions of concern, highlighting areas for further investigation and action. This report confirms this assertion since volunteers remain committed and data remain of good quality, so the next step is improved communication between organisations invested in understanding and improving water quality, and investment in processes and pathways to escalate concerns and target interventions.
The Angling Trust launched the Water Quality Monitoring Network (WQMN) across England and Wales in July 2022, following a successful trial on the Severn catchment. The network of volunteers undertakes on site physical and chemical (including nutrients) measurements of water quality in streams and rivers. This report summarises the second year’s results across all rivers and catchments monitored and aims to provide a high-level summary of the scheme efforts and brief visualisation of the results thus far. It follows a similar format to the first-year report (Kean and Bagshaw, 2024), but focus is limited to the four catchments with the highest intensity of monitoring. This report is for all the volunteers who have collected data, and it is hoped that it can inform national efforts (e.g. CaSTCo – the Catchment Systems Thinking Cooperative, Natural Resources Wales and Environment Agency approaches to using citizen science data) to increase the value and utility of citizen science collected freshwater data.
The WQMN is formed from angling clubs, anglers and other volunteers who undertake regular monitoring activities on rivers across England and Wales. Angling clubs recruit and organise teams of local monitors who are allocated monitoring sites. On a regular and consistent basis, these monitors gather a range of data for each site.
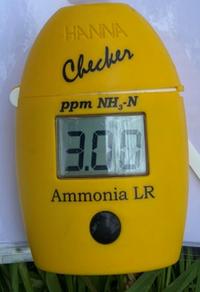
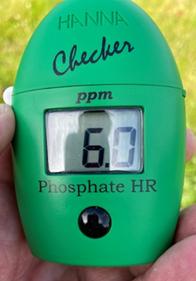
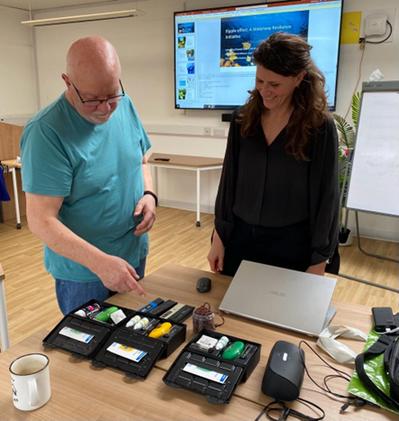
The WQMN monitors used a variety of equipment from a standard list: Electrical Conductivity and Temperature probe, Hanna Phosphate Checker, Nitrate Strips, and Hanna Ammonia Checker (not available to all WQMN monitors). WQMN monitors were encouraged to test water samples on a monthly basis and make observations on the weather, river flow, river level, visual algal blooms and pollution and record their results using the Epicollect smartphone app, which reports to a central, freely- accessible database. No biological measures of water quality were made (although some organisations may also take part in other schemes e.g. ‘RiverFly’ invertebrate monitoring)
Monitors are provided with a comprehensive volunteer pack detailing a risk assessment, how to select a sample site, suggested monitoring frequency, kit care and maintenance, safety guidelines, methods for collecting and analysing a water sample, and guidance for recording measurements on Epicollect5. The pack also contains links to training videos prepared by Cardiff University scientists for the Wye Catchment Collaborative Monitoring Network, freely available on YouTube
All results reported on Epicollect were screened by the Angling Trust staff for anomalies. To eliminate errors caused by inaccurate data input, any anomalies were discussed with volunteers. In the first year of the project we understand that some clubs made preliminary comparisons of their data to Environment Agency (EA) laboratory tested samples, and reported consistent results, however this was not quantified.
This second-year report summarises data collected between 17th July 2023 and 16th July 2024 A few additional samples (n=12) from 29th April and 16th July 2022 which were reported late so not included in the first-year report are also included. A total of 3956 samples were reported, 49 were excluded from analysis because they originated from transitional and coastal waters, or still waters, these environments have different chemistry and ecology to flowing freshwaters (streams and rivers). It is possible some sampling from still waters is included in this report as they were not identified.
Environmental quality standards displayed in figures and catchment maps are based on standard concentration limits set by UK and European legislation.
It should be noted that standards are site specific and based on an annual average, or as a growing season mean (March to September inclusive), and are not intended to be compared to one off readings, but these standards are useful benchmarks
Phosphate and Ammonia: Under the Water Framework Directive (WFD), standards for phosphate and ammonia are calculated by Environment Agency (EA) and Natural Resources Wales (NRW) taking into account the natural variation based on altitude, alkalinity and stream order and they are therefore site specific. As site specific standards are not available for the sites sampled by the WQMN monitors (unless by coincidence they happen to also be the sites monitored by the EA or NRW), we needed another measure to interpret the levels recorded. The site-specific standards for England were requested from the EA who provided standards for 8349 sites across England in 2023. No updates were received for 2024. Natural Resources Wales provided phosphate standards for 847 sites and ammonia standards for 469 sites. Within these standards: the maximum level for “good” classification for phosphate is 0.101 mg/l (PO4-P) and for ammonia is 0.6 mg/l. For phosphate the standards are expressed as PO4-P so it is necessary to convert to PO4 3- to make it comparable with the measurements produced by the equipment used by the WQMN recorders: 0.101 mg/l PO4-P = 0.31 ppm PO4 3- These upper limits of WFD good classification in England and Wales were used as a conservative guide to identify readings which may indicate some level of contamination and therefore sites of concern on the catchment maps. As we use the conservative overall upper standard, it is possible that more samples would exceed site-specific limits if they were available. It should be noted that there are five classification categories under the Water Framework Directive (WFD): High, Good, Moderate, Poor and Bad. Therefore measurements or site averages in this report which are identified as above the upper limit of WFD good standard are not necessarily in “bad” condition.
Nitrate: Concern about nitrate pollution initially focused on drinking water supply, but there is now also recognition of nitrate’s role in eutrophication. The European Nitrates Directive (1991) set a maximum nitrate concentration of 50 mg/litre (equivalent to 11.3ppm NO3 --N) which applied to all UK rivers. This limit is still used by the Environment Agency in England in their process of designating Nitrate Vulnerable Zones (NVZs), whereas in Wales, the Welsh Government replaced NVZs with Wales-wide regulations to tackle nitrate pollution from agriculture. There are no nitrate standards for rivers under WFD. In this report, citizen science measurements are compared to the 11.3ppm NO3-N standard. In the “Results by catchment” section, additional categories below the Nitrates Directive standard are given because there is some concern this is insufficiently stringent, and historical nitrate levels indicate that concentrations have been much lower in the past (EA, 2021).
There are tighter targets for protected rivers designated as Special Areas of Conservation (SACs) or Sites of Specific Scientific Interest (SSSIs) under Habitats Directive. It was not possible to obtain individual SAC/SSSI targets and compare to WQMN data from SAC/SSSI rivers within the scope of this report. Additionally, as we summarise and compare against the maximum of good, the inclusion of tighter SAC/SSSI targets would not change the results as presented here.
Confidence in the dataset
It is important to acknowledge the limitations and uncertainties of any dataset. Citizen science collected water quality data are intended to compliment quality assured statutory monitoring undertaken by government agencies. They have the potential to provide water quality insights in the temporal and spatial gaps that exist in statutory monitoring through more frequent monitoring over a potentially greater geographical range, and therefore greatly assist in the identification of pollution hotpots and the pressures on our river systems. The data acquired through the use of low-cost equipment does not rival professional standard equipment in terms of accuracy and precision However their use has been tested by Cardiff University who directly compared results from the low-
cost equipment used by the WQMN to results from professional analysis for nitrate, phosphate, electrical conductivity and temperature and found them to perform well (von Benzon, 2022). Results were less precise than professional standard monitoring, but sufficiently accurate to identify trends and unusually high values. We can therefore be reasonably confident that the majority of WQMN data are a sufficient level of accuracy for the purposes of this monitoring exercise – that is, to identify sites at highest risk or displaying unusual patterns. We are not aware of any similar validation for the Hanna Ammonia Checker.
It is possible that there is some bias in site selection, rather than sites being selected at random across the catchment. For the WQMN the following are potential sources of bias in the data:
• Skew in data collection towards pollution. People are more likely to volunteer where they think there is a problem.
• Conversely, skew in data to where people fish, which would be more likely to have good water quality, and to be in the middle and lower reaches.
The data collected by the WQMN are a mixture of ad hoc data collection, with some regular repeat sampling. One off samples at random locations carry more uncertainty than regular repeat sampling, and limits time trend analysis. Therefore in the section examining individual catchments we have focused on those sites that have been regularly sampled (8 or more samples at the same site).
The readings from the equipment give a concentration – that is, a quantity of chemical per unit volume (for example milligram of phosphate per litre of water). A high concentration in a small volume of water is not necessarily of concern, if this water is discharged into a larger volume body of water that dilutes the high concentration (the same amount of chemical in a larger volume of water lowers the concentration). The environmental quality standards (WFD and Nitrate Directive) are predicated on larger rivers with comparatively high volumes of water. Many of the citizen science readings may be collected in small tributaries where standards have not been agreed, and a high concentration only impacts a relatively small body of water. In a large catchment, small water bodies with high concentrations are not necessarily of concern since once the water reaches the main stem of the river, these concentrations could be diluted to fall within ‘good’ standards. We therefore suggest that the 'good ecological status’ standards are useful for comparison, but recommend that citizen scientists note the relative discharge (volume of water per unit of time) of their stretch of water when making comparisons.
Conversely, small streams can maintain unique conditions providing habitat and refuge for a variety of organisms. The ecosystem functioning of small streams can also be significantly impacted by pollution, so whilst water volumes are low, the ecological consequences of high concentrations of pollutants can still be significant. Interpreting the significance of nutrient concentrations is complex, with a large body of evidence to draw upon in scientific literature, government reports and local knowledge. This report will not seek to ‘explain’ the data, but instead showcase it so stakeholders (including those who collect the data) could apply their local understanding of catchment processes to understand it when spatial patterns are revealed
In this section all measurements are collated to describe trends at the England and Wales scale in sampling effort, visual pollution and the main water quality parameters collected (phosphate, nitrate, ammonia and electrical conductivity).
The good news:
• Sampling has increased (over time and areas covered).
• Visual records of algal blooms and pollution were uncommon.
• The majority of readings were below environmental quality standards for phosphate, nitrate and ammonia.
Concerns:
• Phosphate: 34% of readings exceeded the England and Wales-wide upper WFD standard for good ecological status
Sampling has increased (over time and areas covered)
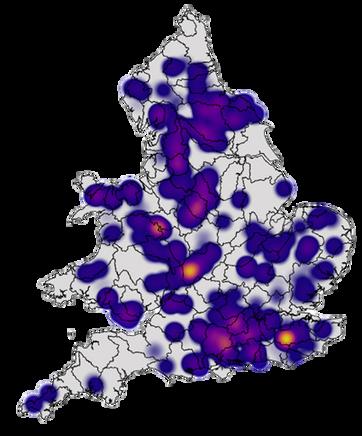
The project has continued to grow in popularity since the first year report (May 2022- July 2023), with now upward of 350 records regularly logged each month (Figure 1). The sampling effort across catchments was uneven, typical of ad-hoc citizen science monitoring schemes, but with clear potential for good coverage across England and Wales (Figure 2): the Water Quality Monitoring Network is now active in 76 catchments (an increase of 12 catchments since the first year). Four catchments (the Medway; the Swale, Ure, Nidd and Upper Ouse; the Avon Warwickshire; Test and Itchen) have each been sampled over 200 times by WQMN monitors in the first year of the project, and another 14 catchments have been sampled over 70 times. A further 58 catchments have been sampled at least once (Figure 3). There are, however, gaps in the reach of the network, and the network is keen to recruit volunteer recorders in the remaining catchments.
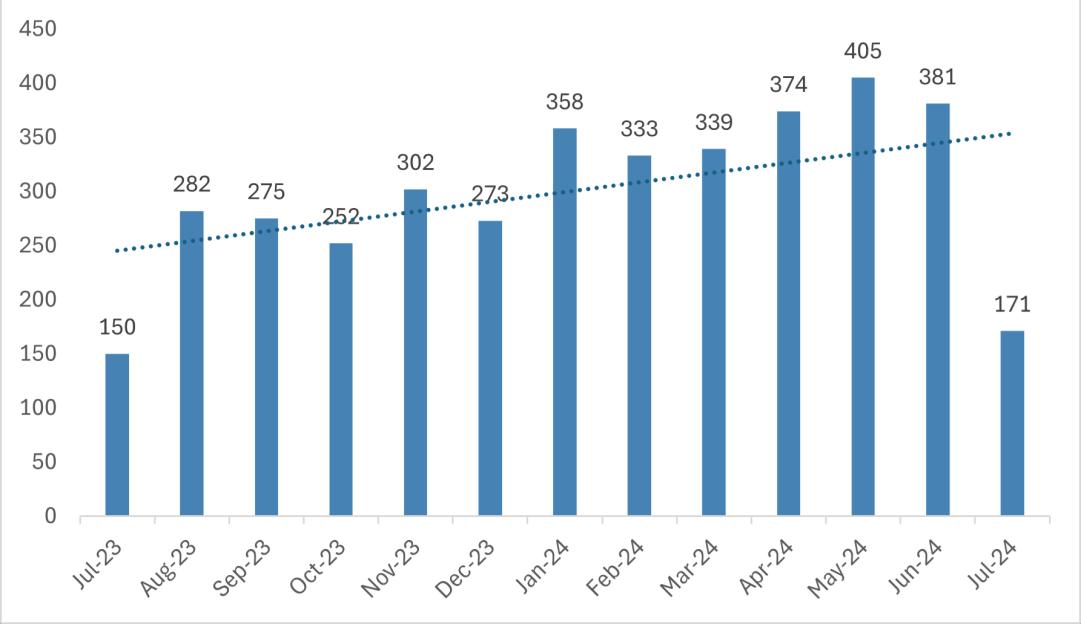
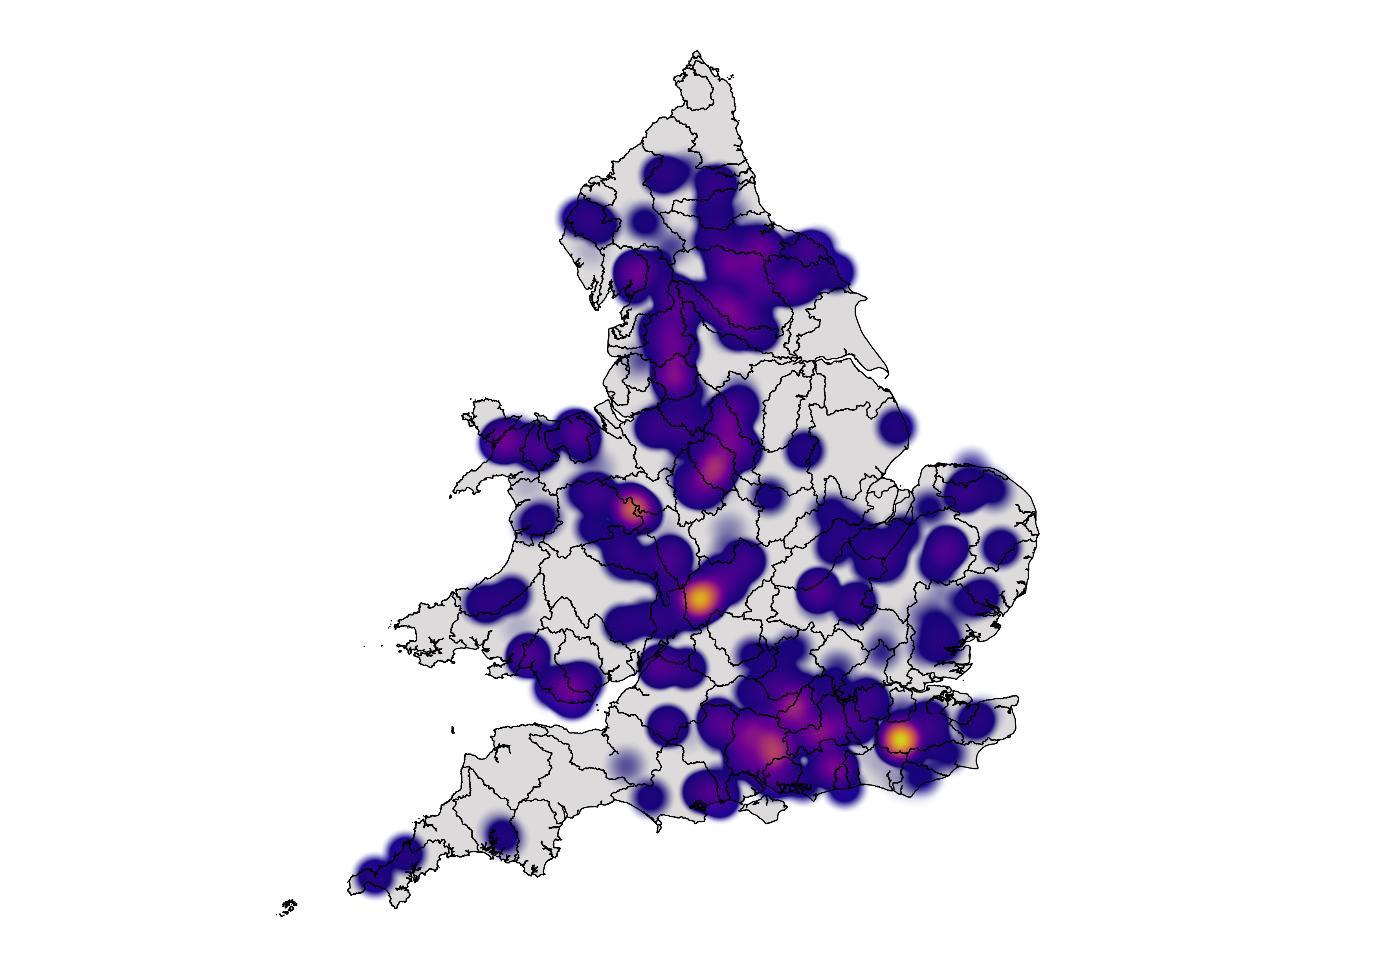
Figure 2 Heat map showing where samples were collected in the second year. The plot shows an uneven sampling effort across England and Wales catchments, typical of ad hoc Citizen Science data collection.
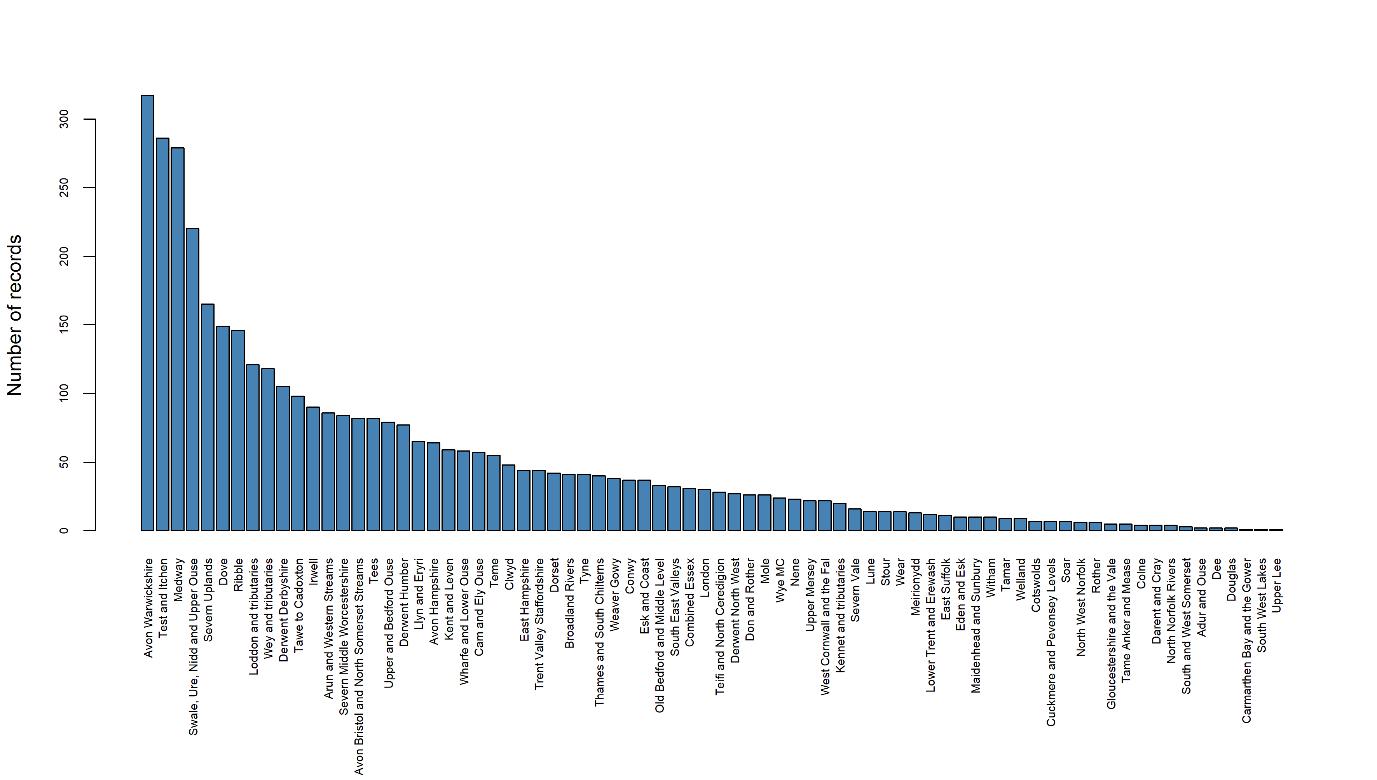
3 Number of records per catchment
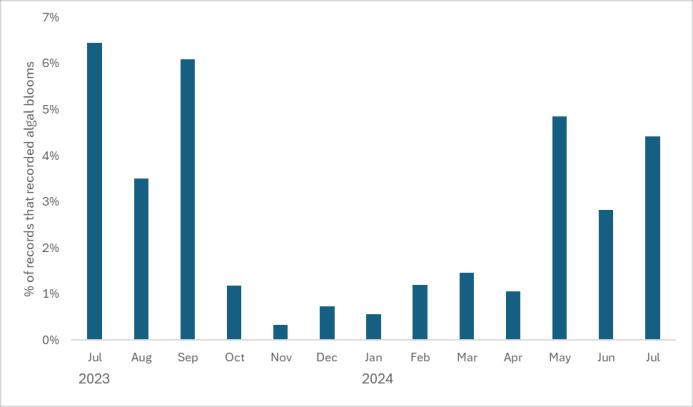
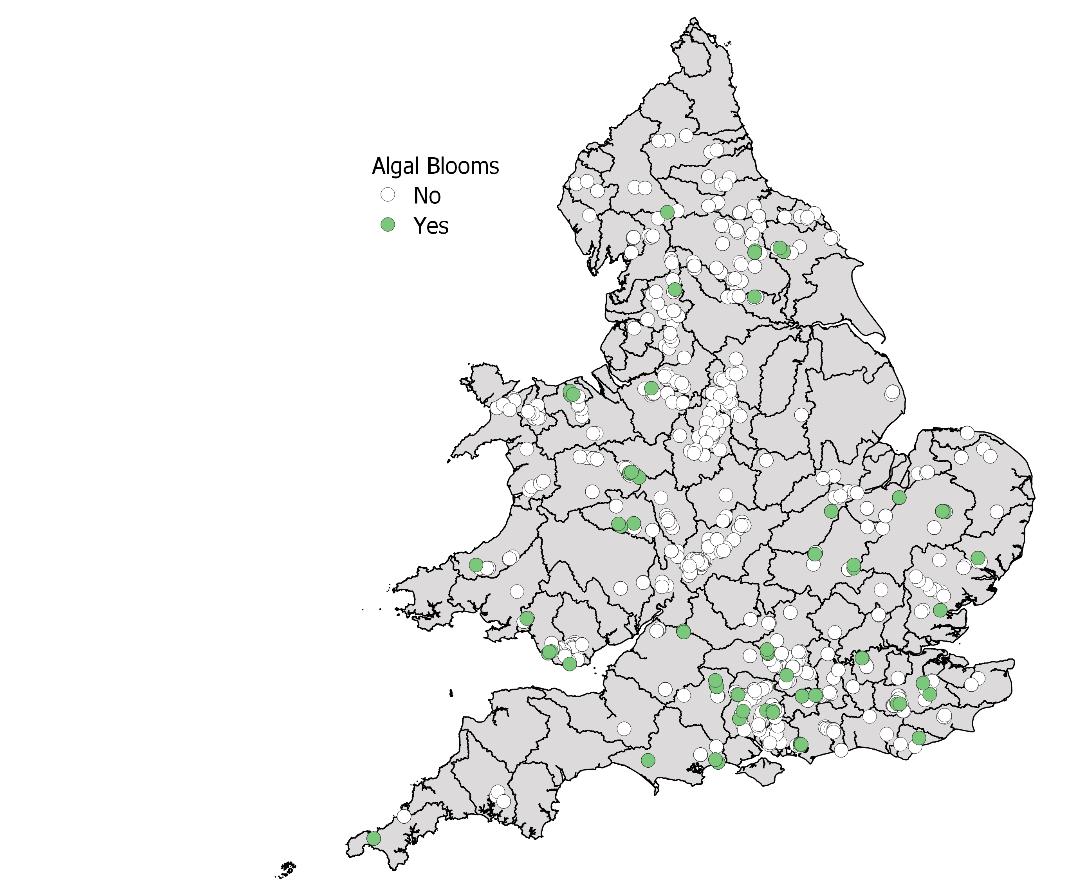
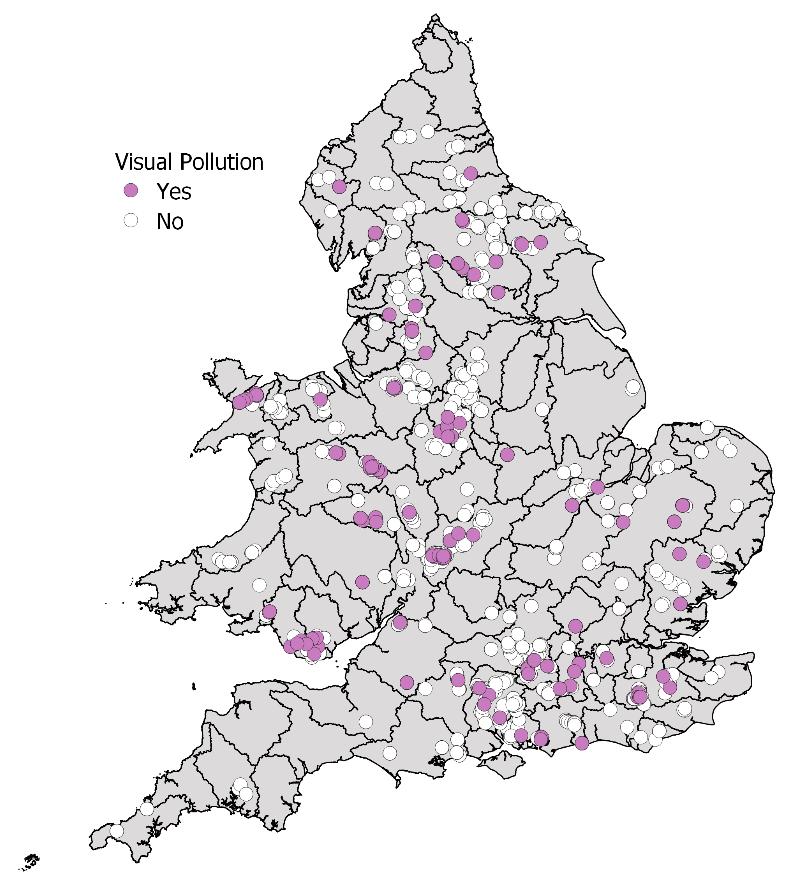
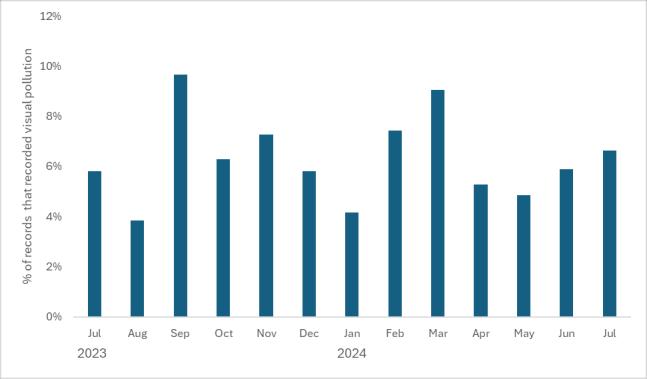
Observations of algal blooms and visual pollution were uncommon Only 2.3 % of records (91/3907) recorded algal blooms, and 6% (240/3667) recorded visual pollution. Observations that were made were not spatially clustered, and instead were found in multiple regions of England and Wales (Figure 4). Algal blooms were observed in every month, although with higher rates in summer (e.g. 6.2% of July 2023 results) and lower rates in winter months (e.g. 0.3% of November 2023 results). There wasn’t an apparent seasonal pattern to records of visual pollution.
Figure 4 Maps of sites where algal blooms or visual pollution were identified at least once during the recording period Note that this map should not be used to interpret frequency, see accompanying graphs for frequency.
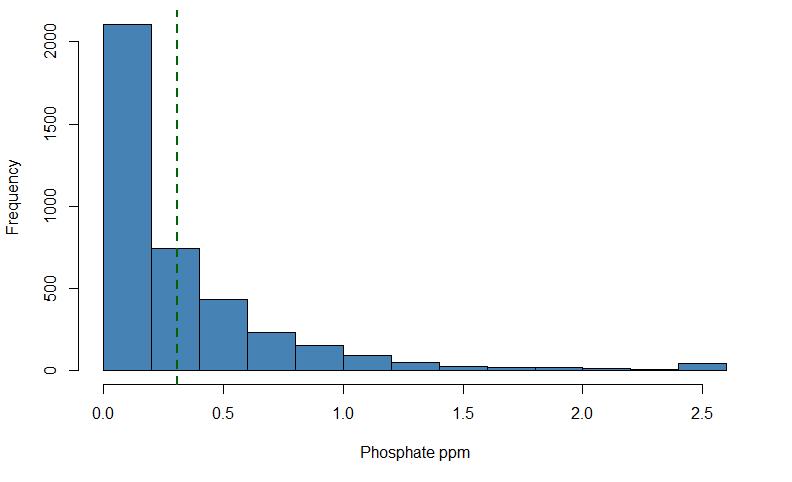
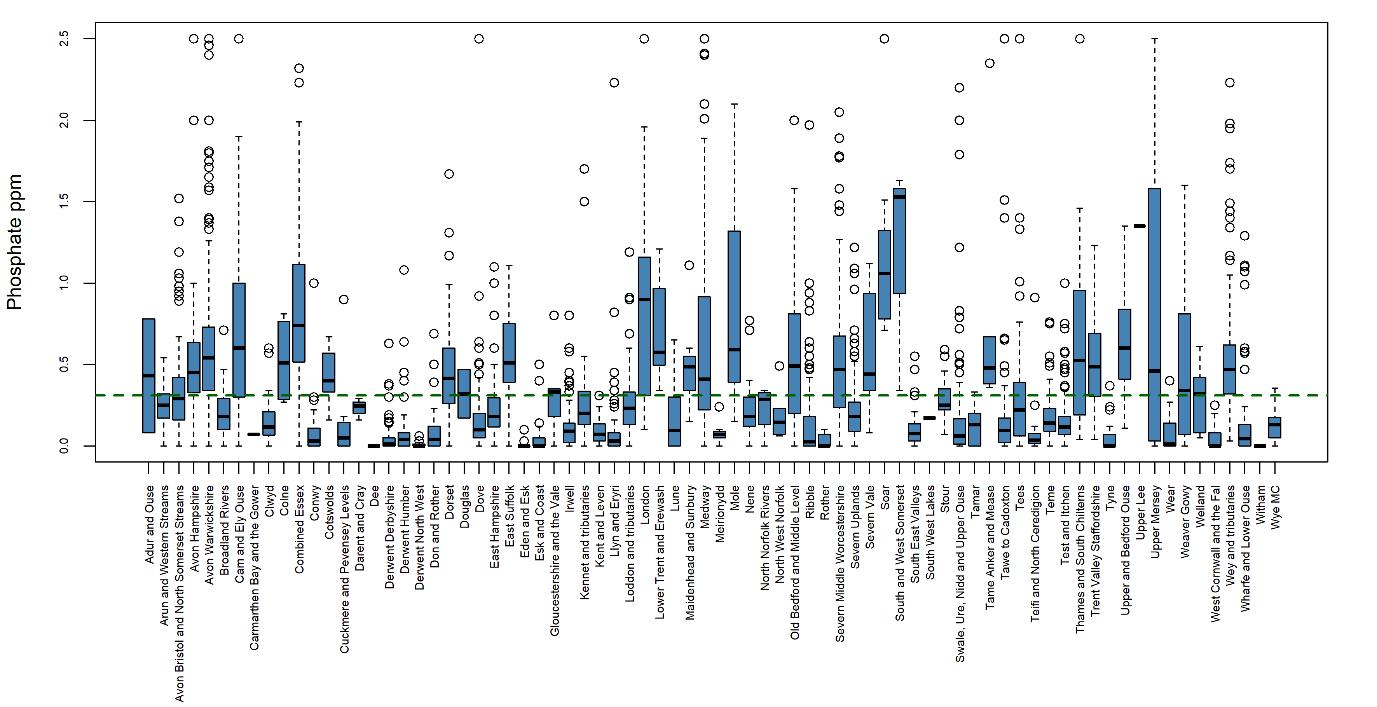
Phosphate readings varied from 0 to 2.5 ppm* (Figure 5) which is the full range of the Hanna Colorimeter used by the WQMN The majority of phosphate readings were below the England and Wales wide upper standard for good ecological status, however 33.9% (1324 out of 3907 readings) exceeded this level. The data demonstrate that phosphate concentrations varied greatly within, and between, catchments (Figure 6). Some of this variability can be due to differing discharge, some because of natural processes (for example, biological activity), and some because of anthropogenic events. Outliers (white circles in Figure 6) are extreme values that could indicate individual pollution events (although that is not possible to confirm without further investigation).
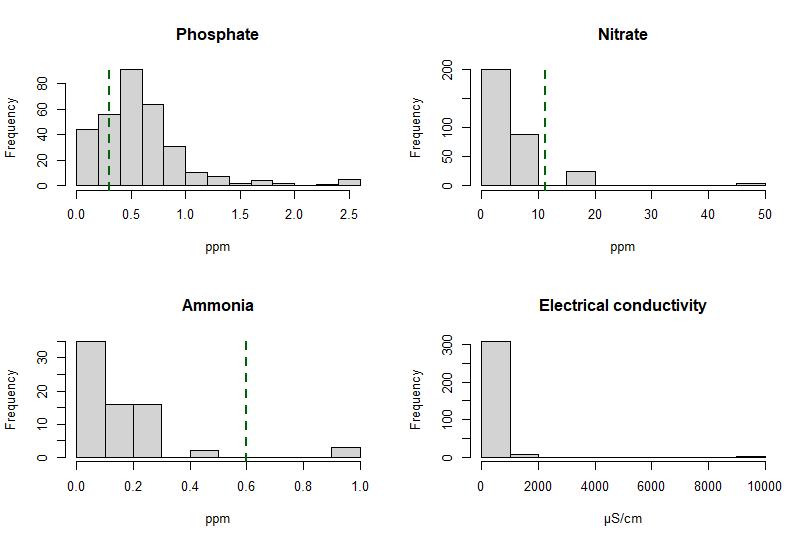
*Note that the Phosphate Colorimeter upper limit is 2.5 ppm, the lower test limit is 0.00 ppm with an accuracy of ± 0.04 ppm, as stated by the manufacturer. So, a 0.00 ppm reading does not mean there is no phosphate present, it will be between 0.00 and 0.04 ppm. A 2.5 ppm reading does not mean that is the total phosphate, it means that it is in excess of 2.5 ppm. We note that there are uncertainties in the performance of the technique (von Benzon et al., 2021), particularly at very low concentrations, but we have confidence that measurements have adequate accuracy above 0.2 ppm.
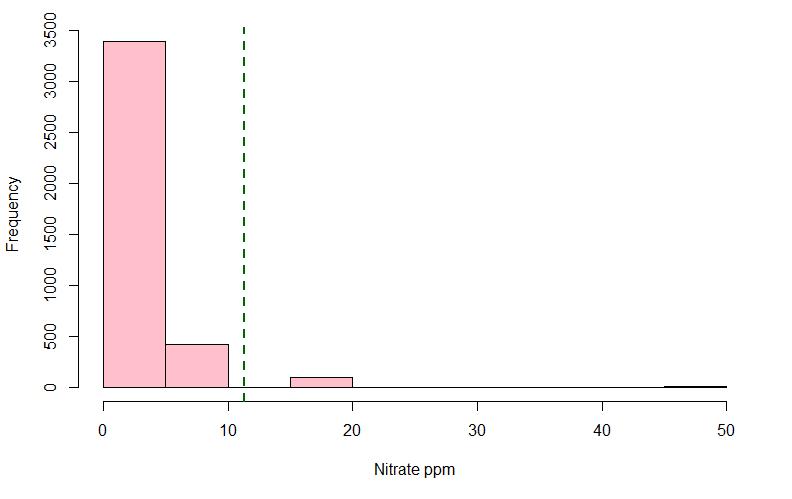
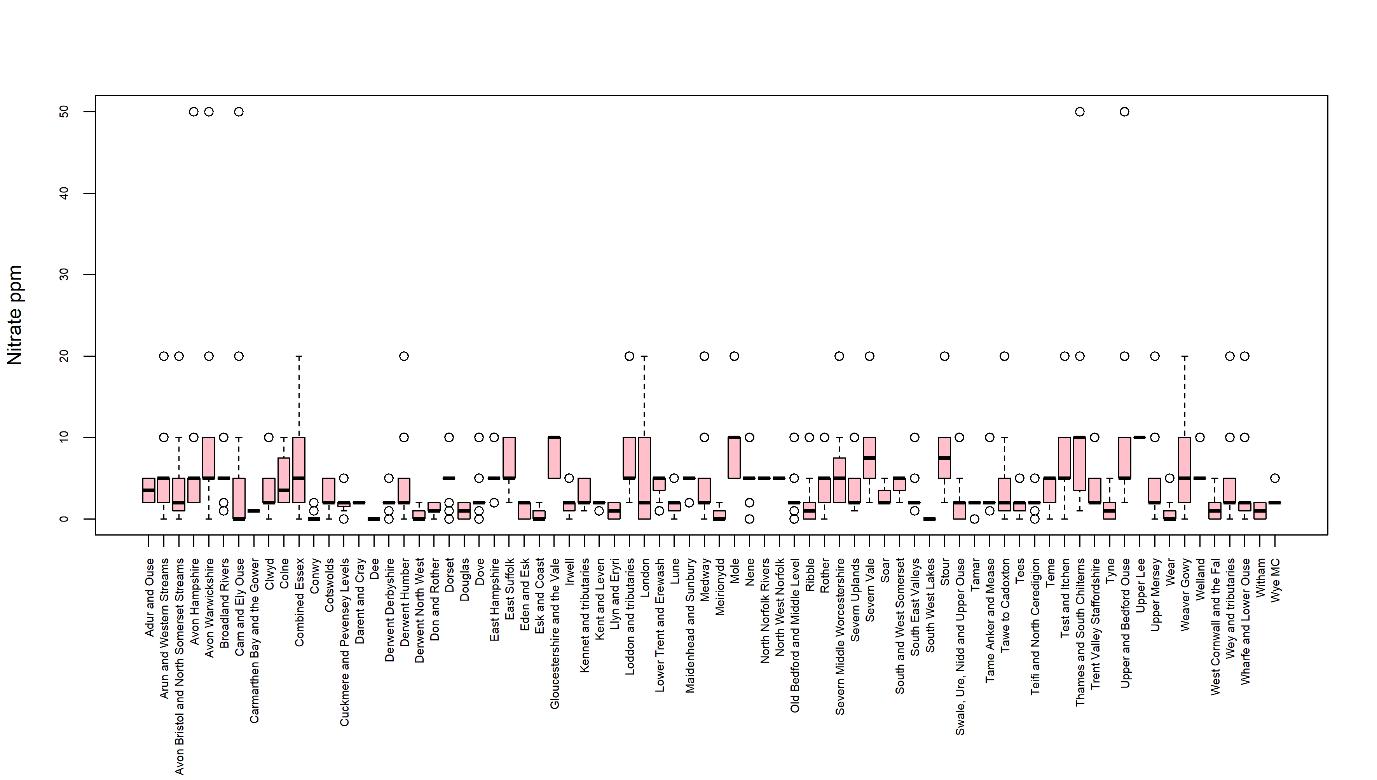
Nitrate readings varied from 0 to 50 ppm (Figure 7) which covers the full range of the test strips used. The majority of readings were below the Nitrates Directive standard*, with fewer than 2.6% (103 out of 3907 readings) exceeded it. Nitrate readings were similar across most catchments (Figure 8). Combined Essex, London and Weaver Gowy had more variable readings compared to other catchments, indicating in this instance a higher proportion of higher readings. Outliers (white circles in Figure 8) are one off extreme values that could indicate individual pollution events (although that is not possible to confirm without further investigation).
* N.B. Nitrates Directive set an upper limit of 11.3ppm NO3-N for all rivers across the UK. Historical nitrate levels indicate that natural river conditions are often much lower (EA, 2021).
Ammonia readings varied from 0 to 9.99 ppm* (Figure 9) which is the full range of the Ammonia Colorimeter used. The majority were below the England and Wales wide upper standard for good ecological status, with less than 3.8% (67 out of the 1750) of readings exceeding it. Ammonia readings were similar across most catchments, with only a very few exceptions (Figure 10); ammonia readings in the Tame, Anker and Mease, North Norfolk, and London catchments were more variable than in other catchments. Outliers (white circles in Figure 10) are extreme values that could indicate individual pollution events, or poor performance of the test equipment (although that is not possible to confirm without further investigation).
* The Ammonia Colorimeter upper limit is 9.99 ppm, the lower test limit is 0.00 ppm with an accuracy of ± 0.05 ppm ± 5%. So, a 0.00 ppm reading does not mean there is no ammonia present, it will be between 0.00 and 0.05 ppm ± 5%. A 9.99 ppm reading does not mean that is the total ammonia, it means that it is in excess of 9.99 ppm.
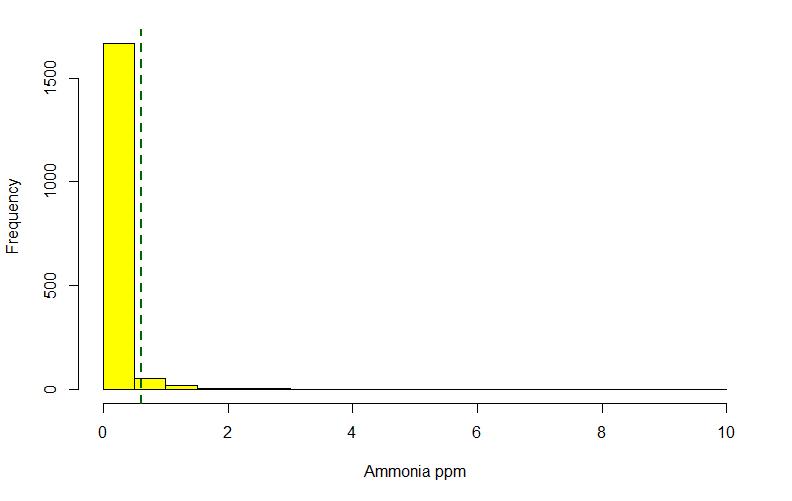
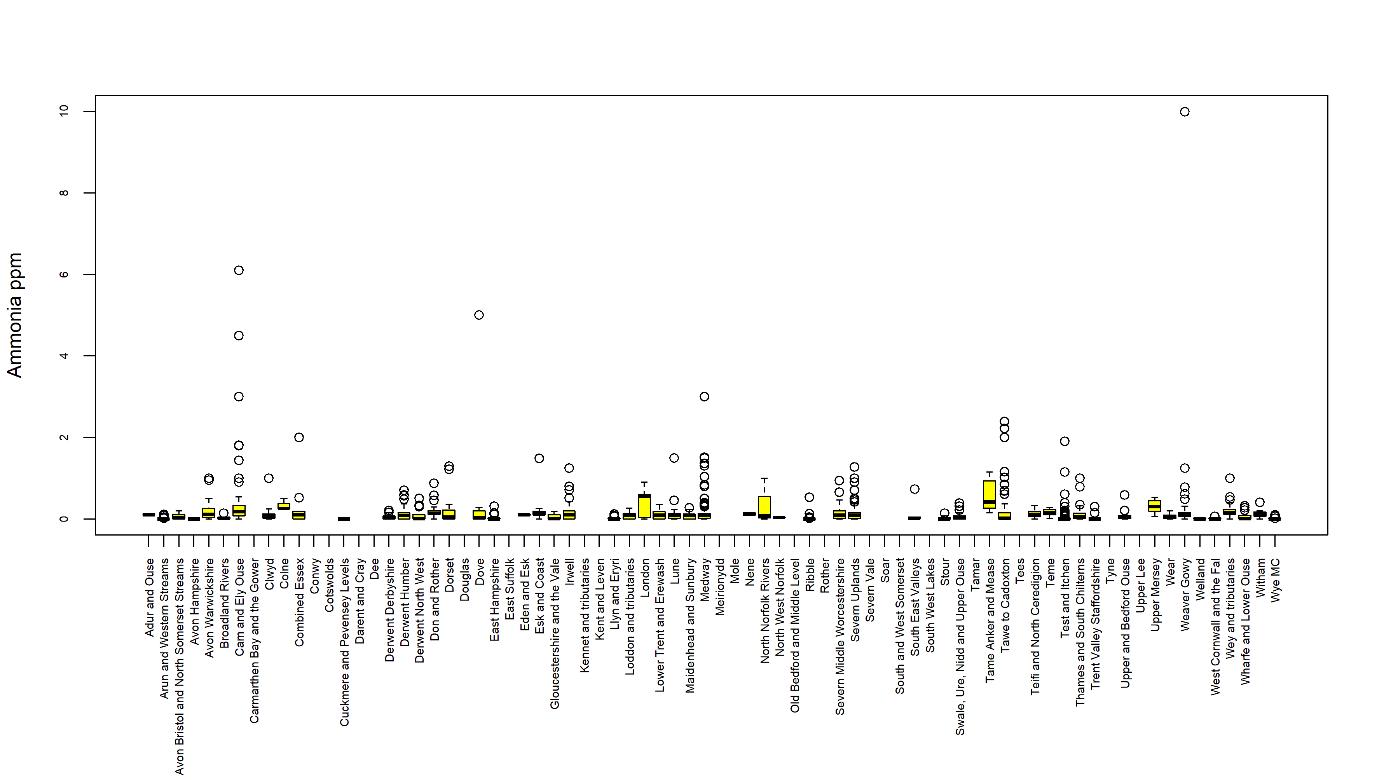
Figure 10 Range of ammonia readings in each catchment
Electrical conductivity (EC, measured in µS/cm = microsiemens per cm) can be an indicator of pollution, for example from sewage, agricultural run-off, or winter road runoff containing salt. EC gives us an indication of the total amount of dissolved solids (TDS) in the water. The higher the concentration of dissolved charged chemicals in the water, the greater the electrical current that can be conducted. EC varies naturally between different rivers due to differences in geology, temperature and stream discharge, and catchments influenced by seawater have higher EC, even beyond tidal limits. For this reason there is not a national standard for which to compare the WQMN data to. However, collating EC measurements can help us to understand the natural range, and to help identify when readings are unusually high. In the WQMN data EC readings ranged from 34 - 9990 µS/cm (a much higher range than in the first year of the project, but only three readings exceeded the first year range), measurements over 1200 µS/cm were rare, just 17 out of 3907 (
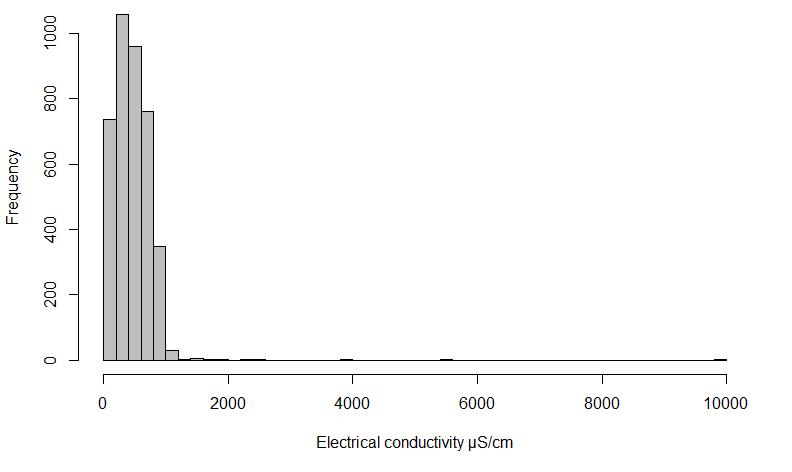
Figure 11) and readings varied between catchments (Figure 12).
Figure 11 Frequency histogram of all Electrical Conductivity readings.
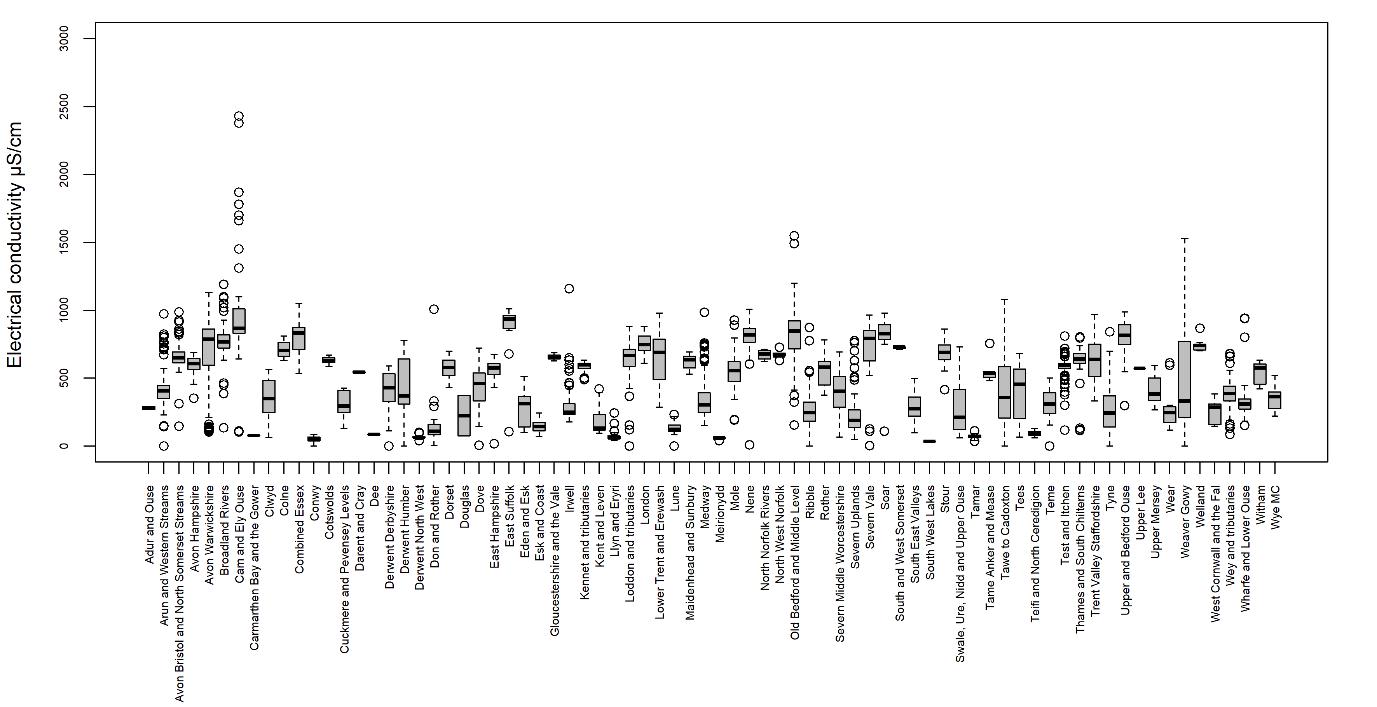
Figure 12 Electrical conductivity across catchments. Three extreme readings were excluded from the plot to provide a clearer picture of the majority of data, these were 9990 µS/cm from Avon Warwickshire and 3900 and 5570 µS/cm from Weaver Gowy.
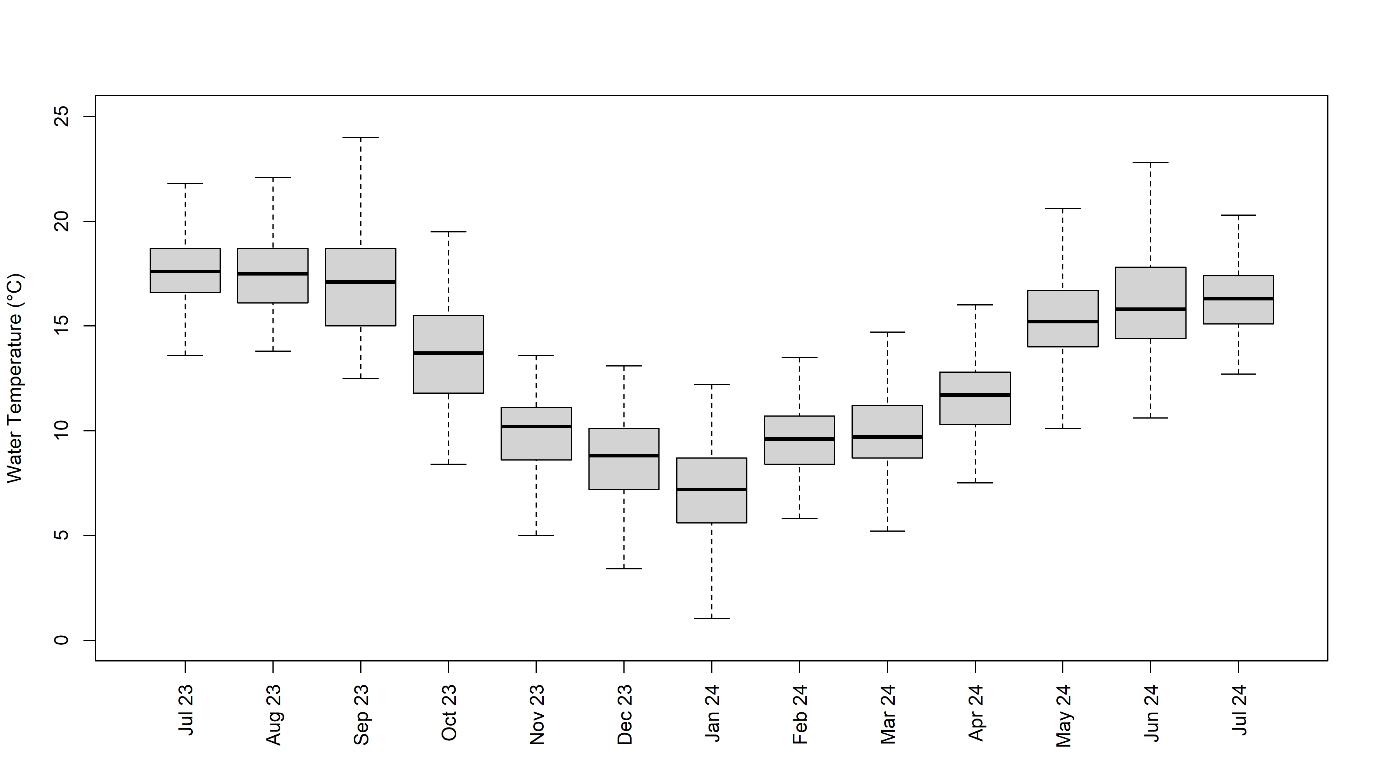
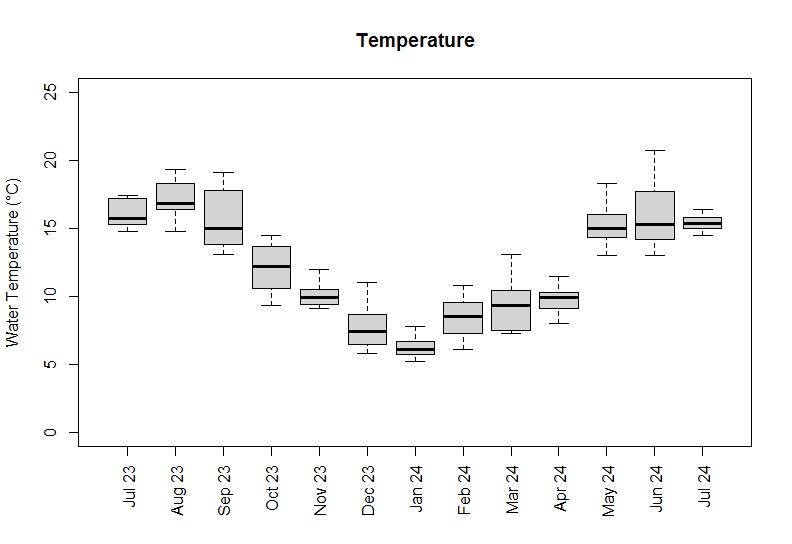
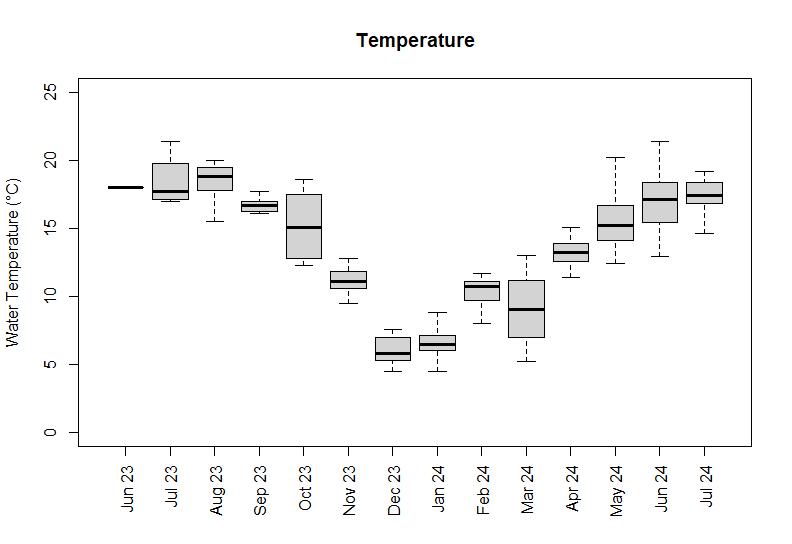
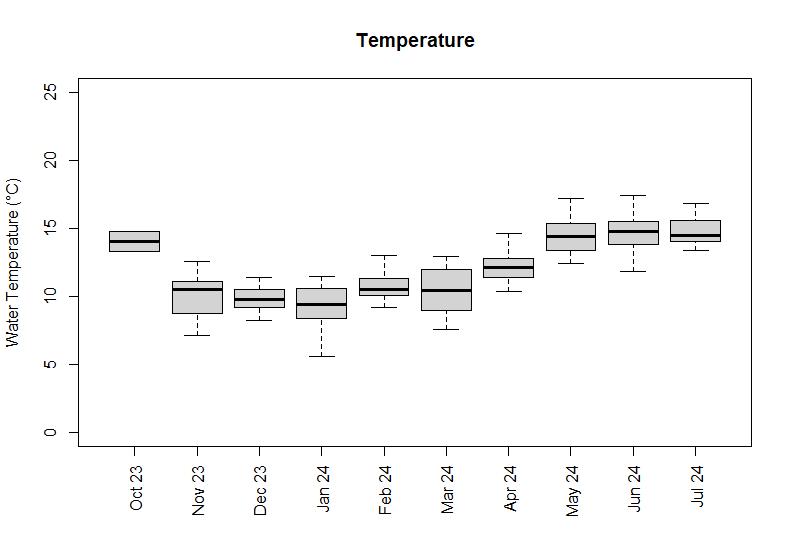
Water temperature ranged from 0 to 24.4oC with the expected pattern of lower temperatures in winter compared to summer months. Water temperature is an important measure because, for example, algal growth is associated with very high summer water temperatures, and mild winter temperatures can be associated with increased persistence of algal blooms, and poor rates of fish survival and reproduction
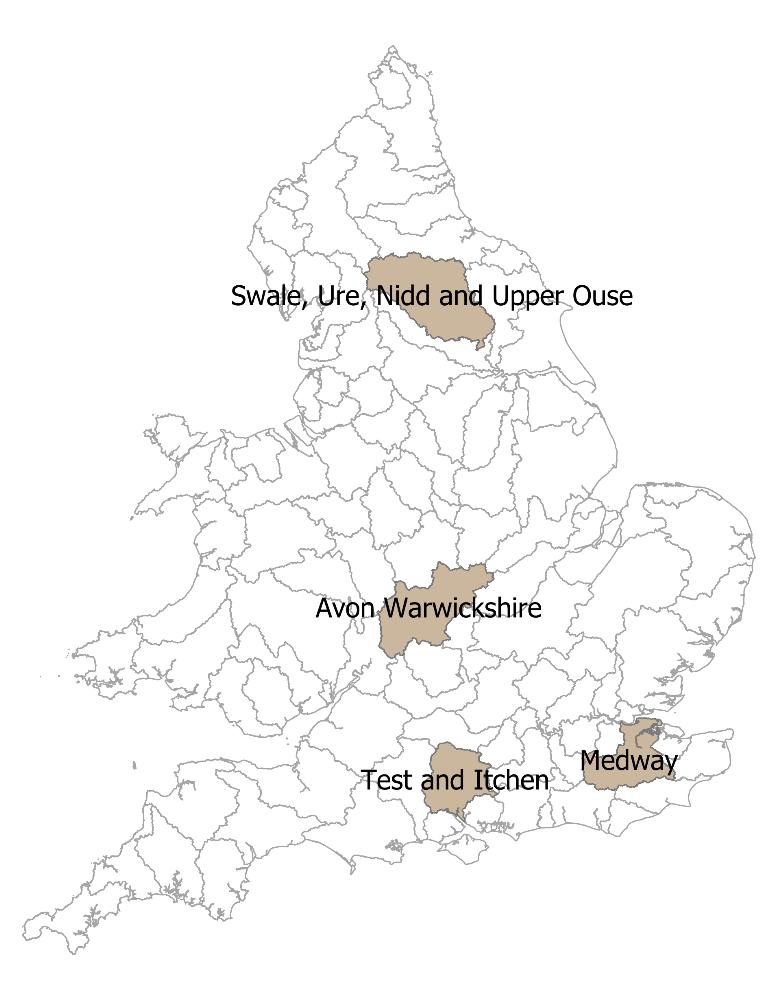
The uptake of the WQMN has been variable and so the data available varies across the catchments of England and Wales. Some clubs have only just started collecting data while others have been regularly sampling sites since the start of the project. Therefore the data available for mapping, calculating site averages and starting to examine trends varies across catchments. In this section we mapped four focus catchments (see map below) those with the greatest sampling. Summary data for all other catchments can be found in the appendix.
The good news:
Ammonia: No site averages exceeded the England and Wales-wide upper standard for good ecological status. See catchments section for mapped details.
Test and Itchen: had no site averages that caused concerns.
Concerns:
Phosphate: Site averages for phosphate exceeded the England and Wales-wide upper standard for good ecological status on the majority of sites on the Medway (100%, 14/14) and Avon Warwickshire (86.4%, 19/22). See catchments section for mapped details, and note that tributary size or discharge was not assessed in this classification.
Nitrate: One site average on the Avon Warwickshire exceeded the Nitrates Directive standard.
All mapping was undertaken using QGIS, a freely available spatial data visualisation tool. Sometimes samples will have been logged by the WQMN volunteer on the riverbank, or on a nearby bench, or during poor weather in their car, therefore we allowed for a small amount of spatial spread (200 m) between records for them to be considered from the same site. Site averages were calculated for sites with eight or more records.
For each focal catchment five figures are provided:
1. A map of the distribution of records across the catchment
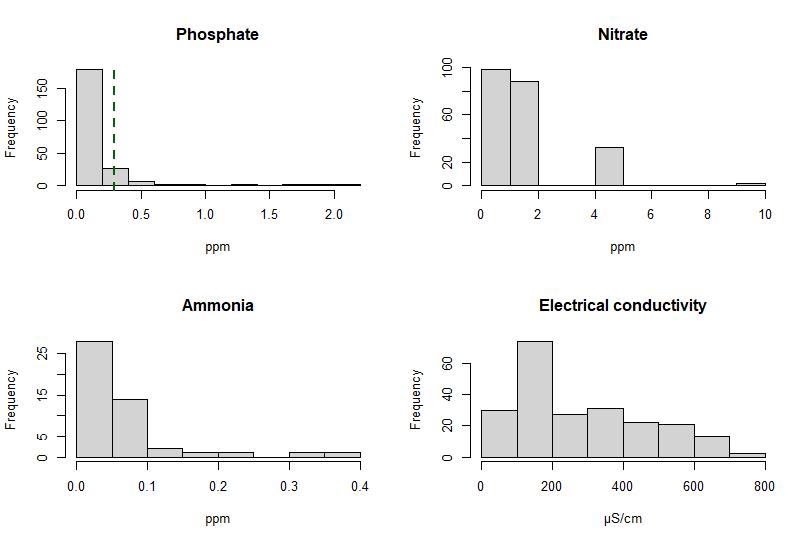
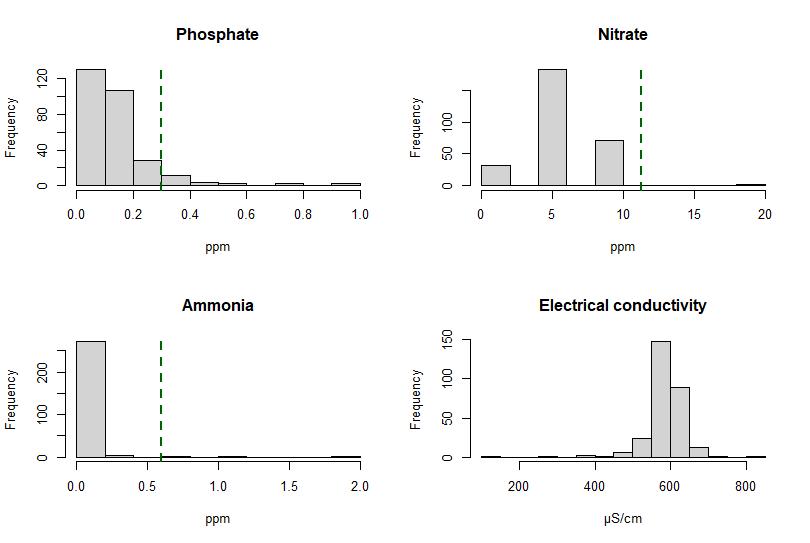
2. A panel of frequency histograms of results for phosphate, nitrate, ammonia, and temperature showing standards above which may indicate some level of pollution, where applicable Occasionally all data were below the standards, so the standard does not appear on the histogram.
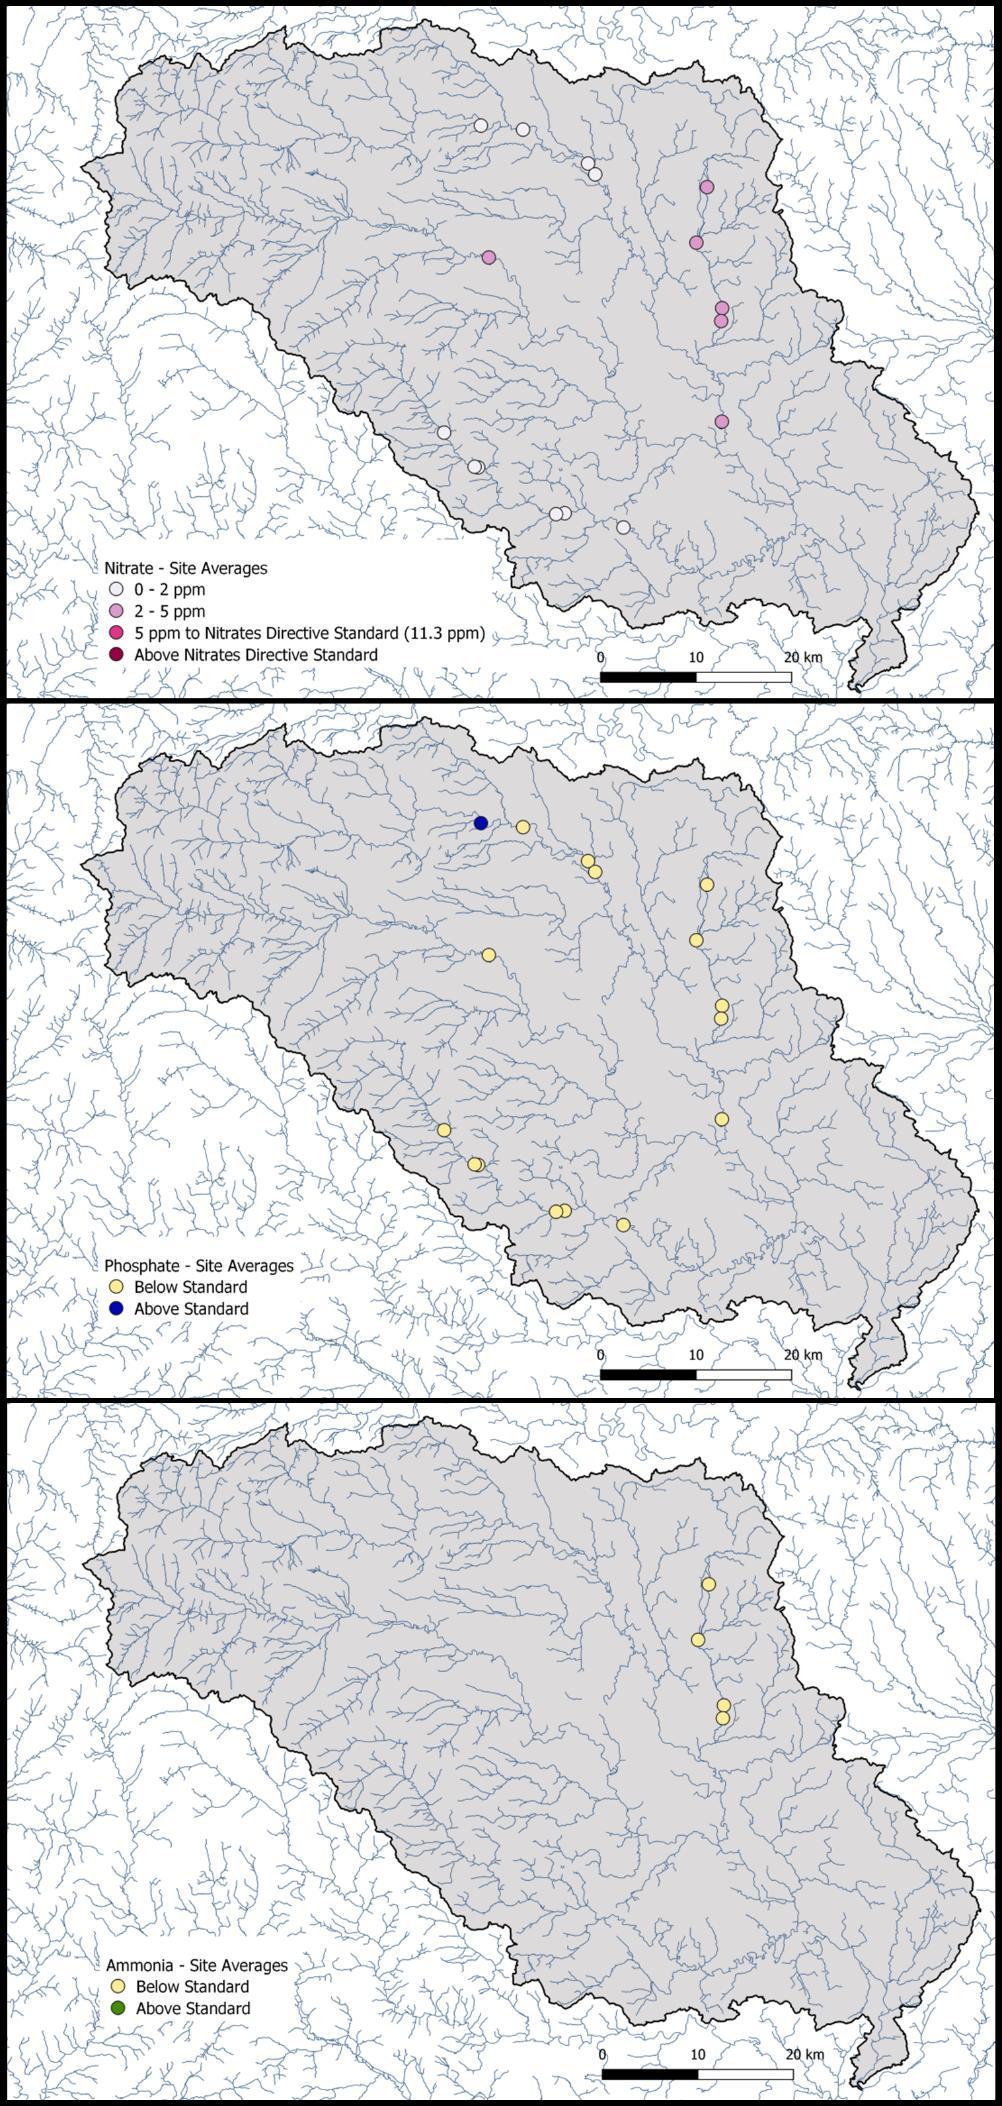
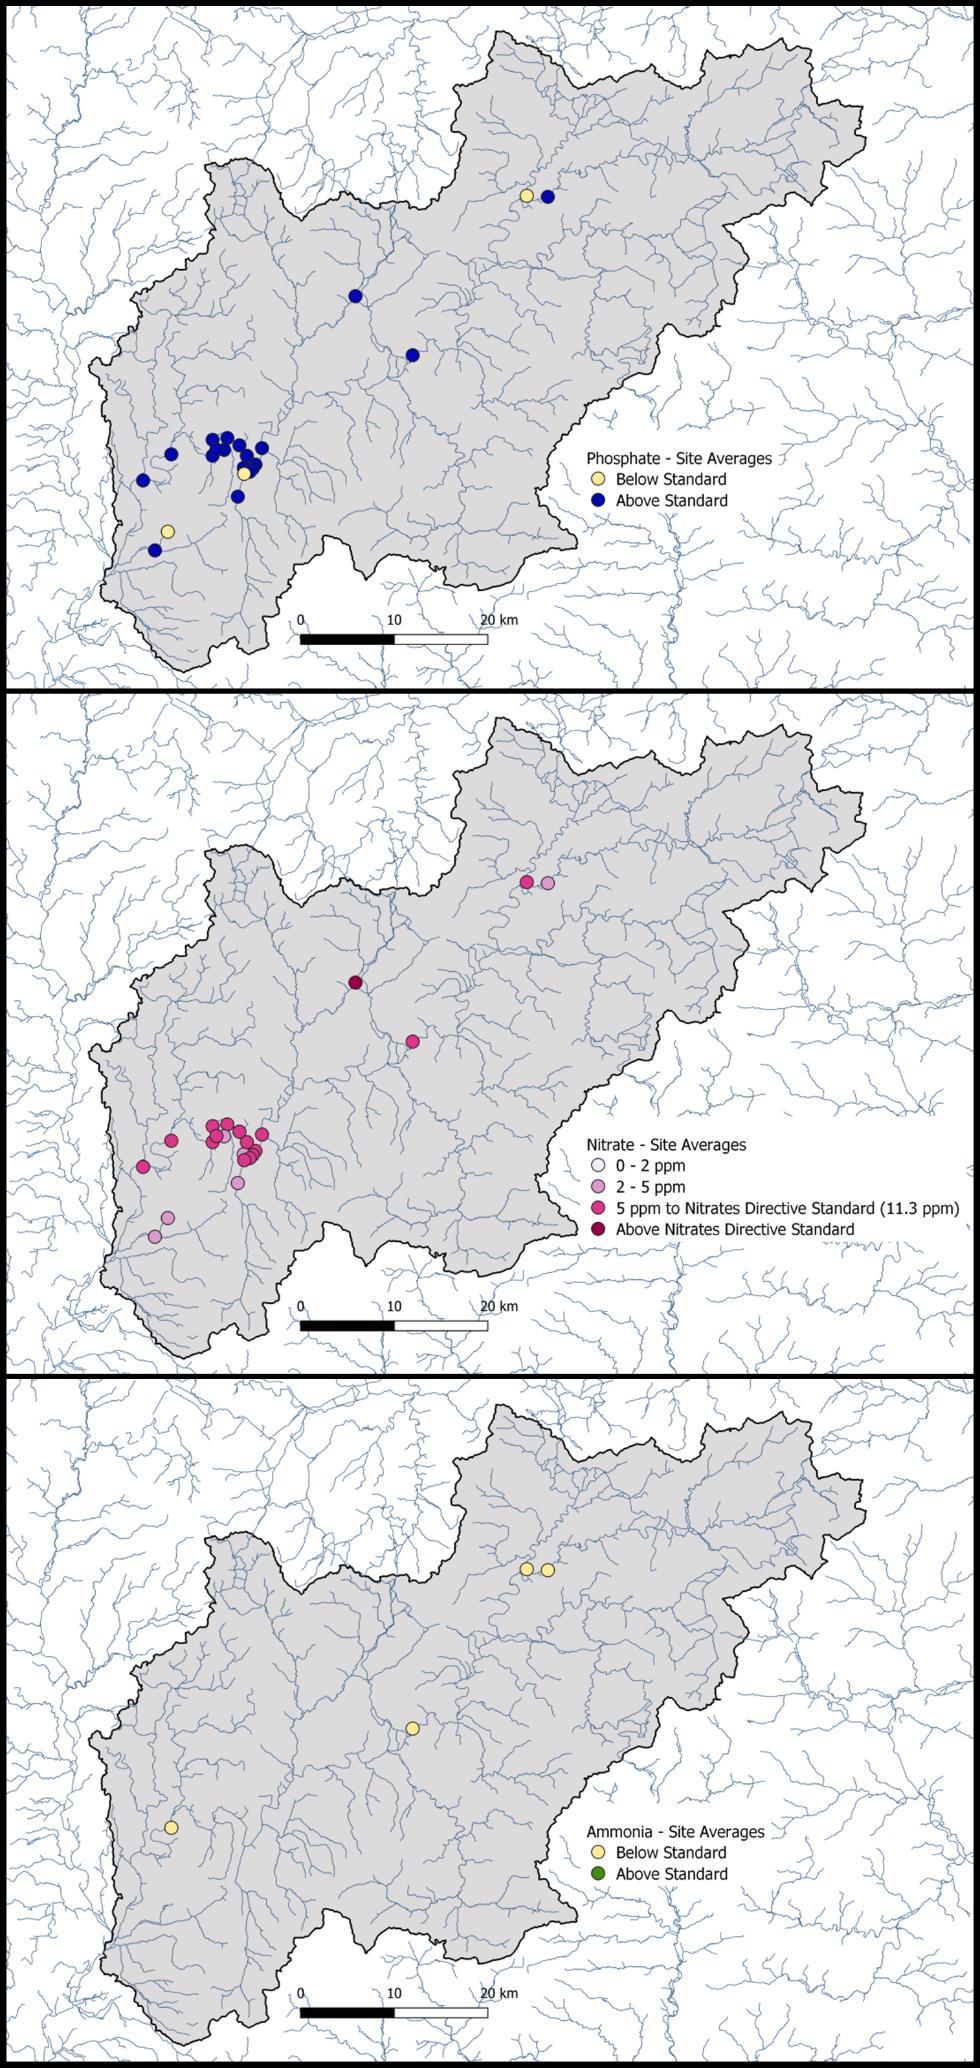
3. Phosphate map: site averages below or above standard (based on the upper limit of WFD standards, see methods for details).
4. Nitrate map: site averages below or above Nitrates Directive standard. Additional categories below the Nitrates Directive standard are given because this standard is largely set with
regards to risks to human health from drinking water, and natural river conditions are often much lower.
5. Ammonia map: site averages below or above standard (based on the upper limit of WFD standards, see methods for details).
These figures allow the reader to assess general catchment trends and give brief interpretation in the Discussion, but individual site trends are not explored here.
N.B. sampling focuses on a smaller area of the catchment
Ure, Nidd and
and Itchen
Number of samples
Phosphate 279
279
279
• 5 visual records of algal blooms
• 8 records of visible pollution
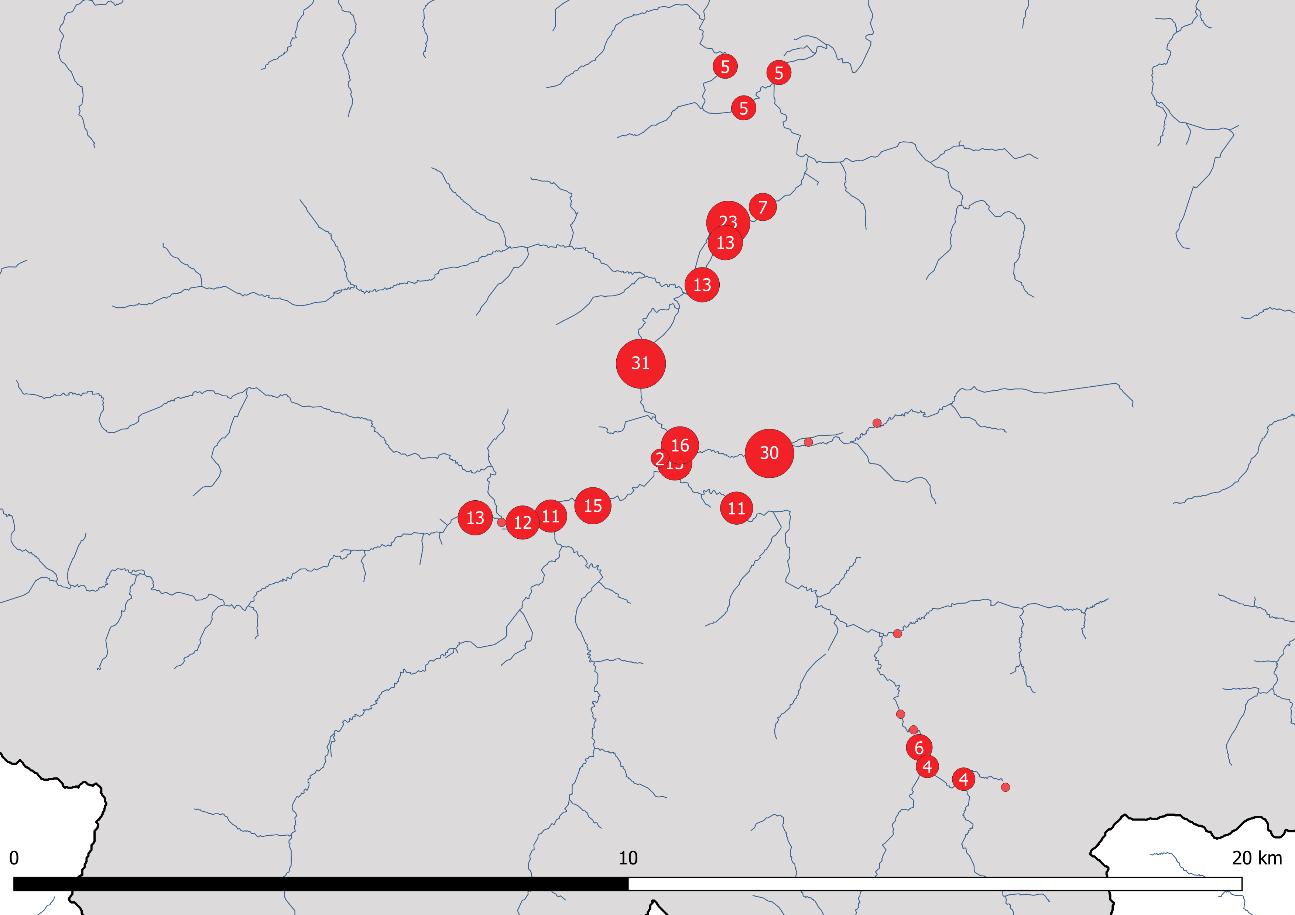
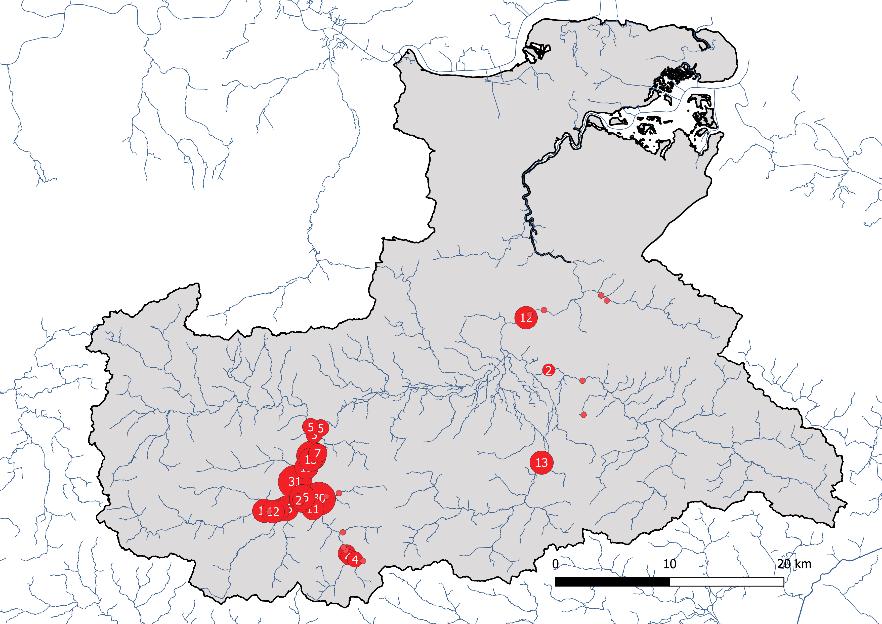
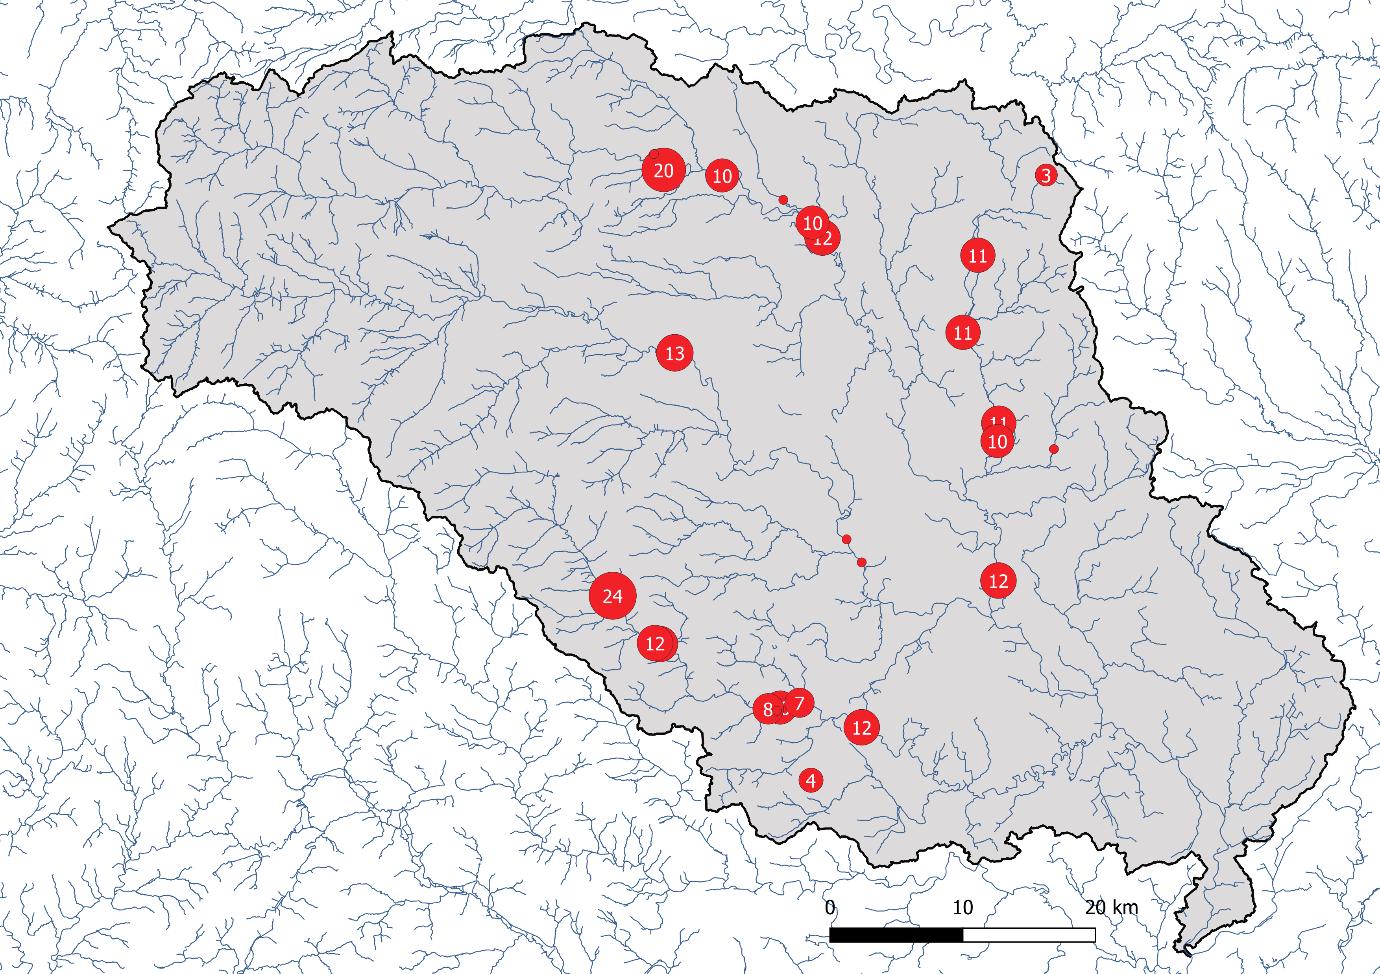
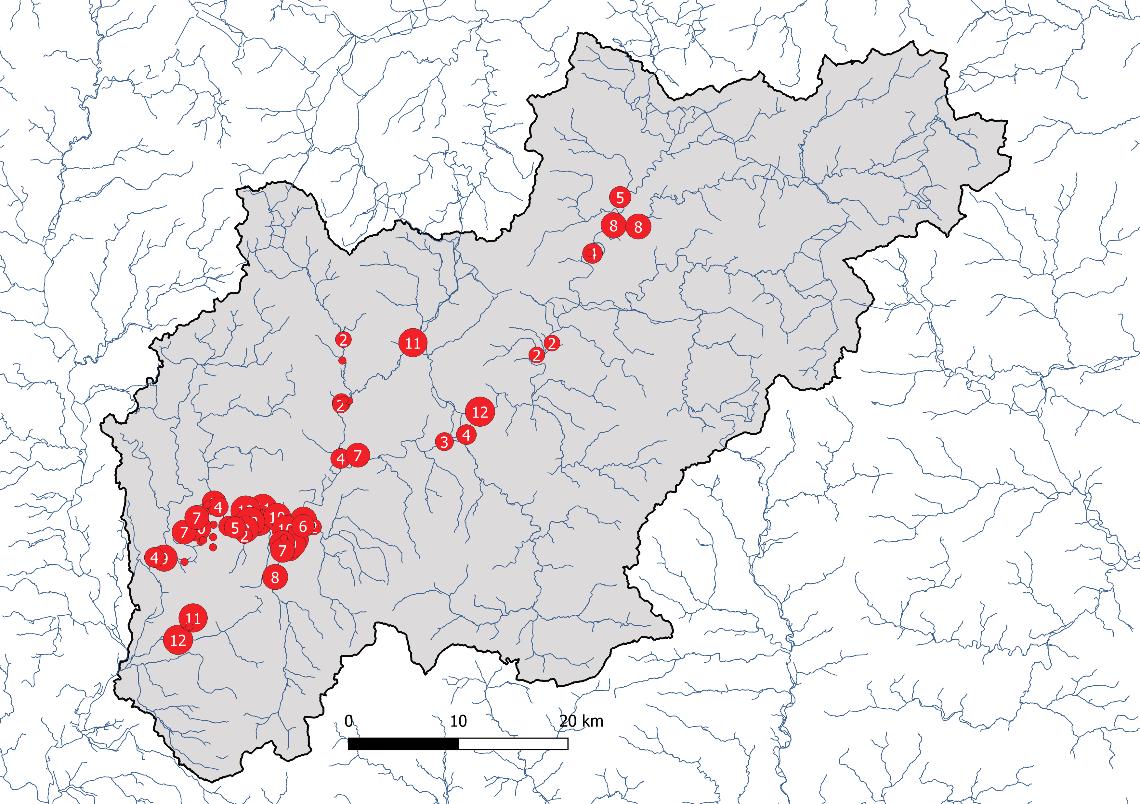
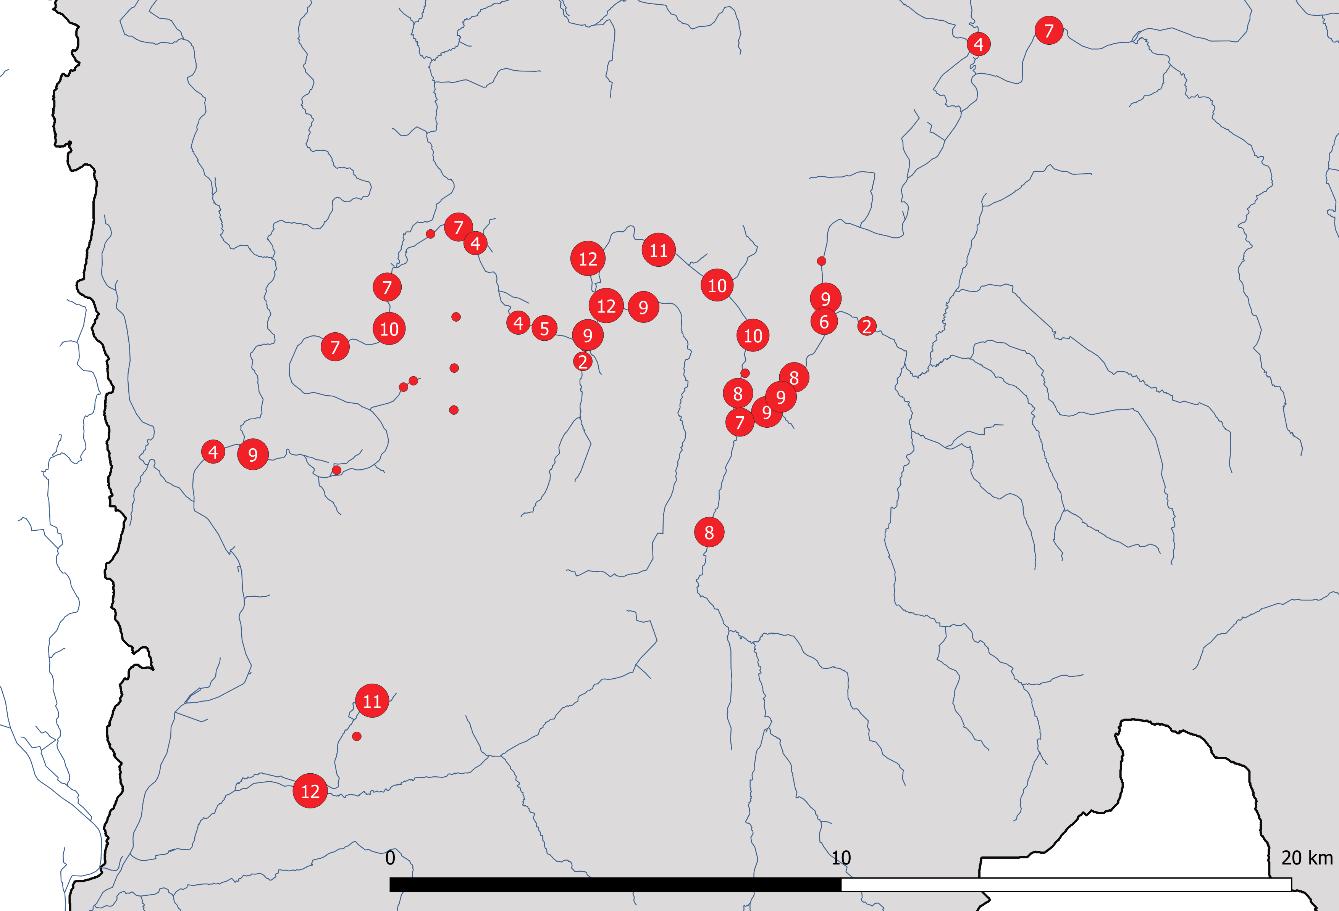
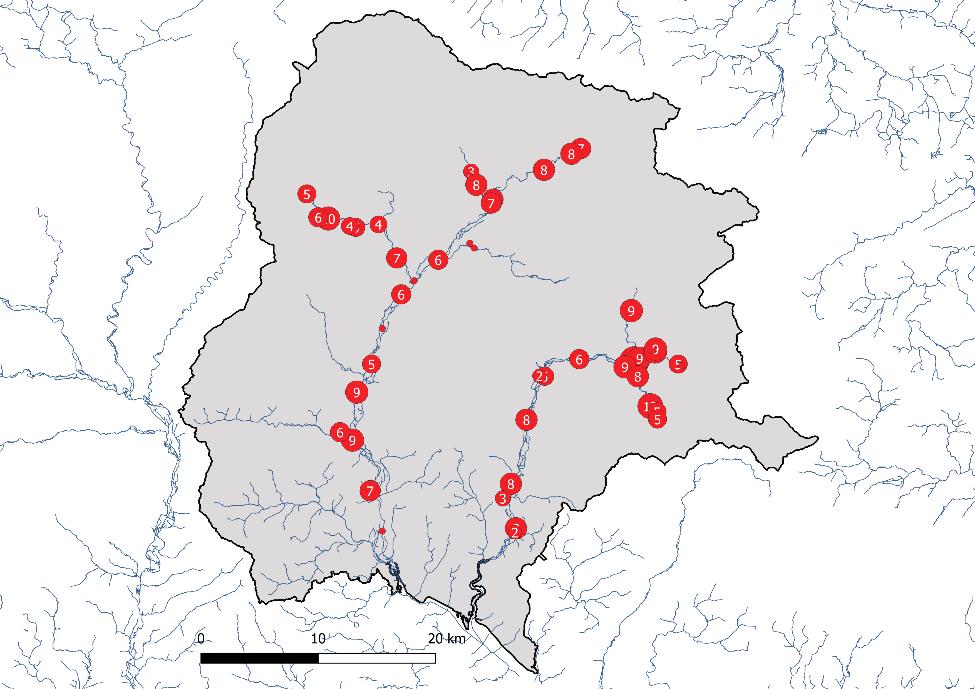
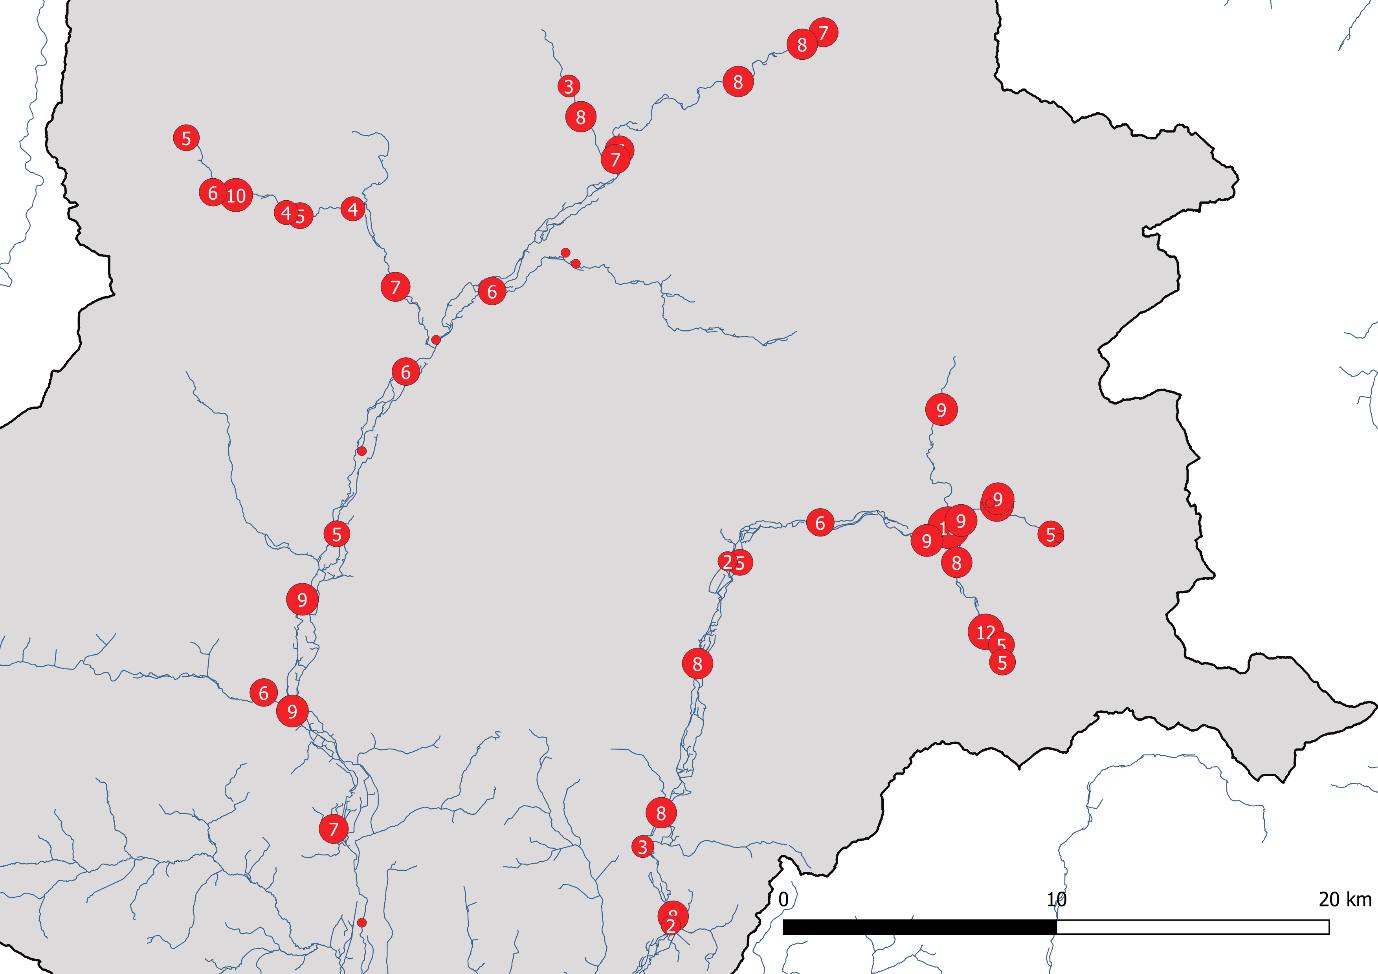
Distribution of records. Numbers within red circles indicate the number of records made within close proximity. Each record consists of multiple measurements and observations taken at the same site and at the same time. Zoomed in section to visualise distribution only.
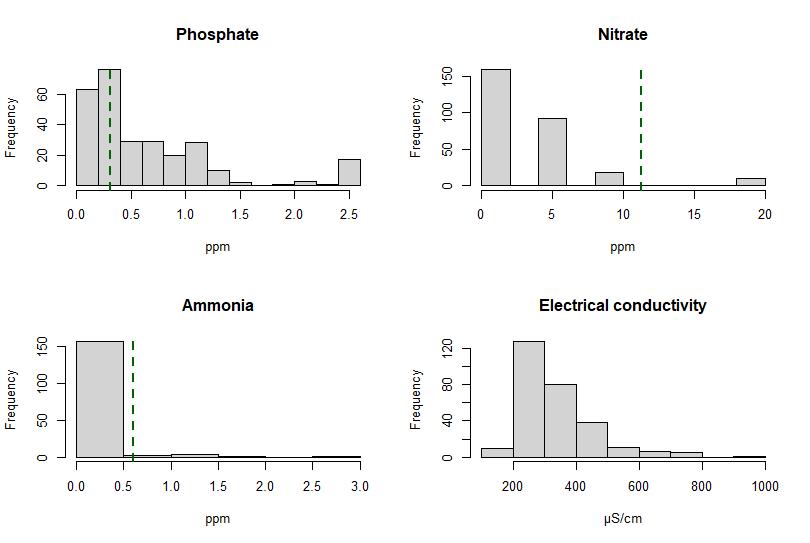
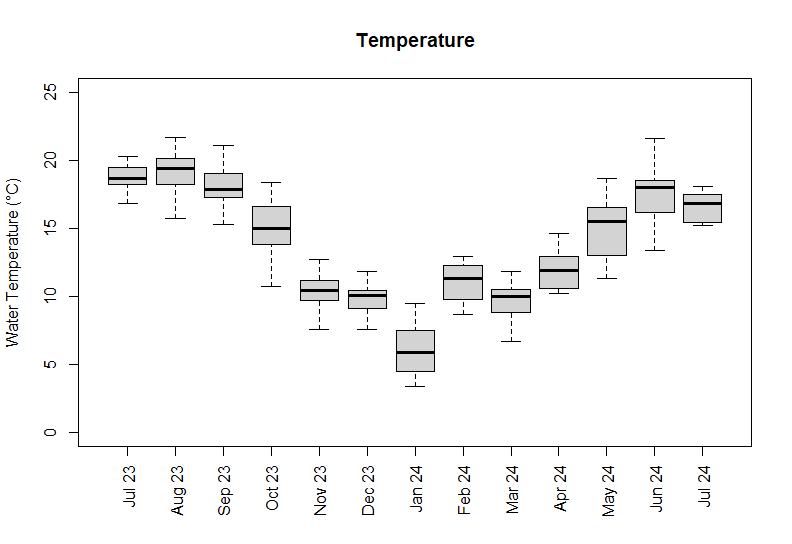
Medway: Frequency distribution of physio-chemical measurements. Green dashed lines indicate environmental quality standards (based on WFD and Nitrates Directive), above which, may indicate some level of pollution (see methods for details).
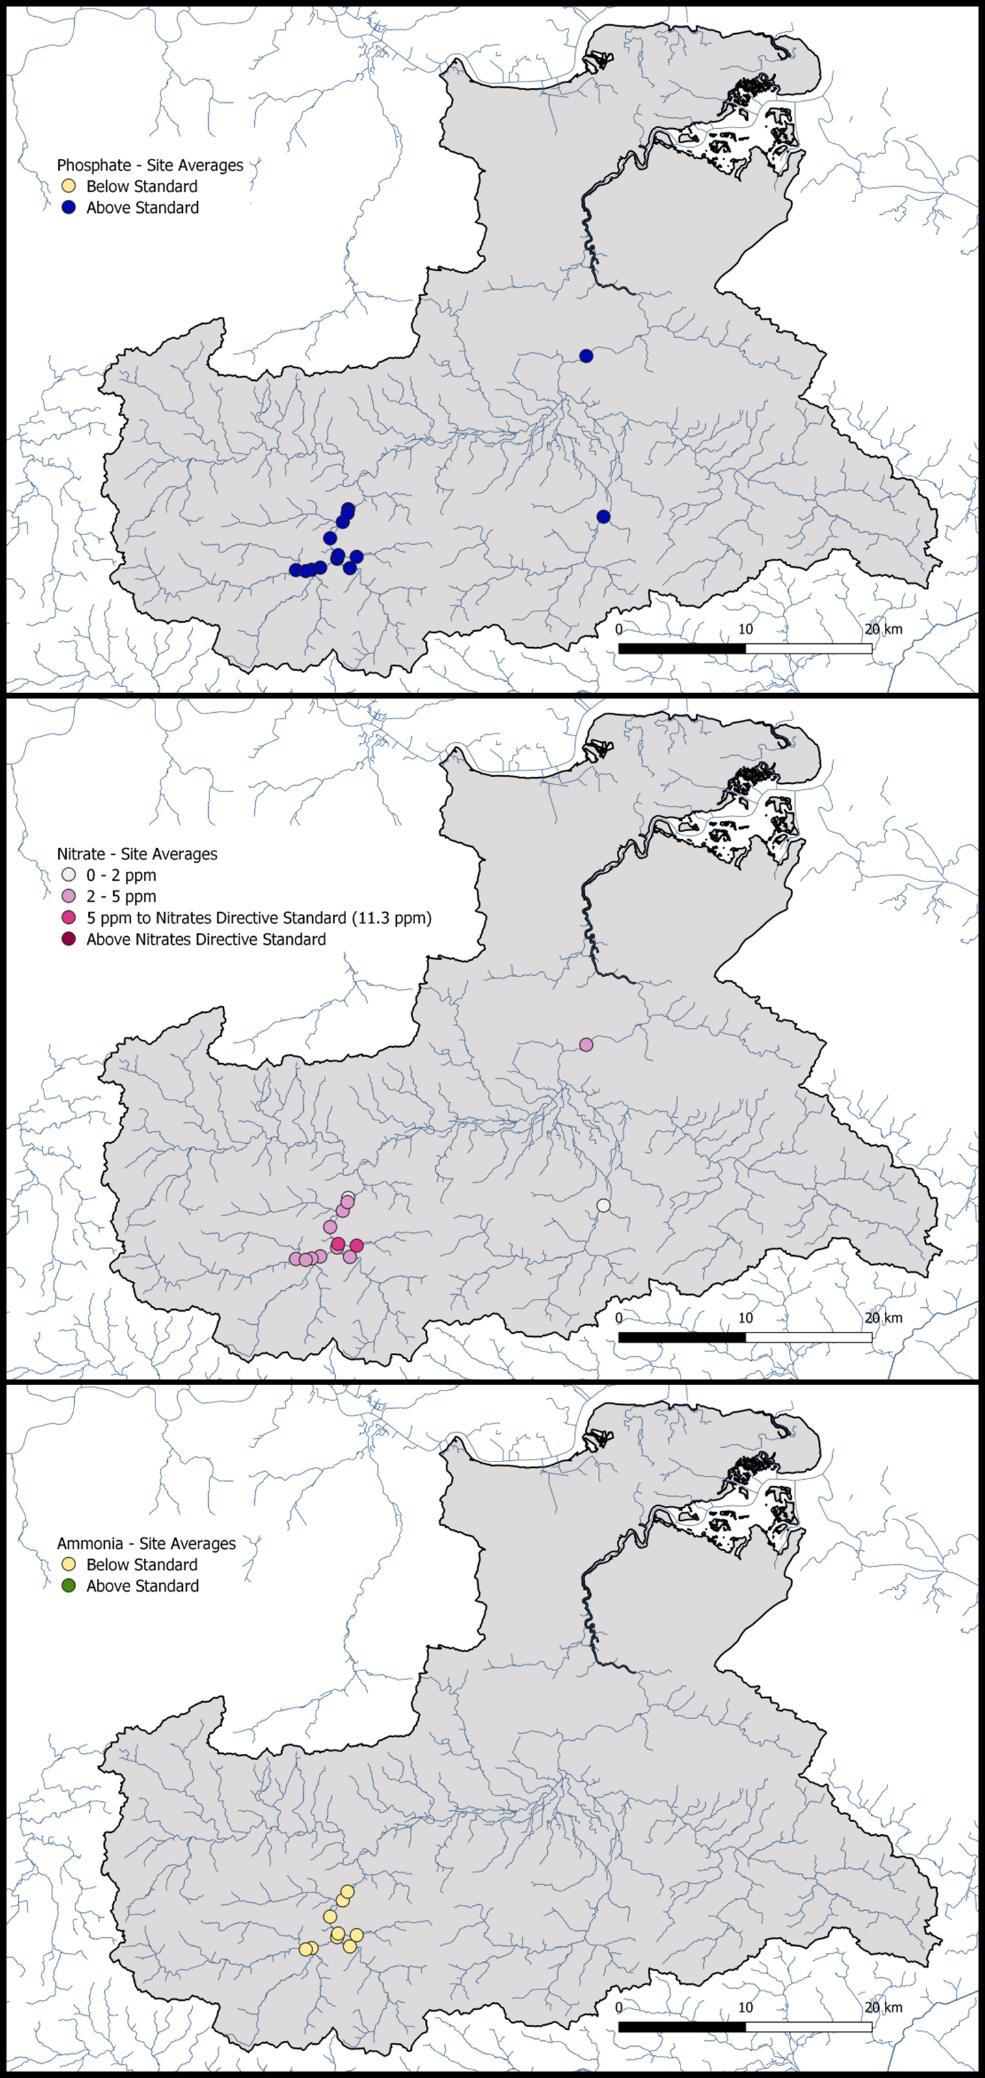
Site averages (minimum 8 replicates) of physiochemical measurements. Above or below standard indicate environmental quality standards (based on WFD and Nitrates Directive), above which, may indicate some level of pollution (see methods for details).
Number of samples
Phosphate 220
Nitrate 220
Ammonia 48
EC 220 Temp 220
• 13 visual records of algal blooms
• 2 records of visual pollution
Distribution of records. Numbers within red circles indicate the number of records made within close proximity. Each record consists of multiple measurements and observations taken at the same site and at the same time.
Frequency distribution of physio-chemical measurements. Green dashed lines indicate environmental quality standards (based on WFD and Nitrates Directive), above which, may indicate some level of pollution (see methods for details).
Site averages (minimum 8 replicates) of physiochemical measurements. Above or below standard indicate environmental quality standards (based on WFD and Nitrates Directive), above which, may indicate some level of pollution (see methods for details).
Number of samples
Phosphate 317
317 Ammonia 72 EC 317 Temp 317
• 0 visual records of algal blooms
• 17 records of visual pollution
Distribution of records. Numbers within red circles indicate the number of records made within close proximity. Each record consists of multiple measurements and observations taken at the same site and at the same time. Zoomed in section to visualise distribution only.
Frequency distribution of physio-chemical measurements. Green dashed lines indicate environmental quality standards (based on WFD and Nitrates Directive), above which, may indicate some level of pollution (see methods for details).
Site averages (minimum 8 replicates) of physiochemical measurements. Above or below standard indicate environmental quality standards (based on WFD and Nitrates Directive), above which, may indicate some level of pollution (see methods for details).
Ammonia not plotted due to low sample size.
Distribution of records. Numbers within red circles indicate the number of records made within close proximity. Each record consists of multiple measurements and observations taken at the same site and at the same time. Zoomed in section to visualise distribution only. Number of
• 6 visual records of algal blooms
• 6 records of visual pollution
Frequency distribution of physio-chemical measurements. Green dashed lines indicate environmental quality standards (based on WFD and Nitrates Directive), above which, may indicate some level of pollution (see methods for details).
Site averages (minimum 8 replicates) of physio-chemical measurements. Above or below standard indicate environmental quality standards (based on WFD and Nitrates Directive), above which, may indicate some level of pollution (see methods for details). Ammonia not plotted due to low sample size.
At the end of its second year of activity, the WQMN has established and maintained citizen science water quality monitoring across many catchments in England and Wales. The volume of data is testament to the widespread concern for rivers and the dedicated efforts of many volunteer anglers. There are many more opportunities to expand the network, and the Angling Trust is keen to recruit more monitors in the next phase. Some gaps in the WQMN coverage of England and Wales can be explained by already established citizen science water quality monitoring groups, for example the Wye Catchment Collaborative Monitoring Network, or West Country Rivers Trust Citizen Science Investigators.
This low-cost citizen science water quality monitoring is not intended as a replacement or rival for statutory monitoring which is the responsibility of the Environment Agency and Natural Resources Wales. Instead it is a powerful complementary measure. Indeed, the WQMN results indicate that phosphate concentrations were more likely than nitrate and ammonia to exceed the standards associated with ecological health, aligning with the focus that has been given in recent years to phosphate in rivers Phosphorus is a cause of eutrophication in freshwaters and is recognised by EA and NRW as a significant cause of water quality failures (EA, 2022, Hatton-Ellis and Jones, 2021). The WQMN data provides further supporting evidence of this.
One concern some have about citizen science data is that they could be biased towards visual pollution, or warmer drier weather (i.e. fair-weather recording). The low incident rate of visual pollution and algal blooms in this data set, and records from year-round indicates this is unlikely to be the case for WQMN data.
The summaries of the second-year monitoring from the most monitored catchments highlight patterns in the data, and some opportunities for further exploration It is important to visualise the distribution of samples across the catchment since monitoring efforts in some catchments are concentrated on a restricted area (e.g. Medway), meaning the summary data for the catchment does not reflect the catchment as a whole. Others, like the Test and Itchen, have more comprehensive coverage of the catchment enabling wider interpretation of results.
The site averages maps highlight some areas that should be prioritised for further investigation to (1) ascertain if the site averages are high due to consistently high measurements, or if a small number of measurements are pulling the mean above the standard, (2), to identify pollution sources, and (3) understand the temporal triggers for these high concentrations. The most obvious areas of concern are the areas of widespread high phosphate site averages in the Medway and Avon Warwickshire. For nitrate, while there are some individual readings above the nitrate standard, only one site (on the Avon Warwickshire) has consistently high readings across the year.
Citizen scientists are in the fortunate position of knowing what is ‘normal’ for their monitoring area: for example, knowing mean concentrations, and the usual responses of the catchment after rainfall. They can then rapidly identify when behaviour is abnormal and potentially report to the relevant agencies. Alternatively, agencies could periodically review data to identify these events. This process requires the statutory bodies, water companies and governments to invest in the development of processes for rapid identification of readings that indicate pollution, and rapid pathways to escalate concerns. This would allow citizen scientists to share their findings with catchment managers so that they can initiate further investigations, actions, or if necessary, enforce regulations on the ground.
Further analysis and future use of WQMN data
• Site averages above standards identified for the four focus catchments should be prioritised for further investigation to (1) ascertain if the site averages are high due to consistently high measurements, or a small number of measurements are pulling the mean above the standard, and (2), to identify pollution sources
• Rainfall and/or discharge data should be examined for these high concentration readings, to understand if there are specific environmental triggers. Site time series graphs can be used to explore spatial patterns. Graphs of citizen science data collected upstream and downstream of suspected pollution sources have been used by others to help identify pollution sources (e.g. Loiselle et al, 2022).
• Known pollution sources (e.g. Combined Sewer Overflows (CSOs)) should be mapped within the catchment, and where possible, data cross-checked with known CSO input times. Local land use could also be mapped to understand whether particular land uses are associated with higher concentration sites.
• Site average maps could be produced for all catchments.
• We recommend continued data collection to enable deeper interpretation of the data –presently we have excluded many of the samples from the catchment maps because sites have not been repeat-sampled. Once a sufficient number of samples per site (>8) are recorded, it is possible to make a more informed temporal assessment and identify how individual sites respond to environmental events (either natural or anthropogenically induced).
• Integration of citizen science data with statutory monitoring (as in the Environment Agency River Wye Management Catchment Integrated Data Analysis Report, 2023). This will enhance the identification of hotspots of poor water quality. The preliminary comparisons of WQMN data to Environment Agency (EA) laboratory tested samples made by some clubs should be reported and quantified.
• Integration with biological measures of water quality e.g. habitat, plant or invertebrate surveys (an example could be invertebrate monitoring through RiverFly), potentially exploring how volunteer photographs could be used for context
• Use the data to address concerns some have about potential citizen science bias. Further exploration of the weather, river level and flow data associated with these samples, along with the date ranges for each catchment could illuminate if recorders are biased to extremes of weather (either warmer drier weather i.e. fair weather recording, or conversely high flows following rain to seek out associated pollution events from storm overflows).
Recommendations
• Make WQMN data freely available online so the data owners (the volunteers), statutory bodies, catchment partnerships and academics can explore and use the data to focus interventions to improve water quality. This could be done relatively cheaply.
• The interpretation of concentrations of nutrients in streams and rivers is complex, as concentrations are influenced by a range of physical and biological parameters. Much more could be done to provide detailed guidance with a range of examples that could empower citizen scientists to interpret their own data.
• Work with agency and academic partners to provide guidance on what citizen science groups can do with their own data – for example, advising on accessing local discharge or rainfall data, matching with CSO data (e.g. SewageMap), demonstrating how template user interfaces could be used to make data visualisations that are useful for individual groups
• By the end of year three there will be a substantial dataset, and time trends could be examined.
• Use the pilot datasets to engage with local agencies (Rivers Trusts, Environment Agency, NRW, water companies) to discuss how citizen science data can be incorporated into their monitoring and assessment – for example, quantifying impacts of interventions, identifying areas of concern or filling gaps between statutory sampling.
• Validation of the Hanna Ammonia checker, similar to that conducted by Cardiff University in 2022 for other low-cost water quality test kit.
Environment Agency (2021). Nitrates: challenges for the water environment. Available from https://www.gov.uk/government/publications/nitrates-challenges-for-the-water-environment.
Environment Agency (2022). Phosphorus and freshwater eutrophication: challenges for the water environment. Available from https://www.gov.uk/government/publications/phosphoruschallenges-for-the-water-environment
Environment Agency (2023). River Wye Management Catchment Integrated Data Analysis Report Available from https://engageenvironmentagency.uk.engagementhq.com/integrated-dataanalysis-reports.
Hatton-Ellis TW, and Jones TG. (2021). Compliance Assessment of Welsh River SACs against Phosphorus Targets. NRW Evidence Report No: 489, 96pp, Natural Resources Wales, Bangor.
Loiselle, S, Koelman, E, and Pilat C (2022). Evenlode Catchment Water Quality and Monitoring Strategy Report. Earthwatch Europe, Oxford, UK.
Von Benzon, E, Bagshaw, E, Perkins, R. (2022) Wye catchment citizen science water quality monitoring report March 2021 – February 2022. Prepared by Cardiff University on behalf of the Wye Catchment Collaborative Monitoring Network.
Map references
England WFD management catchment boundaries © Environment Agency copyright and/or database right 2020. All rights reserved.
Wales WFD management catchment boundaries © Natural Resources Wales and Database Right. All rights Reserved. Contains Ordnance Survey Data. Ordnance Survey Licence number AC0000849444. Crown Copyright and Database Right.
OS Open Rivers. Contains OS data © Crown Copyright [and database right] (2023)
#N/A= no records were made in this catchment
It is important to read the number of records alongside the percentages, as conclusions should not be drawn on a low number of samples.
Catchment summary data (as given in the table below) can be misleading where sampling has not been widespread and is concentrated on particular sub-catchments.