2ndAssestment >>> KFC Operations Management Amalia Nurhidayati - 29323119 General Management 17 S

1.Background
ThebackgroundofKFC
2. Problem Statement
IdentifythecurrentproblemofKFCoperationas
3. Strategic Capacity Management
helpsKFCtoforecastdemandandensurethatithasthe rightamountofcapacitytomeetthatdemand.This includesensuringthatKFChasenoughstaff,equipment,

KFCcanuseprocessanalysistomonitortheperformanceofits kitchenoperationsandensurethattheyarealignedwithits strategiccapacitygoals.
KFCusewaitinganalysistomonitortheperformanceofitskitchen operationsandensurethattheyarealignedwithitsstrategiccapacity goals. KFCcusewaitinganalysistotracktheaveragewaittimefor customers.Thisinformationthenbeusedtomakeadjustmentstothe kitchenprocessasneeded.

Theoverallsummaryandreccomendation


This section contains of :
Company history
Company strategy
Mission & Value
SWOT analysis KFC
KFC supply chain
Problem statement
KentuckyFriedChicken(KFC)isagloballyrenownedfast-foodre wasfoundedbyColonelHarlandSanders,whobegansellingfried Corbin,Kentucky,USA,duringtheGreatDepression.Overtheyear mostrecognizablefast-foodchainsintheworld.
smallr chisebusiness.
omingahousehold
KFC'smaingoalistoprovidethe tastiestfriedchickenusingtheir secretrecipeanduniqueherbs andspices.
KFCfocusesonmakingsurethey serveyouquicklyandthatyou alwaysgetthesamegreattaste everytimeyouvisit,nomatter whereyouare.
They'reopeningmoreKFCrestaurantsall overtheworld,adaptingtheirfoodto matchlocalflavors,andthey'realso tryingtobemoreeco-friendlyandgive backtocommunities.
KFC'smissionistoservegreattasting,high-qualityfriedchickento
satisfytheircustomers'cravings,ensuringajoyfulandfulfillingdining experienceeverytime.
KFCiscommittedtodeliveringtop-notch,deliciousfood madewiththefinestingredientsandcookedtoperfection.
MakingcustomershappyisatthecoreofwhatKFCdoes. Theystrivetoprovideexcellentserviceanddelightfulmeals.
Honesty,ethics,andtransparencyarefundamentaltoKFC'soperations,both withinthecompanyandinitsrelationshipswithcustomersandpartners.
Strongbrandidentityrenownedforiconicfriedchicken andsecretblendof11herbsandspices.
Wideglobalpresencewithavastnetworkoffranchised andcompany-ownedrestaurants.
Menuinnovation,offeringdiversechickenoptionsand adaptingtolocaltastes.
Expandingintonewmarkets
Developingnewmenuitems
Improvingcustomerservice
Reducingtheenvironmentalimpactofoperations
Unhealthyfoodoptions
Longwaittimesinsomerestaurants
Negativeperceptionofanimalwelfarepractices
Perceivedhealthconcernsrelatedtothefriedandfastfoodimage
Competitionfromotherfastfoodrestaurants
Risingfoodcosts
Healthconcerns
Economicrecession
Sourcing
Processing
Distribution
KFCsourcesitsingredientsfromavarietyofsuppliersaroundthe world.Someofthekeyingredientsincludechicken,potatoes,flour,and spices.
KeyPlayers
Poultrysuppliers,potato farmers,flourmillers,spice companies
KFC'singredientsareprocessedatavarietyoffacilities,including chickenprocessingplants,potatoprocessingplants,andflourmills.
Poultryprocessors,potato processors,flourmillers
KFC'singredientsaredistributedtoitsrestaurantsthroughanetworkof distributioncenters.
Third-partylogistics providers
Warehousing KFC'singredientsarestoredinwarehousesatitsrestaurants. KFCemployees
Preparation
KFC'singredientsarepreparedintomealsatitsrestaurants. KFCemployees
Serving KFCmealsareservedtocustomersatitsrestaurants. KFCemployees
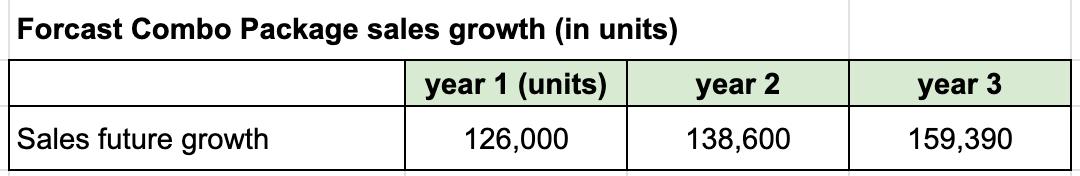
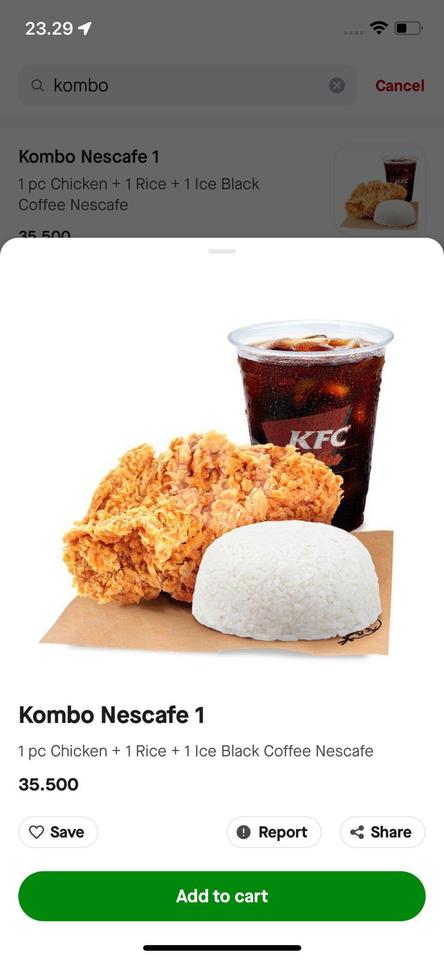
KFC'sComboPackagemenuisapopularchoiceforcustomers,butthedemandforthismenu expectedtoincreasesignificantlyoverthenextthreeyears(YoYincrease10%).Combopacka chicken+rice+drinks.Thepriceperpackageis$2.5.
ThisisputtingastrainonKFC'skitchenoperations,andthecompanyisfacinganumberofcha including:
Bottleneckinthekitchenprocess:ThecurrentkitchenprocessforpreparingtheComboPackageisnot efficientenoughtomeettheexpectedincreaseindemand Thisisleadingtolongwaittimesfor
apacitytomeetthe osoinawaythatdoesnot
Helps KFC to forecast demand and ensure that it has the right amount of capacity to meet that demand. This includes ensuring that KFC has enough staff and equipment
Determining capacity requirement for increasing demand in the next 3 years
Calculating value of decisions tree to know which one the most valuable decisions

KFChavemenu:Combopackage(chicken,rice,drink).Managementwouldliketodetermine yearlyequipmentandlaborrequirementsforitspackingoperationforthenextthreeyears.

KFCneedstodetermineifithasenoughcapacitytomeetfuturedemand.Thecompany currentlyhasacapacityof130,000Combopackagesperyear,andsalesareexpectedtogrow
boPackage.We e/year
To answer Capacity requirement for the next 3 years :
First, need Forecasting to Predict Sales for Kombo Package KFC with growth 10% YoY
Then, Calculate Equipment and Labor Requirements
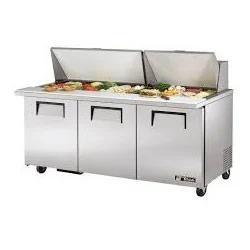
WithCapacitylimitAssumption130,000peryear
2chefneededtoprepareCombopackage
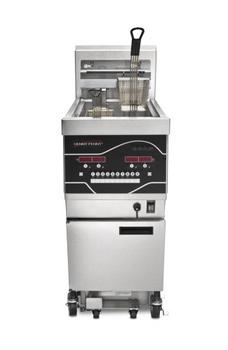
1fryercanpackageeacharound100,000Combopackageperyear.
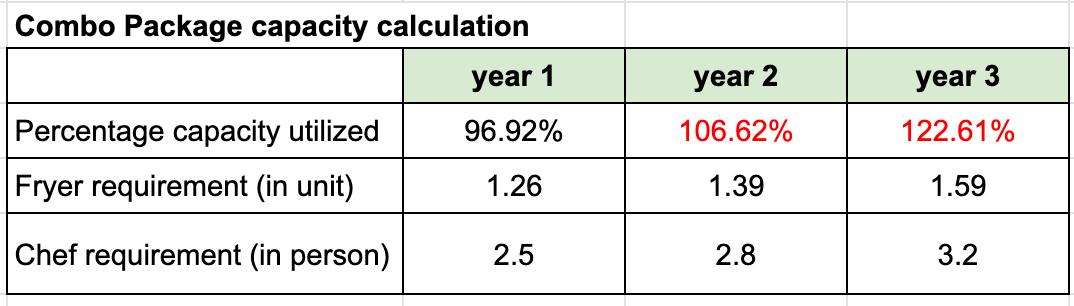
Thesalesisincreasingyear1-3,andthere willbeovercapacityinyear2&3.Sowe needtoaddextralabourandfryertomeet thedemand
Basedontheprojectedsalesgrowth,KFCwillhaveacapacityshortfallinyear2andyear3.Toaddressthisshortfall,KFC
canconsiderhiringmorekitchenstaffandpurchasingadditionalfryers
Basedontheprojectedcapacitycalculation,therewillbeovercapacityinyear2&3.Totackletheissue,thereare3strategy toconsider:Addnewchef,buynewfryer,andaddnewcashier.
KFC,iscurrentlyatapivotalcrossroadsastheownerdeliberatesonhowtomanagetheanticipatedgrowthoverthenext3years.
TheThreeOptionscostassumption:
AddingNewChef
Cost:$43,000
ExpectedOutcome:
StrongGrowth:AnnualReturnsof$150,000
WeakGrowth:AnnualReturnsof$110,000
AddingNewFryer:
CostofImplementation:$15,000
ExpectedOutcome:
StrongGrowth:AnnualReturnsof$90,000
WeakGrowth:AnnualReturnsof$60,000
Addnewcashier:
Cost:$25.000
ExpectedOutcome:
StrongGrowth:AnnualReturnsof$120,000
WeakGrowth:AnnualReturnsof$105,000
ProbabilityofStrongGrowthduetoincreasedpopulationfromthenewelectronicsfirm:55%~0.55
ProbabilityofWeakGrowth:45%~0.45
Operatingcostsforalloptionsareequal.
Waitingformorethanoneyearcouldleadtocompetitionmovingin,makingexpansioninfeasible.
1. 2. 3.Fromtheassumptionof3options,wedeterminethedatatothetable.Andcalculatevalue$for3yearsofeachoptions. theobjectiveofcalculatingthevalueofadecisiontreeforaddingachef,addinganewfryer,oraddingacashieristo determinewhichoptionwouldhavethegreatestpositiveimpactonthecompany 'sprofitability
Revenue-Addchef=$410,000
Revenue-addchef=$290,000
Revenue-Addnewfryer=$255,000
Revenue-Addnewfryer=$165,000
Revenue-AddCashier=$335,000
Revenue-AddCashier=$290,000
Wehave3optionstoaccomodatesalesgrowthfor3years:Addnewchef,addnewfryer,addnewcashier
Addingachefisthemostlikelyoptiontoleadtoasignificantincreaseinrevenue,withanexpectedvalueof $356,000.Thisisthehighestexpectedvalueofthethreeoptionsthatleadtobestoptionforfuture.
Thismeansthatthereisa55%chancethataddingachefwillleadtoanincreaseinrevenueof$410,000anda 45%chancethatitwillleadtoweakgrowthof$290.000.Theexpectedvalueof$356,000issumofstrong& weakgrowthaftermultiplyby%probability
Thedecisiontreeshowsthataddingachefisthemostlikelyoptiontoleadtoasignificantincreaseinrevenue, witha55%chanceofincreasingrevenueby$410,000.Addinganewfryeristhesecondmostlikelyoptionto leadtoasignificantincreaseinrevenue,witha55%chanceofincreasingrevenueby$255.000.
KFC can use strategic capacity management to forecast demand and ensure that it has enough staff and equipment on hand to meet customer demand. Steps involved in strategic capacity management :
Forecast demand. KFC demand for next 3 years increased 10% YoY
Assess current capacity. = KFC in year 2 & 3 will going to be over capacity
Develop plans to address capacity gaps. = To tackle the issues, we will choose add new chef for year 1-3
Improve profitability can help to reduce costs and increase revenue.
Improve customer satisfaction
By ensuring that the company has the capacity to meet customer demand
Gain a competitive advantage can help companies to gain a competitive advantage over their rivals.
TheobjectiveofprocessanalysisforKFCistoidentifyand improvetheefficiencyandeffectivenessofitsbusiness processes.Wedeterminetheprocessofkitchenformaking 1kombopackagechicken.Herearethecontent:
Theflowchartprocess+stepsofactivities
Throughput
BalancingbottlenecksfromChefAtoChefBbyadding
newfryerandnewchef
ProductProcessMatrix
Break-evendemandforinvestmentnewfryerandnew chef
Executed by 2 chef
Executed by 1 person food preparator
Executed by 1 cashier
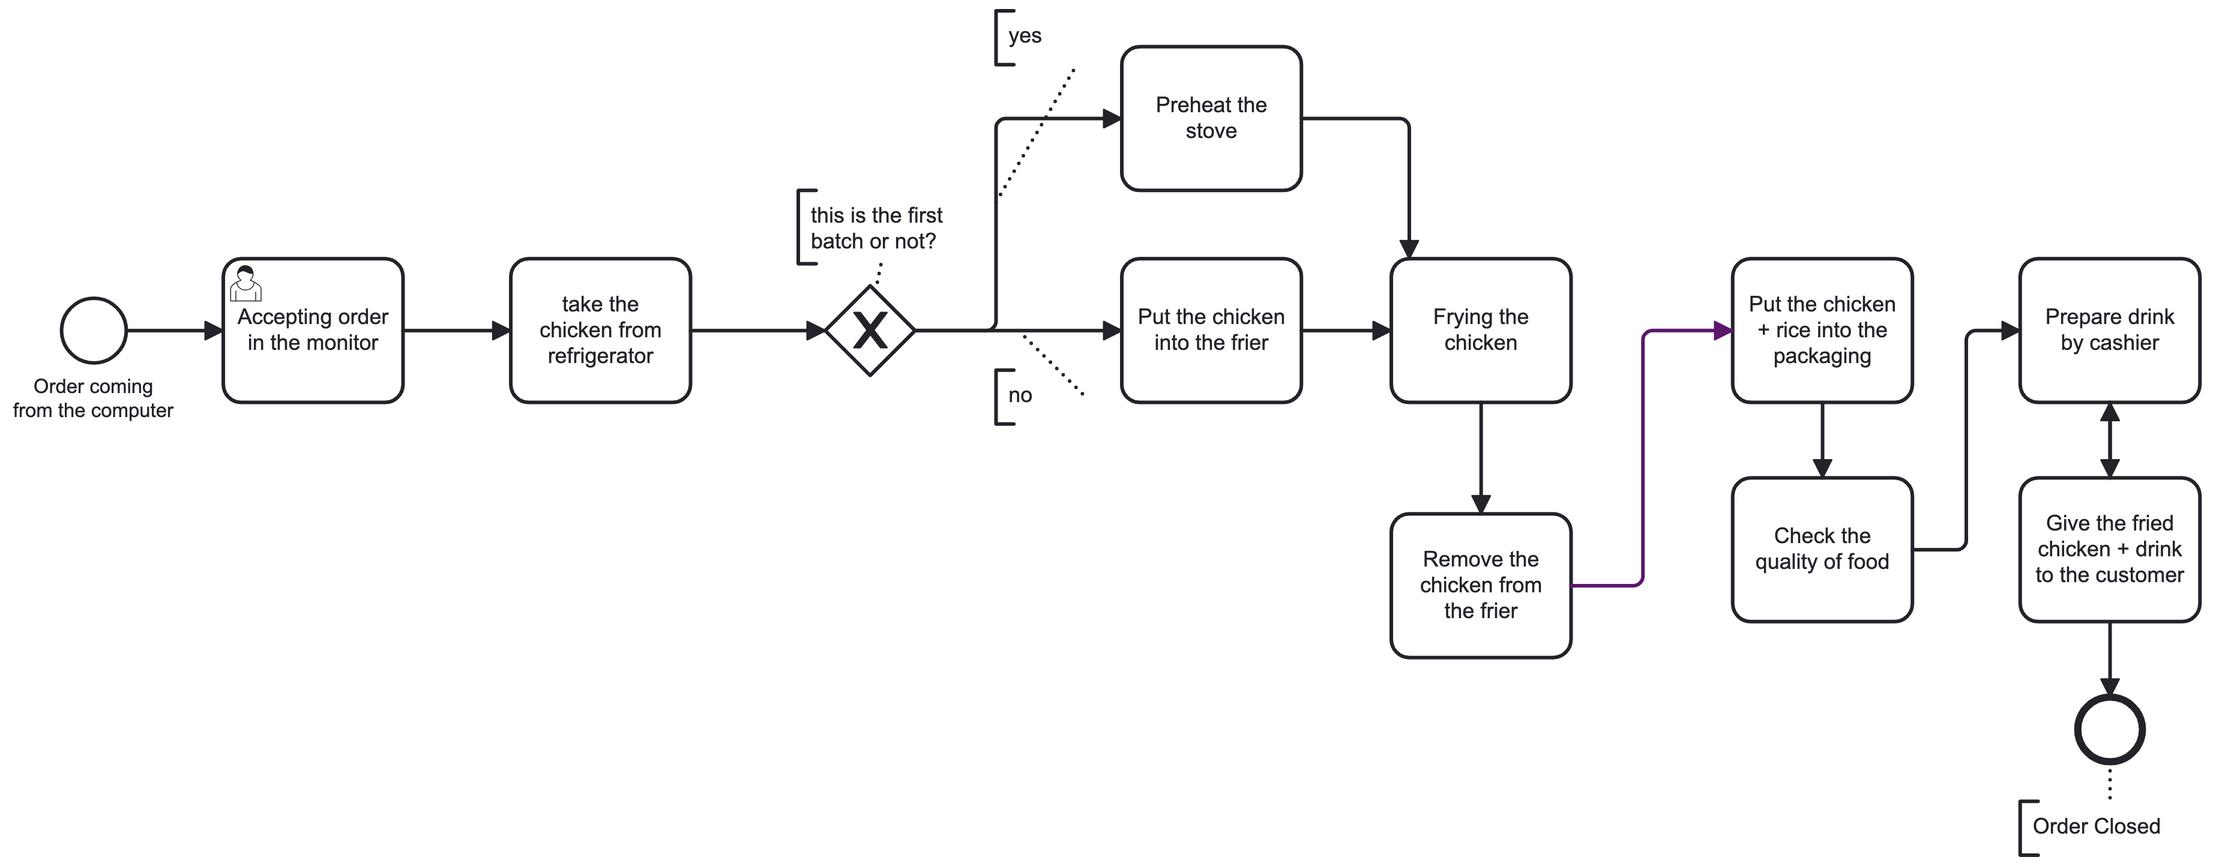
Theobjectiveoftheprocessistotakeanorderfromacustomeranddeliverthefriedchicken tothe customerquickly.Theproccessexecutedby2chef,1foodpreparator,1cashier.Thecurrent processtook 33.5minutesfor12kombopackage.Theflowchartcanbeusedtoanalyzetheperformanceofthe orderingandfulfillmentprocessandtoidentifypotentialbottlenecks.
Aftervisualizetheflowchart,wedeterminethestepofactivities.Itshowsthecycletimeofeachactivities,starttimeandfinish,theworker whoresponsibletothetask.Weknowthattheoveralltimetofinishtheprocessis33.5minutes,andthetotalchickenfrom1batchis1dozen ~12pcsKombopackage(chicken,rice,drink)
9
Thisshowsinformationaboutcycletime,totalproduction.Wecalculatethetotalproductionfor8hours(1daywork).
1 Accepting order in
2 take the chicken from refrigerator and cooling
3 Put the chicken into the fryer & set temperature
4 Frying the chicken
5 Remove the chicken from the fryer
6 Put the chicken + rice into the packaging
7 Check the
8 Prepare drink by cashier
9
refrigerator = 3 dozen/5 min
Chef B
- 1 fryer = 1 dozen/15 min
Chef B
Food preparator
Food preparator
FirstBatchintotaltimeweneed=33.5minutes~1dozen
Cycletime2ndbatchandsoon=16minutes(putchickenintofryerandfryingthechicken)
8hours=480minutes
Sointotal#dozenwecanmake=(480-33.5)/16min+1dozen=29dozenchicken
**thefirstbatchneedtopreheatthechickenand2ndbatch=justaddadditional16minutes
How much of time for Chef A and Chef B to fill each orders?
WewanttoknoweachCheftaketimepereachorder,anditshowsthatinbalancetimework
take
ChefAneedtimetoacceptingorder(2min)+takeoutfromrefrigerator(2.5min)=4.5minutes
ChefBneedtimetoputchickenintothefryer(1min) +removethechickenfromthefryer(3min)= 3minutes
We relized that there’s bottleneck (inbalance) from take chicken from refrigerator to put the chicken into fryer. Below show the closeup bottleneck process :
Current layout
Takethechickenfrom refrigerator
Cycletime:
Putthechickenintothefryer andFriedthechicken
Cycletime:
Raw Chicken cooked fried chicken (WIP)
ChefA=40dozen/hour have3refrigerators=3 dozenchicken 3dozen/4.5minutes
1chef=20dozen/hour
have1fryer=1dozen chicken
1dozen/3minutes
ChefA

3Refrigerators 1Fryer
There’s inbalance process from refrigerator to fryer
Capacity=1chef/3dozen/4.5minutes
ChefB
Capacity=1chef/dozen/3minutes
Inbalanceprocessfrom3refrigeratorto1fryer,alsothere’sinbalancecapacityfromChefA(40dozen/hour)toChefB(20dozen/hour)
How to balance the process from refrigerator to fryer?
If we add 1 fryer, the capacity will balance
CapacityofChefAandChefBarenotbalanceiftherejust1fryer,butifweadd1morefryertotheprocess,thecapacityofChefA andChefBwillBalance.ChefBcapacityincreasedduetothejobdescthatcorrespondswiththenumberofthefryer(Putthe chickenintothefryer&settemperature,revomethechicken)
Before
3dozen/4.5minutes
Rateperhours=40dozen/hour
ChefB
ChefA +
1dozen/3minutes
Rateperhours=20dozen/hour
If we add 1 fryer
After
ChefA
3dozen/4.5minutes
Rateperhours=40dozen/hour
ChefB
2dozen/3minutes
Rateperhours=40dozen/hour
Ifweadd1fryerthecapacityproductionfromChefAtoChefBwillbalance.ChefAwillproduce40dozenchicken/hour,andafter addingnewfryertheChefBwillproduce40dozenchicken/hourtoo
If we add 1 new Chef, the capacity will balance
CapacityofChefAandChefBinadayarenotbalance.Ifwehire1newchef,thecapacityperdaywillbalance.ChefCwillhelpChefBtofriedthe chicken.thetotalcapacity/dayofChefA=320;ChefB+ChefC=320(balance)
Takethechickenfrom refrigerator
Putthechickenintothe frierandFriedthe chicken
Cycletime: 1chef=20dozen/hour
Raw Chicken cooked fried chicken (WIP)
Cycletime:
ChefA=40dozen/hour 1hour/40dozen
Takechickenfromrefrigerator=
Produce40dozen/hourx8hourworkindayx1chef=320capacity/day
Fryingthechicken=
Produce20dozen/hourx8hourworkindayx2chef=320capacity/day
Thecapacitiesareroughlyequals
Currentsituation:
totaldozenthatchefAproduceinamonth=320x12=3.840dozen
totaldozenthatchefBproduceinamonth=160x12=1920dozen
totaldozenthatchefCproduceinamonth =1600x12=1920dozen
Sothetotalof3chefs=7680capacity
Ifweadd1chef,thetotalproductionwillincrease100%
Add new 1 Chef C
Putthechickenintothe frierandFriedthe chicken
Cycletime: 1chef=20dozen/hour 1/2hour=40dozen
Chef A Chef BTheproduct-processmatrix,alsoknownastheoperations processmatrix,helpsinunderstandingtherelationshipbetween thetypeofproductbeingproducedandthetypeofproduction processused.
InthecaseofKFC,afast-foodrestaurant,themostsuitable representationontheproduct-processmatrixwouldbethe "AssemblyLine"approach.
KFCoperatesusinganassemblylineapproach,characterizedby acontinuousflowofstandardizedfooditemsbeingprepared, cooked,andassembledinasequentialorder.
Explanation:
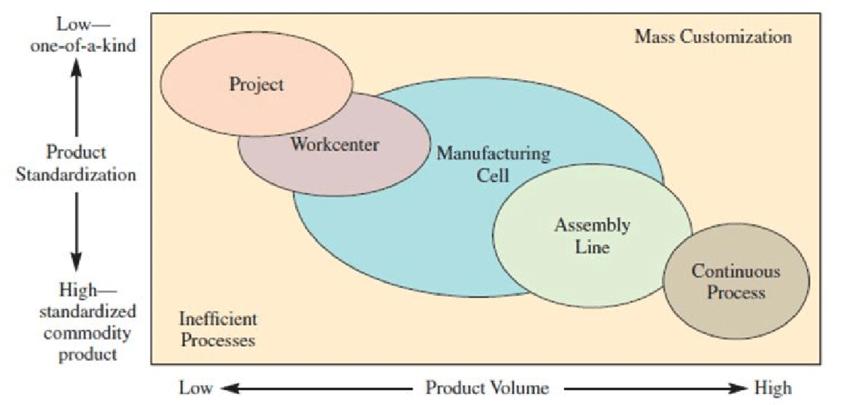
Differentcomponentsofameal(chicken,drink,friesetc.)arepreparedatdifferentstations,eachspecializinginaspecifictask (frying,grilling,etc.).
Theitemsmovedowntheline,andeachstationaddsspecificelementstotheorder,suchasfryingchicken,preparingsidedishes, andassemblingthefinalmeal.
Thisapproachallowsforahighvolumeofstandardizedproductstobeproducedefficientlyandquicklytomeetcustomerdemand.
The"AssemblyLine"approachisthemostsuitableforKFCgiventhestandardizednatureoftheirmenuitemsandthehighdemand forfastfood.Itensuresefficiency,consistency,andspeedindeliveringtheirsignatureproductstocustomers.
Afterwecalculatecapacityafterweadd1newchefand1newfryer.WewanttoknowaboutBreak-evendemand oftheseinvestment.Theobjectiveisto determinetheminimumnumberofunitsthatmustbesoldinordertocoverallcostsandmakenoprofitorloss.ThisinformationcanbeusedtohelpKFCmake decisionsaboutpricing,marketing,andproduction.
Tocreateabreak-evendemandassumptionfortheoptionofKFCaddnewchefandaddnewfryerweneedtomakesomeassumptionsaboutthefixedand variablecostsassociatedwitheachoption.
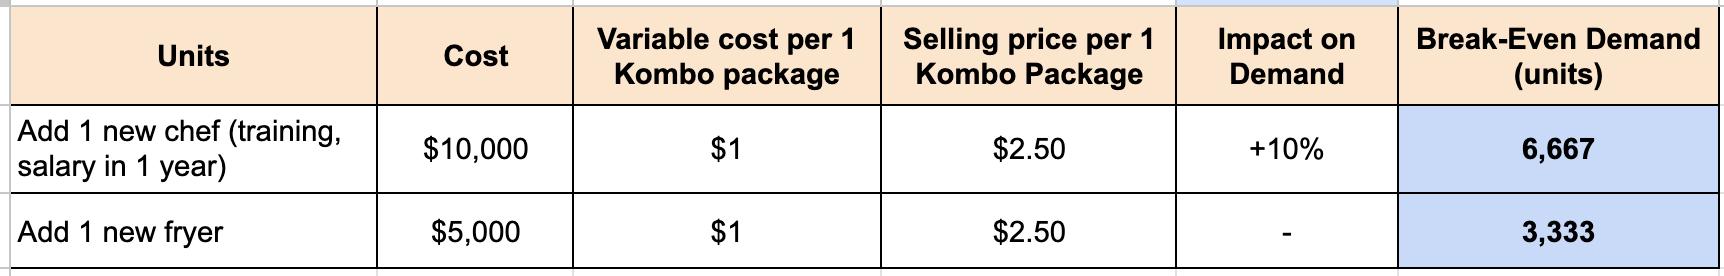

Basedontheassumptionsabove,thebreak-evendemandforKFCtoadd1newchefis6.667unitsperyear,whilethebreak-evendemandforKFCto add1newfryeris3.333unitsperyear.Thismeansthataddinganewchefismoreexpensivethanaddinganewfryer.But,thebenefitsofaddingachef outweighthebenefitsofaddingafryer.AchefcanhelpKFCtoincreasedemand(chefcanpreparevarietyoffoodandcanalsocookfooditemsto order),improvecustomersatisfaction,andincreaseflexibility(achefcancreatenewmenuitems,preparefoodforspecialeventsetc)
Identifying and eliminating bottlenecks. Bottlenecks are the steps in the process that take the longest. By identifying and eliminating bottlenecks, KFC can reduce the cycle time and improve throughput.
Thetotalprocess1stbatchrequired33.5minutes
Throughput=29dozenchicken/8hour~ 348pcsKomboPackagein8hour
There’sbottleneckfromtakechickenfromrefrigeratortoputintothefryer.Tobalancetheprocess,weneedtoadd1
chefandadd1fryer,thetotalcapacity/daywillincrease100%
theproduct-processmatrixofKFCwouldbethe"AssemblyLine"
FromtheBreakevendemand.add1newchef=BEP6.667unitsperyear.add1newfryer=BEP3.333unitsperyear.Add chefismoreexpensive,butthedemandwillincreaseduetoproductivityincrease,improvesatisficationandhelpnew jobdesk.
HerearesomespecificexamplesofhowKFCcanuseprocessanalysistoimproveitsbusiness:
Reducethetimeittakestofulfillcustomerordersbyaddingnewchef
Improvethequalityoffood.Thiscanbedonebyimplementingaqualitycontrolprocessthatensuresthatallfoodis preparedtothesamehighstandards.
Reducefoodwaste.Thiscanbedonebyimprovingtheaccuracyofinventoryforecastsandbyusingfreshingredients.
Improvecustomersatisfaction.Thiscanbedonebyprovidingbettercustomerserviceandbyimprovingthequalityof food.
KFCusewaitinganalysistomonitortheperformanceofitskitchen operationsandensurethattheyarealignedwithitsstrategiccapacity goals. KFCcusewaitinganalysistotracktheaveragewaittimefor customers.Thisinformationthenbeusedtomakeadjustmentstothe kitchenprocessasneeded.
ThroughprocessanalysisatKFC,we'vedeterminedthattheadditionof1chef effectivelybalancesthedailymenuproductioncapacityandtime.
Inourwaitinglineanalysis,weaimtoquantifytheeffectsofthecurrentsituation(no addchef)versusthenewscenario(with1extrachef) intermsofcustomerwaiting timesandorderprocessingattherestaurant.
howfoodordersflowthroughthekitchen,Averagewaitingtimeforcustomers, Averagequeuelength,Probabilityofacustomerhavingtowaitinline.
Inthissectionyou’llfind:
1.
CalculatingWaitingLinecurrentsituation
2.
CalculationWaitingLineafteradd1newchef
3.
Comparingcurrentvsnewscenario
4.
Conclusion
Waitinglineanalysisisamathematicaltechniqueusedtoanalyzeandmodelqueuingsystems.Itcanbeusedtounderstandhow customersflowthroughasystem,identifybottlenecks,andimprovetheefficiencyofthesystem.
InthecontextofKFCkitchenproduction,waitinglineanalysiscanbeusedtounderstandhowfoodordersflowthroughthekitchen, identifywherebottlenecksoccur,andimprovetheefficiencyofthekitchenoperation.
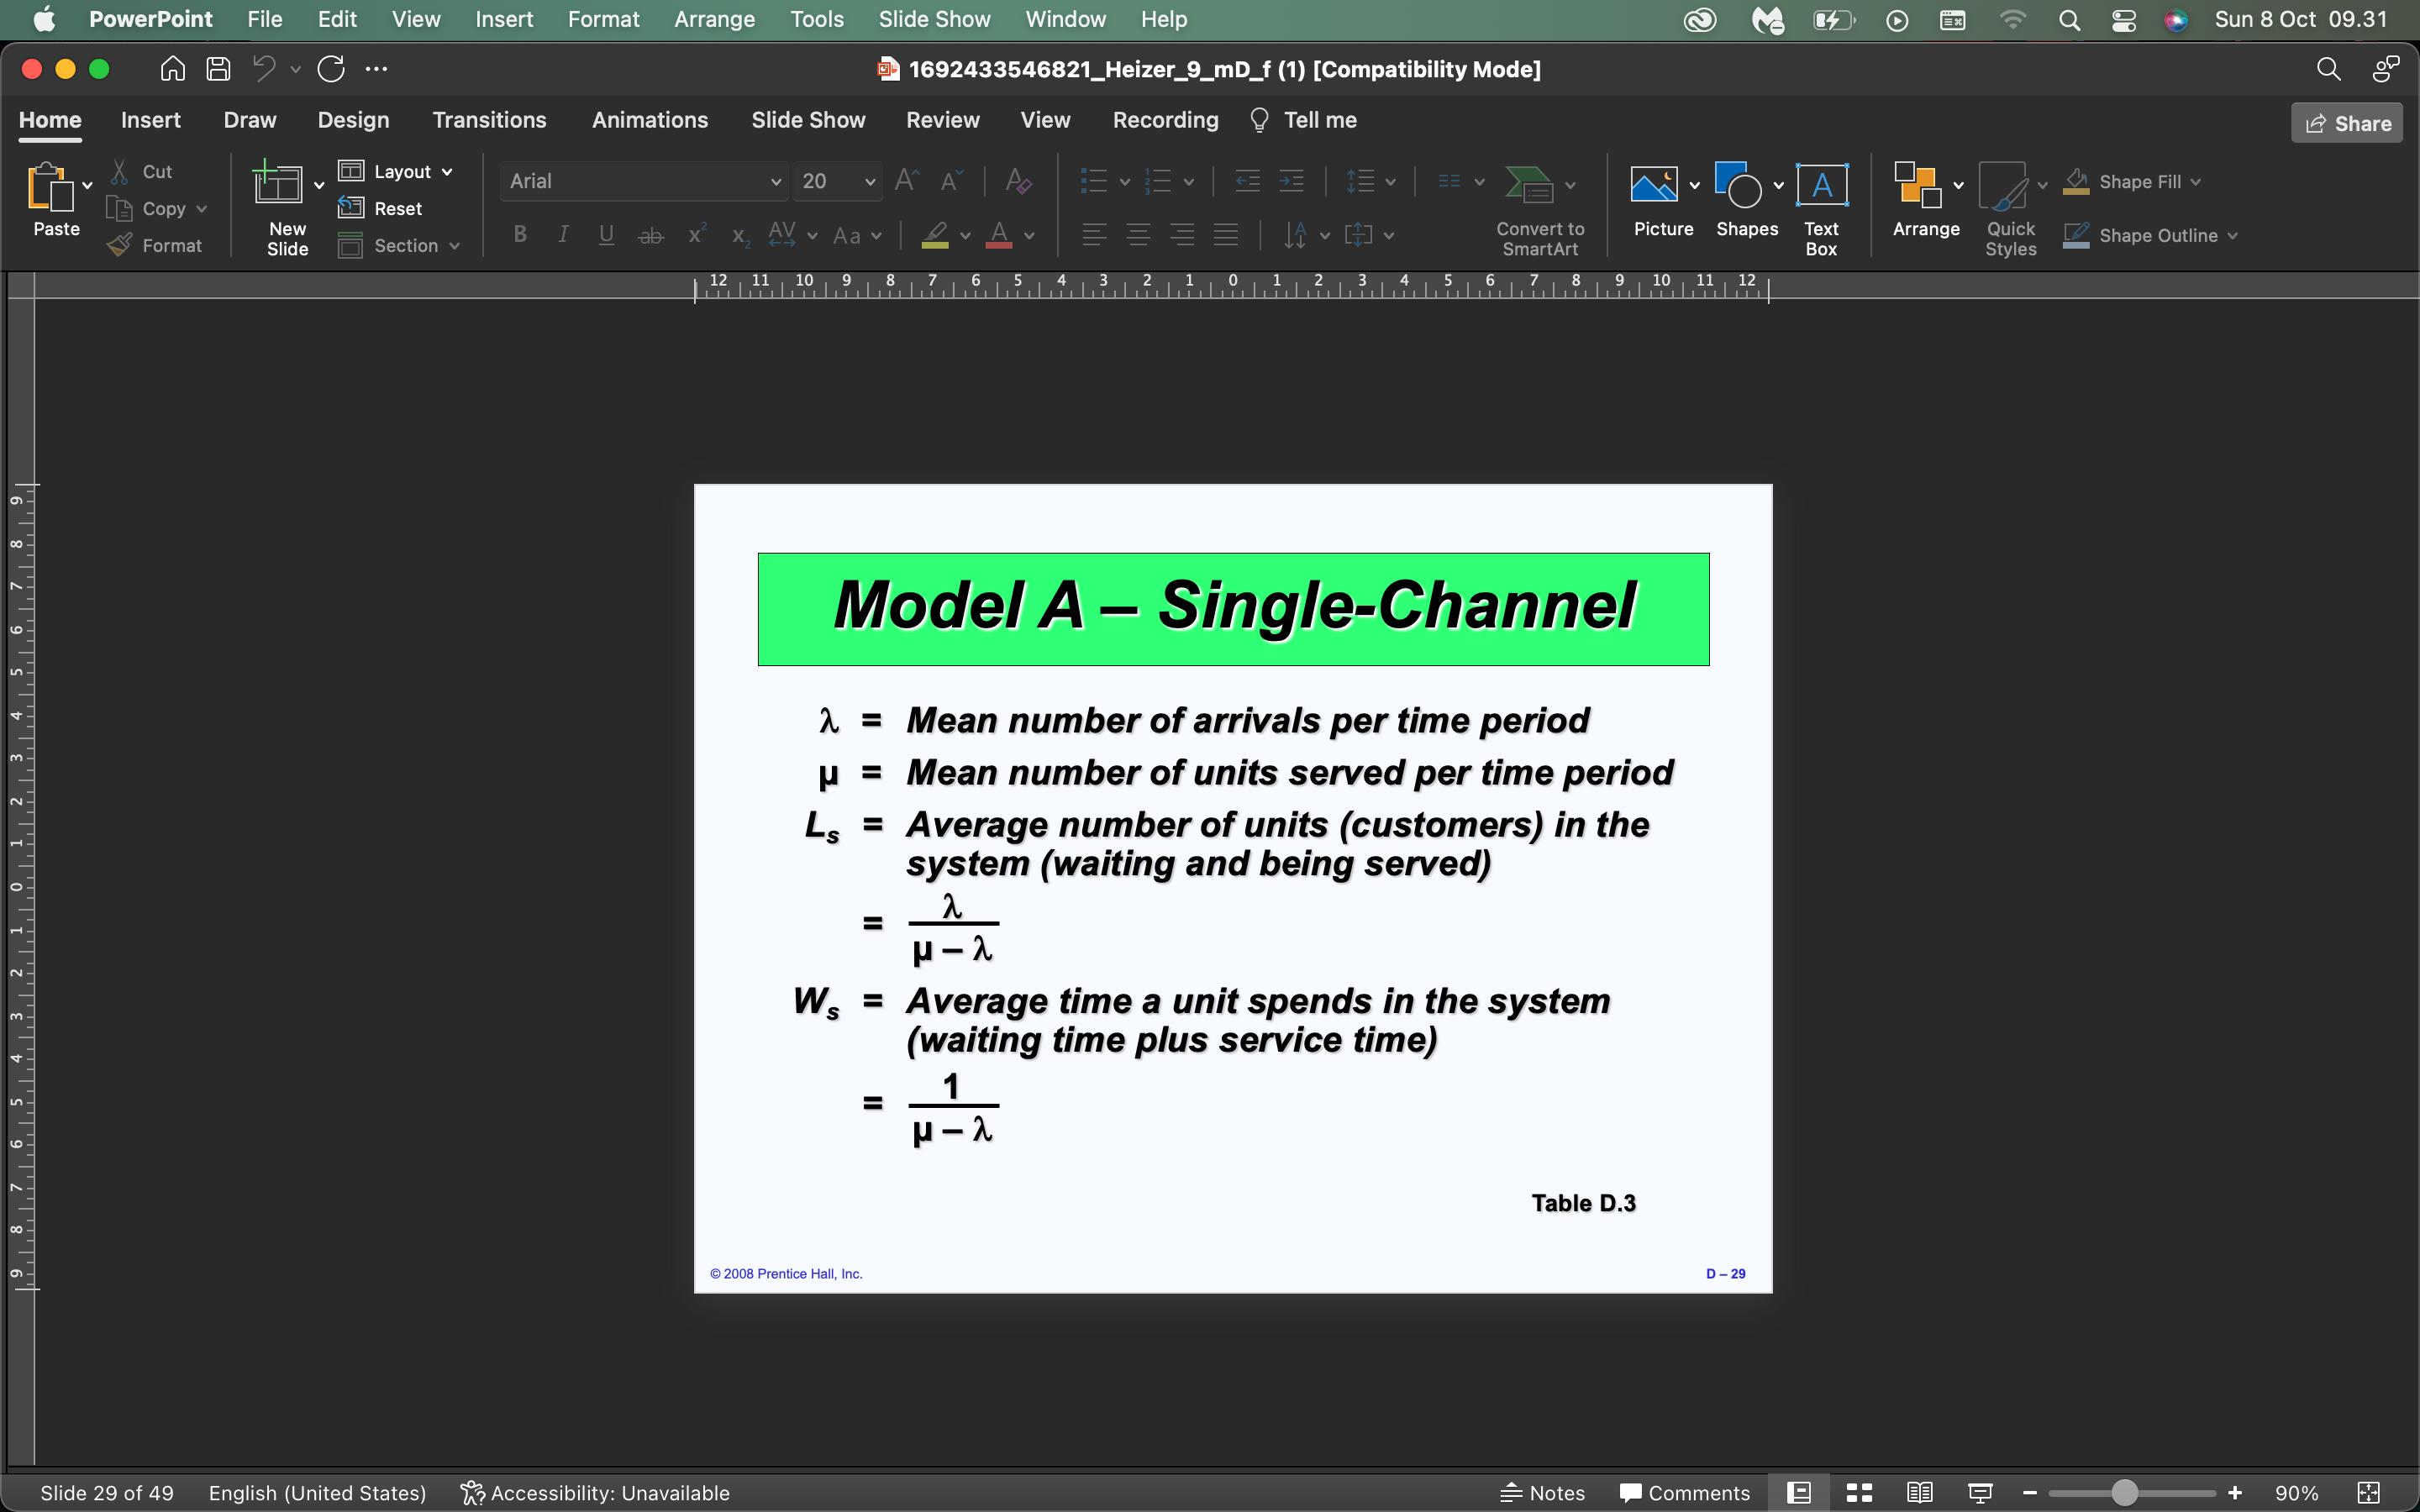
Asinglechannel-singlephasewaitinglinesystemisaqueuingsystemwherethereisonlyoneserver(thekitchen)andonephaseof service(preparingthefood).
Themodelcanbeusedtocalculatethefollowingmetrics:
Theaveragewaitingtimeforcustomers
Theaveragequeuelength
Theprobabilityofacustomerhavingtowaitinline
Theprobabilityofacustomerhavingtowaitlongerthanacertainamountoftime
Question:HowcanKFCimprovetheefficiencyofitskitchenoperationsandreducethewaitingtimeforcustomers?calculate
Averagewaitingtimeforcustomers,Averagequeuelength, Probabilityofacustomerhavingtowaitinline
Assumptioncurrent(2chef)
Thearrivalrateofcustomersis30customersperhour.
Averagenumberofunitswaitinginthequeue
=4customers
Theservicerateofthekitchenis45ordersperhour.
Thenumberofcustomersinthesystemis30
Theaveragewaitingtimeforcustomersinsystem
Averagetimeaunitspendsinthesystem
= = hour
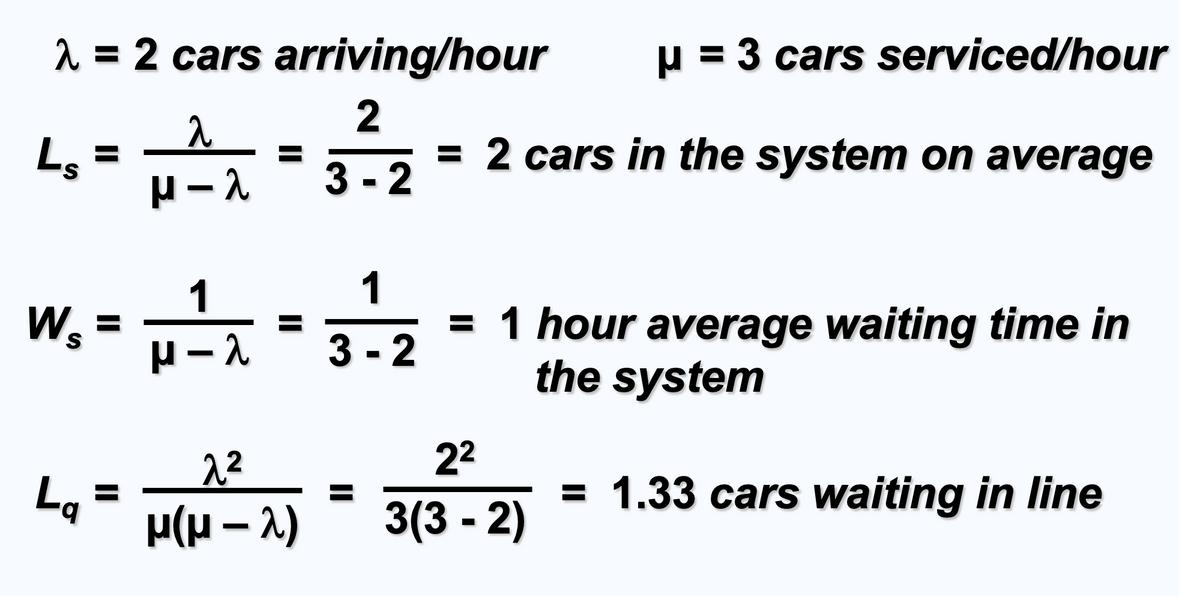
=2customersinthesystemonaverage =4minutesaverage waitingtimeinsystem
waitingtimeinthesystem
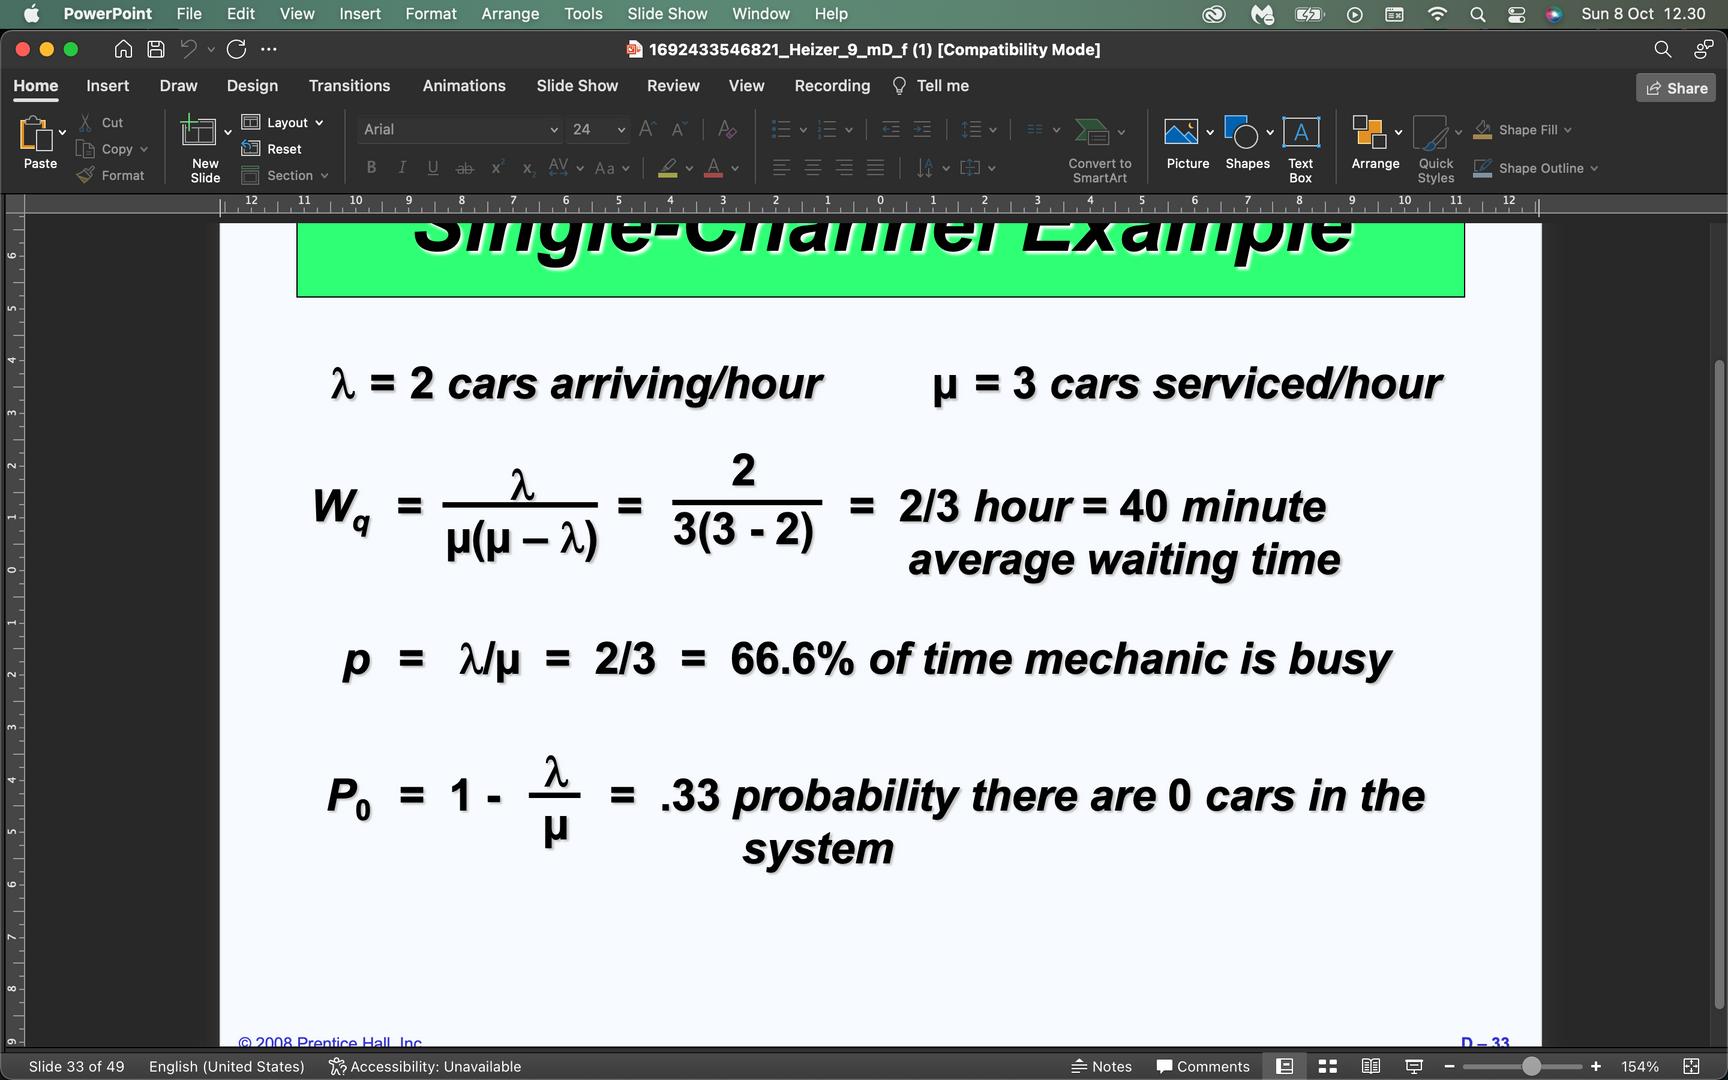
Averagetimeaunitspendswaitinginthequeue
hour
=2.67minutesaverage waitingtime
Utilizationfactorforthesystem
30/45=67%thekitchenarebusy
Probabilityof0unitsinthesystem
=0.33probabilitythereare0customersin thesystem
Afterthat,wecalculateprobabilitykcustomersinthesystemtogetfoodfromthekitchen
Assumptioncurrent
Thearrivalrateofcustomersis 30customersperhour.
Theservicerateofthekitchenis 45ordersperhour.
Thenumberofcustomersin thesystemis30

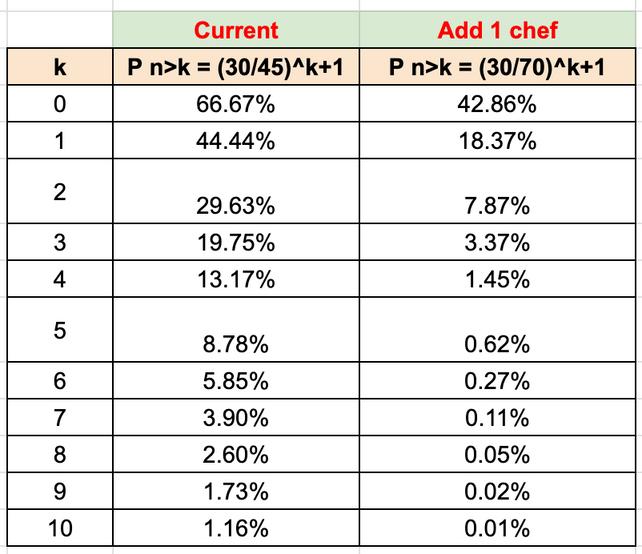
Probabilityofmorethan0unitsinthesystem,wherenis
thenumberofunitsinthesystem
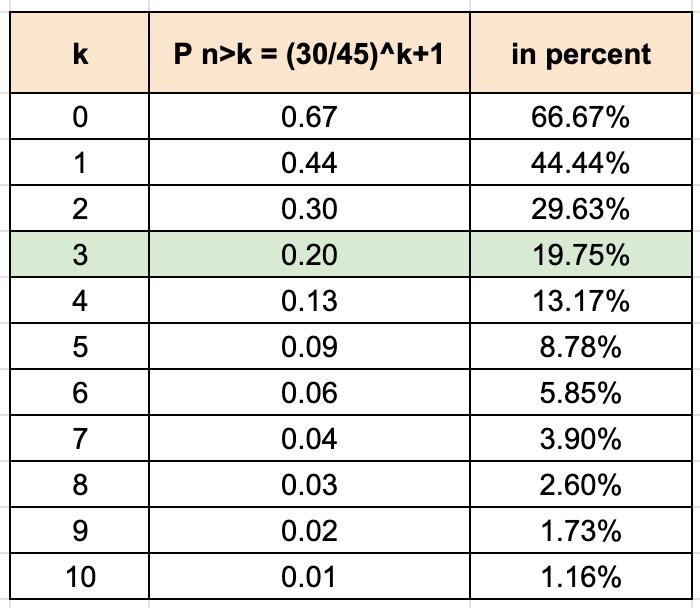
Impliesthatthereisa 19.75%chancethatmore than3customersarein thesystem
Wesawthattheprobabilityof0customerwaitnginfrontis66%,andprobability3customerwaitinqueuesystemis19.75%
Afterwecalculatethecurrentsituation,weneedtoknowaboutwaitinganalysissaferweadd1newchef,thedifferencein servicerate=70ordersperhour(increase55%)
AssumptionNewscenario(3chef)
Thearrivalrateofcustomersis30customersperhour.
Theservicerateofthekitchenis70ordersperhour.
Averagenumberofunitswaitinginthequeue
=0.32~0customers
Thenumberofcustomersinthesystemis30
Theaveragewaitingtimeforcustomersinsystem
=1customersinthesystemonaverage
Averagetimeaunitspendsinthesystem
= hour
Averagetimeaunitspendswaitinginthequeue
waitingtimeinthesystem =
=1.5minutesaverage waitingtimeinsystem
=0.64minutesaverage waitingtime
Utilizationfactorforthesystem
30/70=43%thekitchenarebusy
Probabilityof0unitsinthesystem
=0.57probabilitythereare0customersin thesystem
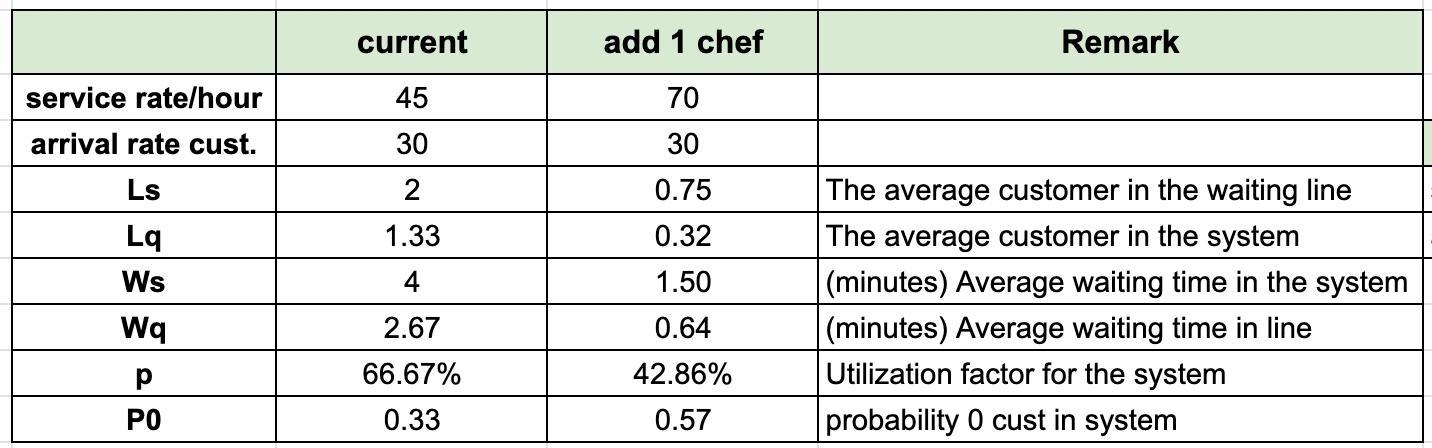
Thisisthetablesummaryofcomparisonbetweencurrentvsadd1chef.Ifweadd1chef,there’spositiveimpactthat
Averagewaitingtimeinsystemdecreased(from4minutesto1.5min)->sothatthecustomercanimmediatelygetafood.
Theaveragecustomerinwaitinglineisdecreasedfrom2to1costomer,thisispositiveimpactsotheCustomersaremore likelytobesatisfiedwiththeirexperienceandKFC'sbrandimagewouldbeenhancedasabusinessthatisknownforhaving shortwaittimes.
Probabilityofmorethan0unitsinthesystem,wherenisthe numberofunitsinthesystem
To improve the efficiency of the kitchen and reduce the waiting time for customers, Here are the things they can do :
Changing thewaythatfoodordersareprepared,suchaspreparingKombopackage(Chicken,rice,drink)inadvance becauseitisfavoritemenu
Implementingaqueuingsystemthatgivesprioritytocustomerswhohaveorderedmorecomplexortime-consumingmenus
Theimpactofadd1newchef:Averagewaitingtimeinsystemdecreased(4minutesto1.5min),averagecustomerinwaitingline isdecreasedfrom2to1cust.
In1day(8hours),KFCcanreduce487minutesofcustomerwaitingtimeinlineperday
Customers are satisfied with their experience if they don't have to wait a long time in line.
Customers who are satisfied with their experience are more likely to return and make repeat purchases
Employees are more likely to be happy and productive if they are not constantly rushed and stressed
Business that is known for having short wait times.
KFC'sComboPackagemenuis expectedtoincrease significantlyoverthenextthree years(YoYincrease10%),the impacttoconsiderare:
Capacitymanagementto meetdemand
Bottleneckinthekitchen processanalysis
Waitingtimeimpactto accomodatedemand
Themanagementhasoptionto hirenewcheforbuynewfryer tofulfillthedemand.
Wedeterminetheprocessofkitchenfor making1Combopackagechicken.
Afterweknowthedemandof ComboPacakgewillincrease, First,wemakeflowchartandstepof activitiesfromordercamein-fryingthe chicken-packaging-orderclose
then,weanalysisthesales growthfornext3years (increased10%YoY)
KFCinyear2&3willgoingto beovercapacity(106%and 122%utilizationrate)
Totackletheissue,thereare3 strategiestoconsider:Add newchef,buynewfryer,and addnewcashier.
Then,Wecalculatethedecision treetoknowthehighestvalue ofeachoption
Theconclusionis:Addinga chefisisthehighestexpected value,withanexpectedvalue of$356,000.Thisofthethree optionsthatleadtobestoption forfuture.
Thetotalprocess1stbatchrequired33.5 minutes
Throughput=348KomboPackage/8 hour~10.440pcs/month
Thevalue=$26.100/month
There’sbottleneckprocessfromtake chickenfromrefrigeratortoputintothe fryer.Tobalancetheprocess,weneedto add1chefandadd1fryer,thetotal capacity/daywillincrease100%
TheBEPforadd1newchef6.667unitsper year.add1newfryer=BEP3.333unitsper year(Addchefismoreexpensive,butthe demandwillincreaseduetoproductivity increase)
Wechoosetoaddnewcheftobalancing theprocess,Reducethecustomertime, improvequalityoffood
ThroughprocessanalysisatKFC, we 'vedeterminedthattheaddition of1chefeffectivelybalancesthe production.Then,Weanalyze waitinglineofcurrentsituationvs newscenario(+1chef)intermsof customerwaitingtimesandorder processingattherestaurant.
Theimpactofadd1newchef: Averagewaitingtimeinsystem decreased(4minutesto1.5min), averagecustomerinwaitinglineis decreasedfrom2to1cust.
In1day(8hours),KFCcanreduce 487minutesofcustomerwaiting timeinlineperday thisispositiveimpactsothe
Customersaremorelikelytobe satisfiedwiththeirexperienceand KFC'sbrandimagewouldbe enhancedasabusinessthatis knownforhavingshortwaittimes.