
Economy GREEN journal ISSUE 58 | 2023 COMMERCIAL AND INDUSTRIAL 20 BLOCKED SUPPLY CHAINS 24 INFRASTRUCTURE DEVELOPMENT PART 2 42
The highs & lows of HYDROGEN


Say Hello to world-leading self-charging innovation. Say hello to the all-new Toyota Hybrid range. With two power sources, the Toyota Hybrid System fuses an internal combustion engine’s h igh-speed p


As I write this note, commercial and industrial (C&I) energy customers around South Africa find themselves trapped between a dysfunctional utility and an industry hamstrung by rising equipment costs, a lack of competition as well as blocked supply chains.
After years of slow uptake of hybrid solar PV and battery projects and the rapid uptake of diesel gensets, C&I customers are rushing for solutions to stem the financial bloodshed resulting from hours per day of running those gensets.
EPCs are inundated with requests for rushed quotes while solar panels, batteries and certified inverters are in short supply with lead times ranging from two to six months.
At the same time, costs are rising. Between profit taking, rising interest rates, rising cost of forex, the price of equipment goes up almost weekly. Prices can even change between order and delivery, resulting in higher markups by EPCs.
Competitors are circling but barriers to entry are keeping them at bay. These include unfamiliar brands, fear of being first, local certification requirements and a lack of presence/support by suppliers in the country. Every electrician, builder and plumber is becoming an installer, with all range of experience levels, but closing the bigger deals remains challenging.
Net effect, the industry is stymied. For now. But the midterm outlook is extremely good for the broad uptake of solar PV/battery hybrid systems, and this is very positive for overall grid capacity and stability.
Onwards and upwards!
Regards,
Publisher

EDITOR: Alexis Knipe alexis@greeneconomy.media
CO-PUBLISHERS: Gordon Brown gordon@greeneconomy.media
Alexis Knipe alexis@greeneconomy.media
Danielle Solomons danielle@greeneconomy.media
LAYOUT AND DESIGN: CDC Design
OFFICE ADMINISTRATOR: Melanie Taylor
WEB, DIGITAL AND SOCIAL MEDIA: Steven Mokopane
SALES: Gerard Jeffcote
Glenda Kulp
Nadia Maritz
Tanya Duthie
Vania Reyneke
PRINTERS: FA Print
GENERAL ENQUIRIES: info@greeneconomy.media
ADVERTISING ENQUIRIES: alexis@greeneconomy.media
REG NUMBER: 2005/003854/07
VAT NUMBER: 4750243448
PUBLICATION DATE: June 2023
www.greeneconomy.media
Hydrogen demand is expected to grow globally from both incumbent markets as well as from new markets. This increase in hydrogen production and use is being driven by a growing desire to improve energy security and by decarbonisation efforts (page 14).
To achieve reliable and cost-efficient energy supply, commercial and industrial consumers are looking for alternative sources of energy for their operations. However, careful consideration of all the tariff components is necessary to determine the economic business case of small-scale embedded generation (page 20).
The renewable energy supply chain is under pressure, with massive consequences for project developers. Demand for equipment is surging for everything from wind turbines to solar PV modules and hydrogen electrolyzers – and the supply gaps are widening (page 24).
The rapid increase in EV sales during the pandemic has tested the resilience of battery supply chains and Russia’s war in Ukraine further exacerbated the challenge. Prices of raw materials such as cobalt, lithium and nickel have surged (page 32).
Enjoy this issue!
Alexis Knipe EditorTo access the full report in our Thought [ECO]nomy report boxes: Click on the READ REPORT wording or image in the box and you will gain access to the original report. Turn to the page numbers (example below) for key takeouts of the report.


According to Rudi Dicks, head of the project management office in the Presidency and member of the National Energy Crisis Committee (NECOM), government is considering reducing the term for Karpowership contracts as an “emergency measure”. Dicks says contracts of potentially five to 10 years would be preferable to the initial term of 20 years.
Despite being named as a preferred bidder in government’s RMIPPPP in 2021 to provide over 1 200MW of power at three of South African ports, Karpowership has drawn criticism over the cost of its 20-year contract along with its refusal of environmental authorisation for its three vessels at the Richards Bay, Ngqura and Saldanha Bay docks.


NECOM has taken the view that a shorter-term period would have to be looked at, potentially between five and 10 years.
By Andre van WykEskom’s financial losses and smothering debt levels are set to balloon, making it more difficult for the power utility to stem the tide of intensified blackouts across SA.

Eskom made a financial loss of R21.2-billion during 2022/3. Eskom had budgeted for a R13.6-billion loss. Gross debt securities and borrowings (or debt levels) increased to R439.1-billion in 2022/3 from R396.3-billion in 2021/2. The utility attributes the 11% increase in its debt levels to the impact of the weak rand.
A broken business model
Eskom’s net revenue grew to R259.2-billion in 2022/3, up from 2021/2’s R247.6-billion. The utility cannot generate enough revenue from its electricity tariffs approved by Nersa. In 2022, an increase of 9.61% was granted to Eskom, lower than the 20.5% it asked for. During 2022/3, Eskom spent R21.36-billion on diesel purchases (more than double 2021/2).
Municipalities owe billions
Total invoiced municipal arrear debt increased to R58.5-billion at year-end, up from 2021/2’s R44.8-billion. A total of 61 municipalities has arrears debt of over R100-million each.
Eskom’s sales volumes were 3.1% lower than budgeted and declined by 4.3% from 2021/2.
During 2022/3, Eskom received R21.9-billion in equity support from government. Government has committed to taking over R254billion of Eskom debt in the next three years.
Daily Maverick

Nersa has announced its approval for Eskom’s plan to purchase 344.5MW new generation capacity. Eskom can procure 75MW of new generation capacity from solar at Lethabo Power Station (Free State) and 19.5MW (solar) at Sere Wind Farm (Western Cape) as well as 100MW (solar) and a 150MW battery energy storage system at Komati Power Station in Mpumulanga.
The generation capacity must be procured by Eskom through tendering procedures that are fair and cost-effective. Nersa has approved the national free basic electricity rate of 172.76c/kWh for 2023/4, effective from July. Business Report
AIIM consortium reached financial close on 89MW Castle Wind Farm to supply renewable energy to Sibanye-Stillwater’s mining operations via an Eskom wheeling agreement. The consortium consists of African Infrastructure Investment Managers (AIIM), African Clean Energy Developments (ACED) and Reatile Renewables.
This milestone marks the effective date of the PPA and the commencement of construction. The energy will originate from Castle Wind Farm (Northern Cape) and will result in energy cost savings, increased energy security and decarbonisation benefits for Sibanye-Stillwater.
This transaction will be the second private wind power wheeling project in SA to have reached financial close. Rand Merchant Bank, a division of FirstRand Bank Limited, is the sole-mandated lead arranger for the project.

Delivered by President Ramaphosa
Progress has been made in implementing measures outlined in the Energy Action Plan. The private sector can invest in electricity generation projects of any size. More than 100 projects are at various stages of development, representing over 10 000MW of new generation capacity and over R200-billion investment. The exponential growth of private sector investment in electricity generation is proof that this reform is having a major impact.
The procurement of new capacity has been accelerated. Three projects from the risk mitigation programme have entered construction, with a further five projects expected to reach financial close during this quarter. Project agreements have been signed for 25 preferred bidders from Bid Window 5 and 6 amounting to approximately 2 800MW, of which 784MW is already in construction.
In the coming months, the procurement of more than 10 000MW of additional generation capacity will be initiated. Municipalities can procure power independently. Several municipalities have embarked on processes to procure additional power of up to 1 500MW.
Government is driving progress on the unbundling of Eskom into separate entities for generation, transmission and distribution. Significant progress has been made towards the establishment of the national transmission company as an independent subsidiary of Eskom.
Government is pursuing sweeping legislative reform and has introduced the Electricity Regulation Amendment Bill, which seeks to establish a competitive electricity market and support the unbundling of Eskom.

Another key piece of legislation, the Energy Security Bill, will
soon be introduced to streamline the regulatory framework and accelerate construction of renewable energy projects. Tax incentives have been introduced to support the rollout of rooftop solar for households.
Jobs must be protected in sectors of the economy that must decarbonise to remain competitive.
Where it may be necessary to delay the decommissioning coal-fired power stations temporarily to address electricity supply shortfall, any decision will be informed by a detailed technical assessment, the timeframe in which new generation capacity is expected and the impact on SA’s decarbonisation trajectory.
Trade, Industry and Competition recently announced the establishment of an energy resilience fund of R1.3-billion.

The value of projects currently in construction is over R300-billion, including energy, water infrastructure and rural roads projects.
The pipeline of green hydrogen projects with a value of over R300-billion is significant. Among these projects is the Boegoebaai Green Hydrogen (Northern Cape) with a potential to create thousands of jobs.
Two years ago, the Blue Drop and Green Drop water quality monitoring systems were administered to monitor SA’s water quality. This will enable stronger intervention in municipalities that fail to meet the minimum standards for water service delivery. Last year’s Green Drop report points to serious challenges in municipalities when it comes to managing water resources. The challenges in water provision highlight the broader challenge of dysfunctionality in many municipalities.
The Minister of Trade, Industry and Competition has published the Energy Users and Energy Suppliers Block Exemptions. These exemptions facilitate collaboration between companies to address electricity supply constraints, by allowing them to engage in activities normally prohibited under the Competition Act.
“These exemptions will enable energy suppliers and energy users to increase and optimise supply capacity, reduce the cost of energy or improve the efficiency of energy supply, and secure backup or alternative energy supply in order to minimise the effects of the current electricity supply constraints,” Minister Ebrahim Patel said.
“Reforms in the competition law effected in 2019 provides for more flexibility when circumstances warrant it. The block-exemptions have been used during the pandemic and in crises such as the July 2021 unrest, to enable competitors to cooperate to address shortages of stock or facilities. This will now also be available to companies to address the energy challenges,” he added.
If SA is to add the much-needed 5GW of new capacity to the grid each year, solutions are needed to optimise the existing transmission infrastructure capacity. The employment of multiple improved energy mechanisms is required, if another failed REIPPP bid window is to be avoided, says SAWEA.
“We have been engaged in efforts to tackle the issues regarding access to the grid and the unlocking of grid capacity since early 2022, whilst urging key stakeholders to prioritise the transmission build. However, more than a year later, having reviewed the 2022/3 Grid Connection Capacity Assessment (GCCA) report, our industry is faced with the reality that the areas of highest wind resource potential in the country are either already depleted or close to being depleted in terms of available grid capacity – a sobering reality that was already known before the last public procurement bidding round,” says Niveshen Govender, Chief Executive Officer of SAWEA.
“Following the Bid Window 6 upset, when not a single wind project advanced to preferred-bidder status, owing to grid constraints in the Cape provinces, it has become increasingly important to understand the methods that were used to allocate the grid capacity ensuring fair and transparent processes, so that we can ensure access for both private and public procurement,” added Govender.
Renewable energy company, Scatec, was involved in a massive Quiver tree planting and re-planting operation at their Kenhardt site in the Northern Cape.


This started after they were awarded the project under the RMIPPPP. The site is currently under construction – and once it reaches completion will have a total solar capacity of 540MW, battery storage capacity of 225MW/1, 140MWh, and provide 150MW of dispatchable renewable power under a 20-year Power Purchase Agreement.
With Quiver trees being on the national flora red list, Scatec’s main objective was to execute an operation to preserve the Quiver trees on site – and ensure an increase of the plant species in the local habitat.
Scatec had a huge role to play to ensure that they preserve the branching succulent plants in the Kenhardt area.
The Quiver tree is known to grow slowly and is habitat specific – found in areas with extreme weather conditions. Climate change has not made things easier for Quiver trees, as they are struggling to grow as abundantly as they did in years gone by.
“Our Environmental license in the area gave us a very clear mandate to protect these trees while we work. Replanting these trees was never going to be an easy process. Scatec partnered with a specialist team that helped them navigate the process,” says Scatec’s sub-Saharan Africa executive VP Jan Fourie.
For every tree that was relocated, an additional ten Quiver Trees had to be planted. The Quiver tree was not an easy find. A nursery that stocked the special trees was in the Western Cape (where the Scatec team had to apply for a permit to transport the Quiver trees over the provincial border).
To date, the Quiver trees are growing into these beautiful and succulent trees. The pictures do not do them justice, you just must see them in real life. “When you are next in the Kenhardt area, be sure to drive by the Scatec site to witness the beauty and appreciate the effort that the team put into replanting the Quiver trees to conserve them,” says Fourie.
The grid allocation rules need to be finalised to provide clarity to the market and ensure further delays in allocating capacity to projects are reduced. Other short-term measures include the addition of the Battery Energy Storage Capacity Bid Window, that will add a capacity totalling 1 230MW in two bid windows this year; and the exploration of co-locating renewable technologies across wind and solar.
By pairing power plants, a single transmission connection point can be used more effectively, matching renewable energy generation profiles with energy demand. “Beyond the economics, international examples of energy planning demonstrate that co-location is a viable consideration if we are to optimise the grid. This is simply because wind production peaks in the late afternoon and continues throughout the night, which compliments solar production during the day, hence we can expect that developers will seriously consider this, especially as it offers feasible cost reductions that will benefit the country,” concluded Govender.
The Extended Producer Responsibility schemes have begun diverting waste from landfill sites. DFFE’s Recycling Enterprise Support Programme has supported 56 start-ups within the sector providing over R300-million in financial support, creating 1 558 jobs and diverting over 200 000 tons of waste from landfills.

DFFE intends to finalise the allocation of 15-year fishing rights to small-scale fishing communities in the Western Cape by October 2023. This will enable a further 3 500 declared traditional small-scale fishers to participate in the ocean’s economy.
SA’s mitigation and adaptation architecture is at an advanced stage. Cabinet has approved a framework to determine emissions allocation to industrial sectors for the 2023-2027 mandatory commitment period. DFFE is developing carbon budget regulations that will address the processing of mitigation plans to be submitted by industry. Besides assisting 44 district municipalities, DFFE is working with nine provinces, to review their existing climate change plans to align with the draft Climate Change Bill.
There is a project pipeline of 9 789MW for renewable energy applications [2 899MW: solar, 6 890MW: wind]. These include battery energy storage systems and associated transmission and distribution infrastructure. Decision-making timeframes have been reduced from 107 to 57 days.
Grid capacity is a national priority to solve. DFFE is considering delays in decommissioning aging coal-fired power stations.


With the European Union aiming to cut emissions in half by 2030, the industrial sector is facing a strong push to decarbonise. In this €350-billion market, there’s a wealth of value on the table.
BY KEARNEY CONSULTINGClimate change caused more than $170-billion in damages in 2021 alone. To avoid a full-scale climate catastrophe (and the associated costs), one of the biggest challenges is transitioning to a climate-neutral economy. The industrial sector has a central role to play in achieving this goal. Driven by intrinsic motivators
along with regulations societal pressure and market dynamics, industrial companies are pushing to decarbonise. In fact, their decarbonisation efforts – and the results across all emission scopes will be a prerequisite if they hope to stay competitive. In this article, we tell you how to stand out from the decarbonisation crowd.
When considering direct and indirect owned emissions (scope 1 and scope 2), the challenge is mostly an energy-related matter for many industrial companies. For others, decarbonisation affects the core product itself. Two examples:
Sugar industry. Most CO2 emissions are energy related. Natural gas is used in combined heat and power plants for sugar extraction, crystallisation and the drying of beet pulp. In addition to improving energy efficiency, decarbonisation opportunities include the trade-off of used natural gas with alternatives such as biogas or hydrogen and electrification through large-capacity heat pumps or electric boilers. Cement industry. CO2 emissions are rooted in the core product. About two-thirds of emissions in the production process are the result of the underlying calcination reaction. Up until now, alternative production technologies have hardly yielded many significant results; emission reductions have mostly been the result of operational improvements, such as higher plant utilisation. However, although the sector has been exploring innovative technologies, such as clinker substitutes.
This dichotomy has implications for the knowledge and resources that industrial companies can deploy for decarbonisation. Many companies acknowledge they have neither the knowledge nor the resources required to get – and keep – the ball rolling. And that’s fair. The decarbonisation challenge is complex and multifaceted. It ranges from creating the required internal data transparency and monitoring an array of regulatory developments, to the realisation of technical solutions over many years and carefully reporting the impact of decarbonisation efforts.
There is much to learn and a lot to do – so much so that companies will have to consider a “make versus buy” decision. On one hand, the companies for which decarbonisation is mostly an energy-related matter tend to tilt toward the “buy” side and investigate partnering. They actively look for external suppliers to support them in their decarbonisation journey, provided that the suppliers bring expertise that is not readily available in-house for less than it would cost to build those capabilities from scratch.
On the other hand, companies where CO2 emissions are rooted in the core product or where energy costs are a top driver for their total cost, such as a process industry, tend to tilt more toward the “make” side of the spectrum. For them, it makes sense to build significant decarbonisation capabilities in-house since it is more important to their business operation.
Of course, this “make versus buy” decision is not purely binary. Decarbonisation-related activities are plentiful. A “make versus buy” decision for each will result in an equilibrium that is probably in between the two extremes (see figure 1).
The decarbonisation services supply market is still in an emerging
state, but it is evolving quickly. Many players in adjacent markets, such as utilities, real estate managers and energy efficiency companies are figuring out whether – and how – they will target this market. At the same time, many innovative start-ups want to claim their slice of the pie by entering the market with innovative technology solutions.
In summary, industrial companies are calling for support in their decarbonisation journeys while the supply market for such support still boasts significant untapped value. Therefore, if you want a winning, profitable model in this attractive market, now is the time.

The decarbonisation journey is a multi-year undertaking that requires companies to be highly dynamic considering three trends:


• Continuous innovation pushes the available technical solutions.
• The company itself is also likely to change in terms of the site footprint, product portfolio and strategic priorities.
• Applicable regulations are rapidly evolving.
Moreover, this multi-year journey requires a plethora of specific capabilities, including a sustainability strategy, carbon accounting, technical solution implementation, investment financing, impact monitoring and verification, compliance management as well as
Decarbonisation is not transactional: it’s a long-term effort.Figure 1: Companies will need to decide whether to make or buy their decarbonisation solutions.
reporting. As mentioned, industrial companies often choose to partner with specialist suppliers on at least some of these specific decarbonisation capabilities.
Managing these partnerships and the associated interactions requires significant effort. While the large industrial companies often have experience in managing complex partnerships and projects, small and medium-size companies usually don’t. This implies a significant decarbonisation execution risk. To mitigate the execution risk, these companies look to simplify their interfaces with the decarbonisation service provider. Enter decarbonisation-as-a-service providers, which will offer a single interface to the decarbonisation services market.
From our work in this decarbonisation services space, we see three emerging business model archetypes (see figure 2):
• One Stop Shop. Providing all decarbonisation capabilities in an integrated way.
• Integrator. Blending supply market capabilities in a single interface to customers.
• Specialists. Offering spot capabilities with deep specialisation.

These are clear-cut archetypes. However, many companies will pivot, transition or expand into this space. Therefore, we expect to see more hybrid business models in the market. In such a model, a decarbonisation services company will opportunistically develop and perform some specialist capabilities while integrating others via subcontracting. This integration can happen either in a decarbonisation-as-a-service model or via a structured ecosystem of specialists. Regardless of the chosen service model, there are four common success factors:

• Nurturing long-term client relationships. Decarbonisation is not transactional: it’s a long-term effort. Suppliers that are willing to commit to the journey will prove more successful.

• Managing complex projects with multifarious stakeholders. Decarbonisation touches many aspects and relative functions at industrial companies, including commercial, operations, finance and legal.
• Knowledge and innovation. Decarbonisation is a field in full evolution. Suppliers must stay on top of new trends, regulation and technologies.
• Customer centricity. Decarbonisation is generally important but specifically different. Suppliers should seek positive network effects among their customer base, though always respect the specificity of their customers’ context.
Decarbonisation is generally important but specifically different.*Authors: Horst Dringenberg, Partner, Maria de Kleijn, Partner and Thomas Vyncke, Founder, CARBON2ZERO. The authors thank Maximilian Hermann, Thomas Peinsipp, Bernhard PribylKranewitter, Annika Schmitz and Leonhardt Viebach for their valuable contributions to this article. Figure 2. Three business model archetypes are emerging in the decarbonisation services market. Kearney Analysis Decarbonisation-as-a-service


While previous periods of hype for the hydrogen economy have waned, significant capital, both public and private, is now being spent on developing water electrolysis systems to produce green hydrogen.
BY IDTechExHydrogen demand is expected to grow globally from both incumbent markets (refining and ammonia production) as well as from new markets such as in methanol, green steel and transport applications. This increase in hydrogen production and use is being driven by a growing desire to improve energy security and by decarbonisation efforts. However, the hydrogen produced must itself be low carbon.
What is green hydrogen?

Green hydrogen refers to the splitting of water into hydrogen and oxygen via electrolysis in an electrolyzer. If renewable electricity is used to power the electrolyzer then the hydrogen produced is green hydrogen. Green hydrogen will have lower carbon emissions associated with it than the hydrogen being produced today, most of which comes from steam methane reformation or coal gasification.
Hydrogen offers a route to decarbonising hydrogen production, in turn various hard-to-abate sectors, such as steel manufacturing, methanol production and certain modes of transport such as heavy-duty vehicles, shipping or aviation. The primary end-uses for hydrogen are in refining activities and ammonia production. These are forecast to remain the key uses in the medium term.
Hydrogen offers a route to greater energy security by allowing local production, and a reduction in their use via their replacement of natural gas and coal for industries including steel, methanol, construction and chemicals production. This is topical given the volatility in natural gas prices and supply.

Green hydrogen accounted for <1% of total hydrogen production globally in 2022, highlighting the level that is needed in the electrolyzer and hydrogen markets.
There are three main types of electrolyzer technology that can be used to produce green hydrogen: alkaline (AEL), proton-exchangemembrane or polymer-electrolyte-membrane (PEM) and solid-oxide electrolyzers (SOEL).
Alkaline electrolyzers have long been used for industrial applications. They are characterised by their low-capital costs and long lifetimes. PEM electrolyzers are at an earlier stage of commercialisation but are set to gain market share. They are characterised by higher-power densities, output hydrogen pressures and faster response times than alkaline systems. This makes them better suited to utilising renewable power. SOELs are the youngest electrolyzer technology. Operating at elevated temperatures above 700°C, they offer higher system efficiencies but are expensive, can struggle with dynamic operation and improvements will be necessary. Nevertheless, their higher efficiencies can play a role in decreasing the levelised cost of the hydrogen while they also hold
promise for producing syngas through the combined electrolysis of H 2 O and CO 2

Key metrics for assessing the performance of an electrolyzer system include efficiency, capital cost, response time and dynamic range, hydrogen purity and pressure, lifetime and footprint. Ultimately, one of the most important parameters is likely to be levelised cost of hydrogen.

Manufacturing capacity is expected to increase significantly over the next five years as players look to capture a share of this growing market. The electrolyzer market is currently dominated by alkaline and PEM electrolyzer manufacturers with comparatively few companies commercialising solid oxide electrolyzers. However, the similarity between solid oxide electrolyzers and fuel cells could provide an entry point for fuel cell manufacturers into the hydrogen market. Certainly, growth in the electrolyzer market, across the three electrolyzer types, will be needed to meet ambitious national and regional targets for clean hydrogen production.


According to the International Renewable Energy Agency, countries need certain key pillars for clean hydrogen policy-making, as outlined below.
National strategy. Secure Research and Development (R&D) programmes to develop technology and knowledge base. Develop a vision document that guides industry efforts and a roadmap that highlights actions and priorities.
Policy priorities, governance systems and regulatory frameworks. Regulations are necessary in both origin and destination countries, and policy signals need to be clear. Industry and civil society to become more involved in policymaking. Ongoing incentives will be needed and may include subsidies. The introduction of standards for transportation and storage is necessary for trade to grow strongly.
Certification of Origin. Hydrogen molecules are identical; a certification system or guarantee of origin is needed.
The clean hydrogen market is poised for growth, driven by decarbonisation efforts and concerns around energy security. Several ambitious roadmaps are being set out by different governments.
BY IDTechExThe key challenge for green and electrolytic hydrogen is cost. Green hydrogen is more expensive than grey, black and blue hydrogen due to the relatively low cost of natural gas and low energy use for hydrogen production. Hydrogen’s long-term cost competitiveness is debatable. The high electricity consumption and cost limit the widespread adoption of green or electrolytic hydrogen. The water electrolyzer market is expected grow to over US$120-billion by 2033.
help strengthen the case for green hydrogen. However, this also highlights the need to utilise variable power sources, necessitating additional energy storage systems to smooth out the power supply or an electrolyzer system capable of operational flexibility.
Innovations in electrolyzer systems have a role to play. For example, new electrolyzer cell designs that separate gas directly in the cell could improve the dynamic operability of alkaline systems. Having an electrolyzer system capable and safe to operate at partial and variable loads will likely be key to the widespread success of green hydrogen.
Order the report GREEN HYDROGEN PRODUCTION | ELECTROLYZER MARKETS 2023-2033 | IDTechEx | [January 2023]

Estimates of green hydrogen costs under different electrolyzer capital and operational cost scenarios.

A reduction in the capital cost of electrolyzer systems will help to bring down the levelised cost of hydrogen. The industry expects capex to come down as manufacturing capacity increases and capabilities improve through greater levels of automation. The more efficient a system is, the lower the energy consumption. Solid oxide electrolyzers are the most efficient type and can be improved further if waste heat can be utilised. Other key performance metrics for electrolyzer systems include operating lifetime, output pressure and purity, current and power density, start-up times, dynamic range and minimum load levels.
The cost of electricity prices needs to drop. Further reductions in the levelised cost of energy for solar and onshore wind would
The Green Hydrogen Commercialisation Strategy builds on the strong foundation of the work undertaken by the Department of Science and Innovation with respect to its HySA programme and the publication of the Hydrogen Society Roadmap.
SA HYDROGEN STRATEGIC VISION.
Developing a globally competitive, inclusive and low-carbon economy by harnessing South Africa’s entrepreneurial spirit, industrial strength and natural endowments.
Export markets
• Secure long-term global market share and trade position.
• Strategically position SA as a preferred provider to key markets.
• Secure global market and national procurement programmes.
• Expedite an export pilot project.
• Progress international strategy.
• Introduce supportive policies and a regulatory framework that aids price parity to increase domestic demand.
• Support R&D, specifically on heavy-duty fuel cell vehicles.
• Show feasibility of hydrogen in hard-to-abate sectors.

• Secure strong inflow of FDI and outflow of hydrogen exports.
• Establish a regulatory and market framework.
• Define a key set of “catalytic” infrastructure projects.
• Define government role and financial investment.
• Expedite private sector investment.
Socio-economic development
• Contribute towards South Africa’s emission reduction goals.
• Focus on decarbonising industrial sectors.
• Ensure integration of renewable energy.
• Incorporate non-financial criteria in procurement processes.
• Develop skills development and job creation within sector.
Local industrial capability and participation
• Develop skills and achieve localised industrialisation.
• Invest and implement R&D programmes.
• Understand the potential for industrialisation.
• Create partnerships.
• Drive the identified skills action plan.
Consider the need and role of a Just Transition
• Analyse and plan for a Just Transition.
• Quantify the commercial and economic impact and sustainability of industrial sectors.
• Ensure appropriate skills development programmes.
GREEN HYDROGEN COMMERCIALISATION STRATEGY FOR SOUTH AFRICA | Final report | [November 2022]
Fuel cells could play a role in the future of power generation, enabling the transition from hydrocarbon fuels to zero-emission fuels. It could be foolish to expect that an imminent abundant supply of hydrogen will fulfil all demand soon, presenting an opportunity for the fuel agnostic, SOFC.
The fuel flexibility of solid oxide fuel cells (SOFC) offers a competitive advantage over the currently dominant proton exchange membrane fuel cell (PEMFC), which is limited to operating on hydrogen.

While PEMFCs can only run on hydrogen, SOFCs run on multiple fuels such as hydrogen, LNG, biogas, methanol, ammonia, e-fuels and more. Liquefied natural gas (LNG) is the most deployed fuel in many applications, but it is not a long-term low-carbon solution due to methane slip and energy-intensive cooling and re-gassing processes.
The utilisation of methane (CH4) produces both CO and CO 2, while using methanol removes the emission of CO. However, reduction in
emissions such as sulfur oxides, nitrous oxides and organics can still be achieved with respect to coal-fuelled plants. Several fuels exist in the zero/low carbon emission sector, including hydrogen, ammonia and e-fuels.

The key issue with hydrogen is its low volumetric energy density and storage temperatures of -263°C, which is intensive to reach and maintain. Ammonia does not need carbon capture but requires new bunker infrastructure and is highly toxic in a spillage.
Green ammonia is a derivative of green hydrogen, so an abundance of green hydrogen must exist first. A by-product of methane is carbon, meaning carbon capture is required for zero emissions, and this can be problematic due to added cost and complexity. Methane is the primary ingredient of LNG, the most deployed alternative fuel with decades of infrastructure.
Methane is also susceptible to methane slip (boil-off methane), a powerful greenhouse gas, while “e-methane” relies on carbon predominantly from industrial sources, which must ultimately be phased out.
Both ammonia and methane are widely transported by the sea today. In contrast, hydrogen is not. At the same time, the former is preferred over the latter due to the lack of emissions produced when using ammonia in a SOFC.
In a future centred around the hyped hydrogen economy, PEMFCs are expected to dominate the fuel cell market. However, SOFCs offer interesting opportunities: their fuel cell flexibility, namely the ability to operate on the fuel choices for both today and tomorrow, sees SOFCs being positioned as a technology to enable a transition in power production methods.

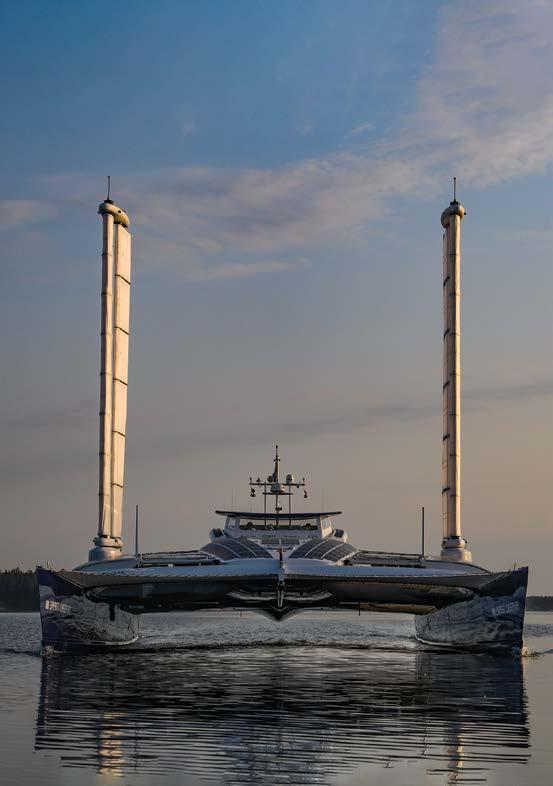
The Toyota fuel-cell-powered Energy Observer boat docks in Cape Town in June 2023. This state-of-the-art sustainability project demonstrates the adaptability of Toyota hydrogen fuelcell technology.

Former racing catamaran turned ship of the future, Energy Observer, has made waves on its seven-year odyssey around the world as the first energy-autonomous hydrogen vessel. Toyota, official partner of Energy Observer and an avid supporter of their project from the start, specially developed a fuel-cell system for the Energy Observer maritime application.
Energy Observer is an electrically propelled vessel of the future that is operated using a mix of renewable energies and an on-board system that produces carbon-free hydrogen from seawater. The operators of the vessel are on a mission to meet people in 50 countries and 101 ports during their voyage, with an aim to prove that a cleaner world is not only possible but that the innovations can open doors to new sustainable energy systems. Their activities also demonstrate and share potential solutions to champion an ecological and energy transition – a challenge facing South Africa in particular.
Toyota’s fuel-cell system, first introduced in the Toyota Mirai, the world’s first mass-produced hydrogen fuel-cell electric vehicle, proved its value as a propulsion system on the road. However, the company has more recently been exploring the use of its fuel cell in other applications such as buses and trucks.
Toyota as a company is aiming to develop a hydrogen society and to “establish a future society in harmony with nature,” as stated in its

The project successfully demonstrates the adaptability of the Toyota fuel-cell technology to a variety of applications.Energy Observer Productions I Antoine Drancey Energy Observer in Svalbard.
Length 31m
Width 13m
Weight 30 tons
Height 14,85m
Draft 2.2m
Crew members 5

Average speed 5/6 knots

The Energy Observer Foundation Exhibition village will be on display at Jetty 2 at the V&A Waterfront harbour from 12 to 18 June. Entrance is free and talks and videos about Energy Observer's Odyssey, the 17 Sustainable Development Goals (SDGs) and energy transition in South Africa will take place daily.
BEYOND ZERO:
Achieving zero and adding new value beyond it as part of efforts to pass our beautiful Home Planet to the next generation, Toyota has identified and is helping to solve issues faced by individuals and society, which Toyota calls “Achieving Zero”. Toyota is also looking “Beyond Zero” to create and provide greater value by continuing to seek ways to improve lives and society for the future.
For more information about Beyond Zero visit: https://global. toyota/en/mobility/beyond-zero/
Environmental Challenge 2050 – this aligned perfectly with Energy Observer’s mission and activities. From that common ground, the two have worked closely together on how a hydrogen fuel-cell system could be adapted to maritime applications.
The maritime-specific system was developed by Toyota Technical Center Europe in a mere seven months. It required a redesign of the Mirai’s system, followed by the build and installation of the compact fuel-cell module. The project successfully demonstrates the adaptability of the Toyota fuel-cell technology to a variety of applications outside of land-based vehicles.

“We are proud of the association with Toyota and its fuel-cell system, as used on our ocean passages and tested in the roughest conditions. After seven years and nearly 50 000 nautical miles of travelling, including three ocean crossings, the Energy Observer energy supply and storage system is now very reliable. We believe that the Toyota fuel-cell system is the perfect component for this, industrially produced, efficient and safe. Being an ambassador for the Sustainable Development Goals (SDGs), our mission is to promote clean energy solutions and we share with Toyota the same vision for a hydrogen society,” says Victorien Erussard, founder and captain of Energy Observer
The Toyota fuel-cell system has proven its benefits already for many years in the first-generation Mirai, and into the second generation zero-emissions vehicle revealed in South Africa earlier this year, but more recently other applications such as buses and trucks have been under development. Toyota believes that hydrogen is the catalyst for energy decarbonisation and such technology acceptance can accelerate modular fuel-cell solutions.
To achieve reliable and cost-efficient energy supply, commercial and industrial consumers are looking for alternative sources of energy for their operations. However, careful consideration of all the tariff components is necessary to determine the economic business case of small-scale embedded generation.
 REPORT BY CSIR AND RES4AFRICA*
The commercial and industrial (C&I) market provides a double opportunity for organisations by delivering them with costs savings, long-term price stability and security of energy supply, and allows for decarbonisation of their operations. The electricity consumption from the C&I market segment however has not grown at the same levels as other global markets due to unreliable supply, in fact it has slightly decreased since 2010.
Official numbers of C&I installations and the equivalent capacity is not available, however estimates have been pulled together from different sources – placing the market size at over 1.15GW as of 2020. Outside of developed countries, South Africa has the largest share of companies actively sourcing renewable energy.

Energy consumers either purchase electricity from Eskom or their municipality. Municipalities buy electricity directly from Eskom and redistribute it to end-users, adding their own distribution network
and retail costs as well as an allowable profit margin. There are currently 266 local municipalities in South Africa, but not all have distribution licenses.
Eskom C&I customers with a notified maximum demand (NMD) greater than 1MVA are typically on a time-of-use (TOU) tariff structure, namely the Megaflex tariff, while municipal licensees apply their own tariffs. All other customer segments who install small-scale embedded generation (SSEG) are required to move to a TOU structure.
C&I customers who have installed grid-tied generation are moved to the Megaflex-Gen tariff (>22 kVA connections). On the MegaflexGen tariff, any excess energy fed into the grid that is not wheeled to another Eskom customer is credited at the Gen-offset tariff. If energy is wheeled to another Eskom customer (the off-taker), then the offtaker is credited at the Gen-wheeling tariff. The Megaflex tariff varies according to transmission zone, network connection size, maximum instantaneous demand and time of use (hour and season).
Megaflex tariff components
• Fixed charges (R/month) to recover overhead costs and prices that vary with customer-base size. These charges are based on the sum of the monthly utilised capacity at each point of delivery (POD) and administration charges.


• Transmission, network and distribution demand charges (R/kW/month) to recover long-run marginal investments required to meet peak demand. These charges are based on the supply voltage, transmission zone and annual utilised capacity measured at the POD at all time periods. Excess network capacity charges are payable.
• Energy charges (R/kWh) recover variable costs to meet the customer load. These are TOU differentiated active energy charges including losses based on supply voltage and the transmission zone of the customer. There are three TOU periods namely peak, standard and off-peak.


• Ancillary service charges (c/kWh) based on the voltage of the supply applicable during all time periods.
• Reactive energy charges (c/kVArh) supplied more than 30% (0.96 power factor or less) of the kWh recorded during peak and standard periods. The excess reactive energy is determined per 30-minute integrating period and is accumulated for the month applicable during the high-demand season.
The Megaflex tariff incorporates three transparent cross-subsidies:
i. The affordability subsidy funded by Eskom’s direct industrial and business customers and is calculated using the end-user’s total active energy demand.
ii. The electrification and rural subsidy funded by Eskom’s direct industrial and business customers as well as municipalities and is calculated using the end-user’s total active energy demand.
iii. The urban low voltage subsidy funded by all Eskom’s customers on urban tariffs that take supply at 66kV or higher. This cost is based on the voltage of the supply and charged on the annual utilised capacity measured at the POD applicable during all time periods.
The actual revenue split between variable and fixed costs was determined in a cost-of-supply study (see figure 3) and demonstrates Eskom’s financial risk to declining energy volume sales. The average

Boosting the growth of the South African PPA market could alleviate pressure on Eskom to supply demand.Eskom and CSIR
cost structure depends on municipal size as determined by NERSA. The variable costs form 74% of municipal electricity budgets.

Figure 4 is an example of the energy costs for a large commercial office park (annual electricity demand ~30 GWh/annum) as well as an industrial customer (annual electricity demand ~1.3 TWh/annum), purchasing electricity directly from Eskom on the Megaflex tariff.

An example of average weekly demand profiles is shown in figure5. Over 85% of total annual electricity charges are inevitably from variable usage charges. Larger industrial customers have lower tariffs than commercial businesses. When customers install SSEG, municipal/ Eskom revenue is reduced due to lower sales volumes and potentially compensating the SSEG customers for excess electricity fed into the grid. A few municipalities have introduced SSEG tariffs based on cost-of-supply studies, or are in the process of doing so, to protect their revenues.


A comparison of the electricity costs for an industrial customer profile connected to two different municipalities, namely George and City of Tshwane, is shown in figure 6. The TOU tariffs for large industrial customers were used for both municipalities. The cost of electricity and tariff composition vary widely depending on the customer’s location.
and CSIR CSIR Analysis
Electricity charges at different locations for a large industrial customer [R-million/annum]

The business case for installing solar PV is reliant on the unbundled tariff the customer pays to Eskom or municipalities. For example, C&I customers on the Megaflex tariff that are connected to the Eskom distribution network pay TOU energy charges which vary between 0.78R/kWh and 1.05R/kWh during standard periods (overlapping most with the timing of solar PV generation). Although the LCOE of rooftop and utility-scale solar PV available to C&I customers is estimated to be between 0.5-1.0R/kWh, customers are also charged fixed-demand charges, which are not offset by solar.
The business case for installing solar PV is reliant on the unbundled tariff the customer pays to Eskom or municipalities.Large commercial office park Representative Load Duration Curve [MW] Large industrial customer Representative Load Duration Curve [MW] Figure 6. Comparison of annual electricity charges for an industrial customer from suppliers based in different locations. Notes: Industrial customer on Megaflex tariff in <300km transmission zone, voltage >66kV and 132kV. Eskom
The charges levied for wheeling follow NERSA guidelines. Eskom does not enter into long-term wheeling agreements at a fixed rate, so C&I customers are subject to changes in their and tariffs structures.
Wheeling charges are the costs of using the network and are also known as network use charges.
Eskom wheeling charges
These costs recover the transmission and distribution licensees’ regulated costs associated with retail, capital, operations, maintenance and return on assets. There are also charges related to the load and generator sides.
Some municipalities have entered into wheeling agreements and have tariffs in place such as the City of Cape Town, City of Tshwane and Nelson Mandela Bay Municipal Metro. For wheeling tariffs to be approved by NERSA, the municipalities/distributor licensees are required to conduct a core outcome set (COS) study to apportion “all costs required to service customers among each customer class in a fair and equitable manner”. In reality, not many municipalities have conducted these studies. Their tariffs are bundled and include grid system and energy costs.
According to the South African Wind Energy Association (SAWEA), wheeling charges differ significantly between City of Cape Town, Nelson Mandela Bay and City of Johannesburg (between 30-40c/kWh) while in Ekurhuleni and Tshwane, it falls between 15-20c/kWh.
Official data on installed capacity for the South African C&I market is unavailable as there is no comprehensive database of renewable energy projects outside utility scale. It is difficult to estimate the actual capacity from SSEG installations as NERSA only started registering systems in 2017.
Several sourcing models are available to those that want to invest in renewable generation for their operations, including power purchase agreements (PPAs), energy attributable certificates (EACs), corporate direct investments and utility green procurement programmes (UGPPs).
A PPA is a contract where a buyer or off-taker (energy utility, licensed power trader or business customer) purchases electricity and the related EACs from an IPP. The PPA defines the revenue and credit quality of the project. It contains legal and commercial obligations for the sale and purchase of power between the parties and sets out the required design and outputs for the power plant, O&M specifications and asset end of termination, if applicable. PPAs vary according to the electricity market structure and the needs of the buyer, seller and financing counterparties:
Physical on-site PPA is where an IPP sells electricity and associated attributes (EACs) directly to a buyer, agreeing on a fixed or discountto-market price. The electricity is instilled at place of consumption (on-site generation).
Sleeved PPA is when an IPP sells electricity and associated attributes to a buyer, agreeing on a fixed or discount-to-market price by means of an intermediary utility company. The intermediary handles the money and energy transfer to and from the IPP on the buyer’s behalf. The utility takes the energy directly from the renewable project and “sleeves” it to the buyer at its point of intake for a fee.
A virtual PPA contract does not include a physical supply of electricity. The developer sells electricity in the spot market, agreeing on a strike price with the off-taker (who receives the EACs) and the difference between the variable market and strike prices is settled. The payment flow is determined by the difference between the costs.
Sleeved and virtual PPAs are off-site generation.
In South Africa, NERSA requires the submission of PPAs between contracting parties as a supporting document to a generation license
application or for registration if the generation facility has been exempted. NERSA does not set standard PPAs for C&I customers; the corporate PPAs are drafted by the parties involved with only physical and sleeved PPAs allowed. Due to the lack of specific regulation for corporate clients, corporate PPAs are regulated by the same rules as normal PPAs. NERSA’s Regulatory Rules on Network Charges for Third Party Transportation of Energy regulation allows any load customer to go into bilateral arrangements with any third-party generator, enabling bilateral PPA with non-municipal and non-Eskom generators.
The corporate PPAs market in South Africa has reached about 16MW (2018), almost entirely covered by solar PV technologies. Boosting the growth of the South African PPA market could alleviate pressure on Eskom to supply demand, however, they require a high level of financial security compared to other sourcing models.

EACs represent a currency trading in the renewable market and allow consumers to make credible claims of renewable energy use.
Beyond the PPAs and EACs sourcing models, companies have their own potential to directly invest in self-generation through ownership and leasing. The market volume of the self-consumption model is steadily growing with more municipalities allowing embedded generators on their networks through the connection agreements for self-consumption by providing net metering schemes and favourable feed-in-tariffs.
UGPP is a tool allowing the buyer to purchase renewable energy through specific products or through tailored tariffs offered by certain utilities. However, South Africa does not have any UGPPs yet.
Although progress is being made in regulations that will allow for the development of the C&I market, the consensus is that the regulations have been insufficient to allow for growth. In addition, regulations around wheeling and bilateral PPA agreements remain unclear, and net-metering regulations have not gained traction, although some municipalities do allow it. C&I consumers are required to ensure that they meet the relevant grid code requirements to be able to connect their generation facilities to the distribution network.
* This article is an excerpt from the report COMMERCIAL AND INDUSTRIAL RENEWABLE ENERGY MARKET FOR SOUTH AFRICA | RES4Africa Foundation (RES4Africa) | Council for Scientific and Industrial Research (CSIR)

Larger industrial customers have lower tariffs than commercial businesses.
The renewable energy supply chain is under immense pressure, with massive consequences for project developers. The demand for equipment is surging for everything from wind turbines to solar PV modules and hydrogen electrolyzers – and the supply gaps are widening.
BY KEARNEY CONSULTING*The International Energy Agency predicts that global renewable capacity will increase by about 2 400GW (75%) between 2022 and 2027. By 2030, this increase should reach between 500GW and almost 1 200GW per year. For comparison, the entire global renewable capacity installed over the past decades stands at about 3 000GW. The picture looks starker for hydrogen: hundreds of gigawatts of electrolyzers are needed from today’s baseline of near-zero demand.

Commodity markets are pouring even more fuel on the fire. Driven by price spikes, oil and gas companies created almost $1-trillion in free cash flow in 2022. This windfall provides the capital needed to finance their own renewable ambitions, with some companies targeting more than 100GW buildouts by 2030. Finally, the US Inflation Reduction Act and Europe’s REPowerEU plan have set ambitious targets and provided hefty incentives, such as a tax credit of up to $3 per kilogram for low-carbon hydrogen, likely driving incremental capacity additions across low-carbon energy sources.
So, is supply keeping up? In some cases, the answer is no or only with significant disruption or changes to the market structure. The solar photovoltaic (PV) market is looking the best so far, with module production capacity outstripping demand by a factor of two. However, shortages along the supply chain in critical raw materials such as polysilicon are a risk, with available capacity only about 20%
above current demand – rendering the supply chain vulnerable to unexpected factory shutdowns, as in Xingjang.
For batteries, concerns also loom on the raw materials side, with forecasts estimating lithium shortages between 2024 and 2028. On the final product, it is estimated that production capacity will not meet supply in the short term, also driven by growing demand for electric vehicles. Some automakers are already reacting with vertical integration, a strategy that won’t be available to utilities.
The wind turbine supply chain is facing severe profitability troubles despite high demand. Further consolidation is probable, despite the already oligopolistic market structure with only five major western original equipment manufacturers (OEMs) remaining. In this environment, investing in extra capacity and innovation can be challenging. As a result, we are seeing price increases and rationing of production volumes. Access to some top-tier battery OEM production capacity requires minimum order sizes of 1GWh. Access to wind turbine blades now takes almost a year or longer. Electrolyzer manufacturers have put capacity expansions on hold due to the lack of final investment decisions (FIDs) with additional capacity taking at least 18 months to ramp up.
Technologies with long-established cost curves have reversed their decline. Li-ion battery packs cost 2% more in 2022 year-over-year, after 12 years of consecutive decline at a rate of -18%. The wind turbine prices of some manufacturers rose more than 30% from 2021 to 2022.
What will all this mean for renewable players, such as project developers? Without adapting your supply chain approach, it will be difficult to secure access to new technologies and volumes of renewable equipment on time and at cost. In this environment, the
procurement approach will need to be tailored to the supply-demand dynamics in the respective technologies and markets (see figure 1).

In wind energy, which is an already-concentrated industry, the balance of power will likely shift further toward the supply side, driven by additional OEM consolidation and more entrants fragmenting the demand side, such as oil and gas companies. Similarly in solar PV, additional concentration on the supply side is probable, while the already heavily-distributed demand will continue to fragment. The demand for ESG-conforming panels is surging in Europe, with the EU proposing a directive for corporate sustainability due diligence along value chains.

The dynamics are harder to assess for hydrogen electrolyzers, a more nascent industry. In the short term, a few OEMs have already committed to or executed capacity expansions. Therefore, they will likely make up a large share of the supply potential in the next three to five years, giving them some power to allocate scarce volumes to the highest bidder. The demand side also has some power thanks to early-mover benefits. Firm FID-backed order commitments or equity investments are valuable to OEMs, allowing them to scale production and potentially build a cost leadership position as they move down the cost curve faster than other OEMs. Flagship projects with publicly announced OEMs might also mobilise more customers. This demandside benefit could wane in the medium term.

Supply and demand dynamics provide a valuable indicator for

which supply chain strategy project developers should pursue. While demand power can be company-specific (think a multi-GW global utility versus a 100MW independent developer), an industry average view showcases the big picture. Offshore wind turbines and electrolyzers have high demand and supply power. Meanwhile, onshore wind and PV face the most adverse combination of market forces from a buyer’s perspective, where demand power is low and supply power is high.

The best way to navigate these market forces is highly dependent on the respective technology and the underlying strategic goals on the demand side as well as on the supply side (see figure 2).
• For PV modules, project developers put a clear focus on securing supply in the right quality and time and at competitive cost. In addition, ESG compliance, especially regarding forced labour, is paramount. The potential for additional value creation and project optimisation with suppliers is rather limited, and innovation is not as important as in other technologies. Consequently, pooling PV module demand into large bundles or a global framework agreement is a better strategy.
• In wind energy, a close collaboration with an OEM can unlock substantially higher value. OEMs can customise turbines and support those already in early-stage project development to maximise project value, enlarging the pie for both parties. In onshore wind, with its heterogenous and relatively small projects, a formal strategic partnership agreement is necessary to enable portfolio-wide collaboration of both parties. Here, the procurement approach can be customised by regions, such as by entering a strategic partnership in Europe but procuring project-by-project in the US. In offshore wind, the
sheer scale of projects allows utilities to get the most – and best – out of OEM competencies, often without formal partnership agreements. However, with the aforementioned market shifts, strategic partnerships may be about to become valuable and necessary also in offshore wind.

• Electrolyzers are a less-established technology in terms of supply chain strategy compared with PV and wind turbines. In procurement, the focus is a bit less on cost (as long as capex comes down as forecasted in the next few years) and more on the efficiency to require less renewable electricity. Simply gaining access to equipment volume is a key concern as well. Equity investments or technology partnerships are the go-tostrategy for electrolyzers.

• Conduct a thorough baselining to understand your cost, risk and procurement process for each of technology.

• Identify and align your strategic objectives – both from a procurement and a business perspective.
• Understand the supply market structure and trends, and define your value proposition to the supply market.
• Develop the right sourcing strategy to enable growth, create cost competitiveness and mitigate risks on the supply market.
STRATEGIC SOURCING


Asignificant drawback of relying solely on backup systems is the inefficiency of charging with alternating current (AC) grid power. Charging batteries using high voltage AC grid power results in power losses. These losses occur during the conversion process from AC to direct current (DC).
Solar PV modules charge the batteries directly, bypassing the need for converting AC grid power. This direct charging from solar energy eliminates the inefficiencies associated with grid charging, resulting in higher overall system efficiency.
Another drawback is the limited use of backup systems during non-loadshedding periods. When there is no loadshedding, the backup system remains idle, not actively contributing to reducing reliance on the grid or lowering electricity costs. This underutilisation of the system means that the investment made in the backup system does not provide continuous benefits. It is essential to explore solutions that maximise the utilisation of backup systems throughout the year.
By introducing solar PV panels into the system, you can begin to harness the sun’s energy to power your electrical appliances and extend the inverter battery’s lifespan for night-time or extended loadshedding periods. This reduces your dependence on the grid during loadshedding hours and ensures a more consistent power supply. There are also added bonuses of lower electricity bills and a more sustainable energy solution.
RESIDENTIAL SET-UP EXAMPLE
System consists of:
• 6 x 550W PV modules [R21 000]
• 250/100 Victron MPPT DC-DC charger [R16 000]
• Victron Multiplus-II 5kVA inverter/charger [R28 000]
• 1 x 5kWh lithium battery [R27 000]
The average baseload is around 500W, with a maximum draw of 4 000W on the output of the inverter. The daily energy consumption ranges from 12kWh to 15kWh, excluding the gas geyser.
From the six 550W modules, an average of 11kWh to 13kWh per day can be generated, depending on the time of year. Approximately 4kWh to 4.5 kWh is stored in the battery, while the remaining energy powers the electrical loads.
By shifting lifestyle habits to use high-power-consuming devices during daylight hours when solar energy is abundant, you can minimise grid dependency. While the return on investment may take around 10 years, it is important to note that the solar system serves not only as an investment but also provides loadshedding relief and convenience.
As South Africa continues to address its energy challenges, solar presents a viable option to ensure a more sustainable and resilient energy future.
When you are ready to embrace solar power and join the movement towards a more reliable energy landscape, ask your installer about sourcing solar panels from Menlo Electric South Africa, an official distributor of JA Solar, Jinko Solar, Tongwei and Longi solar panels. info.sa@menloelectric.com
storage solutions by Sungrow | Menlo Electric

Menlo Electric speaks to Sungrow expert Michal Klos about energy systems, inverters, PV modules and related topics. Get exclusive insights into the solar industry. Menlo Electric offers free training to its clients. Participants will learn how to use Menlo products, market trends market trends and meet leading experts in the space training is conducted by both Menlo experts and guests. On completion, a certificate is issued to verify participants' commitment to professional development.
Invest in energy-efficient appliances. To reduce overall energy demand and augment the effectiveness of your solar system.
Opt for LED lighting. Replace traditional bulbs with energy-efficient LED lights as they consume consume less energy and have a longer lifespan. Take advantage of time-of-use pricing. Schedule high-energy-consuming activities, such as laundry or dishwashing, during off-peak hours. Monitor and manage energy usage. Install an energy monitoring and management system to track and analyse your energy usage. This helps identify areas where energy consumption can be reduced and optimise the efficiency of your solar system.
It has become popular to rely on inverter-only backup systems in the face of loadshedding, however by adding solar to the system South Africans can save money.* Written by Arno Odendaal, technical sales, Menlo Electric South Africa.
Sodium-sulphur batteries (NAS® Batteries), produced by NGK Insulators Ltd., and distributed by BASF, with almost 5 GWh of installed capacity worldwide, is the perfect choice for large-capacity stationary energy storage.


A key characteristic of NAS® Batteries is the long discharge duration (+6 hours), which makes the technology ideal for daily cycling to convert intermittent power from renewable energy into stable on-demand electricity.
NAS® Battery is a containerised solution, with a design life of 7.300 equivalent cycles or 20 years, backed with an operations and maintenance contract, factory warranties, and performance guarantees.
Superior safety, function and performance are made possible by decades of data monitoring from multiple operational installations across the world. NAS® Battery track record is unmatched by any other manufacturer.
Provide for your energy needs from renewable energy coupled with a NAS® Battery.
Contact us right away for a complimentary pre-feasibility modelling exercise to find out how a NAS® Battery solution can address your energy challenges!
info@altum.energy
www.altum.energy
Battery energy storage powered by renewable energy is the future, and it is feasible in South Africa right now!
Gqeberha in the Eastern Cape will see construction starting on an exciting new solar energy plant later this year and SRK Consulting, South Africa is among the technical partners working to make this project a reality.
BY SRK CONSULTINGAccording to Brent Cock, principal engineering geologist at SRK’s Gqeberha office, the company has conducted a geotechnical investigation of the site where the 50MW photovoltaic plant will be located. The project is on a 100-hectare site on the western outskirts of Gqeberha between Bridgemeade and Greenbushes. An interpretive geotechnical report has been prepared and submitted to the co-developers, RAW Renewables and Natura Energy.

“In a project like this, it is important to test the subsurface geotechnical and geological conditions, including the suitability of on-site material for engineering layer works,” says Cock. “We were also asked to investigate the excavatability of the site, as well as groundwater and seepage conditions.” The study checked for any problematic soils and looked at foundation conditions to make appropriate recommendations for the project’s design and construction.

“We excavated 24 test pits across the site with a 30-ton tracked excavator, to depths ranging from 0.9 metres (m) to 3.9m below current ground level – so that we could expose and analyse the ground profile,” he says. “We also undertook dynamic probe super heavy (DPSH) tests to assess the in-situ consistency, which showed refusal occurring at depths of 1m to 2.4m.”
Wenner vertical electric sounding (VES) tests were conducted at 17 locations, with two perpendicular soundings at each of the selected positions sharing the same centre position. “Samples of disturbed soil were collected from representative soil horizons and tested by an SRK-approved soil testing laboratory. This gives us insight into aspects such as the particle size distribution, including clay content where it occurs, as well as moisture content, thermal resistivity and aggressiveness towards buried concrete and steel,” Cock explains.
The presence of ferruginisation in the terrace gravels – where the gravel particles have either been stained/coated, zones within the layer indurated (hardened) by iron oxide or a combination of both –indicates that there are sections of the site where water perched on the underlying bedrock in the past. A 2:1 paste of soil and distilled

water was tested according to the Basson Method to determine whether the ground is aggressive towards buried concrete and corrosive towards steel,” he says.

Attention was paid to the presence of reworked residual clayey silt, residual shale and shale bedrock as these are not considered suitable construction material. “Disturbing these horizons is not recommended as recompacting the material is difficult, particularly if wet,” Cock adds.
The site was deemed to be underlain by competent founding material, typically medium-dense sand and gravel with occasional very stiff clayey silt. “Both piled and concrete plinth foundations will be suitable for the support of the PV panels.” He added that where materials of variable consistency are present on a site, it is often economical to pre-drill percussion holes to the required depth – to provide both bearing and uplift – and then backfill the holes with suitable soil, after which piles can be driven into them.

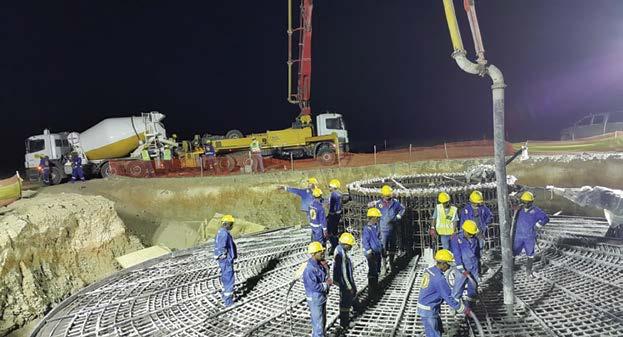
Non-linear finite element analysis can save up to 30% in steel reinforcement costs for concrete structures in wind turbine foundations. Sourcing materials for a remote location is logistically complex, adding significantly to the total project cost.
BY ZUTARIWhile non-linear finite element analysis (NL-FEA) is not intended as a mainstream design solution, it is ideal for once-off structures like wind turbine foundations. Given the large number of renewable energy projects South Africa plans to have running within the next couple of years, optimising these at the design stage will fast-track the rollout and reduce costs.
A standard foundation contains about 120kg of reinforcement per cubic metre of concrete, equating to about R1.5-million of reinforcement per foundation. Using NL-FEA design to reduce the reinforcement per foundation by up to 30% for a wind farm of 30 wind turbines equates to a staggering R13.5-million saving, plus a significant reduction in the carbon footprint.

“We are trying to be more accurate in looking at prestressed or reinforced concrete structures to reduce the project risk. The result is considerable savings for both client and contractor,” says Professor Pierre van der Spuy, associate, Zutari.
Conventional finite element analysis (FEA) packages operate in the linear-elastic regime of concrete and other materials. On the other hand, NL-FEA develops accurate material models for concrete that consider softening post-yield until ultimate failure occurs.
“Rather than being conservative in our approach towards concrete structures, we aim to be more accurate,” highlights Prof van der Spuy. Concrete is a non-linear material that resists tension but endures compression. Therefore, capturing its true behaviour as a material is difficult with conventional FEA packages.
“By adopting NL-FEA instead, we can utilise the material’s true properties in a way that cannot be done otherwise in a linear method or through hand calculations, both methods that err on the side of caution,” says the professor.
NL-FEA dives into the heart of concrete, presenting opportunities in other areas like forensics. “Fortunately, concrete structures do not collapse that often. In such situations, we can look at the behaviour of a specific part of a structure and achieve much more accurate results
than with standard methodologies,” he adds.
It is even possible to apply NL-FEA to other concrete-intensive infrastructures such as dam walls, which typically have heat problems as the concrete hydrates. “The software even allows us to model cooling pipes in concrete.” Regarding wind turbine foundations, NL-FEA design can be used to tweak the geometry so that any heat build-up is dissipated toward the edges.
“It is a bit more effort from the design perspective, but the benefit is so vast from a construction perspective that additional design costs are easily offset.” Zutari is not reinventing the wheel, as a European company is already using the method for wind turbine foundation design. “We are bringing this methodology to the local market as an affordable design option with significant benefits.”
Concrete is a non-linear material that resists tension but endures compression.Second base pour at Excelsior wind farm. Arc Innovations working on a base at Perdekraal Wind Farm. Khobab Wind Farm. Arc Innovations Arc Innovations
South Africa’s renewable energy market continues to evolve while growing significantly, demonstrating that the industry is maturing. We are witnessing the liberalisation of the energy market moving towards a sustainable wind sector, says SAWEA.
 BY SAWEA*
The renewable energy industry has witnessed significant changes this last year, resulting in the market’s transition from being one with a single offtaker (Eskom) to an open model, brought about by the removal of the licencing requirement for generation plants over 100MW as liberalisation mechanisms promulgated into law by the Department of Mineral Resources and Energy (DMRE). With more renewable-energy projects being introduced through this intervention, it will significantly contribute to the reduction of carbon emissions in line with our Nationally Determined Commitments.
“There is a clear indication of a changing energy landscape through policy interventions that promote a green pathway to energy security, which have come about because of our country’s need for energy security and commitment to decarbonise. The private off-taker market model is very different to the public programme and together, these two structures will allow for the procurement of new capacity to meet the needs of the country, and to facilitate the implementation of the targeted energy mix,” says Niveshen Govender, SAWEA CEO.
This shift offers flexibility and allows for private entities to accelerate the reduction of their carbon footprint, further attracting new investors to renewable energy. The structure of Power Purchase Agreements (PPAs) for the private offtake market will be viewed
differently to the conventional Renewable Energy Independent Power Producer Procurement Programme (REIPPPP) PPA structure.
“Tariffs in the private PPA market will be determined by bilateral negotiations between willing buyers and willing sellers, creating an open-market mechanism that will lead to IPPs approaching commercialisation differently,” adds Govender. “While there is an argument for the standardisation of PPAs, the allocation of risk is a concern and will be approached differently, depending on the project conditions. Contributing factors to future tariffs could include inflation, the cost of logistics and shipping, global changes to raw material and production costs amongst others. This may lead to an unintended imbalanced market shift between established and new IPPs competing on scale and price.”
To date, the country has procured 3 442MW of wind energy plants through the established public procurement programme, with a further 984MW of wind energy projects having NERSA registrations for private procurement. There’s a potential pipeline of at least 4 000MW as bid in Bid Window 6 for public procurement and 15 000MW as indicated by the DMRE for private procurement. When considering South Africa’s long-term energy planning, both private and public markets are required to significantly increase the penetration of renewable energy towards a sustainable energy transition.


The rapid increase in EV sales during the pandemic has tested the resilience of battery supply chains and Russia’s war in Ukraine further exacerbated the challenge. Prices of raw materials such as cobalt, lithium and nickel have surged.
BY INTERNATIONAL ENERGY AGENCY*Unprecedented battery demand and a lack of structural investment in new supply capacity are key factors. Russia’s invasion of Ukraine created pressures because Russia supplies 20% of global high purity nickel. Average battery prices fell by 6% to USD132 per kilowatt-hour in 2021, a slower decline than the 13% drop the previous year. Given the current oil price environment the relative competitiveness of EVs remains unaffected.
Today’s battery supply chains are concentrated around China, which produces three-quarters of all lithium-ion batteries and is home to 70% of production capacity for cathodes and 85% of production capacity for anodes (both are key components of batteries). Over half of lithium, cobalt and graphite processing and refining capacity is in China.
Europe is responsible for over one-quarter of global EV production, but it is home to very little of the supply chain apart from cobalt processing at 20%. The US has an even smaller role in the global EV battery supply chain with only 10% of EV production and 7% of battery production capacity.

Both Korea and Japan have considerable shares of the supply chain downstream of raw material processing, particularly in the highly technical cathode and anode material production. Korea is responsible for 15% of cathode material production capacity, while Japan accounts for 14% of cathode and 11% of anode material production. Korean and Japanese companies are also involved in the production of other battery components such as separators.
Mining generally takes place in resource-rich countries such as Australia, Chile and the Democratic Republic of Congo, and is handled by a few major companies. Governments in Europe and the US have
bold public sector initiatives to develop domestic battery supply chains, but most of the supply chain is likely to remain Chinese through 2030. For example, 70% of battery production capacity announced for the period to 2030 is in China.
Additional investments are needed in the short term, particularly in mining, where lead times are much longer than for other parts of the supply chain.
since 2020 because of high mineral prices and technology innovation, primarily driven by an increasing uptake in China.
Innovation in new chemistries, such as manganese-rich cathodes or even sodium-ion, could further reduce the pressure on mining. Recycling can also reduce demand for minerals. Although the impact between now and 2030 is likely to be small, recycling’s contribution to moderating mineral demand is critical after 2030.
The supply of some minerals such as lithium would need to rise by up to one third by 2030 to match the demand for EV batteries. For example, demand for lithium – the commodity with the largest projected demand-supply gap – is projected to increase sixfold to 500 kilotonnes by 2030, requiring the equivalent of 50 new averagesized mines.
There are other variables affecting demand for minerals. If current high commodity prices endure, cathode chemistries could shift towards less mineral-intensive options. For example, the lithium iron phosphate chemistry does not require nickel nor cobalt but comes with a lower-energy density and is better suited for shorter- range EVs. Their share of global EV battery supply has more than doubled


Industry
Companies have taken various actions to secure their EV battery supply chains. EV automakers are investing heavily into the localisation of their supply chains. By offering them a nearby supply of lithiumion batteries (LiBs), local gigafactories will reduce firms’ dependency on foreign suppliers and the downside risks ingrained in global supply chains.
This is particularly evident in the midstream as of November 2021, there is a total of 145 EV battery factories that are either operating or undergoing construction across 28 markets. This includes 51 construction projects in Europe, totalling 1 230GWh, and 29 in North America at 488.2GWh.
These projects are key enablers in the localisation of EV battery supply chains. Localisation is occurring upstream with automakers and EV battery manufacturers employing various strategies to develop local supplies of CRMs near manufacturing sites.

Renewable energy should become a major pull-factor for EV battery manufacturers in the near term. Battery manufacturing is capital and energy-intensive process – it therefore behoves firms to produce in markets with abundant access to affordable renewable energy to secure funding (given the growing importance of ESG in investment decision-making) and to ensure the sustainability of EVs. Consequently, we the primary pull factor for EV battery manufacturers (outside of government support) will shift from labour cost/availability to renewable energy cost, availability and sustainability. This is because automakers, and their large commercial clients, have put in place their own sustainability strategies which will place increased pressure on their component suppliers to become more sustainable. This will include sourcing ethically produced materials, using renewable energy and reducing carbon footprints along their own supply chains.
Recycling presents several upside risks to the EV supply chain. By enabling automakers to re-use the CRMs in EV batteries, recycling offers an affordable, reliable and local supply of CRMs, which tapers automakers’ exposure to supply chain risks and reliance on the mining industry for regular supplies of expensive metals. Recycling is also an attractive process, particularly to governments and private sector firms, as by diverting LiBs away from landfills recycling contributes to an organisation’s sustainability efforts.


Let’s take a moment and reflect on the energy crisis in this country. We are hovering around stage 6 loadshedding at the time of writing this, and there are fears that it will get worse during winter.
BY REVOV*Simply put, we don’t have enough energy to power our faltering economy. That’s the one side of the coin. On the other side, we find ourselves in a world that is under increasing pressure to reduce carbon emissions. Make no mistake, our country will pay the price in terms of international trade unless we step up and honour our renewable energy obligations.
However, there is a third side to this coin – the rim. And the rim of this coin is not defined by either the pressure of supply or the pressure to avoid losing out on international trade. It is defined by the ethical responsibility of doing the right thing. We must start caring about the planet.
Around the world, and especially in this country, people are quick to dismiss the “green agenda”. Let’s take a moment to reflect on how this plays out in South Africa.
On a national level, we are being told that we don’t have the luxury to worry about renewables because there is an urgent energy crisis to fix. The solution, we are told, lies in ships burning gas off our coastline, and a re-investment in our notoriously unreliable and dirty coal power stations.
On a personal level, we hear that we don’t have the luxury to worry about the lowest carbon footprint energy backup solutions because we must keep the lights on as cost-effectively as possible. This inevitably leads to people using generators or battery systems made from inferior chemistry, or from the right chemistry but without much thought going into the carbon footprint of the battery.

Worrying about whether we will have a planet in a generation’s time is certainly not a luxury. It is the absolute crux of the point. This is the radical mindshift that’s required. It is time more South Africans stood up for the environment. If anyone needs to be reminded just how dire the situation is, do yourself a favour and visit the Human Impact Lab’s Climate clock. We have eight years left until the dominoes fall one by one.
Remember the chimney collapse at Kusile? To rush the unit back into operation by the end of this year, a host of environmental standards (such as removing dangerous chemicals from the byproduct) have been waived – all in the name of reducing loadshedding. Fair enough, but does the prospect of acid rain on innocent people in Mozambique not keep you awake at night? It should.
A common refrain in South Africa is that renewables cannot produce the amount of power we need. Renewables really can generate power – and large amounts to boot. Not only will it go a long way towards solving the energy crisis, but it will be clean and more reliable.
In one year, Vietnam’s ambitious and forward-looking rooftop solar programme added 9.3GW of electricity to the country’s energy supply. Today, because they did not invest fast enough in transmission infrastructure at the same time, they must put a lid on the sheer amount of power being generated. Don’t let anyone tell you renewables can’t produce enough electricity: regulations and an outdated mindset is what stops renewables from generating enough electricity.
We simply must do the right thing. Renewable energy, backed up with 2nd LiFe battery technology – with as close to a zero-carbon footprint as possible, and which fills a crucial spot in the circular economy as it solves what to do with replaced electric vehicles’ batteries instead of dumping them in landfills – ensures we have an almost endless supply of energy storage capacity waiting to be put to use.
It just takes bravery.

We must start caring about the planet.
It is the absolute crux of the point.
Cities around the world need systems and technologies to improve public transit ridership, improve city congestion, encourage rideshare systems and reduce dependence upon fossil fuel-powered vehicles especially for single riders. The move towards micromobility has become a hot topic.
Cities across the globe are on leveraging technology to increase sustainability and to transform their municipalities around improved transit flow. The benefits for residents of these smart cities will be better traffic flow as well as having practical options to get to destinations regardless of their ability to walk, bike or drive and much more. The by-products of doing this successfully is that city residents and users benefit from cleaner air and convenient options for moving themselves and their goods around. Improving the lives of citizens while simultaneously benefiting the municipality in reducing traffic congestion and vehicle emissions is the goal of the renewed focus on mobility in general and micromobility.
Globally, micromobility solutions are surging in popularity as owning a vehicle in many urban areas can be impractical, and relying on schedule-based public transportation is not always convenient. Between the cost of vehicle ownership, rising insurance costs and a lack of convenient parking, many residents are opting to not purchase a traditional car.
Notably, cities like Barcelona (Spain); Los Angeles, Oakland, San Francisco and New York City (USA); Paris (France) and many others have already experienced significant micromobility market growth or have performed important pilot projects.
It has become critical to explore what value this trend and these emerging modes of transport have for African cities. Africa is in dire need for modern infrastructure developments that reduce carbon emissions while boosting economic growth and job creation.
While the world is making strides in adopting the use of clean energy, the African transport sector still relies substantially on fossil fuels. And many African city governments, alongside state or provincial governments are tasked with collaborating to transform their burgeoning metropolises.
Micromobility is seen as a potential solution to moving people more efficiently around cities, an opportunity to match local transport modes to need and develop physical infrastructures that offer options for Africans to move around. Focusing on micromobility offers part of the solution to African transportation sector challenges as it is a narrative of change through innovation, associated with lower carbon footprint and energy efficiency. In the African context, there is still a search for how this focus on mobility can also contribute to addressing poverty, unemployment and inequality.
However, in the current absence of complete smart micromobility ecosystems and supportive policy, African cities show slow adoption of this new mode of transport which has already gained vast momentum in most global metropolises.
Whereas micromobility captures an array of lightweight vehicle types that generally have mass of less than 500kg, speed lower than 25km/h and are operated by one person, e-Micromobility vehicles specifically have motorised powertrains and are electric. These include standard bicycles, e-bikes, electric scooters, electric

skateboards, Segways, cargo bikes and electric pedal assisted (pedelec) bicycles.
e-Micromobility vehicles are powered by green energy and their batteries are charged by solar panels. Over the years, e-micromobility vehicles have seen major advancements which include fastcharging batteries with increased performance and decreasing cost. Innovations in mobile computing enable micromobility to be a shared mode of transport which can be booked using apps on connected smartphones.
This economy model is an incentive to bring about modal shift as it encourages people to move out of their private cars to use shared
micromobility services. Shared services also provide the opportunity for transit integration over the city.
Micromobility is aimed at serving short distance travel in cities where most car trips are less than 8km mainly in the last mile1. There is a necessity to disrupt high private vehicle use for short distance travel in cities as this causes congestion and contributes to high carbon emissions. Governments and local authorities can articulate system-wide benefits of micromobility such as efficiencies and emission-savings related to moving people around. There is the increased access to mobility as a public service in local areas and between regions of a city.
• Renting a micromobility vehicle is more cost-effective than purchasing and maintaining a full-sized vehicle. Driving for the development of micromobility in a city creates the legal environment for freeing up citizens’ revenue. Viewing mobility as a service is critical to bring affordability to moving people and their goods around in African cities. Mobility as a service through micromobility vehicles creates new jobs such as drivers, equipment suppliers, vehicle maintenance as well as repair and battery swapping businesses electrification of micromobility is developed to scale this greener mode of transport.
• Globally, the micromobility model has shown itself to be extremely sustainable, especially as e-scooters, the internet of things (IoT) and edge computing technologies evolve.


• A micromobility network is highly efficient when compared to other public transportation solutions. Once a network has been implemented, a city can reduce the burden on other types of public transit.
• In developed economies, convenience is represented as a micromobility device’s availability for rent on many city street corners, for example, rental bikes or scooters.
Micromobility provides the opportunity for transit integration and for transforming ailing and constrained transport networks as well as movement infrastructure in African cities. Repairing, reinvesting and building more robust transport networks and movement infrastructure in the last mile is where most African cities require support.
As an emerging focus of transport planning, e-micromobility can expand the view of mobility as a service and transforming African cities to be more responsive to prevailing challenges. This can be done with an ecosystem that makes operating e-micromobility vehicles economically viable through supportive legislation and policies developed in collaboration with the private sector.
The task falls in the mandate and ambit of city and local authorities alongside state or provincial governments. In most contexts, one organ of state cannot unlock the benefits of micromobility, e-micromobility and mobility as a service alone or in isolation. Thus, micromobility is a call to collaborate for the common goal of transforming nascent African municipalities and serving citizens with mobility options enabled by government and provided by the private and informal sectors.
Micromobility is a call to collaborate for the common goal of transforming burgeoning African metropolises.1 In supply chain management and transportation planning, the last mile is the last leg of a journey comprising the movement of people and goods from a transportation hub to a destination.
While other countries are leading the charge with electric vehicles and renewable energy, South Africa languishes in a power crisis and EVs on a mass scale seems like a pipe dream.
BY ANDILE SKOSANA, CITYCONSOLIDATOR.AFRICAThe revolution is coming and South Africa will have no choice but to keep up. The ideal is a country, and cities, that are built around sustainability and e-mobility, and, we would strongly argue, e-micromobility. But the question is how do we get there?
This is how the Rosebank e-Micromobility Pilot Project was born – a small public-private partnership that goes down to the most granular level. Fifteen electric delivery bikes working within the Rosebank Management District precinct, sharing the same solarpowered charging kiosk that doubles as a battery-swapping centre.
But why e-bikes, why e-micromobility? South Africa’s roads are built for cars and trucks. It would be no exaggeration to proclaim that they are unsafe for e-bikes. Despite the proliferation of delivery bikes in our suburbs. However, this is where we are, not where we want to be. It should not be that one 75kg person starts up a two-ton internal combustion vehicle to travel 3km to buy a litre of milk. Two-wheelers take up less space, they are more environmentally friendly, more manoeuvrable, more cost-effective and ultimately quicker because of their convenience. Most importantly, they are more inclusive in bringing more people into mobility generally. Introduced sustainably, an e-micromobility ecosystem will make for friendlier streets.
Delivery bikes present a solid anchor point from which to enter the e-micromobility discussion. Since Covid-19, e-commerce has skyrocketed and will grow by 40% through 2025. This is one of the only growing segments in the economy now, and yet there is policy silence around the use of delivery e-bikes in cities. Where should they park? What are the rules for training drivers? What are the set standards and regulations? None of these questions can be answered, yet these e-bikes are integral to our suburban and inner-city lives. There needs to be rigorous thinking and planning around influencing policy for the sector because we can shape the growth of the sector to deliver convenience to other parts of the city and even the townships. The pilot project talks directly to this glaring need. If we can build a
viable and safe e-micromobility ecosystem for delivery bikes, the next step is to add commuter and personal recreational mobility to the same ecosystem.


A project like this cannot exist without massive buy-in. The private sector-led project has the support of the Rosebank Management District, Transport Authority Gauteng, the City of Johannesburg represented by transport, development and planning, the JRA and the Smart Cities office. The Gauteng Department of Economic Development is interested in issuing riders from Alexandra. The private sector has been equally welcoming in the form of secondlife storage battery business REVOV, SeeSayDo, SolidGreen, Mzansi Aerospace Technologies as an accelerator, and Evo Motors will provide e-bikes and Green Riders e-bikes and training. The list of stakeholders grows daily.
The outcome will be an applied research case study that delves into metrics to do with every aspect of the ecosystem, as well as concept notes to influence policy. Gauging the performance of the pilot will generate insights into e-bike and rider performance, delivery metrics, carbon savings and much more. The concept notes will include submissions to support the Transport Authority Gauteng’s 2030 Smart Mobility strategy, a concept note on a green mobility credentials and universally-standard swappable battery ecosystems as well as precinct infrastructure and management protocols for e-micromobility.
e-Micromobility provides South Africa with an opportunity to catapult our cities into this new world, where they are not only more economically viable but also more inclusive of people’s needs. Building a world-class African city is the objective which will be achieved with a bottom-up approach that lays the foundation for scale, responsive policy and ultimately mass buy-in. This bottom-up approach might start small but will grow to make “rands and sense”, changing the face of our cities together.


Local Procurement
International Chemical Procurement
Local Logistics
Cross Border Logistics
End to End Logistics of Copper Concentrate through Africa

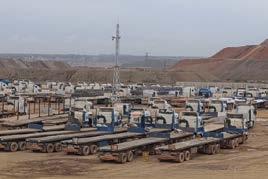


Sea Freight


We are a Zijin owned subsidiary, with multiple mining clients mainly in the Democratic Republic of the Congo.


Our company specialises in supplying mining equipment, steel, and consumables to our clients


We specialise in cross-border logistics throughout Africa


The South African water sector is facing all kinds of crises with an ill-equipped and sorely resourcedepleted government that seeks to correct over a decade’s inactions. While this phenomenon is not unique to the sector; without water security we have no hope of reviving the economy. So, let’s take stock of where we are and what our options are going forward.
OPINION PIECE BY BENOÎT LE ROY, SA WATER CHAMBER

• National Water and Sanitation Master Plan published in 2018.
• National water security framework for South Africa updated.
• Water Summit held in Pretoria, March 2022.
• National Infrastructure Plan (NIP) 2050 published in 2022.
• National Water Resource Strategy 4 draft for public comment published in 2022.
• Blue and Green Drop Reports published in 2022.
• Main themes out of the Master Plan such as non-revenue water, reuse and desalination have not yet been implemented in an overt and convincing manner at local government level as mandated by legislation.
• Pollution of our water resources given the 97% sewage plants not complying to Green Drop standards remain unchanged with no visible mitigation actions made by local government. Many court cases have been won by NGOs but there has been no impactful enforcement of the court orders owing to the lack of state capacity.
• Nelson Mandela Bay faces ongoing water shortages despite government interventions to support new water initiatives.
• eThekwini suffered devastating floods in 2022 leaving much of the metro’s water and sewage infrastructure damaged on account of its poor state and consequent vulnerability. The December holidaymakers failed to materialise because of ongoing beach pollution by illegal sewage discharges that, to this day, remain reportedly largely unchanged.
• Gauteng metros face weekly water disconnections owing to failing municipal water assets and Rand Water outages, all worsened by severe loadshedding.
One would easily surmise that the reality resembles a war zone depiction but no, it’s not Ukraine or Sudan but South Africa where society seems to take it on the chin and accept that failing government services are here to stay and the new normal. Most of the water-related problems we face have one root cause, failed economic policy at all levels of government exacerbated by severe governance failures resulting in reduced institutional capacity to rebuild South Africa’s water security.
South Africa has a rounded-off population of 60-million and is ranked as 25th in the world and fifth continentally by population size. We simply cannot be ignored with such a significant population and a relatively high GDP per capita on the continent. This means to me that
we must sort out the water security as one of the continent’s top five population and economic powers for the sake of all those around us that invariably depend on us.
Water security is a fundamental economic lubricator, and the rollout of the infrastructure upgrades and extensions are key developers of crucial skills and a significant job creator. The implementation of the Water and Sanitation Plan with a price tag of R900-billion in 2018 would generate at least R3.6-trillion in GDP triggering a multitude of skills, supply chain and technology opportunities.
Many of the water value chain inputs are now imported due to deindustrialisation and government in collaboration with the private sector seeks to reverse this terminal trend with the adoption of the Water and Sanitation Reindustrialisation Plan published in 2022. The SA Water Chamber was established to catalyse the required publicprivate collaboration to unlock these master plans and this principal, loosely termed Private Sector Participation (PSP) is embedded in all recent policies including the latest NIP 2050 phases one and two.
The chasm between national policy and local government implementation is so stark that the former has embarked on establishing the Water Partnership Office (WPO) in the Development Bank of Southern Africa and the National Water Infrastructure Agency within the Department of Water and Sanitation (DWS) to effectively replace the Trans Caledon Water Authority (TCWA) and the DWS construction entity.
These two initiatives are intended to provide project preparation funding and implementation solutions on a programmatic basis with the required skills in a semi-centralised supporting mechanism. These entities would initially focus on reducing non-revenue water, implementing reuse schemes and desalination plants along the coast as espoused in the Water and Sanitation Master Plan.
We are now five years down the track of the Master Plan timeline of 10 years, so we have a decade’s worth of infrastructure to roll out by 2028. This is an extraordinary opportunity for South Africa, so we need to start now!
Loadshedding is a daily problem for all South Africans. And when it comes to water security, it’s a complex issue with very little that municipalities can do to alleviate the stress – apart from alternative energy sources that are generally far too expensive, as they are not possible at utility scale in the towns. Metros in South Africa have

anything from 100 to 500 pump stations to provide water and evacuate sewage. Cities are designed to operate with 24/7 electricity supply feeding into these systems. Loadshedding is not a normal design input anywhere in the world.
The result is that all electrical demands are being fed from a single supply system, so loadshed the area and all consumers are switched off from houses to shops, government buildings, clinics, hospitals, police stations, schools as well as water and sewage pump stations. Cities generally have 24 to 48 hours water storage in reservoirs which are designed to be fed continuously by electrically driven pump stations to keep them at adequate levels for the required pressures in the system.
Periodic outages are catered for by the system’s embedded storage capacity, but ongoing outages result in systems unable to keep wet and they run dry. This leads to extraordinary damage when refilling the pipelines due to excessive water hammer, especially in the old vulnerable and dated systems in South Africa. Sewage systems only have around four hours of storage time as the maturation of the sewage can lead to odours as well as methane and hydrogen sulphide emissions that are potentially lethal.
So, we sit on an additional time bomb on our aging and collapsing water infrastructure that we are ill-equipped to mitigate. We must not only capacitate local government in implementing the Water and Sanitation Master Plan, but also do it without energy security that serves to complicate and delay matters that will be costing us all more. What an own goal.
It is very difficult to be positive about our country given the progressive collapse of our basic services such as water, electricity and logistics but “WE” have to mobilise a rather apathetic society to embrace their duties and each with their own capacity contribute to the inculcation of water security in our country. So, active citizenry is a powerful tool and is starting to mobilise in the water sector, but it has been unable to make any real dent in the rolling out of water security, yet. This landscape is a complex decentralised one that needs better governance, co-ordination and major PSP to unlock our water required water security.
In the next issue, I will uncover any major updates and share my views on:
• Municipal budgets in the South African metropolitians for water infrastructure
• Decentralised/package plant options
• Digitisation and digitalisation
• Desalination news

Loadshedding is not a normal design input anywhere in the world.
Water security is a fundamental economic lubricator.
As expressed in the think-piece published in Issue 57, infrastructure backlogs and failures remain high in many countries. Countless arguments have been made to explain this, with the most popular one being under-investment.
BY LLEWELLYN VAN WYK, B. ARCH; MSC (APPLIED), URBAN ANALYSTIn this think-piece, infrastructure condition reports are reviewed to assess whether there might be reasons other than those typically articulated – a systemic fault line perhaps – that might explain why infrastructure quality continues to lag despite investment.

Infrastructure diagnostic reviews collect comprehensive data on the infrastructure sectors of a country and provide a holistic analysis of the challenges they face. Most reports adopt a sectoral approach, usually including typical bulk infrastructure services like energy, water, sanitation, transport and waste. The reports covered include Australia, Canada, New Zealand, Singapore, South Africa, USA and the UK. The period covers 1998 to 2021. The reports consulted are listed in the references.
Other reports use a different narrative to the more conventional engineering approach, as in the Asian Development Bank (2005) that uses “stories” as a stock-taking basis. The narrative includes an economic story (levels of expenditure, stocks of infrastructure assets, access to infrastructure services and competitiveness); a spatial and demographic story (the demands on infrastructure of rapid urban growth, linking the rural poor to growth poles as well as the regional dimension of infrastructure supporting trade and spreading the benefits across borders); the environmental story (air quality, emissions, sanitation as well as the functioning of ecological goods and services); the political story (who captures the benefits of infrastructure, who provides, to
whom at what price and at whose cost); and lastly the funding story (the scale of infrastructure needs and how to resource them).
These are crucial questions and were used in this think-piece to frame a narrative around “systemic infrastructure gaps”. The emergence of the word “gap” surprised me: in all my research in this field the search had been predicated on identifying issues, but the more reading that was done the more the notion of gaps bedded in.

Based on an extensive reading of these reports, the following main findings emerged.
The core argument is that infrastructure is an essential part of an enabling environment for investment and livelihood thus promoting economic advancement, reducing poverty and improving delivery of health and other services (World Bank, 2014). Almost all reports argue that infrastructure is a “bedrock for development” (Mitullah, 2016)

and that it has granted to the Asian regions for example, “enviable record on growth and poverty reduction” (Asian Development Bank, 2005). What is not clear, however, is how much economic growth is needed to afford the increased capital investment in infrastructure and the associated ongoing long-term maintenance and operation costs?


Many claims are made of the role infrastructure plays in economic growth. What is not examined is the cost benefit, particularly who carries the cost (including maintenance) and who benefits. A good example here is the construction of new government buildings in Pretoria. I still do not understand why ministerial offices must look like presidential suites in a five-star hotel.
those land-use patterns are not accounted for. Often this results in expensive infrastructure retrofitting.
Difficult economic geography may also present a significant challenge for infrastructure development: striking the balance between urban and rural infrastructure design is particularly challenging, not least because the unit costs of delivering rural infrastructure is often higher than similar urban infrastructure (Asian Development Bank, 2005).
Despite investment, access to infrastructure services remains uneven. The Asian Development Bank (ADB) acknowledges that infrastructure plays a dual role: meeting the needs of the poor and providing the underpinnings for the region’s growth. The recognition of this dual role is fundamental to a proper understanding of sustainable infrastructure design. More critically, the ADB also notes that the “complexity of responding to these demands is greater than ever, and the cost of getting things wrong is very high. Poorly-conceived infrastructure investments today would have a huge environmental, economic and social impact – and be very costly to fix later” (Asian Development Bank, 2005).
In many countries infrastructure networks increasingly lag demand and are characterised by missing regional links and stagnant household access. In most African countries, universal access to household services is more than 50 years away (Sudeshna, 2008). More critically, even where infrastructure networks exist, Sudeshna (2008) notes that a significant percentage of households remain unconnected, suggesting that demand-side barriers persist and that universal access entails more than physical rollouts of networks. Not unexpectedly, access to infrastructure in rural areas is only a fraction of that in urban areas (Sudeshna 2008).
The point is made (Foster, 2010) that achieving universal access will call for greater attention to removing barriers that prevent the uptake of services and offering practical alternative solutions.


Understanding that infrastructure is a system of systems is key to future strategic planning. The development of infrastructure networks needs to be strategically informed by the spatial distribution of economic activities and by economies of agglomeration (Foster and Briceno-Garmendia, 2010). A challenging aspect in this regard is the infrastructure choices/land-use pattern nexus, especially where those land-use patterns are not well established and/or the expansion of
In this regard, Infrastructure Australia advocates adopting a placebased approach which creates a synergistic link between assets and networks of assets, local and context-specific characteristics and is beneficial to users of infrastructure services (Infrastructure Australia, 2021).
The Affordability Gap

Affordability gaps are reported across urban sectors, and these gaps tend most often to affect the poor who are often found in periurban, informal settlements. In developing economies infrastructure services may be twice as expensive in some countries, reflecting both diseconomies of scale in production and high-profit margins caused by lack of competition (Foster and Briceno-Garmendia, 2010).

The provision of basic services stays uneven: access to water and sanitation remains low in lowand middle-income countries. A reliable electricity supply remains the predominant infrastructure challenge, with many countries facing regular power shortages and many paying high premiums for emergency power.
In most cases the funding needs exceed the available revenues. The cost of addressing infrastructure needs is many billions of dollars a year, about one-third of which is for maintenance (Briceno-Garmendia, 2008). However, due to the large infrastructure spending backlog, the estimated spending needs contain a strong component of refurbishment and replacement. The challenge varies by country type – fragile states face an
High levels of investment do not necessarily translate into efficient investment.
Infrastructure impacts on ecosystems that are already stressed by climate change impacts.
Did you know that Section 12B of the Tax Act allows for the accelerated depreciation of your power generation capex resulting in a 27.5% saving on your project installation?

Blue Sky Energy works with leading light steel frame construction suppliers to offer a range of innovative solutions such as agrivoltaics and solar carports.
Have you considered putting your spare space to work? Whether you have low-value land or large parking spaces, bring them to life through solar PV installations that create energy and high-value spaces such as shade for parking or tunnels for agriculture.

Rooftop, solar carports, ground-mounted solar, and agri-voltaics represent the best value energy available to the energy customer in South Africa.


Blue Sky Energy are experts in the design, procurement and construction of such plants.
Battery energy storage installations provide access to solar energy daily during peak hours when the sun is not shining and enable users to bridge their primary energy needs through grid interruptions.
While the levelised cost of hybrid solar and battery storage installations is significantly greater than solar PV only, appropriately sized solutions can be commercially feasible.
Would you like to know if your property or business can achieve energy security at the same cost or less than what you are paying currently?

impossible burden and resource-rich countries lag in spite of their wealth. It is argued that infrastructure provides best outcomes when it is delivered within robust, well-regulated market structures and funded through an equitable balance of user and taxpayers’ revenues (Infrastructure Australia, 2016).

Infrastructure assets in many countries are nearing and/or are at their end of life. Ageing infrastructure networks are a simple consequence of when they were built. The inadequate maintenance of existing infrastructure exacerbates the dilapidation – and in some cases the destruction – of already overburdened infrastructure systems. The rehabilitation backlog reflects a legacy of under-funded maintenance, a major waste given that the cost of rehabilitation is several times higher than the cumulative cost of sound preventative maintenance (Foster and Bricendo-Garmendia, 2010).

There are two funding sources from which infrastructure can be funded: consumers (via user charges) and public sector (via taxpayers). A large share of infrastructure investment is domestically financed, with the central government budget being the main driver of infrastructure investment. Public investment is largely tax-financed and executed through central government budgets, whereas the operating and maintenance expenditure is largely financed from user charges and executed through state-owned entities or municipalities.
the private sector could provide funding, like ICT. Many countries are mostly spending only about two-thirds of the budget allocated to public investment in infrastructure. This means that public spending could increase by 30% without an increase in funding if institutional bottlenecks that inhibit capital budget execution could be overcome. Challenges include better planning of projects, earlier completion of feasibility studies, more efficient procurement processes as well as better project management and execution.
The ability of users to choose from a range of infrastructure services can be improved with new technologies, which can enable substantial improvements to user experiences and quality of life outcomes. This is especially true in rural areas, and for people from lower socio-economic and diverse backgrounds. However, local by-laws and building regulations can prohibit the implementation of alternative technologies and major public infrastructure delivery entities can prohibit local authorities from implementing alternative and competing infrastructure services to the detriment of users as has been the case recently in South Africa. A clear knowledge gap exists among infrastructure designers around using innovation and emerging technologies to find new solutions to old problems (Wilczek, 2015). I am reminded by Einstein’s comment “Insanity is doing the same thing over and over and expecting different results”.

Asian Development Arcadis. (2016). Global Infrastructure Investment Index. Arcadis.
Asian Development Bank. (2005). Connecting East Asia: A New Framework for Infrastructure. Tokyo: Asian Development Bank.
Briceno-Garmendia, C. S. (2008). Financing public infrastructure in Sub-Saharan Africa: Patterns, Issues, and Options. Washington: World Bank.
Foster, V. B.-G. (2010). Africa’s Infrastructure: A Time for Transformation. Washington: World Bank.
Rarely are user charges sufficient enough to cover the maintenance and operation of the service. The contribution level of consumers is impacted by the prevailing economic conditions. In a highinflation environment (like the global economy is now facing) the ability of consumers to pay for services becomes challenging of itself, let alone including a contribution to future development or meeting maintenance needs. Thus, many local authorities limit their budget increases to be equal to or below the current inflation rate, which then precludes asset maintenance or expansion. The lack of formal access to public infrastructure services and/or non-payment for those services becomes an expression of political dissatisfaction.
Global Infrastructure Hub. (2021). Singapore. Global Infrastructure Hub.

Infrastructure investment and climate action are urgently needed. With the right approach it’s possible to achieve both goals simultaneously. The planet’s climate crisis requires a resilient built environment to protect and support communities (Tomer, 2021). Infrastructure impacts on ecosystems that are already stressed by climate change impacts. Where infrastructure is built, and what resources are used for its construction and operation become key considerations to deal with both threats. Infrastructure choices play a critical role in addressing the contributory role of infrastructure to biodiversity loss and climate change. Achieving resilience requires a shift in focus from the resilience of assets themselves to the contribution of assets to the resilience of the system (Infrastructure Australia, 2021). Assets that do this include blue and green infrastructure and naturebased solutions.
Han, G. (2023, February 9). Govt spending may hit 20% of GDP by FY2030, GST hike and tax moves were needed to fund growing needs: MOF. The Straits Times.
Infrastructure Australia. (2016). Australia Infrastructure Plan. Infrastructure Australia.
Infrastructure Australia. (2019). An Assessment of Australia’s Future Infrastructure Needs. Infrastructure Australia.
Infrastructure Australia. (2021). A Pathway to Infrastructure Resilience. Infrastructure Australia.
Jay, S. J. (2007). Environmental Impact Assessment: Retrospect and Prospect. Environmental Impact Assessment Review. Elsevier. 27 (4), 289-300.

Lenzen, M. M. (2003). Environmental impact assessment including indirect effects - a case study using input-output analysis. Environmental Impact Assessment Review. Elsevier. 23(3), 263-282.
Mitullah, W. S. (2016). Building on progress: Infrastructure development still a major challenge in Africa. Nairobi: Afrobarometer.
Rathbone, M. A. (2021). Singapore ranks #1. Singapore: CMS.
The lack of long-term planning, coordination and cooperation between levels of government remains a severe constraint on infrastructure development. High levels of investment do not translate into efficient investment. Even if major potential efficiency gains are achieved, many countries would still face an infrastructure funding gap of billions of dollars a year, mainly in power.
Sudeshna, B. W. (2008). Access, Affordability, and Alternatives: Modern Infrastructure Services in Africa. Washington: World Bank.
Tomer, A. K. (2021). Rebuild with purpose. Brookings: Metropolitan Policy Program.
Wilczek, F. (2015, September 23). Einstein’s Parable of Quantum Insanity. Scientific America.
World Bank. (2014). Logistics performance index. Washington: World Bank.

World Data. (2023). Transport and infrastructure in Singapore. Washington: World Bank.
Briceno-Garmendia, Smits and Foster (2008) note that in some instances countries allocate more resources to some areas of infrastructure than seem to be warranted, often in areas where
In this regard, national, regional and local policymaking agendas and project level interventions have a critical role to play. Typical approaches in the past relied on environmental impact assessments (EIAs) with a view to minimising impacts through mitigation measures or environmental safeguards. However, EIAs are criticised for being used more as a decision-aiding tool rather than a decision-making tool (Jay, 2007) thereby limiting their influence on decisions. In practice, almost all EIAs address only direct and immediate on-site effects (Lenzen, 2003).


Throughout the many country infrastructure reports read for this think-piece, one country stood out – Singapore. Singapore has jumped up two places to claim the number one spot on the 2021 Infrastructure Index (Rathbone, 2021) and retained its position as the world’s most attractive market for the third edition of the Global Infrastructure Investment Index (Arcadis, 2016). This despite investing around 5% of its Gross Domestic Product (GDP) on infrastructure in 2015 and 1% in 2021 (Global Infrastructure Hub, 2021), a level many commentors would argue is insufficient. Singapore aims to spend 4.4% of GDP by FY2026 to FY2030 (Han, 2023). Yet, as shown in Table 1, its infrastructure quality rates at 95 and its infrastructure gap at 0.
Notes to Table
1. GDP per capita and population data as of 2021.
2. All other data as of 2019.
3. Infrastructure quality rating on a scale from 0 (worst) to 100 (best).
This begs the question: how can Singapore retain its leading position at this level of investment? Perhaps the answer is that it is a city state with an area of 719km² and a population density of 7 585 inhabitants per km² (World Data, 2023). If this is the case, the factors making a city state successful need to be identified and tested for replicability in other countries.
In starting this series of analyses I had in mind the opportunity of finding some systemic reason(s) for the poor state of infrastructure globally. The collective readings have however given rise to a) the notion of gaps and b) the success of infrastructure services in Singapore. I have long argued that the design of a city state may well be the key to a well-functioning and sustainable infrastructure sector, and there is now some evidence to support this hypothesis. In the next think-piece, I will explore this notion further.
ASCE 2021. A Comprehensive Assessment of America’s Infrastructure. Virginia: American Society of Civil Engineers.
ASCE 2013. 2013 US Report Card for America’s Infrastructure. Virginia: American Society of Civil Engineers.
Canada Infrastructure 2016. Informing the Future: Canadian Infrastructure Report Card 2016. Canadian Construction Association, Canadian Public Works Association, Canadian Society for Civiol Engineering, and the Federation of Canadian Municipalities.
CBI/AECOM 2016. Thinking Globally Delivering Locally: CBI/AECOM Infrastructure Survey 2016. United Kingdom: CBI. Coulibaly, B. (ed), 2019. Foresight Africa. Washington, Brookings Institution.
ISPI 2019. Infrastructure and Development: The Case of Infrastructure Asia. Italian Institute for International Political Studies.
ICE 2014. State of the Nation Infrastructure. Institution of Civil Engineers.
IPA 2017. Transforming Infrastructure Performance. United Kingdom: Infrastructure and Projects Authority.
Engineers Australia 2010. Australian Infrastructure Report Card 2010. Engineers Australia, November 2010.
Infrastructure Australia 2015. Australia Infrastructure Audit. Infrastructure Australia April 2015.
Infrastructure New Zealand 2020. Infrastructure Priorities for 2020-2023 Government. Infrastructure New Zealand, Auckland.
Lim, H. 2008. Infrastructure Development in Singapore. In Kumar, N. (ed.), International Infrastructure Development in East Asia – Towards Balanced Regional Development and Integration, ERIA Research Project Report 2007-2, Chiba: IDE_JETRO, pp.228-262.
Miller, J. (ed.), 2007. Infrastructure 2007: A Global Perspective. Urban Land Institute and Ernst & Young.
National Infrastructure Commission 2018. National Infrastructure Assessment. United Kingdom: National Infrastructure Commission.
New Zealand Government 2015. The Thirty Year New Zealand Infrastructure Plan. New Zealand Government: Wellington.
SAICE 2011. Infrastructure Report Card for South Africa. Halfway House: The South African Institution of Civil Engineering.
SAICE 2017. Infrastructure Report Card for South Africa. Halfway House: The South African Institution of Civil Engineering.
SAICE 2022. Infrastructure Report Card for South Africa. Halfway House: The South African Institution of Civil Engineering.


Materials informatics is the application of data-driven methods to the field of materials science and has wide-ranging benefits, but the ability to enhance the sustainability of materials could be the most impactful of these.


 BY IDTechEx*
Decarbonisation efforts are a growing driver for adopting these technologies and processes. This, alongside the fact that materials informatics helps organisations to save money while accelerating materials innovation, is a contributing factor to IDTechEx’s prediction that the market for the provision of external materials informatics services will grow at 13.7% CAGR to 2033.

Players from the AI industry are seeing materials informatics’ ability to contribute to solving the climate crisis. Meta AI (of Facebook parent Meta) and Carnegie Mellon University’s Open Catalyst Project aims to identify catalysts that aid the production of fuels using excess renewable energy. This project open sources the discovery process, making the results of 260-million density functional theory calculations publicly available for researchers to train their own surrogate models on.
Alongside the project’s initiators, universities, including Munich Technical University and other AI giants, including Tencent AI, have published results calculated from the dataset. Applications of “AI for good” in sustainability of this sort will likely become a major part of the ESG toolboxes of machine learning industry titans. These surrogate models could aid in decreasing the energy requirements to produce, for example, green hydrogen.
Solar photovoltaics (PV) are another fruitful area for materials informatics to make an impact. AI can facilitate many areas of PV development, including accelerated lifetime testing.


The materials industry itself is acting on the need for in-house data


Some key application areas for materials informatics and their potential sustainability impacts. Main image: Phytoplankton: regulators of atmospheric CO2, ocean acidification and global carbon cycle.

science expertise as its importance continues to grow, including in facilitating sustainable manufacturing. In February 2023, materials industry giant Toray Industries announced that it would be


opening a new research facility for just this purpose. The plan is to bring together materials scientists, chemical engineers and digital transformation professionals to drive nanotechnology advances using materials informatics and computational chemistry.

In this image of fluorides on an anode surface of a Li-ion battery, the growth of nearly perfect cubes is directly linked to the crystal system of the materials. ZEISS light and electron microscopes were used to assess the quality of Li-ion batteries. The demand for these energy suppliers and storage devices continues to increase, as do the requirements.

As natural resources become increasingly scarce and the demand grows for more portable, reliable, safe and sustainable forms of energy, scientists face new challenges in materials research. Solar cells, batteries, fuel cells and next-generation nuclear reactors – and the often highly heterogeneous materials they contain – present a paradigm shift in shaping the way energy is generated, stored and converted.

Multi-scale, multi-modal imaging and analysis approaches lead to a comprehensive understanding of the links between structure, chemistry and performance. This deep understanding paves the way towards designing novel materials and devices.
In lithium-ion batteries (LiBs), for example, material features spanning across many orders affect the battery’s ultimate performance: measuring the LiB’s geometric architecture, inspecting the package of intact LiBs, quantifying particles, voids and porosity as well as mapping the chemical composition and reactivity on a micro or nanometer scale.
Kerr microscopy allows for visualisation of magnetic domains in materials for new EV motors. For even higher magnifications, eg to characterise micro and nanometer scaled defects in battery electrode materials or when imaging sensitive material like graphite or polymers, an SEM with outstanding low-voltage performance provides robust information. Materials researchers profit from non-destructive inspection of the whole, intact battery when performing large-scale inspection in 3D or even 4D. Particle and void sizes or tortuosity inside of the battery can also be quantified with a high-resolution X-ray microscopy.
Players from across the AI industry are seeing materials informatics’ ability to contribute to solving the climate crisis.Professor Cobus Visagie’s microscopy image of fungi shows a new Talaromyces species found in South Africa, growing on oatmeal. Visagie is a mycologist, Forestry and Agricultural Biotechnology Institute at the University of Pretoria, working on the taxonomy of moulds from the natural and built environment.

USE-IT, a registered non-profit founded on the principle of a circular economy, creates jobs through waste recycling, reduction and diversion. Green Economy Journal caught up with them and learnt that one man’s trash is indeed another man’s treasure.

Please outline the organisation’s background and how it is fulfils its stated objective.
Located in Hammarsdale, the organisation is funded in part by the eThekwini Economic Development Unit (EDU). The priority of the EDU is job creation and while this aligns with USE-IT goals, it remains critical that relationships with other partners and funders are fostered to ensure the development and ongoing implementation of projects that align with the principles of the circular green economy.
Job creation and entrepreneurship through waste diversion and beneficiation have become the key priorities, and USE-IT leverages resources to build opportunities in the green economy.
How do you establish enterprise development for companies in South Africa?
As an NPO/NGO, USE-IT operates in a collaborative environment, forming partnerships with organisations with synergistic objectives as well as sharing knowledge and resources.
USE-IT would identify the opportunity or entrepreneur and help create a business that would utilise waste as a source of material within in their operation, either through beneficiation or upcycling or recycling. Once the product is developed and the business is established, we partner with Niya Consulting who are a multi-faceted organisation and business incubation that facilitates business strategies in the interest of growing the organisation. Niya provides clients, including start-ups and SMEs, with a platform to manage their processes effectively through best practice, staying abreast with ongoing changes in the sector landscape for sustainable future economies.
This is done through an incubation programme housed at the Hammarsdale Waste Beneficiation Site. Each of these projects fall under our incubation program, we provide the technical assistance, operational space and administrative support. The aim is to incubate the business until it is a financially viable venture where they can then apply for finance to expand their operations off site.
What are your current flagship projects?
We have the following incubation programme:
1. Owethu Umgele Sewing (funded through the Do More Foundation) who utilises waste textiles to make shopping bags, school backpacks and gym bags. Most of this material waste is derived from corporates through old banners and conference display materials. Once they are no longer of use to the corporates, the materials are donated to Owethu who use this waste to make new products.
2. Home Deco Tech is a woodworking project that uses waste wood as its materials to manufacture custom-made furniture. Home Deco Tech is also sponsored by CHEP to supply educational toys made from its waste wood that are then in turn sponsored to Early Childhood Development Centres.
3. KEY Bricks is an innovation that will manufacture an eco-block consisting of recycled materials such as glass and building rubble. This project will aim to create opportunities for local block manufacture close to the build site as the units are small-scale and easy to transport.
Where do you see the sector going within the upcoming five? How does USE-IT fit into this future?
This is a long conversation … loadshedding is having a severe impact on the industry. Please read Detrimental effects of rolling blackouts on SA’s plastics industry on GreenEconomy.Media
The impact is felt especially by the waste collectors, we have been working together with the informal waste sector to integrate them into the formal sector. They remain at the lowest end of the value chain yet are responsible for 80% of what ends up being recycled. We have been establishing networks of waste collectors and setting up buyback centres close to them so that they can trade.
An example of the benefits of this, previously a waste collector based in Hammarsdale would need to travel to Pinetown to sell their waste. That trip would cost R60. They could sell their waste for R140 (a full bulk bag of PET) and take home R80. By cutting out that cost of transport we have directly impacted the earning potential of that waste collector. It might seem like a small amount but it makes a huge difference in the lives of collectors.
To try and change the big picture is overwhelming, so we focus on where we can make small changes that will have big impact and improve the lives of the people we work with.
By working with an NPO like USE-IT, we lend credibility to our funders through robust reporting and financial accountability. Our track record has secured us funding for the past 10 years and we continue to provide impact for our funders.
We lend credibility to our funders through robust reporting and financial accountability.


According to estimates, global waste generation will reach 2.2-billion tons by 2025. Shockingly, high-income countries, which account for 16% of global population, produce 34% of the world’s waste. And, only 15% to 20% of waste generated globally is recycled.
BY SANLAM INVESTMENTS*One of the leading causes of waste pollution is inefficient production processes, product design and improper waste disposal practices, such as illegal dumping and ineffective waste collection services. Manufacturers need to understand and incorporate principles of circular economy in their design to ensure that their products maintain a level of value post use.
It is estimated that South Africa alone generates about 122-million tons of waste a year, 90% of which still goes to landfills. Waste products that end up in landfills become an environmental and social cost to society, with little accountability from manufactures. We should move towards the principle of cradle-to-cradle, where there is greater accountability for product manufacturers in the waste value chain.
Considering the impact of waste pollution on the environment, society and governance practices, what actions can investors take to mitigate these challenges?
At Sanlam Investments, our approach has recognised investing in waste management as a core part of our sustainability strategy. Investing in innovative technologies a crucial role in improving waste management. This could include investing in companies that are developing new materials, technologies or business models that support a circular economy and reduce waste.
To show Sanlam Investments’ commitment towards sustainable investments, SkipWaste recently became the private equity division’s fourth acquisition in the fund, following that of Cavalier Group, Absolute Pets and Q Link. SkipWaste has an integrated business model, spanning onsite waste management, primary storage, waste logistics, recycling and recovery as well as alternative disposal and conversion. With more than 1 000 clients and 3 000 sites primarily in Gauteng, SkipWaste is well-positioned to sustain its access to waste-at-source and the company’s ability to redirect more waste towards alternative forms of disposal.
In addition to investing for impact, asset owners can engage with investee companies to encourage them to adopt sustainable practices,
such as reducing waste, improving recycling and increasing their use of renewable energy. One practical measure is for companies to set specific, science-based and well-thought-out targets so that investors can track the company’s performance and hold management accountable. This not only has a positive impact on the environment but also influences the long-term financial performance of companies.
Waste management contributes to achieving several United Nations Sustainable Development Goals (SDGs), including SDG 8, which focuses on promoting inclusive and continuous economic growth, full and productive employment as well as decent work for all.
Waste management creates employment opportunities, particularly in low-income communities. According to Plastics SA the plastic industry provides some 60 000 informal jobs, many of whom are waste-pickers and collectors. This, in turn, helps to reduce poverty and increase economic growth.
Viable waste management practices contribute to achieving SDG 12, which aims to ensure responsible consumption and production patterns. By reducing the amount of waste that ends up in landfills, waste management reduces greenhouse gas emissions and environmental pollution, thereby promoting a more sustainable future.
Waste management contributes to the development of resilient infrastructure, which is critical for sustainable economic growth. Proper waste management helps to prevent environmental degradation and health hazards.
Innovation is crucial in the fight for sustainability amidst the increasing environmental challenges worldwide. Entrepreneurs, innovators and researchers are developing new technologies, processes and products that reduce our impact on the planet. By supporting innovation and investment in waste management, asset managers drive progress towards a brighter and greener future.

