29 May 2024


29 May 2024
Edmondson Park, NSW
Prepared For ALAND Prepared By
Brendan Woolley Director

1.1 Instructing Party
Instructing Party ALAND
Address 8-10 Gould Street
STRATHFIELD SOUTH NSW 2136
Ordered By David Hamilton
Email davidh@aland.com.au
Telephone +61 413 419 453
1.2 Purpose
Charter Keck Cramer (“Charter”) has been instructed by ALAND to prepare a Residential Apartment Market Research Report in relation to the Edmondson Park region in Southwest Sydney. By way of background, ALAND is preparing to develop “The Edmondson Collection” (“subject project”) which is proposed to accommodate 178 apartments across three buildings ranging in scale from four to eight storeys.
The purpose of this report is to provide ALAND with detailed property market research relating to the Edmondson Park apartment market including demographic characteristics, pricing & market metrics, project profiles of new developments, the apartment supply pipeline and analysis of ALAND’s past project performance in the area. This report is to be utilised by ALAND for internal purposes.
1.3 Terms of Reference
This report has been prepared for the exclusive use of the party to whom it is addressed and for no other purpose. No responsibility is accepted for any third party who may use or rely on the whole or any part of the content of this report. It should be noted that any subsequent amendments or changes in any form to this report would only be notified to and known by the parties to whom it is addressed. This report has been carefully prepared by Charter Keck Cramer Strategic Research and the information contained herein should not be relied upon to replace professional advice on specific matters.
© 2024 (Charter Keck Cramer)
1.4 Our Reference
Charter Contact Brendan Woolley
Report Author Brendan Wolley, Cornelia Potgieter
Report No. Final V1 (issued 29 May 2024) (Draft V1 was issued 15 May 2024)
2.1 Edmondson Park – Location & Context
2.1.1 Location & Setting
Edmondson Park is located in Southwest Sydney in the local government area of Liverpool. The suburb is situated circa 7 kilometres southwest of Liverpool Central Business District and approximately 40 kilometres southwest of the Sydney Central Business District.
In 2008, Edmondson Park was rezoned for urban development as part of the NSW Government’s plan for urban expansion in the Southwestern fringe of Greater Sydney. Prior to rezoning and redevelopment, Edmondson Park was predominantly used for rural residential purposes also accommodating the former Ingleburn Army Camp. The suburb has now transitioned into a primarily low-density residential area with pockets of medium-density development, supported by a high-density town centre.
Neighbouring suburbs to the north of Edmondson Park include Horningsea Park and Prestons which are characterised by established low-density residential development. New low and medium-density residential precincts are emerging to the west, south-west, south and south-east, specifically in Austral, Leppington, Denham Court and Bardia.
The specific location of Edmondson Park in the broader context of the Sydney metropolitan area is highlighted on the location maps below.
Location Map
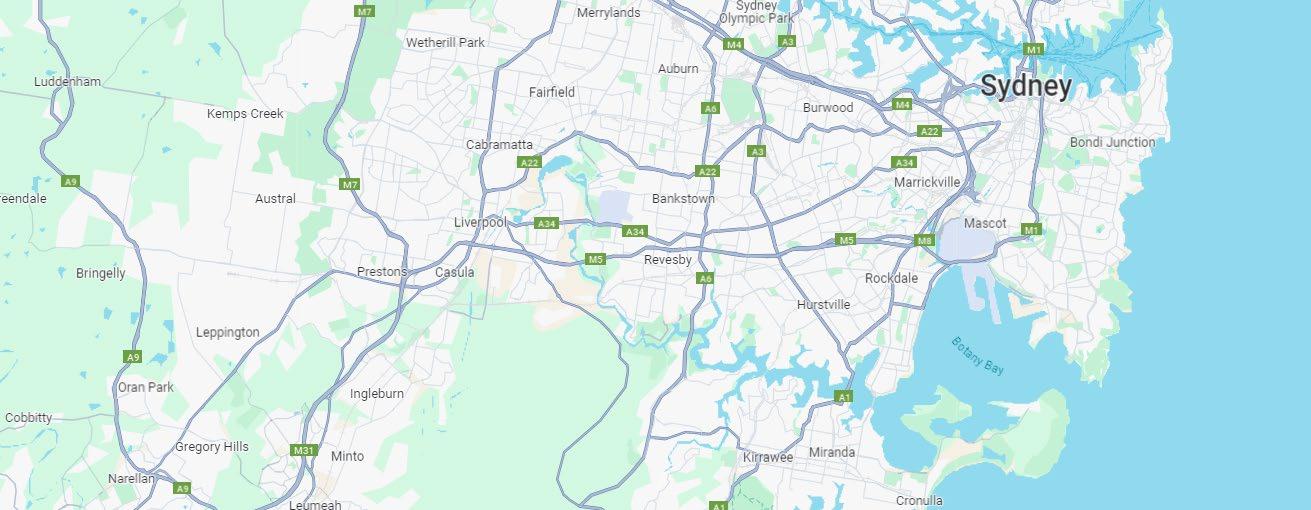
SOURCE – whereis.com

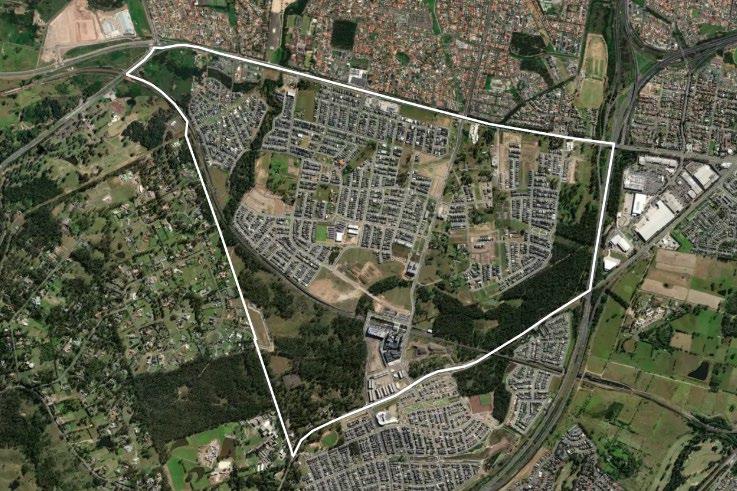
Edmondson Park Suburb Location & Aerial Context
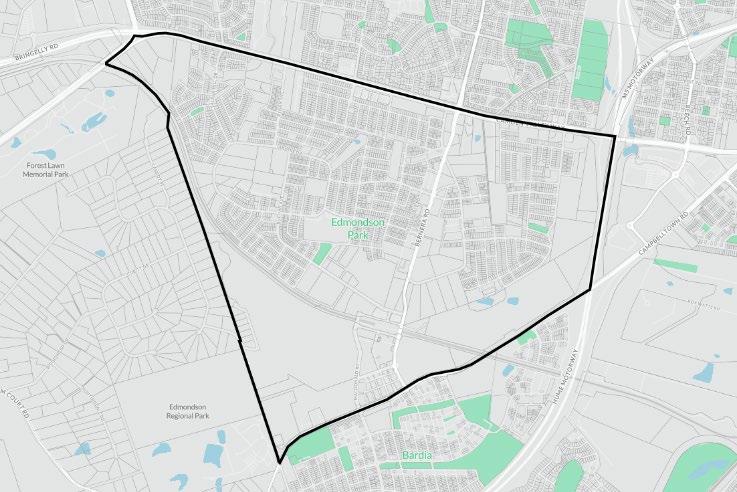
SOURCE – Landchecker.com.au
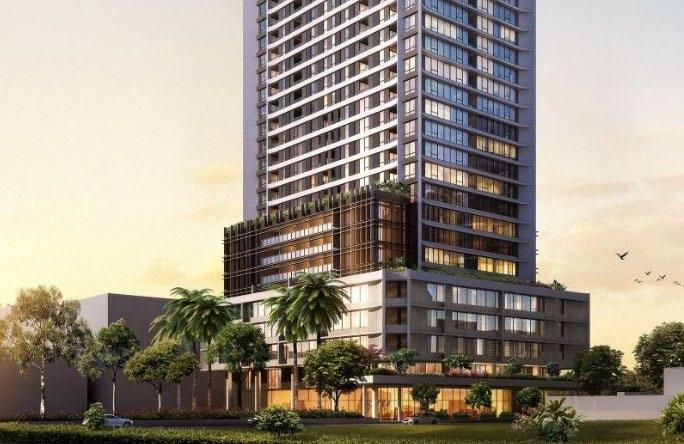
The following images provide an indication of new residential apartment projects in Edmondson Park.
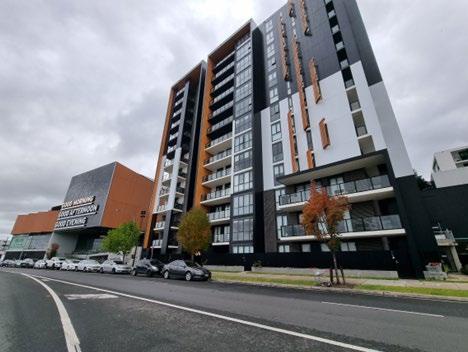
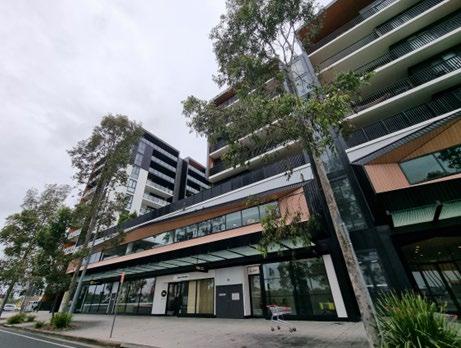
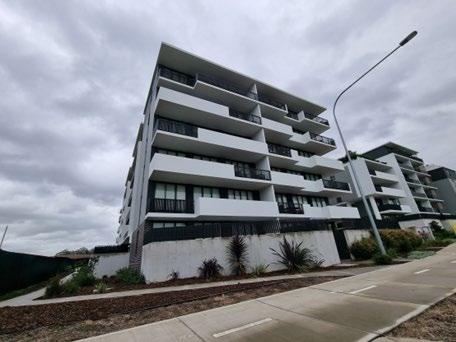
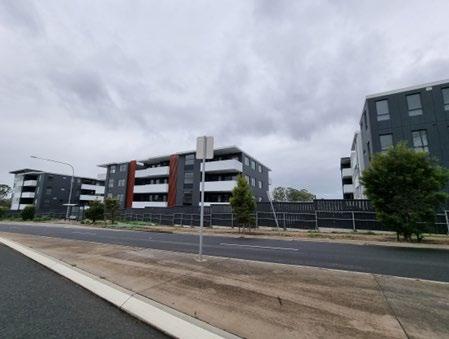
SOURCE - Charter Keck Cramer
Edmondson Park is considered well connected to existing public transport links. Bus and rail services are the primary forms of public transport servicing the area whilst there are additionally numerous major roadways locally accessible.
Bus routes operate regularly throughout the area, providing linkages to Carnes Hill, Liverpool, Ingleburn, Leppington, Glenfield and Fairfield.
Edmondson Park railway station opened in 2015 and forms part of the Southwest Rail Link. The station is located in the southern portion of the suburb aligning the northern side of Ed.Square town centre.
Major roadways accessible to Edmondson Park include Camden Valley Way to the north and Campbelltown Road, to the south of the suburb. These roadways provide access to the Hume Highway which links to Liverpool and Campbelltown, as well as the M5 and M7 Motorways which form part of Sydney’s western orbital network. These road networks provide access to suburbs throughout the Sydney metropolitan area along with the Mascot airport precinct and Sydney CBD.
Edmondson Park is located circa 20 kilometres southeast of Western Sydney International (Nancy-Bird Walton) Airport which is currently under construction and due for completion in 2026.
Retail services and amenities are concentrated in Edmondson Park’s masterplanned town centre, Ed.Square which was completed by Frasers Property Australia in 2021. The precinct is located in the southern portion of the suburb, adjacent to Edmondson Park railway station and features a Coles supermarket, a range of fresh food operators, an “Eat Street” comprising restaurants and cafes, entertainment offerings and general amenity. Other major retail precincts accessible to Edmondson Park are located to the north and east in the suburbs of Prestons and Casula. Liverpool is the closest regional centre and features a high content of retail amenity including Westfield Liverpool.
Edmondson Park accommodates a limited number of education providers although additional education facilities are located throughout the broader region, including university campuses in both Liverpool and Campbelltown. Local schools include the following:
St Francis Catholic College
Edmondson Park Public School
Bardia Public School
Glenfield Park School
St Catherine of Siena Primary School Prestons
William Carey Christian School
John Edmondson High School
Holy Spirit Catholic Primary School
Lifestyle Amenity
Residents have localised access to numerous lifestyle amenities in the form of public reserves, outdoor spaces, community facilities and entertainment precincts including:
Edmondson Regional Park
Clermont Park
Western Sydney Parklands
Macquarie Links Golf Course
Hoyts cinemas
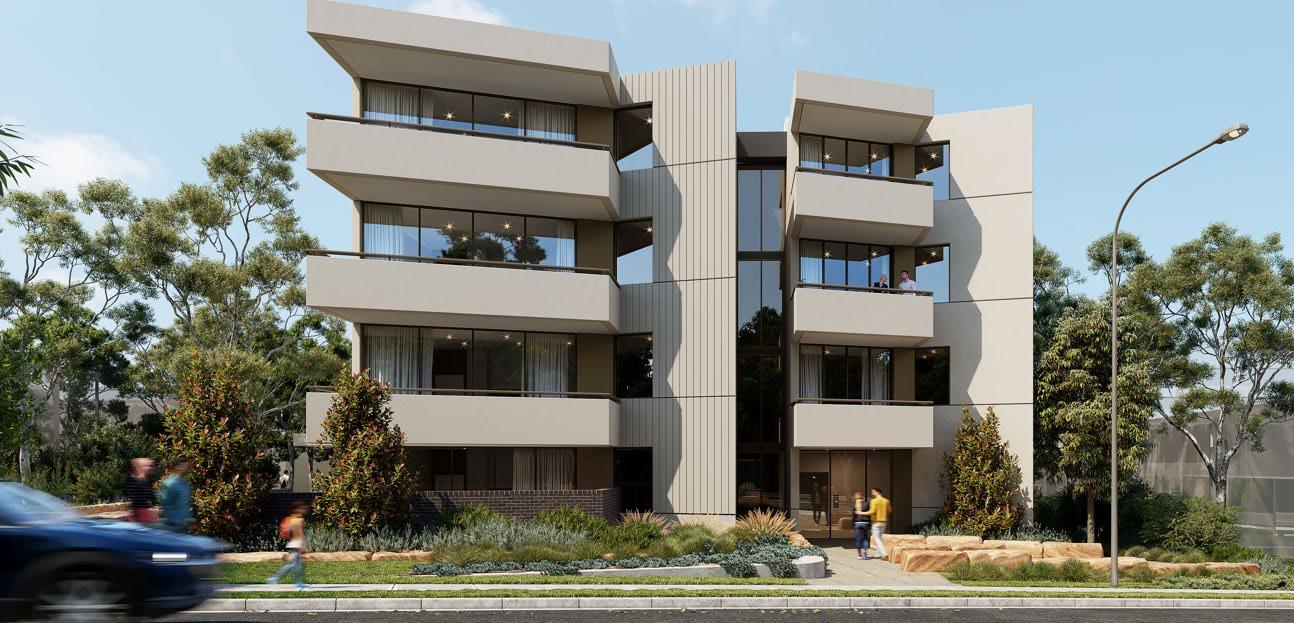
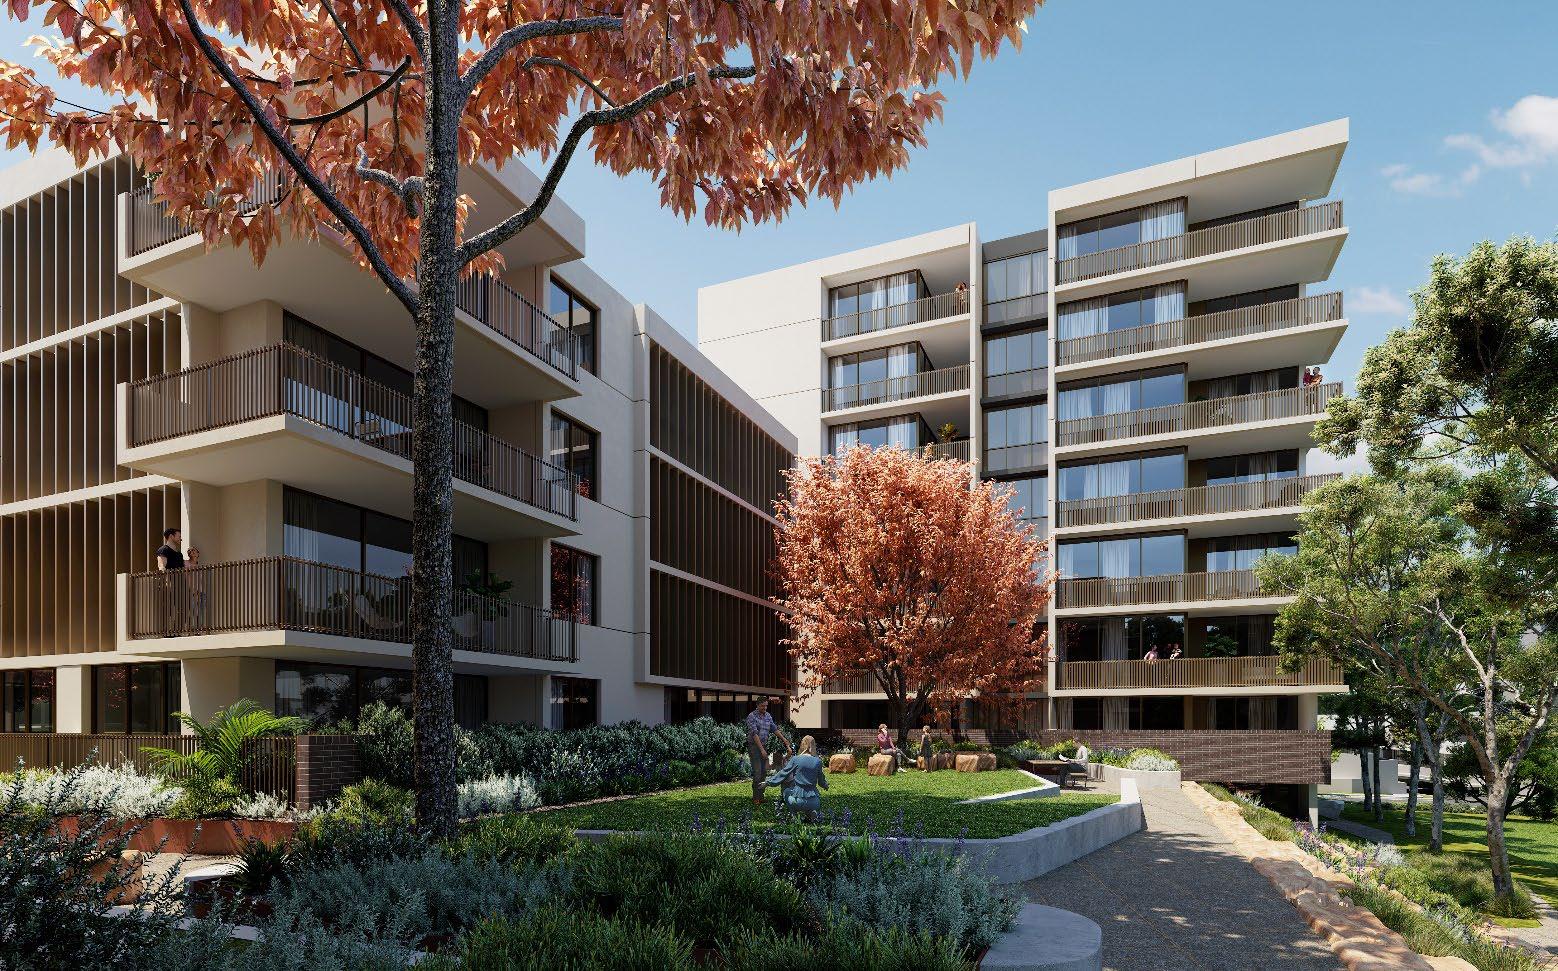
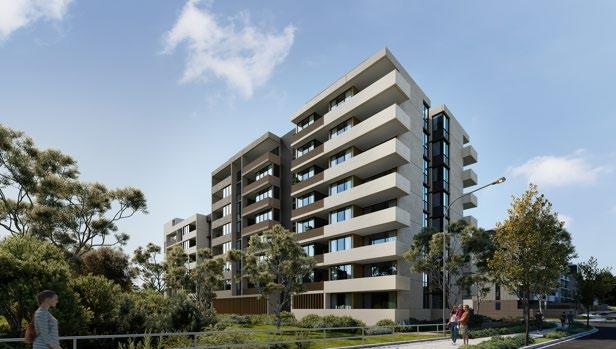
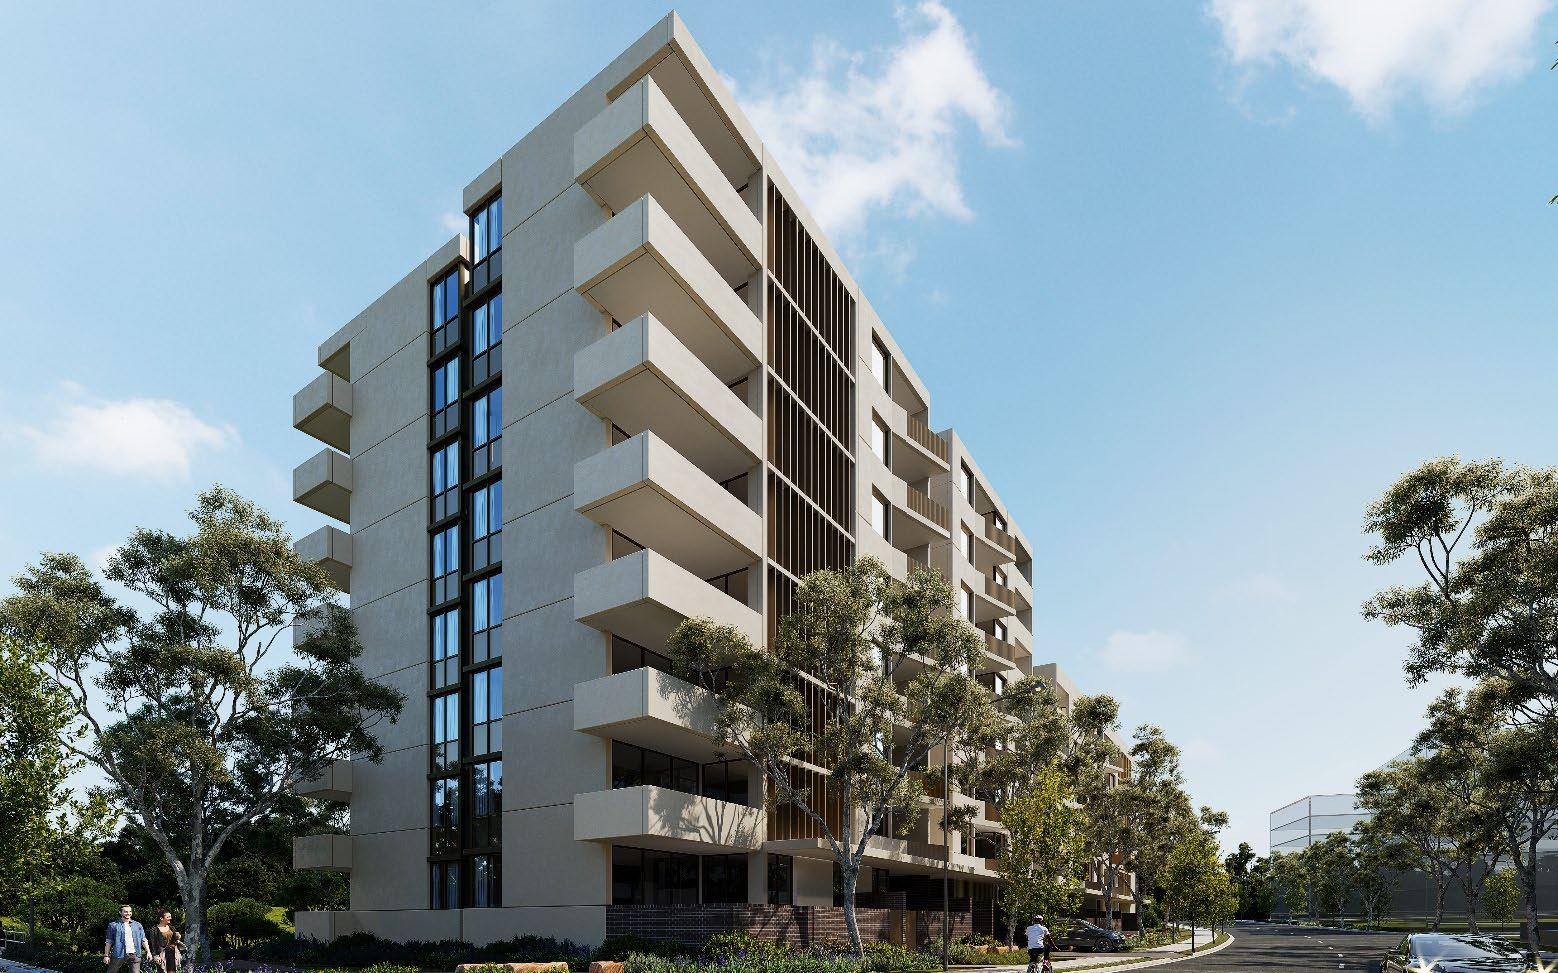
ALAND’s proposed residential development, “The Edmondson Collection” is located on the western alignment of Bernera Road, Edmondson Park, neighbouring the western and southern boundaries of ALAND’s 2021 built residential project “Costello”. The proposed development spans across a Z-shaped allotment and is set to accommodate 178 apartments across three x four to eight storey residential flat buildings. Parking is to be provided at basement level. The project is also proposed to feature communal landscape courtyards at ground level as well as a rooftop terrace.
Project dwelling yield mix and sizing is summarised in the table below:
“The Edmondson Collection” - Dwelling Mix & Sizing
Source – ALAND
The following concepts provide an indication of The Edmondson Collection built form
To inform the current and likely future resident profile and population characteristics of Edmondson Park a comprehensive demographics analysis has been completed. The following locations have been selected as the key study areas:
Edmondson Park state suburb
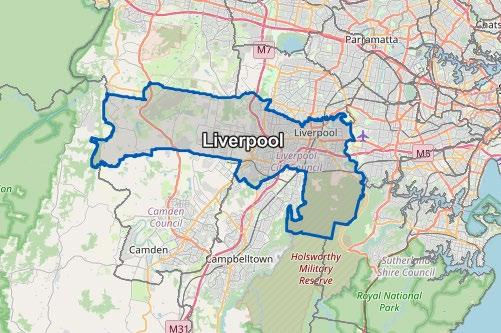
Liverpool Local Government Area
The following maps indicate the boundaries of Edmondson Park and Liverpool Local Government Area.
Edmondson Park (State Suburb)
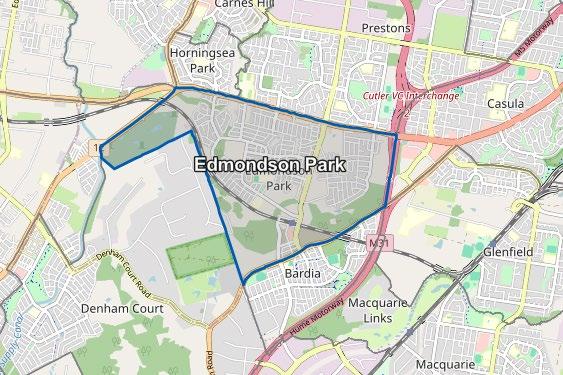
Source - Australian Bureau of Statistics, Charter Keck Cramer
Liverpool (Local Government Area)
Statistics for Greater Sydney have also been referenced as an additional point of comparison.
The analysis is primarily based on census data compiled by the Australian Bureau of Statistics (“ABS”) as per the 2021 Census. In addition, NSW Department of Planning, Housing and Infrastructure (“The Department”) population forecasts prepared in 2022 have been relied upon for the population related information.
The following characteristics have been reviewed to provide an overview of local area demographics and likely future direction:
Current and forecast population.
Age characteristics
Housing structure
Household size and forecast change.
Dwelling mix
Income & Education
Ownership, mortgage repayments and rent
Employment
Ethnicity
Migration profile
From the information analysed, conclusions have been drawn in relation to the demographic profile of the area.
The suburb of Edmondson Park supports a usual resident population of 12,080 people with 49.7% male and 50.3% female. The localised population increased by a significant +432% between 2016 and 2021as a result of the introduction of substantial new dwelling supply.
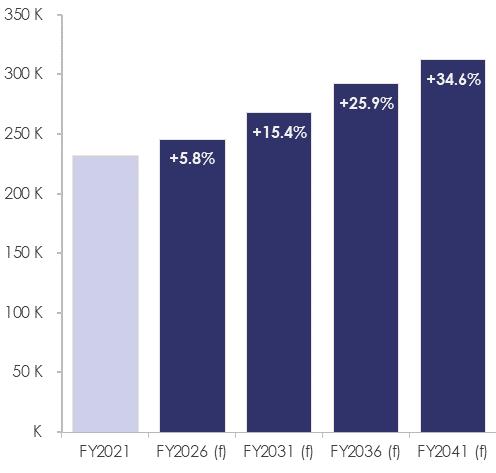
As per The Department, Liverpool LGA supported a resident population of 232,303 in 2021.
Forecast population growth by The Department projects the Liverpool LGA population to increase to 312,653 persons by 2041. This represents an additional 80,350 people (34.6%) from the 2021 population.
The Department also provides population forecasting down to Statistical Area 2 (“SA2”) level with Edmondson Park located in Prestons - Edmondson Park SA2 (“Edmondson Park Local Area”). As at 2021, the Edmondson Park Local Area comprised a total of 22,643 residents and is anticipated to grow by an additional 4,041 persons (+17.8%) by 2041.
The current household size in Edmondson Park is 3.4 persons, which measures above Liverpool LGA and Greater Sydney (3.2 and 2.7 persons respectively). This demographic highlights the family centric nature of the location.
Based on the population projections and current household size, Liverpool LGA will require circa 109,959 dwellings by 2041. This represents an additional requirement of approximately 33,300 dwellings over the next 20 years (circa 1,665 new dwellings per annum on average).
Forecast Population Growth (2021 to 2041)*
Edmondson Park Local Area
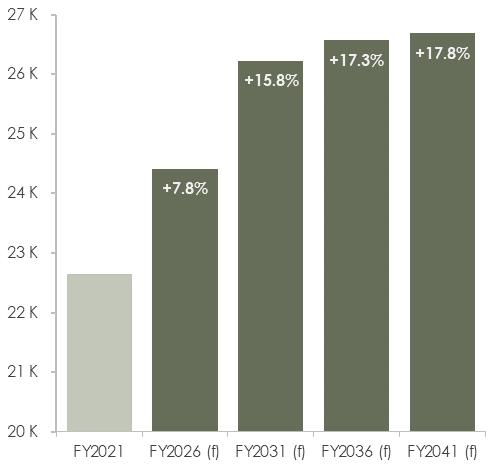
*It is noted, percentage forecast growth is indexed to 2021 population.
SOURCE - NSW Department of Planning, Housing and Infrastructure
LGA
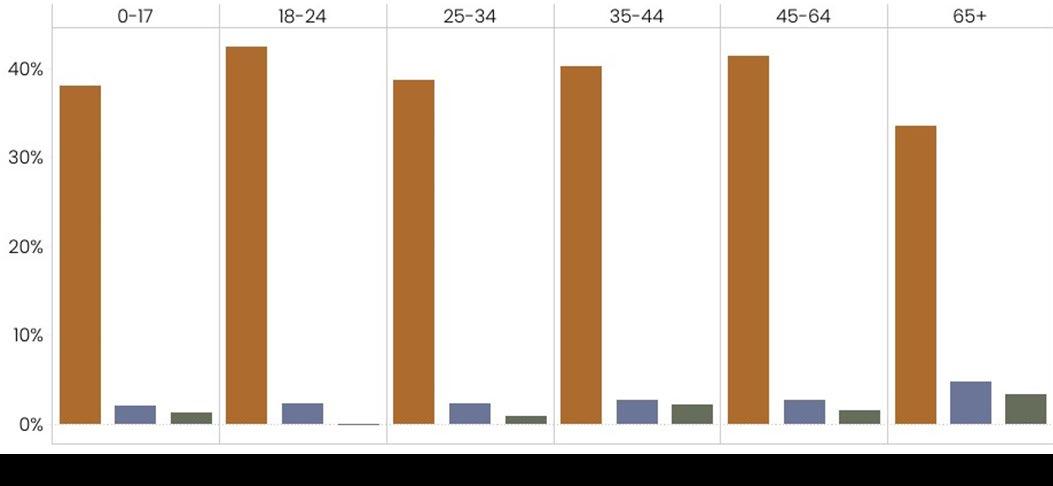
The median resident age in Edmondson Park is 31 years. This is lower than both Liverpool LGA and Greater Sydney which recorded median ages of 34 and 37 years respectively.
As at 2021, the 0 - 17 year age bracket accounted for 30.7% of Edmondson Park’s population, followed by the 35 - 44 year age bracket at 20.1%. This is considered to highlight the notable content of Couples with Children households residing locally.
Liverpool LGA age characteristics are broadly similar in terms of the most prevalent age group with the 0 – 17 year cohort accounting for 26.3% of the population. The second highest proportion of the population was the 45 – 64 year age group (23.5%).
In Greater Sydney the 45 – 64 year age bracket accounted for the highest proportion of the population (23.8%) followed by the 0 – 17 year age bracket (21.8%).
The 25 - 34 and 45 – 64 year age brackets were third and fourth in Edmondson Park, accounting for 18.3% and 17.3% of the population.
The 65+ year age group was the lowest in Edmondson Park at only 4.3% of the population. In contrast, the 18 – 24 year cohort was the lowest in Liverpool LGA (9.8%).
Being a developing suburb benefitting from an influx of new residents over the past five years, all age cohorts in Edmondson Park increased substantially between 33.5% to 42.5% p.a. between 2016 and 2021. The highest increase was in the 18 -24 year age group (42.5% p.a.), followed by the 45 - 64 year age group (41.4% p.a.) The 18-24 year age group brackets only increased by 2.4% p.a. in Liverpool LGA and declined -0.1% p.a. in Greater Sydney.
Age Distribution (% of Population)
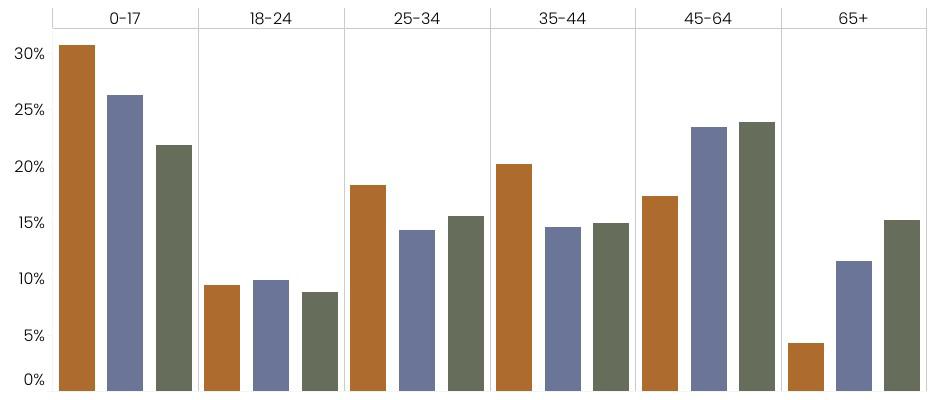
SOURCE - Australian Bureau of Statistics Census of Population and Housing
Age Cohort % Change p.a. (2016 – 2021)
SOURCE - Australian Bureau of Statistics Census of Population and Housing
Couples with Children represent the highest percentage of households within Edmondson Park (60.6%), Liverpool LGA (46.7%) and Greater Sydney (36.0%). This is considered attributable to the high proportion of detached houses which are generally characterised by three+ bedrooms and thus accommodate large household sizes.
Couples (no children) represent the next highest group in Edmondson Park, Liverpool LGA and Greater Sydney at 17.3%, 17.9% and 24.4% respectively. This is reflected in the Edmondson Park apartment market, with dwelling mix typically weighted to one and two-bedroom typologies. As at 2021, one and two-bedroom apartments accounted for 87.7% of total apartment stock.
The third highest group in Edmondson Park was Lone Persons (10.9%), which was significantly below both Liverpool LGA (17.2%) and Greater Sydney (23.2%).
One Parent Families and Group Households respectively account for the lowest percentage of household structures in all review locations, with Edmondson Park accommodating 10.9% and 1.6% respectively.
By 2041, Couples with Children are anticipated to remain the most prevalent household group albeit accounting for a lesser proportion (52.3%), with Couples (no children) and Lone Persons households forecast to make up 18.2% and 11.1% of the local population (SA2 level)
Household Structure
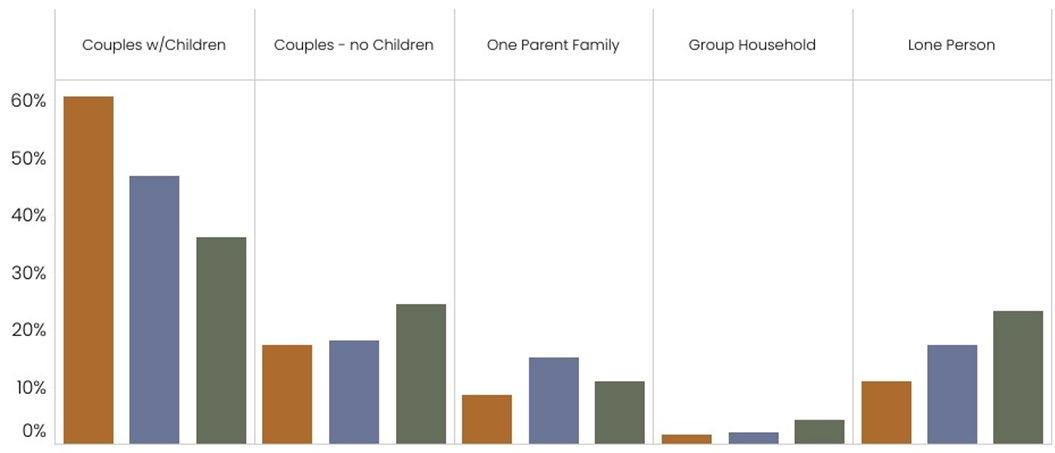
SOURCE - Australian Bureau of Statistics Census of Population and Housing
3.4 Dwelling Mix
Edmondson Park is a suburban greenfield location and accordingly the majority of new dwellings up until 2021 have been provided in the form of freestanding houses. In this regard, houses account for 83.8% of all dwellings in Edmondson Park which is higher than Liverpool LGA at 73.3% and Greater Sydney (56.2%).
Townhouses account for 6.2% of dwellings in Edmondson Park, 10.3% in Liverpool LGA and 12.9% in Greater Sydney.
In Edmondson Park, apartments account for only 10.0% of all dwellings as at 2021, 16.4% of dwellings in Liverpool LGA and 30.9% of the Greater Sydney total dwelling mix. As at 2021 when the Census was conducted there were only 332 apartments reported in Edmondson Park. It is important to note that this has now increased to 998 apartments representing a significant uplift.
Throughout the late 2010s and early 2020s, residential development focus throughout the region was predominantly on the provision of new dwelling houses, with approvals for new housing accounting for between circa 50% to 70% of dwelling approvals. However, over the last two years development focus has shifted to apartments, evidenced by a growing proportion of approvals for which now account for more than 50% of recent dwelling approvals.
Of the 332 apartments in Edmondson Park, the majority of apartments are 4+ Storeys (89.9%). Only 0.9% of apartment blocks are low-rise (1 - 3 storeys) and the remainder are stated as being attached to a house (granny flat).
Apartments within Liverpool LGA are dominated by 3 storey structures with 36.1% of all apartments within such blocks. The second most prevalent scale buildings are 9+ storey blocks at 29.4% followed by 4 – 8 storey apartment buildings (15.9%)
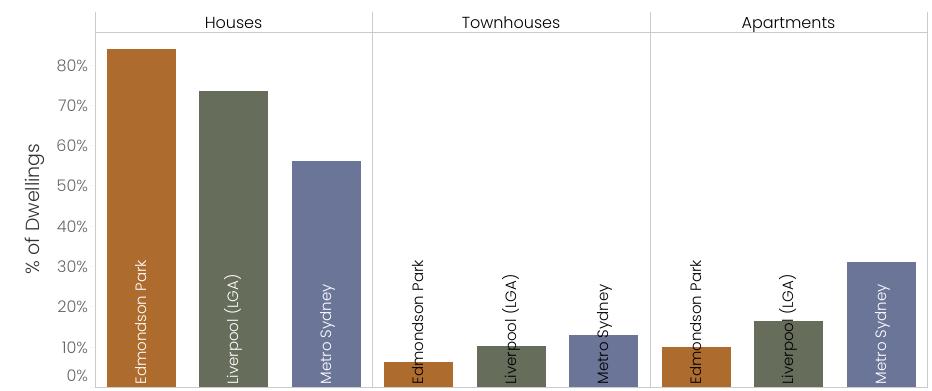
SOURCE - Australian Bureau of Statistics Census of Population and Housing
The 2021 Census indicates that within Edmondson Park, a high proportion of apartments accommodate two-bedrooms. Overall, the mix indicated includes no studios, 27.7% one-bedroom (92), 59.9% two-bedrooms (199) and 5.1% threebedrooms (18). It is noted, the majority of three-bedroom “apartments” noted in the Census are attached to a house (Granny Flats).
In Liverpool LGA, 2.1% of apartments had 0 bedrooms (bedsit / studio), 13.3% offered one-bedroom, 66.7% had twobedrooms, 13.7% had three-bedrooms and 1.7% had four+ bedrooms. It is noted that 2.5% of responses did not state bedroom numbers.
*This table has been reproduced from the 2021 ABS Census Community Profile and it is understood that the dwelling numbers indicated within the “Total” columns do not always equal the exact number of dwellings when aggregated due to rounding considerations within the original ABS dataset and associated analysis.
SOURCE - Australian Bureau of Statistics Census of Population and Housing
LGA Dwelling Structure by Number of Bedrooms
Typology
*This table has been reproduced from the 2021 ABS Census Community Profile and it is understood that the dwelling numbers indicated within the “Total” columns do not always equal the exact number of dwellings when aggregated due to rounding considerations within the original ABS dataset and associated analysis.
SOURCE - Australian Bureau of Statistics Census of Population and Housing
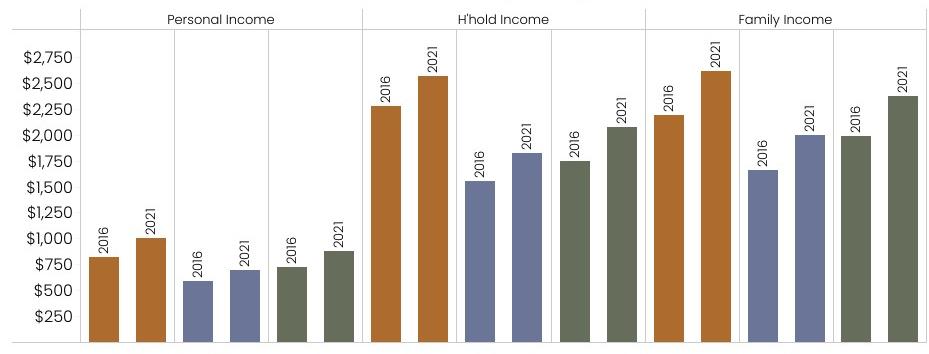
3.6 Income & Education
Personal income at $1,008 p.w. in Edmondson Park reflected a 22.9% increase from 2016, being notably higher than Liverpool LGA ($694 p.w.) and Greater Sydney ($881 p.w.).
Household income at $2,562 p.w. in Edmondson Park reflected an increase of 12.6% from 2016 being $743 p.w. greater than Liverpool LGA and $485 p.w. higher than Greater Sydney.
Family income at $2,619 p.w. in Edmondson Park increased by 19.3% from 2016 being higher than both Liverpool LGA ($2,001 p.w.) and Greater Sydney ($2,374 p.w.).
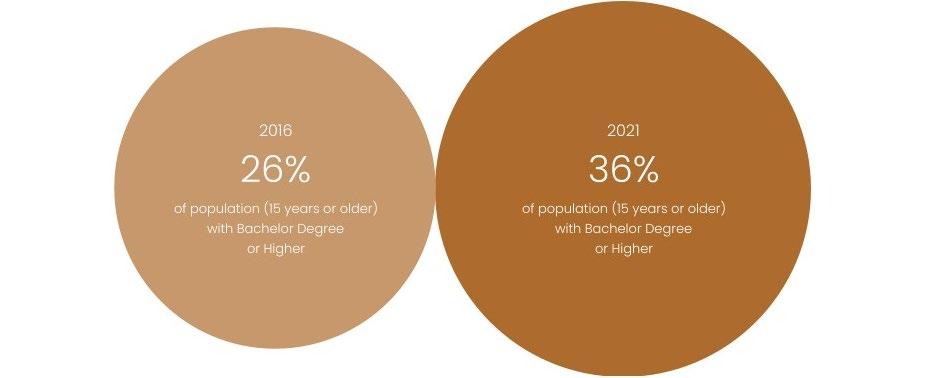
Between 2016 and 2021 the educational attainment of Edmondson Park residents increased from 26% to 36%.
Income
Park Liverpool LGA
SOURCE - Australian Bureau of Statistics Census of Population and Housing
SOURCE - Australian Bureau of Statistics Census of Population and Housing
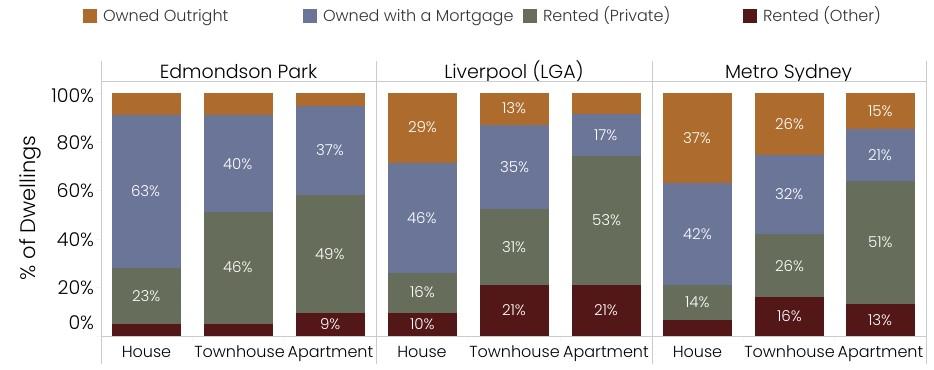
Edmondson Park features a below average content of investment properties with 58.2% of apartments held by investors. Liverpool LGA and Greater Sydney feature a higher content reflecting 73.9% and 63.9% respectively. This is considered to reflect the contemporary age of most apartments with many new projects taken up by a greater proportion of owner occupiers than has traditionally occurred.
Only 5.2% of apartments are owned outright in Edmondson Park with 36.6% owner occupied with a mortgage. This is more than double when compared to Liverpool LGA where only 17.4% of apartments are owner occupied with a mortgage.
With regards to townhouses, a significant 50.9% of Edmondson Park stock is rented whilst 8.8% is owned outright and 40.3% is owner occupied with a mortgage. The ratio differs in Liverpool LGA with a higher content of townhouses owned outright (12.9%) and a lower number owner occupied with a mortgage (34.9%).
The majority of houses in Edmondson Park are owner occupied (71.9%) with 8.9% of all houses owned outright. Only 28.2% are held as rental investments. Within Liverpool LGA, 74.2% of houses are owner occupied (28.6% owned outright) whilst 79.0% in Greater Sydney are owner occupied (42.0% owned outright).
The high content of “owner occupation with a mortgage” in Edmondson Park is considered to reflect the developing nature of the location with many properties having been purchased within the last 10 years.
SOURCE - Australian Bureau of Statistics Census of Population and Housing
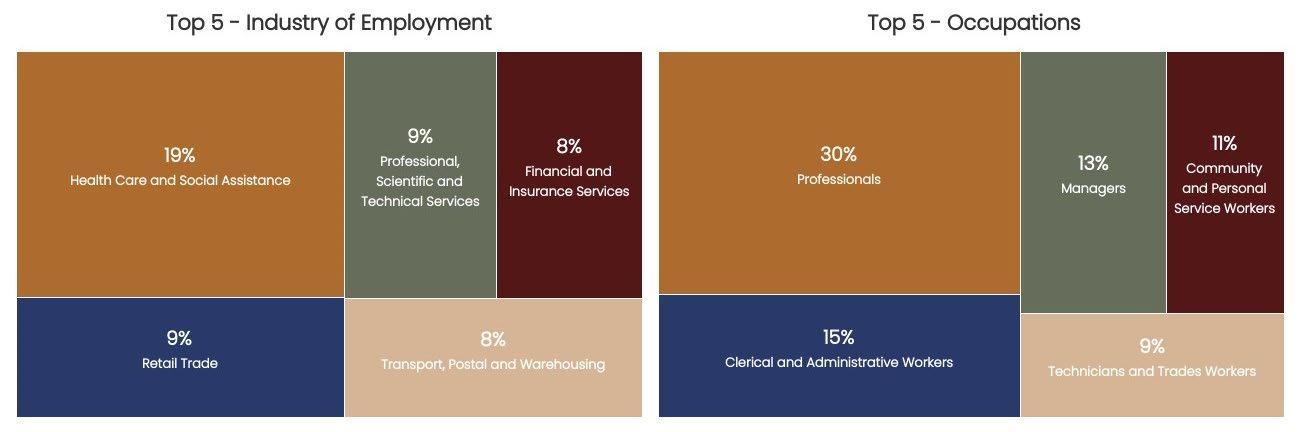
As per 2021 Census data, Health Care and Social Assistance is the main industry of employment in Edmondson Park at 19%. This is followed by Professional, Scientific and Technical Services and Retail Trade at 9% of the working population. Professionals make up the highest proportion of occupations in Edmondson Park at 30%. This is followed by Clerical & Administrative Workers at 15%, then Managers at 13%.
Employment & Occupation – Edmondson Park
3.9 Ethnicity
As per the 2021 Census, 44.1% of Edmondson Park residents were born in Australia with the remainder born overseas. This is less than Liverpool LGA at 51.2% and Greater Sydney at 56.8%.
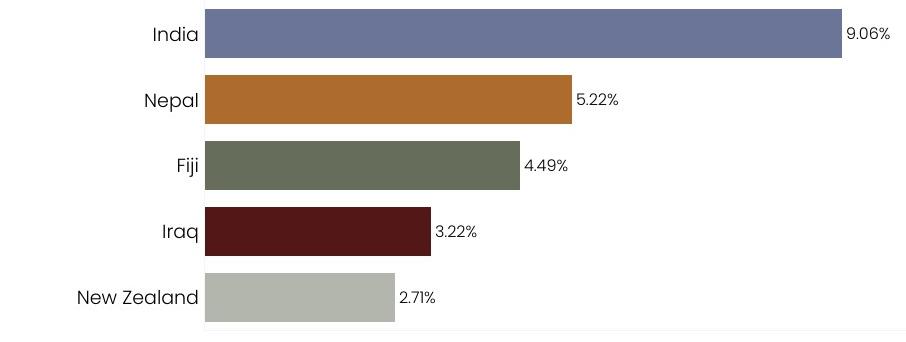
Indian born residents accounted for 9.1% of residents with Nepalese born residents the third highest number at 5.2% followed by Fiji 4.5%, Iraq at 3.2% and New Zealand 2.7%.
In terms of ancestry, 14.8% of residents have Indian heritage, 10.9% Australian, 8.2% Chinese, 7.9% English and 6.4% Nepalese
Ethnicity Profile – Top Five Country of Birth (other than Australia)
SOURCE - Australian Bureau of Statistics Census of Population and Housing
The chart below highlights the top five ethinicity profiles of Edmondson Park residents by year of arrival in Australia.
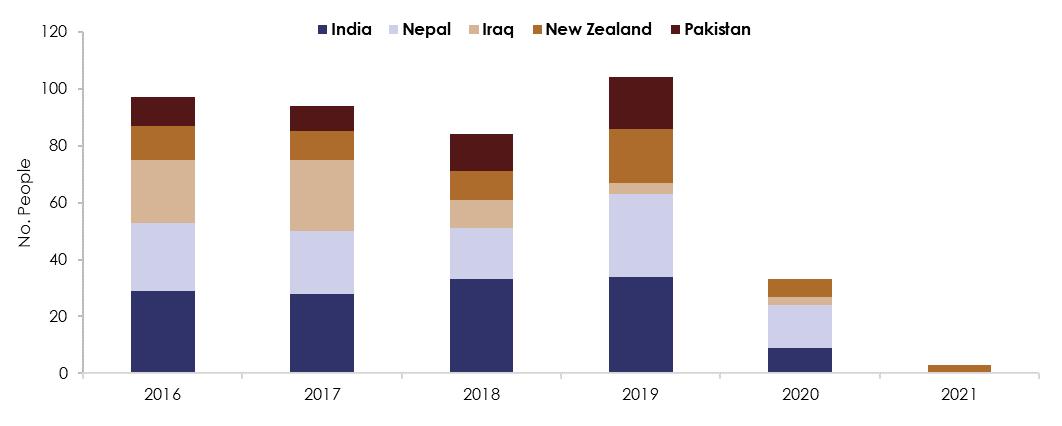
SOURCE - Australian Bureau of Statistics Census of Population and Housing
Between 2016 and 2019, residents arriving from Inida were the predominat ethnic group residing in Edmondson Park. The number of new residents from Nepal has grown in proportion, outpacing Indian born residents in 2020. It is noted however that there was limited migration in both 2020 and 2021 as reuslt of international border closures throughout the COVID pandemic.
An analysis has been completed to identify the primary locations from where people have relocated to Edmondson Park over the past five years. In this instance, the most detailed level of migration data provided by the ABS is at Statistical Area 2 (“SA2”) with the subject property located within the “Edmondson Park” SA2.
The table overleaf identifies the top in-migration locations to Edmondson Park. Outside of intra-migration within Edmondson Park SA2 and overseas migration, a desire to remain with the same region is evident given the remaining locations in the top 10 in-migration locations are all local.
Key Edmondson Park SA2 In-Migration Regions
Area 2
Hoxton Park - Carnes Hill - Horningsea Park
West Hoxton - Middleton Grange
Chipping Norton - Moorebank
TOTAL (Top 10 Locations)
*Represents residents that were located in Edmondson Park SA2 at both the 2016 Census and 2021 Census – includes residents that have either relocated within Edmondson Park SA2 or remain at the same address.
A review of the age profile of movers has been undertaken to identify which age cohorts are most prevalent in Edmondson Park and the likely dwelling preference of this demographic. The prevalence of family households (couples with children) is evident based on the high content of 0 -17 year (children) and 35 - 44 year (parent) groups. Given the high quantum of low density housing provision in Edmondson Park we anticipate this migration profile will continue. Only 4.4% of residents that relocated to Edmondson Park between 2016 and 2021 were aged 65+ years
The review also indicates that many current overseas born residents are aged between 25 – 44 years. This typically corresponds with singles, couples and family households (the latter being the dominant household type in Edmondson Park). It is noted that much of this demographic group has started a family in Australia evidenced by a significant proportion of Australian born children in Edmondson Park (24.7% of all Edmondson Park residents). There is also a higher content of overseas born residents aged 65+ years highlighting multi-generational migration.
These groups typically would seek a range of dwelling typologies ranging from two-bedroom apartments (couples and young families) through to freestanding houses (family and multi- family households).
It is anticipated these ethnicities will continue to relocate to Edmondson Park given family connections, location characteristics, price points and variety of dwelling options.
4.1
Inflation has been slowing since Q1 2023 but the pace of decline in recent quarters has been sluggish, and at 3.6%, CPI is still higher than the RBA’s target (March 2024, ABS). Latest projections suggest inflation will remain above the 2 - 3% target range until late 2025, which is later than previously expected. The RBA caution that while goods price inflation has eased significantly, service price inflation remains high and is a key source of uncertainty. At their early May meeting, the RBA held the cash rate at 4.35%, but highlighted that “the path of interest rates remains uncertain” and that they are “not ruling anything in or out”. In other words, if the dataflow points to higher or more prolonged above-target inflation, then further increases in the cash rate are possible, though this is not economists’ central case scenario. Market expectations are for the cash rate to remain at its current level through much of the year and for the RBA to start gradually cutting rates from Q4 2023
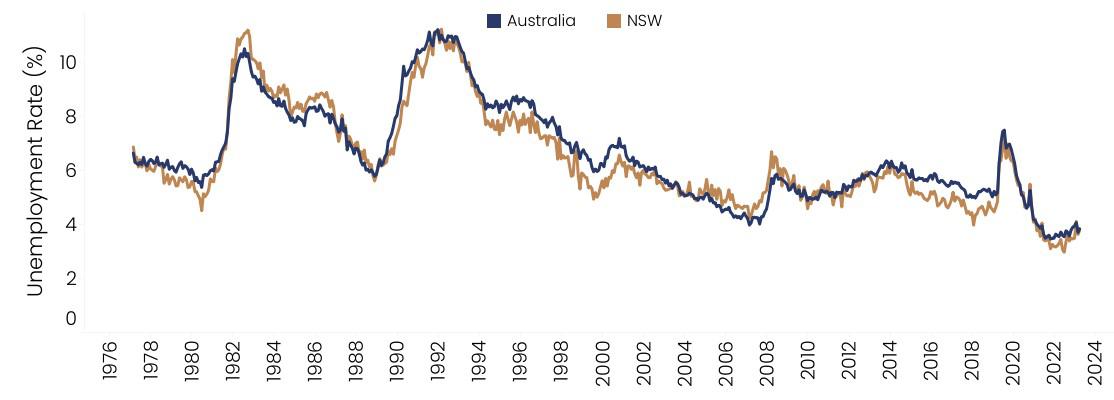
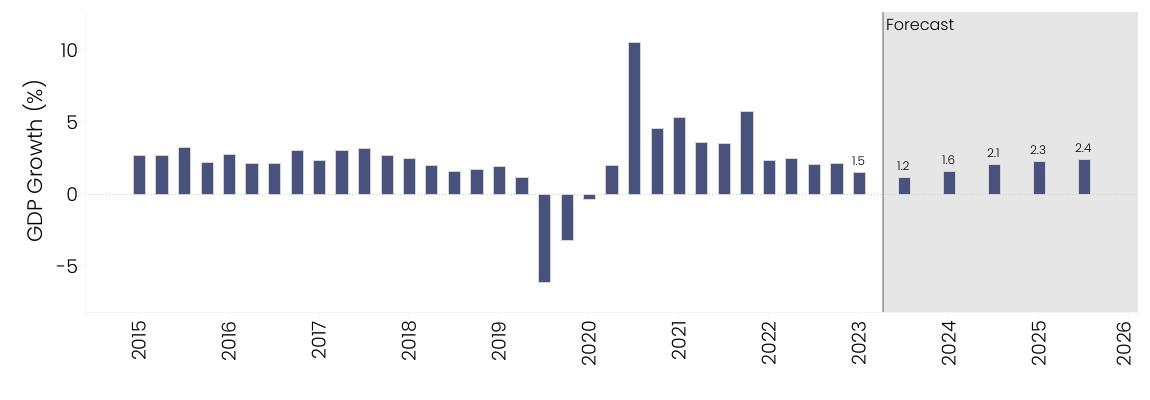
The economy is experiencing a period of sub-trend growth. GDP growth in the three months to December 2023 was just 0.2% (1.5% over 12 months) and was driven by government expenditure and private business investment. For households, the run of interest rate hikes over the last 12-18 months and the rising cost of living are having a substantial impact on budgeting. Discretionary spending has been particularly subdued over the last six months as consumers remain cautious. In the labour market, conditions have eased slightly over the last six months. Unemployment is still very low, but there has been a shift towards part time jobs, which have grown strongly over recent quarters while full time employment has remained relatively flat. The number of hours worked fell during much of 2023, but wage growth has accelerated to 4.2% p.a., up from 3.3% a year ago. Sub-trend economic growth is expected to persist for the next 12-18 months and unemployment is forecast to rise from its current rate of 3.8% (seasonally adjusted, March 2024) to 4.2% by end-2024.
The extent to which consumer spending continues to slow is a key source of uncertainty and risk to the economic outlook; while internationally, the outlook for the Chinese economy and the impact of overseas conflicts are potential threats to global growth. Latest forecasts suggest GDP growth in Australia is set remain soft in 2024 at 1.6%, thereafter improving to 2.3% in 2025.
Cash Target Rate (%) Source: RBA / Forecasts: Various Interest rates are expected to start declining at the end of 2024…
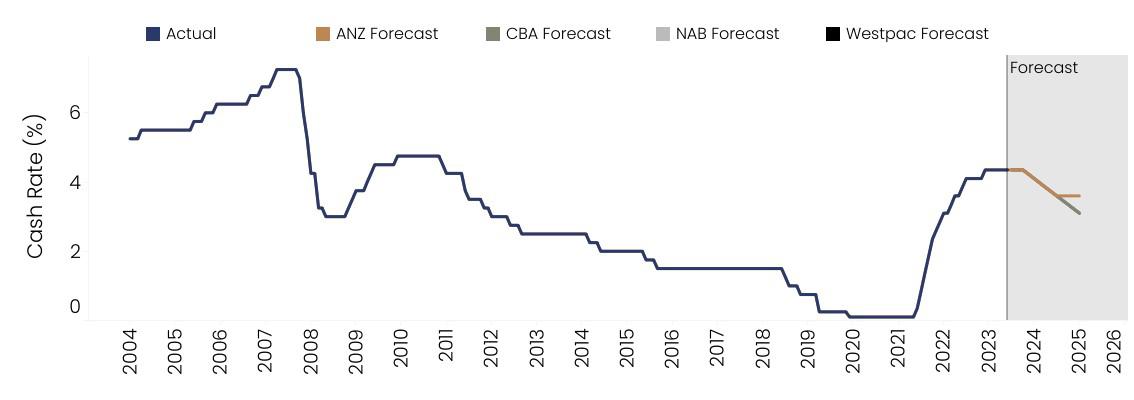
Average Cash Rate (Dec 2004 to May 2024): 3.15%
CPI (quarterly series, %) Source: ABS / Forecast: RBA
Inflation has fallen significantly from its December 2022 peak…

Consumer & Business Confidence Source: ANZ-Roy Morgan
Consumer and business confidence have improved but remain soft …

Unemployment (%) Source: ABS
The labour market remains tight, with unemployment at an historic low…
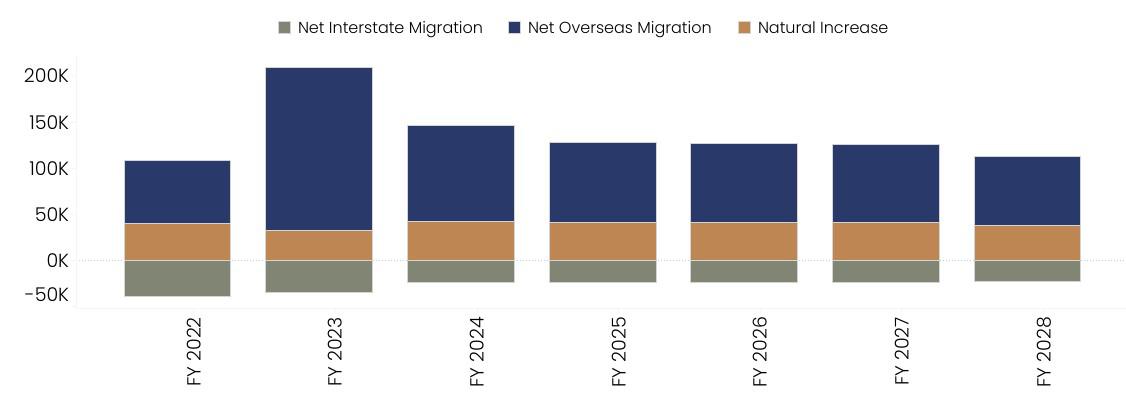
Population Change NSW (000s) Source: Centre for Pop.
Net overseas migration will support economic growth…
GDP Growth (Y-on-Y, %) Source: ABS / Forecast: RBA
GDP growth will remain sub-trend in 2024…
SOURCE - Charter Keck Cramer, ABS, RBA, Westpac-MI, NAB
National Level Indicators
Comments GDP Dec Qtr 2023
$609.8bn0.2%0.3%1.5%
The Australian economy (GDP, seasonally adjusted) increased by 0.2% during the December Qtr 2023. Current value measures 1.5% greater than 12 months prior.
At its meeting in early May, the Reserve Bank Board held the cash rate unchanged. Interest rates are widely regarded as having reached their peak but the RBA cautions that there are risks to the outlook. Inflation Mar Qtr 2024
137.41.0%0.6%3.6%
Unemployment Mar-20243.8%0.1%-0.4%0.3%
Real Net National Disposable Income Dec Qtr 2023
Consumption Expenditure Dec Qtr 2023
Exports of G&S Dec Qtr 2023
Consumer Confidence
State Level Indicators
$478.1bn1.4%-0.5%1.6%
$298.3bn0.1%-0.2%0.1%
$163.9bn-0.3%-0.2%4.1%
Australia's CPI (All Groups) was 3.6% during the 12 months to March 2024. While inflation remains above target, the rate of price rises has slowed in recent quarters.
The unemployment rate remains very low on an historic basis, measuring 3.8% in March (seasonally adjusted).
Australia's seasonally adjusted net disposable income increased by 1.4% during the December Qtr 2023 and is 1.6% higher than the same period last year.
Australia's seasonally adjusted consumption expenditure saw 0.1% growth during the December Qtr 2023, and is only 0.1% higher than 12 months ago.
Australia's exports of goods and services declined by 0.3% during the December Qtr but are up by 4.1% over 12 months.
The ANZ-Roy Morgan Consumer Confidence Rating fell in March to an average of 82 throughout the month. An index reading below 100 indicates that pessimism outweighs optimism among consumers.
According the NAB Quarterly Business Survey, NSW's business conditions deteriorated by 3 index points during the Mar Qtr 2024. Conditions are 14 points lower than the same period last year. Retail Trade
NSW's seasonally adjusted retail turnover declined in March by 1.1% month-on-month and is 0.9% lower than 12 months ago.
Building Approvals
Note - building approvals data can vary significantly month-onmonth. NSW building approvals decreased by 1.2% in March but are up by 6.3% relative to 12 months ago. Population Sep Qtr 2023 8,394,7000.6%0.5%2.3%
NSW's population increased by 0.6% during the Sep Qtr of 2023 and has climbed a total of 2.3% during the last 12 months.
The apartment development market remained subdued throughout 2023 in Sydney recording only 8,300 completions (circa one-third of annual supply requirements) and 6,300 apartments launched (-31% below the previous low experienced during the pandemic), highlighting the continuation of an ongoing and aggregating supply deficit. Middle and Outer regions remain prevalent as new supply locations.
Many local buyer segments remain priced out of the market or are holding off making purchase decisions given ongoing market uncertainty. Investor returns have improved given uncharacteristically high and ongoing rental growth, although this incentive has been somewhat offset by the higher cost of funds. Foreign investors remain noticeably absent whilst interstate investors also, for the most part, remain on the sidelines and will likely do so until off the plan incentives are re-introduced.
Building and material cost increases, rising interest rates, further taxes & charges along with limited apartment price growth have seen many projects become financially unfeasible. Whilst median prices have started to recalibrate upwards, growth has been slow and sporadic and accordingly many projects will not proceed under current settings.
The NSW State Government has taken recent initiative and introduced extensive new housing themed planning policies for Metropolitan Sydney, most of which are specifically focused on the increased provision of residential apartment product.
These policies in part respond to the National Housing Accord dwelling target of 1.2 million dwellings endorsed by the National Cabinet (Federal Government) in August 2023 but also seek to start providing an enhanced framework to address the significant and ongoing dwelling supply deficit that shows no sign of self-rectifying by market forces alone.
The NSW Government has committed to the provision of circa 375,000 new dwellings between mid-2024 to 2029 to assist in meeting the National Housing Accord (75,000 dwellings per annum). Three key State planning policy initiatives have been introduced / proposed including the new Transport Oriented Development State Environmental Planning Policy (“TOD SEPP”) with 18 of the Tier 2 rezonings coming into effect on 29 April 2024 (the remainder to be rolled out through to June 2025), the Infill Affordable Housing amendment to the State Environmental Planning Policy (Housing) 2021 (“Housing SEPP”) enacted in December 2023 and thirdly the low to mid-rise housing proposal which is expected mid-2024.
Although the policies will provide notably higher development capacity across varied locations, they do not address the market fundamentals which continue to result in ongoing undersupply. To the contrary, since announcement many developers have instead placed current projects on hold to identify any increased development potential and are wading through the confusion surrounding how the policies interact with each other and existing policy.
If fully delivered, the TOD SEPP and low to mid-rise SEPP would produce less than half of the 375,000 dwelling target over the next five years, highlighting the somewhat unrealistic expectations being faced by the property industry.
Effective collaboration and co-operation is essential between all levels of Government to help deliver significant new supply, but there is already friction between particularly Local and State Government subsequent to the new policy announcements. Resolution of the issues are paramount in the short term.
With the Federal Government Budget announcements on 14 May 2024, income tax cuts and possibilities for increased spending capacity create concerns that upward inflationary pressures may return. Should this be the case it is possible that the Reserve Bank of Australia could raise the cash rate within the back end of 2024. If this were to eventuate there could be a stifling effect in the residential property market after 13 rate rises in recent years. It is now unlikely that rate cuts will occur until 2025.
In light of this, interest rate cuts and increased development capacity through planning policies will collectively not be enough to facilitate delivery of the unprecedented quantum of new apartment supply required to achieve the Federal and State Government aspirational housing targets. Increased collaboration and understanding will also be required between all levels of Government for any opportunity to achieve a notable supply increase.
Current market conditions will continue to test the resolve of many developers and those that are well capitalised, focus on design-led development and project risk mitigation will have the greatest opportunity to achieve successful development outcomes in the short to medium term.
A median house and unit price trend analysis has been completed on the suburbs of Edmondson Park, Bankstown, Campbelltown, Liverpool and additionally Liverpool LGA. This review has been undertaken to identify current pricing parameters, differentials between dwelling typologies and locations along with variations over time. In addition, a sales volume trend analysis has been completed to highlight changes in transaction volumes over time.
The residential property market in Edmondson Park has performed comparatively well over an extended period, demonstrating strong price growth
Median house and unit prices across the review locations indicate notable differences and pricing fluctuation over the last 15 years It is noted that “unit” refers to a townhouse, semi-detached dwelling, flat or apartment (strata titled).
Median price points for both dwelling typologies in each review location are listed below:
Edmondson Park: Median house price: $1,217,000; Median unit price: $672,000
Bankstown: Median house price: $1,204,250; Median unit price: $485,000
Campbelltown: Median house price: $800,000; Median unit price: $512,500
Liverpool: Median house price: $910,000; Median unit price: $480,000
Liverpool LGA: Median house price: $975,000; Median unit price: $450,000
Edmondson Park house and unit pricing reflects a consistent premium above Liverpool LGA and trends as the highest priced house and unit market when compared to the other suburbs reviewed.
The first chart highlights pricing differentials between house and unit pricing for both Edmondson Park and Liverpool LGA, whilst the two charts subsequent separately compare house and unit pricing in Edmondson Park, Liverpool LGA and the three review suburbs (“Study Area”).
Park & Liverpool LGA Median Price Trends
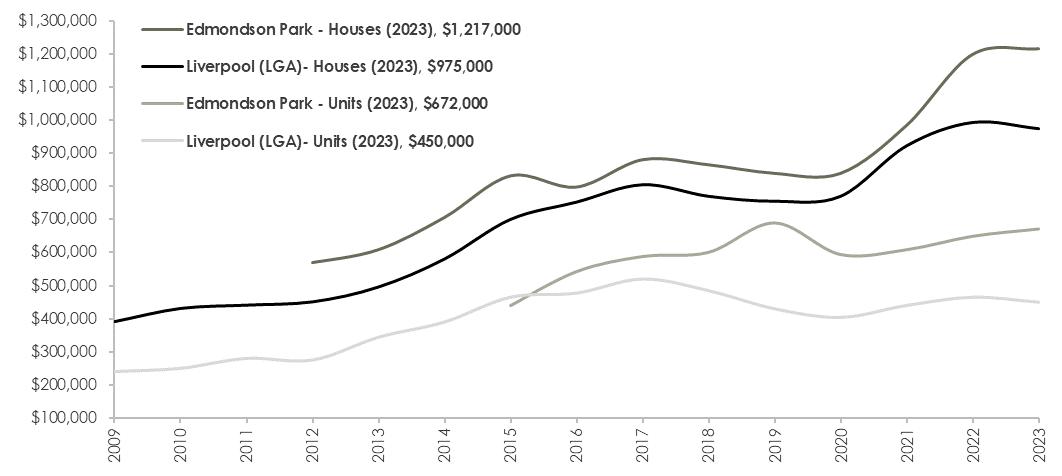
SOURCE - Domain, Charter Keck Cramer
Median House Price Trends
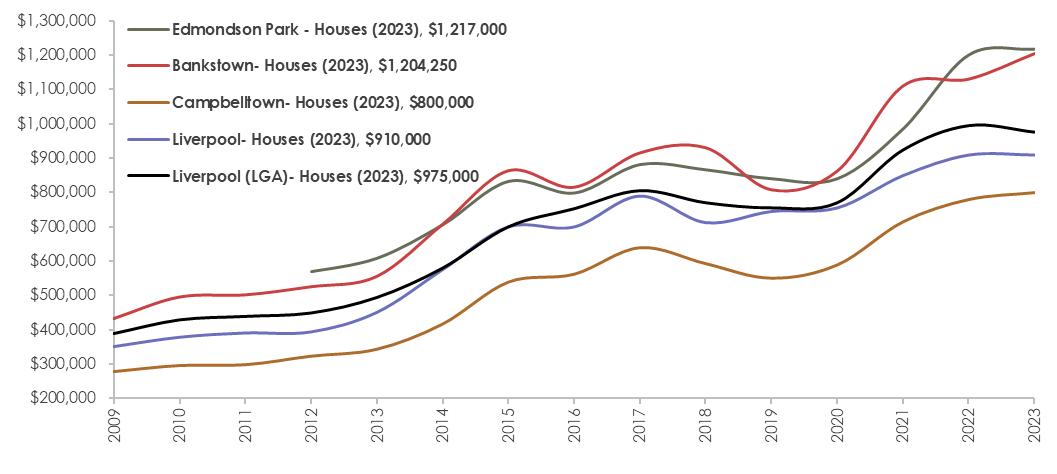
SOURCE - Domain, Charter Keck Cramer
The following observations are noted in relation to house pricing:
Median house prices demonstrated broadly consistent trends and growth patterns across the Study Area Between the commencement of the review period through to 2013 price growth was moderate. Subsequent to this, there was an upswing in median house prices, followed by a period of undulating growth between 2015 and 2020. Over the 24 months to 2022, robust median price increases of between 20.5% (Liverpool) and 42.9% (Edmondson Park) were evident throughout the Study Area Over the last two years, prices have stabilised in the suburbs of Campbelltown and Liverpool as well as Liverpool LGA, however, have continued to grow in Edmondson Park and Bankstown.
Current house prices in Edmondson Park represent the highest median sale price of the four review locations The first sales were recorded in 2012, with prices fluctuating over the remaining duration of the review period. Strong growth was evident between 2020 and 2022, during which median house prices increased 42.9% over the two years. Houses reflect a favourable 10-year compound annual growth rate (“CAGR”) of 7.2%, representing the second lowest CAGR across the review locations. This is considered in part due to the high quantum of greenfield land releases as well as new housing stock introduced throughout Edmondson Park and surrounds over the past circa 15 years, resulting in alternative purchaser choice.
Bankstown house prices in 2023 were marginally below Edmondson Park. Median prices historically trended above all other suburbs reviewed and also demonstrated more pronounced price fluctuations. The 10-year CAGR reflected a strong rate of 8.1%.
Median house price trends in Campbelltown typically demonstrated similar trends to the other review locations, albeit having moderated slightly in 2023. The 10-year CAGR reflected a rate of 8.8% which was the highest rate recorded across the suburbs reviewed. This is off the back of pricing being the lowest in both 2009 through to 2023.
House prices in Liverpool suburb have once again historically exhibited similar growth trends, with pricing typically above Campbelltown and in line with the broader Liverpool LGA. Liverpool suburb recorded a 10-year CAGR of 7.3%, which reflects the third highest rate across the suburbs reviewed.
Liverpool LGA has broadly recorded stable and consistent house price growth, albeit representing the lowest 10-year CAGR of 7.0%.
Of the suburbs reviewed, Campbelltown is the most affordable followed by Liverpool Edmondson Park and Bankstown feature the highest house prices of the review locations all of which have reflected solid 10-year CAGR rates varying between 7.0% and 8.8%.
The chart overleaf highlights price trends for units within each of the five review locations.
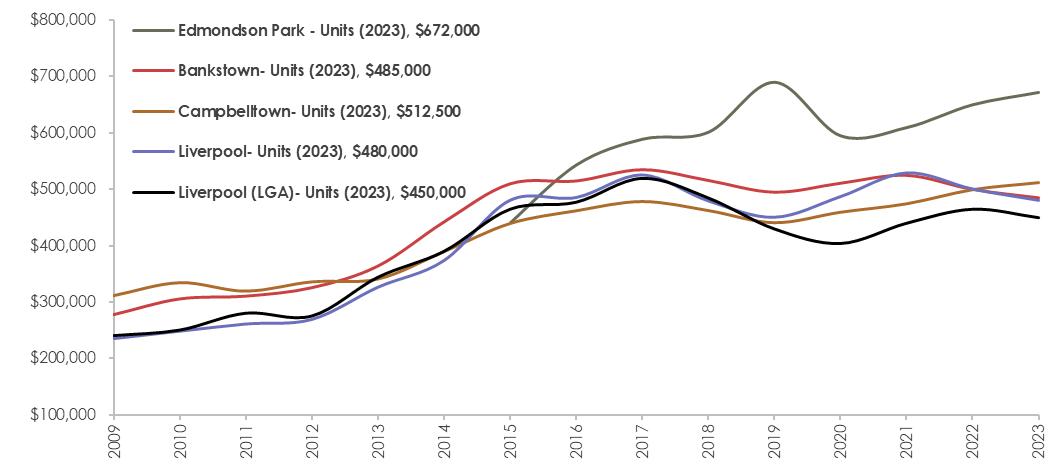
SOURCE - Domain, Charter Keck Cramer
The following observations are noted in relation to unit pricing:
Units offer a more affordable price point which allows potential buyers to enter a housing market that they otherwise would have been priced out of. This trade-off is occurring more frequently due to affordability constraints as well as the better-quality units being delivered.
Median unit prices in Edmondson Park were first recorded in 2015 (greater than 10 sales) being the timeframe when such product was introduced. Pricing has since fluctuated, reflecting robust growth between 2015 and 2019, followed by a dip in the market which continued over the 12 months to 2020. Pricing has since stabilised, reflecting moderate and consistent price growth since 2020. Current pricing indicates a 181% premium in house prices compared to unit prices having varied between 122% (2019) and 189% (2015). Given sales commenced in 2015, an 8-year CAGR has been adopted. Units in Edmonson Park have averaged a favourable growth rate of 5.4% p.a. over the past eight years.
Median unit price trends in Bankstown reflected minimal growth between 2009 to 2012, followed by a five-year period of consecutive strong growth. During this period, median prices increased 64.4% from $325,000 in 2012, peaking at $535,000 in 2017. Pricing has since reduced, recording a median of $485,000 in 2023 Over the last decade, the CAGR has averaged 2.9%. House prices in Bankstown are currently 248% higher than unit prices, being the most significant price differential across the study area. The price differential has remained above 150% since 2009, widening to more than 200% over the past three years.
Campbelltown is the second highest priced unit market across the suburbs reviewed, although remains $159,500 less than Edmondson Park. Unit prices recorded modest growth between 2009 and 2013, accelerating in the mid-2010s, prior to moderating over the last seven years. Current median pricing at $512,500 reflects the highest median price for units in Campbelltown observed over the review period. Next to Edmondson Park, Campbelltown has the highest longer term CAGR at 4.1%. Currently, houses are almost 156% more expensive than units, reflecting the widest price gap over the last 15 years within the Campbeltown market.
Liverpool suburb is the most affordable of the review suburbs Pricing has trended in line with the broader Liverpool LGA, having shown minimal growth between 2009 to 2012, followed by an upswing in the mid-2010s. A dip in median unit pricing was evident between 2017 to 2019 followed by a recovery after which median prices peaked at $528,500 in 2021. Over the last two years, prices have decreased, reflecting a median price of $500,000 in 2022 and $480,000 in 2023. At 3.9%, the 10-year CAGR of units represents the second highest rate recorded across the study area. The median house price is currently 190% higher than the median unit price. Since 2009, the price differential varied between 138% and 190% having widened in excess of 150% since 2019.
Unit prices across Liverpool LGA broadly trended upward between 2009 and 2017, with the strongest growth period evident in the mid 2010s, peaking at $520,000 in 2017. More recently, median unit prices have trended downward and are currently circa $70,000 less than the peak pricing in 2017.
It is evident that there is a notable and widening price differential between houses and units within the review locations. This is highlighted by the significantly higher 10-year CAGR evident for houses when compared with units. This indicates that units are by far the most affordable dwelling option. Both houses and units in Edmondson Park are amongst the highest priced when compared to the other three suburbs reviewed
4.5 Sale Volume Trends
Transaction volumes for each dwelling typology within the study locations are highlighted in the chart below
Sale Volume Trends – Houses
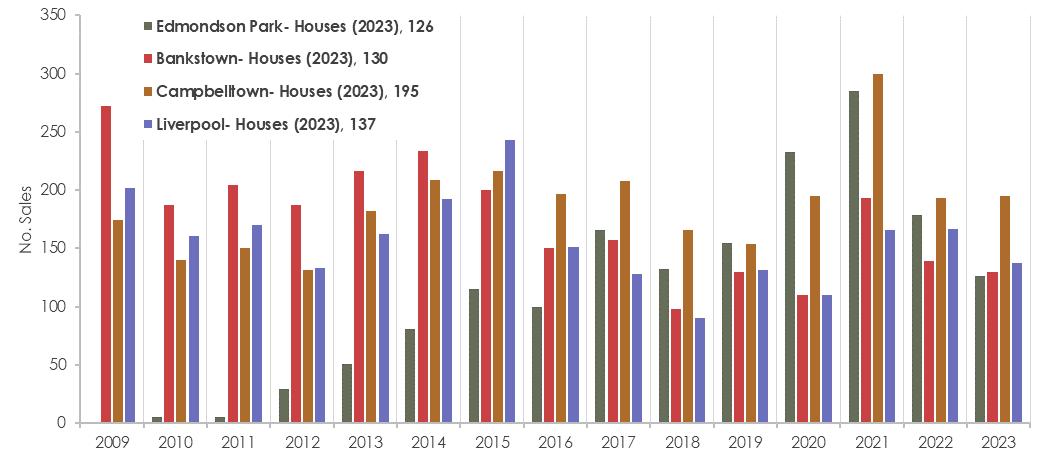
SOURCE - Domain, Charter Keck Cramer
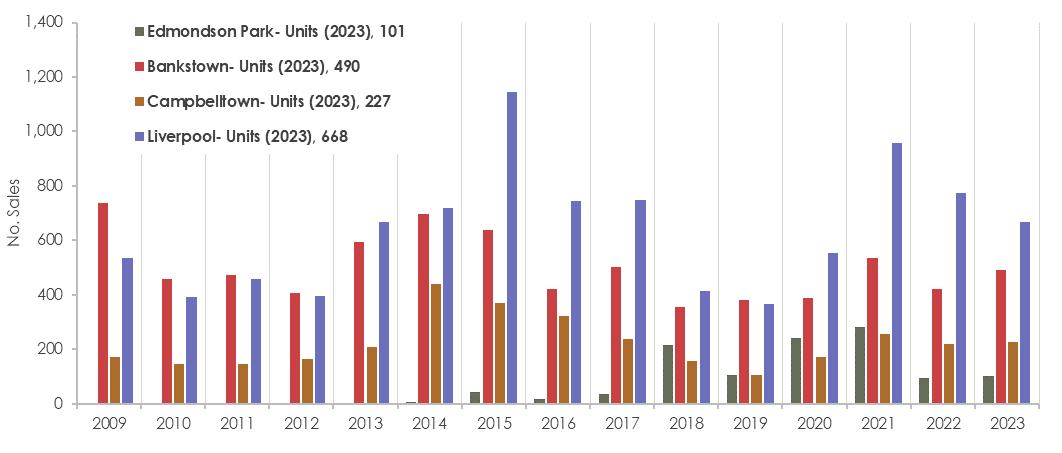
The following observations are noted in relation to transaction volumes:
Over the past 15 years, units have typically reflected the majority of sales within each suburb reviewed, given the centralised location and increased focus on high density development Currently, the sales volume of units in Liverpool, Bankstown and Campbelltown exceeds houses, whilst house and unit sales have become broadly similar in Edmondson Park.
The number of houses sold in Edmondson Park over the study period has varied between 0 (2009) and 285 (2021), averaging 119 sales per annum. The market was most active between 2020 and 2021, averaging 259 sales per annum. Unit sales in Edmondson Park were first recorded in 2014, totaling six sales that year. The highest number of sales recorded over a year occurred in 2021 at 280 sales. The majority of activity occurred between 2020 and 2021, with sales volumes averaging 260 sales per annum during this period.
The sales volume trends for units have consistently exceeded the annual sales volume of houses in Bankstown. House sales have ranged between 98 (2018) and 272 (2009), averaging 174 sales per annum whilst unit sales have ranged between 355 (2018) and 738 (2009), averaging 500 sales per annum. Fluctuations are evident in the sales volume of units, with most sales occurring between 2013 and 2015, averaging 642 sales per annum. In contrast, the sales volume for houses peaked in 2009, averaging less than 170 sales thereafter.
Transaction volume trends in Campbelltown were broadly consistent across the typologies between 2009 and 2013, averaging 155 house sales and 166 unit sales over the five year period. This was followed by a significant influx of unit sales between 2014 and 2016, averaging 377 sales per annum There has since been consistency in volume trends, albeit fluctuating in response to market factors. Overall, the number of houses sold throughout the review period has varied between 131 (2012) and 300 (2021), averaging 187 sales per annum. Sales volumes of units have ranged between 106 (2019) and 439 (2014), averaging 222 sales per annum.
Throughout the review period, the number of units sold per annum has consistently exceeded the annual sales volume of houses in Liverpool suburb. House sales have ranged between 90 (2018) and 243 (2015), averaging 156 sales per annum whilst unit sales have ranged between 364 (2019) and 1,146 (2015), averaging 635 sales per annum. The number of unit sales have fluctuated over the review period, with the most activity occurring between 2013 and 2017, averaging 805 sales per annum. The quantum of units sold halved over the following three years, averaging circa 400 sales per annum between 2018 and 2020, followed by a significant influx in sales in 2021 (958 sales). Sales activity has since moderated, with 668 sales recorded in 2023.
Overall, transaction volumes for both houses and units in 2023 moderated to the long-term averages.
The following analysis has been completed to identify residential rental market and investment yield characteristics of the local Edmondson Park market:
Review of historic median rental prices for houses, townhouses and apartments identifying price trends over time and differentials between typologies. This includes a review of one, two and three-bedroom typologies (as available).
An analysis has been completed on new rental bond trends to identify the quantum of rental stock and most prevalent rental typologies over time.
Current rental pricing expectations for houses, townhouses and apartments. This includes a range of one, two and threebedroom typologies (as available).
Review of indicative extrapolated investment yield trends for two-bedroom units since 2020 (timing based on data availability)
Vacancy rates and trends for Edmondson Park.
To assist in identifying rental price and volume trends, an analysis has been completed on one, two and three-bedroom rental properties. This has included a review of house, townhouse and apartment dwelling typologies to identify differentials in price points and highlight the most active rental property types.
The rental trend analysis has been completed over the past five-year period (2019 to 2023) and has included a focussed review on both Edmondson Park and Liverpool LGA. Quarterly rental data is available at postcode level which for Edmondson Park is postcode 2714. This postcode broadly aligns with Edmondson Park state suburb boundaries.
The table overleaf indicates median rents for houses, townhouses and apartments on a quarterly basis having regard to new rental bonds lodged throughout Edmondson Park (postcode 2714). The following key takeouts are evident with regards to rental volumes:
Over the review period, the number of new bonds lodged for houses and townhouses have averaged less than 10 new bonds per quarter indicating very modest rental activity for these dwelling typologies
One and two-bedroom apartments represent the highest number of rental properties even though there remains a limited content within Edmondson Park. The number of one and two-bedroom rentals often range between 10 to 30 new bonds per quarter. Rental volumes for these typologies have shown an increase post Q3 2020 as the volume of stock has increased within the area
Three-bedroom apartments have averaged less than 10 new bonds per quarter given the limited availability of this rental typology.
The following key takeouts are evident with regards to rental pricing:
There is overall a limited sample of rentals across all typologies, albeit, since Q2 2023, two-bedroom apartments have reflected a premium over two-bedroom houses. This is in contrast to three-bedroom houses which in Q 2023 showed a premium over three-bedroom apartments although it is noted that there has been very limited three-bedroom apartment rental activity.
Rents have overall reflected price increases over the review period based on the limited localised data available.
Edmondson Park (Postcode 2174) Rental Price & New Bond Trends (Quarterly 2019 to 2023)
Date House
Edmondson Park, NSW
Specific to apartments, the chart below tracks rental trends of one and two-bedroom apartments in Edmondson Park from the September 2020 quarter onwards, coinciding with the introduction of more localised rental stock. For the purposes of the chart, rental movements have been extrapolated with a dashed line where data was not available. It is noted that the were no three-bedroom apartment rentals recorded over this time period (less than 10 rentals per quarter). The below chart indicates initial price fluctuations from September 2020 through December 2021 for two-bedroom apartments. This is followed by consistent strong price growth equating to $170 per week (35.4%) over two years to December 2023 Onebedroom apartments also indicate an upward trend, albeit with a less uniform trajectory given a smaller quantum of rentals. Between December 2021 and December 2023, rents for one-bedroom apartments in Edmondson Park increased by $100 (23.3%).
Edmondson Park Apartment Rental Price Trends - All Bedroom Comparison (2020 to 2023)
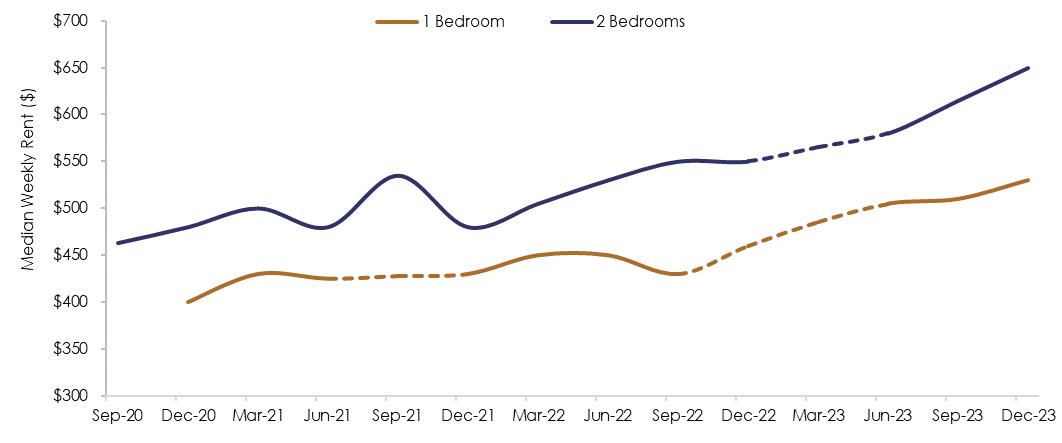
* Note: Rental pricing has been extrapolated for periods where there were insufficient rentals, shown with dotted lines in the chart
SOURCE - NSW Department of Communities & Justice, Charter Keck Cramer
Given the finite number of rentals recorded in Edmondson Park, an additional review has been completed on Liverpool LGA to provide a more complete trend profile. The table overleaf indicates median rents for houses, townhouses and apartments on a quarterly basis over the past five years based on new rental bonds lodged throughout Liverpool LGA.
The following key takeouts are evident with regards to rental volumes:
Two-bedroom apartments represent the highest number of rental properties available with 4,157 out of 7,536 total apartments currently held as rentals (55.2%). The number of two-bedroom rentals has averaged circa 428 per quarter (“/ qtr”) over the past five years, ranging from 335 / qtr to 521 / qtr.
Houses are the dominant dwelling typology in Liverpool LGA and as such most rental activity is for houses (50.4% of all rental activity). Most house rentals feature three bedrooms with circa 42.4% of all private rental houses in Liverpool LGA accommodating three bedrooms (3,385 dwellings). Three-bedroom house rental bonds lodged over the past five years have ranged from 207 to 366 / qtr, averaging circa 291 new bonds / qtr Average quarterly bond lodgments for the remaining one and two-bedroom house stock is significantly less, respectively accounting for less than 30 / qtr and 79 / qtr.
One-bedroom apartments represent the third most active rental typology, averaging 128 new bonds / qtr, having ranged between 97 to 160 new bonds / qtr over the review period. Despite representing only 13.3% of total apartment stock, almost half (712 one-bedroom apartments) are rental properties Likewise, despite only representing 13.7% of all apartments, a total of 724 (46.7%) of three-bedroom apartments are held as rental properties, averaging 56 new bonds / qtr.
With regards to townhouses, the most active market for rentals are three-bedroom typologies. Despite only accounting for an average of 56 new bonds / qtr, three-bedroom townhouses represent the third highest number of rental dwellings available. On average, there were less than 30 new rental bonds per quarter for two-bedroom townhouses
The following key takeouts are evident with regards to rental pricing:
Median quarterly rents for two and three-bedroom townhouses have broadly shown a premium throughout the review period, albeit as at December 2023, rental pricing was the same across all three-bedroom typologies.
Although typically worth a lower amount from a purchase price perspective, two and three-bedroom apartments reflect a slight price premium over houses.
Liverpool LGA Rental Price & New Bond Trends (Quarterly 2019 to 2023)
The chart below provides a comparison of quarterly median price trends for one-bedroom apartment rentals between 2019 and 2023 in Liverpool LGA It is noted there were no one-bedroom townhouses and sporadic rental data for houses available, thus being excluded from the chart Rents for one-bedroom apartments remained relatively consistent between December 2019 to December 2021. This was followed by a period of strong growth with rents peaking in September 2023 at $450 per week, reflecting a 28.6% increase on December 2021 prices. Over the 2023 December quarter, rents remained unchanged and were in line with peak pricing at $450 p.w.
All Typology Comparison (2019 to 2023)
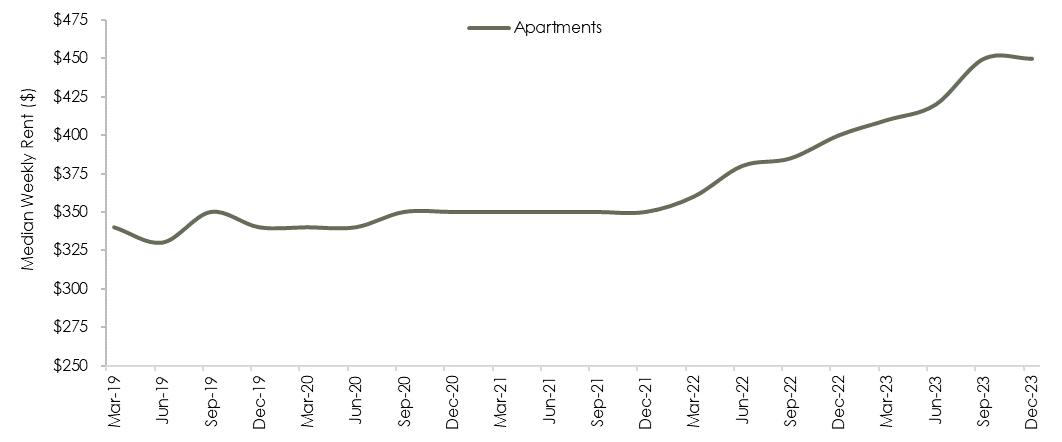
SOURCE - NSW Department of Communities & Justice, Charter Keck Cramer
Two-bedroom dwellings are represented across all three typologies with rents having broadly shown undulating growth over the past five years. Townhouses have historically reflected the highest rental prices although trends have fluctuated notably. Over the past 24 months, rental prices across all typologies have shown significant growth. Specifically, rental prices for two-bedroom houses have increased 29.9%, 31.0% for townhouses and 35.9% for apartments over the two years
All Typology Comparison (2019 to 2023)
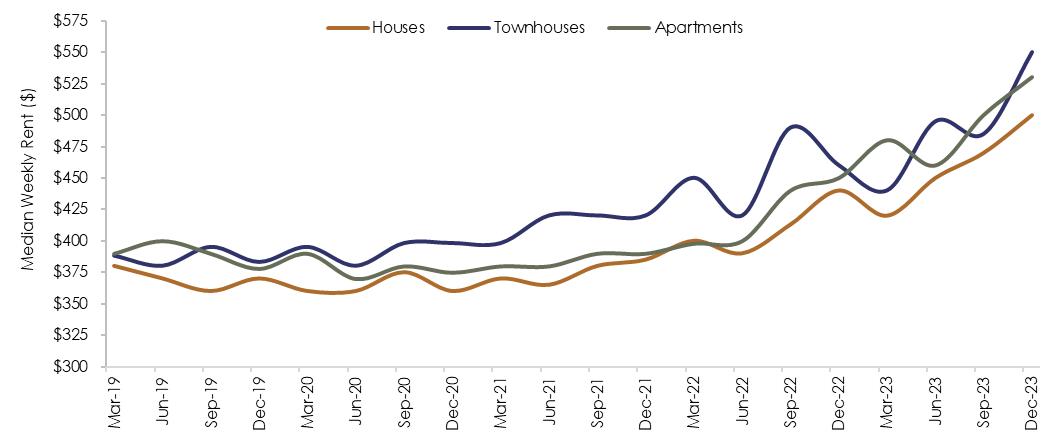
SOURCE - NSW Department of Communities & Justice, Charter Keck Cramer
Three-bedroom houses and townhouses represent the most active rental markets with apartments the least active category. Townhouses have reflected a premium above houses and apartments with all featuring undulating growth throughout the review period. Similar to apartment and house price trends, strong price growth ensued post December
2021. Over the 24 months to December 2023, three-bedroom dwelling rents have increased 30.0% for houses, 28.7% for townhouses and 36.0% for apartments with all now similarly priced
Liverpool LGA Three-Bedroom Rental Price Trends - All Typology Comparison (2019 to 2023)
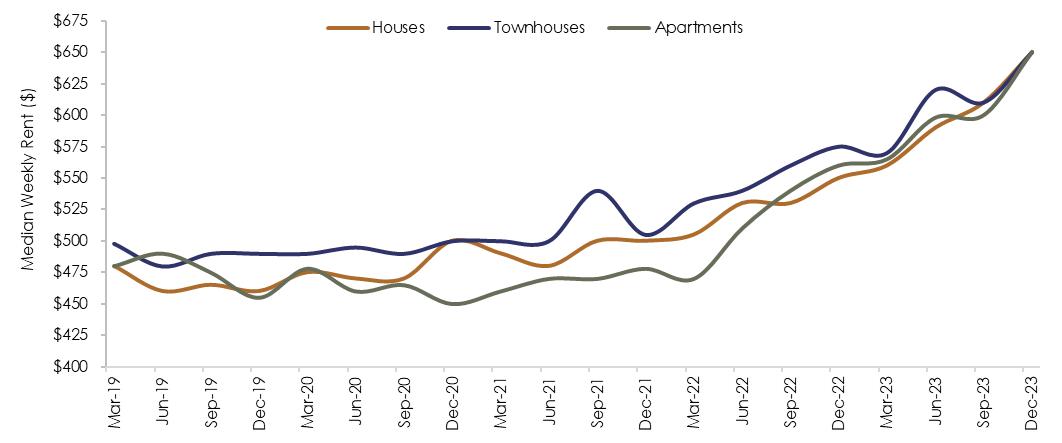
SOURCE - NSW Department of Communities & Justice, Charter Keck Cramer
As an additional point of comparison, a chart has been prepared to highlight comparative trends between two-bedroom apartments within Edmondson Park, Liverpool suburb and the Sydney Metropolitan Area (“Review Locations”) Twobedroom apartments have been selected being the most prevalent investment typology.
Two-Bedroom Apartment Rental Trend Comparison – Edmondson Park, Liverpool & Metro Sydney (2020 to 2023)
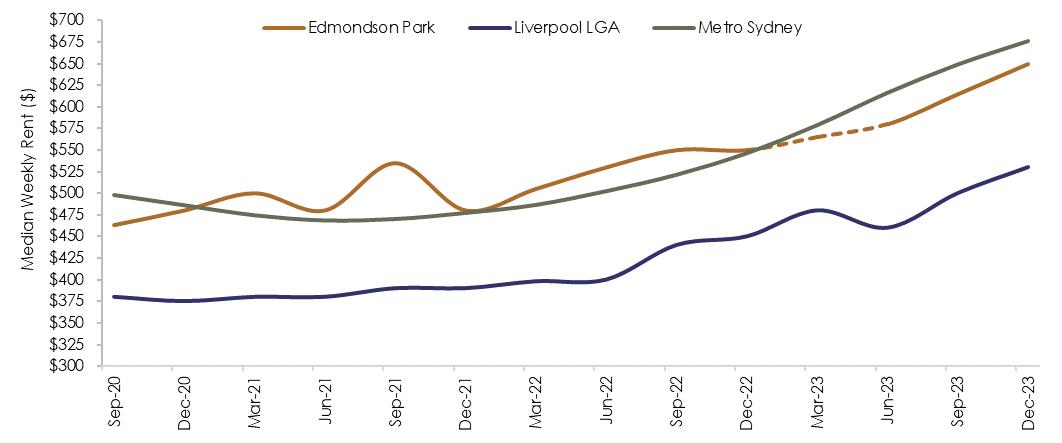
SOURCE - NSW Department of Communities & Justice, SQM Research, Charter Keck Cramer
Two-bedroom rents across the Review Locations have shown broadly similar rental trends, albeit Edmondson Park has expectantly shown greater price fluctuations due to a smaller sample of rental properties. The rate of rental price growth has shown notable increases across the Review Locations, with rental prices recorded in December 2023 between 18% to 26% higher than price recorded in June 2022. Two-bedroom apartment rental pricing in Edmondson Park reflected a premium above Metro Sydney between December 2020 and December 2022, after which rents have trended slightly higher in Metro Sydney. Rental pricing in Edmondson Park has consistently recorded a notable premium when compared to Liverpool LGA. This is considered a result of the proportionately higher content of new and better-quality stock in Edmondson Park.
To provide an indication of current market pricing expectations within Edmondson Park and surrounds, an extensive review has been completed on one, two and three-bedroom dwellings currently available for rent. This has included review of apartment, townhouse and house typologies.
The review has typically focused on new and contemporary accommodation although more established stock has been considered where this is limited overall rental supply. All rentals are shown on a weekly unfurnished basis with the following summary table highlighting current price ranges.
Edmondson Park Current Rental Pricing Expectations Summary Dwelling
Apartments One-Bedroom
Three-Bedroom
Townhouses
One-Bedroom*
Two-Bedroom*
Three-Bedroom
Houses
One-Bedroom
Two-Bedroom
Three-Bedroom
*Includes Granny Flats.
Based on current listings, rental price expectations per week for apartments in Edmondson Park reflect a premium when compared to houses and townhouses. This is considered a result of limited rental stock availability of houses and townhouses as well as renter living preferences favouring apartments (close proximity to retail and public transport as well as amenity inclusions)
It is noted that with ongoing low vacancy there are currently few rental listings in Edmondson Park At the time of reporting there were limited two-bedroom houses and one-bedroom townhouses available for rent given the limited supply of this typology
As an additional point of comparison, the table below highlights recent rental price points for one, two and three bedroom apartments (as available) in both Edmondson Park and Liverpool LGA based on new rental bonds lodged in the December quarter of 2023. This data includes first quartile, median and third quartile price points.
Edmondson Park & Liverpool LGA Apartment Rental Pricing Summary
Location
Edmondson Park (2174)
One-Bedroom
Three-Bedroom
Liverpool LGA
SOURCE - NSW Department of Communities & Justice, Charter Keck Cramer
It is evident that rental price points within Edmondson Park exceed those in Liverpool LGA for one and two-bedroom apartments. No pricing was available for new three-bedroom apartment rentals in Edmondson Park reflecting limited supply of this typology. It is anticipated however that any three-bedroom rentals would exceed broader Liverpool LGA price points.
Most investment related activity in Edmondson Park relates to apartments. This is considered a result of apartments offering a more affordable price point to purchasers coupled with broadly similar rental returns to houses thus increasing the quantum of apartment investment properties.
Given the relatively emerging nature of the apartment and medium density housing markets in Edmondson Park, there is a limited amount of data available to identify investment yields. This is particularly the case for one and three-bedroom apartments. Accordingly, our review has focused primarily on gross investment yield trends for two-bedroom apartments which are the most rented and traded investment product.
Available rental and sales data for two-bedroom apartments has been analysed since data became consistently available (mid-2020) to highlight median rental trends and extrapolated investment yields.
The chart overleaf highlights rental and investment yield trends for two-bedroom apartments in Edmondson Park from September 2020 to December 2023.
Between September 2020 and December 2021, price trends for median two-bedroom apartment displayed undulating growth, given a mix of new supply and issues associated with the COVID-19 pandemic. From December 2021 onwards rents have increased considerably for two-bedroom apartments (35.4%). This growth in rental pricing coincides with affordability issues to purchase property given 13 cash rate rises along with ongoing reductions in vacancy.
Apartment investment yields have broadly fluctuated throughout the review period although have typically tracked in an upward direction. The average two-bedroom gross apartment yield between September 2020 and December 2023 reflects 4.4% having started at 4.0% and increasing over the 3 ¼ year period to 4.8%.
Yield growth has been somewhat moderated by ongoing capital growth however the local market is in a somewhat unusual (but favourable) position where rents, yields and purchase prices are all consecutively increasing. This is considered beneficial to owner occupiers and investors alike.
Median Apartment Rents & Investment Yields (Two-Bedroom) – Edmondson Park / Postcode 2174 (2020 – 2023)

SOURCE - Corelogic, Charter Keck Cramer
A review of historic residential vacancy has been completed in Edmondson Park to highlight trends in the vacancy rate and the number of vacant dwellings. The vacancy data relates to all dwelling types although the statistics primarily relate to houses being the most prevalent dwelling typology in the area. Postcode 2174 has been analysed for the vacancy data which broadly corresponds to Edmondson Park suburb boundaries.
The chart below highlights vacancy trends between January 2005 and March 2024 Between 2005 and 2015 there was very limited residential stock in Edmondson Park with much of the land remaining in a rural residential format (prior to subdivision and release of new land estates).
From 2015 onwards, significant new residential development was undertaken notably increasing local dwelling supply. With greater supply came more definable vacancy trends with the number of vacant premises initially increasing from only 2 vacancies in June 2015 (1.5% vacancy rate) up to 50 vacancies in December 2018 (8.1%). From 2019 onwards, the number of vacant premises have generally trended downwards (albeit with fluctuations) which is in keeping with an ongoing
reduction in the vacancy rate. It is important to note that this reduction has coincided with increased supply additions which perhaps understates the level of rental take-up.
As at March 2024 the vacancy rate is 2 0% which continues the low trend resulting from the broader strength of the rental market (notable rental price increases and ongoing high demand)
The chart below highlights vacancy rate trends between 2005 and the 2024 (to April 2024).
Rate Trends – Edmondson Park / Postcode 2174 (2005 – 2024)
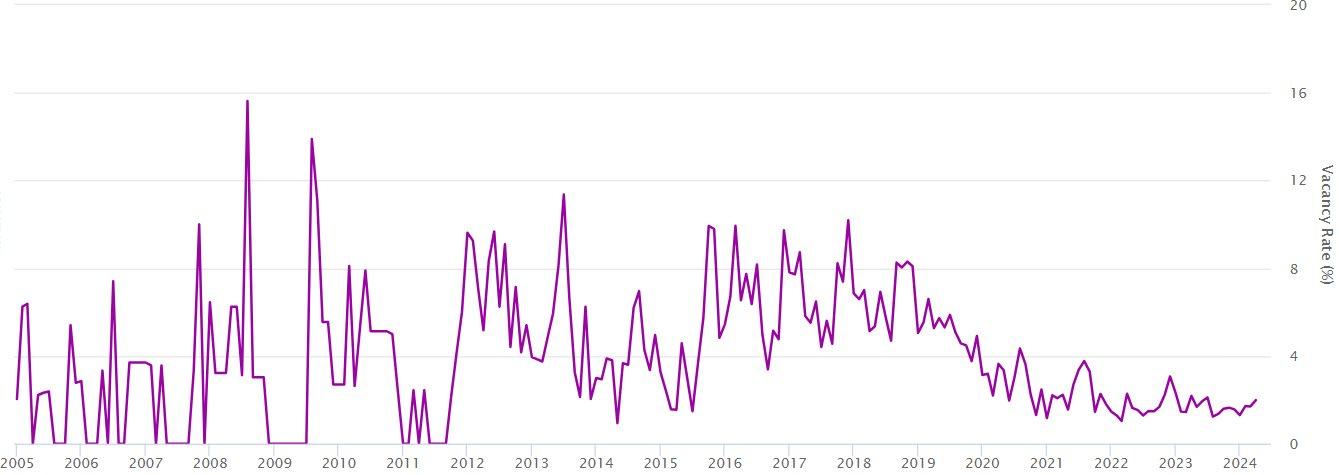
SOURCE - SQM Research
6.1
A comprehensive analysis has been completed on historic and proposed localised Build to Sell (“BTS”) and Build to Rent (“BTR”) apartment supply since 2009. The suburbs reviewed include Edmondson Park, Austral, Bankstown, Campbeltown, Denham Court, Gledswood Hills, Leppington and Liverpool (“Study Area”).
A historic review of completed apartment projects,
A review of projects currently marketed, under construction,
Identification of longer-term potential future apartment supply of including projects that have planning approval, are at application stage or are mooted, as well as,
An itemised review at a Study Area level of proposed residential apartment projects.
A review of Build to Sell (“BTS”) and Build to Rent (“BTR”) apartment projects has been completed within the Study Area from 2009 to date along with proposed future supply.
Apartment supply within the Study Area has increased considerably throughout the review period although more recently, completions have been tempered as result of high building and land costs and broader market related factors such as high interest rates and low purchaser sentiment. Since 2009 the Study Area has recorded 9,462 apartment completions (including 9,003 BTS apartments and 459 BTR apartments) at an average annual completion count of 631 throughout this period.
There were initially relatively subdued completions through 2009 and the early 2010s however the study region recorded strong annual supply between 2017 to 2020 with approximately 53.5% of its post 2009 supply completed in this period. This represented an average annual completion rate of around 1,265 apartments across this period.
Peak annual supply across the study region was recorded in 2019 with 1,765 apartment completions. This was primarily driven by strong completions in Liverpool (1,138 apartments) and Bankstown (328 apartments). Annual supply has moderated since 2021, although remained in keeping with 2015 supply levels, averaging 738 completion per annum over the last three years.
Notable new supply has been provided in the key centres of Liverpool, Bankstown and Campbelltown since 2009, with new supply completions in Edmondson Park from 2017 onwards. Edmondson Park town centre has become a focal point over the past 10 years for new residential apartment development. This is in part due to the opening of Edmondson Park train station and far superior accessibility. The development of Ed.Square opposite the train station has also been key to the introduction and market acceptance of localised apartment product. In this regard, there is considerable new apartment supply proposed within Edmondson Park. There has been no historical apartment completions in Austral, Gledswood Hills and Leppington.
The following apartment completion statistics are evident across the key centres and Edmondson Park:
Liverpool: 4,246 BTS and BTR apartments across 65 projects / stages (average of 65 apartments per project) with peak supply in 2019.
Bankstown: 2,475 BTS apartments across 46 projects / stages (average of 54 apartments per project) with peak supply in 2023.
Campbelltown: 1,743 BTS apartments across 34 projects / stages (average of 51 apartments per project) with peak supply in 2016.
Edmondson Park: 998 BTS apartments across 15 projects / stages (average of 67 apartments per project) with peak supply in 2022.
We note the following key observations in relation to future supply over the medium-term:
There are limited forecast completions over the next two years with only 11 apartments due to be completed in 2024 (one project currently Under Construction), and 30 in 2025 (one project currently Marketed).
The number of forecast completions increases to 617 apartments in 2026, of which 82% of the stock is concentrated in two projects located in Liverpool, including “Illoura Place” (312 BTR Apartments) and “The Liverpool” (138 BTS Apartments).
Five out of the six projects due for completion in 2026 are currently Marketed and one is Approved.
The chart overleaf highlights the quantum of new BTS and BTR supply from 2009 to 2026
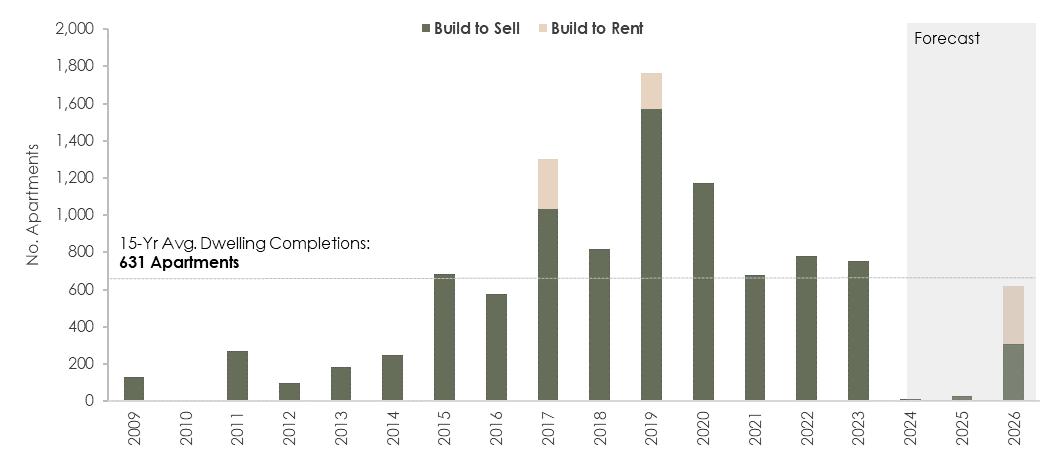
SOURCE - Charter Keck Cramer
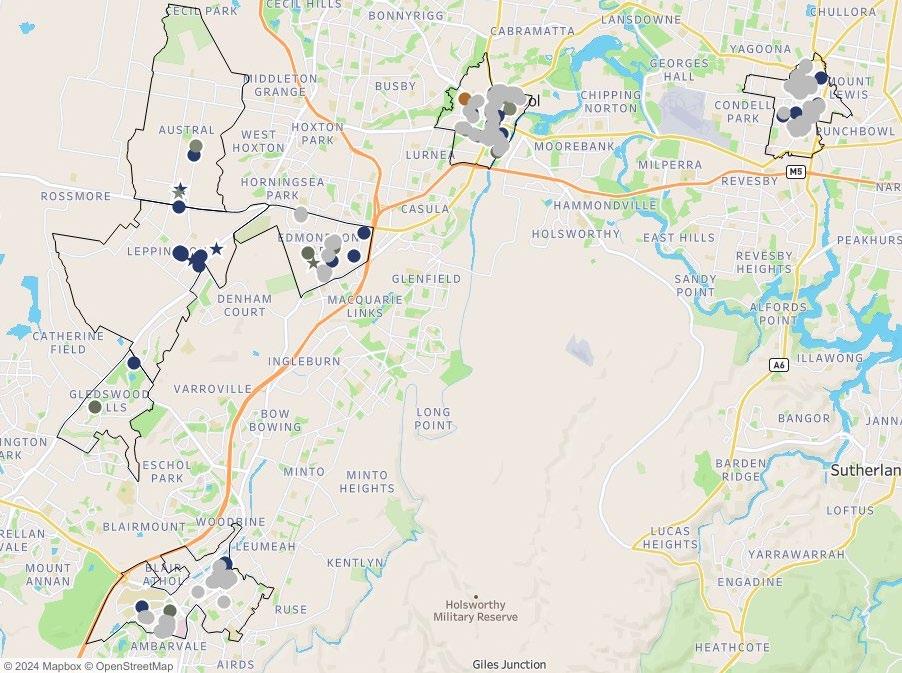
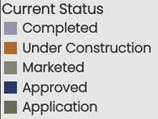
The map below contextualises the assessed suburbs within the Study Area to highlight the geographic distribution of locally competing contemporary apartment supply and proximity to Edmondson Park. This includes projects that have been completed since 2009, are currently under construction, are being actively marketed, have approval or are at development application stage.
SOURCE - Charter Keck Cramer


It is also important to understand the longer-term potential future supply of apartments (apartments that have planning approval, are at the application stage or are mooted) throughout the Study Area. A total of 65 potential future projects have been identified with key findings as follows:
Whilst new apartment supply has moderated from 2020 onwards, there are currently 5,053 apartments Approved throughout the Study Area, including 4,699 BTS and 354 BTR apartments. This spans across 35 projects with yields ranging from 8 to 1,250 apartments (average of 144 apartments).
The largest project (comprising 1,250 residential apartments) is the Macarthur Gardens North project which is proposed to include a potential mix of studio, one-, two- and three-bedroom apartments including circa 5% - 10% affordable housing. The apartments are to be constructed within buildings offering up to nine storeys and the precinct will feature a civic plaza, public open space, 11 hectares of parkland and recreational space for sports / leisure.
Additional notable projects of scale include 598 apartments by Bathla Group located at 164-170 Croatia Avenue in Edmondson Park. The project is proposed across four stages and includes nine buildings ranging from four to nine storeys, 1,290 sq.m. of retail and 5,880 sq.m. of communal space. Other projects include, 312 apartments approved at 28 Elizabeth Street in Liverpool, 264 apartments at 77 - 79 Bathurst Street in Liverpool and 242 apartments at 307-313 Bringelly Road, Leppington.
There are an additional 2,241 BTS apartments at the Application stage across 9 projects / stages. Project dwelling yields range from 30 to 761 units, with an average project size of 249 apartments indicating a greater focus on larger scale projects and masterplanned precincts which have become more desirable to prospective purchasers / residents.
The largest project (comprising circa 761 apartments) is AV Jennings’ proposal at 1 Bugden Place, Campbelltown. The proposed masterplan precinct includes eight mixed-use buildings ranging from six to 15 storeys, inclusive of a neighbourhood shop and cafés.
In addition to the above, another 1,039 BTS apartments across additional projects are mooted throughout the region.
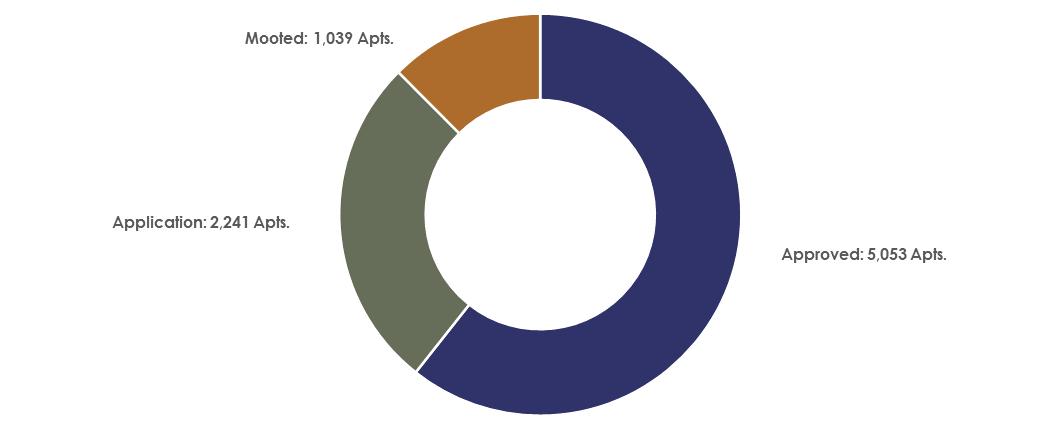
SOURCE - Charter Keck Cramer
6.4 Future Supply
The table overleaf provides an itemised review of key projects across the Study Area including projects “Under Construction”, “Marketed”, “Approved” in the “Application” stage of the development process of “Mooted”
Details of each project are as reported by Cordell Connect with regard to information provided directly by marketing agencies, online sources and Charter’s apartment database. It is noted that the estimated completion timing should be construed as a guide only given the various and ongoing impacts of the COVID-19 pandemic along with broader market considerations (interest rate increases, significant construction cost escalations, deferred projects, planning approval delays, extensive planning policy changes etc).
The subject project is not included within the review list.
Future Supply - Build to Sell and Build to Rent
Project Name Project Address
Dwelling Yield
Project Stage Project Status BTS BTR
Project Timing Developer
"23 - 25 Roslyn Street" 23 - 25 Roslyn Street, Liverpool 11 - Q4-2024 David MK Limited Under Construction Commenced
"185 Fifth Avenue" 185 Fifth Avenue, Austral 30 - Q4-2025 Unknown Marketed Firm
"Annapurna" 260 Edmondson Avenue, Austral 44 - Q1-2026 Lavish Construction & Development Marketed Firm
"23 George Street" 23 George Street, Liverpool 36 - Q1-2026 M & M Prpic Marketed Firm
"15 - 17 Frangipane Avenue" 15 - 17 Frangipane Avenue, Liverpool 32 - Q1-2026 PNC Pty Ltd Marketed Firm
"Illoura Place" 28 Elizabeth Street, Liverpool - 312 Q3-2026 Aware Super Approved Possible
"The Liverpool by FYVE" 22 - 26 Elizabeth Street, Liverpool 193 - Q4-2026 FYVE Developments Marketed Firm
"11 Ingleburn Road" 11 Ingleburn Road, Leppington 100 - Q1-2027 The Bathla Group Approved Possible
"13 - 15 Bathurst Street" 13 - 15 Bathurst Street, Liverpool 50 - Q1-2027 Zhinar Architects Marketed Firm
"50D Raby Road" 50D Raby Road, Gledswood Hills 90 - Q1-2027 Sekisui House Approved Possible
"20 East Terrace" 20 East Terrace, Bankstown 20 - Q1-2027 Unknown Approved Possible
"Ingleburn Lots 13" 27 Ingleburn Road, Leppington 307 - Q1-2027 Balintore Developments Approved Deferred
"39 - 41 Chertsey Avenue" 39 - 41 Chertsey Avenue, Bankstown 38 - Q1-2027 Unknown Approved Possible
"Changsha Road" Changsha Road, Edmondson Park 40 - Q2-2027 Unknown Approved Possible
"225 Croatia Avenue" 225 Croatia Avenue, Edmondson Park 219 - Q3-2027 The Bathla Group Application Possible
"7 - 13 Norfolk Street" 7 - 13 Norfolk Street, Liverpool 129 - Q3-2027 Eagle Homes Approved Possible
"77 - 79 Bathurst Street" 77 - 79 Bathurst Street, Liverpool 264 - Q3-2027 Il Capitano Investments Approved Deferred
"Gledswood Village Precinct" 1 - 9 Providence Drive, Gledswood Hills 358 - Q1-2029 United Development Management Application Possible
"Apartments" Buchan Avenue, Edmondson Park 131 - Q1-2029 Urban Property Group Application Possible
"Further Stages" Faulkner Walk, Edmondson Park 226 - Q4-2029 Urban Property Group Application Possible
"226 Chapel Road South" 226 Chapel Road South, Bankstown 37 - Q1-2030 Unknown Approved Possible
"47 Ingleburn Road" 47 Ingleburn Road, Leppington 63 - Q1-2030 Unknown Approved Possible
"Queen Street Towers A-E" 21 - 32 Queen Street, Campbelltown 427 - Q2-2030 Aland Approved Possible
"48 Speed Street" 48 Speed Street, Liverpool 17 - Q2-2030 St George Building Approved Possible
"164 - 170 Croatia Avenue" 164 - 170 Croatia Avenue, Edmondson Park 598 - Q2-2030 The Bathla Group Approved Possible
"1 Bugden Place" 1 Bugden Place, Campbelltown 761 - Q3-2030 AV Jennings Application Possible
"31 - 33 Shepherd Street" 31 - 33 Shepherd Street, Liverpool 341 - Q4-2031 Unknown Application Possible
"MacArthur Gardens North" Goldsmith Avenue, Campbelltown 1,250 - TBC Landcom Approved Possible
“Ingleburn Stage 2-3” 119 - 120 Ingleburn Road, Leppington 496 - TBC Topwei One Mooted Possible
“431 Macquarie Street” 431 Macquarie Street, Liverpool 400 - TBC Unknown Mooted Possible
Project Name Project Address
Dwelling Yield
Project Timing Developer Project Stage Project Status BTS BTR
"307 - 313 Bringelly Road" 307 - 313 Bringelly Road, Leppington 242 -
"76 Rickard Buildings A-F" 76 Rickard Road, Leppington 180 -
"402 Macquarie Street" 402 Macquarie Street, Liverpool 168 -
“8 - 14 West Terrace” 8 - 14 West Terrace, Bankstown
"Castlereagh & Copeland Block A & B" 6 - 12 Copeland Street, Liverpool
"Austral Green" 250 - 260 Sixth Avenue, Austral 113 -
"Ardennes Avenue" Ardennes Avenue, Edmondson Park 99 -
Salvo Property Group Approved Possible
Approved Possible
Kingdom Towers 2 Approved Possible
Architecture And Building Works Pty Ltd Mooted Possible
Glory Property Group Application Deferred
Vcross Development Managment Approved Possible
Unknown Approved Possible "46 Meredith Street" 46 Meredith Street, Bankstown
"203 - 209 Northumberland Street" 203 - 209 Northumberland Street, Liverpool
"1 - 9 Anderson Avenue" 1 - 9 Anderson Avenue, Liverpool
"216 Edmondson Avenue" 216 Edmondson Avenue, Austral 57 -
"17 - 21 Tyler Street" 17 - 21 Tyler Street, Campbelltown 49 -
Approved Possible
The Bathla Group Approved Possible
Unknown Approved Possible "62 - 62A Copeland Street" 62 - 62A Copeland Street, Liverpool
"74 - 80 Cairds Avenue" 74 - 80 Cairds Avenue, Bankstown
"44 - 46 Warby Street" 44 - 46 Warby Street, Campbelltown 39 -
"26 - 30 Mill Road" 26 - 30 Mill Road, Liverpool 33 -
Building Corp Australia Approved Firm
Unknown Approved Deferred
"15 - 19 Leonard Street" 15 - 19 Leonard Street, Bankstown 30 - TBC UFN Group Approved Possible
"15 - 17 Pearce Street" 15 - 17 Pearce Street, Liverpool 30 - TBC Unknown Application Possible
"30 Castlereagh Street" 30 Castlereagh Street, Liverpool 28 -
"27 - 31 Sir Joseph Banks Street" 27 - 31 Sir Joseph Banks Street, Bankstown 27 -
"23 - 25 Charles Street" 23 - 25 Charles Street, Liverpool 23 -
"44 Kitchener Parade" 44 Kitchener Parade, Bankstown 14 -
Unknown Approved Possible
Approved Possible
Approved Possible
Ghazi Al Ali Architect Pty Ltd Approved Possible
"9 - 11 Mill Road" 9 - 11 Mill Road, Liverpool 12 - TBC Unknown Approved Possible
"Leppington Estate Stages 1 & 2" 1382 - 1402 Camden Valley Way, Leppington 8 -
Total 8,729 354
Tribeca Property Group Approved Possible
A total of circa 8,729 proposed residential apartments (8,375 BTS and 354 BTR) have been identified based on information available at the time of reporting. This combined yield represents the potential number of apartments should all reported projects be developed. These apartments span across a total of 54 projects (some comprising multiple stages). The projects range in size from 8 apartments ("Leppington Estate Stages 1 & 2") up to 1,250 apartments (“MacArthur Gardens North”) with an average project yield of 165 apartments. There were no new apartments proposed in Denham Court, 2,733 in Liverpool, 2,526 in Campbelltown, 1,396 in Leppington, 448 in Gledswood Hills and 419 in Bankstown. Specific to the suburb of Edmondson Park, 1,313 new apartments are proposed.
7.1 Introduction
There are currently limited new apartment projects within close proximity to Edmondson Park. A detailed analysis of one residential apartment project currently marketing “off the plan” and five recently completed within Southwest Sydney has been undertaken. This has included a comprehensive review of the project yield, dwelling numbers, mix, internal floor area ranges (net saleable areas), current price points (including rates p.s.m. of net saleable area), marketing history, buyer profiles and average take-up rates per calendar month.
The profiles have been separated into projects currently marketed off the plan followed by recently completed projects and include the following:
“The Liverpool” 26 Elizabeth Street, Liverpool
“Spring Square” 32 Kitchener Parade, Bankstown
“Edwin Residences” 17-23 Goulburn Street, Liverpool
“Eden Residences” 51-55 Hutton Road, Edmondson Park
“The Hoxton” 6 Gillespie St, Liverpool
“The Belmont” 2 Sergeant Street Edmondson Park
“The Liverpool” 26 Elizabeth Street, Liverpool
Pricing relates to Asking Prices.
3
Comment Sales / Marketing
Project marketing commenced in July 2022. To date circa 142 out of 193 apartments have sold (73%). This equates to an average sales rate of 6.7 apartments per month.
It is understood that all the one-bedroom apartments have sold, 69% of two-bedroom apartments and 76% of three-bedroom apartments.
The purchasers are advised to include an even mix of owner occupiers from the local area and investors from further afield, throughout the Greater Sydney area.
The majority of owner occupiers are young first home buyers with investors typically of an older demographic.
The main selling factors include the close proximity to Liverpool CBD, locational amenity (Bigge Park) and lifestyle factors.
Amenities: Residents will have access to restaurants on the ground floor and level 35, a private dining room located on level nine, a resident’s lounge, pool and lounge, gym, media room and outdoor dining spaces. Additionally, the project is situated directly opposite Bigge Park which features children’s playgrounds, including a modern water play area.
Finishes: Fitout and specifications are considered of a medium to high standard for this locality. Fixtures and fittings specifically noted in the marketing material include stone benchtops, stainless steel Fisher & Paykel appliances, integrated fridges, mirrored splashbacks and plush carpets.
Other
“The Liverpool” is a mixed-use residential development comprising 193 apartments, a 93-room hotel and 6,500 sq.m. of commercial and retail space. Residential apartments are located on levels 10 through 34 and hotel accommodation is located on levels six through nine.
Basement car parking is provided over five levels, accommodating a total of 362 car spaces (201 residential).
The project is located approximately 600 metres north of Liverpool railway station and 170 metres south-east of Westfield Shopping Centre.
“Spring Square” 32 Kitchener Parade, Bankstown

Recent Sales (May 2023 to April 2024)
2
3
Comment
Sales / Marketing
Project marketing commenced in November 2019. A total of 369 out of 516 apartments (72%) sold off the plan, equating to circa seven sales per calendar month. The busiest sales period was during Q2 2022, averaging approximately 22 sales per month.
By April 2024, 385 out of 516 apartments had sold (75%), equating to a project sales rate of seven sales per calendar month.
Over the last 12 months, there have been 135 sales. The blended NSA rate during this period was $8,679 p.s.m.
The majority of purchasers are advised to be local owner occupiers, particularly rightsizers.
The main selling factors include the project’s amenities, as well as the close proximity to Bankstown town centre, railway and the future metro line.
Amenities: Residents have access to retail within the precinct, a childcare centre, outdoor barbeque and kitchen spaces as well as landscaped gardens and courtyards.
Finishes: Fitout and specifications are considered of a medium to high standard for this locality, with purchasers benefiting from a choice of interior colour schemes.
Other
“Spring Square” is a mixed-use project comprising five buildings accommodating retail, commercial and residential apartments. Total project dwelling yield includes 262 x one-bedroom (51%), 219 x two-bedroom (42%) and 35 x three-bedroom apartments (7%). Circa 5,500 sq.m. of retail and commercial space is located on ground and first floor levels, intended to accommodate a childcare centre, bars, cafes, and restaurants with alfresco dining.
Two levels of basement car parking is provided under each building, accommodating 714 vehicles (626 residential).
The project is located approximately 280 metres north-west of Bankstown railway station and 160 metres north-west of Bankstown town centre.
“Edwin Residences” 17-23 Goulburn Street, Liverpool
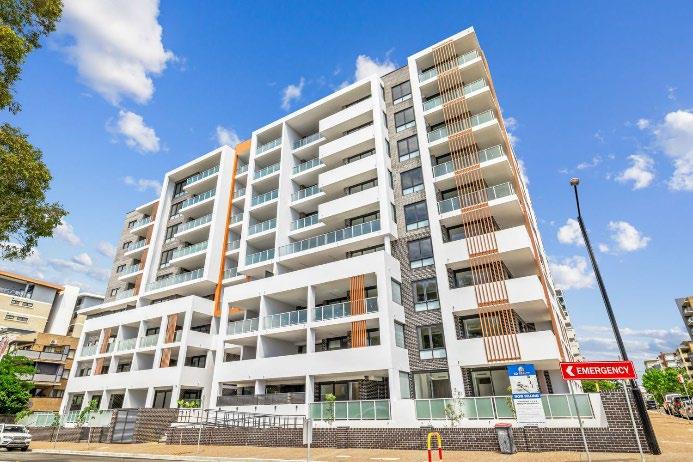
Recent Sales (May 2023 to April 2024)
3
Project sales commenced March 2021. Sale evidence indicates 64 out of 101 apartments (63%) have sold and settled to date, equating to circa two sale per calendar month. It is understood 27 apartments have been retained by the developer and 10 apartments were multi-sales purchased for student housing purposes.
Over the last 12 months, there have been 32 sales. The blended NSA rate during this period was $7,691 p.s.m.
The majority of purchasers have included owner occupiers, including rightsizers and young professionals.
The main selling factors include proximity to Liverpool city centre and access to public transport.
Amenities: Residents have access to two rooftop communal terraces.
Finishes: Fitout and specifications are considered to be of a medium standard for this locality. Fixtures and fittings specifically noted in the marketing include stone benchtops, Fisher & Paykel kitchen appliances, ducted air-conditioning, full-length showers and floating vanities.
Other
“Edwin Residences” is a residential flat building comprising 101 apartments across nine levels. Total project dwelling yield includes 15 x one-bedroom (15%), 73 x two-bedroom (72%) and 13 x three-bedroom apartments (13%).
Basement parking provided over two levels accommodating 130 motor vehicles (119 residential).
The project is located 750 metres south-west from Warwick Farm railway station and 650 metres north-east from Westfield Liverpool.
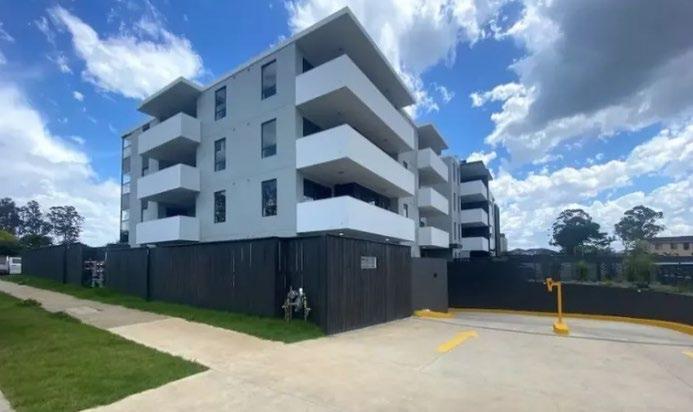
Recent Sales (May 2023 to April 2024)
Sales Summary
Comment
Sales
Building A sales commenced in October 2018. A total of 35 out of 42 apartments (83%) sold off the plan, equating to circa one sale per calendar month. Building B and C sales commenced in July 2021, with 57 out of 63 apartments transacting prior to building completion (89%), equating to a presale rate of circa three sales per calendar month.
To date, circa 97 out of 105 apartments have sold (92%), equating to approximately 1 sale per calendar month.
Over the last 12 months, there have been 10 sales. The blended NSA rate during this period was $8,554 p.s.m.
There were no one and three-bedroom apartment sales over the last 12 months. Historical pricing throughout 2022 and early 2023 indicate a sale price range of between $479,000 to $529,000 ($9,909 p.s.m. to $10,256 p.s.m.) for one-bedroom apartments and $719,000 to $739,000 ($7,494 p.s.m. to $7,893 p.s.m.) for three-bedroom apartments.
As per CoreLogic data, owner occupiers account for circa 70% of purchasers within the project.
The main selling factors include the project’s proximity to Ed.Square town centre and public transport.
Amenities: Residents have access to communal open space at lower ground floor level including a children’s playground as well as two rooftop courtyards located above Buildings A and C.
Finishes: Fitout and specifications are considered of a medium standard for this locality. Fixtures and fittings specifically noted in the marketing material include stone benchtops, integrated dishwasher and range hood, built-in ‘black glass’ oven and gas cooktop, stainless steel appliances, frameless shower screens, floor-to-ceiling tiled bathrooms, water efficient bathroom fittings and timber floorboards.
Other
“Eden Residences” comprises three x four storey residential flat buildings. Stage 1, (Building A) was completed in Q4 2021 with Stage 2 (Buildings B and C) completed in Q2 2023. Building A features 42 apartments, Building B features 23 apartments and Building C features 40 apartments. Total project dwelling yield includes 7 x studio (11%), 15 x one-bedroom (10%), 72 x two-bedroom (69%) and 11 x three-bedroom apartments (10%).
Two levels of basement car parking provided, accommodating 180 vehicles.
The project is located approximately 1.4 kilometres north-east of Ed.Square Shopping Centre and Edmondson Park railway station.
Hoxton” 6 Gillespie St, Liverpool
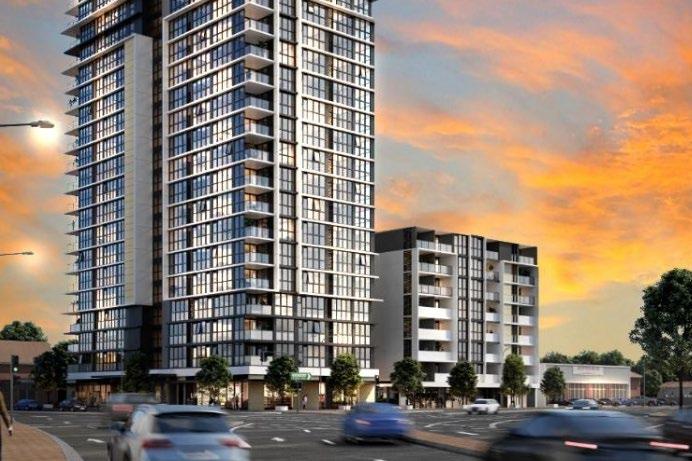
Recent Sales (May 2023 to April 2024)
Marketing commenced in February 2020. By December 2022, all apartments had sold, equating to 9 sales per calendar month.
Over the last 12 months, there have been 10 resales. The blended NSA rate during this period was $7,485 p.s.m.
Purchasers are advised to have included an even mix of investors and first home buyers, with investors attracted by the relatively modest price points.
The majority of purchasers were owner-occupiers from the Southwest region.
The main selling factors included affordability and growth potential. The marketing agent stated the business model of the developer provided confidence to purchasers during the uncertainties experienced during the onset of the COVID-19 pandemic.
Amenities: Each building features a rooftop garden with a central ground floor courtyard between the three buildings.
Finishes: Fitout and specifications are considered to be of a medium standard. Fixtures and fittings specifically noted in the marketing material include “calacutta” stone island benchtops, Grohe tapware and Fisher & Paykel appliances.
Other
“The Hoxton” is a mixed-use development comprising three buildings and ground floor retail. Building A includes 31 levels of residential apartments, Buildings B and C each feature 7 levels of residential apartments. Total project dwelling yield includes 33 x one-bedroom (11%), 237 x two-bedroom (78%) and 33 x three-bedroom apartments (11%).
The project is located approximately 1.3 kilometres south-west of Liverpool railway station and 1.7 kilometres south of Westfield Liverpool.
“The Belmont” 2 Sergeant Street Edmondson Park
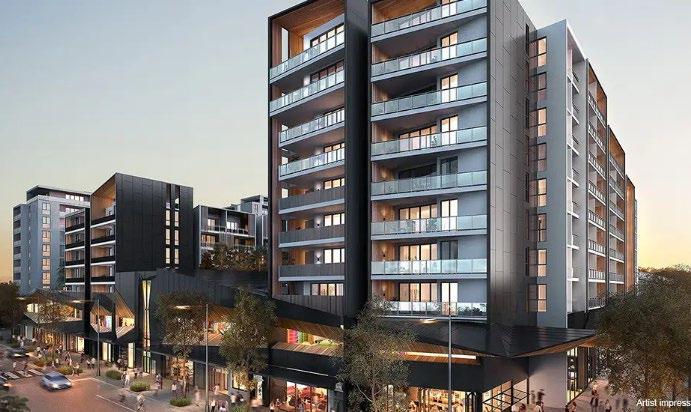
Recent Sales (May 2023 to April 2024)
1
Sales commenced in June 2018. Within the first month of release, 55% (54 apartments) had transacted within The Belmont. By building completion, 90 apartments had sold off-the-plan including a multi-sale of 11 apartments to a social and disability housing provider “Summer Housing Pavilions”. This equates to two sales per calendar month. By March 2021, all apartment stock had sold, equating to 3 sales per calendar month.
In the last 18 months, there have been 7 sales, all of which were resales. During this period, the average sale price achieved was $8,967 p.s.m.
Over the last 12 months, there have been 5 sales. The blended NSA rate during this period was $8,414 p.s.m.
There were no three-bedroom apartment sales over the last 12 months. Historical pricing throughout 2022 indicate a sale price of $800,000 ($8,467p.s.m.).
Initial interest during the early expressions of interest for the project were from an even mix of first home buyers, owner occupiers and investors including young families and a number of downsizers.
There was strong take up in early stages by families (three-bed apartments) whereas first home buyers and investors primarily purchased one and two-bedroom apartments with owner occupiers seeking all bedroom typologies.
Potential purchasers were looking to relocate from all areas of metropolitan Sydney to capitalise on the various lifestyle and transport upgrades at more affordable price points. The main selling factors include the Belmont’s proximity to Ed.Square retail precinct and public transport.
Amenities: Residents have access to communal open space with landscaped gardens, barbeque facilities and a community swimming pool.
Finishes: Fitout and specifications are considered of a medium to high standard. Fixtures and fittings specifically noted in the marketing material include timber-look floor tiles, stone benchtops, mirror splashbacks, chrome tapware, floor to ceiling windows and split-system airconditioning.
Other
The Belmont is one of six residential buildings located in the town centre of Fraser’s masterplanned community “Ed.Square”. Stage 1 of the town non-residential component was completed in 2020 and comprised 25,000 sq.m. of retail space including a Coles Supermarket and cinema complex, a number of restaurants and cafes, and circa 6 ha of open / green space. Stage 2 of the nonresidential section is to be delivered over the medium term. Upon Completion, Ed Square town centre will feature 40,000 sqm of retail space with over 120 shops as well as additional residential development. Total building dwelling yield includes 36 x one-bedroom (36%), 56 x two-bedroom (57%) and 7 x three-bedroom apartments (7%).
Two levels of basement car parking accommodating 126 residential vehicles.
Located in the north-western portion of Ed.Square town centre and adjacent to the south of Edmondson Park railway station.
A comparative summary of all projects reviewed has been prepared. This includes a comparison of the following:
Pricing range per apartment typology on a listing / sale price basis.
Pricing range per apartment typology on a rate per square metre of net saleable area basis.
Net saleable area range for each apartment typology.
One-Bedroom Price Ranges
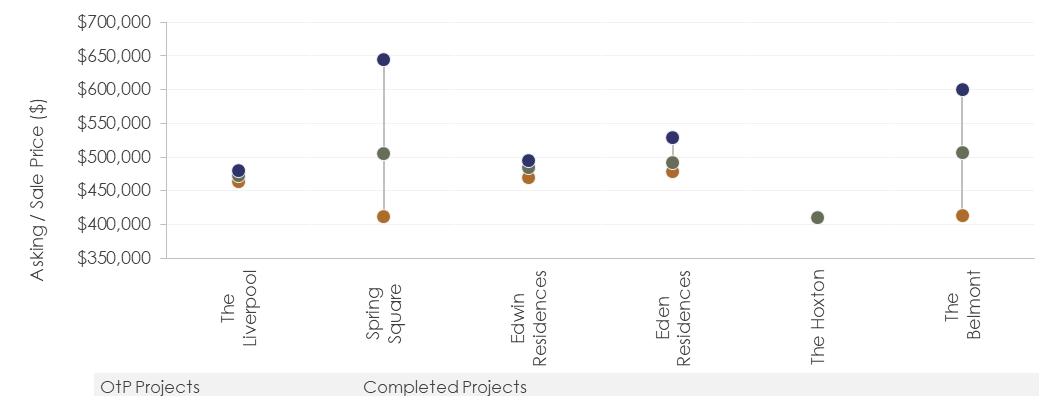
SOURCE - Charter Keck Cramer
Two-Bedroom Price Ranges
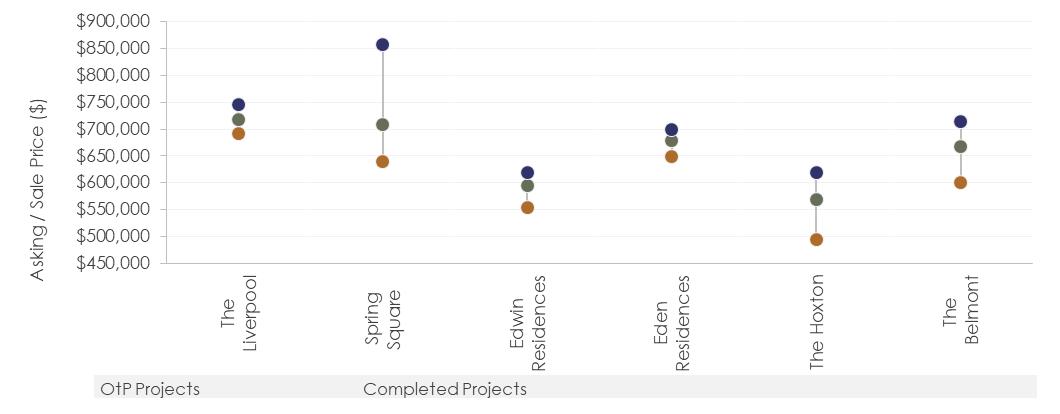
SOURCE - Charter Keck Cramer
Three-Bedroom Price Ranges
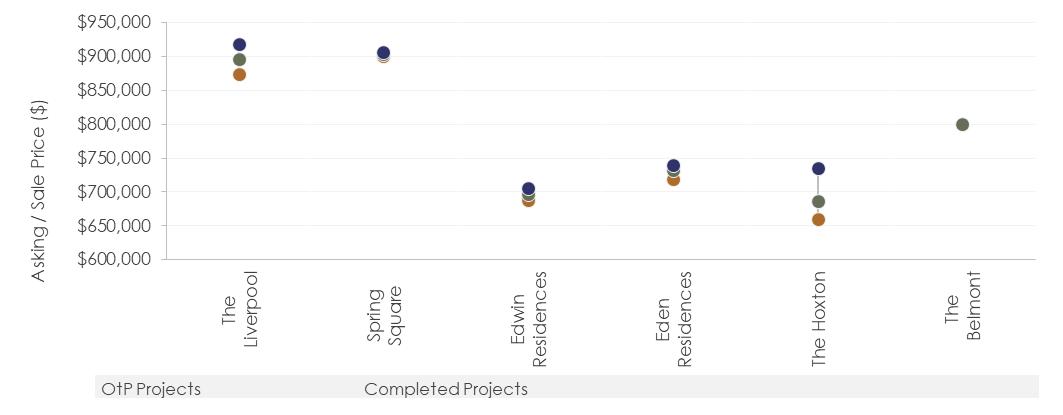
SOURCE - Charter Keck Cramer
7.4.2 Price Per Square Metre Comparison
One-Bedroom p.s.m. Ranges
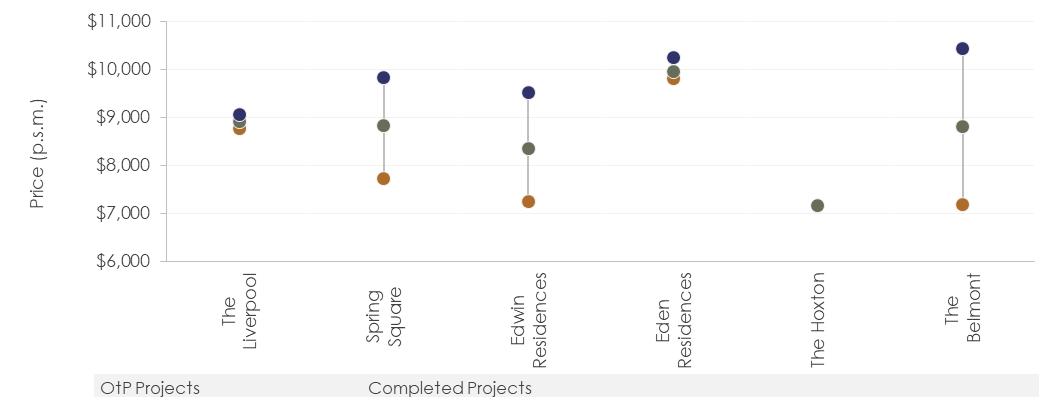
SOURCE - Charter Keck Cramer
Two-Bedroom p.s.m. Ranges
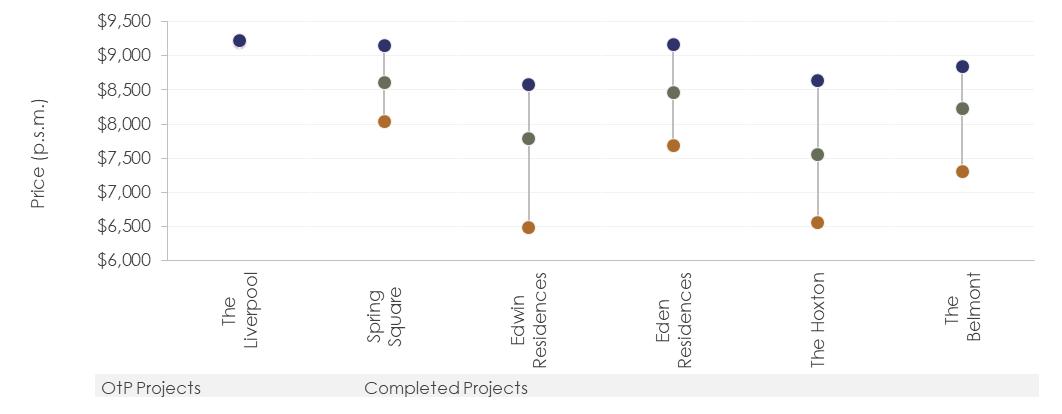
SOURCE - Charter Keck Cramer
Three-Bedroom p.s.m. Ranges
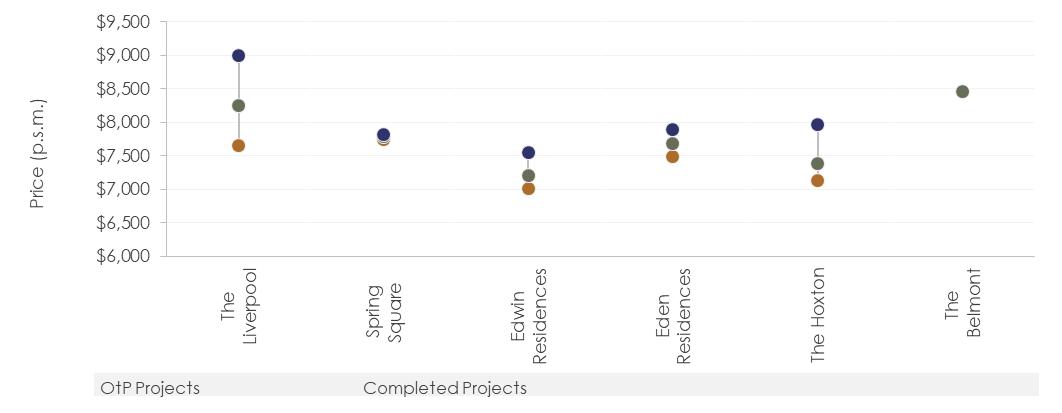
SOURCE - Charter Keck Cramer
7.4.3
One-Bedroom NSA Ranges
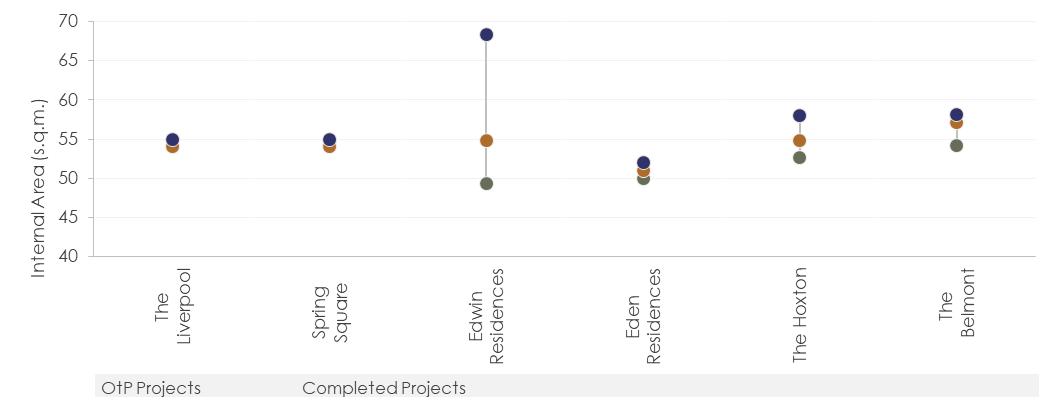
SOURCE - Charter Keck Cramer
Two-Bedroom NSA Ranges
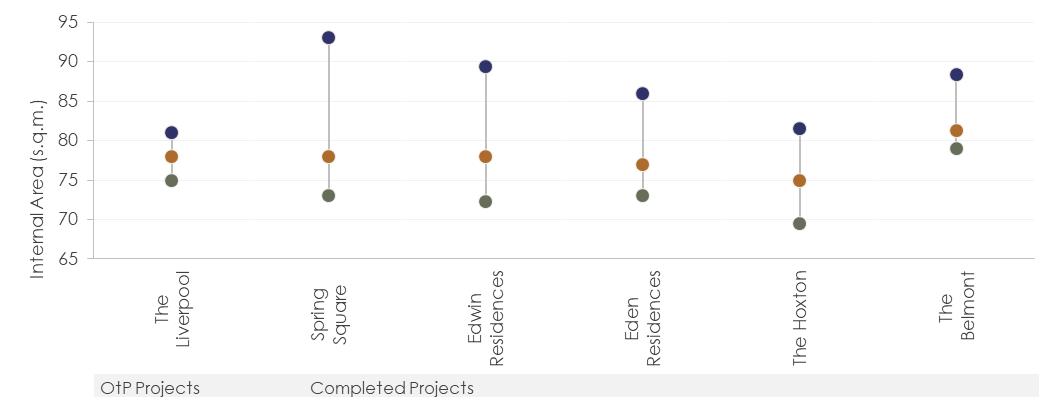
SOURCE - Charter Keck Cramer
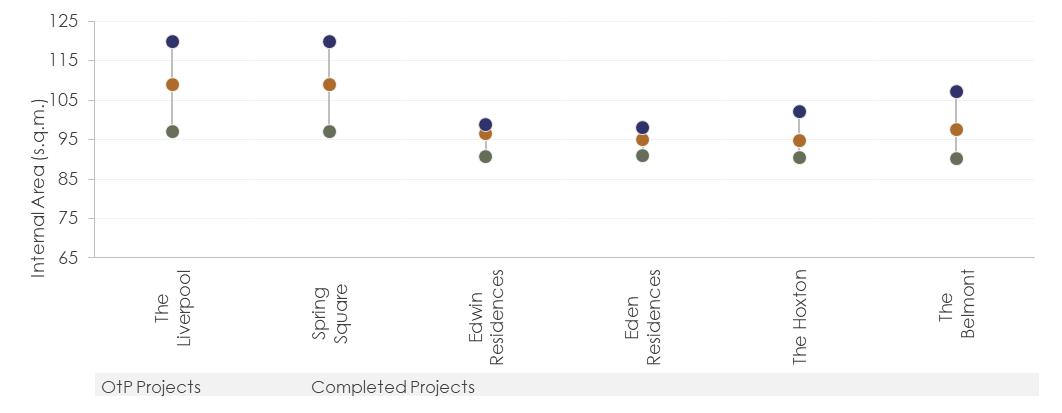
SOURCE - Charter Keck Cramer
7.4.4 Project Profile Summary
A summary of the projects reviewed is provided in the following table which details total apartment yield and indicative average price points per square metre of internal floor area for each project. The table has been divided into “Off the Plan” and “Completed” projects.
It is noted that the pricing indicated is representative of either current asking prices or recent sale prices achieved (as indicated within the respective project profiles).
Off the Plan Projects
“The Liverpool” 26 Elizabeth Street, Liverpool
Completed Projects (Recent Sales)
“Spring Square” 32 Kitchener Parade, Bankstown
“Edwin Residences” 17-23 Goulburn Street, Liverpool
“Eden Residences” 51-55 Hutton Road, Edmondson Park
“The Hoxton” 6 Gillespie St, Liverpool
“The Belmont” 2 Sergeant Street Edmondson
*Pricing reflects historical pricing as indicated in the respective project profile.
The following summary table outlines the full price ranges across all six projects reviewed based on current asking prices and recent sales. That is, the minimum and maximum price points per apartment typology across all six projects analysed.
3
Across the study region asking price rates p.s.m. of internal floor area are priced from circa $6,500 p.s.m. up to circa $10,400 p.s.m. However, the overall range is more typically between $7,500 p.s.m. to $9,000 p.s.m. The price points vary based on location, quality of development and fitout standard, features, scale, sizing, parking provision, view profiles and market related factors.
Charter has been analysed settled sales within ALAND’s “Costello” Project located adjacent to “The Edmondson Collection” at 361 – 363 Bernera Road & 120 Passendale Road, Edmondson Park. “Costello” includes a mix of one, two and three-bedroom apartments across three buildings.
The table below provides a profile of the Costello project, including a summary of sales over the past year and commentary relating to the broader sales history from initial marketing commencement.

1
Sales commenced in June 2020. By October 2021, all apartment stock had sold, equating to 8 sales per calendar month.
Over the last 12 months, there have been 12 sales. The blended NSA rate during this period was $9,029 p.s.m.
As per CoreLogic data, owner occupiers account for circa 85% of purchasers within the project. This includes a mix of young families, and downsizers. The project has predominantly been marketed towards this market.
The main selling factors include the close proximity to schools and the business districts of Liverpool and Campbeltown, as well as the lifestyle and amenity offered within the Ed.Square precinct.
The chart below indicates the blended median annual sale price per square metre for all sales throughout the sale period between 2020 and 2024 (year to date).
As requested, an implied growth rate has been adopted for the years 2025 to 2027 which assumes that a similar rate of growth ensues. Costello achieved broadly consistent price growth between 2020 to 2024, reflecting a compound annual growth rate of 4.1% in median sale price p.s.m. of net saleable area across the project. This growth rate notably exceeds the 4-year CAGR of -0.7% evident for all units in Edmondson Park.
The chart below indicates price trends to date and implied growth for apartments within Costello assuming a continued annual growth rate of 4.1% per annum.
Collection Price Trends & Implied Future Growth
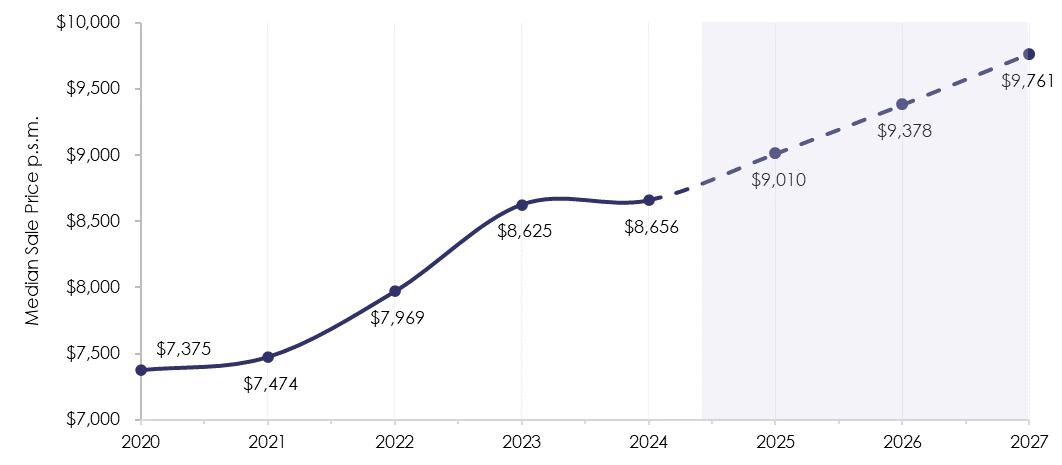
SOURCE – ALAND, PriceFinder, Charter Keck Cramer
A demographic profile of Edmondson Park has been completed to inform the current and potential future population characteristics of the area. The suburb of Edmondson Park has been adopted as the key study area and compared with Liverpool Local Government Area and Greater Sydney
Key findings from the demographic review are as follows:
Between 2016 and 2021, the population of Edmondson Park increased by a considerable 432% to 12,080 people, translating to an influx of residential stock.
Population forecasts suggest that circa 109,959 additional dwellings will be required in Liverpool LGA by 2041.
The median resident age is 31 years in Edmondson Park which is lower than Liverpool LGA at 34. Almost one third of the residents located in Edmondson Park are aged 0 – 17 years, indicating a strong family presence in the area. Couples with children account for the greatest volume of households at 60.6%.
A significant 83.9% of all dwellings in Edmondson Park are “houses” many of which have been developed over the past circa 10-year period as there has been an implied focus on greenfield land releases and low density development in Southwest Sydney. In contrast apartments account for only 10.0% of all dwellings. As low-density land supplies become more limited in Edmondson Park and the number of apartment developments increase, the percentage of apartments is anticipated to increase as at the next census.
Couples with children represent the highest percentage of households within Edmondson Park (60.6%) followed by couples no children (17.3%) then lone person households (10.9%).
More than 84% of houses in Edmondson Park comprise four+ bedrooms, commensurate with the high proportion of local family households. In contrast, close to 90% of apartments feature one or two bedrooms which typically appeal to the growing couples no children and lone persons demographic.
Personal, Household and Family incomes in Edmondson Park all exceed both Liverpool LGA and Greater Sydney. More than a third of the apartments in Edmondson Park are owner occupied with a mortgage. This is considered to reflect the developing nature of the location with many properties having been purchased within the last 10 years. Given a high prevalence of family households with above average income levels, the opportunity to rent or buy an apartment in the local area is enhanced. Many of these residents are employed in health care and professional services.
Circa one quarter of houses are investor owned. In contrast, given the comparatively lower price point options relative to houses at this location, 58% of apartments in Edmondson Park are held as investment properties (notably less than Liverpool LGA at 74%).
Many of the top 10 net positive migration locations into Edmondson Park are within close proximity including Prestons, and Casula. Next to intra-migration within Edmondson Park, overseas migration represented the second highest source of new residents, with the vast majority relocating from India, Nepal and Pakistan.
Overseas migration has been dominated by the 25 – 34 year age group. Considering the notable proportion of Australian born children in Edmondson Park (24.7% of all Edmondson Park residents), much of this demographic group represents new young family households. Overall, the 0 -17 year age cohort represented the highest group (30.6%) of local migration, followed by the 35 – 44 years age group (20.1%), typically representing family households.
A median house and unit price trend analysis has been completed on the suburbs of Edmondson Park, Bankstown, Campbelltown, Liverpool and additionally Liverpool LGA. This review has been undertaken to identify current pricing parameters, differentials between dwelling typologies and locations along with variations over time. In addition, a sales volume trend analysis has been completed to highlight changes in transaction volumes over time.
Median price points for both dwelling typologies in each review location are listed below:
Edmondson Park: Median house price: $1,217,000; Median unit price: $672,000
Bankstown: Median house price: $1,204,250; Median unit price: $485,000
Campbelltown: Median house price: $800,000; Median unit price: $512,500
Liverpool: Median house price: $910,000; Median unit price: $480,000
Liverpool LGA: Median house price: $975,000; Median unit price: $450,000
Edmondson Park house and unit pricing reflects a consistent premium above Liverpool LGA and trends as the highest priced house and unit market when compared to the other suburbs reviewed.
Median house prices demonstrated broadly consistent trends and growth patterns across the Study Area. Between the commencement of the review period through to 2013 price growth was moderate. Subsequent to this, there was an upswing in median house prices, followed by a period of undulating growth between 2015 and 2020. Over the 24 months to 2022, robust median price increases of between 20.5% (Liverpool) and 42.9% (Edmondson Park) were evident throughout the Study Area. Over the last two years, prices have stabilised in the suburbs of Campbelltown and Liverpool as well as Liverpool LGA, however, have continued to grow in Edmondson Park and Bankstown.
Of the suburbs reviewed, Campbelltown is the most affordable followed by Liverpool. Edmondson Park and Bankstown feature the highest house prices of the review locations all of which have reflected solid 10-year CAGR rates varying between 7.0% and 8.8%.
Units offer a more affordable price point which allows potential buyers to enter a housing market that they otherwise would have been priced out of. This trade-off is occurring more frequently due to affordability constraints as well as the betterquality units being delivered.
Median unit prices in Edmondson Park were first recorded in 2015 (greater than 10 sales) being the timeframe when such product was introduced. Current pricing indicates a 181% premium in house prices compared to unit prices having varied between 122% (2019) and 189% (2015). Given sales commenced in 2015, an 8-year CAGR has been adopted. Units in Edmonson Park have demonstrated a favourable CAGR of 5.4% p.a. over the past eight years
It is evident that there is a notable and widening price differential between houses and units within the review locations. This is highlighted by the significantly higher 10-year CAGR evident for houses when compared with units. This indicates that units are by far the most affordable dwelling option. Both houses and units in Edmondson Park are amongst the highest priced when compared to the other three suburbs reviewed
Over the past 15 years, units have typically reflected the majority of sales within each suburb reviewed, given the centralised location and increased focus on high density development. Currently, the sales volume of units in Liverpool, Bankstown and Campbelltown exceeds houses, whilst house and unit sales have become broadly similar in Edmondson Park.
Charter has analysed historic median rental prices for houses, townhouses and apartments over time in the local Edmondson Park market.
Houses are the dominant dwelling typology in Edmondson Park, although since the introduction of apartment stock the most notable rental activity in recent years has been for two-bedroom apartments. Two-bedroom apartments have been popular with investors given comparatively low buy-in price points coupled with high rental returns. In fact, rents for twobedroom dwellings across all typologies reviewed are typically highest for apartments. There are limited one-bedroom rental properties in Edmondson Park and even fewer three-bedroom apartments.
The table below highlights current pricing expectations for rental properties in Edmondson Park (weekly unfurnished). Apartments are priced highest across all typologies but for three-bedroom houses which tend to exceed apartments given larger living areas and land content.
Edmondson Park Current Rental Pricing Expectations Summary
Apartments
Townhouses
Three-Bedroom
Houses
One-Bedroom
Three-Bedroom
Given the relatively emerging nature of the apartment and medium density housing markets in Edmondson Park, there is a limited amount of data available to identify investment yields. This is particularly the case for one and three-bedroom apartments. Accordingly, our review has focused primarily on gross investment yield trends for two-bedroom apartments which are the most rented and traded investment product.
Apartment investment yields have broadly fluctuated throughout the review period although have typically tracked in an upward direction. The average two-bedroom gross apartment yield between September 2020 and December 2023 reflects 4.4% having started at 4.0% and increasing over the 3 ¼ year period to 4.8%.
Yield growth has been somewhat moderated by ongoing capital growth however the local market is in a somewhat unusual (but favourable) position where rents, yields and purchase prices are all consecutively increasing. This is considered beneficial to owner occupiers and investors alike.
Apartment supply within the Study Area has increased considerably throughout the review period although more recently, completions have been tempered as result of high building and land costs and broader market related factors such as high interest rates and low purchaser sentiment. Since 2009 the Study Area has recorded 9,462 apartment completions (including 9,003 BTS apartments and 459 BTR apartments) at an average annual completion count of 631 throughout this period.
Peak annual supply across the study region was recorded in 2019 with 1,765 apartment completions. This was primarily driven by strong completions in Liverpool (1,138 apartments) and Bankstown (328 apartments).
New supply completions in Edmondson Park have been evident from 2017 onwards. Edmondson Park town centre has become a focal point over the past 10 years for new residential apartment development which is part due to the opening of Edmondson Park train station (superior accessibility). The development of Ed.Square has also been key to the introduction and market acceptance of localised apartment product.
To date, 998 BTS apartments have been completed in Edmondson Park across 15 projects / stages (average of 67 apartments per project) with peak supply in 2022.
There is considerable new apartment supply proposed within Edmondson Park. At the time of reporting, 1,313 new apartments are proposed across six projects in Edmondson Park (excluding the subject project). A total of circa 8,729 proposed residential apartments (8,375 BTS and 354 BTR) have been identified in the Study Area with 15% of this located in Edmondson Park.
A detailed analysis of relevant apartment projects currently marketing “off the plan” and “completed” within Edmondson Park and key suburbs including Bankstown and Liverpool has been completed which has included a comprehensive review of the project yield, dwelling numbers and mix, internal living area ranges, current price points (including rates p.s.m.), marketing history, buyer profiles and average take-up rates per calendar month.
The following summary is provided of the typical accommodation mixes, sizes, pricing and rates per square metre of projects actively marketed at the time of this report:
Prevailing Product Types and Pricing
Apartment Types
This summary provides a useful guide of apartments products and pricing currently being offered to the market.
Having regard to our market research as summarised herein, the following findings summarise take-up rates and apartment buyer profiles within Edmondson Park and surrounding locations:
Take-up rates have varied between developments and in recent years have ranged from an average of 2 sales p.c.m. to up 9 sales p.c.m. over the full length of project marketing periods.
First home buyers – very prevalent for one and two-bedroom apartments.
Upsizers – two and three-bedroom apartments.
Downsizers / empty nesters and families – two and three-bedroom apartments.
Investors – one and two-bedroom apartments, particularly for developments that offer exceptional “inner city” style amenity and localised trains which appeal to both investors and tenants.
Purchasers are typically from within metropolitan Sydney and have looked to capitalise on the various lifestyle and transport upgrades in Edmondson Park at comparatively affordable price points.
There has been growing interest in higher priced apartments within well located projects featuring desirable amenities. These buyers seek products that provide a lifestyle such as being well located to transport and retail and comprising amenities such as pools, gymnasiums and communal areas.
Charter has been analysed settled sales within ALAND’s “Costello” Project located adjacent to “The Edmondson Collection” at 361 – 363 Bernera Road & 120 Passendale Road, Edmondson Park. “Costello” includes a mix of one, two and three-bedroom apartments across three buildings.
As requested, an implied growth rate has been adopted for the years 2025 to 2027 which assumes that a similar rate of growth ensues. Costello achieved broadly consistent price growth between 2020 to 2024, reflecting a compound annual growth rate of 4.1% in median sale price p.s.m. of net saleable area across the project. This growth rate notably exceeds the 4-year CAGR of -0.7% evident for all units in Edmondson Park.
W charterkc.com.au
E enquiry@charterkc.com.au
T 1300 242 787