


HAWAII
*seefootnotesonpages9-12regardingmethodologyupdatesYoY%chg=year-over-yearpercentchangecomparingcurrentmonthtothesamemonthlastyear. MoM%chg=month-over-monthpercentchangecomparingcurrentmonthtothepreviousmonth.
*seefootnotesonpages9-12regardingmethodologyupdates1-yr%chg=percentchangecomparingthecurrentYTDtimeperiodtothesameYTDtimeperiodoneyearago. 2-yr%chg=percentchangecomparingthecurrentYTDtimeperiodtothesameYTDtimeperiodtwoyearsago.


April 2025
OAHU, HAWAII
(Acountofpropertiesthathaveclosedinagivenmonth)
Mo-Yr

Single-Family HomesCondosTotal
Apr-223656721,037
May-223446881,032
Jun-22357626983
Jul-22312518830
Aug-22314508822
Sep-22278496774
Oct-22222435657
Nov-22192340532
Dec-22202360562
Jan-23150275425
Feb-23173325498
Mar-23236444680
Apr-23208420628
May-23262438700
Jun-23248470718
Jul-23224422646
Aug-23252422674
Sep-23232376608
Oct-23213399612
Nov-23180310490
Dec-23182272454
Jan-24184292476
Feb-24179334513
Mar-24230344574AprilSFHYoY%chgCNDYoY%chgAprilYTDSFHYoY%chgYTDCNDYoY%chg Apr-242624316932023208-43.0%420-37.5%2023767-38.8%1,464-38.5%
Jul-24269389658
2025
(Themediansalespriceofallclosedpropertiesinagivenmonth)
Mo/Yr Single-Family HomesCondos
Apr-22$1,105,000$510,000
May-22$1,153,500$516,500
Jun-22$1,100,000$534,000
Jul-22$1,107,944$500,000
Aug-22$1,125,500$498,500
Sep-22$1,100,000$502,500
Oct-22$1,050,000$520,000
Nov-22$1,149,500$480,000
Dec-22$1,049,500$502,500
Jan-23$970,000$495,000
Feb-23$987,000$480,000
Mar-23$1,083,750$536,000
Apr-23$999,995$500,000
May-23$1,109,000$505,000
Jun-23$1,050,000$510,000
Jul-23$1,090,000$500,000
Aug-23$1,110,000$515,000
Sep-23$1,050,000$532,500
Oct-23$1,100,000$515,000
Nov-23$1,100,055$516,179
Dec-23$996,500$510,000
Jan-24$1,021,016$502,500
Feb-24$1,075,000$512,500
Mar-24$1,100,000$500,000AprilSFHYoY%chgCNDYoY%chgAprilYTDSFHYoY%chgYTDCNDYoY%chg
Apr-24$1,100,000$528,0002023$999,995-9.5%$500,000-2.0%2023$1,010,000-8.2%$500,000-2.0%
May-24$1,085,000$495,0002024$1,100,00010.0%$528,0005.6%2024$1,072,5006.2%$510,0002.0%
Jun-24$1,120,000$530,000
Jul-24$1,140,000$509,000
Aug-24$1,122,000$500,000
Sep-24$1,112,722$517,500
Oct-24$1,100,000$525,000
Nov-24$1,115,000$530,000
Dec-24$1,054,500$540,000
Jan-25$1,120,000$539,500
Feb-25$1,185,000$494,000
Mar-25$1,160,000$500,000
2025
(Theaveragesalespriceofallclosedpropertiesinagivenmonth)
Mo/Yr Single-Family HomesCondos
Apr-22$1,404,481$613,189
May-22$1,450,008$625,327
Jun-22$1,382,559$631,822
Jul-22$1,329,023$590,934
Aug-22$1,341,958$547,319
Sep-22$1,307,249$607,502
Oct-22$1,243,960$676,988
Nov-22$1,387,685$594,444
Dec-22$1,325,156$576,689
Jan-23$1,139,294$633,441
Feb-23$1,427,864$592,131
Mar-23$1,391,538$651,630
Apr-23$1,223,383$603,795
May-23$1,355,804$623,748
Jun-23$1,300,456$589,597
Jul-23$1,270,421$617,683
Aug-23$1,427,996$628,127
Sep-23$1,357,981$608,222
Oct-23$1,304,757$670,805
Nov-23$1,434,999$676,625
Dec-23$1,207,793$602,535
Jan-24$1,323,172$593,630
Feb-24$1,437,693$580,274 Monthly Average Sales Price
Average Sales Price
Year-to-Date
Mar-24$1,380,838$579,500AprilSFHYoY%chgCNDYoY%chgAprilYTDSFHYoY%chgYTDCNDYoY%chg
Apr-24$1,408,991$617,6642023$1,223,383-12.9%$603,795-1.5%2023$1,306,551-8.5%$620,3191.2%
May-24$1,419,039$592,9642024$1,408,99115.2%$617,6642.3%2024$1,387,3256.2%$594,685-4.1%
Jun-24$1,282,503$690,803 2025$1,399,728-0.7%$608,762-1.4%2025$1,491,8317.5%$621,1554.5%
Jul-24$1,360,415$616,302
Aug-24$1,387,740$590,171
Sep-24$1,307,833$625,154
Oct-24$1,304,557$647,091
Nov-24$1,351,976$635,715
Dec-24$1,236,689$639,866
Jan-25$1,344,122$654,915
Feb-25$1,400,996$610,108
Mar-25$1,819,326$614,751
Apr-25$1,399,728$608,762
April 2025
OAHU, HAWAII
(DaysonMarketrepresentsthenumberofdaysfromwhenapropertyisfirstlistedtowhenanofferisaccepted;theMedianDaysonMarketrepresentsthemedianofallsalesinagivenmonth)
Mo/Yr Single-Family HomesCondos
Apr-221012
May-221010
Jun-221011
Jul-221112
Aug-221313
Sep-221814
Oct-221919
Nov-221818
Dec-222521
Jan-232424
Nov-232923
Dec-231826
Jan-242929
Feb-243039
Percent of Original List Price Received April 2025
HAWAII
(Thepercentagefoundwhendividingaproperty'ssalespricebytheoriginallistprice;reportedpercentageisthemedianofallsalesfortheperiodindicated)
Mo/Yr Single-Family HomesCondos
Apr-22102.6%100.0%
May-22102.2%100.0%
Jun-22102.0%100.0%
Jul-22100.0%100.0%
Aug-22100.0%100.0%
Sep-2299.2%100.0%
Oct-2299.8%99.0%
Nov-2298.4%98.8%
Dec-2296.7%98.5%
Jan-2395.9%98.4%
Feb-2396.0%98.0%
Mar-2396.7%98.5%
Apr-2398.3%98.7%
May-2398.7%99.0%
Jun-2399.5%98.9%
Jul-23100.0%98.8%
Aug-2399.1%99.6%
Sep-2399.0%98.8%
Oct-2398.0%98.7%
Nov-2397.1%98.0%
Dec-2398.3%97.9%
Jan-2498.3%97.5%
Feb-2497.8%97.9%
Percent of Original List Price Received
Mar-2498.3%98.3%AprilSFHYoY%chgCNDYoY%chgAprilYTDSFHYoY%chgYTDCNDYoY%chg
Apr-2499.0%97.8%202398.3%-4.2%98.7%-1.3%202397.1%-4.5%98.4%-1.6% May-24100.0%98.3%202499.0%0.7%97.8%-0.9%202498.4%1.3%97.9%-0.5%
Jun-2499.6%98.2%
Jul-2499.0%98.1%
Aug-2499.5%98.3%
Sep-2499.0%97.7%
April 2025
OAHU, HAWAII
(Acountofpropertiesthathavebeennewlylistedonthemarketinagivenmonth)
Mo-Yr
Single-Family HomesCondosTotal
Apr-224247221,146
May-224456871,132
Jun-223916861,077
Jul-223866161,002
Aug-22381608989
Sep-22304601905
Oct-22285532817
Nov-22289526815
Dec-22164371535
Jan-23268523791
Feb-23233463696
Mar-23293530823
Apr-23292532824
May-23309582891
Jun-23324535859
Jul-23275521796
Aug-23330549879
Sep-23281516797
Oct-23272566838
Nov-23267457724
Dec-23180349529
Jan-24285581866
Feb-24295533828
Mar-24291647938AprilSFHYoY%chgCNDYoY%chgAprilYTDSFHYoY%chgYTDCNDYoY%chg Apr-243496561,0052023292-31.1%532-26.3%20231,086-28.7%2,048-27.9% May-243456581,003202434919.5%65623.3%20241,22012.3%2,41718.0% Jun-24334622956

April 2025
OAHU, HAWAII
(Ameasureofcontractactivityrepresentedbyacountofpropertiesthathavehadoffersacceptedonthemduringagivenmonth)
Mo/Yr
Single-Family HomesCondosTotal
Apr-223666631,029
May-22356601957
Jun-22305501806
Jul-22297484781
Aug-22312475787
Sep-22224436660
Oct-22198342540
Nov-22198359557
Dec-22168289457
Jan-23267378645
Feb-23217399616
Mar-23258444702
Apr-23271438709
May-23258507765
Jun-23231415646
Jul-23247421668
Aug-23267425692
Sep-23232371603
Oct-23192325517
Nov-23174308482
Dec-23182290472
Jan-24220376596
Feb-24269390659
Mar-24280439719AprilSFHYoY%chgCNDYoY%chgAprilYTDSFHYoY%chgYTDCNDYoY%chg Apr-242694437122023271-26.0%438-33.9%20231,013-26.6%1,659-35.5% May-242604226822024269-0.7%4431.1%20241,0382.5%1,648-0.7% Jun-24253385638
Jul-24255380635
Aug-24235410645
Sep-24271399670
Oct-24250319569
Nov-24234328562
Dec-24194310504
Jan-25209357566
*Methodologyupdatedasof2021toreflectacountofpropertiesthatenteredcontractwithinthegivenmonthandremaininescrowstatusattheendofthemonth(alsoappliedtohistoricaldatashownabove). PendingSales,inreportspriorto2021,reflectacountofalllistingsthatheldaPending(P)statusthroughoutthegivenmonth.
2025
OAHU, HAWAII
(ThenumberofpropertiesinActive(A)statusattheendofthegivenmonth)
Mo/Yr
Single-Family HomesCondosTotal
Apr-223959171,312
May-224719391,410 Jun-225279981,525 Jul-225761,0501,626 Aug-225961,0731,669 Sep-226291,1411,770 Oct-226561,1941,850 Nov-226821,2441,926 Dec-225971,1701,767 Jan-235511,1961,747 Feb-235471,1771,724 Mar-235411,1521,693 Apr-235351,1441,679 May-235431,1181,661 Jun-236051,1591,764 Jul-235911,1541,745
Aug-235981,1461,744 Sep-235921,1941,786 Oct-236261,3061,932
Nov-236721,3372,009AprilSFHYoY%chgCNDYoY%chg
Dec-236001,2341,834202353535.4%1,14424.8% Jan-246071,3481,955202461815.5%1,57637.8%
Feb-245991,3881,987 202580530.3%2,51259.4% Mar-245811,4932,074 Apr-246181,5762,194 May-246401,6512,291 Jun-246531,7292,382 Jul-247221,8672,589 Aug-247601,8792,639 Sep-247551,8872,642 Oct-247411,9572,698 Nov-247492,0492,798 Dec-246751,9282,603 Jan-257342,0882,822 Feb-257282,1602,888 Mar-257732,3023,075 Apr-25805 2,512 3,317
Inventory
Homes Condos
Total Active Inventory Single-Family Homes + Condos
Single-Family Homes Condos
*Indicatormodifiedasof2021toreflectActivestatuslistingsonlyandappliedtohistoricalmonthlydatashownabove.Previousreportindicator,referredtoasActiveListings,reflectedallactivelymarketedlistingsinAandCstatus.
April 2025
OAHU, HAWAII
(Thenumberofpropertiesundercontractattheendofthegivenmonth/combinedlistingsinCandPstatus)
Mo/Yr
Single-Family HomesCondosTotal
Apr-225929561,548
May-225838561,439
Jun-225097281,237
Jul-224796761,155
Aug-224626541,116
Sep-22388590978
Oct-22345506851
Nov-22319512831
Dec-22278430708
Jan-23376523899
Feb-23386592978
Mar-23393602995
Apr-234356231,058
May-234186861,104
Jun-23370612982
Jul-23383586969
Aug-23391590981
Sep-23383569952
Oct-23333475808
Nov-23312473785AprilSFHYoY%chgCNDYoY%chg
Dec-233054687732023435-26.5%623-34.8%
Jan-2433453286620244452.3%6473.9%
Feb-244165861,002
Mar-244486471,095
Apr-244456471,092
May-244405931,033
Jun-244336071,040
Jul-24409580989
Aug-24380581961
Sep-244215981,019
Oct-24384490874
Nov-24405488893
Dec-24338462800
Jan-25335500835
Feb-25385573958
Mar-254396191,058
Inventory In Escrow
Inventory In Escrow
Homes + Condos
Homes Condos
Months Supply of Active Inventory*
April 2025
OAHU, HAWAII
(Comparesactiveinventorytoarolling12-monthaverageclosedsales)
Mo/Yr
Single-Family HomesCondos
Apr-221.11.5
May-221.31.5
Jun-221.51.6
Jul-221.61.7
Aug-221.71.8
Sep-221.92.0
Oct-222.12.1
Nov-222.22.3
Dec-222.12.2
Jan-232.02.4
Feb-232.02.4
Mar-232.12.4
Apr-232.12.5
May-232.22.6
Jun-232.62.8
Jul-232.62.8
Aug-232.72.8
Sep-232.73.0
Oct-232.93.3
Dec-232.83.220232.190.9%2.566.7%
Feb-242.83.6
Mar-242.74.0
Apr-242.84.2
May-242.94.4
Jun-243.04.7
Jul-243.25.1
Aug-243.45.1
Sep-243.45.2
Oct-243.35.4
Nov-243.35.6
Dec-242.95.2
Jan-253.15.6
Feb-253.15.8
Mar-253.36.2
Apr-253.5 6.8
*Methodologyupdatedasof2021(alsoappliedtohistoricaldatashownonthischart). MonthsofInventory,inreportspriorto2021,reflectacomparisonofactivelistingstoaveragependingsales.

$700,000 - $799,999 1627-40.7%5820190.0%96.5%100.0%-3.5%311782.4%1722-22.7%534420.5%32313.2%3.32.250.0%
$800,000 - $899,999 3039-23.1%19190.0%98.6%97.8%0.8%3640-10.0%38372.7%745729.8%67661.5%2.61.844.4%
$900,000 - $999,999 2330-23.3%3212166.7%100.0%100.2%-0.2%423040.0%31303.3%724850.0%4753-11.3%2.81.855.6%
$1,000,000 - $1,499,999 87817.4%201625.0%100.0%98.9%1.1%117135-13.3%8599-14.1%22216435.4%144158-8.9%2.62.218.2%
$1,500,000 - 1,999,999 39390.0%2225-12.0%97.4%98.8%-1.4%584334.9%373215.6%1028914.6%574721.3%3.23.3-3.0%
$2,000,000 - $2,999,999 1619-15.8%3812216.7%95.8%100.0%-4.2%35329.4%222010.0%816819.1%2932-9.4%5.44.520.0% $3,000,000 and above 111010.0%6214342.9%94.4%94.1%0.3%2627-3.7%12119.1%12610026.0%221729.4%12.611.113.5% All Single-Family Homes241262-8.0%291770.6%97.8%99.0%-1.2%3663494.9%264269-1.9%80561830.3%4474450.4%3.52.825.0%
$300,000 - $399,999 735046.0%362356.5%96.9%97.3%-0.4%1319045.6%6572-9.7%40423969.0%95111-14.4%6.64.161.0%
$400,000 - $499,999 5278-33.3%402281.8%97.8%98.9%-1.1%14110534.3%5872-19.4%40225855.8%89103-13.6%6.54.062.5%
$500,000 - $599,999 58563.6%352352.2%98.1%98.2%-0.1%1259630.2%5259-11.9%33417887.6%7890-13.3%6.13.196.8%
$600,000 - $699,999 4749-4.1%3437-8.1%97.6%98.5%-0.9%1048325.3%3761-39.3%24813287.9%6679-16.5%6.52.9124.1%
$700,000 - $999,999 6180-23.8%352634.6%98.3%99.1%-0.8%13811025.5%5681-30.9%39323269.4%98115-14.8%6.33.865.8%
$1,000,000 - $1,499,999 1630-46.7%463339.4%95.6%96.2%-0.6%564719.1%292138.1%18414526.9%413228.1%8.47.610.5%
$1,500,000 - $1,999,999
April 2025 OAHU, HAWAII
(Acountofpropertiesthathaveclosedinagivenmonth)
$450,000-$599,9998714.3%796129.5% $600,000-$699,99979-22.2%93113-17.7%

$900,000-$999,9992330-23.3%316325-2.8%
$1,000,000-$1,499,99987817.4%1,00887115.7%

Sales by Price Range 12-mth Period: Single-Family

April 2025 OAHU, HAWAII
(Acountofpropertiesthathaveclosedinagivenmonth)
$150,000-$299,9994850-4.0%487523-6.9%
$600,000-$699,9994749-4.1%454551-17.6%
$700,000-$999,9996180-23.8%7447341.4%
$1,000,000-$1,499,9991630-46.7%26522915.7%

Median Days on Market by Price Range: Single-Family Homes
April 2025 OAHU, HAWAII
(Themediannumberofdaysfromwhenapropertyisfirstlistedtowhenanofferisaccepted)
$449,999andbelow14955.6%342254.5%
$450,000-$599,9998035128.6%2538-34.2% $600,000-$699,9996120205.0%3435-2.9%
Median Days on Market by Price Range
$900,000-$999,9993212166.7%1619-15.8%
$1,000,000-$1,499,999201625.0%1617-5.9%
$1,500,000-1,999,9992225-12.0%1519-21.1% $2,000,000-$2,999,9993812216.7%191258.3%
$3,000,000andabove6214342.9%3339-15.4%
Median Days on Market by Price Range 12-mth Period: Single-Family Homes
Median Days on Market by Price Range: Condos April 2025
(Themediannumberofdaysfromwhenapropertyisfirstlistedtowhenanofferisaccepted)
$150,000-$299,999524320.9%442576.0% $300,000-$399,999362356.5%362263.6%
$700,000-$999,999352634.6%252213.6%
$1,000,000-$1,499,999463339.4%373119.4%
April 2025
(Thepercentagefoundwhendividingaproperty'ssalespricebytheoriginallistprice;reportedpercentageisthemedianofallsalesfortheperiodandpricerangeindicated) Single-Family
$449,999andbelow106.5%123.0%-13.4%89.8%92.4%-2.8%
Median Percent of Original List Price Received by Price Range 1-mth Period: Single-Family Homes Apr-25 Apr-24
$700,000-$799,99996.5%100.0%-3
$1,000,000-$1,499,999100.0%98.
Median Percent of Original List Price Received by Price Range 12-mth Period: Single-Family Homes

April 2025
(Thepercentagefoundwhendividingaproperty'ssalespricebytheoriginallistprice;reportedpercentageisthemedianofallsalesfortheperiodandpricerangeindicated)
Median Percent of Original List Price Received by Price Range 1-mth Period: Condos
$149,999andbelow92.1%94.
$400,000-$499,99997.8%98.9%-1
$500,000-$599,99998.1%98.2%-0
$1,000,000-$1,499,99995.6%96.2%-0.6%96.0%96.2%-0.2% $1,500,000-$1,999,99983.3%94.
Median Percent of Original List Price Received by Price Range 12-mth Period: Condos 12-mth Median This Period 12-mth Median Last
This12-monthperiodreflectstheconsecutive12-monthperiodupthroughthecurrentmonth,whilelastperiod reflectsthesame12-monthperiodoneyearprior.
(Acountofpropertiesthathavebeennewlylistedonthemarketinagivenmonth)


$450,000-$599,999411-63.6%91892.2%
New Listings by Price Range 12-mth Period: Single-Family Homes 12-mth Total This Period 12-mth Total Last Period

$1,000,000-$1,499,999117135-13.3%1,3001,07720.7%
(Acountofpropertiesthathavebeennewlylistedonthemarketinagivenmonth)
$150,000-$299,999877417.6%76769410.5%
$700,000-$999,99913811025.5%1,3681,04630.8% $1,000,000-$1,499,999564719.1%52642224.6%

Listings by Price Range 12-mth Period: Condos 12-mth Total This Period 12-mth Total Last Period

April 2025
(Ameasureofcontractactivity/acountofpropertiesthathavehadoffersacceptedontheminagivenmonth)
$449,999andbelow36-50.0%373215.6%
$450,000-$599,99962200.0%998023.8%
$900,000-$999,99931303.3%3623600.6%
$1,000,000-$1,499,9998599-14.1%1,01290711.6%
Pending Sales by Price Range 12-mth Period: Single-Family Homes
April 2025
(Ameasureofcontractactivity/acountofpropertiesthathavehadoffersacceptedontheminagivenmonth)
$149,999andbelow20195.3%145162-10.5%
$150,000-$299,99944440.0%493539-8.5%
$300,000-$399,9996572-9.7%754763-1.2%
$400,000-$499,9995872-19.4%763797-4.3%
$500,000-$599,9995259-11.9%655735-10.9%
$600,000-$699,9993761-39.3%495574-13.8%
$700,000-$999,9995681-30.9%713755-5.6%
$1,000,000-$1,499,999292138.1%28422426.8%
$1,500,000-$1,999,99978-12.5%1007533.3%
$2,000,000andabove7616.7%8486-2.3%
Pending Sales by Price Range 12-mth Period: Condos

$449,999andbelow5425.0%
$450,000-$599,99925250.0%
$600,000-$699,9994519136.8%
$700,000-$799,999534420.5%
$2,000,000-$2,999,999816819.1%
$3,000,000andabove12610026.0%
status.
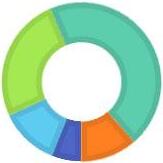
$599,999 and below
$600,000 to $799,999
$800,000 to $999,999
$1,000,000 to $1,999,999
$2,000,000 and above
$599,999 and below
$600,000 to $799,999
$800,000 to $999,999
$1,000,000 to $1,999,999
$2,000,000 and above
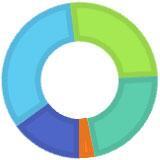
Inventory by Price Range

$150,000-$299,99927117654.0%
$300,000-$399,99940423969.0%
$2,000,000andabove12910127.7%
status.
$299,999 and below
$300,000 to $499,999
$500,000 to $699,999
$700,000 to $1,499,999
$1,500,000 and above
$299,999 and below
$300,000 to $499,999
$500,000 to $699,999
$700,000 to $1,499,999
$1,500,000 and above


$1,000,000

$599,999 and below
$600,000 to $799,999
$800,000 to $999,999
$1,000,000 to $1,999,999
$2,000,000 and above
$299,999 and
$300,000 to $499,999
$500,000 to $699,999
$700,000 to $1,499,999
$1,500,000 and above
$299,999 and below 182184177177170180196177152186185205210217223245253244281287292321308302326
$300,000 to $499,999 251252273272287314352363349386431464497517556593597597605624557615651729806
244236252233243234266296264273266280310343364391399420439446412460466519582
307289309323301304333337315343343364377396412473468463479490443470514543577
*Indicatormodifiedasof2021toreflectActivestatuslistingsonlyandappliedtohistoricalmonthlydatashownabove.Previousreportindicator,referredtoasActiveListings,reflectedallactivelymarketedlistingsinAandCstatus.
Total Inventory In Escrow* by Price Range: Single-Family Homes
April 2025
(Thenumberofpropertiesinanescrowstatusattheendofagivenmonth) Single-Family HomesApr-25Apr-24YOY chg
$449,999andbelow141216.7%
$450,000-$599,99913128.3%
$600,000-$699,999221729.4%
$700,000-$799,99932313.2%
$800,000-$899,99967661.5%
$900,000-$999,9994753-11.3%
$1,000,000-$1,499,999144158-8.9%
$1,500,000-1,999,999574721.3%
$2,000,000-$2,999,9992932-9.4%
$3,000,000andabove221729.4%
Total Inventory In Escrow by Price Range Single-Family Homes Apr-25 Apr-24
-
and above
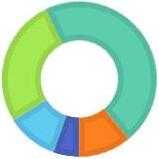
Inventory In Escrow - Percent Share by Price Range
$599,999 and below
$600,000 to $799,999
$800,000 to $999,999
$1,000,000 to $1,999,999
$2,000,000 and above
$599,999 and below
$600,000 to $799,999
$800,000 to $999,999
$1,000,000 to $1,999,999
$2,000,000 and above
(Thenumberofpropertiesinanescrowstatusattheendofagivenmonth)
Apr-25Apr-24YOY chg
$149,999andbelow2830-6.7%
$150,000-$299,9996567-3.0%
$300,000-$399,99995111-14.4%
$400,000-$499,99989103-13.6%
$500,000-$599,9997890-13.3%
$600,000-$699,9996679-16.5%
$700,000-$999,99998115-14.8%
$1,000,000-$1,499,999413228.1%
$1,500,000-$1,999,999111010.0%
$2,000,000andabove111010.0%
Inventory In Escrow by Price Range Condos

and above
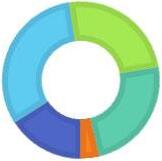
$299,999 and below
$300,000 to $499,999
$500,000 to $699,999
$700,000 to $1,499,999
$1,500,000 and above
$299,999 and below
$300,000 to $499,999
$500,000 to $699,999
$700,000 to $1,499,999
$1,500,000 and above
(Comparesactiveinventorytoarolling12-monthaverageclosedsales)
$449,999andbelow2.51.392.3%
$450,000-$599,9993.65.0-28.0%
$600,000-$699,9995.62.1166.7% $700,000-$799,9993.32.250.0%
$1,000,000-$1,499,9992.62.218.2%
$1,500,000-1,999,9993.23.3-3.0%
$2,000,000-$2,999,9995.44.520.0% $3,000,000andabove12.611.113.5%
Months Supply of Inventory Single-Family Homes
$599,999 and below
$600,000 to $799,999
$800,000 to $999,999
$1,000,000 to $1,999,999
$2,000,000 and above
(Comparesactiveinventorytoarolling12-monthaverageclosedsales)
$149,999andbelow4.22.850.0%
$150,000-$299,9996.64.065.0%
$300,000-$399,9996.64.161.0%
$700,000-$999,9996.33.865.8%
$1,000,000-$1,499,9998.47.610.5%
$1,500,000-$1,999,99911.511.6-0.9%
$2,000,000andabove16.114.411.8%
$299,999 and below
$300,000 to $499,999
$500,000 to $699,999
$700,000 to $1,499,999
$1,500,000 and above
OAHU, HAWAII: Jan 1987 to the Present


OAHU, HAWAII: Jan 1987 to the Present