THE 24TH ANNUAL REPORT ON THE

CONDITIONS OF CHILDREN IN ORANGE
COUNTY
LETTER FROM THE CHAIR
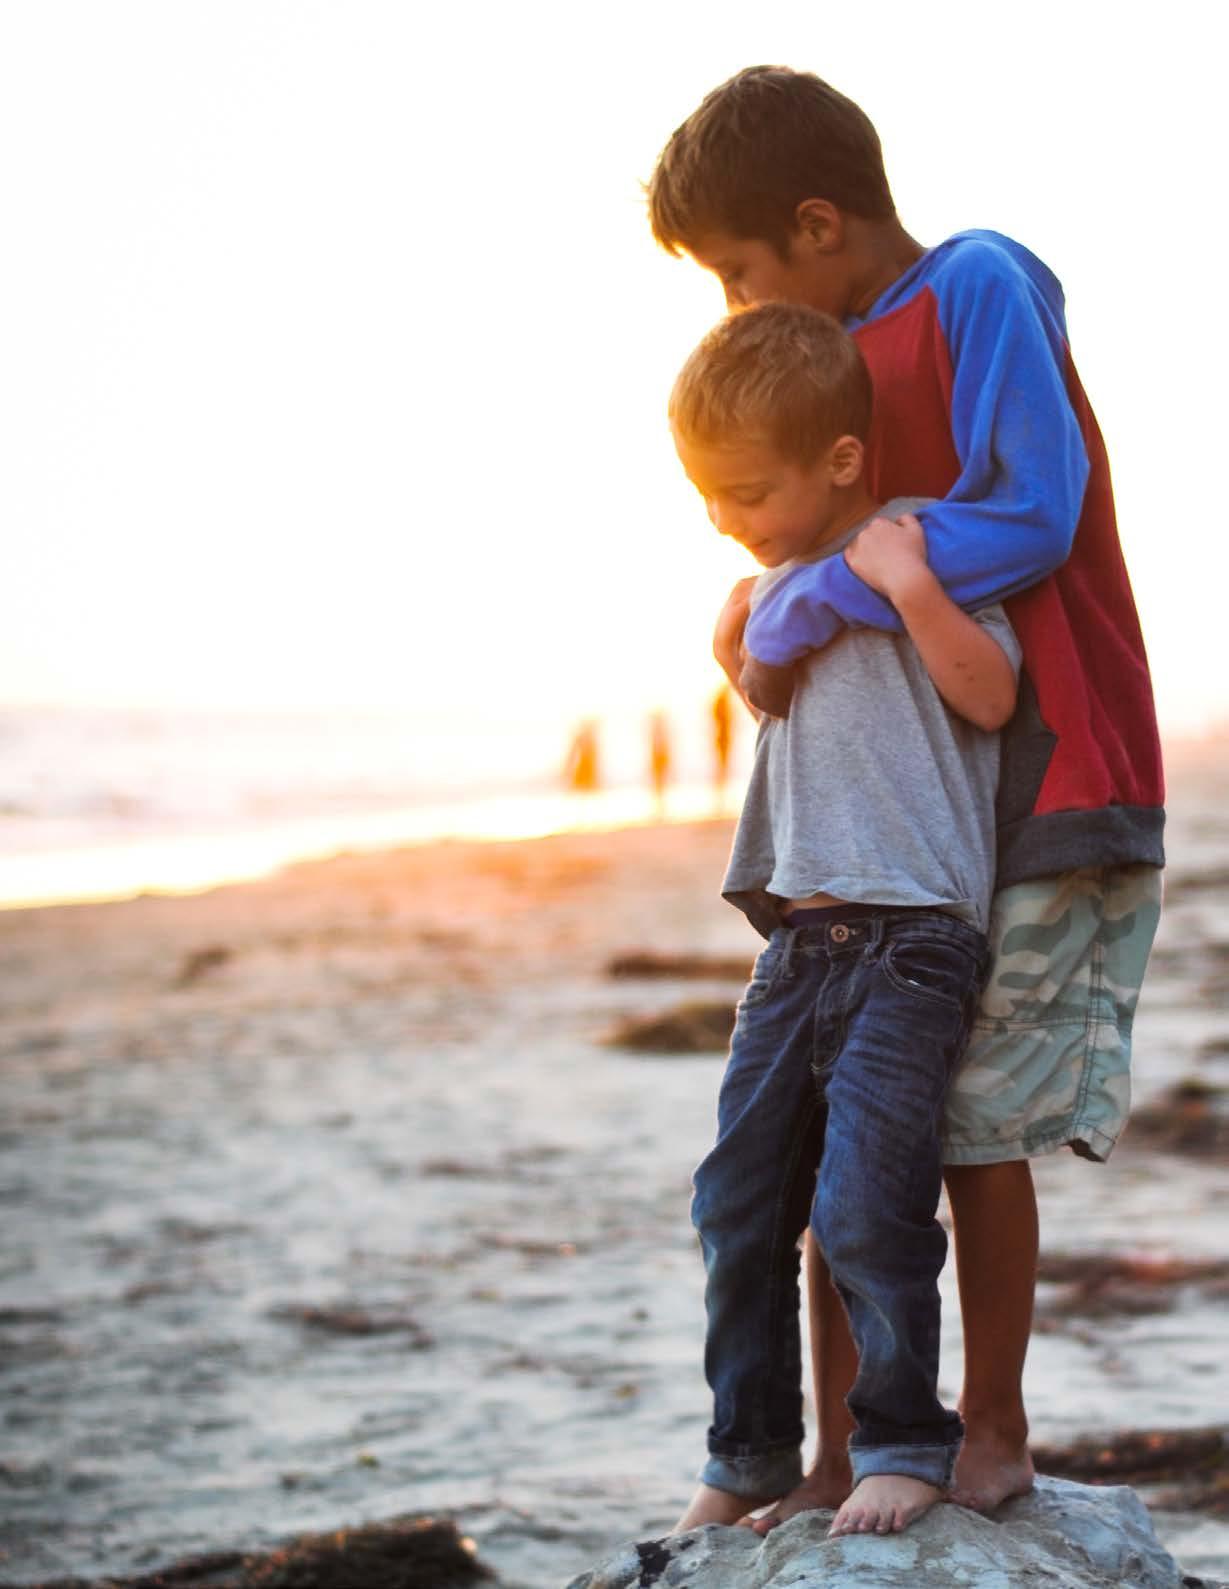
The future of Orange County rests in the health and well-being of our children. Each year, our Conditions of Children Report allows us an opportunity to assess our progress in order to ensure their future is bright.
There are many areas in which we have done well as a county this past year. For example, infant mortality rates are at their lowest level, and immunization rates for kindergartners are at their highest level in 10 years, while teen births have decreased by half. Student academic performance has improved in both literacy and math, with economically disadvantaged students showing the greatest improvement on standardized testing. Additionally, substantiated child abuse is down, as are juvenile arrests and youth gang-related activity. These improvements are the result of committed individuals and organizations working tirelessly to improve the lives of youth across Orange County.
While we continue to make great strides forward in many areas, we also recognize that our focus and innovative efforts are required to move the needle on other fronts. We must prioritize action to combat childhood poverty, obesity, housing insecurity and other issues that have substantial negative impacts on our children. Mental health continues to be an area in need of our attention. After dropping in 2015, children’s mental health and substance abuse related hospitalizations rose again in 2016. We must also continue to address disparities between ethnicities and races that persist for several of the indicators this report tracks. Innovative programs and approaches are needed to safeguard the well-being of our children.
As Chair of the Orange County Children’s Partnership, I am confident that by working together and investing in innovative solutions, such as providing mental health clinicians in schools or fostering public-private partnerships, we can help create a brighter future for every child. I hope this report will aid you as a resource by providing critical information in order to make Orange County a place where children continue to thrive. Join me, the Orange County Children’s Partnership, and the more than 20 organizations working on behalf of children and families in Orange County in forging a better future for our children, our communities and our world.
Sincerely,
Andrew Do
Chair, Orange County Children’s Partnership
ORANGE COUNTY CHILDREN’S PARTNERSHIP 2018 MEMBERS
Chair
Supervisor Andrew Do
First District
Chairman of the Orange County
Board of Supervisors
Vice Chair
Anne Bloxom
County of Orange Social Services
Agency/Children & Family
Services Division Director
Members
Eldon Baber
The Raise Foundation
Debra Baetz
County of Orange Social Services Agency
Agency Director
Kimberly Goll, MURP
Children and Families
Commission of Orange County
Eric Handler, MD, MPH
Orange County Health Care Agency/Public Health Officer
Hon. Joanne Motoike
Presiding Judge of the Orange County Juvenile Court
Sandra Hutchens
Orange County Sheriff
Fatima Juarez
Shatoya Wallace
Former Foster Youth
Susan Leibel
Juvenile Justice Commission
Cheryl Meronk, MSG, MBA
CalOptima
Al Mijares, Ph.D.
Orange County Superintendent of Schools
Rae Lynn Nelson Director
South Orange County SELPA
Paula Noden
Regional Center of Orange County
Leon J. Page
Orange County, County Counsel
Sharon Petrosino
Public Defender
For more information about the priorities, work and public meetings of the OCCP, please visit: ochealthinfo.com/phs/about/family/OCCP.
Tony Rackauckas
Orange County District Attorney
Richard Sanchez, REHS, MPH
Orange County Health Care
Agency Director
Denise Schleicher
Contract Attorney for Children

Steven J. Sentman
Chief Probation Officer
Vacant
Foster Parent Representative
Vacant
Group Home Representative
As of 8/2018
Letter from the Chair Executive Summary 2 The Work of the Orange County 3 Children’s Partnership Overlaying Data 4 Teen Self-Harm, Chronic Sadness, 5 and School Connectedness Orange County Snapshot 8 Good Health Indicators 10 ACCESS TO HEALTH CARE 12 EARLY PRENATAL CARE 14 INFANT MORTALITY 16 LOW BIRTH WEIGHT 18 PRETERM BIRTHS 20 TEEN BIRTHS 22 BREASTFEEDING 24 IMMUNIZATIONS 26 OBESITY 28 PHYSICAL FITNESS AND NUTRITION 30 BEHAVIORAL HEALTH 32 Economic Well-Being Indicators 34 CHILD POVERTY 36 CALWORKS 38 SUPPLEMENTAL NUTRITION 40 HOUSING 42 CHILD SUPPORT 44 Educational Achievement Indicators 46 KINDERGARTEN READINESS 48 THIRD GRADE ENGLISH LANGUAGE ARTS 50 THIRD GRADE MATHEMATICS 52 HIGH SCHOOL DROPOUT RATES 54 COLLEGE READINESS 56 Safe Homes and Communities Indicators 58 PREVENTABLE CHILD AND YOUTH DEATHS 60 SUBSTANTIATED CHILD ABUSE 62 CHILD WELFARE 64 JUVENILE ARRESTS 66 JUVENILE SUSTAINED PETITIONS 68 GANG ACTIVITY AMONG YOUTH 70 Index of Supplemental Tables 72 TABLE
OF CONTENTS
EXECUTIVE SUMMARY
Several indicators show overall improvement in children’s health, education and safety. Yet one in six children (17%) in Orange County are living in poverty.
The 24th Annual Report on the Conditions of Children in Orange County studies four interdependent focus areas: Good Health, Economic Well-Being, Educational Achievement and Safe Homes and Communities. Each focus area includes the most recent data for indicators to assess improving or worsening trends over 10 years.
Orange County children remain in good health with an uninsured rate of 2.5%, and teen birth rates and infant mortality rates at their lowest in 10 years. While there was a 10-year increase in children experiencing housing insecurity, fewer children were impacted in 2016/2017 than previous year. Students continue to show academic improvement, especially children in migrant education and children who are economically disadvantaged. The percentage of children and youth entering foster care and placed in a permanent home within 12 months has shown significant improvement and is now higher than the percentage in California.
Along with the positive trends, there are areas of concern, including serious mental illness,
continued disparities and an increase in the number of children living in poverty. Mental health related-hospitalizations grew 73% in the past 10 years. The overlay maps in this report explore the intersection of teen self-harm with other conditions such as school connectedness and chronic sadness and hopelessness. Also, disparities exist in Orange County among races and ethnicities, geographic communities, and school districts, depending on the indicator. Lastly, families continue to struggle economically, with more children (49%) eligible for free and reducedprice lunch while at the same time enrollment in CalWORKs, CalFresh and the Women, Infants, and Children (WIC) programs continue to decline.
Highlighting 10-year trends allows us to explore steady or improving indicators, such as uninsured rates and foster care placement in permanent homes, as well as indicators that need improvement, such as serious mental illness and disparities that need further exploration and attention so that all children in Orange County can thrive.
KINDERGARTEN READINESS
THIRD GRADE ENGLISH LANGUAGE ARTS
THIRD GRADE MATHEMATICS
OBESITY
PHYSICAL
HOUSING
HIGH SCHOOL DROPOUT RATES
COLLEGE READINESS
JUVENILE ARRESTS
JUVENILE SUSTAINED PETITIONS
GANG
2
IMPROVING NEEDS IMPROVEMENT GOOD HEALTH SAFE HOMES AND COMMUNITIES EDUCATIONAL ACHIEVEMENT ECONOMIC WELL-BEING EARLY PRENATAL CARE CALWORKS
NUTRITION CHILD WELFARE CHILD
CHILD POVERTY
SUPPLEMENTAL
SUPPORT
SUBSTANTIATED CHILD ABUSE
TO HEALTH CARE
ACTIVITY AMONG YOUTH PREVENTABLE CHILD AND YOUTH DEATHS ACCESS
INFANT MORTALITY LOW BIRTH WEIGHT PRETERM BIRTHS TEEN BIRTHS
BREASTFEEDING IMMUNIZATIONS
FITNESS AND
NUTRITION
BEHAVIORAL HEALTH
THE WORK OF THE ORANGE COUNTY CHILDREN’S PARTNERSHIP
The Orange County Children’s Partnership (OCCP) is a unified voice that champions health, education, safety and economic stability by advancing more responsive services that effectively meet the needs of children and families in Orange County communities.
Since 1982, the OCCP, comprised of public and community agencies, has worked tirelessly to address the changing needs of Orange County’s children, and create an environment in which all children can thrive. We believe by aligning our efforts we can achieve high impact results. Our priority areas are:
• Child Abuse/Neglect – WE CAN Coalition1
• Childhood Obesity
• Commercially Sexually Exploited Children
• Continuum of Care Reform (Assembly Bill 403)
• Early Childhood Development
• Food Security
• Mental Health Advocacy for Adolescents
Continuum of Care Reform
While the OCCP’s priorities cross many areas, the implementation of Assembly Bill 403, approved by Governor Brown in 20152, continues to be our immediate focus due to the magnitude of restructuring, licensing and training requirements of resource families. Over the past year, the OCCP put structures in place to ensure alignment and coordination, such as increased communication, increased transparency, and increased connectivity with the state for compliance with rules and regulations and timelines.
The OCCP organized two subcommittees and one ad hoc committee (see diagram). These subcommittees report to the OCCP regularly to obtain critical feedback.
Successes in this past year include:
• Group homes are beginning to transition to short-term residential therapeutic programs (STRTPs) and obtain provisional licenses. Initial concern that some group homes would close given new requirements has been alleviated.
• The Social Services Agency (SSA) has a closer working relationship with foster family agencies, relying on them to train and certify community members as resource families. This relationship allows SSA to focus on training and certifying kin care to become resource families. Improved referral processes have been established
• OCCP partners have begun to explore a secured facility for commercially sexually exploited children and youth with substance use disorders and other high needs to ensure they are safe and able to obtain needed treatment.
Remaining challenges include:
• Meeting the needs of Orange County’s high needs youth including: obtaining wraparound services for high needs youth placed with resource families to ensure needs are being met, and youth can remain in home; and finding families that can take emergency placements, sibling sets and children with enhanced behavioral and medical needs.
• The magnitude of changes all at once continue to challenge the system. The goal is to ensure Assembly Bill 403 is implemented in a timely fashion while meeting the needs of our most fragile and marginalized children.
Advocacy
OCCP has begun to track county and state legislation that impacts children and families. In the future, the OCCP may recommend and collectively take action on these legislative opportunities.
3
1 http://www.ochealthiertogether.org/tiles/index/display?alias=wecan 2 https://leginfo.legislature.ca.gov/faces/billNavClient.xhtml?bill_id=201520160AB403 2018 Focus
Short-Term Residential Therapeutic Programs Subcommittee
Secured Facility Ad Hoc Committee
Foster Family Agencies Subcommittee
Child Welfare Continuum of Care Reform
OVERLAYING DATA
The metrics of well-being that indicate success or challenges in communities across the county are interconnected and cannot be separated in the experience of children and families. Since none of the conditions measured in this report occur in isolation, each year the Conditions of Children report examines the intersection of related indicators by overlaying data to see if there are correlations (or lack thereof) to be explored.
This year, the Conditions of Children report examines the intersection of three measures: emergency department (ED) visits among teens because of self-harm; student self-reported chronic sadness; and school connectedness. This set of measures was, in part, selected in response to the increasing rate of suicide among Orange County youth. On average, over the past 10 years, 12.8 Orange County teens committed suicide each year. The annual 10-year average number of suicides among teen males is 9.5 suicide deaths and among females, 3.3 suicide deaths (10-19 year olds).
900 ED VISITS
2014 and 2016 in Orange County, the sizable majority of teen ED visits for self-harm were by females, 74% (n=1,991), compared to males at 26% (n=705). Mostly females experienced the notable rise in the number of ED visits, the steepest increase from 439 in 2010 to 694 in 2014, while males’ number of ED visits were between 212 and 237 for those same years. While the actual number of children directly impacted by self-harming behavior and/or suicide may be small, the impact on that child, their family, their
19 SUICIDES IN 2016
OC TEEN SUICIDES INCREASED FROM 7 IN 2007 TO 19 IN 2016
There is an existing, yet complicated relationship between suicide and self-harm. Many who engage in self-harm do not have the intention to self-kill and many who die by suicide have no history of self-harming behavior. However, research connecting self-harm injuries to suicide and suicide attempts identifies self-harm as an important risk factor for suicide and a reason to examine self-harm among youth. Over the past decade in Orange County, teens aged ten to 19 years have experienced an approximate increase of over 25% in the number and rate of Emergency Department visits for self-harm injuries. Between
schools, and their community is large. This exploration in overlaying data demonstrates where the impact may be greatest and identifies other potentially influential factors at play. It may raise further questions and fall short of conclusive findings, but it can be used to highlight areas for further investigation. By working to understand this complex story, Orange County can begin to identify and further support strategies to minimize the overall impact on children and families.
4
1 Self-harm Emergency Department visits include injuries from self-cutting, self-poisoning (e.g. overdosing on opioid or other medications), as well as other less common mechanisms.
EMERGENCY DEPARTMENT VISITS FOR SELF-HARM BY OC TEENS EACH YEAR ON AVERAGE BETWEEN 2014 AND 2016 2016 2015 2014 879 886 931
2007 2016
TEEN SELF-HARM, CHRONIC SADNESS, AND SCHOOL CONNECTEDNESS
Both chronic sadness and hopelessness can be risk factors for self-harm. Additionally, within the last 10 years, low school connectedness has been identified as a risk factor for self-harm.
Mapping ED visits for self-harm along with chronic sadness/hopelessness and school connectedness begins to show the role that mental health and a student’s environment – including both school and home – has in their decision-making to self-harm and/or commit suicide.
25% OF STUDENTS FEEL CHRONICALLY SAD OR HOPELESS
Consistent with the literature, the maps on the following pages show regions within Orange County where there is alignment between higher frequency of ED visits for self-harm among teens and high chronic sadness and low school connectedness, including certain areas of Westminster, Anaheim, and Lake Forest. In contrast, higher school connectedness and low chronic sadness appears to be associated with low self-harm ED visits, as seen in parts of Irvine, for example. Low chronic sadness was associated with low self-harm ED visits in regions of Newport Beach and north Lake Forest.
Areas of interest emerge that reveal exceptions to these linkages. For example, parts of Rancho Santa Margarita show high levels of school connectedness and low chronic sadness, yet have high numbers of self-harm ED visits among teens.
45% OF STUDENTS DO NOT HAVE A HIGH LEVEL OF SCHOOL CONNECTEDNESS
Regions of the city of Orange have low school connectedness and high chronic sadness, yet low number of self-harm ED visits among teens. Parts of Garden Grove and Brea have reports of high chronic sadness yet low ED visits. A deeper dive into these areas of interest suggests other factors that may influence these outcomes (see next page).
Indicator Definitions
Self-Harm ED Visits: Injuries from self-cutting, self-poisoning (e.g., overdosing on opioid or other medications), as well as other less common mechanisms
Chronic Sadness/Hopelessness: Being so sad or hopeless every day for two weeks or more that they stop doing some usual activities in the previous year
School Connectedness: Being treated fairly, feeling close to people, feeling happy, feeling a part of, and feeling safe at school
E.D. (2014). Correlates of Suicide Attempts among self-injurers: A meta-analysis. Clinical Psychology Review, 34(4), 282-297. Retrieved from https://doi.org/10.1016/j.cpr.2014.03.005. 5 Self Harm ED Visit rates data are from the California Office of Statewide Health Planning and Development (OSHPD) Emergency Department and Patient Discharge Data from years 2012 to 2016. 6 Young, R., Sweeting, H. & Ellaway, A. (2011). Do schools differ in suicide risk? the influence of school and neighbourhood on attempted suicide, suicidal ideation and self-harm among secondary school pupils. BMS Public Health, 11:874. DOI: 10.1186/1471-2458-11-874. 7 The California Healthy Kids Survey (CHKS) is the data source for chronic sadness and school connectedness. CHKS is an anonymous and voluntary survey to measure school health, including school climate, safety and overall wellness. The California Department of Education (CDE) encourages districts serving grades 5-12 to administer the CHKS as part of the California School Climate, Health, and Learning Survey (Cal-SCHLS) System
1 The suicide rate data are from the California Department of Public Health Death Static Master File (DSMF) from 2012 to 2016. 2 Mental Health First Aid. 3 Klonsky,E.D., May, A.M., & Glenn, C.R. (2013). The relationship between nonsuicidal self-injury and attempted suicide: Converging evidence from four samples. Journal of Abnormal Psychology, 221(1), 231-237. 4 Victor, S.E. & Klonsky,
Other Influencing Factors
Recognizing that the relationship among the three selected indicators is complicated, it is important to acknowledge that other indicators or conditions influence how children live, play and go to school. The table presents a subset of the report’s indicators that are potential risk factors for self-harm. A review of these additional factors may help to uncover reasons for why the experiences of children differ across Orange County when it comes to teen self-harm, chronic sadness/hopelessness, and low school connectedness. Readers are encouraged to look at these additional indicators and the extent to which a comparison of the overlay map aligns or does not align with the mapping of these additional indicators.
6 1 t 7 r a ; ' z x c v s p l ] 3 9 4 q w f k e h8 [ 6 i 2 j d 0 g 6 = o u \ y Teen Self-Harm and School Connectedness 1 ALISO VIEJO 2 ANAHEIM 3 BREA 4 BUENA PARK 5 COSTA MESA 6 COTO DE CAZA 7 CYPRESS 8 DANA POINT 9 FOUNTAIN VALLEY 0 FULLERTON - GARDEN GROVE = HUNTINGTON BEACH q IRVINE w LA HABRA e LA PALMA r LADERA RANCH t LAGUNA BEACH y LAGUNA HILLS u LAGUNA NIGUEL i LAGUNA WOODS o LAKE FOREST p LAS FLORES [ LOS ALAMITOS ] MIDWAY CITY \ MISSION VIEJO a NEWPORT BEACH s NORTH TUSTIN d ORANGE f PLACENTIA g RANCHO SANTA MARGARITA h ROSSMOOR j SAN CLEMENTE k SAN JUAN CAPISTRANO l SANTA ANA ; SEAL BEACH ' STANTON z TUSTIN x VILLA PARK c WESTMINSTER v YORBA LINDA Average % Reporting Low Levels of School Connectedness • 54.5% to 70.2% • 44.8 to 54.4% • 33.9 to 44.7 • 17.0% - 33.8% • No Data 70 - 126 49 - 69 27 - 48 0 - 26 Number of Emergency Department Visits by ZIP Code of Residence
Teen Self-Harm and Chronic Sadness/Hopelessness
Conditions of Children's Report Indicator Other Influencing Factors
Behavioral Health – Mental Health (p. 32)
Behavioral Health – Substance Use (p. 32)
Access to Healthcare (p. 12)
Poverty (p. 36)
Kindergarten Readiness (p. 48)
Substantiated Child Abuse (p. 62)
Self-harm is commonly associated with certain mental disorders, such as borderline personality disorder, depression, anxiety disorders, post-traumatic stress disorder and eating disorders.
People who harm themselves often do so while under the influence of alcohol or recreational drugs.
Influences prevention, early diagnosis, and treatment of health problems.
Influences academic achievement, abuse and neglect, behavioral, social-emotional problems, and physical health problems.
Indicator of both a child's family and community supports and environment.
Emotional neglect and abuse are significant predictors for self-harm.
7 8 j
• 33% and Greater • 28.6% - 33% • 25.6% - 28.5% • 17.8% - 25.5% • No Data Average % Reporting Chronic Sadness/Hopelessness 70 - 126 49 - 69 27 - 48 0 - 26 Number of Emergency Department Visits by ZIP Code of Residence 1 t 7 r a ; ' z x c v s p l ] 3 9 4 q w f k e h8 [ 6 i 2 j d 0 g 6 = o u \ y
ORANGE COUNTY SNAPSHOT
• Over 3.2 million people are living in Orange County1
• Median age is 37.72
• Population increase continues to be driven by natural increase* POPULATION INCREASE DUE TO NET MIGRATION
45.7% OF CHILDREN AGES 5 AND OLDER SPEAK A LANGUAGE OTHER THAN ENGLISH AT HOME9
YOUTH AGES 16-24 YEARS OLD WHO ARE NEITHER WORKING NOR IN SCHOOL11
LAST VISIT TO THE DENTIST WAS 6 MONTHS AGO OR LESS AMONG 3-11 YEAR OLDS 12
HEALTH STATUS OF 0 TO 17 YEAR OLDS IS EXCELLENT OR VERY GOOD13
Population
2007/08 2016/17 % CHILDREN IN ORANGE COUNTY NUMBER OF BIRTHS IN ORANGE COUNTY DEMOGRAPHICS6 2016 Children 0-17 2016 Total Population Black 1.7% 1.5% All Other 2.8% 5.1% 42.4% White 30.0% 47.1% Hispanic/Latino 34.2% Asian 18.9% 16.3% Good Health net migration -9,866 natural increase* 18,030 26,831 Asian Black 1.3% Hispanic or Latino Filipino 2.1% White Multiracial 3.7% Not Reported 0.8% 49.1% 16.4% 26.0% 79.3%
Asian/Pacific Islander Languages Other Indo/ European Languages Spanish 14.3% 4.1% 26.2% 44,0263 38,1214 2007 2016
VS NATURAL INCREASE5
69.2% Safe Homes and Communities
CHILDREN IN SINGLE PARENT HOUSEHOLDS10 24% 9.4% Note: Current data reflect the most recent year of data available, ranging from 2015 to 2017. *Natural increase is total births minus total deaths. Net migration is the net movement including intrastate, interstate, and international moves. 3,596
Other Languages 1.0% American Indian or Alaska
Pacific Islander 0.3%
Native 0.2%
2007 2016
GRADE K-12 STUDENT POPULATION BY RACE/ETHNIC GROUP8
25.5% 22.7%7
• 16.9% of children are living in poverty (120,188)14
• A minimum wage earner must work 184 hours/week to afford a two-bedroom apartment15
CHILDREN ARE READ TO DAILY (0 TO 5 YEARS OLD)26
MINIMUM INCOME NEEDED TO PURCHASE A MEDIAN-PRICED HOME23
1 California Department of Finance, State and County Population Projections (2010-2016) 2 U.S. Census Bureau, 2016 American Community Survey, 1-Year Estimates 3 Orange County Health Care Agency. 4 Orange County Health Care Agency. 5 California Department of Finance, “E-2. California County Population Estimates and Components of Change by Year – July 1, 2000-2017.” Table 1. 6 2016 American Community Survey 5-Year Estimates, Table S0201, S0901 7 2016 American Community Survey 5-Year Estimates, Table S0901. 8 CDE Dataquest, 2017-18. 9 American Community Survey 2016 1-Year Estimates. S1601.Language Spoken at Home. 10 2016 American Community Survey 5-Year Estimates, Table S0901. “Children in single parent households” means the child(ren) live with mother only or with father only. 11 Measure of America, 2016, http://www.measureofamerica. org/disconnected-youth/ 12 CHIS, 2016. 13 CHIS, 2016. 14 American Community Survey 2016 5-Year Estimates. S1701. 15 National Low Income Housing Coalition, Out of Reach 2018: California, http://nlihc.org/oor/california 16 https://data.bls.gov/map/MapToolServlet. 17 Feeding America, Map the Meal Gap, 2016. 18 Housing and Urban develop-ment, FY2018 Fair Market Rent Documentation System. 19 National Low Income Housing Coalition, Out of Reach 2018. 20 California Association of Realtors, Historical Housing Data, Median Prices of Existing Detached Home. 21 RENTCafe, July 2018. 22 ESRI & MRI GfK, 2017. Survey question asking “Thinking of the last 12 months, do you believe that you and your household are better off or worse off financially than you were one year ago?” 23 California Association of Realtors, Traditional Housing Affordability Index (HAI) measure. 24 U.S. Census Bureau, 2016 American Community Survey, 1-Year Estimates; 25 CDE Dataquest, 2017/18. 26 CHIS, 2016. 27 2016 American Community Survey 1-year Estimates, Table S2801 MEDIAN MARKET RENT18 3-bedrooms $2,626 2-bedrooms $1,876 1-bedroom $1,493 Economic Well-Being
Educational Achievement Access to Technology Individuals
Individuals
87.9% 90.6% 85.4%
have a smart phone27 Households own a computer27
have internet access27
61.3% 485,835 2017/18
UNEMPLOYMENT 2009 April 2018 2.6%16
$167,670 HOURLY WAGE19 Needed hourly wage to afford 2-bedroom fair market rent $36.08 Estimated hourly average renter wage $20.22
2018 40% 8.7% MEDIAN HOME PRICE AND MEDIAN AVERAGE RENTAL RATE20 Home Price $818,000 2018 Home Price $544,300 2009 Rental Rate $1,677 Rental Rate $1,92721 FOOD INSECURITY IN 201617 9.6% MEDIAN HOUSEHOLD INCOME ADJUSTED FOR INFLATION24
12 MONTHS22 Is Worse 20.0% Will be Worse 9.3% 2007 $73,263 $81,837 2016
STUDENT ENROLLMENT25
HOUSEHOLDS WHO COULD AFFORD A MEDIAN PRICED HOME IN
HOUSEHOLD IS WORSE NOW FINANCIALLY THAN IN THE LAST
GOOD HEALTH INDICATORS
PHYSICAL FITNESS AND NUTRITION

LOW BIRTH WEIGHT 6.5% 6.3% 2007 2016 PERCENT OF INFANTS WITH LOW BIRTH WEIGHT INFANT MORTALITY 4.2 1.5 2007 2016 RATE OF INFANT MORTALITY PER 1,000 LIVE BIRTHS IMMUNIZATIONS 90.0% 95.7% 2008 2017 PERCENT OF CHILDREN ADEQUATELY IMMUNIZED BY KINDERGARTEN BREASTFEEDING 63.1% 65.8% 2012 2017 PERCENT EXCLUSIVE BREASTFEEDING AT TIME OF HOSPITAL DISCHARGE EARLY PRENATAL CARE TEEN BIRTHS 88.1% 87.6% 2007 2016 29.6 10.9 2007 2016 PERCENT OF WOMEN WHO RECEIVED EARLY PRENATAL CARE IN THE FIRST TRIMESTER EXCLUDING SELF-PAY DELIVERIES BIRTH RATE PER 1,000 FEMALES 15 TO 19 YEARS OF AGE ACCESS TO HEALTH CARE PRETERM BIRTHS PERCENT OF UNINSURED CHILDREN 10.9% 2.5% 2008 2016 9.8% 8.0% 2007 2016 PERCENT OF PRETERM BIRTHS UPWARD TREND IMPROVEMENT DOWNWARD TREND IMPROVEMENT UPWARD TREND NEEDS IMPROVEMENT DOWNWARD TREND NEEDS IMPROVEMENT BEHAVIORAL HEALTH 16.8 24.2 2007 2016 HOSPITALIZATION RATE FOR SERIOUS MENTAL ILLNESS AND SUBSTANCE ABUSE
5.8% 6.2% 2013/14 2016/17 PERCENT OF 5TH GRADE STUDENTS WITH HEALTH RISK DUE TO AEROBIC CAPACITY OBESITY 18.3% 18.0% 2013/14 2016/17 PERCENT OF 5TH GRADE STUDENTS WITH HEALTH RISK DUE TO BODY COMPOSITION NOTE: Variation in data ranges are due to availability of data and frequency of data collection. GO TO TABLE OF CONTENTS

ACCESS TO HEALTH CARE
ACCESS IMPROVES FOR ALL RACIAL AND ETHNIC GROUPS.
DESCRIPTION OF INDICATOR
This indicator reports the number and percentage of children under 18 years old who are uninsured; the number and percentage who do not have a usual source of care; and those who experienced delayed care or did not receive medical care or prescription medications.
Why is this important?
Improving health care access for all children helps to improve prevention, early diagnosis and treatment of health problems. Children with health insurance are more likely to get timely prescription medications and medical or mental health care when needed; are more likely to get preventive care (including immunizations, dental care and vision screenings); and, overall, have better health outcomes.
Findings
• In 2016, 2.5% of children were uninsured, representing a drop in uninsured rates by 77.1% since 2008 (from 10.9%).
• Orange County went from having a higher rate of uninsured children in 2008 (10.9%) than California (10.0%) and the United States (9.3%), to having a lower rate than both California (2.9%) and the United States (4.5%) in 2016.
• More Hispanic children continue to have higher uninsured rates than other racial/ethnic groups, with 3.2% of Hispanic children uninsured in 2016, compared with Asian children (2.2%), White children (1.9%), and Other races (1.8%). However, this gap is shrinking.
• Uninsured percentages of very young children (0-5 years old) have dropped by 78.7%, from 8.9% in 2009 to 1.9% in 2016. Similarly, rates of uninsured 6-17 year olds have dropped by nearly three-quarters, from 11.2% in 2009 to 2.9% in 2016.
• In addition, the California Health Interview Survey (pooled estimate for 2012 through 2016) reveals:
– An estimated 10.5% of Orange County children annually did not have a usual source of care to go to when they were sick or needed health advice.
– Approximately 3.2% of Orange County children experienced a delay or lack of medical care, and 3.6% experienced a delay or lack of needed prescription medications.
– Most children who had access to a usual source of care went to a doctor’s office (69.3%), while 19.0% usually went to a clinic or community hospital. The proportion of children who had no usual source of care or who regularly visited an Emergency Department, urgent care center or other location for well care was approximately 10%.
12
Percent of Children Uninsured, by Race/Ethnicity
Percent of Children Under 18 Years Old Who Were
Percent of Children Under 18 Years Old Who Were Uninsured, by
to 2016
2010
• 2010 • 2011 • 2012 • 2013 • 2014 • 2015 • 2016 • 0-5 Years 2009 2012 2010 2016 2015 2014 2013 2011
Source: ACS (1 YR estimates, 2010-2016) Other includes: Black/African American, AIAN, 2+ races, and Other races Source: American Community Survey (2009-2016)
Community of Residence, 5 Year Average, 2016 e LA PALMA 5.7% r LADERA RANCH 3.3% t LAGUNA BEACH 4.4% y LAGUNA HILLS 7.1% u LAGUNA NIGUEL 3.3% i LAGUNA WOODS 0% o LAKE FOREST 4.9% p LAS FLORES 0.5% [ LOS ALAMITOS 10.9% ] MIDWAY CITY 11.3% \ MISSION VIEJO 3.2% a NEWPORT BEACH 2.3% s NORTH TUSTIN 2.7% GOOD HEALTH
Uninsured By Age Group, 2009 to 2016 12% 6 0 Source: American Community Survey, 2012-2016, 5 year Average 1 ALISO VIEJO 2.6% 2 ANAHEIM 5.6% 3 BREA 3.1% 4 BUENA PARK 2.6% 5 COSTA MESA 7.2% 6 COTO DE CAZA 2.5% 7 CYPRESS 5.3% 8 DANA POINT 5.3% 9 FOUNTAIN VALLEY 4.0% 0 FULLERTON 7.3% - GARDEN GROVE 4.8% = HUNTINGTON BEACH 3.3% q IRVINE 3.2% w LA HABRA 6.9% d ORANGE 4.8% f PLACENTIA 4.4% g RANCHO SANTA MARGARITA 2.0% h ROSSMOOR 2.5% j SAN CLEMENTE 3.9% k SAN JUAN CAPISTRANO 7.6% l SANTA ANA 7.6% ; SEAL BEACH 3.7% ' STANTON 7.1% z TUSTIN 5.4% x VILLA PARK 3.1% c WESTMINSTER 5.8% v YORBA LINDA 3.4% p 6 1 u 8 y i s j k r a h v f 3 0 4 w e ; c ] t z = 9 d 7 [ 2 x l' 5 q \ o g • 6-17 Years Hispanic Other White Asian 15% 10 5 0 15.0 11.5 10.2 10.3 6.7 6.8 6.3 6.8 7.1 4.7 4.5 5.0 2.5 2.6 1.8 1.5 1.8 3.0 3.0 3.7 3.0 2.2 2.6 1.9 4.3 3.2 4.7 4.0 • Greater than 10.0% • 7.0% - 9.9% • 4.0% - 6.9% • 0.0% - 3.9% • Unincorporated % Uninsured 10.7 7.6 5.6 4.5 3.2 2.4 5.6 9.4 8.1 5.9 3.9 8.6 ORANGE COUNTY: 2.5% CALIFORNIA: 2.9% 8.9 11.2 2.9 1.9 Source: U.S. Census Bureau, Tables S2701 (2009-2016 data) and B27001 (2008 data) • Orange County • California • United States Orange County, California and United States, 2008 to 2016 2008 2011 2009 2012 2016 2015 2014 2013 2010 12% 6 0 10.4 9.8 8.2 8.0 7.9 7.6 6.0 4.8 6.9 7.1 5.0 3.3 8.6 9.3 2.5 10.0 2.9 10.9 4.5 9.5 8.0 9.0 7.5 7.2 7.4 5.4 3.4 ACCESS TO HEALTHCARE SUPPLEMENTAL TABLES GO TO GO TO TABLE OF CONTENTS
EARLY PRENATAL CARE
DESCRIPTION OF INDICATOR
This indicator tracks the number and percent of infants born to women whose prenatal care began during the first trimester (the first three months) of pregnancy.
Why is this important?
Getting regular prenatal care as soon as a woman knows she is pregnant improves the potential for a healthy pregnancy resulting in a full-term baby. Ideally, this care should begin with a preconception care visit to a health care provider. Prenatal care provides screening and management of a woman’s risk factors and health conditions to reduce pregnancy complications, as well as education and counseling on healthy behaviors during and after pregnancy.1 While the value of initiating prenatal care during early pregnancy is not disputed, evidence equating late presentation to prenatal care with adverse pregnancy outcomes is limited. Additionally, certain genetic, behavioral, social, environmental, and other factors can also adversely affect the ability to have a healthy, full-term baby. Still, late presentation to prenatal care has been associated with risk of maternal death in all women (especially in minorities), increased rates of preterm delivery, low birth weight, and congenital malformations.2
Findings
• Orange County’s 2016 rate of women receiving early prenatal care was 84.4% – greater than the United States (77.1%).3
• In Orange County, the percent of women receiving early prenatal care decreased 4.1% since 2007, dropping from 88.0% in 2007 to 84.4% in 2016.4 However, this decrease is correlated with an increase in self-pay deliveries that began in 2014 5
– Self-pay deliveries are those paid through cash payment rather than health insurance and are often associated with foreign visitors that travel to the U.S. to give birth. These women generally arrive in the U.S. late in their pregnancy and leave shortly after giving birth; therefore, these births typically have no recorded prenatal care. In 2016, there were 3,602 self-pay deliveries in Orange County, an increase from 859 in 2007. Nearly 85% of self-pay deliveries in 2016 were among Asian women.
– When self-pay deliveries are excluded, the percent of women who received early prenatal care in Orange County in 2016 is 87.6%. While this still results in a lower rate than 2007 (88.1%), it reflects a more stable pattern.
• With self-pay deliveries excluded, 91.5% of White women received early prenatal care followed by Asian (89.5%), Hispanic (84.8%) and Black (80.4%) women. The most significant decreases in early prenatal rates are among women of “other” races (9.4%) and Black women (5.5%) since 2007.
14
EARLY PRENATAL CARE REMAINS STABLE; DISPARITIES BETWEEN ETHNICITIES AND RACES PERSIST.
1 Hagan, J. F., Shaw, J. S., and Duncan, P. M., Eds. (2008). 2 Smith, A. and Bassett-Novoa, E., Late Presentation to Prenatal Care, American Family Physician, Volume 92, Number 5, September 1, 2015. 3 United States: Centers for Disease Control, National Center for Health Statistics. 4 Further analyses of the California Birth Statistical Master Files indicate that early prenatal care in Orange County remains relatively stable when birth circumstances related to self-pay deliveries are considered. However, disparities between ethnicities and races persist. 5 Self-pay deliveries in Orange County increased substantially in 2014, 2015, and 2016. Analysis of trends indicates correlation of individuals with self-pay deliveries with lack of documentation of early prenatal care. Self-pay deliveries are mostly to Asian women. Self-pay deliveries only comprise a minor percentage for all other races/ethnicities and exclusion does not affect the prenatal care percentages for these groups.
Percent of Women who Received Early Prenatal Care
in the First Trimester, Orange County and California, 2007 to 2016
• Orange County
• Orange County, Excluding Self-Pay
• California
Note: California implemented a change in methodology for the collection of prenatal care information beginning in 2007, which likely resulted in reduced reports of early prenatal care after 2006.
*Other includes Pacific Islander, Multiracial, Other and Unknown.
Note: If comparing to state and national data, beginning in 2006, individuals whose race/ ethnicity is not stated or is unknown have been grouped with Non-Hispanic Whites for CA and USA statistics. As a result, Hispanic rates are potentially underestimated. Source: Orange County Health Care Agency, Family Health Division
Percent
of Women who Received Early Prenatal Care, Excluding Self-Pay Deliveries in Orange County, by City of Residence, 2016
e LA PALMA 86.4% r LADERA RANCH 94.8% t LAGUNA BEACH 92.6% y LAGUNA HILLS 90.0% u LAGUNA NIGUEL 89.2% i LAGUNA WOODS* 66.7% o LAKE FOREST 89.8% p LAS FLORES N/A [ LOS ALAMITOS 88.5% ] MIDWAY CITY 77.5% \ MISSION VIEJO 91.3% a NEWPORT BEACH 94.0% s ORANGE 88.2% d PLACENTIA 89.1% Note: N/A is no data available. *Laguna Woods rate is based on fewer than five births. Rates based on less than five events are unstable and should be interpreted with caution. Source: Orange County Health Care Agency, Family Health Division 1 ALISO VIEJO 92.4% 2 ANAHEIM 84.3% 3 BREA 90.3% 4 BUENA PARK 85.7% 5 COSTA MESA 90.6% 6 COTO DE CAZA 92.5% 7 CYPRESS 88.0% 8 DANA POINT 91.5% 9 FOUNTAIN VALLEY 85.5% 0 FULLERTON 86.7% - GARDEN GROVE 82.8% = HUNTINGTON BEACH 90.1% q IRVINE 91.8% w LA HABRA 87.9% f RANCHO SANTA MARGARITA 95.6% g ROSSMOOR N/A h SAN CLEMENTE 91.0% j SAN JUAN CAPISTRANO 85.1% k SANTA ANA 84.9% l SEAL BEACH 92.1% ; STANTON 85.5% ' TUSTIN 87.5% z VILLA PARK 85.7% x WESTMINSTER 82.6% c YORBA LINDA 91.4% • 50.1% - 80.0% • 80.1% - 85.0% • 85.1% - 90.0% • 90.1% - 100.0% • Unincorporated • No data available % of Women ORANGE COUNTY: 84.4% CALIFORNIA: N/A GOOD HEALTH 6 1 u 8 y i h j r a g c d 3 0 4 w e l x ] t ' = 9 s 7 [ 2 z k; 5 q \ o f
2007 2010 2013 2008 2011 2014 2009 2012 2016 2015 100% 50 0
California Source: California Department of Health, Vital Statistics
System. California data not available for 2016. Orange County Source: Orange County Health Care Agency, Family Health Division 87.4 87.6 88.9 88.9 88.9 89.1 88.3 87.9 88.1 86.1 83.2 88.3 88.6 88.7 89.0 88.2 87.8 88.0 85.2 84.4 84.6 81.3 80.4 80.2 79.8 78.5 75.7 74.4 87.8 100%
Query
• White • Asian 2007 2010 2013 2008 2011 2014 2009 2012 2016 2015
Early Prenatal
in the First Trimester, Excluding Self-Pay Deliveries, by Race/Ethnicity, 2007 to 2016 50 0 91.5 89.5 83.4 83.2 81.8 76.0 85.5 78.6 83.0 78.2 83.8 82.1 82.7 74.0 86.5 86.2 86.2 85.8 85.1 85.1 92.6 92.1 92.7 91.0 92.6 90.5 92.8 91.7 91.5 87.3 91.8 89.1 82.9 82.0 85.3 92.3 90.4 81.7 78.7 86.0 92.3 90.1 87.0 85.2 85.1 92.2 • Other* • Black • Hispanic 84.8 80.4 78.8 90.9 p EARLY PRENATAL CARE SUPPLEMENTAL TABLES GO TO GO TO TABLE OF CONTENTS
Percentage of Women who Received
Care
INFANT MORTALITY
DESCRIPTION OF INDICATOR
The infant mortality indicator refers to deaths of infants under one year of age. The number and rate of infant mortality is calculated per 1,000 live births per year.
Why is this important?
The infant mortality rate is a widely-used indicator of societal health because it is associated with maternal health, quality of and access to medical care, socioeconomic conditions and public health practices. Improvements in the infant mortality rate may reflect progress in medical technology, hygiene and sanitation systems, economic well-being and the availability and use of both preventive and clinical health services.1 Despite the overall declines in infant mortality since 2002, there remain significant disparities in the rates among Hispanics in Orange County, which remain higher than the overall county rate. In the past, these disparities had been only partially explained by factors such as adequacy and quality of prenatal care.
Findings
• In 2016, there were 104 infant deaths in Orange County.
• The infant mortality rate was 1.5 deaths per 1,000 births in 2016, a 64.3% decrease since 2007. This is lower than California’s rate of 4.22 and the United States’ rate of 5.9.3
• L eading causes of infant mortality were congenital anomalies (birth defects) (33.7%), maternal causes 4 (25.6%), other conditions of the perinatal period (18.7%), all other causes (9.4%), and short gestation/low birth weight (9.3%).
• In 2016, disparities among races and ethnicities narrowed. Infant mortality rates (per 1,000 live births) were highest among Hispanic infants (2.2), followed by White (1.6) and Asian (1.4) infants.5
16 1 MacDorman, M F, Mathew, MS, 2013. 2 State of California, Center for Health Statistics, Vital Statistics Query System. 3 Centers for Disease Control, CDC Wonder, 2016. 4 Maternal Causes includes causes such as hypertension, premature rupture of membranes, malpresentation, placenta previa, alcohol/drug abuse, or other complications of labor and delivery. 5 See supplemental tables for mortality rates for Black infants.
INFANT MORTALITY RATES REACH THEIR LOWEST IN 12 YEARS.
Rate per 1,000 Live Births Suffering Infant
•
•
•
Note: Rates based on less than five deaths are unstable, and therefore should be interpreted with caution. Black infant mortality rates are not included because the relatively low numbers of Black infant births and deaths in Orange County yield unreliable statistics for annual comparison.
Percent of Infant Deaths, by Cause, 2016
• Congenital Anomalies
• Maternal Causes*
•
• All Other Causes
• Short Gestation/Low Birth Weight
• Respiratory Distress Syndrome (RDS)
• Accidents and Adverse Effects
• Pneumonia and Influenza
• Sudden Infant Death
* Maternal Causes includes causes such as hypertension, premature rupture of membranes, malpresentation, placenta previa, alcohol/drug abuse, or other complications of labor and delivery.
Note: There were 104 infant deaths in 2016. Percent of Infant Deaths are rounded to the nearest whole number, therefore, sum does not equal 100.
Source: Orange County Health Care Agency, Orange County Coroner Division.
White
Hispanic
Asian Rate
Infant Mortality, by
and Ethnicity
to 2016 2016 6 2 4 0
per 1,000 Live Births Suffering
Race
2007
Source: Orange County Health Care Agency GOOD HEALTH 2.7 3.0 3.8 4.2 2.2 2.2 1.7 2.0 3.3 4.5 2.0 3.3 4.5 2.3 4.1 5.8 2.9 4.1 4.4 2.5 1.8 1.8 5.0 3.9 2007 2008 2011 2014 2009 2012 2015 2010 2013
Mortality Orange County and California, 2007 to 2016
Orange County • California 2007 2008 2011 2014 2009 2012 2015 2010 2013 2016 6 4 2 0 4.2 4.8 4.1 4.0 4.2 3.4 3.3 3.0 2.7 1.5 5.2 5.1 4.9 4.7 4.8 4.5 4.7 4.3 4.4 4.2 Source: Orange County Health Care Agency 2.2 1.6 4.4 3.9 2.9 1.4
•
Other Conditions of Perinatal Period
25.6% 18.7% 9.4% 33.7% 9.3% 0.0% 1.2% 1.2% 1.2% INFANT MORTALITY SUPPLEMENTAL TABLES GO TO GO TO TABLE OF CONTENTS
LOW BIRTH WEIGHT
LOW BIRTH WEIGHT REMAINS UNCHANGED AT 6.3% OF ALL BIRTHS.
DESCRIPTION OF INDICATOR
This indicator reports the total number of low birth weight infants and very low birth weight infants as a proportion of the total number of births. Low birth weight is defined as infants born weighing less than 2,500 grams (5 pounds, 8 ounces). Very low birth weight infants are defined as a subset of low birth weight infants born weighing less than 1,500 grams (3 pounds, 5 ounces).
Why is this important?
Low birth weight infants have an increased risk of experiencing developmental problems and delays. In addition, these infants are at higher risk for serious illness, disability, lifelong health difficulties and are more likely to die before their first birthday.1 Amongst very low birthweight infants, the risks are higher and the negative outcomes more severe, especially the risk of death in the first year with a 22% chance of dying, compared to 1% for low birth weight infants.2 The primary causes of low birth weight are premature birth and fetal growth restriction. Risk factors for low birth weight include smoking3, alcohol/ drug use during pregnancy, multiple births, poor nutrition, maternal age, socioeconomic factors, domestic violence and maternal or fetal infections.
Findings
• In 2016, there were 38,121 births to residents in Orange County, of which 6.3% (2,397) were low birth weight infants, a decrease from the high of 6.7% in 2011 and the same rate since 2012.
• Overall, the Orange County rate is lower than the 2016 rates for California (6.8%)4 and the United States (8.2%).5
• Very low birth weight infants comprised 1.0% (392) of the total births.
• When assessed by race/ethnicity, the percent of low birth weight infants within each group were: Black (11.0%), Asian (6.8%) Hispanic (6.4%), and White (5.3%) infants.
18 1 MacDorman, M. F., Mathews, T. J., & Declercq, E. R. (2012). 2 Mathews, T. J., MacDorman, M. F. (2013). 3 CDPH. October 2017. Pregnant and Breastfeeding Women and Cannabis. California Cannabis Health Information Initiative. 4 California Department of Public Health, Center for Health Statistics, Birth Files. 5 Centers for Disease Control, National Center for Health Statistics, 2017.
Percent of Infants with Low Birth Weight
Percent of Infants with Low Birth Weight, by
Note: N/A is no data available.
Woods rate is based on fewer than five births. Rates based on less than five events are unstable and should be interpreted with caution.
Community of Residence, 2016 w LA HABRA 4.9% e LA PALMA 5.8% r LADERA RANCH 6.9% t LAGUNA BEACH 7.1% y LAGUNA HILLS 5.4% u LAGUNA NIGUEL 4.7% i LAGUNA WOODS* 33.3% o LAKE FOREST 6.7% p LAS FLORES 6.7% [ LOS ALAMITOS 7.2% ] MIDWAY CITY 4.4% \ MISSION VIEJO 8.4% a NEWPORT BEACH 4.8% s NORTH TUSTIN N/A
Source: HCA Family Health Division 1 ALISO VIEJO 5.5% 2 ANAHEIM 7.1% 3 BREA 7.1% 4 BUENA PARK 4.0% 5 COSTA MESA 5.7% 6 COTO DE CAZA 2.4% 7 CYPRESS 6.8% 8 DANA POINT 5.9% 9 FOUNTAIN VALLEY 6.9% 0 FULLERTON 6.6% - GARDEN GROVE 5.7% = HUNTINGTON BEACH 5.7% q IRVINE 5.5% d ORANGE 5.8% f PLACENTIA 6.8% g RANCHO SANTA MARGARITA 5.5% h ROSSMOOR N/A j SAN CLEMENTE 3.0% k SAN JUAN CAPISTRANO 7.7% l SANTA ANA 7.1% ; SEAL BEACH 3.9% ' STANTON 4.1% z TUSTIN 7.7% x VILLA PARK 3.2% c WESTMINSTER 7.7% v YORBA LINDA 7.9% GOOD HEALTH % Low Birth Weight • 7.6% - 10.0% • 5.1% - 7.5% • 2.51% - 5.0% • 0.0% - 2.5% • Unincorporated • No data available p 6 1 u 8 y i j k r a h v f 3 0 4 w e ; c t z = 9 d 7 [ 2 x l' 5 q \ o g ORANGE COUNTY: 6.3% CALIFORNIA: 6.8% s
*Laguna
Orange County and California, 2007 to 2016 • Orange County • California 2007 2008 2011 2014 2009 2012 2015 2010 2013 2016 8% 6 4 2 0 Source: Orange County Health Care Agency, Family Health Division 6.3 6.5 6.4 6.6 6.4 6.7 6.3 6.3 6.3 6.3 6.8 6.9 6.8 6.8 6.8 6.8 6.7 6.8 6.7 6.8 ] • Black • Asian • White • Hispanic
of Infants with Low Birth Weight, by Race/Ethnicity 2007 to 2016 2007 2008 2011 2014 2009 2012 2015 2010 2013 2016 15% 5 10 0 5.7 6.0 6.1 6.1 8.2 7.2 6.7 7.3 10.4 11.7 9.5 10.9 5.6 5.9 6.0 5.5 5.8 6.3 7.8 13.2 6.3 6.5 7.8 10.4 6.1 6.2 7.4 10.9 6.0 6.7 8.1 9.0 Note: Due to relatively low numbers of Black infants and deaths, statistics for this group are unreliable. Source: Orange County Health Care Agency, Family Health Division 11.4 11.0 6.9 6.4 6.8 6.4 5.3 6.4 LOW BIRTH WEIGHT SUPPLEMENTAL TABLES GO TO GO TO TABLE OF CONTENTS
Percent
PRETERM BIRTHS
PRETERM BIRTHS INCREASE FOR SECOND CONSECUTIVE YEAR.
DESCRIPTION OF INDICATOR
This indicator reports the percentage of total annual births which are preterm. Preterm birth is defined as the delivery of an infant at less than 37 weeks of gestation, the period of time between conception and birth. Late preterm births (occurring between 34 to 36 weeks of gestation), moderate preterm births (occurring between 32 to 33 weeks of gestation), and very preterm births (occurring less than 32 weeks of gestation) are subsets of preterm births. Since 2014, preterm births have been calculated by establishing the gestational age based on the obstetric estimate. For years 2013 and earlier, the gestational age was calculated in the month prenatal care began by recording the date of the last normal menses. This change may lead to a slight discontinuity in prenatal care results between years 2013 and 2014.
Why is this important?
Preterm birth is an important public health issue requiring sustained focus on its causes, consequences, and prevention strategies.1 Several factors – economic, personal, medical, and behavioral – may increase the likelihood that a woman has preterm labor and delivers early.2 Compared to infants born at term, preterm infants are more likely to suffer lifelong neurologic, cognitive and behavioral problems.3,4 Preterm births and low birth weight are often, but not always, associated. Preterm births cost the U.S. health care system more than $26 billion each year.5
Findings
• Preterm births accounted for 8.0% of the 38,121 births to Orange County residents in 2016. While this is up slightly from 2015 (7.6%), it is down 18.4% from 2007 when preterm births were at 9.8%. By comparison, the rate for the United States was higher at 9.8% (5.8% decrease since 2007) in 2016.
• Disparities persist with preterm births among Black infants at 12.8%, followed by Hispanic (8.8%), White (7.9%), and Asian (7.3%) infants. The percentages decreased for all races and ethnicities, compared to 2007.
• Out of all preterm births, the percentage of preterm births was lowest among women less than 15 years old (0.03%) and highest among women 30 to 34 years old (32.2%).
• Women 40 years and older have the highest percentage of late preterm births (8.9%) compared to teens under 15 years of age who have no late preterm births (0.0%).
20 1 Surgeon General’s Conference on the Prevention of Preterm Birth, 2008. 2 Centers for Disease Control, Preterm Birth Infographic. 3 Martin, J.A., et al, 2012. 4 Mathews, T.J., MacDorman, M.F., 2012. 5 Centers for Disease Control and Prevention, Reproductive Health, 2013.
Percent of Preterm Births
Note: Percent calculated from number of births with known obstetric estimate gestational age less than 37 weeks for 2014. Rates prior to 2014 were calculated from last menstrual cycle dates.
Agency; March of Dimes Report Card.
Percent of Preterm Births, by Race/Ethnicity
Percent of Preterm Births, by Mother’s Age
Orange County, 2016
Note: Percent calculated from number of births with known obstetric estimate gestational age less than 37 weeks for 2014. Rates prior to 2014 were calculated from last menstrual cycle dates.
Percent of Preterm Births, by Community,
2008 2012 2009 2013 2015 2010 2014 2016 2007 2011
Orange County, California and United States, 2007 to 2016 • United States • California • Orange County
County of Orange Health Care
Source:
2007 to 2016 • Black • White • Hispanic • Asian
Source: County of Orange Health Care Agency
2016 r LA PALMA 8.3% t LADERA RANCH 8.7% y LAGUNA BEACH 6.4% u LAGUNA HILLS 7.0% i LAGUNA NIGUEL 7.7% o LAGUNA WOODS 0.0% p LAKE FOREST 8.6% [ LOS ALAMITOS 10.6% ] MIDWAY CITY 6.7% \ MISSION VIEJO 10.1% a NEWPORT BEACH 7.3% s NEWPORT COAST 4.3% d ORANGE 7.6% f PLACENTIA 10.3% Source: Orange County Health Care Agency, Family Health Division 1 ALISO VIEJO 10.2% 2 ANAHEIM 8.4% 3 BREA 8.4% 4 BUENA PARK 7.9% 5 COSTA MESA 6.6% 6 COTO DE CAZA 7.1% 7 CYPRESS 8.9% 8 DANA POINT 6.6% 0 FOUNTAIN VALLEY 6.7% - FULLERTON 8.9% = GARDEN GROVE 8.2% q HUNTINGTON BEACH 7.4% w IRVINE 5.5% e LA HABRA 7.2% g RANCHO SANTA MARGARITA 7.5% h ROSSMOOR N/A j SAN CLEMENTE 5.0% k SAN JUAN CAPISTRANO 12.4% l SANTA ANA 9.2% ; SEAL BEACH 9.8% ' STANTON 6.0% z TUSTIN 8.5% x VILLA PARK 9.7% c WESTMINSTER 9.2% v YORBA LINDA 9.4%
GOOD HEALTH • 15.1% - 20.0% • 10.1% - 15.0% • 5.1% - 10.0% • 0.0% - 5.0% • Unincorporated • No data available % Preterm Births 6 1 u 8 y i j k r \ v d 3 0 4 w e ; c [ t z = 9 s 7 p 2 x l' 5 q ] o f 20% 15 5 10 0 9.7 9.7 9.4 13.5 9.7 9.0 9.0 11.7 9.4 9.2 14.7 9.6 9.0 8.5 13.4 9.4 8.9 8.9 11.8 8.9 8.3 7.7 10.1 10.9 10.8 7.3 6.7 8.0 7.0 8.6 8.1 7.5 6.1 7.1 6.0 ORANGE COUNTY: 8.0% CALIFORNIA: 8.6% 16.3 12.8 8.8 7.9 7.3 15% 10 5 0 2008 2012 2009 2013 2015 2010 2014 2016 2007 2011 10.4 10.9 9.8 10.4 10.5 9.5 10.0 9.9 9.1 9.8 9.8 9.0 9.8 8.8 9.6 9.6 9.6 9.6 8.3 8.5 8.4 7.8 7.4 7.6 10.1 10.3 9.4 8.6 9.8 8.0 a • ‹15 Years • 15-19 Years • 20-24 Years • 25-29 Years • 30-34 Years • 35-39 Years • 40+ Years 0.03% 8.34% 3.20% 10.92% 20.98% 32.19% 24.34% h PRETERM BIRTHS SUPPLEMENTAL TABLES GO TO GO TO TABLE OF CONTENTS
Source: Orange County Health Care Agency
TEEN BIRTHS
TEEN BIRTH RATE AMONG HISPANIC TEENS DROPS NEARLY 70% OVER 10 YEARS.
DESCRIPTION OF INDICATOR
This indicator reports the percent of total annual births occurring among females ages 19 years and under and the teen birth rate, which is a calculation of annual teen births per 1,000 females ages 15 to 19 years per year.
Why is this important?
Giving birth as a teen can have profoundly negative consequences for both the teen parents and the infant. Teen births may also have negative consequences for society. Teen mothers are less likely to complete high school or college. They are more likely to require public assistance and live in poverty than their peers who are not mothers.1 Infants born to teen mothers are at greater risk for low birth weight, preterm birth, and death in infancy. These infants have a lower probability of obtaining the emotional and financial resources they need throughout childhood to develop into independent, productive, well-adjusted adults.2 For society, teen births in the United States cost taxpayers an estimated $5.2 billion in 2013. Estimated taxpayer costs were $590 million for California and $35 million for Orange County in 2013 (societal costs are estimated to be even higher). Teen birth rates have declined significantly since 1991, representing an estimated annual U.S. taxpayer savings of $1.8 billion.3
Findings
• In 2016, 3.2% (1,220) of total annual births were to teen females ages 19 years and younger, a 54% decrease from 7.0% (3,082) in 2007. Overall, total county births decreased 13.4% from 44,026 in 2007 to 38,121 births in 2016.
• The teen birth rate in Orange County in 2016 was 10.9 births per 1,000 females ages 15 to 19, a decrease of 63.2% from 29.6 births per 1,000 in 2007.
• At 10.9 births per 1,000 teen females, Orange County has a lower teen birth rate than California (15.7)4 and the United States (20.3).5
• When assessed by race/ethnicity, Hispanic teens had the highest birth rate (21.0 per 1,000 teen females), followed by Black (16.3), White (2.9), and Asian (0.9) teens.
• Teen birth rates have declined for all races and ethnicities, with Hispanic teens experiencing the most dramatic drop (66.9% in 10 years).
22 1 Healthy People 2020, 2014. 2 CDC, Vital Signs: Teen Pregnancy, 1991-2009. 3 Public Health Institute, No Time for Complacency Teen Births in California, updated February 2016 using 2013 birth data from the California Department of Public Health and 2013 population projections from the California Department of Finance. 4 State of California, Health Information and Research Section. 5 CDC, National Vital Statistics Reports: National Center for Health Statistics.
Birth Rate per 1,000 Females 15 to 19 Years of Age Orange
• United States
• California
Birth Rate per 1,000 Females 15 to 19 Years of Age, by Race/Ethnicity 2007
• Hispanic
• Black
• Non-Hispanic White
• Asian
Birth Rate per 1,000 Females 15 to 19 Years of Age, by Community of Residence, 2012 to 2016, 5 Year Average
Source: Orange County Health Care Agency
County, California and United States, 2007 to 2016
• Orange County
to 2016 Note: Rates calculated using data from State of California, Department of Finance Source Orange County: Orange County Health Care Agency Source California: State of California, Health Information and Research Section. Source United States: National vital statistics reports: National Center for Health Statistics 2007 2008 2011 2014 2009 2012 2015 2010 2013 2016 0 80 20 60 0
w LA HABRA 16.1 e LA PALMA 2.2 r LADERA RANCH 0.0 t LAGUNA BEACH 0.0 y LAGUNA HILLS 4.9 u LAGUNA NIGUEL 3.9 i LAGUNA WOODS 0.0 o LAKE FOREST 7.6 p LOS ALAMITOS 4.1 [ MIDWAY CITY 10.1 ] MISSION VIEJO 3.1 \ NEWPORT BEACH 0.0 a ORANGE 12.1 s PLACENTIA 11.0 Note: N/A indicates no data are available. Source: Orange County Health Care Agency, Family Health Division Population source: U.S. Census Bureau, American Community Survey, Five Year Average Population, 2012-2016 1 ALISO VIEJO 4.1 2 ANAHEIM 21.4 3 BREA 5.2 4 BUENA PARK 16.1 5 COSTA MESA 18.2 6 COTO DE CAZA 0.0 7 CYPRESS 3.3 8 DANA POINT 16.1 9 FOUNTAIN VALLEY 3.5 0 FULLERTON 12.8 - GARDEN GROVE 14.3 = HUNTINGTON BEACH 5.7 q IRVINE 1.1 d RANCHO SANTA MARGARITA 3.9 f ROSSMOOR 0.0 g SAN CLEMENTE 9.2 h SAN JUAN CAPISTRANO 10.7 j SANTA ANA 27.5 k SEAL BEACH 0.0 l STANTON 8.7 ; TRABUCO CANYON N/A ' TUSTIN 15.4 z VILLA PARK 0.0 x WESTMINSTER 7.4 c YORBA LINDA 1.3 50 40 10 20 30 GOOD HEALTH • Greater than 25.1 • 18.1 - 25.0 • 5.0 - 18.0 • Fewer than 5.0 • Unincorporated • No data available Teen Birth Rate per 1,000 Females 41.5 39.1 34.2 20.2 19.2 16.7 14.8 12.0 25.7 22.7 21.1 19.0 29.4 26.5 24.2 22.3 28.0 31.3 38.3 35.4 31.5 27.7 25.3 22.5 ORANGE COUNTY: 10.9 CALIFORNIA: 15.7 40 2007 2008 2011 2014 2009 2012 2015 2010 2013 2016 2.5 3.3 2.5 1.8 2.3 2.2 1.3 58.2 51.4 44.3 40.0 38.1 32.8 28.6 26.1 18.9 13.3 13.5 12.9 11.4 17.4 7.7 6.7 6.8 5.1 4.5 4.2 4.7 21.0 23.7 10.9 15.7 20.3 16.3 9.0 2.9 3.5 0.9 1.6 25.2 6.9 3.4 63.5 42.5 40.1 29.6 6 1 u 8 y i g h r \ f c s 3 0 4 w e k x t ' = 9 a 7 p 2 z jl 5 q ] o ; d [ TEEN BIRTHS SUPPLEMENTAL TABLES GO TO GO TO TABLE OF CONTENTS
BREASTFEEDING
DESCRIPTION OF INDICATOR
This indicator reports the prevalence of breastfeeding using two California Department of Public Health data sources. The In-Hospital Newborn Screening Program documents feeding practices at the time of hospital discharge. The Maternal Infant Health Assessment (MIHA) is an annual statewide-representative survey of women with a recent live birth in California. In-Hospital Newborn Screening data are presented as the percent of mothers breastfeeding in the hospital after birth; MIHA data are presented as the percent of mothers who reported breastfeeding at one month after delivery and at three months after delivery.
Why is this important?
Human milk is the optimal source of nutrition and provides many benefits for healthy infant growth and development. Breast feeding significantly reduces infant risks for infections, asthma or allergies compared to infants who are formula fed, resulting in fewer hospitalizations and trips to the doctor.1 Evidence also demonstrates that breastfeeding reduces the risk for cardiovascular disease, asthma and diabetes later in life and can reduce the risk of childhood obesity.2 These benefits increase greatly when a mother exclusively feeds for the first six months of life.
Breastfeeding can provide protective health benefits for the mother who breastfeeds frequently enough for sufficient duration. The breastfeeding mother may experience less postpartum bleeding (which conserves iron in the body), less risk for post-menopausal osteoporosis and hip fracture, an earlier return to pre-pregnancy weight, and decreased risks of breast and ovarian cancers.
Breastfeeding also benefits the entire family and community. It improves household food security because families need not use income to buy formula, food and bottles. Health care related expenses decrease because breastfeeding protects the infant and mother.
Findings
• In 2017, 65.8% of Orange County women were exclusively breastfeeding at time of hospital discharge, lower than California at 69.8% of women.
• Exclusive breastfeeding at time of discharge was highest among White women at 82.0%, followed by multiracial (76.0%), Black (65.7%), Hispanic (62.7%), Pacific Islander (62.5%), and Asian (52.1%) women.
• In 2015/16, 50.8% of Orange County women surveyed by MIHA were exclusively breastfeeding one week after delivery, an 0.4% decrease since 2013/14, and lower than women in California at 58.9%.
• One month after delivery, 41.5% of Orange County women surveyed by MIHA in 2015/16 were exclusively breastfeeding, an 5.6% increase since 2013/14, and lower than women in California at 47.8%.
• Three months after delivery, 31.6% of Orange County women surveyed by MIHA in 2015/16 were exclusively breastfeeding, a 21.1% increase since 2013/14, and lower than women in California 32.6%.
24
THE PERCENTAGE OF MOTHERS EXCLUSIVELY BREASTFEEDING THREE MONTHS AFTER DELIVERY INCREASED MORE THAN 20% SINCE 2013/14.
1 Bartick M, Reinhold A., 2010. 2 Gartner LM, et al., 2005.
Hospital Discharge Breastfeeding Percents in Orange County and California, 2012 to 2017
• Orange County Any Breastfeeding
• California Any Breastfeeding
• California Exclusive Breastfeeding
• Orange County Exclusive Breastfeeding
Source: California Department of Public Health, Center for Family Health, Genetic Disease Screening Program, Newborn Screening Data, 2017. NBS Form Version (D) Revised 12/2008. Maternal, Child, and Adolescent Health Program.
Hospital Discharge Breastfeeding Percents, by Race/Ethnicity, 2017
• Exclusive Breastfeeding
• Any Breastfeeding
Source: California Department of Public Health. Center for Family Health, Genetic Disease Screening Program, Newborn Screening Data, 2017. NBS Form Version (D) Revised 12/2008. Maternal, Child, and Adolescent Health Program.
Breastfeeding Percentages at One Week, One Month, and Three Months After Delivery, 2013/14 to 2015/16
• Any breastfeeding 1 week postpartum
• Any breastfeeding 1 month postpartum
• Any breastfeeding 3 months postpartum
• Exclusive breastfeeding 1 week postpartum
• Exclusive breastfeeding 1 month postpartum
• Exclusive breastfeeding 3 months postpartum
Note: Indicators for breastfeeding at three months postpartum are limited to women whose infant was at least three months old at the time of survey completion.
Note: MIHA is an annual population-based survey of California resident women with a live birth. Data from MIHA 2015-2016 were combined, resulting in a statewide sample size 13,431. The sample size of Orange county was 447. Prevalence (%), 95% confidence interval (CI) and estimated number of women in the population breastfeeding (rounded to the nearest hundred) are weighted to represent all women with a live birth who resided in California and the county in 2015-2016. Population estimate (N) is a two-year average. See the Technical Notes for information on weighting, comparability to prior years and technical definitions. Visit the MIHA website at www.cdph.ca.gov/MIHA.
Source: Sacramento: California Department of Public Health, Maternal, Child, and Adolescent Health Program, 2017
GOOD HEALTH
100% 100% 100% 80 60 40 20 80 75 86.3 91.8 78.0 42.8 32.0 51.4 60 0 0 0 25 50 40 20 2013/14 2015/16 2014/15 Any Breastfeeding Any Breastfeeding Exclusive Breastfeeding White 82.0 96.5 Multiple 76.0 95.7 Other 67.3 95.2 Black 65.7 92.2 Total 65.8 94.8 Hispanic 62.7 94.4 Pacific Islander 62.5 85.4 Asian 52.1 93.7 87.0 76.7 50.8 41.5 31.6 93.6 90.8 73.4 39.3 85.7 51.0 26.1 93.9 94.8 95.1 95.0 92.9 93.5 93.9 64.6 66.6 68.6 63.8 64.6 67.1 2012 2013 2016 2015 2017 2014 Exclusive Breastfeeding 93.3 92.2 62.4 63.1 94.8 94.0 94.0 65.8 66.1 69.8 69.4 BREASTFEEDING SUPPLEMENTAL TABLES GO TO GO TO TABLE OF CONTENTS
IMMUNIZATIONS
IMMUNIZATION FOR KINDERGARTENERS REACHES THE HIGHEST LEVEL IN 10 YEARS.
DESCRIPTION OF INDICATOR
This indicator reports the percent of children who received all of the doses of specific vaccines recommended by their 2nd birthday and required at kindergarten entry. Data at the 2nd birthday are based upon annual retrospective reviews of a sample of randomly selected schools’ kindergarten immunization records and therefore represent vaccination trends three years prior.
Why is this important?
The widespread use of safe, effective childhood vaccinations has been one of the most successful and cost-effective public health interventions in the U.S. and globally. Many serious and once-common childhood infections have been dramatically reduced through routine immunizations. The success of immunization programs depends upon appropriate timing and on a high rate of vaccine acceptance, particularly among parents of young children.
Over the past decade, increasing numbers of children with delayed or refused vaccinations have led to reduced levels of vaccine coverage. Studies have found that children whose parents delay or refuse vaccines are more likely to be White and reside in well-educated, higher income areas.1 On the population level, success depends on a community achieving a threshold level of immunity, and many communities are below the protective level needed to prevent the spread of disease.2
Findings
• In 2017, 77.9% of Orange County children entering kindergarten had been adequately immunized (4:3:1 schedule) at their 2nd birthday, lower than the high of 78.9% in 2014.3
• In 2017, 95.7% of Orange County kindergartners had up-to-date immunizations, a 7.9% increase from the 10-year low at 88.7% in 2013, and
exceeding the high of 95.5% in 2016. Children attending private schools in Orange County tend to have lower levels of up-to-date immunizations compared to public schools at kindergarten entry (93.0% vs. 96.2%).
• These percents and trends are similar to those among kindergartners throughout California, who were immunized at a rate of 95.1%.4
• One school district, comprised of Laguna Beach Unified public schools and private schools in the area, had 88.5% or fewer of kindergartners with up-to-date immunization levels. However, seven school district regions remain below the recommended immunization rate of 95%. This correlates with higher percentages of permanent medical exemptions and conditional enrollments.5
Effective July 1, 2016, California law now removes the personal belief exemption from statute and requires almost all schoolchildren to be fully vaccinated in order to attend public or private elementary, middle and high schools. For kindergarten entrance, children must be immunized against 10 diseases:
Diphtheria, Haemophilus Influenza Type B (Bacterial menigitus), Measles, Mumps, Pertussis (whooping cough), Polio, Rubella, Tetanus, Hepatitis B and Varicella (chicken pox). Home school students or students who do not receive classroom-based instruction are not required to be vaccinated. Students who qualify for an Individualized Educational Program cannot be prevented from accessing any special education and related services required by their IEP. The medical exemption will remain in statute.
26 1 Wei, F., Mullooly, J.P., Goodman, M. et al., 2009. 2 Hussain, H. et al., 2011. 3 Adequately Immunized-4:3:1 or Better: In order to be considered adequately immunized by age two, children need to have at least the 4:3:1 immunization series, which includes: four or more doses of diphtheria/tetanus/pertussis (DTaP) vaccine, three or more doses of poliovirus vaccine, and one or more doses of measles/ mumps/rubella (MMR) vaccine. 4 California Department of Public Health, Immunization Branch. 5 Personal belief exemptions filed with a school before January 1, 2016 are valid until entry into the next grade span (7th through 12th grade). Personal beliefs exemptions may be transferred between schools in California, both within and across school districts. Conditional enrollment is when a child is behind on their required immunizations and may be admitted conditionally if they are not currently due for any doses or have a temporary medical exemption.
Immunizations at Kindergarten Enrollment, Private and Public Schools within Each School District,
GOOD HEALTH Percent of Adequately Immunized Children Enrolling in School Between 2008 and 2017 in Orange County and California • Up-To-Date at Kindergarten Entry, California • Up-To-Date at Kindergarten Entry, Orange County • Up-To-Date at 2nd Birthday, Orange County Note: 2006 to 2010 Orange County data includes other Southern California counties (Imperial, Orange, Riverside, San Bernardino, and San Diego). 2011-2014 data include a small, random sample of schools for Orange County only. Sources: Orange County Health Care Agency. Kindergarten Assessment Results, California Department of Health Services, Immunization Branch. Kindergarten Retrospective Survey Results California Department of Health Services, Immunization Branch; County of Orange, Health Care Agency 2008 2011 2014 2009 2012 2015 2010 2013 2017 2016 0 100% 25 50 75 Immunization Coverage Among Kindergarten Students at Two Years of Age, by Immunization, Kindergarten Retrospective Survey, 2013 to 2017 Year Number DTaP (4+) Polio (3+) MMR (1+) Hepatitis B (3+) Varicella (1+) 4:3:1 4:3:1-3 4:3:1-3:1 2013 1,966 78.6% 88.3% 87.6% 87.8% 86.5% 73.6% 70.9% 68.9% 2014 1,800 82.7% 92.1% 90.9% 90.8% 90.2% 78.9% 77.1% 75.3% 2015 1,634 79.7% 90.2% 89.7% 87.0% 88.1% 75.5% 72.2% 70.2% 2016 1,995 83.0% 93.5% 92.1% 90.0% 91.1% 78.5% 75.5% 73.4% 2017 2,660 81.5% 91.8% 92.0% 90.1% 89.9% 77.9% 75.5% 73.4% Source: Orange County Health Care Agency Up-to-Date
2017 • 96.6% - 100.0% • 93.6% - 96.5% • 90.0% - 93.5% • Less than 89.9% % of Immunizations 0 HUNTINGTON BEACH CITY ELEMENTARY 94.2% - IRVINE UNIFIED 94.9% = LA HABRA CITY ELEMENTARY 97.9% q LAGUNA BEACH UNIFIED 88.5% w LOS ALAMITOS UNIFIED 98.5% e MAGNOLIA ELEMENTARY 99.0% r NEWPORT-MESA UNIFIED 94.0% t OCEAN VIEW 96.0% y ORANGE UNIFIED 95.1% u PLACENTIAYORBA LINDA UNIFIED 96.6% 1 ANAHEIM CITY 98.2% 2 BREA-OLINDA UNIFIED 98.0% 3 BUENA PARK ELEMENTARY 98.4% 4 CAPISTRANO UNIFIED 90.5% 5 CENTRALIA ELEMENTARY 97.4% 6 CYPRESS ELEMENTARY 97.8% 7 FOUNTAIN VALLEY ELEMENTARY 96.1% 8 FULLERTON ELEMENTARY 96.8% 9 GARDEN GROVE UNIFIED 98.2% i SADDLEBACK VALLEY UNIFIED 93.6% o SANTA ANA UNIFIED 97.1% p SAVANNA ELEMENTARY 91.5% [ TUSTIN UNIFIED 96.3% ] WESTMINSTER ELEMENTARY 97.1% 2 = 3 8 u 1 y e 5 p 6 w ] 9 o 7 t 0 r - i 4 q [ Source: Orange County Health Care Agency 76.6 89.6 91.1 73.6 78.9 75.5 78.5 88.7 90.0 92.5 95.5 90.2 90.4 92.9 95.6 74.8 89.0 90.7 78.1 89.5 91.0 75.7 89.3 90.3 ORANGE COUNTY: 95.7% CALIFORNIA: 95.1% 81.1 77.9 95.1 95.7 91.7 90.0 IMMUNIZATIONS SUPPLEMENTAL TABLES GO TO GO TO TABLE OF CONTENTS
OBESITY
RISK OF OBESITY REMAINS STEADY AT 18% OF 5TH GRADERS OVER THE LAST FOUR YEARS.
DESCRIPTION OF INDICATOR
This indicator reports data from the California Physical Fitness Test on the percent of 5th grade students who are classified as having health risk due to their body composition. Details about this indicator are provided in the box below.
Why is this important?
Excess weight acquired during childhood and adolescence may persist into adulthood and increase the risk for chronic diseases, such as sleep apnea, diabetes, cardiovascular disease and hypertension. Obese adolescents have a 70% chance of becoming obese adults.1 Excess weight can be prevented and treated through proper nutrition and physical activity (reported on page 30-31 of this report), especially during the critical periods of infancy, two to four years of age, and adolescence.
Findings
• During the 2016/17 school year, 18.0% (6,600) of Orange County 5th graders tested were classified as obese. This rate has remained steady since 2013/14 at approximately 18% and is lower than California at approximately 21.5% of 5th graders.
• Among race and ethnic groups, Pacific Islander (36.2%) and American Indian (28.2%) 5th graders had the highest percentages of students classified at health risk due to their body composition, followed by Hispanic (26.8%), Black (17.3%), Filipino (13.3%), Asian (9.7%), White (8.5%), and Multiracial (7.3%) 5th graders.2
• As of 2013/14, “at health risk due to body composition” is equivalent to or greater than the 95th percentile of BMI, which is considered obese.
California Physical Fitness Test uses the Cooper Institute’s FITNESSGRAM approach, which classifies 5th grade students at “Health Risk” due to body composition when they had a body fat percentage or a body mass index (BMI) that could result in health issues. “Health Risk” classifications for body composition are defined using criterion-referenced, age-specific standards. The definitions of FITNESSGRAM categories were recently modified to more closely approximate widely accepted CDC-defined BMI weight classification schemes and improve classification agreement between body fat and BMI based approaches. Because of these adjustments, California Physical Fitness Test data collected prior to the 2013/14 school year are not comparable to those collected under the current standards.
28 1 The Surgeon General, 2000. 2 Black, Filipino, American Indian, and Pacific Islander 5th grade student enrollment is less than 2% of all 5th grade student enrollment. Percent at risk for these groups may be unstable and should be interpreted with caution.
Percent of 5th Grade Students who Are Obese, by Race/Ethnicity
Source: California Department of Education, DataQuest, 2018.
Notes: Black, Filipino, American Indian, and Pacific Islander 5th grade student enrollment is less than 2% of all 5th grade student enrollment. Percent at risk for these groups may be unstable and should be interpreted with caution.
Percent of 5th Grade Students who are Obese,
2016/17
2013/14 to
• Pacific Islander • Hispanic • Black • American Indian • Filipino • Multi Race • White • Asian 2016/17 2015/16 2014/15 2013/14
by School District, 2016/17 • 20.1% - 31.0% • 10.1% - 20.0% • 0.0% - 10.0% % of Students 0 HUNTINGTON BEACH CITY ELEMENTARY DISTRICT 9.3 - IRVINE UNIFIED 7.7 = LA HABRA CITY ELEMENTARY 26.9 q LAGUNA BEACH UNIFIED 4.0 w LOS ALAMITOS UNIFIED 6.4 e MAGNOLIA ELEMENTARY 23.3 r NEWPORT-MESA UNIFIED 15.1 t OCEAN VIEW 14.1 y ORANGE UNIFIED 23.1 u PLACENTIAYORBA LINDA UNIFIED DISTRICT 14.6 50% 30 20 40 10 0 Source: California Department of Education, DataQuest, 2018 1 ANAHEIM ELEMENTARY 28.8 2 BREA-OLINDA UNIFIED 15.1 3 BUENA PARK ELEMENTARY 29.7 4 CAPISTRANO UNIFIED 9.4 5 CENTRALIA ELEMENTARY 3.7 6 CYPRESS ELEMENTARY 13.3 7 FOUNTAIN VALLEY ELEMENTARY 10.0 8 FULLERTON ELEMENTARY 17.0 9 GARDEN GROVE UNIFIED 23.1 i SADDLEBACK VALLEY UNIFIED DISTRICT 4.8 o SANTA ANA UNIFIED DISTRICT 30.6 p SAVANNA ELEMENTARY DISTRICT 18.4 [ TUSTIN UNIFIED 17.9 ] WESTMINSTER 21.8 GOOD HEALTH
2 = 3 8 u 1 y e 5 p 6 w ] 9 o 7 t 0 r - i 4 q [ ORANGE COUNTY: 18.0% CALIFORNIA: 21.5% California Orange County 28.6 36.2 17.9 18.0 16.6 26.8 16.0 13.3 9.9 9.7 9.3 8.5 8.6 7.3 27.3 28.2 21.0 21.5 18.3 17.3 OBESITY SUPPLEMENTAL TABLES GO TO GO TO TABLE OF CONTENTS
Nearly one in five 5th grade students are obese.
PHYSICAL FITNESS AND NUTRITION
PHYSICAL FITNESS OF 5TH GRADERS DROPS SLIGHTLY SINCE 2015/16.
DESCRIPTION OF INDICATOR
To assess physical fitness, this indicator reports data from the California Physical Fitness Test on the percent of 5th grade students who are classified as having health risk due to their aerobic capacity.
For nutrition, this indicator reports the proportion of youth (ages two to 17) who ate fast food one or more times in the past week and ate less than two fruit servings in the past day.
Why is this important?
Both physical fitness and nutrition are essential to achieving and keeping a healthy weight.1 The habitual intake of too many calories, including from the consumption of sugary beverages, without enough physical fitness, can result in obesity. Those who eat a nutritious diet rich in fruits and vegetables and/or incorporate aerobic physical activity and cardio-respiratory fitness into a daily routine are less likely to develop many types of disease, including heart disease, high blood pressure, Type 2 diabetes, and oral disease.2,3 Additionally, these behaviors, when developed at a younger age, are associated with similar behaviors in adulthood.4
Findings
• During the 2016/17 school year, 6.2% (2,273) of 5th graders tested were classified “at health risk due to aerobic capacity,” up 6.9% since
2013/2014 (5.8% or 2,113), but slightly lower than California at 6.7% of 5th graders.
• The percentage of 5th graders at health risk due to aerobic capacity was highest among Pacific Islander 5th graders (16.9%), followed by Hispanic (9.5%), American Indian (8.7%), Black (8.1%), Filipino (5.9%), White (3.0%), Asian (2.9%), and Multiracial (2.0%) 5th graders.5
• According to the 2015/16 California Health Interview Survey:
– 22.6% of children (2 to 17 years old) reported drinking one or more glasses of soda during the previous day, a decrease of 33.9% from 34.2% in 2013.
– 24.8% of children (2 to 17 years old) reported eating five or more servings of fruits and vegetables daily, an increase of 25.3% from 19.8% in 2011.
Note: California Physical Fitness Test uses the Cooper Institute’s FITNESSGRAM approach to classify 5th graders aerobic capacity at health risk when their V02max, a measure of maximum oxygen consumption, fell within certain limits after participation in structured aerobic exercises, such as the Progressive Aerobic Cardiovascular Endurance Run (PACER), one-mile run, or walk test, which deemed them at likely risk for future health problems. The definition of aerobic capacity categories was recently modified to improve classification agreement between the PACER and one-mile run approaches. Because of these adjustments, California Physical Fitness Test data collected prior to the 2013/14 school year are not comparable to those collected under the current standards.
30 1 Chan RSM and Wood J., 2010. 2 U.S. Department of Health and Human Services and U.S. Department of Agriculture, 2010. 3 Warburton, D.E.R., et. al., 2006. 4 Hallal, P.C., et. al., 2006. 5 Black, Filipino, American Indian, and Pacific Islander 5th grade student enrollment is less than 2% of all 5th grade student enrollment. Percent at risk for these groups may be unstable and should be interpreted with caution
Source: California Department of Education, DataQuest, 2018
Note: Black, Filipino, American Indian, and Pacific Islander 5th grade student enrollment is less than 2% of all 5th grade student enrollment. Percent at risk for these groups may be unstable and should be interpreted with caution.
Percent of Children Ages 2 to 17 Years Old who Consumed Soda the Previous
Percent of Children Ages 2 to 17 Years Old who Eat
Percent of 5th Grade Students at Health Risk Due to Aerobic Capacity, by School
GOOD HEALTH 2013/14 2016/17 2015/16 2014/15
2016/17 • 9.1% or Greater • 6.1% - 9.0% • 3.1% - 6.0% • 0.0% - 3.0% % of Students 0 HUNTINGTON BEACH CITY ELEMENTARY DISTRICT 3.4 - IRVINE UNIFIED 1.6 = LA HABRA CITY ELEMENTARY 5.2 q LAGUNA BEACH UNIFIED 0.0 w LOS ALAMITOS UNIFIED 2.3 e MAGNOLIA ELEMENTARY 7.9 r NEWPORT-MESA UNIFIED 3.6 t OCEAN VIEW 5.1 y ORANGE UNIFIED 5.7 Source: California Department of Education, DataQuest, 2018 1 ANAHEIM ELEMENTARY 19.1 2 BREA-OLINDA UNIFIED 2.9 3 BUENA PARK ELEMENTARY 12.8 4 CAPISTRANO UNIFIED 3.2 5 CENTRALIA ELEMENTARY 20.0 6 CYPRESS ELEMENTARY 3.8 7 FOUNTAIN VALLEY ELEMENTARY 3.3 8 FULLERTON ELEMENTARY 4.1 9 GARDEN GROVE UNIFIED 6.3 u PLACENTIAYORBA LINDA UNIFIED DISTRICT 4.5 i SADDLEBACK VALLEY UNIFIED DISTRICT 0.7 o SANTA ANA UNIFIED DISTRICT 9.9 p SAVANNA ELEMENTARY DISTRICT 7.8 [ TUSTIN UNIFIED 4.0 ] WESTMINSTER 3.9
of 5th Grade Students Classified at Health Risk
to Aerobic Capacity, by Race/Ethnicity in Orange County 2013/14 to 2016/17 20% 10 15 5 0 2 = 3 8 u 1 y e 5 p 6 w ] 9 o 7 t 0 r - i 4 q [ ORANGE COUNTY: 6.2% CALIFORNIA: 6.7% 2012 2013 2011 2014 2015 2013 2016 2016 2015 2014
2013 to 2016 * Statistically unstable. Source: California Health Interview Survey, 2016/17
District,
Percent
Due
Day
of Fruits/Vegetables Daily, 2011 to 2016 50% 25 25 0 0 * Statistically unstable. Source: California Health Interview Survey, 2016/17 50% 22.2 21.5* 16.8* 28.4 24.8* 25.1* 22.6* 22.9*
5+ Servings
California Orange County • Hispanic • Pacific Islander • American Indian • Black • Filipino • White • Multiracial • Asian 16.9 5.9 8.7 8.1 9.5 6.7 3.0 2.9 2.0 6.2 9.1 7.2 6.5 5.6 5.8 5.0 2.7 2.3 2.1 19.8 34.2 PHYSICAL FITNESS AND NUTRITION SUPPLEMENTAL TABLES GO TO GO TO TABLE OF CONTENTS
BEHAVIORAL HEALTH
AFTER DROPPING IN 2015, CHILDREN’S MENTAL HEALTH AND SUBSTANCE ABUSE-RELATED HOSPITALIZATIONS RISE IN 2016.
DESCRIPTION OF INDICATOR
This indicator reports the number of inpatient hospitalizations in Orange County among 0-17 year olds related to serious mental health and substance use conditions. The data include rates of inpatient hospitalization for broad behavioral health conditions and rates of inpatient hospitalization per 10,000 children broken down by behavioral health diagnosis, race/ethnicity, and city of residence.
Why is this important?
The presence of behavioral health disorders can have a profound impact on individuals and families, as well as systems within the community, such as schools or the juvenile justice system. By tracking hospitalization rates related to behavioral health disorders, health officials can more readily identify trends and monitor the needs of the community while directing needed resources (e.g., training, education, counseling, outreach, substance abuse treatment, etc.) to areas in need. For example, an increase in hospitalization rates due to heroin use may signal a serious trend in a local community and may lead to resource allocation to combat the increase in use of this harmful drug.
Findings
• Overall, hospitalization rates for serious mental illness and substance abuse conditions for children increased by 44%, from a low of 16.8 per 10,000 children in 2007 to 24.2 per 10,000 children in 2016.
• This increase is driven by an increase in hospitalizations for serious mental illness, which grew 73%, from a low of 11.5 per 10,000 children in 2007 to 19.9 per 10,000 children in 2016.
• Major Depression and Mood Disorders accounted for two-thirds (66%) of all such hospitalizations, followed by Bipolar (10%),
Schizophrenia/Psychoses (4%), and Schizoaffective Disorders (3%).
• Admissions for substance-related diagnoses accounted for 2% of all hospitalizations for children in 2016. This is a decrease of 70% over the past decade to 0.5 per 10,000 children.
• White youth accounted for 42% of all mental illness and substance abuse-related hospitalizations and Hispanic children accounted for 41%.
• While males accounted for a little more than half (53%) of substance-related hospitalizations, females accounted for the majority (62%) of mental illness hospitalizations.
• Slightly more than half (55%) of the 1,733 hospitalizations among Orange County youth occurred at hospitals located in Orange County, while the rest were in neighboring counties of Los Angeles (28%), San Bernardino (16%), San Diego (1%), Riverside (<1%), and Ventura (<1%) Counties. The majority of these hospitalization were covered by private insurance (45%) and Medi-Cal (51%).
• In 2015, 12.3% of adolescents aged 12 to 17 years had at least one major depressive episode in California and 11.9% in the United States. Overall, both proportions were higher than previous years between 2005 to 2013 (ranging from 8.8% to 11.4%).1
32 1 Substance Abuse and Mental Health Services Administration. (2015). 2015 National Survey on Drug Use and Health: Table 9.6B (United States) and Table 20 (California) Rockville, MD.
Mental Health and Substance Abuse Related-Hospitalization Rates, Rate per 10,000 Children
2007 to 2016
Total
•
•
•
Source: Orange County Health Care Agency, Health Policy - Research
Note: Other includes mental disorders such as other unspecified mood disorders, conduct disorders, and disorders related to sleep, eating, elimination, and pain.
2016
•
•
Source: Orange County Health Care Agency, Health Policy - Research
Notes: Rates for Black children are not included due to inability to calculate rates due to estimates for small case numbers and populations. Other Mental Disorders include other unspecified mood disorders, conduct disorders, and disorders related to sleep, eating, elimination, and pain.
Rate
Sources:
(22016) Prepared by HCA Health Policy - Research
OSHPD Patient Discharge Data
Mental Illness
Other
Substance Abuse
White
Hispanic
10,000
Mental Health Hospitalization Rates per
Children, by Race/Ethnicity
2007 2010 2013 2008 2011 2014 2009 2012 2016 2015 0 25 5 10 20 15 0
of Orange County Hospitalizations for Mental Health and Substance Abuse per 10,000 Children, by City, 2016 w LA PALMA 12.2 e LADERA RANCH 23.0 r LAGUNA BEACH 28.3 t LAGUNA HILLS 36.5 y LAGUNA NIGUEL 26.6 u LAGUNA WOODS 0.0 i LAKE FOREST 22.5 o LOS ALAMITOS 38.3 p MISSION VIEJO 24.7 [ NEWPORT BEACH 18.1 ] NORTH TUSTIN 36.7 \ ORANGE 43.9 a PLACENTIA 27.2 1 ALISO VIEJO 20.1 2 ANAHEIM 27.1 3 BREA 24.9 4 BUENA PARK 20.7 5 COSTA MESA 30.8 6 CYPRESS 26.3 7 DANA POINT 26.5 8 FOUNTAIN VALLEY 23.0 9 FULLERTON 26.5 0 GARDEN GROVE 23.0 - HUNTINGTON BEACH 27.7 = IRVINE 19.8 q LA HABRA 10.9 25 20 5 10 15 • 27.3 or Greater • 24.21 - 27.2 • 18.4 - 24.1 • 0.0 - 18.3 • Unincorporated Rate of Hospitalizations Major Depression & Mood Disorders 23.3 Substance Related Other Schizoaffective Schizophrenia & Psychoses Bipolar GOOD HEALTH 1 y 7 t u d f [ z a 3 9 4 q w h ' p r k ] l8 \ 6 o 2 ; g 0 j 5 = p e i s 1.7 3.7 11.3 16.7 1.0 5.2 15.5 21.7 1.4 4.6 12.6 18.7 1.4 3.9 14.0 19.2 1.1 5.2 0.7 0.7 0.4 3.1 3.0 2.6 18.8 20.8 19.3 22.6 24.5 22.3 ORANGE COUNTY: 24.1 CALIFORNIA: N/A 6.7 1.9 2.8 6.1 4.2 1.3 1.2 0.8 1.1 0.7 0.7 0.4 0.0 0.5 0.7 0.2 • Asian/Pacific Islander s RANCHO SANTA MARGARITA 21.8 d SAN CLEMENTE 21.8 f SAN JUAN CAPISTRANO 33.7 g SANTA ANA 19.9 h SEAL BEACH 15.7 j STANTON 14.7 k TUSTIN 31.7 l UNINCORPORATED 3.6 ; VILLA PARK 0.0 ' WESTMINSTER 18.0 z YORBA LINDA 18.3 16.3 22.5 3.8 0.5 24.2 19.9 3.6 1.7 16.8 11.5 13.7 BEHAVIORAL HEALTH SUPPLEMENTAL TABLES GO TO GO TO TABLE OF CONTENTS
ECONOMIC WELL-BEING INDICATORS

CHILD
PERCENT
CALWORKS
PERCENT
SUPPLEMENTAL
PERCENT OF CHILDREN RECEIVING CALFRESH
PERCENT OF CHILDREN INSECURELY HOUSED
PERCENT OF CURRENT SUPPORT DISTRIBUTED
7.6% 18.0% 2007/08 2016/17
NUTRITION
CHILD
4.0% 4.7% 2007/08 2016/17 53.7% 68.3% 2008/09 2017/18
SUPPORT
OF CHILDREN RECEIVING CALWORKS
POVERTY HOUSING
42.3% 49.1% 2008/09 2017/18 2.6% 5.5% 2007/08 2016/17
OF STUDENTS ELIGIBLE FOR FREE AND REDUCED PRICE LUNCH
UPWARD TREND IMPROVEMENT DOWNWARD TREND IMPROVEMENT UPWARD TREND NEEDS IMPROVEMENT DOWNWARD TREND NEEDS IMPROVEMENT NOTE: Variation in data ranges are due to availability of data and frequency of data collection. GO TO TABLE OF CONTENTS

CHILD POVERTY
NEARLY HALF OF ORANGE COUNTY STUDENTS ARE ELIGIBLE FOR FREE OR REDUCED PRICE LUNCH.
DESCRIPTION OF INDICATOR
This indicator reports the number and percent of students eligible for the National School Free and Reduced Price Lunch program, considered to be an indicator of children living in poverty or of working poor families. Eligibility is based on income of the child’s parent(s) or guardian(s), which must be below 185% of the Federal Poverty Level. It also tracks the percent of children living in poverty according to the U.S. Census.
Why is this important?
Research has demonstrated that living in poverty has a wide range of negative effects on the physical and mental health and well-being of children. Poverty is linked with negative conditions such as substandard housing, homelessness, inadequate nutrition, food insecurity, inadequate child care, lack of access to health care, unsafe neighborhoods and under-resourced schools.1 These conditions mean school districts face many challenges serving low-income families, particularly those school districts with more than 75% of students enrolled in the Free and Reduced Price Lunch program.2 The implications for children living in poverty include greater risk for poor academic achievement, school dropout, abuse and neglect, behavioral and socioemotional problems, physical health problems and developmental delays.
Findings
• In 2017/18, 49.1% (235,275) of students were eligible for the Free and Reduced Price Lunch program in Orange County, lower than California at 60.1% (3,739,347).
• Between 2008/09 and 2017/18, there was a larger increase (16.1%) among Orange County students eligible for the Free and Reduced Price Lunch program than among students throughout California (11.7%).
• According to the U.S. Census, 16.9% of Orange County’s children were living in poverty in 2016; a 24.3% increase from 2010 (13.6%), while remaining lower than California (21.9%) and the United States (21.2%).3
• When cost of living and a range of family needs and resources, including social safety net benefits, are factored in, poverty among Orange County’s children jumps to 24.6%, surpassing California at 22.8%, with a threshold income needed to maintain a basic standard of living for a family of four at $33,700.3
36 1
3
in tax credits and in-kind assistance that can augment family resources and subtracts medical, commuting, and child care expenses. 2011
Bureau data is used to estimate the CPM. 3 American Community Survey. Poverty Status in the Past 12 Months of Families, Table S1702.
American Psychological Association, 2014. 2 The Institute for Education Sciences define high-poverty schools public schools where more than 75.0% of the students are eligible for the Free and Reduced Price Lunch program.
California Poverty by County, 2013-2015, calculated according to the CPM. The California Poverty Measure (CPM) incorporates the changes in costs and standards of living since the official poverty measure was devised in the early 1960s—and accounts for geographic differences in the cost of living across the state. It also factors
Census
Percent of Students Eligible to Receive Free
Percent of Children Under 18 Years Old Living
ECONOMIC WELL-BEING
Reduced Price Lunch 2008/09 to 2017/18 • Orange County • California • United States • California • Orange County Source: Department of Education, 2018 2009/10 2011/12 2010/11 2008/09 2012/13 2013/14 2017/18 2016/17 2015/16 2014/15 0
and
Poverty,
City 2016 q LA HABRA 20.9 w LA PALMA 11.3 e LAGUNA BEACH 5.6 r LAGUNA HILLS 12.7 t LAGUNA NIGUEL 8.2 y LAGUNA WOODS 0.0 u LAKE FOREST 8.6 i LOS ALAMITOS 12.3 o MISSION VIEJO 5.0 p NEWPORT BEACH 3.0 [ ORANGE 18.6 ] PLACENTIA 15.0 \ RANCHO SANTA MARGARITA 6.7 Source: U.S. Census Bureau, S1701 2012-2016 American Community Survey, 5-Year Estimates 1 ALISO VIEJO 4.6 2 ANAHEIM 24.4 3 BREA 7.0 4 BUENA PARK 20.1 5 COSTA MESA 16.0 6 CYPRESS 6.6 7 DANA POINT 6.9 8 FOUNTAIN VALLEY 10.9 9 FULLERTON 20.3 0 GARDEN GROVE 21.9 - HUNTINGTON BEACH 11.4 = IRVINE 9.5 a SAN CLEMENTE 7.9 s SAN JUAN CAPISTRANO 20.2 d SANTA ANA 30.9 f SEAL BEACH 4.1 g STANTON 36.2 h TUSTIN 20.2 j VILLA PARK 3.3 k WESTMINSTER 22.1 l YORBA LINDA 4.9 80% 60 40 20 • 24.1% - 36.2% • 16.1% - 24.0% • 8.1% - 16.0% • 0.0% - 8.0% • Unincorporated % Living in Poverty Source: U.S. Census Bureau, 2012-2016 5-Year American Community Survey 2010 2012 2011 2014 2016 2015 2013 Percent of Children Under 18 Years Old, Living in Poverty, Orange County, California and United States 2010-2016 25% 15 20 10 1 t 7 r y a s p l ] 3 9 4 q w f k e h8 [ 6 i 2 j d 0 g 5 = o u \ 20.0 21.3 19.9 20.8 16.0 16.9 17.6 17.6 21.6 21.9 21.7 22.1 22.7 22.5 14.6 ORANGE COUNTY: 16.9% CALIFORNIA: 21.9% 53.8 55.9 56.7 57.5 58.0 59.4 58.6 49.0 50.0 47.9 46.4 45.6 45.0 42.3 49.1 47.7 49.1 60.0 59.2 60.1 19.2 16.9 21.9 21.2 19.1 13.6 CHILD POVERTY SUPPLEMENTAL TABLES GO TO GO TO TABLE OF CONTENTS
in
by
CALWORKS
DESCRIPTION OF INDICATOR
This indicator reports the average number and percent of children per month under the age of 18 years receiving financial assistance through California Work Opportunity and Responsibility to Kids (CalWORKs). Any change in the number of CalWORKs beneficiaries is an indicator of a change in poverty status.
Why is this important?
The percent of children benefiting from CalWORKs is an indicator of Orange County’s capacity to help families struggling to make ends meet and at the same time, responsibly care for their children. This indicator also reflects a widespread need for financial support among families in need across Orange County as CalWORKs beneficiaries receive financial and employment assistance. The goals of the CalWORKs program include reduced welfare dependency, increased self-sufficiency, and improved child well-being by encouraging parental responsibility through school attendance, child immunizations requirements and by assisting with paternity and child support enforcement activities.
Findings
• In 2016/17, 4.7% (34,485) of Orange County’s children received CalWORKs assistance which is a 17.5% increase from 4.0% in 2007/08. Overall Orange County is lower than California at 5.2%.
• Since 2011/12, the proportion of children receiving CalWORKs has been steadily declining, mirroring a nationwide trend.
• Young children (zero to five years of age) accounted for 30% of the youth population receiving CalWORKs assistance.
• The cities of Anaheim at 8.4% (7,349), Santa Ana at 8.3% (7,792), Stanton at 6.0% (612), Cypress at 5.6% (599), Buena Park at 5.5% (1,072), and Garden Grove at 5.5% (2,221) have the highest percentages of children receiving CalWORKs.
• Cities with the lowest percentage of children receiving CalWORKs include Newport Beach at 0.5% (78), Rancho Santa Margarita at 0.6% (76), Laguna Beach at 0.6% (23), Villa Park at 0.6% (7), Aliso Viejo at 0.7% (96), and Yorba Linda at 0.9% (152).
38
CALWORKS ENROLLMENT CONTINUED TO DROP IN 2017, BUT STILL REPRESENTS A 10-YEAR INCREASE OF 17.5%.
Percent
Number and Percent of Children Under 18 Years Old Receiving CalWORKs 2007/08 to 2016/17 • Number of Children • Percent of Children Source: County of Orange Social Services Agency 0 0
January 2017 w LA PALMA 1.5% e LAGUNA BEACH 0.6% r LAGUNA HILLS 3.7% t LAGUNA NIGUEL 1.5% y LAGUNA WOODS* N/A u LAKE FOREST 2.2% i LOS ALAMITOS 2.5% o MISSION VIEJO 1.3% p NEWPORT BEACH 0.5% [ ORANGE 4.0% ] PLACENTIA 4.5% \ RANCHO SANTA MARGARITA 0.6% a SAN CLEMENTE 1.2% Note: *2012-2016 American Community Survey estimates no population under 18 in Laguna Woods. Source: County of Orange Social Services Agency, January 2018 1 ALISO VIEJO 0.7% 2 ANAHEIM 8.4% 3 BREA 1.7% 4 BUENA PARK 5.5% 5 COSTA MESA 3.3% 6 CYPRESS 5.6% 7 DANA POINT 1.6% 8 FOUNTAIN VALLEY 2.0% 9 FULLERTON 4.5% 0 GARDEN GROVE 5.5% - HUNTINGTON BEACH 2.4% = IRVINE 1.2% q LA HABRA 5.2% s SAN JUAN CAPISTRANO 2.4% d SANTA ANA 8.3% f SEAL BEACH 1.0% g STANTON 6.0% h TUSTIN 3.9% j VILLA PARK 0.6% k WESTMINSTER 5.0% l YORBA LINDA 0.9% 50,000 7.0% 40,000 46,809 45,950 5.6 10,000 1.4 20,000 2.8 30,000 4.2 1 t 7 r y a s p l ] 3 9 4 q w f k e h8 [ 6 i 2 j d 0 g 5 = o u \ • 6.0% or Greater • 4.0% - 5.9% • 2.0% - 3.9% • 0.0% - 1.9% • Unincorporated • No data available % Receiving CalWORKs ECONOMIC WELL-BEING
Receiving CalWORKs, by City
2008/09 2010/11 2009/10 2007/08 2011/12 2012/13 2014/15 2016/17 2015/16 2013/14 ORANGE COUNTY: 4.7% CALIFORNIA: 5.2% 31,932 35,962 42,793 43,916 42,877 42,345 38,982 34,485 5.9 6.3 6.1 6.0 6.0 5.5 4.7 5.4 4.0 4.5 CALWORKS SUPPLEMENTAL TABLES GO TO GO TO TABLE OF CONTENTS
Children ages birth to five make up a third of all children receiving CalWORKs assistance.
SUPPLEMENTAL NUTRITION
DESCRIPTION OF INDICATOR
The indicator reports the number and percent of recipients of the CalFresh Program, federally known as the Supplemental Nutrition Assistance Program (SNAP) and the number and percent of recipients in the Supplemental Nutrition Program for Women, Infants and Children (WIC).1 As an indicator of poverty, the increase in children receiving these benefits is one that needs improvement. However, the increase may also be viewed as an improvement in that more eligible children are receiving these benefits.
Why is this important?
Data shows that there is a relationship between a family’s food security and assurance of a healthy life. Households with food insecurity are more likely to experience reduced diet quality, anxiety about their food supply, increased use of emergency food sources or other coping behaviors, and hunger. CalFresh and WIC programs provide nutrition assistance to people in low-income households by increasing their food buying power so they are able to purchase more nutritious foods, such as fruits, vegetables and other healthy foods. Income eligible children can receive both forms of nutrition assistance.
Findings
• In 2016/17, 18.0% (131,670) of children under 18 years old received CalFresh, a 137% increase in the number of children since 2007/08 at 7.6%. Orange County had a lower rate than California at 27.6% (2,537,628) of children receiving CalFresh (SNAP).2
• In January 2017, the greatest proportion of CalFresh beneficiaries under 18 in Orange County were children aged six to 12 years old (43.7% or 52,355), followed by zero to five years old (31.3% or 37,511), and 13 to 17 years old (24.9% or 29,837).
• It is estimated that only 70.9% of people in Orange County who are eligible for CalFresh are receiving that benefit, less than California at 71.8%.3
• In 2016/17, 61,406 participants were served by the WIC program, a decrease of 47.6% from 117,118 in 2006/07. Of these, more than three fourths (48,797) of participants are young children zero to five years old.
• In 2015, 52.7% of women and children eligible for WIC were receiving that benefit nationally, lower than California at 65%.4
40
1,
2 California Department of Social Services, CalFresh County Data Dashboard, 2016. 3 California Department of Social Services, CalFresh County Data Dashboard, 2016. 4 USDA Special Supplemental Nutrition Program for WIC Eligibles and Coverage National and State Level Estimates.
1 WIC provides nutrition services to pregnant and postpartum women, infants and children (ages 0 to 5 years). Participants must meet eligibility and income guidelines (at or below 185% of the federal poverty level). WIC participants are reported as the number of prenatal, breastfeeding and postpartum women, infants and children up to five years old who receive food vouchers in the month of September each year. The CalFresh Program, federally known as the Supplemental Nutrition Assistance Program (SNAP), helps income-eligible families put healthy and nutritious food on the table. The program issues monthly electronic benefits that can be used at grocery stores and participating farmers markets. The amount of the benefit is based on household size, income and housing expenses. Children under 18 years are reported annually through CalWIN. December figures are used to define the service population for a given federal fiscal year (Oct.
2016 to Sept. 30, 2017).
CALFRESH ENROLLMENT SHOWS 10-YEAR INCREASE WHILE WIC PARTICIPATION DECLINES.
13% Number and Percent of Children Under 18 Years Old Served by CalFresh and Number of Participants Served by WIC 2007/08 to 2016/17 Note: Data represents fiscal Year (July – June) monthly averages for CalFresh. Source for CalFresh: Orange County Social Services Agency Source for WIC: Orange County Health Care Agency/Nutrition Services-WIC Percent of Children Under 18 Years Old Receiving CalFresh, by City 2016 w LA PALMA 7% e LAGUNA BEACH 3% r LAGUNA HILLS 12% t LAGUNA NIGUEL 6% y LAGUNA WOODS* N/A u LAKE FOREST 8% i LOS ALAMITOS 9% o MISSION VIEJO 6% p NEWPORT BEACH 2% [ ORANGE 17% ] PLACENTIA 17% \ RANCHO SANTA MARGARITA 4% a SAN CLEMENTE 6% 160,000 128,000 96,000 15 10 5 0 20 25% 64,000 32,000 0 Note: *2012-2016 American Community Survey estimates no population under 18 in Laguna Woods. Source: Orange County Social Services Agency, Family Health Division 1 ALISO VIEJO 5% 2 ANAHEIM 28% 3 BREA 7% 4 BUENA PARK 19% 5 COSTA MESA 15% 6 CYPRESS 12% 7 DANA POINT 8% 8 FOUNTAIN VALLEY 8% 9 FULLERTON 17% 0 GARDEN GROVE 26% - HUNTINGTON BEACH 10% = IRVINE 5% q LA HABRA 20% s SAN JUAN CAPISTRANO 13% d SANTA ANA 32% f SEAL BEACH 3% g STANTON 22% h TUSTIN 16% j VILLA PARK 1% k WESTMINSTER 25% l YORBA LINDA 4% ECONOMIC WELL-BEING • CalFresh • WIC • Percent Served by CalFresh • 21.0% and Greater • 15.1% - 20.0% • 10.1% - 15.0% • 5.1% - 10.0% • 0.0% - 5.0% • Unincorporated • No data available % Receiving CalFresh 18% of Orange County Children (131,670) receive CalFresh. 1 t 7 r y a s p l ] 3 9 4 q w f k e h8 [ 6 i 2 j d 0 g 5 = o u \ 2008/09 2007/08 2010/11 2009/10 2011/12 2012/13 2014/15 2016/17 2015/16 2013/14 ORANGE COUNTY: 18.0% CALIFORNIA: 27.6% 60,793 74,127 98,259 104,622 117,188 100,434 116,978 103,563 130,263 98,219 136,835 92,303 87,408 78,856 71,367 61,406 19.7 19.9 19.2 18.0 18.9 17.9 14.6 12.3 9.3 7.6 141,688 141,716 140,410 131,670 SUPPLEMENTAL NUTRITION SUPPLEMENTAL TABLES GO TO GO TO TABLE OF CONTENTS
HOUSING
DESCRIPTION OF INDICATOR
This indicator reports the number of insecurely housed students identified by school districts as homeless, meaning they are living in motels, shelters, parks and doubling- or tripling-up in a home, as defined by the McKinneyVento Homeless Education Assistance Act.
Why is this important?
The high mobility, trauma, and poverty associated with homelessness and insecure housing create educational barriers, low school attendance, developmental, physical and emotional problems for students. Lacking a fixed, regular nighttime stay increases the chances that a student will require additional support services associated with their developmental and academic success. A homeless student or one living in a crowded environment may experience a greater tendency for stress and anxiety not knowing where they are going to sleep each night nor having a consistent, quiet, permanent place to study or do their homework. Lack of secure housing may be associated with lower standardized test scores in all areas.
Findings
• In 2016/17, 5.5% (27,119) of students in Orange County experienced insecure housing, which is 111.5% greater than in 2007/08, at 2.6% (17,051).1 In the past year, the percent of students experiencing insecure housing has dropped slightly from 5.8% in 2015/16.
• With regard to primary nighttime residence, in 2016/17:
– 89.5% (24,274) of insecurely housed students were doubled or tripled-up in housing.
5.2% (1,423) of insecurely housed students were in hotels or motels.
– 3.9% (1,055) of insecurely housed students were housed in shelters.
1.4% (367) of insecurely house students were unsheltered.2
• Of those students with insecure housing in 2017/16, high school age students (grades 9-12) represent the highest percentage at 50.6%, followed by elementary age students (pre K-5th) at 30.1% and middle school students (grades 6-8) at 19.3%.2
42 1 The data are collected from the Local Education Agency (school district) and reported to the California Department of Education (CDE) at the end of each academic year, by June 30. Beginning 2010-2011, CDE began collecting the data directly via California Longitudinal Pupil Achievement Data System. Data from 2014-2015 is lower due to a statewide data system error at the CDE that likely resulted in under-reported counts. 2 Due to the small population size, the data may be unstable.
–
–
FEWER STUDENTS HAVE INSECURE HOUSING IN 2016/17 THAN THE PREVIOUS SCHOOL YEAR.
ECONOMIC WELL-BEING
Percent
and Percent of Students with Insecure Housing, Orange County and California, 2007/08 to 2016/17 * Data from 2014-2015 is lower due to a statewide data system error at the CDE that likely resulted in under-reported counts. Source: California Department of Education Source: California Department of Education Note: * ACCESS (Alternative, Community, and Correctional Schools and Service) student population is unique in that it encompasses a wide range of youth, including students in group homes or incarcerated in institutions, students on probation or homeless, students who are parents or working full-time, students participating in a home schooling program, and students who are referred by local school districts. Source: California Department of Education. Data provided by districts on their LEA Reporting Consolidated Application and Reporting System (CARS) 17,051 22,025 26,029 28,091 28,625 30,542 32,510 26,064 28,450 27,119 6.5 4.8 5.7 4.3 5.6 4.0 5.2 3.6 4.4 3.4 2.6
Number
of Enrolled Students
Insecure Housing, by School District, 2016/17 = HUNTINGTON BEACH CITY SCHOOL 0.8% q HUNTINGTON BEACH UNION HIGH SCHOOL 3.1% w IRVINE UNIFIED SCHOOL 0.3% e LA HABRA CITY SCHOOL 1.3% r LAGUNA BEACH UNIFIED SCHOOL 0.4% t LOS ALAMITOS UNIFIED SCHOOL 0.4% y MAGNOLIA SCHOOL 31.5% u NEWPORT-MESA UNIFIED SCHOOL 0.5% i OCDE – ACCESS* 19.8% o OCEAN VIEW SCHOOL 7.9% p ORANGE UNIFIED SCHOOL 1.1% Primary Nighttime Residency of Insecurely Housed Students, 2007/08 and 2016/17 35,000 7% 30,000 6 25,000 5 15,000 10,000 5,000 20,000 3 2 1 4 0 0 1 ANAHEIM ELEMENTARY SCHOOL 11.2% 2 ANAHEIM UNION HIGH SCHOOL 9.2% 3 BREA-OLINDA UNIFIED SCHOOL 0.5% 4 BUENA PARK SCHOOL 6.5% 5 CAPISTRANO UNIFIED SCHOOL 3.5% 6 CENTRALIA SCHOOL 13.4% 7 CYPRESS SCHOOL 11.0% 8 FOUNTAIN VALLEY SCHOOL 0.2% 9 FULLERTON SCHOOL 1.3% 0 FULLERTON JOINT UNION HIGH SCHOOL 2.5% - GARDEN GROVE UNIFIED SCHOOL 1.7% [ PLACENTIAYORBA LINDA UNIFIED SCHOOL 11.0% ] SADDLEBACK VALLEY UNIFIED SCHOOL 2.2% \ SANTA ANA UNIFIED SCHOOL 13.2% a SAVANNA SCHOOL 12.8% s TUSTIN UNIFIED SCHOOL 1.8% d WESTMINSTER SCHOOL 10.8% • Total Orange County Students with Insecure Housing • % of Total Student Enrollment in Orange County • % of Total Student Enrollment in California • Unstable Data • 2007/08 • 2016/17
with
• 12.1% and Greater • 8.1% - 12.0% • 4.1% - 8.0% • 0.0% - 4.0% % Students with insecure housing 3 e 4 9 0 [ 1 2 p y 6 a 7 t d\ 8 o = q u w ] 5 r s 2008/09 2007/08 2010/11 2009/10 2011/12 2012/13 2014/15* 2016/17 2015/16 2013/14 ORANGE COUNTY: 5.5% CALIFORNIA: 5.3% 5.2 4.8 5.8 5.5 4.4 92.8 89.5 5.2 3.9 1.4 4.6 2.3 0.4 Doubled/ Tripled-Up Hotels/Motels Shelters Unsheltered 100% 60 40 20 80 0 HOUSING SUPPLEMENTAL TABLES GO TO GO TO TABLE OF CONTENTS
SUPPORT
SUPPORT DISTRIBUTED TO ORANGE COUNTY FAMILIES INCREASED 27% IN 10 YEARS.
DESCRIPTION OF INDICATOR
This indicator reports the Distributed Net Collections divided by the average monthly caseload for the Federal Fiscal Year. Improvements in collections per case reflects an increase in income to parents to provide for the basic needs of their children.
Why is this important?
The number of Orange County children living in poverty has risen by 24.3% since 2010 (120,188 in 2016).1 Research shows that child support payments help to lift more than one million Americans above the poverty line each year and assist families with incomes above the poverty line to make ends meet.2 Orange County Child Support Services (CSS) builds partnerships with parents, develops community linkages, and cultivates existing relationships with other county agencies. Expected results are increased collections and improved performance, which yield increased financial support to meet the needs of children and families. Child support collections pay for essentials such as food, shelter, child care, and medical support. CSS has implemented a family-centered approach that connects customers to local resources for family essentials (e.g., clothing and food), parental success (e.g., parenting classes and financial workshops) and individual services (e.g., adult education and job training). In the last 10 years, the number of Orange County CSS cases has decreased while services to customers have increased, along with the collections per case.
Findings
• Total Orange County child support cases decreased by 36.0% from 103,598 in 2008/09 to 66,296 in 2017/18. Over the same period, net collections increased slightly by 2.2% from $180.3 million in 2008/09 to $184.3 million in 2017/18, with an average of $180.1 million annually.
• Most (92.8%) Orange County cases have a court order established, in comparison to California’s rate of 91.1%. Since March 2008, the Orange County CSS rate has increased 19.3%.3
• The percent of current support distributed among Orange County cases during 2017/18 was 68.3%, which is higher than the California rate of 66.3%, and represents a continuous improvement since 2008/09 when the rate was 53.7% (a 27.2% increase).4
44 1 American Community Survey 2012-2016, 5-Year Estimates. Table S1702. 2 Turetsky, V., 2005. 3 California Department of Child Support Services, 2018. Percentage data source, Year to date as of March 2018, Table 01.1.1, pdf. 4 Department of Child Support Services, 2018. Collection Rate Percentage and Dollars Owed collected from California pulled from State of California – Health and Human Services Agency Child Support Program Statistics FFY 2017, table 1.3.
CHILD
ECONOMIC WELL-BEING Total Child Support Cases and Per Case Collections 2008/09 to 2017/18 Note: Total cases each year is a 12-month average from July to June. Data for 2016/17 were updated from the previous Conditions of Children report. Source: Orange County Department of Child Support Services Source: Orange County Department of Child Support Services Source: Orange County Department of Child Support Services Number of Cases and Total Support Distributed, by City, 2017/18 • 5.0 - 22.0 • 3.0 - 4.9 • 2.0 - 2.9 • Under 2.0 • Unincorporated Total Support (in Millions) q LA HABRA 928 $3,718,315.39 w LA PALMA 126 $559,980.96 e LADERA RANCH 189 $1,418,109.50 r LAGUNA BEACH 102 $716,798.65 t LAGUNA HILLS 250 $1,079,294.42 y LAGUNA NIGUEL 453 $2,507,893.14 u LAGUNA WOODS 24 $94,583.87 i LAKE FOREST 702 $2,982,129.48 o LOS ALAMITOS 198 $916,056.75 p MISSION VIEJO 707 $3,947,575.29 [ NEWPORT BEACH 384 $3,384,196.34 ] ORANGE 1,601 $6,271,911.71 \ PLACENTIA 621 $2,608,660.40 Percent of Child Support Distributed, Orange County and California 2008/09 to 2017/18 120,000 80% 80,000 100,000 60 40 20 60,000 20,000 0 40,000 0 0 1 ALISO VIEJO 405 $2,697,103.86 2 ANAHEIM 5,975 $21,547,544.04 3 BREA 431 $1,943,253.65 4 BUENA PARK 1,222 $4,622,821.63 5 COSTA MESA 1,066 $4,958,481.26 6 CYPRESS 502 $2,183,482.04 7 DANA POINT 281 $1,571,920.96 8 FOUNTAIN VALLEY 435 $2,208,889.64 9 FULLERTON 1,667 $6,338,825.22 0 GARDEN GROVE 2,349 $9,115,366.12 - HUNTINGTON BEACH 1,881 $8,834,115.17 = IRVINE 1,302 $7,876,243.91 a RANCHO SANTA MARGARITA 387 $2,268,170.92 s SAN CLEMENTE 483 $2,840,619.73 d SAN JUAN CAPISTRANO 310 $1,399,067.64 f SANTA ANA 5,434 $19,431,520.97 g SEAL BEACH 81 $503,600.94 h SILVERADO 23 $82,906.69 j STANTON 551 $1,952,659.14 k TRABUCO CANYON 168 $1,105,031.37 l TUSTIN 1,105 $4,521,353.31 ; VILLA PARK 21 $82,075.98 ' WESTMINSTER 1,114 $4,758,739.13 z YORBA LINDA 506 $2,763,367.51 • Total Number of Cases • Per Case Collection • Orange County • California 2009/10 2009/10 2008/09 2008/09 2011/12 2011/12 2010/11 2010/11 2012/13 2012/13 2013/14 2013/14 2015/16 2017/18 2016/17 2017/18 2016/17 2015/16 2014/15 2014/15 ORANGE COUNTY: 33,984 CASES $145.8 MILLION 54.3 53.4 59.0 56.0 62.7 58.6 64.8 61.4 65.7 66.7 68.0 68.0 63.3 64.9 66.9 66.4 1 y 7 t u s d e [ \ z 3 9 4 q w g r8 ] 6 o 2 f 0 j 5 = l ; p i h k a ' $3,000 1,000 500 1,500 2,000 2,500 103,598 100,056 89,852 77,582 70,608 68,635 67,732 68,117 67,685 66,296 $2,781 $2,640 $2,677 $2,719 $2,593 $2,530 $2,321 $1,975 $1,771 $1,741 53.7 52.8 66.3 68.3 CHILD SUPPORT SUPPLEMENTAL TABLES GO TO GO TO TABLE OF CONTENTS
EDUCATIONAL ACHIEVEMENT INDICATORS
KINDERGARTEN READINESS
PERCENT OF CHILDREN READY FOR KINDERGARTEN
HIGH SCHOOL DROPOUT RATES

PERCENT HIGH SCHOOL DROPOUTS FOR GRADES 9-12 COHORT
THIRD GRADE ENGLISH LANGUAGE ARTS
PERCENT OF THIRD GRADE STUDENTS MET OR EXCEEDED STATE STANDARDS FOR ENGLISH LANGUAGE ARTS
THIRD GRADE MATHEMATICS
PERCENT OF THIRD GRADE STUDENTS MET OR EXCEEDED STANDARDS FOR MATHEMATICS
PERCENT OF GRADUATES WITH UC/CSU ELIGIBLE REQUIREMENTS
COLLEGE
44.9% 52.0% 2007/08 2016/17 51.0% 56.0% 2014/15 2016/17 46.0% 51.0% 2014/15 2016/17
READINESS
12.3% 5.3% 2009/10 2016/17
UPWARD TREND IMPROVEMENT DOWNWARD TREND IMPROVEMENT UPWARD TREND NEEDS IMPROVEMENT DOWNWARD TREND NEEDS IMPROVEMENT 51.9% 53.2% 2015 2018 NOTE: Variation in data ranges are due to availability of data and frequency of data collection. GO TO TABLE OF CONTENTS

KINDERGARTEN READINESS
DESCRIPTION OF INDICATOR
Orange County uses the Early Development Index (EDI) to measure children’s readiness for school. The EDI – conducted during the kindergarten year – assesses children’s development by using a questionnaire filled out by kindergarten teachers for every child in their class. It tracks five areas of a child’s development: language and cognitive development; communication skills and general knowledge; social competence; emotional maturity; and physical health and wellbeing. In 2015, comprehensive EDI data was available for children enrolled in public school for the first time in Orange County and thus serves as a baseline to measure changes in incoming kindergarten class readiness over time.
Why is this important?
Long-term, a child’s academic success is heavily dependent upon their readiness for kindergarten. Children who enter school with early skills, such as basic knowledge of math and reading concepts as well as communication, language, social competence and emotional maturity, are more likely than their peers without such skills to experience later academic success, attain higher levels of education and secure employment.1 Factors that influence kindergarten readiness include family and community supports and environments, as well as children’s early development opportunities and experiences. The EDI is one way to assess how well communities are preparing its children for school.
Findings
• In 2018, 53.2% of children in Orange County were developmentally ready for kindergarten, a 2.5% increase from 2015 at 51.9%. Children are considered developmentally ready for school if they are on track in all five areas assessed (or in all four areas if only four areas were assessed).
• Among kindergartners, the areas of greatest vulnerabilities are language and cognitive
development (26% vulnerable or at-risk) and communication skills and general knowledge (26%). Fewer percentage of children are vulnerable or at risk in social competence (21%), physical health and well-being (20%) and emotional maturity (19%).
• The five developmental areas are made up of 16 sub areas which are measured by a child’s readiness (ready, somewhat ready or not ready). Within these sub areas, children are least ready in their communication skills and general knowledge (59% not ready or somewhat ready), prosocial and helping behavior (58%), overall social competence (53%), and gross and fine motor skills (48%).
• Communities with the highest percentage of students developmentally ready for school include North Tustin at 76.5% (102 EDI records), followed by Ladera Ranch at 76.0% (334), Los Alamitos at 67.8% (118) and Coto de Caza at 66.7% (51).2
• The lowest percentage of students ready for school are in the communities of Midway City at 36.2% (94), followed by Santa Ana at 44.1% (3,940), and Laguna Beach at 45.4% (97).
48 1 Duncan, G. J., Dowsett, C. J., and Claessens, A. (2007). School readiness and later achievement. Developmental Psychology, 43(6), 1428-1446. 2 EDI records indicates how many assessments were completed in each community and is provided to show sample size.
ONE IN FOUR KINDERGARTENERS ARE VULNERABLE OR AT RISK IN THE AREA OF LANGUAGE AND COGNITIVE DEVELOPMENT.
Percent of Children Ready for
1 Aliso Viejo 51% 2 Anaheim 48% 3 Brea 60% 4 Buena Park 53% 5 Costa Mesa 54% 6 Coto de Caza 67% 7 Cypress 60% 8 Dana Point 58% 9 Fountain Valley 53% 0 Fullerton 55% - Garden Grove 48% = Huntington Beach 58% q Irvine 64% w La Habra 46% e La Palma 55% r Ladera Ranch 76% t Laguna Beach 45% y Laguna Hills 49% u Laguna Niguel 65% i Lake Forest 59% o Las Flores N/A p Los Alamitos 68% [ Midway City 36% ] Mission Viejo 62% \ Newport Beach 60% a North Tustin 76% s Orange 51% d Placentia 57% f Rancho Santa Margarita 52% g Rossmoor n/a h San Clemente 54% j San Juan Capistrano 55% EDUCATION Communication Skills & General Knowledge Language & Cognitive Development Basic literacy skills Interest in literacy/numeracy and memory Advanced literary skills Basic numeracy skills Emotional Maturity Prosocial and helping behavior Anxious and fearful behavior Aggressive behavior Hyperactive and inattentive behavior Social Competence Overall social competence Responsibility and respect Approaches to learning Readiness to explore new things Physical Health & Well-being Physical readiness for school day Physical independence Gross and fine motor skills
for Kindergarten, by Sub Area, 2018 Note: Due to rounding, percentages may not add to 100. Source: Early Development Index, 2018 0 20 40 60 80 100%
Percent of Children Not Ready
Kindergarten, by Community of Residence, 2018 % of Students • 60.1% or Greater • 55.1% - 60.0% • 50.1% - 55.0% • 50.0% or Less • Few Data (less than 30 EDI records) • No data available e LA PALMA 55% r LADERA RANCH 76% t LAGUNA BEACH 45% y LAGUNA HILLS 49% u LAGUNA NIGUEL 65% i LAKE FOREST 59% o LAS FLORES N/A p LOS ALAMITOS 68% [ MIDWAY CITY 36% ] MISSION VIEJO 62% \ NEWPORT BEACH 60% a NORTH TUSTIN 76% s ORANGE 51% d PLACENTIA 57% 1 ALISO VIEJO 51% 2 ANAHEIM 48% 3 BREA 60% 4 BUENA PARK 53% 5 COSTA MESA 54% 6 COTO DE CAZA 67% 7 CYPRESS 60% 8 DANA POINT 58% 9 FOUNTAIN VALLEY 53% 0 FULLERTON 55% - GARDEN GROVE 48% = HUNTINGTON BEACH 58% q IRVINE 64% w LA HABRA 46% f RANCHO SANTA MARGARITA 52% g ROSSMOOR N/A h SAN CLEMENTE 54% j SAN JUAN CAPISTRANO 55% k SANTA ANA 44% l SEAL BEACH 49% ; STANTON 52% ' TRABUCO CANYON 65% z TUSTIN 50% x VILLA PARK 51% c WESTMINSTER 49% v YORBA LINDA 63% ORANGE COUNTY: 53.2% CALIFORNIA: N/A Note: N/A indicates no date are available. Source: Early Development Index, 2018 1 u 8 y h j \ v d 3 0 4 w e l c [ t z = 9 s 7 p 2 x k; 5 q ] a g i f r 6 o 41 21 38 79 10 11 82 5 13 83 7 10 29 29 42 33 15 52 15 79 6 3 9 88 7 6 87 14 13 73 10 43 47 7 18 75 2 17 81 3 97 11 89 11 28 62
' KINDERGARTEN READINESS SUPPLEMENTAL TABLES GO TO GO TO TABLE OF CONTENTS
• Not Ready • Ready • Somewhat Ready
THIRD GRADE ENGLISH LANGUAGE ARTS
DESCRIPTION OF INDICATOR
This indicator presents the California Assessment of Student Performance and Progress (CAASPP) data for student academic performance in English Language Arts and Literacy (ELA). Starting in 2014/15 (2015), CAASPP reflects the Common Core State Standards and online testing system to measure the academic performance of students. This indicator reports on third grade students.
Why is this important?
CAASPP is designed to demonstrate progress towards learning problem-solving and critical thinking skills needed for college and a career readiness. It gives schools and communities data on the performance of students and significant student groups within a school. This information helps schools analyze academic progress and if resource re-allocation is needed to ensure all students succeed. ELA assesses a student’s performance in reading, writing, listening and research. Understanding performance at the completion of third grade is important because third grade is the year that the focus of reading instruction shifts from learning to read, to reading to learn. Thirdgraders who lack proficiency in reading are four times more likely to become high school dropouts.1
Findings
• In 2017, a little over half (51%) of Orange County third grade students met or exceeded the statewide achievement standard for ELA, a 10.9% increase from 2015 (46%) and higher than California at 44%.
• Among third grade students who are not economically disadvantaged, 71% met or exceeded the achievement standards in ELA, substantially higher than those students who are economically disadvantaged at 32%.
• The greatest improvement was among economically disadvantaged students with a 21% increase in students who met or exceeded standards compared to a 3% increase
among students who were not economically disadvantaged.
• The ELA assessments are subdivided by four academic focus areas. Thirty percent of third graders exceeded standards in the area of writing, followed by 29% in research/inquiry, 27% in reading and 21% exceeded standards in listening.
• Across all focus areas, more third grade students were above standards in 2017 than 2015. The greatest improvement was in writing (28% increase), followed by research/inquiry (27% increase), listening (19% increase) and reading (19% increase) focus areas.
• Within each race/ethnic group, Asian students had the highest percentage of students who exceeded or met standards for ELA at 77%, followed by Filipino (73%), Multiracial (69%), White (69%), Pacific Islander (48%), Black (42%), and Hispanic (33%) students. American Indian students were the lowest percentage of students who met or exceed standards (32%), a decrease of 28.9% since 2015.
• The school districts with the highest percentage of third grade students exceeding or meeting standards for overall achievement in English language arts are Laguna Beach (83%), Los Alamitos (81%), Fountain Valley (71%) and Huntington Beach City (71%). The school districts with the lowest percentages are Anaheim City (23%), Santa Ana City (24%) and La Habra City (35%).
50 1 Hernandez, D.J. (2012). Double Jeopardy: How Third-Grade Reading Skills and Poverty Influence High School Graduation. The Annie E. Casey Foundation.
ECONOMICALLY DISADVANTAGED STUDENTS SHOW GREATEST IMPROVEMENT ON STANDARDIZED TESTING.
Overall Achievement in ELA Among Third Grade Students, by Socioeconomic Status,
2015 and 2017
• Standard Not Met
• Standard Nearly Met
• Standard Met
• Standard Exceeded
Note: A student is defined as “economically disadvantaged” if the most educated parent of the student, as indicated in CALPADS, has not received a high school diploma or the student is eligible to participate in free or reduced-price lunch program also known as the National School Lunch Program.
Source: CAASPP, 2017
Achievement in ELA Focus Areas Among Third Grade Students, 2017
• Above Standard
• Below Standard
Overall Achievement in ELA Among Third Grade Students, by Race/Ethnicity, 2015 to 2017
• 2015 Standard Exceeded/Met
• 2016 Standard Exceeded/Met
Note: ELA results include information about the students’ performance in the areas of reading, writing, listening, and research. The student’s performance in these key areas for each subject are reported using the following three indicators: below standard, at or near standard, and above standard.
Source: CAASPP, 2017
Note: Third grade student enrollment by race/ethnicity is 51% Hispanic, 24% White, 16% Asian, 4% Multiracial, 2% Filipino, 1% Black, 0.3% Pacific Islander, and 0.2% American Indian.
Source: CAASPP, 2017
Percent of Third Grade Students Who Exceeded or Met Standards for ELA Overall Achievement, by School District, 2017
Note: District comparisons should be interpreted with caution as districts vary greatly in composition, with differing proportions of students who are English learners, special needs, low income, or homeless – all factors which can influence achievement.
Source: CAASPP, 2017
EDUCATION
Reading Research/ Inquiry Writing Listening 80% 80% 40 60 40 20 60 0 0 20 1 ANAHEIM CITY 23% 2 BREA-OLINDA UNIFIED 62% 3 BUENA PARK ELEMENTARY 43% 4 CAPISTRANO UNIFIED 60% 5 CENTRALIA ELEMENTARY 55% 6 CYPRESS ELEMENTARY 63% 7 FOUNTAIN VALLEY ELEMENTARY 71% 8 FULLERTON ELEMENTARY 51% 9 GARDEN GROVE UNIFIED 52% 0 HUNTINGTON BEACH CITY ELEMENTARY 71% - IRVINE UNIFIED 70% = LA HABRA CITY ELEMENTARY 35% q LAGUNA BEACH UNIFIED 83% w LOS ALAMITOS UNIFIED 81% e MAGNOLIA ELEMENTARY 49% r NEWPORT-MESA UNIFIED 58% t OCEAN VIEW 60% y ORANGE COUNTY UNIFIED 47% u PLACENTIA-YORBA LINDA UNIFIED 63% i SADDLEBACK VALLEY UNIFIED 54% o SANTA ANA UNIFIED 24% p SAVANNA ELEMENTARY 41% [ TUSTIN UNIFIED 55% ] WESTMINSTER 55% ORANGE COUNTY: 51% CALIFORNIA: 44% • 70.1% - 100.0% • 50.1% - 70.0% • 30.1% - 50.0% • 0.0% - 30.0% % of Students 2 = 3 8 u 1 y e 5 p 6 w ] 9 o 7 t 0 r - i 4 q [ • At or Near Standard 100% 40 20 60 80 0 2015 2015 2017 2017 Economically Disadvantaged Not Economically Disadvantaged 41 46 12 12 27 28 20 17 18 16 28 26 14 9 40 45 • 2017 Standard Exceeded/Met Hispanic American Indian or Alaska Native Black Native Hawaiian or Pacific Islander White Multiracial Filipino Asian 73 75 77 71 70 69 69 64 45 37 36 25 72 68 37 39 40 31 73 69 32 42 48 33 27 30 21 29 40 43 61 47 32 28 17 24 THIRD GRADE ELA SUPPLEMENTAL TABLES GO TO GO TO TABLE OF CONTENTS
THIRD GRADE MATHEMATICS
MORE THAN HALF OF THIRD GRADE STUDENTS MET OR EXCEEDED STANDARDS IN MATH.
DESCRIPTION OF INDICATOR
This indicator presents the new California Assessment of Student Performance and Progress (CAASPP) data for student academic performance in mathematics. Starting in 2014/15 (2015), CAASPP reflects the Common Core State Standards and online testing system to measure the academic performance of students. This indicator reports on third grade students.
Why is this important?
CAASPP is designed to demonstrate progress towards learning problem-solving and criticalthinking skills needed for college and a career. It gives schools and communities data on the performance of all students and significant subgroups within a school. This information helps schools analyze their academic progress and if resource re-allocation is needed to ensure all students succeed. The mathematics component assesses a student’s performance in applying mathematical concepts and procedures, using appropriate tools and strategies to solve problems and demonstrating ability to support mathematical conclusions. It is known that math difficulties are cumulative and worsen with time.1 Understanding third grade performance is important because it is the year that students start utilizing the decimal system to do multi-digit number calculations, an important foundation for future success in mathematics.
Findings
• In 2017, over half (56%) of Orange County third grade students met or exceeded the statewide achievement standard in math, a 9.8% increase from 2015 and higher than California at 47%.
• Among third grade students who are not economically disadvantaged, 75% met or exceeded the achievement standards in math, substantially higher than those students who are economically disadvantaged at 37%.
• The greatest improvement was among economically disadvantaged students with a 19% increase in students who met or exceeded standards from 2015 to 2017 compared to a 4% increase among students who were not economically disadvantaged.
• Four in 10 (40%) third grade students were above the standard in concepts and procedures compared to problem solving and modeling/data analysis (32%) and communicating reasoning (34%).
• Asian students had the highest percentage of students who exceeded or met standards in math at 85%, followed by Filipino (74%), Multiracial (74%), White (72%), Pacific Islander (56%), Black (39%), American Indian (37%) and Hispanic (37%) students.
• The school districts with the highest percentage of third grade students exceeding or meeting standards for overall achievement in math were Los Alamitos Unified (86%), Laguna Beach Unified (85%), Fountain Valley Elementary (78%), and Irvine Unified (77%).
• The school districts with the lowest percentage of third grade students exceeding or meeting standards for overall achievement in math were Anaheim City (27%), followed by Santa Ana Unified (32%), and La Habra City Elementary (45%).
52
1 National Mathematics Advisory Panel. Foundations for success: The final report of the National Mathematics Advisory Panel. Washington, DC: U.S. Department of Education; 2008.
Overall Achievement Among Third Grade Students in Mathematics, by Socioeconomic Status, 2015 and 2017
• Standard Not Met
• Standard Nearly Met
• Standard Met
• Standard Exceeded
Note: A student is defined as “economically disadvantaged” if the most educated parent of the student, as indicated in CALPADS, has not received a high school diploma or the student is eligible to participate in free or reduced-price lunch program also known as the National School Lunch Program.
Source: CAASPP, 2017
Achievement in Mathematics Focus Areas Among Third Grade Students, 2017
• Above Standard
• Below Standard
Overall Achievement in Mathematics Among Third Grade Students, by Race/Ethnicity, 2015 to 2017
Note: Math results include information about the students’ performance in the areas of concepts and procedures, problem solving & modeling/data analysis, and communicating reasoning. The student’s performance in these key areas for each subject are reported using the following three indicators: below standard, at or near standard, and above standard.
Source: CAASPP, 2017
Note: Third grade student enrollment by race/ethnicity is 51% Hispanic, 24% White, 16% Asian, 4% Multiracial, 2% Filipino, 1% Black, 0.3% Pacific Islander, and 0.2% American Indian.
Source: CAASPP, 2017
Percent of Third Grade Students Who Exceeded or Met Standards for Mathematics Overall Achievement, by School District, 2017
Note: District comparisons should be interpreted with caution as districts vary greatly in composition, with differing proportions of students who are English learners, special needs, low income, or homeless – all factors which can influence achievement.
Source: CAASPP, 2017
EDUCATION
Concepts and Procedures Problem Solving & Modeling/Data Analysis Communicating Reasoning 50% 100% 40 20 60 80 0 0 25 White Black Multi-
Asian Hispanic Native
American Indian
Alaska Native Filipino 1 ANAHEIM CITY 27% 2 BREA-OLINDA UNIFIED 72% 3 BUENA PARK ELEMENTARY 49% 4 CAPISTRANO UNIFIED 62% 5 CENTRALIA ELEMENTARY 61% 6 CYPRESS ELEMENTARY 68% 7 FOUNTAIN VALLEY ELEMENTARY 78% 8 FULLERTON ELEMENTARY 56% 9 GARDEN GROVE UNIFIED 55% 0 HUNTINGTON BEACH CITY ELEMENTARY 76% - IRVINE UNIFIED 77% = LA HABRA CITY ELEMENTARY 45% q LAGUNA BEACH UNIFIED 85% w LOS ALAMITOS UNIFIED 86% e MAGNOLIA ELEMENTARY 52% r NEWPORT-MESA UNIFIED 62% t OCEAN VIEW 64% y ORANGE COUNTY UNIFIED 51% u PLACENTIA-YORBA LINDA UNIFIED 67% i SADDLEBACK VALLEY UNIFIED 56% o SANTA ANA UNIFIED 32% p SAVANNA ELEMENTARY 46% [ TUSTIN UNIFIED 56% ] WESTMINSTER 60% ORANGE COUNTY: 56% CALIFORNIA: 47% • 75.1% - 100.0% • 50.1% - 75.0% • 25.1% - 50.0% • 0.0% - 25.0% % of Students 2 = 3 8 u 1 y e 5 p 6 w ] 9 o 7 t 0 r - i 4 q [ • At or Near Standard 100% 40 20 60 80 0 2015 2015 2017 2017 Economically Disadvantaged Not Economically Disadvantaged 35 40 10 9 28 29 18 16 25 23 38 33 12 8 34 42 • 2015 Standard Exceeded/Met • 2016 Standard Exceeded/Met • 2017 Standard Exceeded/Met 81 74 70 69 43 39 52 31 85 76 73 72 46 42 39 37 84.6 74.3 73.9 72.1 55.5 38.6 36.5 37.1 40 32 34 32 45 46 27 24 20 THIRD GRADE MATHEMATICS SUPPLEMENTAL TABLES GO TO GO TO TABLE OF CONTENTS
racial
Hawaiian or Pacific Islander
or
HIGH SCHOOL DROPOUT RATES
DESCRIPTION OF INDICATOR
This indicator measures high school dropout rates for Orange County school districts, including detail by race/ethnicity and by program. Beginning in 2008, a student is considered a dropout if he or she was enrolled in grades 9 to 12 during the previous year and left before completing the current school year, or did not attend the expected school or any other school by October of the following year. Students who received a diploma, General Education Diploma (GED), or California High School Proficiency Exam (CHSPE) certificate; transferred to a degree-granting college; died; had a school-recognized absence; or were known to have left the state are not counted as dropouts.1
Why is this important?
Education provides benefits to both individuals and society. Compared to high school graduates, dropouts earn lower wages, pay fewer taxes, are more likely to commit crimes, are more likely to be on welfare and are far less healthy.2
Findings
• The Orange County cohort dropout rate for 2016/17 was 5.3% and lower than the California dropout rate of 9.1% in 2016/17 and the United States dropout rate for public schools of 6.1% in 2016.3
• In 2016/17, there were 40,949 cohort students of which 36,360 graduated and 2,185 students dropped out. The remaining 2,404 students did not graduate because they were either considered still enrolled at the time of the cohort’s graduation (1,260 students), Special Education completers (359 students), CHSPE completers (193), or received an adult education diploma (14) or the GED (31 students). A total of 547 students were “other transfers.”
• Dropout rates for the 2016/17 school year continued to be highest among Black students (8.4%), followed by Hispanic (7.4%), American Indian (7.3%), Multiracial (4.8%), White (3.5%), and Asian (2.6%) students.
• By program, dropout rates were highest among students enrolled as foster youth (26.5%), followed by English Learners (12.9%), Migrant Education (10.3), Students with Disabilities (9.0%), and Socioeconomically Disadvantaged (7.9%) programs.4
1 California Department of Education, DataQuest, 2016/17 data. A cohort is a defined group of students that could potentially graduate during a 4-year time period (grade 9 through grade 12). The 2016-17 Four-Year Adjusted Cohort Graduation Rate (ACGR) and Outcome data has been released. Beginning in 2016-17, the ACGR and Outcome data were calculated using different business rules and are not comparable with the Cohort Outcome data from previous years. 2 Belfield, C. and Levin, H. (2007). The Economic Losses from High School Dropouts in California. 3 National Center of Education Statistics, 2017, table 219.70. 4 Socioeconomically Disadvantaged is a student whose parents have not received a high school diploma or is eligible for the free or reduced-price lunch program. English Learner is a student identified as English learner based on the results of the California English Language Development Test or is a reclassified fluent-English-proficient student (RFEP) who has not scored at the proficient level on the California English-Language Arts and Mathematics Standards Tests. Student with Disabilities is a student who receives special education services and has a valid disability code or was previously identified as special education but who is no longer receiving special education services for two years after exiting special education. Migrant is a student
54
who changes schools during the year, often crossing school district and state lines, to follow work in agriculture, fishing, dairies, or the logging industry.
ORANGE COUNTY DROPOUT RATE IS 5.3%; LOWER THAN THE RATE ACROSS CALIFORNIA.
Percent of Grade 9-12 Cohort Dropouts, by
• Hispanic
Note: The 2016-17 Four-Year Adjusted Cohort Graduation Rate (ACGR) and Outcome data has been released. Beginning in 2016-17, the ACGR and Outcome data were calculated using different business rules and are not comparable with the Cohort Outcome data from previous years
Source: California Department of Education, DataQuest, 2017.
Percent of Grade 9-12 Cohort High School Dropouts, by
Number of Students Who Did Not Graduate by Cohort, by Reason, 2016/17
• Black
Multiracial EDUCATION 2009/10 2010/11 2012/13 2011/12 2016/17 2015/16 2014/15 2013/14
• American Indian or Alaska Native • Asian • White •
Race/Ethnicity
to 2016/17
2009/10
School
2016/17 1 ANAHEIM UNION HIGH 7.1% 2 BREA-OLINDA UNIFIED 2.7% 3 CAPISTRANO UNIFIED 1.0% 4 FULLERTON JOINT UNION HIGH 2.7% 5 GARDEN GROVE UNIFIED 8.3% 6 HUNTINGTON BEACH UNION HIGH 2.7% 7 IRVINE UNIFIED 2.7% 8 LAGUNA BEACH UNIFIED 4.8% 9 LOS ALAMITOS UNIFIED * 0 NEWPORT-MESA UNIFIED 5.3% - ORANGE UNIFIED 5.7% = PLACENTIA-YORBA LINDA UNIFIED 2.4% q SADDLEBACK VALLEY UNIFIED 2.7% w SANTA ANA UNIFIED 4.7% e TUSTIN UNIFIED 1.0% ORANGE COUNTY: 5.3% CALIFORNIA: 9.1% 3 = 4 2 e 61 w 5 7 8 0 q • 0.0% - 2.0% • 2.1% - 4.0% • 4.1% - 6.0% • 6.1% - 8.3% •10 or fewer students % Dropouts *Appears to protect student privacy where there are 10 or fewer students. Source: California Department of Education, DataQuest, 2017 Source: California Department of Education, DataQuest, 2017 • English Learners • Migrant Education • Socioeconomically Disadvantaged Percent of Grade 9-12 Cohort Dropouts, by Program, 2009/10 to 2016/17 • Students with Disabilities • Foster Youth 25% 20 15 10 5 0 14.7 10.0 3.9 4.7 5.6 9.5 13.2 7.4 3.5 4.5 4.9 8.9 12.6 5.6 3.3 3.9 7.3 15.3 14.0 11.3 3.9 10.4 9.4 10.3 4.8 5.3 5.3 2.6 2.4 3.1 4.7 4.5 4.5 5.7 5.4 6.7 8.1 7.4 10.0 3.7 3.8 3.9 9.9 5.3 12.3 7.3 17.2 7.4 20.1 8.4 6.7 4.8 5.7 3.5 5.2 2.6 Overall Orange County 2009/10 2010/11 2011/12 2012/13 2016/17 2015/16 2014/15 2013/14 35% 14 7 21 28 0 21.9 21.4 18.2 10.8 17.5 10.9 20.4 12.6 11.5 12.8 12.9 11.1 16.0 14.6 10.2 26.4 24.7 10.5 8.5 7.7 11.7 11.8 8.9 10.6 9.9 8.8 30.8 10.3 12.9 26.5 9.0 8.8 15.1 13.8 13.0
District,
• Cohort Student Dropouts
Graduation
Other Transfers
Special Ed Completers
CHSPE Completers • Completed the GED
Adult Education Diploma Completers 14 31 193 Source: California Department of Education, DataQuest, 2017 547 359 2,185 1,260 9 HIGH SCHOOL DROPOUT RATES SUPPLEMENTAL TABLES GO TO GO TO TABLE OF CONTENTS
• Still Enrolled at Time of Cohort
•
•
•
•
COLLEGE READINESS
OVERALL COLLEGE READINESS INCREASES; RATES VARY AMONG RACES/ETHNICITIES AND PROGRAMS.
DESCRIPTION OF INDICATOR
This indicator tracks the number and percent of students who graduate from high school having completed the course requirements to be eligible to apply to a University of California (UC) or California State University (CSU). The UC/CSU eligibility requirements are presented below.
Why is this important?
The UC/CSU minimum course requirements are centered on a well-rounded curriculum that fosters content mastery and ensures that students are ready to take college courses without remediation. Courses include an applied learning component to help students improve comprehension and practice critical thinking skills. The more students master the content in conjunction with these skills, the more likely they are to pursue and succeed in college, as well as in the workforce.1
Findings
• In 2016/17, Orange County had 37,355 high school graduates, of which 52.0% were UC/CSU eligible, higher than California’s eligibility rate of 46.8%.2
• UC/CSU eligibility in Orange County increased 15.8% in 10 years, from 44.9% of graduates in 2007/08 to 52.0% in 2016/17.
UC/CSU Requirements
• 4 years of English
• 3 years of Math, including Algebra, Geometry, and Intermediate Algebra
• 2 years of History/Social Studies, including one year of U.S. History or one-half year of U.S. History and one-half year of Civics or American Government; and one year of World History, Cultures, and Geography
• At 77.5%, Asian students had the greatest proportion of graduates who were UC/CSU eligible, followed by White (58.1%), Multiracial (56.7%), Black (38.3%), Hispanic (38.0%), and American Indian (32.9%), graduates.
• Hispanic graduates comprise the largest group of total graduates (44.0%), while only 38.0% of those were UC/CSU eligible. This is lower than Asian (16.0% of total graduates, of which 77.5% were UC/CSU eligible) and White (31.0% of graduates, of which 58.1% were UC/CSU eligible) graduates.
• Since 2007/08, the UC/CSU eligibility rates for graduates have increased the most among students in the Migrant Education program (159.1% increase), followed by students in the Socioeconomically Disadvantaged program (71.9% increase). The eligibility rate for graduates of the English Learner program has declined 67.7% since 2007/08.3
• 2 years of Science with lab required chosen from Biology, Chemistry, and Physics
• 2 years of Foreign Language and must be the same language for those two years
• 1 year of Visual and Performing Arts chosen from Dance, Drama/Theater, Music, or Visual Art
• 1 year of Electives
56 1 University of California, Office of the President (UCOP). 2 California Department of Education, DataQuest, 2018. 3 See footnotes on page 54 for program descriptions.
EDUCATION Percent of Graduates in Orange County and California Meeting UC/CSU Entrance Requirements, 2007/08 to 2016/17 • Orange County • California Source: California Department of Education, DataQuest, 2018. 60% 40 0 Percent of Graduates Meeting UC/CSU Entrance Requirements, by School District, 2016/17 20 3 = 4 2 9 e 61 w 5 7 8 0 q 27.9 21.7 25.0 23.2 16.2 8.5 30.1 18.2 17.5 30.8 35.5 21.4 23.9 37.1 5.8 5.8 7.3 6.2 6.2 20 40 60% 0 2016/17 2015/16 2014/15 2007/08 2008/09 2009/10 2010/11 2011/12 2013/14 2012/13 1 ANAHEIM UNION HIGH 40.0% 2 BREA-OLINDA UNIFIED 55.1% 3 CAPISTRANO UNIFIED 53.7% 4 FULLERTON JOINT UNION HIGH 55.7% 5 GARDEN GROVE UNIFIED 57.5% 6 HUNTINGTON BEACH UNION HIGH 46.9% 7 IRVINE UNIFIED 69.0% 8 LAGUNA BEACH UNIFIED 76.5% 9 LOS ALAMITOS UNIFIED 74.0% 0 NEWPORT-MESA UNIFIED 60.0% - ORANGE UNIFIED 47.6% = PLACENTIA-YORBA LINDA UNIFIED 53.2% q SADDLEBACK VALLEY UNIFIED 53.4% w SANTA ANA UNIFIED 49.3% e TUSTIN UNIFIED 63.1% • 40.0% - 50.0% • 50.1% - 60.0% • 60.1% - 70.0% • 70.1% - 80.0% % Meeting Requirements 40.7 40.3 38.3 42.8 43.3 48.9 50.4 33.9 35.3 36.3 36.9 38.3 41.9 43.4 Percent of Graduates, by Program Meeting UC/CSU Entrance Requirements, 2007/08 to 2016/17 Source: California Department of Education, DataQuest, 2018 Source: California Department of Education, DataQuest, 2018
of Graduates and Percent of Graduates Meeting UC/CSU Entrance Requirements, 2016/17 • Total Graduates • Migrant Education Source: California Department of Education, DataQuest, 2018 • Percent of UC/CSU Eligible Graduates within each Race/Ethnicity • Socioeconomically Disadvantaged • English Learners 2008/09 2010/11 2009/10 2007/08 2011/12 2012/13 2016/17 2015/16 2014/15 2013/14 36.1 37.5 ORANGE COUNTY: 52.0% CALIFORNIA: 46.8% 33.5 44.9 36.1 7.6 39.7 32.7 37.2 46.8 45.4 52.0 51.1 23.5 23.1 19.3 50.0 Hispanic 38.0% 16,509 Total 52.0% 37,355 White 58.1% 11,717 Asian 6,051 77.5% Multiracial 1,078 56.7% 614 38.3% Black American Indian 210 32.9% COLLEGE READINESS SUPPLEMENTAL TABLES GO TO GO TO TABLE OF CONTENTS
Number
SAFE HOMES AND COMMUNITIES INDICATORS
GANG ACTIVITY AMONG YOUTH 144.4 26.9 2008 2017 JUVENILE GANG-RELATED PROSECUTIONS PER 100,000 YOUTH 10 TO 17 YEARS OLD JUVENILE ARRESTS 4,111 1,332 2007 2016 JUVENILE ARREST RATE PER 100,000 YOUTH 10 TO 17 YEARS OLD SUBSTANTIATED CHILD ABUSE 11.2 6.4 2008 2017 SUBSTANTIATED CHILD ABUSE ALLEGATIONS RATE PER 1,000 CHILDREN 0 TO 17 YEARS OLD PREVENTABLE CHILD AND YOUTH DEATHS UNINTENTIONAL INJURY DEATH RATE PER 100,000 YOUTH 1 TO 19 YEARS OLD CHILD WELFARE 38.9% 38.8% 2006/07 2015/16 PERCENT OF CHILDREN ENTERING FOSTER CARE PLACED IN PERMANENT HOMES WITHIN 12 MONTHS 6.9 4.6 2007 2016 JUVENILE SUSTAINED PETITIONS 1,048 442 2003 2016 SUSTAINED PETITIONS PER 100,000 YOUTH 10 TO 17 YEARS OLD UPWARD TREND IMPROVEMENT DOWNWARD TREND IMPROVEMENT UPWARD TREND NEEDS IMPROVEMENT DOWNWARD TREND NEEDS IMPROVEMENT NOTE: Variation in data ranges are due to availability of data and frequency of data collection. GO TO TABLE OF CONTENTS
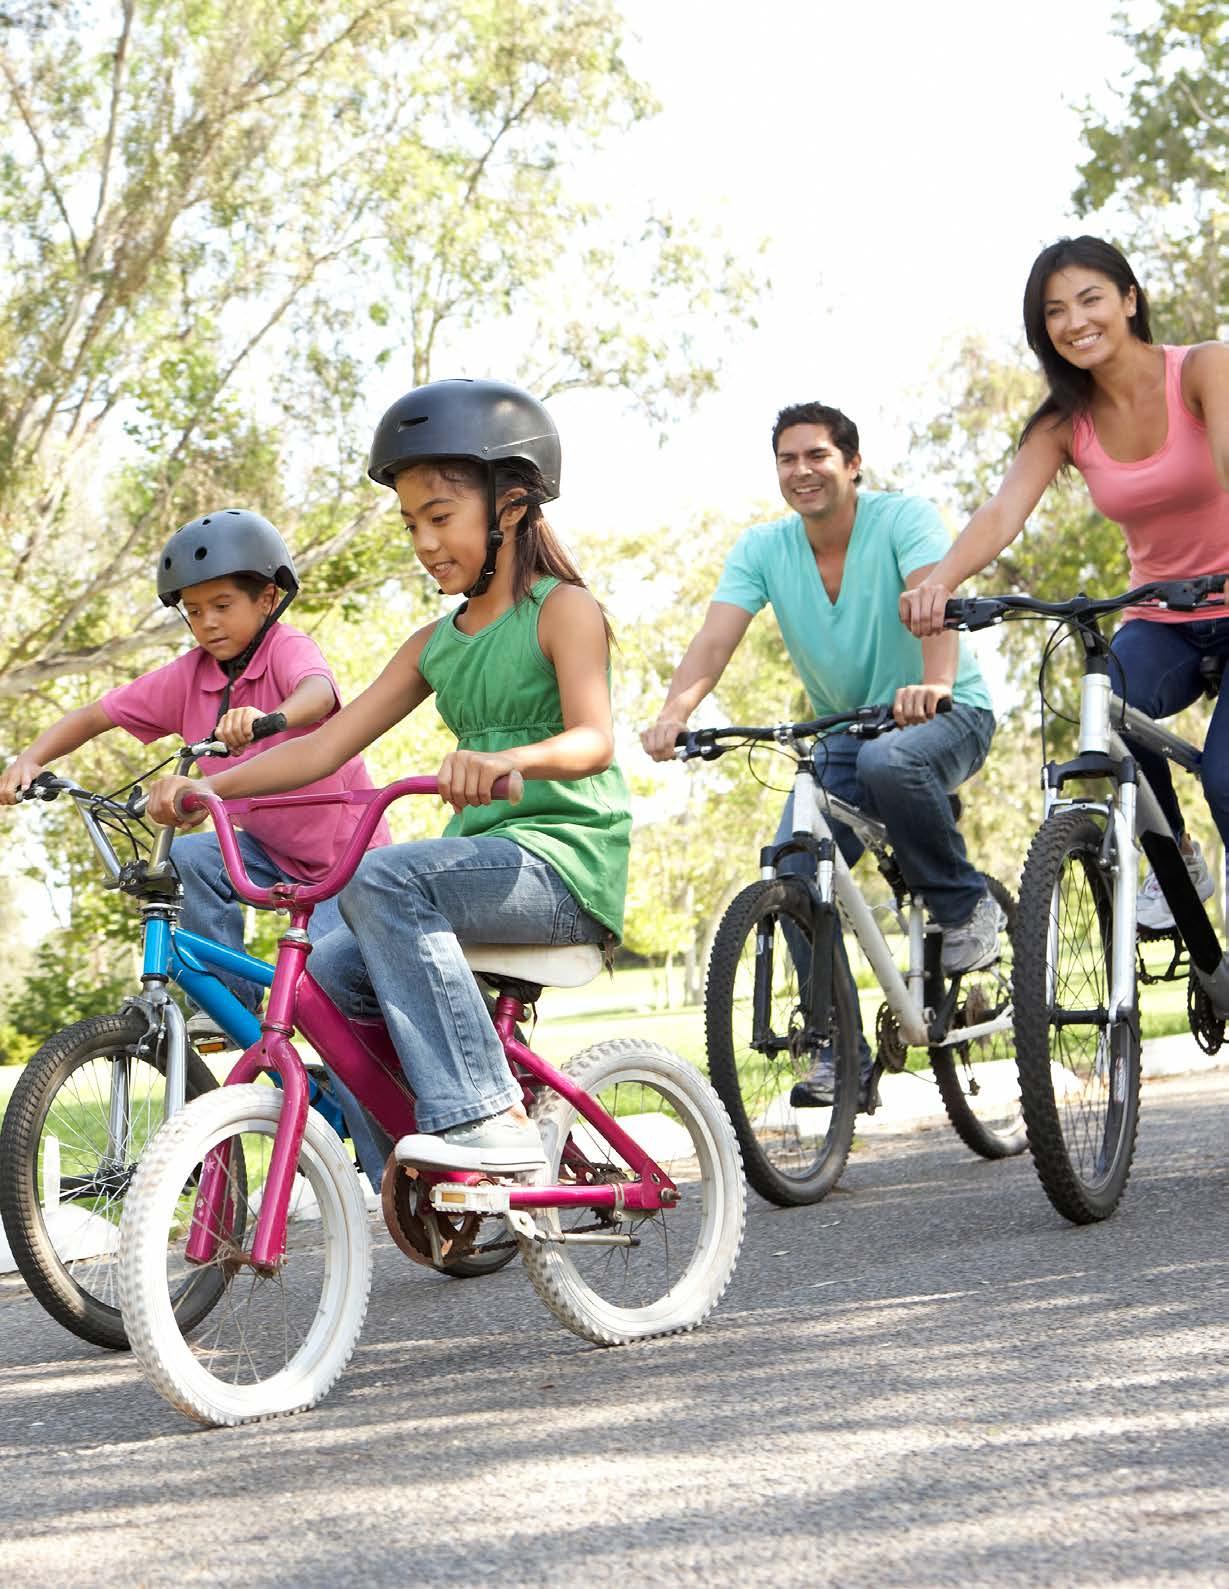
PREVENTABLE CHILD AND YOUTH DEATHS
UNINTENTIONAL INJURIES DECLINE WHILE SUICIDE AND HOMICIDE RATES GRADUALLY INCREASE.
DESCRIPTION OF INDICATOR
This indicator reports the number of deaths from unintentional and intentional injuries, including suicide and homicide. Leading causes of death by age group are also identified.
Why is this important?
The death of every child is a tragedy for family and friends and a loss to the community. Along with the direct impact of a child’s death, the child death rate in a community is an important indicator for public health advocates and policymakers. A high rate can point to underlying problems, such as violent neighborhoods or inadequate child supervision.1 Unintentional childhood mortality due to injury is strongly inversely related to median income and thus, a solid indicator of poverty. It can also point to inequities, for example, in access to health care or safe places to play.2 Because children are much more likely to die during the first year of life (infancy) than they are at older ages, trends in infant mortality are discussed separately (page 16).
Findings
• Orange County’s overall injury death rate for children has increased 2.2% from 9.1 per 100,000 children ages one to 19 years in 2007 to 9.3 per 100,000 children in 2016, which is lower than California’s rate of 11.3 in 2016.
• The unintentional injury death rate (e.g., accidental poisoning, motor vehicle accident, or drowning) decreased 33% from a peak rate of 6.9 per 100,000 children in 2007 to 4.6 per 100,000 children in 2016.
• Despite this decrease, unintentional injuries accounted for the highest average number (37 per year) and rate (4.8 per 100,000) of all injury deaths to children between 2014 and 2016, followed by cancer (21 per year) and suicide (16 per year).
• Suicide rates for children have increased 150% from 1.0 per 100,000 children ages one to 19 years in 2007 to 2.5 per 100,000 children in 2016. Homicide rates have also increased by 72.7%, from 1.1 per 100,000 children ages one to 19 years in 2007 to 1.9 per 100,000 children in 2016.
• Over half (52.3%) of all child and youth deaths were among older teens (ages 15 to 19).
• Male mortality rate increased 54% from 17.0 per 100,000 in 2015 to 26.2 per 100,000 in 2016. During the same period, the female mortality rate remained stable (13.7 per 100,000 in 2015 and 13.6 per 100,000 in 2016).
• White, Hispanic, and Asian/Pacific Islander groups had higher rates in 2016 when compared to 2015 (19.4 vs 13.9, 20.2 vs 16.8, and 21.2 vs 15.7, respectively).
60
1 Infant, Child and Teen Mortality, Indicators on Children and Youth, Child Trends Data Bank, updated June 2013 (www.childtrendsdatabank.org). 2 Consumer Federation of America. 2013. Child Poverty, Unintentional Injuries and Foodborne Illness: Are Low-Income Children at Greater Risk?
Injury, Unintentional Injury, Suicide and Homicide, Rate Per 100,000 Children, One to 19 Years Old 2007 to 2016
Overall Mortality Rates for Children, One to 19 Years Old, by Race/Ethnicity Orange County, 2012 to 2016
Leading Causes of Death for Children One to 19 Years Old, by Age Group and Number of Deaths,
FIRST LEADING CAUSE SECOND LEADING CAUSE THIRD LEADING CAUSE
Source: Orange County Health Care Agency Source: Orange County Health Care Agency • All Injury Deaths • Unintentional Injury • Suicide • Homicide • White • Hispanic • Asian or Pacific Islander SAFE HOMES & COMMUNITIES 2007 2010 2013 2008 2011 2014 2009 2012 2016 2015 2012 2014 2015 2013 2016 0 0 10 25 20 15 5 10 5 Notes: Three-year total number of deaths. *Tied Source: Orange County Health Care Agency 16.0 14.9 11.5 18.1 17.0 8.0 16.8 15.7 13.9 9.6 5.1 1.9 1.5 8.1 4.1 1.4 2.4 8.0 8.0 8.9 7.6 6.0 5.5 4.4 1.0 1.7 2.0 0.9 1.2 1.2 4.7 1.5 1.5 7.3 4.4 1.4 1.5 9.4 6.1 2.1 1.2
2014-2016
Unintentional Injuries (110) 1-19 Years Cancer (63) Suicide (47) Unintentional Injuries (62) 15-19 Years Suicide (42) Homicide (29) Unintentional Injuries (20) 10-14 Years Cancer (14) Suicide (5) Cancer (19) 5-9 Years Unintentional Injuries (12) Congenital Anomalies (9) Unintentional Injuries (16) 1-4 Years Congenital Anomalies* (13) Cancer* (13) 1.1 2.5 1.9 4.6 9.3 6.9 9.1 1.0 12.3 21.2 20.2 19.4 16.0 18.2 PREVENTABLE CHILD AND YOUTH DEATHS SUPPLEMENTAL TABLES GO TO GO TO TABLE OF CONTENTS
SUBSTANTIATED CHILD ABUSE
DESCRIPTION OF INDICATOR
This indicator reports the unduplicated count of children with substantiated child abuse allegations. Allegations refer to the nature of abuse or neglect that a child is experiencing (e.g. sexual or physical). A substantiated child abuse allegation is determined by the investigator based upon evidence that makes it more likely than not that child abuse or neglect occurred as defined in Penal Code (PC) 1165.6. A substantiated allegation does not include a report where the investigator later found the report to be false, inherently improbable, to involve accidental injury, or to not constitute child abuse or neglect as defined in PC 1165.6.
Why is this important?
Studies indicate that victims of child abuse are more likely to use drugs and alcohol, become homeless as adults, engage in violence against others and be incarcerated. The identification of a family in which a substantiated incident of abuse or neglect has occurred is important because it provides an opportunity for intervention to assure child safety. Once a child abuse referral is substantiated by the investigating social worker, safety threats for the child(ren) are identified and a social worker works with the family to develop a safety plan.
Findings
• In 2017, 31,683 children were the subject of one or more child abuse allegations in Orange County. Of these, 14.6% (4,628) of children had substantiated allegations of child abuse, higher than California in 2015, at 13.8%.1
• In 2017, substantiated allegations occurred at a rate of 6.4 per 1,000 children, a 42.9% decrease from 11.2 in 2008, and lower than California (7.5), with a 26.5% decrease from
10.2 in 2008. In 2014, there were approximately 692,235 maltreated children with substantiated allegations in the United States, a rate of 9.1 per thousand population, higher than Orange County and California.2
• Children under six made up the greatest proportion of substantiated allegations: children less than one year of age comprised 12.8% of substantiated child abuse allegations and children one to five years old made up 30.7% of allegations totaling 43.5%. Children six to 10 years old made up 27.9%; 11 to 15 years old, 21.2%; and 16 to 17 years old, 7.4%.
• In 2016, most (71.0%) substantiated child abuse allegations were due to general neglect, followed by at-risk/sibling abuse (11.3%), severe neglect (5.3%), and sexual abuse (5.1%) substantiated allegations. Physical abuse (3.8%), caretaker absence (2.5%), emotional abuse (0.3%) and exploitation (0.8%) made up the remaining types.
62 1 University of California, Berkeley, California Child Welfare Indicators Project, CWS/CMS 2017 Quarter 4 Extract. 2 U.S. Department of Health and Human Services, Children’s Bureau. Child Maltreatment, 2016.
SUBSTANTIATED ABUSE IS DECLINING; CHILDREN UNDER SIX MAKE UP THE GREATEST PROPORTION OF SUBSTANTIATED CHILD ABUSE.
Substantiated Child Abuse Allegations, Rate per 1,000 Children Under 18 Years Old 2008 to 2017 Note: Rates are based on unduplicated count of children. Source: Orange County Social Services Agency, 2017 • Orange County • California • Child Abuse Allegations • Substantiated Allegations Substantiated Child Abuse Allegations, Rate per 1,000 Children, by City, 2017 Note: Numbers are based on unduplicated count of children. Source: CWS/CMS 2016 Quarter 4 Extract, Orange County Social Services Agency Total Number of Children with Child Abuse Allegations and Substantiated Allegations, 2008 to 2017 w LA PALMA 2.8 e LAGUNA BEACH 3.3 r LAGUNA HILLS 6.3 t LAGUNA NIGUEL 5.3 y LAGUNA WOODS N/A u LAKE FOREST 4.6 i LOS ALAMITOS 8.2 o MISSION VIEJO 4.0 p NEWPORT BEACH 4.2 [ ORANGE 7.5 ] PLACENTIA 7.9 \ RANCHO SANTA MARGARITA 2.8 a SAN CLEMENTE 4.1 1 ALISO VIEJO 4.0 2 ANAHEIM 12.8 3 BREA 5.0 4 BUENA PARK 6.4 5 COSTA MESA 9.4 6 CYPRESS 2.8 7 DANA POINT 5.2 8 FOUNTAIN VALLEY 3.5 9 FULLERTON 8.4 0 GARDEN GROVE 5.3 - HUNTINGTON BEACH 4.8 = IRVINE 4.5 q LA HABRA 6.4 s SAN JUAN CAPISTRANO 8.9 d SANTA ANA 12.2 f SEAL BEACH 7.3 g STANTON 4.8 h TUSTIN 8.8 j VILLA PARK 0.0 k WESTMINSTER 7.2 l YORBA LINDA 1.8 Note: N/A indicates data are not available. For Laguna Woods, this is due to the small number of children living in Laguna Woods. Source: Orange County Social Services Agency, 2017 2008 2010 2013 9.5 9.4 2011 9.9 10.7 2014 9.3 8.1 2009 8.5 7.8 2012 9.6 10.0 2017 2016 2015 9.2 9.1 7.5 7.8 0 15 10 5 1 t 7 r a s p l ] 3 9 4 q w f k e h8 [ 6 i 2 j d 0 g 5 = o u \ • 10.0 or Greater • 6.0 - 9.9 • 3.0 - 5.9 • 0.0- 2.9 • Unincorporated • No data available Rate Per 1,000 Children ORANGE COUNTY: 6.4 CALIFORNIA: 7.5 SAFE HOMES & COMMUNITIES 40,000 10,000 20,000 30,000 0 2008 2010 2013 2011 2014 2009 2012 2017 2016 2015 26,951 7,364 24,563 5,819 25,808 5,360 29,592 31,980 31,168 31,683 5,539 5,758 5,478 4,628 26,944 7,930 29,029 8,494 24,558 6,834 y 8.1 7.3 11.2 10.2 7.5 6.4 SUBSTANTIATED CHILD ABUSE SUPPLEMENTAL TABLES GO TO GO TO TABLE OF CONTENTS
CHILD WELFARE
DESCRIPTION OF INDICATOR
This indicator reports on three measures of permanency following the placement of a child into foster care. “Permanency within 12 months” reports the percent of children placed in homes through reunification with the family, adoption or guardianship within 12 months of removal. “Reentry Following Reunification” tracks those children who reentered foster care within 12 months of reunification with the family or guardianship. “Exits to Permanency” is a measure of children who were in foster care for 24 months or longer, who were then transitioned to a permanent home, including reunified with the family, placed with a legal guardian, or adopted.1
Why is this important?
The placement of children in out-of-home care occurs when a child cannot remain safely with his or her family.2 Child abuse and neglect is a problem that crosses socioeconomic and racial/ ethnic boundaries with profound effect on the well-being of the children. The number of children growing to maturity in out-of-home care has gained considerable national, state and local attention. Too often these children experience many placements, which can lead to the inability to reunify with their families or attach to a new permanent family. Permanent placement of children helps prevent placement instability, which can be related to attachment disorders, poor educational outcomes, mental health and behavioral problems and negative adult outcomes.
Findings
• In 2015/16, 38.8% of Orange County children were placed in permanent homes within 12 months of entering foster care, higher than
California at 35.8% for the first time in six years. The national goal is greater than or equal to 40.5%.
• Of the nearly 40% of children who were placed in permanent homes within 12 months of entering foster care in 2015/16, reunification was the most common type of permanency (36.1%), followed by adoption (1.6%) and guardianship (1.1%).
• The percent of children in Orange County reentering foster care within 12 months of reunification or guardianship increased for the third consecutive year.3 In 2014/15, the rate of reentry was 10.4%, a 19.5% increase since 2005/06.4 California was higher at 10.7%. The national goal is less than or equal to 9.3%.
• In 2016/17, 28.6% of children were in foster care for two years or more before being placed in a permanent home, 19.2% higher than in 2007/08 (24.0%). California is higher at 30.7%. The national goal is greater than or equal to 30.3%.
64
PLACEMENT OF FOSTER CHILDREN IN PERMANENT HOMES EXCEEDS THE STATE FOR THE FIRST TIME IN SIX YEARS; HOWEVER, THE RATE OF CHILDREN REENTERING FOSTER CARE IS CLIMBING.1
1 Exists to permanency measures children who were in foster care for 24 months or longer on the first day of the year, who were then transitioned to a permanency within 12 months. 2 University of California, Berkley, Center for Social Services Research, 2013. 3 Historically, an increase in the rate of permanency within 12 months has been associated with a greater percent of youth re-entering foster care. The increase in the rate of re-entry may also be associated with a growing population of youth with higher level of needs. 4 Reentry measures are only for those children who have been removed from the home and reach unification or guardianship within 12 months.
Percent of Children Entering Foster Care and Placed in a Permanent Home within 12 months, Orange County and California,
• California
Percent of Children Entering Foster Care and Placed in a Permanent Home within 12 months, by Type of Permanency, 2006/07 to 2015/16
Percent of Children Reentering Foster Care within 12 months of Reunification or Guardianship, Orange County and California, 2004/05 to 2014/15
• California
Note: Due to methodological differences, the reporting period for no reentry following reunification will always be one year behind what is reported for the other measures.
Source: CWS/CMS 2017 Quarter 4 Extract, UC Berkley, Center for Social Services Research
Percent of Children in Foster Care, 24+ Months, Placed in a Permanent Home, Orange County and California, 2007/08 to 2016/17
• Orange County
Note: Permanency is defined as achieved when the child is reunified with the family, placed with a legal guardian, or adopted.
Source: CWS/CMS 2017 Quarter 4 Extract, UC Berkley, Center for Social Services Research
SAFE HOMES & COMMUNITIES
15% 35% 10 28 21 14 0 0 5 7 12.1 4.3 11.7 5.5 12.3 7.0 11.8 8.4 11.9 5.2 12.0 11.6 4.1 6.3 25.0 26.3 26.4 25.8 25.7 32.9 34.1 33.6 24.5 26.2 23.9 24.8 21.8 25.0 28.5 29.2 2007/08 2010/11 2008/09 2012/13 2011/12 2009/10 2013/14 2014/15 2016/17 2015/16
• Reunification Source: CWS/CMS 2017 Quarter 4 Extract, UC Berkley Center for Social Services Research 50% 40 30 0 10 20 2006/07 2009/10 2007/08 2011/12 2010/11 2008/09 2012/13 2013/14 2015/16 2014/15
2006/07 to 2015/16 Source: CWS/CMS 2017 Quarter 4 Extract, UC Berkley Center for Social Services Research 50% 40 42.8 38.8 42.4 42.7 44.0 42.7 41.1 34.8 38.8 35.2 27.9 36.8 30.9 34.2 36.8 36.0 30 10 0 20 2005/06 2009/10 2009/10 2007/08 2007/08 2006/07 2006/07 2011/12 2011/12 2010/11 2010/11 2008/09 2008/09 2012/13 2012/13 2013/14 2013/14 2015/16 2014/15 2014/15 • Orange County • California • Orange County • Adoption • Guardianship 0.8 1.3 1.3 1.1 0.9 1.1 1.5 1.1 1.9 1.6 0.4 0.5 0.4 0.9 1.0 1.0 1.6 1.9 0.9 1.1 37.7 37.0 40.7 42.0 32.9 33.1 24.8 27.9 31.4 36.1 48.6 13.9 38.9 8.7 24.0 38.8 10.7 11.4 35.8 9.1 23.3 28.6 30.7 10.4 CHILD WELFARE SUPPLEMENTAL TABLES GO TO GO TO TABLE OF CONTENTS
JUVENILE ARRESTS
JUVENILE ARRESTS DROP 70% IN 10 YEARS.
DESCRIPTION OF INDICATOR
This indicator tracks youth 10-17 years old who have been taken into custody in a manner authorized by law. An arrest may be made by a peace officer or by a private person. It may be a felony, misdemeanor, status, or infraction. Felonies generally include violent crimes (such as murder, assault, and rape), some property and drug-related offenses, plus other more serious offenses. Misdemeanor offenses include crimes such as assault and battery, petty theft, other drug and alcohol-related offenses and many less serious offenses. Status offenses are acts that are considered offenses only when committed by a juvenile, such as truancy or curfew violations. Infractions include non “criminal” charges such as seatbelt violations, speeding tickets, littering citations and running a red light.
Why is this important?
An arrest is usually the first formal encounter a youth has with the juvenile justice system. It is particularly important that at this onset of criminal activity, a pattern of juvenile delinquency does not continue into adulthood. More importantly, the flow of youthful offenders into the justice system should be prevented. Research shows that early intervention in children’s lives can effectively reduce later crime.1 Prevention programs positively impact the general public because they stop crime from happening in the first place.2 Various cost-benefit analyses show that early prevention programs are a worthwhile investment of government resources compared with prison and other criminal justice responses.3
Findings
• In 2016, there were 4,521 juvenile arrests in Orange County, and 62,646 in California.
• Between 2007 and 2016, there was a 69.8% decrease in the total number of juvenile arrests in Orange County, dropping from 14,988 arrests to 4,521 arrests.
• Orange County’s juvenile arrest rate in 2016 was 1,332 per 100,000 youth 10 to 17 years old, a decrease of 67.6% from 2007, compared to California at 1,500 per 100,000 youth, a decrease of 70.4% since 2007.
• In Orange County, misdemeanors accounted for 57.1% (2,581), felonies for 26.4% (1,195) and status offenses for 16.5% (745) of arrests among youth ages 17 years and under in 2016.
• In 2016, 8.2% (110) of fatal and injury collisions due to driving under the influence of alcohol involved youth under the age of 21 years; 71% of those youth were male.
• Among 18 to 20 year olds, DUI convictions have increased by 4% since 2004 with a peak of 1,226 convictions in 2009. Among youth under 18 years, there was a 12% decrease since 2004, with a peak of 84 convictions in 2008.4
66 1 Zagar, R.J., Busch, K.G., and Hughes, J.R., 2009. 2 Saminsky, A., 2010. 3 Welsh, B.C. and Farrington, D.P., 2009. 4 Current DUI conviction data are not available.
Note: Information on crash involvement is maintained and produced by the California Highway Patrol; 2016 crash data are the most recent available.
Source: California Highway Patrol, Information Services Unit Statewide Integrated Traffic Records System, Table 5J.
Note: The number of DUI convictions per year are based on data from two years prior. DUI conviction data for 2016 were not available at time of printing.
Source: Annual Reports of the California DUI Management Information System (2006-2016)
Juvenile Arrest Rate per 100,000 Youth 10 to 17 Years Old Orange County and California, 2007 to 2016 • California • Orange County Note: 2007 to 2012 figures were based on population projections as of 2007 while 2013 and 2014 figures were based on revised projections as of December 2014. 2015 figures were based on revised projections as of February 2017. Sources: Criminal Justice Statistics Center, California Department of Justice Demographic Research Unit, California State Department of Finance 6,000 3,000 0 1,000 2,000 5,000 4,000 Percent Youth 0-20 Years in Fatal and Injury Collisions by “Had Been Drinking Drivers,” by Age 2011 to 2016 DUI Convictions in Orange County, by Age 2006 to 2015 Percent of Juvenile Arrests, by City, Youth 10 to 17 Years Old 2016 w LA PALMA 0.2 e LAGUNA BEACH 0.8 r LAGUNA HILLS 0.0 t LAGUNA NIGUEL 0.2 y LAGUNA WOODS 0.0 u LAKE FOREST 1.8 i LOS ALAMITOS 0.1 o MISSION VIEJO 7.3 p NEWPORT BEACH 10.5 [ ORANGE 3.0 ] PLACENTIA 1.0 \ RANCHO SANTA MARGARITA 0.3 a SAN CLEMENTE 0.8 Sources: Criminal Justice Statistics Center, California Department of Justice, Demographic Research Unit, California State Department of Finance 1 ALISO VIEJO 0.3 2 ANAHEIM 1.1 3 BREA 2.1 4 BUENA PARK 1.0 5 COSTA MESA 1.5 6 CYPRESS 0.2 7 DANA POINT 2.0 8 FOUNTAIN VALLEY 1.7 9 FULLERTON 1.9 0 GARDEN GROVE 1.9 - HUNTINGTON BEACH 0.7 = IRVINE 0.6 q LA HABRA 4.8 s SAN JUAN CAPISTRANO 1.5 d SANTA ANA 2.1 f SEAL BEACH 1.0 g STANTON 0.3 h TUSTIN 1.1 j VILLA PARK 0.9 k WESTMINSTER 0.7 l YORBA LINDA 0.0 1 t 7 r y a s p l ] 3 9 4 q w f k e h8 [ 6 i 2 j d 0 g 5 = o u \ 2007 2009 2012 2010 2013 2008 2011 2014 2016 2015 • 3.0% or Greater • 2.0% - 2.9% • 1.0% - 1.9% • 0.0% - 0.9% • Unincorporated % Juvenile Arrests SAFE HOMES & COMMUNITIES 4,121 4,960 4,502 4,010 4,145 3,809 3,352 2,718 2,370 2,134 1,725 1,422 2,076 1,994 2,457 3,069
• 0-14 • 18-20 2011 2016 2015 2014 2013 2012 4% 1,500 1 300 3 900 2 600 1,200 0 0 • 15 • Under 18 • 16 • 17 • 18 • 19 • 20 ORANGE COUNTY: 1.4% CALIFORNIA: N/A 1,332 1,500 4,111 5,071 2006 2007 51 830 2009 84 1,112 2008 42 1,080 2010 73 1,226 2015 2014 59 910 2012 87 1,044 2013 67 1,098 2011 76 1,170 849 55 694 32 0.4 0.2 0.2 0.1 0.1 0.0 3.6 3.6 0.0 1.9 0.9 3.1 3.2 1.5 1.0 0.0 0.0 0.2 3.3 1.9 1.0 1.0 0.1 0.1 0.1 2.7 2.4 1.1 0.4 0.7 0.1 0.0 0.1 0.0 0.0 0.0 3.6 3.7 2.4 2.2 1.7 1.3 JUVENILE ARRESTS SUPPLEMENTAL TABLES GO TO GO TO TABLE OF CONTENTS
JUVENILE SUSTAINED PETITIONS
JUVENILE SUSTAINED PETITION RATES DECLINE; HISPANIC YOUTH
DESCRIPTION OF INDICATOR
This indicator reports number and percent of juvenile petitions that are sustained. After a juvenile arrest, a referral is typically made by the arresting officer to the Probation Department for further processing. The probation officer decides whether a referral is dismissed, the juvenile is placed on informal probation or a petition will be sought for a formal court hearing. When a petition is sustained by the court, the juvenile becomes a ward of the court. A ward is either allowed to go home under the supervision of a probation officer or ordered for detention in a juvenile institution.
Why is this important?
Sustained juvenile petitions are similar to an adult criminal conviction. They indicate where and what types of crimes are occurring among youth. Many agencies have a role to play in helping to meet California’s goal of rehabilitation for youth who have a sustained petition, including schools, social services agencies, and community-based organizations. Knowledge about sustained juvenile petitions can help provide strategic direction to prevention, early intervention, and rehabilitation efforts in Orange County.
Findings
• In 2016, there were 2,412 total juvenile petitions. Of these, 1,501 were sustained petitions (62%), a 43.5% decrease from 2013 (2,657).
• The rate of sustained petitions was 442 per 100,000 youth ages 10 to 17 years old in 2016, a 44.8% decrease from 2013 (800 per 100,000 youth), and a 57.8% decrease from 2003 (1,048 per 100,000 youth).
• Sustained petitions were highest among youth 15 to 17 years old who comprised 88.9% of total sustained petitions, followed by youth 12 to 14 years old (11.0%) and youth 11 years and younger (0.1%).
• When assessed by race and ethnicity, Hispanic youth (78.8%) had the most sustained petitions, followed by White (12.1%), Black (4.7%), Asian (2.2%), and Other (2.2%) youth in 2016.
• Across genders, the vast majority of sustained petitions were on juvenile males (85.3%), with juvenile females accounting for 14.7% of sustained petitions in 2016.
68
COMPRISE NEARLY 80% OF ALL PETITIONS.
2013 to 2016
Juvenile Sustained Petitions, Rate per 100,000, Youth 10 to 17 years old, by City, 2016
of
2013 2016 2015 2014
• 10-11 Years of Age • 12-14 Years
Age • 15-17 Years of Age
• 800.1 or Greater • 550.1 - 800.0 • 275.1 - 550.0 • 0.0 - 275.0 • Unincorporated Rate of Sustained Petitions q LA HABRA 538.6 w LA PALMA 121.1 e LAGUNA BEACH 265.4 r LAGUNA HILLS 253.5 t LAGUNA NIGUEL 268.3 y LAKE FOREST 273.7 u LOS ALAMITOS 0.0 i MISSION VIEJO 216.2 o NEWPORT BEACH 37.0 p ORANGE 780.6 [ PLACENTIA 377.3 ] RANCHO SANTA MARGARITA 28.6 Source: Orange County Probation, Research Division. B01001, 2012-2016 American Community Survey, 5 year Population Estimates 1 ALISO VIEJO 173.9 2 ANAHEIM 837.0 3 BREA 173.4 4 BUENA PARK 264.8 5 COSTA MESA 512.3 6 CYPRESS 117.0 7 DANA POINT 329.6 8 FOUNTAIN VALLEY 90.6 9 FULLERTON 411.1 0 GARDEN GROVE 497.5 - HUNTINGTON BEACH 126.5 = IRVINE 120.8 \ SAN CLEMENTE 86.6 a SAN JUAN CAPISTRANO 409.7 s SANTA ANA 929.9 d SEAL BEACH 0.0 f STANTON 673.3 g TUSTIN 368.9 h WESTMINSTER 226.5 j YORBA LINDA 153.2 Juvenile Sustained Petitions, Rate per 100,000 Youth 10 to 17 Years Old, Orange County, 2003, 2013 to 2016 Percent of Total Juvenile Sustained Petitions, Youth 10 to 17 Years Old, by Race/Ethnicity,
Source: Orange County Probation, Research Division Source: Orange County Probation, Research Division Source: Orange County Probation, Research Division 2003 // 80% 60 40 20 0 Hispanic White Black Asian & Pacific Islander Other
of Juvenile Arrests with a Sustained Petition, Youth 10
Old, by Age, 2016 SAFE HOMES & COMMUNITIES 88.9 11.0 0.1 1 t 7 r \ a o j [ 3 9 4 q w d h e g8 p 6 u 2 s 0 f 5 = i y ] 1,200 800 400 0 1,048 800 680 442 506 • 2013 • 2014 • 2015 • 2016 ORANGE COUNTY: 438.1 CALIFORNIA: N/A 75.0 16.4 3.7 2.7 2.2 77.8 14.1 3.4 3.2 1.5 79.3 78.8 11.5 4.0 3.6 1.6 12.1 4.7 2.2 2.2 JUVENILE SUSTAINED PETITIONS SUPPLEMENTAL TABLES GO TO GO TO TABLE OF CONTENTS
Percent
to 17 Years
GANG ACTIVITY AMONG YOUTH
DESCRIPTION OF INDICATOR
This indicator reports the number and rate of gang-related prosecutions of juveniles under the age of 18.1 Gang-related prosecutions involve charges related to active gang membership and/or committing a crime at the direction of a criminal street gang, with other gang members and/or for the benefit of a gang.2
Why is this important?
Data consistently shows that gang members are responsible for a disproportionately high number of crimes committed by youthful offenders. Compared to other delinquent youth, gang members are more extensively involved in serious and violent criminal behavior. Juvenile gang members commit serious and violent offenses at a rate several times higher than non-gang adolescents. Gang crime often involves offenses such as weapons possession, drug trafficking, carjacking, assault and murder.3 According to the 2015 National Gang Report, neighborhood street gangs continue to be a significant threat to local jurisdictions across the country.4 From a societal standpoint, the issue of juvenile gangs is one that requires swift action for both the well-being and safety of communities and the youth who get caught up in gang life. The Orange County District Attorney’s office seeks to reduce juvenile gang crime both by prosecuting those crimes and collaborating with other agencies to prevent juveniles from joining gangs via the Orange County Gang Reduction and Intervention Partnership (OC GRIP). OC GRIP focuses its work on reducing truancy and providing gang prevention and resiliency building curricula. As a result of OC GRIP, in 2016/17, 89% of students have decreased truancy and about 60% of students receiving its curricula reported increased well-being and resiliency.
Findings5
• In 2017, 4% of juvenile prosecutions were gang-related, down from 15% in 2008.
• Between 2008 and 2017, the total number of juvenile gang-related prosecutions in Orange County decreased 84%, from 859 in 2008 to 136 in 2017.
• Also, the number of unique juveniles prosecuted for gang-related offenses in Orange County dropped 82% from 625 in 2008 to 110 in 2017.
• The rate of juvenile gang-related prosecutions declined 81% from 144.4 per 100,000 youth aged 10 to 17 in 2008 to 26.9 per 100,000 in 2017.
• Older teens accounted for the majority of gangrelated activity, with teens ages 15-17 comprising 84% of the total number of juveniles in 2017 who were prosecuted for gang-related offenses.
• In 2017, Hispanic youth represented the highest percentage of juvenile gang-related prosecutions (91.8%), followed by Asian (3.6%), Black (2.7%), White (<1%) and Other (<1%) youth.
• The communities most impacted by juvenile gang-related crime in 2017 were Anaheim and Santa Ana, as 69% of the juvenile gang-related filings originated in these cities
70 1 Prior Conditions of Children reports tracked the number of gang members countywide, using data from local law enforcement agencies. This data is not available for 2017. Therefore, youth gang activity is reported using data from the Orange County District Attorney’s Office. 2 Gang-related prosecutions are defined as those prosecutions that involve charges of Penal Code sec. 186.22(a) and/or (b). 3 National Gang Intelligence Center, “National Gang Report.” 2015, page 12. 4 National Gang Intelligence Center, “National Gang Report.” 2015, page 9. 5 Prosecutorial data was sourced from OCDA records.
GANG-RELATED PROSECUTIONS DECLINE SIGNIFICANTLY OVER THE PAST DECADE.
Number of Juvenile Gang-Related Prosecutions and Number of Unique Juveniles Prosecuted for Gang-Related Offenses 10 to 17 Years Old, 2008 to 2017
Number of Unique Juveniles with Gang-Related Prosecutions and Rate Per 100,000 Youth 10 to 17 Years Old with Gang-Related Prosecutions, by Age, 2008 to 2017
Percent of Unique Juveniles with Gang-Related Prosecutions, by Race/Ethnicity, 10 to 17 Years Old
2008
Source: Orange County District Attorney’s Office • Hispanic • Asian •
• Black
Other/Unknown 0.5 0.9 4.5 3.6 2.2 2.7 1.1 0.9 2008 2017 91.7 91.8
and 2017
White
•
SAFE HOMES & COMMUNITIES
Source: Orange County District Attorney’s Office • Number of Gang Related Prosecutions • Number of Unique Juveniles Prosecuted 2008 2010 2013 697 411 2011 587 889 2014 468 313 2009 213 214 2012 491 2017 2016 2015 312 247 212 187 0 1,000 800 600 400 200 153 153 136 625 859 110 749
to
years old
old •
old Note: Rate is calculated using two data sources. The Orange County District Attorney’s Office provided gang-related prosecution data. The U.S. Census provided data for the total 10-17 year-old population in 2017. Source: Orange County District Attorney’s Office Source: U.S. Census American Community Survey 1-Year Estimates, Table B01001 800 200 600 150 400 100 0 0 200 50 2008 2011 2014 2009 2012 2015 2016 2010 2013 2017 122 503 94 493 74 417 58 353 41 272 34 178 35 152 24 25 18 128 92 129 144.4 140.8 113.4 72.4 94.8 49.3 43.9 36.4 36.5 26.9 # of Unique Juveniles with Gang-Related Prosecutions Rate per 100,000 GANG ACTIVITY AMONG YOUTH SUPPLEMENTAL TABLES GO TO GO TO TABLE OF CONTENTS
• 15
17
• 10 to 14 years
Rate per 100,000 10-17 years
INDEX OF SUPPLEMENTAL TABLES

GOOD HEALTH INDICATORS 77 Indicator: ACCESS TO HEALTH CARE 78 Number and Percent of Children Uninsured, by Race/Ethnicity, 2010 to 2016 78 Enrollment by Program, January 2008 to January 2018 78 Indicator: EARLY PRENATAL CARE 79 Total Number and Percent of Women who Received Early Prenatal Care in Orange County, California and the United States, by Year, 2007 to 2016 79 Total Number and Percent of Women who Received Early Prenatal Care, by Race/Ethnicity, 2007 to 2016 79 Indicator: BIRTHS AND LOW BIRTH WEIGHT ........ 81 Total Number and Percent of Births, by City and Community, 2007 to 2016 81 Number and Percent of Infants, by Birth Weight and Race and Ethnicity, 2007 to 2016 83 Low Birth Weight and Very Low Birth Weight by Maternal Age, 2016 84 Secondary Indicator: INFANTS BORN WITH ABNORMAL CONDITIONS 85 Number and Rate Per 1,000 Live Births of Infants Born with Selected Abnormal Conditions, by Race/Ethnicity, 2007 to 2016 85 Number of Infants Born, by Selected Abnormal Conditions, 2007-2016 85 Indicator: PRETERM BIRTHS 86 Percent of Preterm Births, by Mother’s Age, 2007 to 2016 86 Percent Preterm (17-36 Completed Weeks of Gestation), 2007 to 2016 86 Percent Preterm, by Maternal Race/Ethnicity, 2007 to 2016 86 Percent Preterm for Orange County, California and United States, 2007 to 2016 87 Percent Late and Very Late Preterm for All and Singleton Births, Orange County, 2007 to 2016 87 Indicator: TERM BIRTHS 88 Total Number and Percent of Term Infant Births by Race and Ethnicity, 2016 88 Total Number and Percent of Total Term Infant Births by Mother’s Age, 2016 88 Total Number and Percent of Term Infant Births by Birth Type, 2016 89 Total Number and Percent of Term Infant Births by Delivery Type, 2016 89 Secondary Indicator: SUBSTANCE-EXPOSED INFANTS .. 90 Number of Orange County Infants Taken into Protective Custody (or petition for dependency filed) as a Result of Testing Positive for Substance Exposure at Birth, 2007/08 to 2016/17 90 Indicator: INFANT MORTALITY RATE 91 Percent of Infant Deaths, by Cause, 2007 to 2016 91 Number and Rate per 1,000 Live Births Suffering Infant Mortality, by Race and Ethnicity, 2007 to 2016 92 Three Year Average Rate per 1,000 Live Births Suffering Infant Mortality, by Race and Ethnicity, 2008-2016 92 Indicator: BREASTFEEDING ...................... 93 Hospital Discharge Breastfeeding Percentages in Orange County and California, 2012-2017 93 Breastfeeding Percentages in Orange County Hospitals and California, 2012-2016 94 Indicator: IMMUNIZATIONS 95 Percent of Adequately Immunized Children Enrolling in School Between 2008 through 2017 in Orange County and California 95 Secondary Indicator: DEVELOPMENTAL DISABLITIES .. 96 Children Receiving Services for Development Disabilities, 2008 to 2017 96 Total Number of Children Under 18 Years of Age Receiving Services for Developmental Disabilities, by Race/Ethnicity, 2008 to 2017 97 Total Number of Children by Age Groups and Number and Percent of Children with a Diagnosis of Autism Served, by the Regional Center of Orange County (RCOC), July 2013 to July 2018 97 Indicator: PHYSICAL ACTIVITY AND NUTRITION 98 Percent of 5th, 7th and 9th Grade Students in Healthy Fitness Zone (HFZ) for Aerobic Capacity, 2011/12 to 2016/17 98 Percent of Students in Healthy Fitness Zone for Aerobic Capacity, by Grade and Race/Ethnicity, 2011/12 to 2016/17 98 Percent of 5th Grade Students Classified as Needs Improvement Based on Health Risk for Aerobic Capacity, by Race/Ethnicity, 2011/12 to 2016/17 99 Indicator: OBESITY 99 Percent
Body Composition 2011/12 to 2016/17 99 Percent
100 Percent of 5th Grade Students Classified
Needs Improvement Based on Health Risk for Body Composition, by Race/ and Ethnicity, 2011/12 to 2016/17 101 Indicator: TEEN BIRTHS 102 Birth Rate per 1,000 Females Aged 15-19 Years in Orange County, California and United States, 2007 to 2016 102 Percent of Teen Births (19 and Under) of Total Births in Orange County, 2007 to 2016 102
at http://ochealthinfo.com/phs/about/family/occp/report
of 5th, 7th and 9th Grade Students in Healthy Fitness Zone (HFZ) for
of Students Meeting Healthy Fitness Zone (HFZ) Standards for Body Composition, by Grade and Race/Ethnicity, 2011/12 to 2016/17
as
Supplemental tables are available online
74 Number and Birth Rates, by Age of Mother (19 Years and Under) per 1,000 Females, 2007 to 2016 102 Birth Rate per 1,000 Female Teen Population 15-19 Years of Age, by Race and Ethnicity, 2007 to 2016 102 Percent of Population, Total Births and Births to Teens (19 and Under), by Race and Ethnicity, 2007 to 2016 103 Number of Teen Births and Teen Birth Rates* per 1,000 females 15-19 years of age, by Age and Race/Ethnicity, 2007 to 2016 104 Number of Live Births, by Mothers Age 15 to 19 and Birth Rate per 1,000 Females, by City of Residence, 2012 to 2016 105 Secondary Indicator: SEXUALLY TRANSMITTED DISEASES 106 Number and STD Case Rates Per 100,000 Youth 10-17 Years Old, by Type of Disease, 2008-2017 106 Number of STD’s Among Youth 10-17 Years of Age, by Gender and Type of Disease, 2008-2017 107 Number and STD Case Rates* per 100,000 Youth, By Age Group and Type of Disease, 2008-2017 108 Indicator: BEHAVIORAL HEALTH 109 Number of Children and Young Adults through Age 25 Served by Children and Youth Behavioral Health, 2007/08 to 2016/17 109 Number of Clients Served by Children and Youth Behavioral Health, by Race/Ethnicity, 2008/09 to 2016/17 109 Number of Services, by Type of Outpatient Program, 2007/08 to 2016/17 109 Number of Bed Days, by Type of Inpatient Placements, 2007/08 to 2016/17 109 Secondary Indicator: SUBSTANCE ABUSE SERVICES .. 110 Number of Children and Young Adults through Age 25 Served by Children and Youth Behavioral Health, 2007/08 to 2016/17 110 Substance Abuse Services: Number and Percent, by Discharge Status, 2007/08 to 2016/17 111 Number and Percent of Adolescents Receiving Substance Abuse Services, by Drug of Choice and Age, 2007/08 to 2016/17 112 Number and Percent of Adolescents Receiving Treatment Services, by Race/Ethnicity and Gender, 2007/08 to 2016/17 113 Number and Percent of Referrals to Substance Abuse Treatment, by Source, 2007/08 to 2016/17 114 Secondary Indicator: CHILDHOOD LEAD POISONING 115 Number of Individual Children Ages 0-20 Years with Elevated Blood Lead Levels (4.5mcg/dL or higher), 2007-2016 115 ECONOMIC WELL-BEING INDICATORS 116 Indicator: CHILD POVERTY 117 Percent of Children Under 18 Years Old, Living in Poverty, and Families Living in Poverty, Orange County and California, 2007 to 2016 117 Number and Percent of Students Eligible to Receive Free and Reduced Price Lunch, By District, 2017/18 118 Indicator: CALIFORNIA WORK OPPORTUNITY & RESPONSIBILITY TO KIDS (CALWORKS) ......... 119 Number of Children Receiving Financial Assistance Countywide, 2007/08 to 2016/17 119 CalWORKs Recipients: Children by Age and City, January 2018 120 Indicator: HOMELESS STUDENTS 122 Homeless Children and Youth, by School District, 2007/08 TO 2016/17 122 Primary Nighttime Residency of Homeless Students, 2007/08 to 2016/17 123 Homeless High School Students 9th to 12th Grade, 2016/17 123 Indicator: SUPPLEMENTAL NUTRITION PROGRAMS 124 Number of Participants Served by the WIC Program, 2007/08 to 2016/17 124 CalFresh Recipients, 2007/08 to 2016/17 124 CalFresh Recipients, by Age and City, January 2018 125 Indicator: CHILD SUPPORT 126 Number of Child Support Cases, Net and Per Case Collection, 2008/09 to 2017/18 126 Child Support Collections, 2008/09 to 2017/18 126 Child Support Collections Percent of Current Support Distributed (CSD), 2008/09 to 2017/18 126 Secondary Indicator: COST OF EARLY CARE AND EDUCATION .............................. 127 County-Wide Average Weekly Licensed Family Child Care Homes and Child Care Centers Costs*, 2008/09 to 2017/18 127 County-Wide Average Weekly Orange County Family Child Care Homes and Child Care Centers Costs*, by Region, 2017/18 128 Birth to 13 Years of Age Child Care Centers (CCTR) Priorities Report, by Board of Supervisor (BOS) District, 2016 129 Subsidized Part-Day Eligibility, 2016 130 EDUCATIONAL ACHIEVEMENT INDICATORS 131 Secondary Indicator: EARLY CARE AND EDUCATION 132 Total Licensed Early Care and Education Capacity, Family Child Care Homes (FCCH) and Child Care Centers, 2008/09 to 2017/18 132 Requests for Child Care Referrals, Reason, and Type of Child Care Needed, 2017/18 132 Secondary Indicator: SCHOOL ENROLLMENT 133 Total Public School K-12 Enrollment by District, 2008/09 to 2017/18 133 Number and Percent of Total Public School K-12 Enrollment, by Race/Ethnicity, 2008/09 to 2017/18 134 Secondary Indicator: ENGLISH LEARNERS ........ 135 Number and Percent of English Language Learners, 2008/09 to 2017/18 135 English Learners Number and Percent, by District, 2008/09 to 2017/18 136
Secondary Indicator: AVERAGE DOLLAR EXPENDITURE PER PUPIL ...................... 138 Annual Expenditure Per Pupil (K-12), by District, 2007/08 to 2016/17 138 Average Expenditure Per Pupil, by District Level for Orange County and California, 2007/8 to 2016/17 139 Indicator: KINGERGARTEN READINESS 140 Number and Percent of Children Developmentally Vulnerable on One or More Areas, by Community, 2018 141 Percent of Children Developmentally Vulnerable or At Risk on One or More Areas and On Track on all Areas, by Community, 2018 141 Percent of Children Developmentally Vulnerable or At Risk on One or More Areas and On Track on all Areas, by Student Characteristic, 2018 141 Indicator: ACADEMIC PERFORMANCE, THIRD GRADE ENGLISH LANGUAGE ARTS AND MATHEMATICS 144 Number and Percent of 10th Grade Students Who Passed English Language Arts and Math, by School District, March 2015 144 Indicator: HIGH SCHOOL DROPOUT RATES ........ 145 Number and Percent of Grade 9-12 Cohort Dropouts, by District, 2009/10 to 2016/17 145 Number and Percent of Grade 9-12 Cohort Dropouts, by Race/Ethnicity, 2009/10 to 2016/17 146 Secondary Indicator: HIGH SCHOOL GRADUATION 147 Number and Percent of Grade 9-12 Cohort Graduates, by District, 2010/11 to 2016/17 147 Percent of Graduates, by Race/Ethnicity, 2010/11 to 2016/17 148 Secondary Indicator: SAT REASONING TEST 148 Average Combined SAT Reasoning Test Scores* for Orange County, California and the United States, 2007/08 to 2015/16 148 Percent of High school Students Meeting Benchmarks for ELA and Math for Orange County, California and the United States, 2016/17 148 Comparison of Lowest and Highest FRL with Percent of Students Meeting Benchmarks by District 2016/17 149 Percent of High School Students Meeting Benchmarks for ELA and Math, by District, for Orange County and California, 2016/17 149 Indicator: COLLEGE READINESS 150 Number of High School Graduates with UC/CSU Required Courses, by School District, 2007/08 to 2016/17 150 Number and Percent of High School Graduates with UC/CSU Required Courses, by Race/ Ethnicity, 2007/08 to 2016/17 151 Secondary Indicator: SPECIAL EDUCATION 152 Number of K-12 Students Receiving Special Education Services, by Type of Disability, for Orange County and California, 2008 to 2017 152 Number of Students Receiving Special Education Services, by Age and Type of Disability, 2008 to 2017 153
HOMES AND COMMUNITIES INDICATORS 155 Secondary Indicator: CHILD MORTALITY 156 Overall Death Rate Per 100,000 Children and Youth 1 to 19 Years of Age, 2007-2016 156 Number of Deaths and Rate Per 100,000 Population for Persons 0 to 19 Years of Age from Unintentional Injury Homicide and Suicide, 2007-2016 156 Death Rate per 100,000 Population for Persons Age 0-19 Years from Unintentional Injury, Homicide and Suicide, by Age Group and Gender, 2007-2016 157 Death Rate Per 100,000 Persons 0-19 Years of Age, by Race/Ethnicity and Cause, 2007-2016 158 Secondary Indicator: UNINTENTIONAL INJURY DEATHS 159 Number and Rate per 100,000 Persons of Unintentional Injury Deaths, by Age Group, 2007-2016 159 Number and Rate per 100,000 Persons 0 to 19 Years of Age for Unintentional Injury Deaths, by Gender, 2007-2016 159 Number and Rate per 100,000 Persons 0 to 19 Years of Age for Unintentional Injury Deaths, by Cause, 2007-2016 160 Number and Rate per 100,000 Persons 0 to 19 Years of Age for Unintentional Injury Deaths, by Race/Ethnicity, 2007-2016 160 Secondary Indicator: HOMICIDE DEATHS/LEGAL INTERVENTIONS 161 Number and Rate per 100,000 Persons of Homicide Deaths, by Age Group, 2007-2016 161 Number and Rate per 100,000 Persons 0 to 19 Years of Age for Homicide Deaths, by Gender, 2007-2016 161 Number and Rate per 100,000 Persons 0 to 19 Years of Age for Homicide Deaths, by Race/Ethnicity, 2007-2016 162 Percent of Homicides of Total Deaths from Unintentional Injury, Homicide and Suicide for Persons 0 to 19 Years of Age, 2007-2016 162 Homicides Death Rate Per 100,000 Persons 0 to 19 Years of Age in Orange County and California, 2007-2016 162 Secondary Indicator: SUICIDE DEATHS 163 Number and Rate per 100,000 Persons of Suicide Deaths, by Age Group, 2007-2016 163 Number and Rate per 100,000 Persons 0 to 19 Years of Age for Suicide Deaths, by Gender, 2007-2016 163 Number and Rate per 100,000 Persons 0 to 19 Years of Age for Suicide Deaths, by Race and Ethnicity, 2007-2016 164 Total Number and Rate per 100,000 Population of Leading Causes of Death, by Age Group, 2007-2016 164 Total Number and Rate per 100,000 Population of Leading Causes of Death, by Age Group, 2007-2016 (continued) 165 Secondary Indicator: CHILD AND YOUTH DEATHS .. 170 Manner of Death, Children Less than 18 Years of Age, 2017 170
SAFE
76 Secondary Indicator: MOTOR VEHICLE ACCIDENTS .. 171 Number of Victims 0 to 19 Years of Age Killed or Injured as a Result of Motor Vehicle Accidents*, by Age Group, 2007-2016 171 Secondary Indicator: CHILDREN AND GUNS 172 Number of Gun-Related Incidents with Children 0 to 19 Years of Age, by Type of Incident, 2007-2016 172 Indicator: SUBSTANTIATED CHILD ABUSE ALLEGATIONS 173 Counts of Children with One or More Reports, by Age and Disposition, 2017 173 Substantiated Child Abuse Allegations, by Percent for Children Under 18 Years, by Type of Abuse, 2008-2017 173 Total Number of Children with One or More Child Abuse Allegations and Substantiated Allegations, 2008-2017 174 Secondary Indicator: CHILD ABUSE –DEPENDENCY PETITIONS 176 Number and Percent of Dependency Petitions Filed, 2007/08 to 2016/17 176 Percent of “Recurrence of Maltreatment” in 12- month Time Period for children with a Substantiated Child Abuse Allegation Orange County and California, 2006/07 to 2015/16 176 Secondary Indicator: DEPENDENTS OF THE COURT 177 Monthly Number of Dependents of the Court by End of Month Cases, 2007/08 to 2016/17 177 Percent of Children by Race/Ethnicity in Out-of-Home Care, April 2009 to April 2018 178 Wraparound Referrals by Agency and Year, 2007/08 to 2016/17 178 Average Monthly Number of Children in Out-of-Home Care, 2007/08 to 2016/17 178 Secondary Indicator: FOSTER CARE 179 Number and Percent of Placement Type, April 2009-April 2018 179 Children and Family Services – Out-Of-Home Placements by Age and City of Placement, April 2018 180 Number of Placement Moves: Number of Placement Moves Per Day for Children in Foster Care in a 12 Month Period, 2007/08 to 2016/17 182 Indicator: CHILD WELFARE 182 Percent of Children Reaching Reunification and Guardianship within 12 Months and Reentry Following Reunification and Guardianship, Orange County and California, 2006/07 to 2015/16 182 Secondary Indicator: ADOPTIONS 183 Percent with Finalized Adoptions within 12 and 24 Months, Orange County and California, 2005/06 to 2014/15 183 Secondary Indicator: EMANCIPATION SERVICES ... 184 Youth Who Received Independent Living Program Services, 2000/01 to 2007/08 184 Youth Who Received Independent Living Services, 2009/10 to 2014/15 185 Indicator: JUVENILE ARRESTS 186 Orange County Juvenile Arrests 10 to 17 Years Old, 2007-2016 186 Juvenile Arrests by City Youth 10 to 17 Years Old, 2007 to 2016 187 Number of Juvenile Arrests and Rates Per 100,000 Youth Ages 10 to 17, Orange County and California, 2007 to 2016 188 Secondary Indicator: REFERRALS TO PROBATION ... 189 Total Probation Referrals with Final Case Disposition, 2007 to 2016 189 Probation Referrals, by City of Residence*, 2007 to 2016 191 Total Felony Referrals Broken Down by Offense at Time of Arrest, 2007 to 2016 192 Total Number and Percent of Probation Referrals, by Final Case Disposition, 2007 to 2016 194 Total Number and Percent of Probation Referrals, by Race and Ethnicity, 2007 to 2016 195 Total Number and Rate per 100,000 of Probation Referrals Incarcerated in County Institutions and the Division of Juvenile Justice California Department of Corrections & Rehabilitation, 2007 to 2016 195 Indicator: JUVENILE SUSTAINED PETITIONS ...... 196 Juvenile Sustained Petitions by City Referred Youth 10-17 Years Old, 2016 196 Juvenile Sustained Petitions Youth 10 to 17 Years Old, by Sex, 2016 197 Juvenile Sustained Petitions Youth 10 to 17 Years Old, by Age, 2016 197 Juvenile Sustained Petitions Youth 10 to 17 Years Old, by Race and Ethnicity, 2016 197 Indicator: GANG ACTIVITY AMONG YOUTH 198 Gang Related Prosecutions by Crime Type, 2008 to 2017 198 Number of Gang Related Prosecutions, Total and by Unique Individuals, and Percent by Repeat Offenders, 2008 to 2017 198 Number and Percent of Gang Related Prosecutions, by Age, 2008 to 2017 199 Number and Percent of Gang Related Prosecutions, by Race and Ethnicity, 2008 to 2017 199
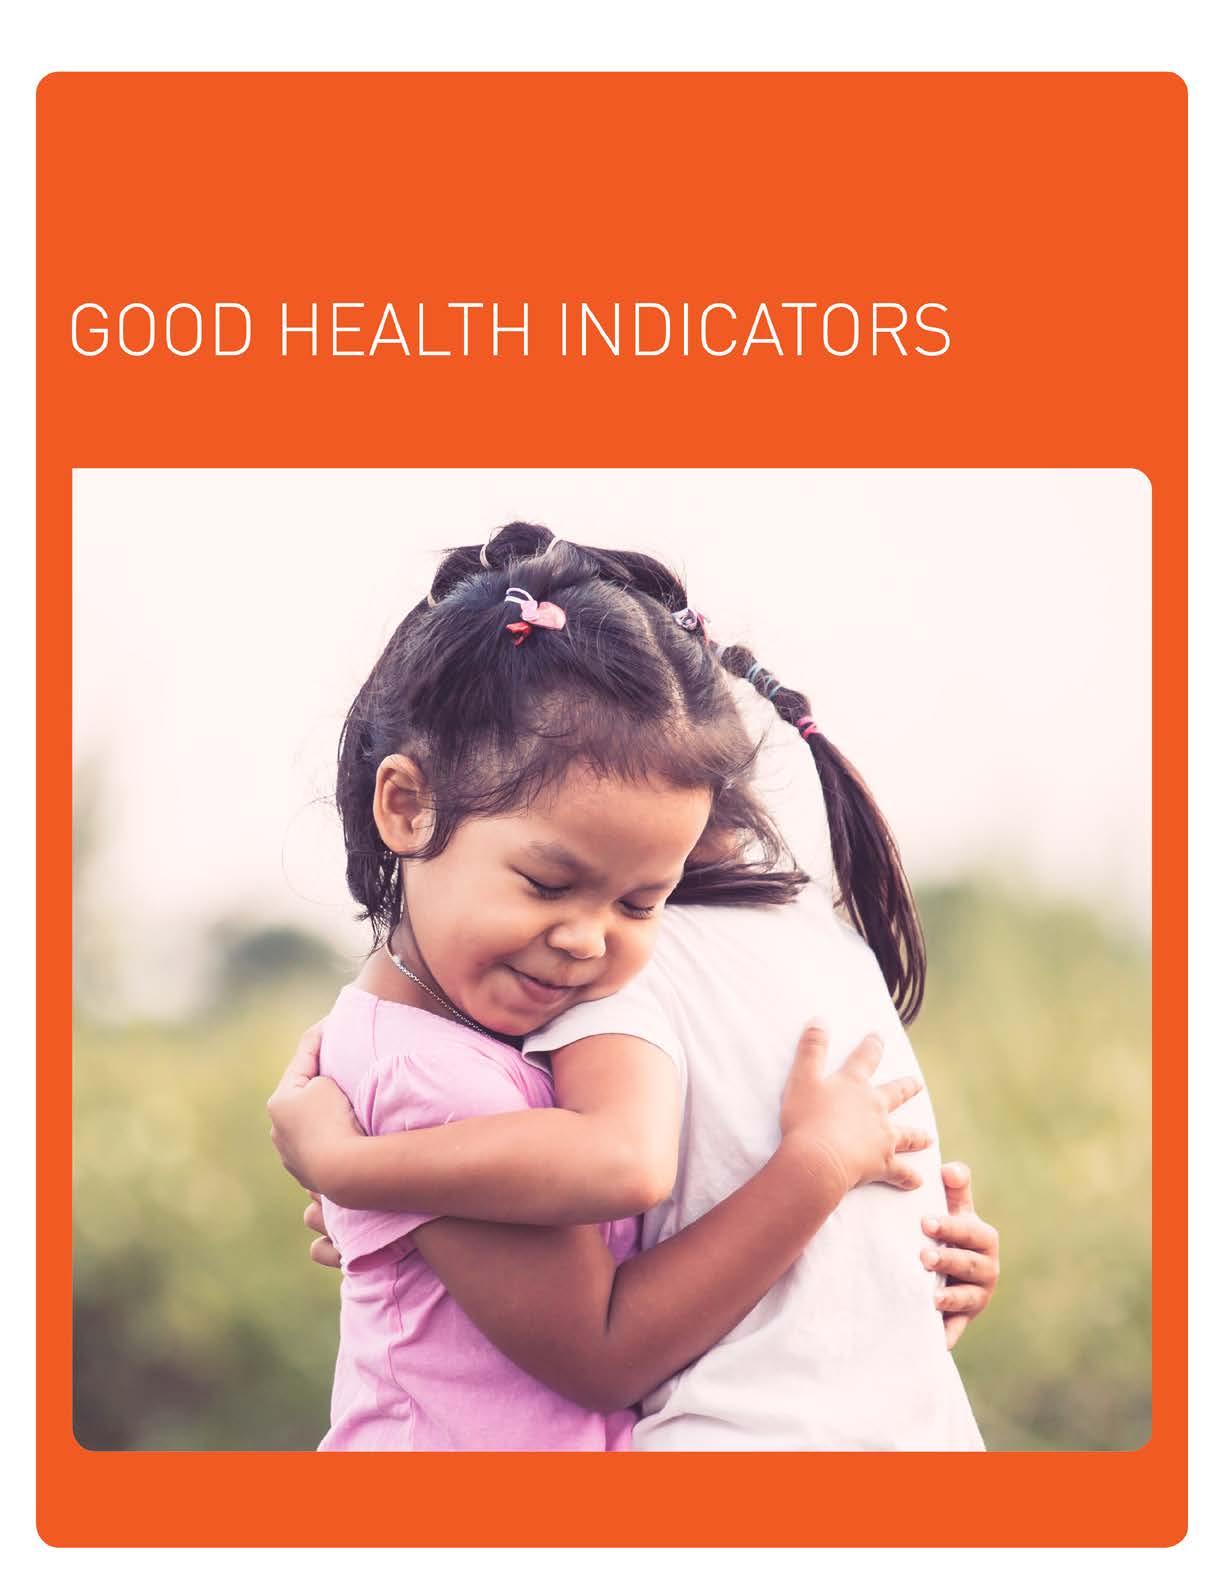
Supplemental Tables: Good Health
Indicator: ACCESS TO HEALTH CARE
*Number shown is for previous month (data not available for January).
**Data not available.
a. Data from March 2013
b Data from September 2014
c Data from May 2016
d. Data from January 2017
e. Data from January 2017. Note: Membership for KP Child Health Program (CHP) as of May 2017 is 1,747. Note that p roject KP CHP membership will continue to decline monthly as the vast majority of our remaining CHP members appear to be eligible for Medi-Cal under SB75 (i.e., full scope Medi-Cal for low income children under age 19 regardless of immigration status).
f. Data from January 2018.
g. Data from January 2018.
Source: Orange County Health Care Agency
Source: Kaiser Permanente
xx 5
Number and Percent of Children Uninsured, by Race/Ethnicity, 2010 to 2016 2010 2011 2012 2013 2014 2015 2016 No. % No. % No. % No. % No. % No. % No. % Hispanic 51,600 15.0 40,124 11.5 35,600 10.2 14,677 4.3 35,571 10.3 23,148 6.8 10,602 3.2 Asian 7,831 6.7 7,300 6.3 8,005 6.8 3,522 3.0 8,098 7.1 4,122 3.7 2,747 2.2 White 10,951 4.7 11,437 5.0 5,519 2.5 5,512 2.6 10,240 4.7 6,483 3.0 3,962 1.9 Other 1,114 2.6 1,584 1.8 1,760 4.0 736 1.5 1,429 3.0 2,341 4.5 815 1.8 Total 71,496 60,445 50,884 24,447 55,338 36,094 18,126 Source: ACS (1 YR estimates, 201 2 - 2016) Other includes: Black/African American, AIAN, 2+ races, and Other races Enrollment by Program, January 2008 to January 2018 Medi -Cal Under 18 Healthy Families California Kids Kaiser Permanente Healthy Kids Total 2008 179,746 78,407 4,094 6,893 881 270,021 2009 188,175 84,285 3,628 7,659 987 284,734 2010 205,834 82,831 2,752 8,252* 1,046 300,715 2011 216,528 81,752 1,590 6,716* 116 306,702 2012 219,418 81,928 798 6,405* 0 308,549 2013 255,695 44,515 650 7,523a ** 308,383 2014 307,879 142 555 6,752b ** 315,328 2015 340,419 ** ** ** ** 340,419 2016 342,361 ** ** 6,078c ** 348,439 2017 333,252d ** ** 3,962e ** 337,214 2018 320,861f ** ** 1,270g ** 322,131
78
Supplemental Tables: Good Health
Indicator: EARLY PRENATAL CARE
N/A: Not Available
*CA data were obtained from California Department of Health, Vital Statistics Query System.
** Source for U.S. data: Centers for Disease Control, National Center for Health Statistics. 2012 data are based on 38 reporting areas (States and Te rritories) that used the revised birth certificate.
***Data are based on 27 reporting areas (States and Territories) that used the revised birth certificate.
Source: Orange County Health Care Agency
Total Number and Percent of Women who Received Early Prenatal Care, by Race/Ethnicity, 2007 to 2016
6
Total Number and Percent of Women w ho Received Early Prenatal Care in Orange County, California and the United States, by Year, 2007 to 2016 PRENATAL CARE 2007 2008 2009 2010 2011 No. % No. % No. % No. % No. % Orange County 38,727 88.0 37,267 87.8 35,650 88.2 34,018 89.0 33,780 88.7 California* 459,188 81.1 445,108 80.7 428,449 81.3 416,759 81.7 410,213 81.7 United States** 1,539,201 70.8 1,824,340 71.0*** 1,862,867 72.1 2,123,146 73.1 2,317,653 73.7 PRENATAL CARE 2012 2013 2014 2015 2016 No. % No. % No. % No. % No. % Orange County 33,814 88.6 32,885 88.3 33,245 86.1 32,038 85.2 32,188 84.4 California* 412,679 81.9 406,035 82.1 418,279 83.2 409,489 84.6 N/A N/A United States** 2,444,021 74.1 2,520,779 74.2 2,824,607 76.7 2,854,065 77.0 3,042,271 77.1
TRIMESTER Total % White % Black % Hispanic % Asian % Other* % 2007 First Second Third No Care Unknown Care TOTAL 38,727 4,269 684 94 252 44,026 88.0 9.7 1.6 0.2 0.6 100.0 11,615 765 116 26 96 12,618 92.1 6.1 0.9 0.2 0.8 100.0 389 48 14 3 2 456 85.3 10.5 3.1 0.7 0.4 100.0 19,431 2,793 439 55 127 22,845 85.1 12.2 1.9 0.2 0.6 100.0 6,614 567 84 5 24 7,294 90.7 7.8 1.2 0.1 0.3 100.0 678 96 31 6 2 813 83.4 11.8 3.8 0.7 0.2 100.0 2008 First Second Third No Care Unknown Care TOTAL 37,267 4,195 649 94 251 42,456 87.8 9.9 1.5 0.2 0.6 100.0 11,225 773 126 30 77 12,231 91.8 6.3 1.0 0.2 0.6 100.0 375 59 13 3 9 459 81.7 12.9 2.8 0.7 2.0 100.0 18,735 2,702 398 49 119 22,003 85.1 12.3 1.8 0.2 0.5 100.0 6,299 551 88 7 42 6,987 90.2 7.9 1.3 0.1 0.6 100.0 633 110 24 5 4 776 81.6 14.2 3.1 0.6 0.5 100.0 2009 First Second Third No Care Unknown Care TOTAL 35,650 3,719 683 99 280 40,431 88.2 9.2 1.7 0.2 0.7 100.0 11,091 759 153 16 88 12,107 91.6 6.3 1.3 0.1 0.7 100.0 358 55 14 7 9 443 80.8 12.4 3.2 1.6 2.0 100.0 17,456 2,282 402 63 120 20,323 85.9 11.2 2.0 0.3 0.6 100.0 6,103 530 93 7 55 6,788 89.9 7.8 1.4 0.1 0.8 100.0 642 93 21 6 8 770 83.4 12.1 2.7 0.8 1.0 100.0 2010 First Second Third No Care Unknown Care TOTAL 34,018 3,248 592 114 265 38,237 89.0 8.5 1.5 0.3 0.7 100.0 10,541 622 114 47 84 11,408 92.4 5.5 1.0 0.4 0.7 100.0 357 36 13 3 7 416 85.8 8.7 3.1 0.7 1.7 100.0 16,356 2,039 370 55 110 18,930 86.4 10.8 2.0 0.3 0.6 100.0 5,760 405 58 1 45 6,269 91.9 6.5 0.9 0.0 0.7 100.0 649 84 17 5 7 762 85.2 11.0 2.2 0.7 0.9 100.0 79
Supplemental Tables: Good Health
Number and Percent of Women w ho Received Early Prenatal Care, by Race/Ethnicity, 2006 to 2016 (Continued)
Percentages based on fewer than 5 events are statistically unreliable. Due to rounding, percentages may not add to 100.
*Other includes American Indian/Alaskan Native ( AIAN), Pacific Islander, More than One Race, and Other. Mothers of unknown race are not included in this table.
Source: Orange County Health Care Agency.
xx 7
Total
TRIMESTER Total % White % Black % Hispanic % Asian % Other* % 2011 First Second Third No Care Unknown Care TOTAL 33,780 3,253 600 90 377 38,100 88.7 8.5 1.6 0.2 1.0 100.0 10,623 626 123 25 90 11,487 92.5 5.4 1.1 0.2 0.8 100.0 374 57 13 0 8 452 82.7 12.6 2.9 0.0 1.8 100.0 15,815 1,950 344 54 194 18,357 86.2 10.6 1.9 0.3 1.1 100.0 5,924 470 81 5 54 6,534 90.7 7.2 1.2 0.1 0.8 100.0 664 88 18 4 10 784 84.7 11.2 2.3 0.5 1.3 100.0 2012 First Second Third No Care Unknown Care TOTAL 33,814 3,152 574 93 553 38,186 88.6 8.3 1.5 0.2 1.4 100.0 10,369 559 113 36 109 11,186 92.7 5.0 1.0 0.3 1.0 100.0 369 51 13 3 9 445 82.9 11.5 2.9 0.7 2.0 100.0 15,271 1,899 317 43 208 17,738 86.1 10.7 1.8 0.2 1.2 100.0 6,647 506 94 8 173 7,428 89.5 6.8 1.3 0.1 2.3 100.0 646 80 17 2 19 764 84.6 10.5 2.2 0.3 2.2 100.0 2013 First Second Third No Care Unknown Care TOTAL 32,885 3,063 696 86 526 37,256 88.3 8.2 1.9 0.2 1.4 100.0 10,662 607 139 34 121 11,563 92.2 5.2 1.2 0.3 1.0 100.0 370 54 12 1 7 444 83.3 12.2 2.7 0.2 1.6 100.0 14,639 1,780 367 46 264 17,096 85.6 10.4 2.1 0.3 1.5 100.0 6,538 537 157 3 122 7,357 88.9 7.3 2.1 0.0 1.7 100.0 660 82 20 2 7 771 85.6 10.6 2.6 0.3 0.9 100.0 2014 First Second Third No Care Unknown Care TOTAL 33,245 3,356 1,126 103 780 38,610 86.1 8.7 2.9 0.3 2 100 10,840 670 128 38 161 11,836 91.6 5.7 1.1 0.3 1.4 100 395 58 15 2 8 478 82.6 12.1 3.1 0.4 1.7 100 14,002 1,711 332 57 364 16,466 85 10.4 2 0.3 2.2 100 7,411 792 613 5 212 9,033 82 8.8 6.8 0.1 2.3 100 597 125 38 2 35 797 74.9 15.7 4.8 0.3 4.4 100 2015 First Second Third No Care Unknown Care TOTAL 32,038 3,273 1,261 106 943 37,621 85.2 8.7 3.4 0.3 2.5 100.0 10,557 657 131 43 204 11,592 91.1 5.7 1.1 0.4 1.8 100.0 385 60 11 2 15 473 81.4 12.7 2.3 0.4 3.2 100.0 13,681 1,715 313 56 321 16,086 85.0 10.7 1.9 0.3 2.0 100.0 6,817 728 775 5 361 8,686 78.5 8.4 8.9 0.1 4.2 100.0 598 113 31 0 42 784 76.3 14.4 4.0 0.0 5.4 100.0 2016 First Second Third No Care Unknown Care TOTAL 32,188 3,348 1,528 120 937 38,121 84.4 8.8 4 0.3 2.5 100 10,971 733 161 48 281 12,194 90 6 1.3 0.4 2.3 100 383 68 8 5 15 479 80 14.2 1.7 1 3.1 100 13,186 1,627 305 59 382 15,559 84.7 10.5 2 0.4 2.5 100 7,502 883 1,044 8 256 9,693 77.4 9.1 10.8 0.1 2.6 100 146 37 10 0 3 196 74.5 18.9 5.1 0 1.5 100
80
Supplemental Tables: Good Health
Indicator: BIRTHS AND LOW BIRTH WEIGHT
8
Total Number and Percent of Births, by City and Community, 2007 to 2016 City 2007 2008 2009 2010 2011 Total % Total % Total % Total % Total % Aliso Viejo 739 1.7 771 1.8 765 1.9 715 1.9 731 1.9 Anaheim 6,294 14.3 6,230 14.7 5,912 14.6 5,493 14.4 5,478 14.4 Brea 483 1.1 441 1.0 388 1.0 451 1.2 436 1.1 Buena Park 1,220 2.8 1,145 2.7 1,041 2.6 1,048 2.7 1,046 2.7 Costa Mesa 1,695 3.8 1,644 3.9 1,614 4.0 1,557 4.1 1,563 4.1 Coto De Caza 59 0.1 67 0.2 44 0.1 42 0.1 42 0.1 Cypress 445 1.0 449 1.1 404 1.0 429 1.1 416 1.1 Dana Point/Capistrano Beach 320 0.7 324 0.8 367 0.9 321 0.8 328 0.9 Foothill Ranch/El Toro 156 0.4 159 0.4 140 0.3 136 0.4 122 0.3 Fountain Valley 533 1.2 485 1.1 526 1.3 431 1.1 466 1.2 Fullerton 1,884 4.3 1,823 4.3 1,678 4.2 1,517 4.0 1,591 4.2 Garden Grove 2,891 6.6 2,623 6.2 2,461 6.1 2,340 6.1 2,189 5.7 Huntington Beach 2,040 4.6 1,990 4.7 1,962 4.9 1,954 5.1 1,965 5.2 Irvine 2,301 5.2 2,486 5.9 2,389 5.9 2,490 6.5 2,577 6.8 La Habra 1,001 2.3 962 2.3 927 2.3 867 2.3 839 2.2 La Palma 164 0.4 137 0.3 126 0.3 131 0.3 108 0.3 Ladera Ranch 572 1.3 569 1.3 480 1.2 473 1.2 411 1.1 Laguna Beach 155 0.4 162 0.4 169 0.4 164 0.4 137 0.4 Laguna Hills 366 0.8 386 0.9 329 0.8 298 0.8 323 0.8 Laguna Niguel 641 1.5 612 1.4 641 1.6 589 1.5 606 1.6 Laguna Woods 4 0.0 4 0.0 4 0.0 5 0.0 6 0.0 Lake Forest 791 1.8 798 1.9 747 1.8 674 1.8 722 1.9 Los Alamitos 172 0.4 137 0.3 165 0.4 152 0.4 160 0.4 Midway City 119 0.3 127 0.3 133 0.3 98 0.3 102 0.3 Mission Viejo 988 2.2 902 2.1 877 2.2 859 2.2 848 2.2 Newport Beach 499 1.1 450 1.1 424 1.0 469 1.2 449 1.2 Newport Coast 117 0.3 93 0.2 114 0.3 82 0.2 110 0.3 Orange 2,124 4.8 2,055 4.8 1,960 4.8 1,895 5.0 1,925 5.1 Placentia 731 1.7 699 1.6 673 1.7 635 1.7 614 1.6 Portola Hills 24 0.1 24 0.1 0 0.0 0 0.0 10 0.0 Rancho Santa Margarita 656 1.5 595 1.4 600 1.5 573 1.5 522 1.4 San Clemente 933 2.1 930 2.2 1,003 2.5 993 2.6 886 2.3 San Juan Capistrano 552 1.3 497 1.2 447 1.1 454 1.2 389 1.0 Santa Ana 7,711 17.5 7,424 17.5 6,787 16.8 6,235 16.3 6,041 15.9 Seal Beach 106 0.2 155 0.4 134 0.3 124 0.3 153 0.4 Stanton 568 1.3 562 1.3 486 1.2 480 1.3 448 1.2 Trabuco Canyon 159 0.4 172 0.4 173 0.4 184 0.5 132 0.3 Tustin 1,364 3.1 1,212 2.9 1,295 3.2 1,198 3.1 1,278 3.4 Villa Park 22 0.0 27 0.1 26 0.1 28 0.1 44 0.1 Westminster 1,354 3.1 1,146 2.7 1,131 2.8 959 2.5 975 2.6 Yorba Linda 636 1.4 597 1.4 644 1.6 559 1.5 608 1.6 Balance of County 437 1.0 385 0.9 245 0.6 135 0.4 304 0.8 Total 44,026 42,456 40,431 38,237 38,100 81
Supplemental Tables: Good Health
xx 9
Total Number and Percent of Births by City and Community, 2007 to 2016 (Continued) City 2012 2013 2014 2015 2016 Total % Total % Total % Total % Total % Aliso Viejo 719 1.9 660 1.8 673 1.7 662 1.8 660 1.7 Anaheim 5,392 14.1 5,201 14.0 5,176 13.4 5,000 13.3 4,879 12.8 Brea 436 1.1 442 1.2 508 1.3 512 1.4 523 1.4 Buena Park 1,053 2.8 1,011 2.7 1,049 2.7 965 2.6 911 2.4 Costa Mesa 1,499 3.9 1,549 4.2 1,656 4.3 1,541 4.1 1,498 3.9 Coto De Caza 45 0.1 53 0.1 43 0.1 51 0.1 42 0.1 Cypress 400 1.0 393 1.1 386 1.0 404 1.1 382 1.0 Dana Point/Capistrano Beach 292 0.8 322 0.9 327 0.8 330 0.9 290 0.8 Foothill Ranch/El Toro 120 0.3 130 0.3 116 0.3 145 0.4 156 0.4 Fountain Valley 460 1.2 475 1.3 504 1.3 467 1.2 507 1.3 Fullerton 1,576 4.1 1,526 4.1 1,770 4.6 1,613 4.3 1,591 4.2 Garden Grove 2,380 6.2 2,241 6.0 2,113 5.5 2,096 5.6 1,928 5.1 Huntington Beach 1,869 4.9 1,893 5.1 2,003 5.2 1,858 4.9 1,841 4.8 Irvine 2,715 7.1 3,007 8.1 4,008 10.4 3,978 10.6 4,983 13.1 La Habra 860 2.3 880 2.4 860 2.2 807 2.1 837 2.2 La Palma 116 0.3 128 0.3 138 0.4 125 0.3 121 0.3 Ladera Ranch 418 1.1 370 1.0 356 0.9 328 0.9 332 0.9 Laguna Beach 179 0.5 157 0.4 157 0.4 176 0.5 140 0.4 Laguna Hills 306 0.8 325 0.9 297 0.8 317 0.8 314 0.8 Laguna Niguel 547 1.4 571 1.5 539 1.4 558 1.5 556 1.5 Laguna Woods 5 0.0 4 0.0 6 0.0 2 0.0 3 0.0 Lake Forest 766 2.0 667 1.8 685 1.8 738 2.0 821 2.2 Los Alamitos 169 0.4 187 0.5 165 0.4 165 0.4 181 0.5 Midway City 108 0.3 97 0.3 96 0.2 94 0.2 91 0.2 Mission Viejo 863 2.3 835 2.2 882 2.3 840 2.2 894 2.3 Newport Beach 471 1.2 479 1.3 620 1.6 531 1.4 606 1.6 Newport Coast 99 0.3 85 0.2 87 0.2 88 0.2 94 0.2 Orange 1,867 4.9 1,791 4.8 1,874 4.9 1,849 4.9 1,764 4.6 Placentia 663 1.7 581 1.6 652 1.7 533 1.4 574 1.5 Portola Hills 0 0.0 13 0.0 14 0.0 5 0.0 3 0.0 Rancho Santa Margarita 529 1.4 518 1.4 552 1.4 530 1.4 523 1.4 San Clemente 930 2.4 883 2.4 842 2.2 766 2.0 802 2.1 San Juan Capistrano 399 1.0 395 1.1 393 1.0 385 1.0 403 1.1 Santa Ana 5,958 15.6 5,607 15.0 5,294 13.7 5,181 13.8 4,987 13.1 Seal Beach 138 0.4 146 0.4 151 0.4 158 0.4 153 0.4 Stanton 450 1.2 439 1.2 388 1.0 398 1.1 369 1.0 Trabuco Canyon 185 0.5 161 0.4 154 0.4 168 0.4 170 0.4 Tustin 1,264 3.3 1,141 3.1 1,145 3.0 1,143 3.0 1,229 3.2 Villa Park 30 0.1 31 0.1 34 0.1 38 0.1 31 0.1 Westminster 1,002 2.6 959 2.6 1,011 2.6 967 2.6 998 2.6 Yorba Linda 611 1.6 597 1.6 685 1.8 662 1.8 718 1.9 Balance of County 297 0.8 306 0.8 201 0.5 447 1.2 216 0.6 Total 38,186 37,256 38,610 37,621 38,121
82
Source: Orange County Health Care Agency
Supplemental Tables: Good Health
*Low birth weight is defined as less than 2,500 grams at birth. Note: Due to rounding, percentages may not add to 100. ^Other includes AIAN, Pacific Islander, More than One Race, and Other.
Source: Orange County Health Care Agency
10
Number and Percent of Infants, by Birth Weight and Race and Ethnicity, 2007 to 2016 TRIMESTER Total % White Black Hispanic Asian Other^ 2007 Under 1,500 Grams 494 1.1 157 12 253 61 11 1,500-2,499 Grams 2,385 5.4 648 40 1,208 443 46 2,500 Grams & over 41,147 93.5 11,813 404 21,384 6,790 756 TOTAL 44,026 100.0 12,618 456 22,845 7,294 813 % Low Birth Weight* 6.5% 6.4% 11.4% 6.4% 6.9% 7.0% 2008 Under 1,500 Grams 417 1.0 107 11 231 58 10 1,500-2,499 Grams 2,288 5.4 652 39 1,115 454 28 2,500 Grams & over 39,751 93.6 11,472 409 20,657 6,475 738 TOTAL 42,456 100.0 12,231 459 22,003 6,987 776 % Low Birth Weight* 6.4% 6.2% 10.9% 6.1% 7.4% 4.9% 2009 Under 1,500 Grams 406 1.0 126 8 194 66 12 1,500-2,499 Grams 2,264 5.6 683 32 1,021 487 41 2,500 Grams & over 37,761 93.4 11,298 403 19,108 6,235 717 TOTAL 40,431 100.0 12,107 443 20,323 6,788 770 % Low Birth Weight* 6.6% 6.7% 9.0% 6.0% 8.1% 6.9% 2010 Under 1,500 Grams 362 0.9 126 12 160 53 11 1,500-2,499 Grams 2,100 5.5 645 43 943 436 33 2,500 Grams & over 35,775 93.6 11,103 361 17,827 5,780 704 TOTAL 38,237 100.0 11,874 416 18,930 6,269 748 % Low Birth Weight* 6.4% 6.3% 13.2% 5.8% 7.8% 5.9% 2011 Under 1,500 Grams 406 1.1 114 8 196 64 10 1,500-2,499 Grams 2,144 5.6 637 39 957 444 41 2,500 Grams & over 35,550 93.3 10,736 405 17,204 6,026 733 TOTAL 38,100 100.0 11,487 452 18,357 6,534 784 % Low Birth Weight* 6.7% 6.5% 10.4% 6.3% 7.8% 6.5% 2012 Under 1,500 Grams 383 1.0 82 14 188 86 5 1,500-2,499 Grams 2,018 5.3 549 38 823 522 39 2,500 Grams & over 35,785 93.7 10,555 393 16,727 6,820 720 TOTAL 38,186 100.0 11,186 445 17,738 7,428 764 % Low Birth Weight* 6.3% 5.6% 11.7% 5.7% 8.2% 5.8% 2013 Under 1,500 Grams 385 1.0 94 5 202 75 9 1,500-2,499 Grams 1,945 5.2 589 37 823 456 39 2,500 Grams & over 34,926 93.7 10,880 402 16,071 6,826 723 TOTAL 37,256 100.0 11,563 444 17,096 7,357 771 % Low Birth Weight* 6.3% 5.9% 9.5% 6.0% 7.2% 6.2% 2014 Under 1,500 Grams 345 0.9 85 11 163 79 7 1,500-2,499 Grams 2,088 5.4 629 41 843 528 47 2,500 Grams & over 36,177 93.7 11,122 426 15,460 8,426 743 TOTAL 38,610 100.0 11,836 478 16,466 9,033 797 % Low Birth Weight* 6.3% 6.0% 10.9% 6.1% 6.7% 6.8% 2015 Under 1,500 Grams 358 1.0 96 6 172 72 12 1,500-2,499 Grams 2,002 5.3 536 43 812 563 48 2,500 Grams & over 35,261 93.7 10,960 424 15,102 8,051 724 TOTAL 37,621 100.0 11,592 473 16,086 8,686 784 % Low Birth Weight* 6.3% 5.5% 10.4% 6.1% 7.3% 7.7% 2016 Under 1,500 Grams 392 1.0 93 17 174 95 2 1,500-2,499 Grams 2,005 5.3 509 36 832 563 10 2,500 Grams & over 35,724 93.7 10,679 426 14,553 9,035 184 TOTAL 38,121 100.0 11,281 479 15,559 9,693 196 % Low Birth Weight* 6.3% 5.3% 11.0% 6.4% 6.8% 6.1%
83
Supplemental Tables: Good Health
Low Birth Weight and Very Low Birth Weight by Maternal Age, 2016
Low Birth Weight
Very Low Birth Weight
xx 11
MATERNAL AGE <15 Years Row % 15-19 Years Row % 20-24 Years Row % 25-29 Years Row % 30-34 Years Row % 35-39 Years Row % 40+ Years Row % Total 2016 <2,500 grams 1 0.04 85 3.5 276 11.5 486 20.3 778 32.5 566 23.6 205 8.6 2,397 2,500+ grams 8 0.02 1,126 3.2 4,407 12.3 8,859 24.8 12,105 33.9 7,353 20.6 1,866 5.2 35,724 Total 9 1,211 4,683 9,345 12,883 7,919 2,071 38,121 2015 <2,500 grams 1 0.04 84 3.6 305 12.9 512 21.7 755 32.0 511 21.6 192 8.1 2,360 2,500+ grams 16 0.05 1,275 3.6 4,764 13.5 8,634 24.5 11,978 34.0 6,807 19.3 1,787 5.1 35,261 Total 17 1,359 5,069 9,146 12733 7,318 1979 37,621
MATERNAL AGE <15 Years Row % 15-19 Years Row % 20-24 Years Row % 25-29 Years Row % 30-34 Years Row % 35-39 Years Row % 40+ Years Row % Total 2016 <1,500 grams 0 0.00 12 3.1 48 12.2 80 20.4 119 30.4 101 25.8 32 8.2 392 1,5002,499 grams 1 0.05 73 3.6 228 11.4 406 20.2 659 32.9 465 23.2 173 8.6 2,005 2,500+ grams 8 0.02 1,126 3.2 4,407 12.3 8,859 24.8 12,105 33.9 7,353 20.6 1,866 5.2 35,724 Total 9 1,211 4,683 9,345 12,883 7,919 2,071 38,121 2015 <1,500 grams 0 0.00 15 4.2 33 9.2 81 22.6 121 33.8 73 20.4 35 9.8 358 1,5002,499 grams 1 0.05 69 3.4 272 13.6 431 21.5 634 31.7 438 21.9 157 7.8 2,002 2,500+ grams 16 0.05 1,275 3.6 4,764 13.5 8,634 24.5 11,978 34.0 6,807 19.3 1,787 5.1 35,261 Total 17 1,359 5,069 9,146 12,733 7,318 1,979 37,621
84
Source: Orange County Health Care Agency
Supplemental Tables: Good Health
Secondary Indicator: INFANTS BORN WITH ABNORMAL CONDITIONS
Definition
Number and rate of infants born with abnormal conditions that are identified at birth and recorded on the birth certificate and the type of abnormalities with which they are born.
Number and Rate Per 1,000 Live Births of Infants Born with Selected Abnormal Conditions, by Race/Ethnicity, 2007 to 2016
Important note to readers: Beginning in 2006, the Medical Worksheet information associated with the birth certificate was mo dified to capture fewer abnormal conditions within each category. To be consistent with the new classification, data prior to 2006 has been reanalyzed, and will significantly differ from the data presented in previous editions in terms of the total number of abnormal conditions in each category.
* Rates based on less than five births are unstable, and, therefore, should be interpr eted with caution. Source: Orange County Health Care Agency
Number of Infants Born, by Selected Abnormal Conditions, 2007-2016
Important note to readers: Beginning in 2006, the Medical Worksheet information associated with the birth certificate was modified to capture fewer a bnormal conditions within each category. To be consistent with the new classification, data prior to 2006 has been reanalyzed, and will significantly differ from the data presented in previous editions in terms of the total number of abnormal conditions in each category.
*Please note that beginning in 2006, the Medical Worksheet started separating Down’s Syndrome into Karyotype Confirmed and Karyotype Pending categories, and therefore, only confirmed cases are presented from 2006 forward.
Source: Orange County Health Care Agency
12
Race/Ethnicity 2007 2008 2009 2010 2011 No. Rate No. Rate No. Rate No. Rate No. Rate Asian 2 0.3* 5 0.7 10 1.5 3 0.5 6 0.9 Black 0 0.0 1 2.2* 0 0.0 0 0.0 2 4.4* Hispanic 17 0.7 38 1.7 29 1.4 20 1.1 26 1.4 Non- Hispanic White 8 0.6 9 0.7 11 0.9 7 0.6 9 0.8 Other/Unknown 1 1.2* 0 0.0 0 0.0 1 0.8 2 1.6* TOTAL 28 0.6 53 1.2 50 1.2 31 0.8 45 1.2 Race/Ethnicity 2012 2013 2014 2015 2016 No. Rate No. Rate No. Rate No. Rate No. Rate Asian 4 0.5* 4 0.5* 9 1.0 9 1.0 9 0.9 Black 0 0.0 0 0.0 0 0.0 1 2.1* 0 0.0 Hispanic 28 1.6 20 1.2 35 2.1 26 1.6 20 1.3 Non- Hispanic White 13 1.2 11 1.0 19 1.6 7 0.6 13 1.1 Other/Unknown 1 1.3* 2 2.5* 1 1.3* 1 1.3* 0 0.0 TOTAL 46 1.2 37 1.0 64 1.7 44 1.2 42 1.1
Abnormal Conditions in Newborn 2007 2008 2009 2010 2011 2012 2013 2014 2015 2016 Anencephaly 2 7 2 1 0 2 2 1 0 0 Meningomylocele/Spina Bifida 1 2 3 2 2 1 3 0 1 1 Omphalocele/Gastroschisis 5 6 5 2 9 8 7 11 7 2 Cleft Lip/Palate 13 24 22 13 17 19 17 30 17 21 Down’s Syndrome 5* 13* 16* 12* 16* 15* 7* 20* 7 5* Hypospadias 2 1 3 1 1 1 1 2 2 3 Total 28 53 50 31 45 46 37 64 44 32
85
Supplemental Tables: Good Health
Percent calculated from number of births with known obstetric estimate gestational age less than 37 weeks for 2014. Rates pri or to 2014 were calculated from last menstrual period dates.
Orange County Health Care Agency
Percent Preterm (17-36 Com pleted Weeks of Gestation), 2007 to 2016
Note: Percent calculated from number of births with known obstetric estimate gestational ag e less than 37 weeks. The primary measure used to determine the gestational age is calculated based on the mother’s last menstrual period (LMP) and the child’s date of birth. In 2007, the obstetric estimate (OE) was added to the Ca lifornia birth certificate to address missing or erroneous LMP data and precludes neonatal assessments. Both rates are shown for 2007-2016. It is anticipated that routine reporting of OE on the birth certificate will improve the accuracy of gestational age estim ates.
Source: Orange County Health Care Agency
Note: Percent calculated from number of births with known obstetric estimate gestational ag e less than 37 weeks for 2014. Percent calculated from number of births with known gestational age less than 37 weeks for years prior to 2014.
Source: Orange County Health Care Agency
xx 13
Percent of Preterm Births, by Mother’s Age, 2007 to 2016 Age of Mother 2007 2008 2009 2010 2011 2012 2013 2014 2015 2016 <15 Years 21.6 21.3 12.1 19.4 25.8 16.7 27.8 18.2 5.9 11.1 15-19 Years 10.3 10.5 9.8 9.8 9.9 9.2 8.6 7.3 7.5 8.0 20-24 Years 8.8 8.1 8.2 8.2 7.7 7.9 6.9 6.4 7.2 7.1 25-29 Years 8.6 8.7 8.2 7.5 7.7 7.1 6.8 6.3 6.5 6.8 30-34 Years 9.7 9.1 9.2 8.9 8.4 7.8 7.4 7.1 7.5 7.6 35-39 Years 11.2 11.1 11.2 10.8 11.2 10.3 8.7 8.9 8.1 9.3 40+ Years 14.3 13.9 15.0 14.7 14.5 12.6 13.0 11.8 12.1 12.3
Indicator: PRETERM BIRTHS
Source:
2007 2008 2009 2010 2011 2012 2013 2014 2015 2016 All Births Calculated by LMP 9.8 9.5 9.4 9.1 9.0 8.4 7.8 7.2 7.4 7.8 All Births Estimated by OE 8.8 8.4 8.6 8.1 8.3 7.9 7.7 7.4 7.5 8.0 Singleton Births Calculated by LMP 8.2 7.9 7.6 7.5 7.2 6.8 6.3 5.7 6.0 6.2 Singleton Births Estimated by OE 7.1 6.7 6.7 6.4 6.4 6.2 6.2 5.8 6.1 6.5
Percent Preterm , by Maternal Race/Ethnicity, 2007 to 2016 Race/Ethnicity 2007 2008 2009 2010 2011 2012 2013 2014 2015 2016 White 9.7 9.0 9.6 9.4 8.9 7.7 7.5 6.0 7.3 7.9 Black 16.3 13.5 11.7 14.7 13.4 11.8 10.1 10.9 10.8 12.8 Hispanic 9.7 9.7 9.2 9.0 8.9 8.6 8.1 6.1 8.0 8.8 Asian 9.4 9.0 9.4 8.5 8.9 8.3 7.1 6.7 7.0 7.3
86
Supplemental Tables: Good Health
Percent Preterm for Orange County, California and United States, 2007 to 2016
N/A: Data not available.
Total Preterm Births for California have been updated to match the 2015 March of Dimes Report Card.
Percent calculated from number of births with known obstetric estimate gestational age less than 37 weeks for 2014 and beyond Rates prior to 2014 were calculated from last menstrual cycle dates. Source: Orange County Health Care Agency; March of Dimes Report Card.
Percent calculated from number of births with known gestational age less than 37 weeks.
Note: The primary measure used to determine the gestational age is calculated based on the mother’s last menstrual period (LMP) and the child’s date of birth. In 2007, the obstetric estimate (OE) was added to the California birth certificate to address missing or erroneous LMP data and precludes neonatal assessments. Both rates are shown for 2007-2016 It is anticipated that routine reporting of OE on the birth certificate will improve the accuracy of gestational age estimates.
Source: Orange County Health Care Agency
14
Total Preterm Births Late Preterm Births Moderately Late Preterm Births Very Preterm Births OC CA US OC CA US OC CA US OC CA US 2007 9.8% 10.9% 10.4% 7.4% N/A 7.5% 1.0% N/A 1.2% 1.4% 1.6% 2.0% 2008 9.5% 10.5% 10.4% 7.2% N/A 7.5% 1.2% N/A 1.2% 1.2% 1.5% 2.0% 2009 9.4% 10.3% 10.1% 7.0% N/A 7.2% 1.2% N/A 1.2% 1.2% 1.5% 2.0% 2010 9.1% 9.9% 10.0% 6.8% N/A 7.2% 1.1% N/A 1.2% 1.2% 1.5% 2.0% 2011 9.0% 9.8% 9.8% 6.6% 7.1% 7.0% 1.1% N/A 1.2% 1.3% N/A 1.9% 2012 8.4% 9.6% 9.8% 6.1% 6.9% 7.0% 1.1% N/A 1.2% 1.2% N/A 1.9% 2013 7.8% 8.8% 9.6% 5.7% 6.4% 6.8% 0.9% N/A 1.2% 1.2% N/A 1.9% 2014 7.4% 8.3% 9.6% 5.4% 6.0% 6.8% 0.9% N/A 1.2% 1.0% 1.3% 1.6% 2015 7.6% 8.5% 9.6% 6.1% 6.2% 6.9% 1.0% N/A 1.2% 1.1% 1.3% 1.6% 2016 8.0% 8.6% 9.8% 5.8% N/A N/A 1.0% N/A N/A 1.1% N/A N/A
Late and
Late Preterm for
Births
Singleton
Late Preterm Births (34-36 Completed Weeks of Gestation) Very Preterm Births (17-31 Completed Weeks of Gestation) All Births Singleton Births All Births Singleton Births Calc. by LMP Est. by OE Calc. by LMP Est. by OE Calc. by LMP Est. by OE Calc. by LMP Est. by OE 2007 7.4% 6.5% 6.4% 5.5% 1.4% 1.3% 1.0% 0.9% 2008 7.2% 6.3% 6.2% 5.3% 1.2% 1.1% 0.9% 0.8% 2009 7.0% 6.4% 5.8% 5.2% 1.2% 1.2% 0.9% 0.8% 2010 6.8% 6.1% 5.7% 4.9% 1.2% 1.1% 1.0% 0.9% 2011 6.6% 6.1% 5.5% 4.9% 1.3% 1.2% 1.0% 0.9% 2012 6.1% 5.8% 5.1% 4.8% 1.2% 1.1% 0.9% 0.8% 2013 5.7% 5.6% 4.7% 4.7% 1.2% 1.2% 0.9% 0.9% 2014 5.4% 5.4% 4.4% 4.4% 1.0% 1.1% 0.7% 0.8% 2015 5.6% 5.6% 4.6% 4.7% 1.0% 1.0% 0.8% 0.8% 2016 6.3% 5.8% 5.2% 5.4% 1.4% 1.1% 1.0% 1.0%
Percent
Very
All
and
Births, Orange County, 2007 to 2016
87
Supplemental Tables: Good Health
Indicator: TERM BIRTHS
**Percents based on fewer than 5 events are statistically unreliable. Due to rounding, percentages may not add to 100. *Oth er includes AIAN, Pacific Islander, More than One Race, and Other. Mothers of unknown race are not included in this table.
xx 15
Total Number and Percent of Term Infant Births by Race and Ethnicity, 201 6 INFANT TYPE Total % White % Black % Hispanic % Asian % Other* % Early Term 9,560 27.3 2,627 23.3 114 27.4 4,146 29.2 2,621 29.2 52 29.1 Full Term 23,253 66.4 7,520 66.7 258 62.0 9,371 66.1 5,995 66.8 109 60.9 Late Term 2,134 6.1 1,083 9.6 41 9.9 647 4.6 346 3.9 17 9.5 Post Term 84 0.2 51 0.5 3 0.7 18 0.1 11 0.1 1 0.6 TOTAL 35,031 11,281 416 14,182 8,973 179
Source:
Total Number and Percent of Total Term Infant Births by Mother's Age, 201 6 MOTHER’S AGE Total % Total Early Term % Full Term % Late Term % Post Term % <15 Years 8 0.0 1 0.0 7 0.0 0 0.0 0 0 15-19 Years 1,112 3.2 323 3.4 727 3.1 60 2.8 2 2.4 20-24 Years 4,347 12.4 1,194 12.5 2,889 12.4 260 12.2 4 4.8 25-29 Years 8,694 24.8 2,274 23.8 5,840 25.1 555 26.0 25 29.8 30-34 Years 11,890 33.9 3,166 33.1 7,878 33.9 812 38.1 34 40.5 35-39 Years 7,170 20.5 2,015 21.1 4,766 20.5 375 17.6 14 16.7 40+ Years 1,810 5.2 587 6.1 1,146 4.9 72 3.4 5 6.0 TOTAL 35,031 9,560 23,253 2,134 84
88
County of Orange Health Care Agency
Source: Orange County Health Care Agency
Supplemental Tables: Good Health
Total Number and Percent of Term Infant Births by Birth Type, 201 6
Total Number and Percent of Term Infant Births by Delivery Type, 2016
16
INFANT TYPE Total % Singleton % Multiple % Early Term 9,560 27.3 9,008 26.2 552 92.6 Full Term 23,253 66.4 23,213 67.4 40 6.7 Late Term 2,134 6.1 2,130 6.2 4 0.7 Post Term 84 0.2 84 0.2 0 0.0 TOTAL 35,031 34,435 596 Source:
of Orange Health Care Agency
County
INFANT TYPE Total % Cesarean % Vaginal % Early Term 9,560 27.3 2,988 26.7 6,572 27.6 Full Term 23,253 66.4 7,583 67.7 15,670 65.7 Late Term 2,134 6.1 593 5.3 15,41 6.5 Post Term 84 0.2 33 0.3 51 0.2 TOTAL 35,031 11,197 23,834 Source: County of Orange Health Care Agency 89
Supplemental Tables: Good Health
Secondary Indicator: SUBSTANCE -EXPOSED INFANTS
Definition
Substance-exposed infants refers to the number of infants with positive toxicology results for alcohol and/or illicit drugs at the time of birth that were provided Emergency Response services by the Orange County Social Services Agency (SSA), resulting in juvenile court intervention. Any indication of maternal substan ce abuse requires an assessment of the needs of the mother and child by a health practitioner or medical social worker prior to the child leaving the hospital. There is a mandatory assessment form that serves as a guide for medical staff to focus their assessment, and the decision to report a child to the Orange County SSA Child Abuse Registry is to be based on a reasonable suspicion that the parent may be unable to care for the child. This must be based on at least one factor other than the positive toxico logy screen. See Maternal Substance Abuse Assessment Protocol on the Conditions of Children Report website at www.ochealthinfo.com/occp/report
Number of Orange County Infants Taken into Protective Custody (or petition for dependency filed) as a Result of T esting Positive for Substance Exposure at Birth, 2007/08 to 2016/1 7
xx 17
2007/08 2008/09 2009/10 2010/11 2011/12 2012/13 2013/14 2014/15 2015/16 2016/17 Substance Exposed Infants 107 81 89 128 82 98 110 121 178 190 Source: Orange County Social Services Agency 90
Supplemental Tables: Good Health
Indicator: INFANT MORTALITY RATE
Definition
The infant mortality indicator refers to deaths of infants under one year of age. The rate of infant mortality is calculated per 1,000 live births per year.
*Maternal Causes includes causes such as hypertension, premature rupture of membranes, malpresentation, placenta previa, alco hol/drug abuse, or other complications of labor and delivery. Note: Due to rounding percentages may not add up to 100. Source: Orange County Health Care Agency.
18
Percent of Infant Deaths, by Cause, 2007 to 2016 CAUSES OF INFANT DEATH 2007 2008 2009 2010 2011 2012 2013 2014 2015 2016 Short Gestation/ Low Birth Weight 8.6% 6.9^ 3.0% 5.4% 6.3% 9.2% 8.9% 3.5% 7.0% 8.1% Congenital Anomalies (Birth Defects) 29.4% 31.7% 33.9% 27.9% 31.3% 38.5% 21.1% 33.9% 16.0% 28.1% Sudden Infant Death Syndrome (SIDS) 1.6% 2% 0.0% 1.4% 0.0% 1.5% 0.0% 0.0% 0.0% 0.0% Respiratory Distress Syndrome (RDS) 2.1% 3.0% 1.8% 3.4% 0.6% 3.1% 2.4% 3.5% 1.0% 1.0% Maternal Causes* 11.8% 16.8% 18.2% 12.9% 13.8% 13.8% 16.3% 20.9% 28.0% 18.1% Accidents and Adverse Effects 0.5% 1.5% 2.4% 1.4% 1.9% 0.0% 2.4% 0.9% 5.0% 2.5% Other conditions of Perinatal Period 24.6% 10.9% 17.6% 36.7% 30.6% 19.2% 33.3% 11.3% 23.0% 23.8% Pneumonia and Influenza 1.1% 1.0% 0.6% 0.0% 0.6% 0.8% 0.0% 1.7% 1.0% 1.0% All Other Causes 20.3% 26.2% 22.4% 10.9% 14.9% 13.8% 15.6% 24.3% 19.0% 17.4%
91
Supplemental Tables: Good Health
**Due to relatively low numbers of Black infants and deaths, statistics for this group are unreliable. Note: Rates based on less than five deaths are unstable, and therefore should be interpreted with caution.
Source: Orange County Health Care Agency.
Three Year Average Rate per 1,000 Live Births Suffering Infant Mortality, by Race and Ethnicity, 2008-2016
*Due to relatively low numbers of Black infants and deaths, statistics for this group are unreliable.
Source: Orange County Health Care Agency.
xx 19
Number and Rate per 1,000 Live Births Suffering Infant Mortality , by Race and Ethnicity, 2007 to 2016 Race/Ethnicity 2007 2008 2009 2010 2011 No. Rate No. Rate No. Rate No. Rate No. Rate Asian 21 2.9 18 2.3 20 2.9 13 2.0 16 2.5 Black 6 13.2 4 8.7** 3 6.8** 2 4.8** 3 6.6** Hispanic 90 3.9 128 5.8 89 4.4 86 4.5 82 4.5 Non- Hispanic White 56 4.4 49 4.1 50 4.1 39 3.3 48 4.2 Race/Ethnicity 2012 2013 2014 2015 2016 No. Rate No. Rate No. Rate No. Rate No. Rate Asian 20 2.7 16 2.2 15 1.7 10 1.8 18 2.7 Black 3 6.7** 2 4.5** 4 8.4** 5 10.6 9 15.9 Hispanic 68 3.8 72 4.2 64 3.9 55 5.0 88 5 Non- Hispanic White 34 3.0 26 2.2 29 2.5 24 1.8 36 3.4
Race/Ethnicity 2008-2010 2011-2013 2014-2016 Asian 2.4 2.5 2.0 Black* 6.8 5.9 11.8 Hispanic 4.9 4.2 4.6 Non- Hispanic White 3.8 3.1 2.5
92
Supplemental Tables: Good Health
Indicator: BREASTFEEDING
Definition
Local statistics on breastfeeding are obtained from two California Department of Public Health data sources. The InHospital Newborn Screening Program documents feeding practices at discharge for all Orange County births. The Maternal Infant Health Assessment (MIHA) is an annual statewide -representative survey of women with a recent live birth in California. In-Hospital Newborn Screening data are presented as the percentage of mothers breastfeeding (any or exclusive breastfeeding) in the hospital after birth. MIHA data are presented as the percentage of mothers who reported breastfeeding (any or exclusive breastfeeding) at one month after delivery and at three months after delivery. An infant is exclusively breastfed when fed only with human milk and no other supplements such as water, formula, non -human milk, food or juice. Any breastfeeding is defined as feeding with both human milk and infant formula.
Hospital Discharge Breastfeeding Percentages in Orange County and California, 2012 -2017
Source: California Department of Public Health, Center for Family Health, Genetic Disease Screening Program, Newborn Screening Data, 2017
Orange County Number and Percent of Any and Exclusive Breastfeeding, by Race/Ethnicity, 2012 to 2017
20
Any Breastfeeding Exclusive Breastfeeding 2012 2013 2014 2015 2016 2017 2012 2013 2014 2015 2016 2017 Orange County 93.2 94.0 94.8 95.1 95.0 94.8 62.1 62.7 64.6 67.1 66.1 65.8 California 92.3 93.0 93.5 93.9 94.0 94.0 62.6 64.8 66.6 68.6 69.4 69.8
Year and Age Black Asian Hispanic White Pacific Islander Multiple Missing/ Other Total 2012 Any Number 293 5,529 15,232 8,900 47 1,336 754 32,091 Any Percent 91.8 93.8 92.4 94.3 83.9 94.9 93.2 93.2 Exclusive Number 196 3,038 9,373 7,197 23 1,041 493 21,361 Exclusive Percent 61.4 51.6 56.8 76.2 41.1 73.9 60.9 62.1 2013 Any Number 334 5,705 14,558 8,907 48 1,095 795 31,442 Any Percent 91.8 94.5 93.0 95.1 88.9 95.5 94.8 94.0 Exclusive Number 224 3,115 8,963 7,242 29 867 540 20,980 Exclusive Percent 61.5 51.6 57.3 77.3 53.7 75.6 64.4 62.7 2014 Any Number 284 7,066 14,324 9,253 44 1,206 383 33,121 Any Percent 92.2 95.0 94.2 95.6 89.8 95.7 96.0 94.8 Exclusive Number 203 3,629 9,290 7,556 23 946 255 22,265 Exclusive Percent 65.9 48.8 61.1 78.0 46.9 75.1 63.9 63.7 2015 Any Number 403 7,453 15,085 9,680 42 1,237 * 34,896 Any Percent 91.6 94.8 94.9 95.8 91.3 96.0 * 95.1 Exclusive Number 298 4,156 10,304 8,069 25 1,016 * 24,592 Exclusive Percent 67.7 52.9 64.8 79.9 54.3 78.9 * 67.1 93
Supplemental Tables: Good Health
Orange County Number and Percent of Any and Exclusive Breastfeeding, by Race/Ethnicity, 2012 to 2017 (continued)
*Reprint due to data not available at time of printing.
Source: California Department of Public Health, Center for Family Health, Genetic Disease Screening Program, Newborn Screenin g Data, 2016
xx 21
Year and Age Black Asian Hispanic White Pacific Islander Multiple Missing/ Other Total 2016 Any Number 341 8,411 14,592 9,526 53 1,220 405 35,097 Any Percent 90.9 95.2 94.2 96.0 93.0 96.1 94.6 95.0 Exclusive Number 260 4,724 9,755 8,001 33 978 287 24,430 Exclusive Percent 69.3 53.5 63.0 80.6 67.1 77.1 67.1 66.1 2017 Any Number 309 8,381 12,882 8,808 41 1,150 410 32,611 Any Percent 92.2 93.7 94.4 96.5 85.4 95.7 95.1 94.8 Exclusive Number 220 4,659 8,562 7,484 30 924 292 22,633 Exclusive Percent 65.7 52.1 62.7 82.0 62.5 76.9 67.7 65.8 California Department of Public Health; Numbers and percents not shown for <10 events; exact percents not shown for hospitals with <10 events; Data not shown for missing race/ethnicity Breastfeeding Percentages in Orange County Hospitals and California, 2012 -2016 Any Breastfeeding Percent Exclusive Breastfeeding Percent Hospitals 2012 2013 2014 2015 2016* 2012 2013 2014 2015 2016* Anaheim Regional Medical Center 88.7 92.8 93.5 94.1 92.4 28.2 41.3 43.2 48.4 44.4 Coastal Communities Hospital 91.2 90.2 94.0 88.9 83.9 55.3 56.0 61.9 50.6 37.0 Fountain Valley Regional Medical Center 89.1 90.3 91.9 93.4 93.6 25.7 18.5 19.4 28.3 34.7 Garden Grove Hospital 93.7 94.3 95.4 94.6 95.8 60.5 61.0 57.2 44.8 35.2 Hoag Memorial -Presbyterian Hospital 96.2 96.0 96.4 96.7 96.5 70.1 72.7 76.6 78.6 77.6 Kaiser-Anaheim 94.3 95.3 97.2 96.9 96.5 73.8 74.8 77.8 79.3 79.0 Kaiser-Irvine 97.1 97.5 96.7 98.0 98.0 80.1 82.6 79.0 84.0 84.5 La Palma Intercommunity Hospital 93.5 89.5 91.5 92.0 93.2 66.8 52.9 57.7 56.4 43.2 Los Alamitos Medical Center 94.1 94.8 93.6 92.1 94.6 75.2 73.4 69.3 64.2 63.7 Mission Hospital Regional Medical Center 94.8 96.0 96.7 96.4 96.6 80.3 80.8 80.6 80.7 77.2 Orange Coast Memorial Hospital 91.6 92.2 92.7 94.0 94.4 60.2 58.2 61.0 65.4 71.2 Saddleback Memorial Medical Center 92.1 93.2 94.0 95.4 95.0 60.1 60.2 58.6 60.7 64.3 St. Joseph's Hospital 94.8 95.4 96.1 95.9 96.1 81.0 83.1 83.7 85.6 84.5 St. Jude Medical Center 94.3 94.3 95.6 95.7 95.4 78.6 74.2 69.2 70.9 68.3 UC Irvine Medical Center 93.2 93.3 92.9 92.4 92.7 64.1 68.0 72.1 71.1 72.8 Western Medical Center 82.9 84.8 88.5 92.1 91.0 14.7 14.0 32.6 47.9 43.1 Western Medical Center Anaheim 96.5 95.0 95.8 95.2 92.6 62.8 51.2 49.3 45.1 31.4 Orange County 93.3 93.9 94.8 95.1 95.0 63.1 63.8 64.6 67.1 66.1 California 92.2 92.9 93.5 93.9 94.0 62.4 64.6 66.6 68.6 69.4
94
Supplemental Tables: Good Health
Indicator: IMMUNIZATION S
Definition
This indicator reports the percentage of children who received all doses of specific vaccines recommended by their 2nd birthday and required at kindergarten entry. Data at the 2nd birthday are based upon annual retrospective reviews of a sample of randomly selected schools’ kindergarten immunization records and therefore represent vaccination trends three years prior.
Percent of Adequately Immunized Children Enrolling in School Between 2008 through 2017 in Orange County and California
*Up-to-date (UTD) for Kindergarten: Proof of immunizations is required to enter kindergarten. Children who are partially immunized are not considered UTD but may attend school as long as they are not overdue for doses needed to complete the vaccine series. Children with a written exemption based on personal beliefs or documented medical conditions are also not UTD but may attend school. 2016 Kindergarten Assessment Results, California Department of Health Services, Immunization Branch.
**Up-to-date at 2nd birthday: 3 doses of polio, 4 doses of DTP or DTaP (diphtheria, pertussis and tetanus) and 1 MMR (measles, mumps and rubella). Additional doses of each vaccine are required before school entry 2003- 2012 Kindergarten Retrospective Survey Results, California Department of Health Services, Immunization Branch. 20032010 OC data includes other Southern California counties (Imperial, Orange, Riverside, San Bernardino, and San Diego). 2011-2012 data include a small, random sample of schools for Orange County only.
Source: Kindergarten Retrospective Survey Resul ts California Department of Health Services, Immunization Branch; Prepared by Orange County Health Care Agency
22
Assessment Year Up-To-Date at Kindergarten Entry* Up-To-Date at 2nd Birthday** CA (%) OC (%) CA (%) OC (%) 2008 91.7 90.0 77.9 81.1 2009 91.1 89.6 76.9 76.6 2010 90.7 89.0 77.4 74.8 2011 91.0 89.5 N/A 78.1 2012 90.3 89.3 N/A 75.7 2013 90.2 88.7 N/A 73.6 2014 90.4 90.1 N/A 78.9 2015 92.8 92.5 N/A 75.5 2016 95.6 95.5 N/A 78.5 2017 95.1 95.7 N/A 77.9
95
Supplemental Tables: Good Health
Secondary Indicator: DEVELOPMENTAL DISABLITIES
Definition
This indicator tracks the total number of children under 18 years of age who utilized services at the Regional Center of Orange County (RCOC). This includes children over three years of age who have a diagnosed developmental disability, and children under three years of age who are eligible for Early Intervention S ervices under Part C of the Individual with Disabilities Education Improvement Act (IDEIA) through California’s Early Start Program. The Early Start Program provides healthcare, intervention specialists, therapists, and parent resources for infants, toddle rs and their families.
Note: Numbers for CalWORKs/Medi-Cal and SSI/Medi-Cal populations are included because data were inconclusive
Note: Due to some children being counted in more than one category, based on their qualifications, values may not add up to 1 00%.
Source: Regional Center of Orange County
xx 23
Children Receiving Services for Development Disabilities, 2008 to 2017 2008 2009 2010 2011 2012 No. % No. % No. % No. % No. % Total Served 9,281 100 9,443 100 9,412 100 8,915 100 8,821 100 Total Served with Diagnosis 5,956 64.2 6,495 68.8 6,362 67.6 6,119 68.6 6,268 71.1 Total Number Under 4 Years of Age 4,270 46 4,297 45.5 4,056 43.1 3,463 68.8 3,247 36.8 Total Number who live at home 8,977 96.7 9,192 97.3 8,530 90.6 8,451 94.7 8,394 95.2 Total Number who live in Community Care Facility 102 1.1 71 0.8 102 1.1 76 0.9 78 0.9 Total number who live in Foster Care (SSA) 125 1.3 106 1.1 114 1.2 115 1.3 99 1.1 2013 2014 2015 2016 2017 No. % No. % No. % No. % No. % Total Served 8,661 100 8,953 9,343 100 9,688 100 10,156 100 Total Served with Diagnosis 6,342 73.2 6,448 72.0 6,644 71.1 6,761 69.8 6,905 68.0 Total Number Under 4 Years of Age 2,953 34.1 3,111 34.7 3,274 35.0 3,505 36.2 3,773 37.1 Total Number who live at home 8,240 95.1 8,750 97.7 9,112 97.5 9,461 97.7 9,911 97.6 Total Number who live in Community Care Facility 68 0.8 61 0.7 59 0.6 48 0.5 58 0.6 Total Number who live in Foster Care (SSA) 84 1 98 1.1 126 1.3 139 1.4 154 1.5
96
Supplemental Tables: Good Health
Total Number of Children Under 18 Years of Age Receiving Services for Developmental Disabilities, by Race/Ethnicity, 2008 to 2017
Note: Those with Middle Eastern ethnicity are included in the 'other' category Source: Regional Center for Orange County
Total Number of Children by Age Groups and Number and Percent of Children with a Diagnosis of Autism Served, by the Regional Center of Orange County (RCOC),
24
Ethnicity 2008 2009 2010 2011 2012 2013 2014 2015 2016 2017 White 2,918 2,863 2,789 2,448 2,342 2,222 2,364 2,486 2,539 2,592 Black 119 129 127 116 119 124 147 167 199 212 Hispanic 3,318 3,507 3,495 3,366 3,328 3,333 3,490 3,715 3,944 4,114 Asian 1,295 1,399 1,437 1,425 1,477 1,485 1,655 1,780 1,861 2,050 Other 1,358 1,345 1,365 1,360 1,035 984 838 1,200 1,151 1,192 Unknown 273 200 199 200 295 489 463 417 408 428 Total 9,281 9,443 9,412 8,915 8,821 8,794 8,957 9,765 10,102 10,587
July
8 2013 2014 2015 2016 Years of Age Total # of Children Served by RCOC # with Autism % with Autism Total # of Children Served by RCOC # with Autism % with Autism Total # of Children Served by RCOC # with Autism % with Autism Total # of Children Served by RCOC # with Autism % with Autism 3-4 692 312 45.1 664 326 49.1 646 342 52.9 722 422 58.4 5-9 2,195 1,125 51.2 2,218 1,170 53.0 2236 1230 55.0 2,331 1,337 57.3 10-14 1,943 920 47.3 2,089 1,002 48.0 2221 1131 50.9 2,262 1,172 51.8 15-18 1,597 677 42.4 1,583 703 48.0 1677 758 45.2 1,772 822 46.3 Total 6,437 3,034 47.1 6,554 3,301 50.4 6,780 3,461 51.1 7,087 3,753 52.9 2017 2018 Years of Age Total # of Children Served by RCOC # with Autism % with Autism Total # of Children Served by RCOC # with Autism % with Autism % Change 2013 to 2018 3-4 701 410 58.5 696 428 61.5 36.4 5-9 2,248 1,384 61.6 2,236 1,438 64.3 25.6 10-14 2,398 1,348 56.2 2,421 1,409 58.2 23.0 15-18 1,758 845 48.1 1,889 956 50.6 19.4 Total 7,105 3,987 56.1 7,242 4,231 58.4 24.0 RCOC data as of 8/01/2018 Note: Point in time data for July 31 in 2013, 2014, 2015, and 2016. Source: Regional Center of Orange County 97
July 2013 to
201
Supplemental Tables: Good Health
Indicator: PHYSICAL ACTIVITY AND NUTRITION
Percent of 5th, 7th and 9th Grade Students in Healthy Fitness Zone (HFZ) for Aerobic Capacity, 2011/12 to 2016/17
*Data prior to 2013/14 is not comparable due to differences in reporting methodology.
Source: California Department of Education, DataQuest
Percent of Students in Healthy Fitness Zone for Aerobic Capacity, by Grade and Race/Ethnicity, 2011/12 to
*Data prior to 2013/14 is not comparable due to differences in reporting methodology. Source: California Department of Education, DataQuest
xx 25
2011/2012 2012/13 2013/14* 2014/15 2015/16 2016/17 5th Graders 62.4 63 70.2 70.7 69.1 68.3 7th Graders 63.6 64.4 74.7 73.6 73.8 74.0 9th Graders 62.4 63 72 71.8 70.4 70.6
2016/17 Grade and Year Black American Indian Asian Filipino Pacific Islander Hispanic White Average 2011/12 5th Graders 64.8 65.9 75.0 69.8 51.4 59.1 80.1 66.6 7th Graders 72.4 75.9 84.3 77.3 62.2 63.5 82.3 74.0 9th Graders 67.5 70.5 81.6 72.1 58.4 61.4 78.2 70.0 2012/13 5th Graders 67.6 61.5 75.8 70.5 59.5 59.7 80.9 67.9 7th Graders 72.7 69.0 85.2 76.5 56.0 62.4 82.0 72.0 9th Graders 68.1 65.5 83.4 76.4 55.2 61.1 78.3 69.7 2013/14* 5th Graders 66.4 70.0 76.1 69.7 61.0 61.5 81.2 69.4 7th Graders 70.5 71.9 86.3 81.2 65.4 65.4 82.9 74.8 9th Graders 70.7 75.9 83.5 77.7 64.9 63.1 78.6 73.5 2014/15 5th Graders 67.7 57.3 77.5 73.4 60.5 62.2 81.1 68.5 7th Graders 69.2 71.2 84.2 77.7 65.1 64.8 81.9 73.4 9th Graders 69.5 66.1 82.9 76.3 62.5 62.7 79.4 71.3 2015/16 5th Graders 65.4 54.4 76.2 68.4 56.8 60.4 79.9 66.0 7th Graders 71.7 82.4 85.8 81.9 68.0 64.4 81.1 76.5 9th Graders 67.3 67.0 81.5 77.0 52.6 62.1 77.2 69.2 2016/17 5th Graders 61.1 53.8 72.9 66.2 45.4 60.0 78.9 62.6 7th Graders 70.2 69.4 84.3 78.6 57.7 65.4 81.6 72.5 9th Graders 62.9 67.0 81.9 76.1 58.1 60.8 79.5 69.5
98
Supplemental Tables: Good Health
Percent of 5th Grade Students Classified as Needs Improvement Based on Health Risk for Aerobic C apacity, by Race/Ethnicity, 2011/12 to 2016/17
*Data prior to 2013/14 is not comparable due to differences in reporting methodology.
Source: California Department of Education, DataQuest
Indicator: OBESITY
Percent of 5th, 7th and 9th Grade Students in Healthy Fitness Zone (HFZ) for Body Composition 2011/12 to 2016/17
*Data prior to 2013/14 is not comparable due to differences in reporting methodology.
Source: California Department of Education, DataQuest
26
Percent Needs Improvement Health Risk for Aerobic Capacity Race/Ethnicity 2011/12 2012/13 2013/14* 2014/15 2015/16 2016/17 Hispanic 10.7 11.2 9.1 7.7 9.5 9.5 Pacific Islander 15.5 11.7 7.2 13.6 10.1 16.9 Black 5.6 5.3 5.6 6.6 6.6 8.1 American Indian 2.3 6.4 5.6 8.7 9.8 8.7 Filipino 5.5 5.3 5.0 4.9 5.1 5.9 White 2.8 3.3 2.7 2.9 3.2 3.0 Two or More Races 3.1 3.5 2.3 3.7 4.6 2.0 Asian 2.4 2.7 2.1 2.3 2.6 2.9 Orange County 6.8 7.2 5.8 5.3 6.3 6.2 California 8.0 8.4 6.5 6.6 6.8 6.7
Grade 2011/2012 2012/13 2013/14* 2014/15 2015/16 2016/17 5th Graders 56.4 56.7 63.4 64.1 64.0 64.2 7th Graders 61.3 62.1 67.4 66.4 67.1 66.6 9th Graders 65.5 65.3 70.8 71.2 69.5 69.2
99
Supplemental Tables: Good Health
*Data prior to 2013/14 is not comparable due to differences in reporting methodology. Source: California Department of Education, DataQuest
xx 27
of Students Meeting Healthy Fitness Zone (HFZ) Standards for Body Composition, by Grade and Race/Ethnicity, 2011/12 to 2016/17
Percent
Grade and Year Black American Indian Asian Filipino Pacific Islander Hispanic White Average 2011/12 5th Graders 55 62.4 66.8 59.9 38.5 43.5 71 56.7 7th Graders 57.3 59.3 72 64.8 51.1 50.7 71.7 61.0 9th Graders 61.3 65.1 75.2 68.2 50.6 56.4 73.8 64.4 2012/13 5th Graders 56.2 61.5 67.8 60.5 52.9 44.8 69.8 59.1 7th Graders 62.8 59.4 74.6 62.8 42.8 49.8 73.9 60.9 9th Graders 63.5 55.9 77.2 68.8 47.1 56 72.9 63.1 2013/14* 5th Graders 63.1 66.7 75 65.9 47.4 51.1 76.4 63.7 7th Graders 64.5 71.9 79.7 71.6 50 55.6 79.1 67.5 9th Graders 68.8 74.1 82.1 76.2 58.4 60.7 79.2 71.4 2014/15 5th Graders 61.7 60.9 75.7 65.2 46.3 52.4 76.5 62.7 7th Graders 62.5 68.5 79.1 71.3 50 55.1 77.8 66.3 9th Graders 69.8 69.9 82.9 72.8 57.8 60.6 80.5 70.6 2015/16 5th Graders 64.7 56.2 75.2 69.3 41.2 52.6 76.0 62.2 7th Graders 66.0 74.1 79.5 71.5 47.2 55.4 78.2 67.4 9th Graders 68.2 69.0 81.8 75.7 52.6 58.8 79.2 69.3 2016/17 5th Graders 65.1 53.3 74.2 68.3 43.8 52.1 77.8 62.1 7th Graders 63.8 54.1 78.4 71.6 46.2 54.6 78.3 63.9 9th Graders 64 69.6 80.8 74.3 49 58 79.7 67.9 100
Supplemental Tables: Good Health
Percent of 5th Grade Students Classified as Needs Improvement Based on Health Risk for Body Composition, by Race/ and Ethnicity, 2011/12 to 2016/17
*Data prior to 2013/14 is not comparable due to differences in reporting methodology.
Source: California Department of Education, DataQuest
28
Percent Needs Improvement Based on Health Risk for Body Composition Race/Ethnicity 2011/12 2012/13 2013/14* 2014/15 2015/16 2016/17 Pacific Islander 49.3 39.9 28.6 39.4 33.8 36.2 Hispanic 42.5 41.7 27.3 26.2 26.7 26.8 Black 32.3 30.7 17.9 15.3 19.1 17.3 American Indian 27 30.2 16.6 16.0 25.4 28.2 Filipino 28.9 26.5 16 17.1 12.7 13.3 Two or More Races 20 22.5 9.9 11.4 12.9 7.3 White 17.2 18.4 9.3 9.4 9.4 8.5 Asian 20.5 19.5 8.6 8.5 9.3 9.7 Orange County 30.6 30.5 18.3 17.7 18.1 18.0 California 33.9 33.7 21 20.9 20.7 21.5
101
Supplemental Tables: Good Health
Indicator: TEEN BIRTHS
Definition Teen births are tracked utilizing two indicators. The first indicator is the percent of total annual births occurring among females ages 19 years and under. The second indicator is the teen birth rate, which is a calculation of annual teen births per 1,000 females ages 15 to 19 years per year.
Birth Rate per 1,000 Females Aged 15-19 Years in Orange County, California and United States, 2007 to 2016
Source Orange County: Orange County Health Care Agency
Source California: State of California, Department of Health Services, Birth Records. a. http://www.cdph.ca.gov/data/statisti cs/Documents/VSC-2005-0202.pdf; http://www.dhs.ca.gov/hisp/chs/OHIR/tables/datafiles/vsofca.xls
Source United States: National vital statistics reports: National Center for Health Statistics. ( http://www.cdc.gov/nchs/births.htm)
Population Source 2003-2009: State of California, Department of Finance, Race/Ethnic Population with Age and Sex Detail, 2000-2010. Sacramento, CA, September 2012.
Population Source 2010-2017: State of California, Department of Finance, Report P-3: State and County Population Projections by Race/Ethnicity, Detail ed Age, and Gender, 2010-2060. Sacramento, California, February 2017
State and County Population Projections by Race/Ethnicity, Detailed Age, and Gender, 2010 -2060. Sacramento, California, February 2017. Source: County of Orange Health Care Agency.
Source 2006-2009: State of California, Department of Finance, Race/Ethnic Population with Age and Sex Detail, 2000-2010. Sacramento, CA, September
State of California, Department of Finance, Report P-3: State and County Population Projections by Race/Ethnicity, Detailed Age, and Gender, 2010-2060.
Source: Orange County Health Care Agency.
xx 29
Area 2007 2008 2009 2010 2011 2012 2013 2014 2015 2016 Orange County 29.6 27.7 25.3 22.5 20.2 19.2 16.7 14.8 12.0 10.9 California 40.1 38.3 35.4 31.6 28.3 26.2 23.2 21.1 19.0 15.7 United States 42.5 41.5 39.1 34.2 31.3 29.4 26.5 24.2 22.3 20.3
Percent of Teen Births (19 and Under) of Total Births in Orange County, 2007 to 2016 2007 2008 2009 2010 2011 2012 2013 2014 2015 2016 7.0% 7.0% 6.8% 6.6% 5.8% 5.5% 4.8% 4.1% 3.7% 3.2% Source:
Number and Birth Rates, by Age of Mother (19 Years and Under) per 1,000 Females, 2007 to 2016 Age of Mother 2007 2008 2009 2010 2011 No. Rate No. Rate No. Rate No. Rate No. Rate < 15 Years 44 0.4 52 0.5 34 0.3 36 0.4 34 0.3 15-17 Years 984 15.3 979 15.0 902 13.8 806 12.3 730 11.3 18-19 Years 2,105 52.7 1,976 48.0 1,828 42.7 1,673 37.6 1,485 33.1 Age of Mother 2012 2013 2014 2015 2016 No. Rate No. Rate No. Rate No. Rate No. Rate < 15 Years 25 0.2 18 0.2 11 0.2 17 0.3 9 0.2 15-17 Years 624 9.8 500 8.0 457 7.3 372 5.8 339 8.9 18-19 Years 1,454 32.6 1,283 29.2 1,102 25.5 987 20.3 872 22.9 Notes: Birth rates for females <15 are based on a per 1,000 females 12-14 years of age, as there were no births to females younger than 12 years of age. Population Source 2006-2009: State of California, Department of Finance, Race/Ethnic Population with Age and Sex Detail, 2000 -2010. Sacramento, CA, September 2012. Population Source 2010- 2017: State of California, Department of Finance, Report P-3:
Birth Rate per 1,000 Female Teen Population 15-19 Years of Age, by Race and Ethnicity, 2007 to 2016 RACE/ETHNICITY 2007 2008 2009 2010 2011 2012 2013 2014 2015 2016 Asian 3.4 2.5 3.3 2.6 1.8 2.2 2.0 1.2 1.6 0.9 Black 25.2 26.1 18.9 13.9 12.6 11.6 10.1 14.8 9.0 16.3 Hispanic 63.5 58.2 51.4 45.4 39.6 36.8 31.0 26.9 23.7 21.0 Non- Hispanic White 6.9 7.7 6.7 6.9 4.9 4.2 3.9 4.3 3.5 2.9
2012.Population
2010-
Sacramento,
2017.
102
Orange County Health Care Agency.
Population
Source
2017:
California, February
Supplemental Tables: Good Health
Percent of Population, Total Births and Births to Teens (19 and Under) , by Race and Ethnicity, 2007 to 2016
*Percent of total female population age 12-19 using: State of California, Department of Finance, Race/Ethnic Population with Age and Sex Detail, 2000-2010. Sacramento, CA, September 2012. Population
Source 2010-2017: State of California, Department of Finance, Report P -3: State and County Population Projections by Race/Ethnicity, Detailed Ag e, and Gender, 2010-2060. Sacramento, California, February 2017 Due to rounding, totals may not add up to 100. The total does not include all races/ethnicity.
Source Orange County Health Care Agency
30
RACE/ ETHNICITY PERCENT OF POPULATION* PERCENT OF TOTAL BIRTHS BY YEAR 2015 2007 2008 2009 2010 2011 2012 2013 2014 2015 2016 Asian 15.7 16.6 16.5 16.8 16.4 17.1 19.5 20.0 23.4 23.1 25.4 Black 1.3 1.0 1.1 1.1 1.1 1.2 1.2 1.2 1.2 1.3 1.3 Hispanic 47.3 51.9 51.8 50.3 49.5 48.2 46.5 45.9 42.6 42.8 40.8 Non- Hispanic White 30.4 28.7 28.8 29.9 31.1 30.1 29.3 31.1 30.7 30.8 32.0 RACE/ ETHNICITY PERCENT OF POPULATION* PERCENT OF TEEN BIRTHS BY YEAR 2015 2007 2008 2009 2010 2011 2012 2013 2014 2015 2016 Asian 16.1 1.8 1.4 1.9 1.8 1.4 1.9 2.5 1.4 2.2 1.4 Black 1.4 1.4 1.5 1.2 1.0 1.0 1.0 0.9 1.6 1.1 2.5 Hispanic 44.9 86.1 85.0 85.3 85.3 86.4 87.4 86.8 85.4 86.1 85.7 Non- Hispanic White 33.2 8.9 10.3 9.7 10.5 8.8 8.0 8.6 10.6 9.7 10.3
103
Supplemental Tables: Good Health
xx 31
Number of Teen Births and Teen Birth Rates* per 1,000 females 15-19 years of age, by Age and Race/Ethnicity, 2007 to 2016 Age of Mother Total Rate Non- Hispanic White Black Hispanic Asian Other 2007 < 15 Years 44 0.4 1 0 41 0 2 15-17 Years 984 15.3 67 9 885 13 10 18-19 Years 2,105 52.7 207 35 1,776 43 44 Total Teen Births 3,133 275 44 2,702 56 56 Teen Birth Rate 29.6 6.9 25.2 63.5 3.4 N/A 2008 < 15 Years 52 0.5 1 2 45 2 2 15-17 Years 979 15.0 74 12 869 10 14 18-19 Years 1,976 48.0 231 33 1,644 31 37 Total Teen Births 3,007 306 47 2,558 43 53 Teen Birth Rate 27.7 7.7 26.1 58.2 2.5 N/A 2009 < 15 Years 34 0.3 0 0 33 1 0 15-17 Years 902 13.8 63 9 806 13 11 18-19 Years 1,828 42.7 202 25 1,522 40 39 Total Teen Births 2,764 265 34 2,361 54 50 Teen Birth Rate 25.3 6.7 18.9 51.4 3.3 N/A 2010 < 15 Years 36 0.4 3 1 31 1 0 15-17 Years 806 12.3 54 2 730 13 7 18-19 Years 1,673 37.6 207 21 1,384 31 30 Total Teen Births 2,515 264 24 2,145 45 37 Teen Birth Rate 22.5 6.8 13.3 44.3 2.5 N/A 2011 < 15 Years 34 0.3 1 0 33 0 0 15-17 Years 730 11.3 52 8 642 9 13 18-19 Years 1,485 33.1 142 14 1,272 23 25 Total Teen Births 2,249 195 22 1,947 32 38 Teen Birth Rate 20.2 5.1 13.5 40.0 1.8 N/A 2012 < 15 Years 25 0.2 1 0 24 0 0 15-17 Years 624 9.8 32 6 572 8 5 18-19 Years 1,454 32.6 135 14 1,241 32 25 Total Teen Births 2,103 168 20 1,837 40 30 Teen Birth Rate 19.2 4.5 12.9 38.1 2.3 N/A 2013 < 15 Years 18 0.2 1 0 17 0 0 15-17 Years 500 8.0 24 6 462 4 4 18-19 Years 1,283 29.2 130 11 1,085 33 24 Total Teen Births 1,783 154 17 1,547 37 24 Teen Birth Rate 16.7 4.2 11.4 32.8 2.2 N/A 2014 0.2 < 15 Years 11 7.3 0 0 11 0 0 15-17 Years 457 25.5 32 13 401 4 7 18-19 Years 1102 135 12 929 18 8 Total Teen Births 1,570 4.7 167 25 1341 22 15 Teen Birth Rate 14.8 17.4 28.6 1.3 N/A 2015 0.3 < 15 Years 17 5.8 1 0 16 0 0 15-17 Years 372 20.3 28 5 332 3 4 18-19 Years 987 105 10 837 27 8 Total Teen Births 1,376 134 15 1,185 30 12 Teen Birth Rate 12.0 3.5 9.0 23.7 1.6 N/A 2016 < 15 Years 9 0.4 1 0 8 0 0 15-17 Years 339 5.2 20 7 308 4 0 18-19 Years 872 18.3 100 20 738 13 1 Total Teen Births 1220 121 27 1054 17 1 Teen Birth Rate 10.9 2.9 16.3 21.1 0.9 N/A *Teen birth rate is expressed per 1,000 females 15-19 years of age. Population Source 2003-2009: State of California, Department of Finance, Race/Ethnic Population with Age and Sex Detail, 2000 -2010. Sacramento, CA, September 2012. Population Source 2010-2017: State of California, Department of Finance, Report P-3: State and County Population Projections by Race/Ethnicity, Detailed Age, and Gender, 2010-2060. Sacramento, California, February 2017. Source: Orange County Health Care Agency 104
Supplemental Tables: Good Health
32
Female Population Age 15-19* 2012 2013 2014 2015 2016 Rates per 1,000 Females 15-19 Aliso Viejo 1,704 7 9 7 6 7 4.1 Anaheim 12,077 453 381 342 308 259 21.4 Brea 1,154 7 5 8 12 6 5.2 Buena Park 2,294 76 57 63 55 37 16.1 Costa Mesa 2,859 49 65 51 46 52 18.2 Coto de Caza CDP 554 0 0 0 1 0 0 Cypress 1,840 12 10 8 9 6 3.3 Dana Point 747 8 8 6 7 12 16.1 Fountain Valley 1,448 6 8 10 13 5 3.5 Fullerton 5,236 94 104 87 75 67 12.8 Garden Grove 5,650 144 125 100 89 81 14.3 Huntington Beach 5,308 54 45 35 26 30 5.7 Irvine 10,460 14 12 13 10 12 1.1 La Habra 152 67 54 45 36 34 223.3 La Palma 464 4 1 3 1 1 2.2 Ladera Ranch CDP 722 1 0 3 2 0 0 Laguna Beach 672 2 2 2 0 0 0 Laguna Hills 1,012 6 11 6 6 5 4.9 Laguna Niguel 1,800 13 10 11 12 7 3.9 Laguna Woods 0 0 0 0 0 0 0 Lake Forest 2,630 29 26 22 14 20 7.6 Los Alamitos 487 4 4 0 2 2 4.1 Midway CDP 497 6 6 4 3 5 10.1 Mission Viejo 3,255 23 15 16 8 10 3.1 Newport Beach 2,211 6 2 4 4 0 0 Orange 5,544 118 87 76 75 67 12.1 Placentia 1,632 22 26 29 26 18 11 Rancho Santa Margarita 1,535 13 9 9 9 6 3.9 Rossmoor CDP 463 0 0 0 0 0 0 San Clemente 2,058 31 29 28 19 19 9.2 San Juan Capistrano 1,594 37 22 20 21 17 10.7 Santa Ana 12,582 611 510 432 361 346 27.5 Seal Beach 276 1 1 1 1 0 0 Stanton 1,486 30 30 23 23 13 8.7 Trabuco Canyon N/A N/A N/A N/A N/A 2 N/A Tustin 2,535 55 45 31 24 39 15.4 Villa Park 220 0 0 0 1 0 0 Westminster 2,989 48 40 35 30 22 7.4 Yorba Linda 2,326 5 5 8 8 3 1.3 Orange County Total 112,405 2,078 1,783 1,559 1,376 1,220 10.9 *Population source: U.S. Census Bureau, American Community Survey, Five Year Average Population, 2012-2016 Source: State of California, Center for Health Statistics, Birth Records. Prepared by: Orange County Health Care Agency 105
Number of Live Births, by Mothers Age 15 to 19 and Birth Rate per 1,000 Females, by City of Residence, 2012 to 2016
Supplemental Tables: Good Health
Secondary Indicator : SEXUALLY TRANSMITTED DISEASES
Definition
This indicator tracks the number of cases and annual case rates per 100,000 population of reportable sexually transmitted diseases (STDs) including chlamydia, gonorrhea, syphilis, and HIV/AIDS in children 10 to 17 years of age.
* Rates per 100,000 population; rates based on less than five events are unstable, and therefore should be interpreted with c aution. **Does not include congenital cases resulting from mother to child transmission.
1The rates before 2010 are calculated using the following population source: State of California, Department of Finance, Race/ Ethnic Population with Age and Sex Detail, 2000- 2050. Sacramento, California, July 2007. The rates since 2010 are calculated using the following population source: State of California, Department of Finance, Race/Ethnic Population with Age and Sex Detail, 2010-2060. Sacramento, California, December 2014.
Note: Recently the CA Department of Finance provided updated population estim ates in Race/Ethnic Population with Age and Sex Detail, 2010-2060. Sacramento, California, December 2014. Rates for years 2010-2013 have been adjusted accordingly and may differ to from rates computed in previous reports.
Source: Orange County Health Care Agency, Public Health Services, May 2018
xx 33
Number and STD Case Rates Per 100,000 Youth 10-17 Yea rs Old, by Type of Disease, 2008-2017 2008 2009 20101 20111 20121 Type of STD** Number Rate* Number Rate Number Rate Number Rate Number Rate Chlamydia 751 207.5 748 209.2 670 194.8 724 210.2 675 196.5 Gonorrhea 39 10.8 25 7.0 38 11.0 35 10.2 49 14.3 Syphilis 4 1.1* 2 0.6* 2 0.6* 1 0.3* 2 0.6* HIV/AIDS 2 0.6* 4 1.1* 0 0.0 4 1.2* 1 0.3* Population 361,899 357,637 343,986 344,368 343,543 20131 20141 20151 20161 20171 Type of STD** Number Rate Number Rate Number Rate Number Rate Number Rate Chlamydia 563 164.1 621 181.0 648 190.8 696 204.9 697 205.3 Gonorrhea 56 16.3 72 21.0 67 19.7 95 28.0 111 32.7 Syphilis 9 2.6 14 4.1 9 2.6 3 0.9* 0 0.0 HIV/AIDS 1 0.3* 2 0.6* 3 0.9* 4 1.2* 1 0.3 Population 343,067 341,370 339,651 339,267 339,480
106
Supplemental Tables: Good Health
*Does not include congenital cases resulting from mother to child transmission
34
Number of STD's Among Youth 10-17 Years of Age, by Gender and Type of Disease, 2008-2017 Type of STD* 2008 2009 2010 2011 2012 2013 2014 2015 2016 2017 Chlamydia Male 147 151 121 162 134 129 136 123 155 159 Female 603 593 548 561 540 434 485 522 539 535 Unknown 1 4 1 1 1 0 0 3 2 3 Total 751 748 670 724 675 563 621 648 696 697 Gonorrhea Male 11 17 12 13 15 20 27 23 32 43 Female 28 8 25 22 33 36 44 44 63 67 Unknown 0 0 1 0 1 0 1 0 0 1 Total 39 25 38 35 49 56 72 67 95 111 Syphilis Male 2 0 0 0 2 6 10 7 2 0 Female 2 2 2 1 0 3 4 2 1 0 Unknown 0 0 0 0 0 0 0 0 0 0 Total 4 2 2 1 2 9 14 9 3 0 HIV/AIDS Male 2 4 0 3 0 1 2 3 4 1 Female 0 0 0 1 1 0 0 0 0 0 Unknown 0 0 0 0 0 0 0 0 0 0 Total 2 4 0 4 1 1 2 3 4 1
Source: Orange County Health Care Agency, Public Health Services, May 201 8 107
Supplemental Tables: Good Health
* Rates per 100,000 population; rates based on less than five events are unstable, and therefore should be interpreted with caution.
**Does not include congenital cases resulting from mother to child transmission.
1The rates before 2010 are calcu lated using the following population source: State of California, Department of Finance, Race/Ethnic Population with Age and Sex Detail, 2000- 2050. Sacramento, California, July 2007. The rates since 2010 are calculated using the following population sourc e: State of California, Department of Finance, Race/Ethnic Population with Age and Sex Detail, 2010 -2060. Sacramento, California, February 2017
Note: Recently the CA Department of Finance provided updated population estimates in Race/Ethnic Population with Age and Sex Detail, 2010-2060. Sacramento, California, February 2017 Rates for years 2010-2015 have been adjusted accordingly and may differ to from rates computed in previous reports.
Source: Orange County Health Care Agency, Public Health Services, May 2018
xx 35
Number and STD Case Rates* per 100,000 Youth, By Age Group and Type of Disease, 2008-2017 2008 2009 20101 20111 20121 Type of STD** Number Rate Number Rate Number Rate Number Rate Number Rate Chlamydia 10-14 years 40 18.2 52 24.0 27 12.8 50 23.8 29 13.9 15-17 years 711 501.8 696 492.6 643 483.2 674 503.4 646 480.4 Gonorrhea 10-14 years 4 1.8* 0 0.0 1 0.5* 2 1.0* 2 1.0* 15-17 years 35 24.7 25 17.7 37 27.8 33 24.6 47 34.9 Syphilis 10-14 years 0 0.0 1 0.5* 0 0.0 0 0.0 0 0.0 15-17 years 4 2.8* 1 0.7* 2 1.5* 1 0.7* 2 1.5* HIV/AIDS 10-14 years 0 0.0 0 0.0 0 0.0 0 0.0 1 0.5* 15-17 years 2 1.4* 5 3.5 1 0.8* 4 3.0* 0 0.0 10-14 Total Cases 44 20.0 53 24.5 28 13.3 52 24.7 32 15.3 15-17 Total Cases 752 530.8 727 514.5 683 513.2 712 531.8 695 516.8 10 - 17 Total Cases 796 220.0 780 218.1 711 206.7 764 221.9 727 211.6 20131 20141 20151 20161 20171 Type of STD** Number Rate Number Rate Number Rate Number Rate Number Rate Chlamydia 10-14 years 25 12.0 27 12.9 23 11.1 35 16.9 35 16.8 15-17 years 538 401.3 594 447.2 625 473.3 661 499.1 662 505.0 Gonorrhea 10-14 years 2 1.0* 4 1.9* 6 2.9 7 3.4 9 4.3 15-17 years 54 40.3 68 51.2 61 46.2 88 66.4 102 77.8 Syphilis 10-14 years 1 0.5* 0 0.0 0 0.0 0 0.0 0 0.0 15-17 years 8 6.0 14 10.5 9 6.8 3 2.3* 0 0.0 HIV/AIDS 10-14 years 0 0.0 0 0.0 0 0.0 0 0.0 0 0.0 15-17 years 2 1.5* 3 2.3* 3 2.3* 4 3.0* 1 0.8 10-14 years Total Cases 28 13.4 31 14.9 29 14.0 42 20.3 44 21.1 15-17 years Total Cases 602 449.0 679 511.2 698 528.6 756 570.8 765 583.6 10 - 17 Total Cases 630 183.6 710 208.0 727 214.0 798 235.2 809 238.3
108
Supplemental Tables: Good Health
Source: Orange County Health Care Agency/Children and Youth Behavioral Health
Note: Since FY04/05 visit count adjusted to exclude clinical documentation activities. Data is no longer available in 2012/13 because state legislation moved the responsibility of providing mental health services for special education students to school districts during 2011/12.
Source: Orange County Health Care Agency, Children and Youth Behavioral Health
*The data provided is for children and adults through the age of 25
Source: Orange County Health Care Agency/Children and Youth Behavioral Health
36
Indicator: BEHAVIORAL HEALTH Number of Children and Young Adults through Age 25 Served by Children and Youth Behavioral Health, 2007/08 to 201 6/17 Outpatient (Visit) 2007/08 2008/09 2009/10 2010/11 2011/12 2012/13 2013/14 2014/15 2015/16 2016/17 Number of Children and Young Adults 12,552 12,864 13,006 14,431 14,918 14,830 15,257 15,029 14,624 15,019 Source: Orange County Health Care Agency/Children and Youth Behavioral Health Number of Clients Served by Children and Youth Behavioral Health, by Race/Ethnicity, 2008/09 to 2016/17 Race/Ethnicity 2008/09 2009/10 2010/11 2011/12 2012/13 2013/14 2014/15 2015/16 2016/17 Percent Change White 3,589 3,463 3,534 3,616 3,648 3,570 2,876 2,670 2,482 -30.8 Black 696 651 693 702 641 626 514 511 537 -22.8 Hispanic 7,144 7,504 8,690 9,099 9,217 9,599 10,422 10,177 10,599 42.5 Asian 713 682 785 700 696 859 778 816 878 23.1 American Indian 158 162 145 124 80 58 41 36 38 -75.9 Other/Unknown 564 544 584 677 548 545 218 196 201 -64.4 Total 12,864 13,006 14,431 14,918 14,830 15,257 15,029 14,624 15,019 16.8
Number of Services, by Type of Outpatient Program, 2007/08 to 2016/17 Outpatient (Visit) 2007/08 2008/09 2009/10 2010/11 2011/12 2012/13 2013/14 2014/15 2015/16 2016/17 Special Education (Community Based) 65,343 60,864 55,881 37,435 25,335 n/a n/a n/a n/a n/a Wards & Dependents 127,175 137,613 120,002 115,999 109,580 97,334 87,439 81,483 79,419 81,396 Other (CommunityBased) 194,638 213,615 256,496 306,331 281,450 294,615 309,259 305,374 287,804 299,878 Total 387,156 412,092 432,379 459,765 416,365 391,949 396,698 387,064 367,429 381,404
Number of Bed Days, by Type of Inpatient Placements, 200 7/08 to 2016/17 Inpatient 2007/08 2008/09 2009/10 2010/11 2011/12 2012/13 2013/14 2014/15 2015/16 2016/17 State Hospital 0 0 0 0 0 0 0 0 0 0 Acute Hospital (Unfunded) 566 497 386 547 440 637 560 299 245 230 Acute Hospital (Medi -Cal) 2,131 2,304 3,016 3,164 3,049 3,857 5,529 4,364 5,471 6,904 Residential Placement (Sp Ed) 58,573 52,610 49,503 41,677 27,654 17,513 10,323 4,451 4,680 5,645 Total 60,270 55,411 52,905 45,388 31,143 22,007 16,412 9,114 10,396 12,779
109
Supplemental Tables: Good Health
Secondary Indicator : SUBSTANCE ABUSE SERVICES
Definition
This indicator tracks the number and percent of adolescents receiving substance abuse services provided by the Orange County Health Care Agency’s (HCA) Alcohol and Drug Abuse Services (ADAS). This indicator reflects the trend of adolescent utilization of services provided by ADAS and its contract providers rather than the absolute number of adolescents needing services or using alcohol or other drugs in Orange County.
Number of Children and Young Adults through Age 25 Served by Children and Youth Behavioral Health, 2007/08 to 201 6/17
xx 37
Year Outpatient Residential Total 2007/08 Number 315 145 460 Percent 68.5% 31.5% 100% 2008/09 Number 317 236 553 Percent 57.3% 42.7% 100% 2009/10 Number 156 56 212 Percent 73.6% 26.4% 100% 2010/11 Number 256 323 5791 Percent 44.2% 55.8% 100% 2011/12 Number 183 288 4712 Percent 38.9% 61.1% 100% 2012/13 Number 245 95 3403 Percent 72.0% 28.0% 100% 2013/14 Number 219 62 281 Percent 78.0% 22.0% 100% 2014/15 Number 178 57 235 Percent 76.0% 24.0% 100% 2015/16 Number 201 61 262 Percent 77.0% 23.0% 100% 2016/17 Number 197 86 283 Percent 70.0% 30.0% 100% 1. Total does not include 215 adolescents counted from Youth Guidance Center 2. Total does not include 198 adolescents counted from Youth Guidance Center 3. Total does not include 28 adolescents counted from Youth Guidance Center Source: Orange County Health Care Agency 110
Supplemental Tables: Good Health
*Total does not include adolescents who received specialized education, prevention, linkage and referral services in connection with the Probation Department and/or the Youth Guidance Center.
Source: Orange County Health Care Agency
38
Substance Abuse Services: Number and Percent, by Discharge Status, 2007/08 to 2016/17 Year Completed Treatment Left with Satisfactory Progress Left with Unsatisfactory Progress Referred/ Transferred Total 2007/08 Number 52 32 160 N/A 244 Percent 21.3% 13.1% 65.6% N/A 100% 2008/09 Number 143 68 316 N/A 527 Percent 27.1% 12.9% 60.0% N/A 100% 2009/10 Number 53 27 102 65 247 Percent 21.5% 10.9% 41.3% 26.3% 100% 2010/11 Number 104 68 106 111 389 Percent 26.7% 17.5% 27.2% 28.5% 100% 2011/12 Number 72 89 212 122 495 Percent 14.5% 18.0% 42.8% 24.6% 100% 2012/13* Number 49 42 186 72 349 Percent 14.0% 12.0% 53.3% 20.6% 100% 2013/14 Number 37 19 147 32 235 Percent 15.7% 8.1% 62.6% 13.6% 100% 2014/15 Number 18 21 125 40 204 Percent 8.8% 10.3% 61.3% 19.6% 100% 2015/16 Number 7 50 191 116 364 Percent 1.9% 13.7% 52.5% 31.9% 100% 2016/17 Number 10 21 145 44 220 Percent 4.5% 9.5% 65.9% 20.0% 100%
111
Supplemental Tables: Good Health
*Includes inhalants, amphetamines, sedatives, stimulants, and over the counter drugs guidance Center; Source: Orange County Health Care Agency
xx 39
Number and Percent of Adolescents Receiving Substance Abuse Services, by Drug of Choice and Age, 2007/08 to 201 6/17 Year Age Alcohol Methamphetamine Cocaine Marijuana PCP/ Hallucinogen Heroin Other* Total 2007/08 Under 13 1 1 0 1 0 0 0 3 13-14 10 11 0 44 1 0 6 72 15-17 51 90 16 314 3 2 17 493 Total 62 102 16 359 4 2 23 568 Percent 10.90% 18.00% 2.80% 63.20% 0.70% 0.40% 4% 100% 2008/09 Under 13 0 0 0 0 0 0 0 0 13-14 3 2 0 27 2 12 0 46 15-17 45 122 14 273 5 37 11 507 Total 48 124 14 300 7 49 11 553 Percent 8.70% 22.40% 2.50% 54.20% 1.30% 8.90% 2.50% 100% 2009/10 Under 13 0 0 0 2 0 0 0 2 13-14 years 5 5 0 34 0 0 7 51 15-17 years 28 33 1 150 0 13 16 241 Total 33 38 1 186 0 13 23 294 Percent 11.20% 12.90% 0.30% 63.20% 0% 4.40% 7.80% 100% 2010/11 Under 13 0 0 0 2 0 0 0 2 13-14 years 7 4 1 48 3 2 2 67 15-17 years 28 38 4 186 17 33 6 312 Total 35 42 5 236 20 35 6 381 Percent 9.20% 11% 1.30% 61.90% 5.20% 9.20% 1.60% 100% 2011/12 Under 13 years 0 0 0 1 0 0 0 1 13-14 years 5 3 0 25 0 0 2 35 15-17 years 26 46 4 178 0 27 16 297 Total 31 49 4 204 0 27 18 333 Percent 9.30% 14.70% 1.20% 61.20% 0 8.10% 5.40% 100% 2012/13 Under 13 years 0 1 0 6 0 0 0 7 13-14 years 8 8 0 36 0 3 1 56 15-17 years 20 61 4 164 0 23 5 277 Total 28 70 4 206 0 26 6 340 Percent 8.20% 20.60% 1.20% 60.60% 0% 7.60% 1.80% 100% 2013/14 Under 13 years 0 0 0 0 0 0 0 0 13-14 years 1 1 0 17 0 0 0 19 15-17 years 21 50 0 178 0 8 5 262 Total 22 51 0 195 0 8 5 281 Percent 8% 18% 0% 69% 0% 3% 2% 100% 2014/15 Under 13 years 0 0 0 0 0 0 0 0 13-14 years 1 1 0 13 0 0 0 15 15-17 years 12 39 1 158 1 3 6 220 Total 13 40 1 171 1 3 6 235 Percent 6% 17% 0% 73% 0% 1% 3% 100% 2015/16 Under 13 years 0 0 0 1 0 0 0 1 13-14 years 1 3 0 23 0 0 0 27 15-17 years 14 44 1 165 0 4 6 234 Total 15 47 1 189 0 4 6 262 Percent 6% 18% 0% 72% 0% 2% 2% 100% 2016/17 Under 13 years 0 0 0 0 0 0 0 0 13-14 years 1 3 0 18 0 0 1 23 15-17 years 20 60 3 166 0 1 10 260 Total 21 63 3 184 0 1 11 283 Percent 7% 22% 1% 65% 0% 0% 4% 100%
112
Supplemental Tables: Good Health
40
Number and Percent of Adolescents Receiving Treatment Services, by Race/Ethnicity and Gender, 2007/08 to 2016/17 Race/Ethnicity Year Gender White Hispanic Black American Indian Asian Other Total 2007/08 Male 126 240 13 2 18 17 416 Female 64 81 1 0 3 3 152 Total 190 321 14 2 21 20 568 Percent 33.5% 56.5% 2.5% 0.4% 3.7% 3.5% 100% 2008/09 Male 157 209 7 2 11 12 398 Female 79 65 3 3 4 1 155 Total 236 274 10 5 15 13 553 Percent 42.7% 49.5% 1.8% 0.9% 2.7% 2.4% 100% 2009/10 Male 56 132 3 1 3 11 206 Female 23 58 1 1 3 2 88 Total 79 190 4 2 6 13 294 Percent 26.8% 64.6% 1.3% 0.6% 2.0% 4.4% 100% 2010/11 Male 110 133 7 0 10 3 263 Female 52 59 2 0 5 0 118 Total 162 192 9 0 15 3 381 Percent 42.5% 50.4% 2.4% 0.0% 3.9% 0.1% 100% 2011/12 Male 152 141 4 4 6 69 235 Female 61 50 2 0 3 32 98 Total 213 191 6 4 9 101 333 Percent 40.6% 36.5% 1.1% 0.8% 1.7% 19.3% 100% 2012/13* Male 87 171 2 0 6 141 236 Female 52 69 1 1 3 47 104 Total 139 240 3 1 9 188 340 Percent 24.0% 41.4% 0.5% 0.2% 1.6% 32.4% 100% 2013/14* Male 78 142 5 4 5 100 334 Female 44 59 3 0 1 41 148 Total 122 201 8 4 6 141 281 Percent 25.3% 41.7% 1.7% 0.8% 1.2% 29.3% 100% 2014/15 Male 65 121 7 1 4 83 281 Female 38 56 2 0 0 35 131 Total 103 177 9 1 4 118 235 Percent 25.0% 43.0% 2.2% 0.2% 1.0% 28.6% 100% 2015/16 Male 51 138 5 0 6 114 314 Female 34 62 1 1 2 48 148 Total 85 200 6 1 8 162 262 Percent 18.4% 43.3% 1.3% 0.2% 1.7% 35.1% 100% 2016/17 Male 48 150 5 1 4 130 338 Female 18 80 2 0 1 74 175 Total 66 230 7 1 5 204 513 Percent 12.9% 44.8% 1.4% 0.2% 1.0% 39.8% 100% *Hispanic or Latino were not excluded from other races and therefore the data cannot be compared to prior years. Source: Orange County Health Care Agency 113
Supplemental Tables: Good Health
*Total does not include youth who received specialized education, prevention, linkage & referral services in connection with t he Probation Department and/or the Youth Guidance Center Source: Orange County Health Care Agency
xx 41
and Percent of Referrals to Substance Abuse Treatment, by Source, 200 7/08 to 2016/17 Year School Family/ Self Legal System Health Care Programs Other Community Referral Total 2007/08 Number 19 246 179 7 11 462 Percent 4.1% 53.3% 38.7% 1.5% 2.4% 100% 2008/09 Number 12 218 261 37 25 553 Percent 2.2% 39.4% 47.2% 6.7% 4.5% 100% 2009/10 Number 11 137 102 1 43 294 Percent 3.7% 46.6% 34.7% 0.3% 14.6% 100% 2010/11 Number 17 146 153 10 55 381 Percent 4.5% 38.3% 40.2% 2.6% 14.4% 100% 2011/12* Number 14 136 112 16 55 333 Percent 4.2% 40.8% 33.6% 4.8% 16.5% 100% 2012/13* Number 31 104 137 37 15 324 Percent 10% 32% 42% 11% 5% 100% 2013/14* Number 19 64 124 22 52 281 Percent 7% 23% 44% 8% 19% 100% 2014/15 Number 9 77 95 9 45 235 Percent 4% 33% 40% 4% 19% 100% 2015/16 Number 9 81 80 18 74 262 Percent 3% 31% 31% 7% 28% 100% 2016/17 Number 14 63 128 10 68 283 Percent 5% 22% 45% 4% 24% 100%
Number
114
Supplemental Tables: Good Health
Supplemental Tables: conomic Well-Being
Secondary Indicator: CHILDHOOD LEAD POISONING
42
Number of Individual Children Ages 0-20 Years with Elevated Blood Lead Levels (4.5mcg/dL or higher), 2007-2016 Year 2007¹ 2008¹ 2009¹ 2010¹ 2011¹ 2012¹ 2013¹ 2014¹ 2015¹ 2016² Individual children ages 0-5 years of age with BLL above reference value of ≥4.5mcg/dL 1,860 1,531 1,597 1,186 1,207 963 720 549 465 652 Individual children ages 6-20 years of age with BLL above reference value of ≥4.5mcg/dL 351 283 320 285 312 202 135 240 72 113 Total individual children with BLL above reference value of ≥4.5mcg/dL 2,211 1,814 1,917 1,471 1,519 1,165 855 789 537 765 1 Source: California Department of Public Health, Childhood Lead Poisoning Prevention Branch (CLPPB) data – published data on CLPPB’s website as of 7/2018 ² Provisional data subj ect to revision (numbers from State’s Data Compact Disc counted by Orange County Childhood Lead Poisoning Prevention Program) 115

Supplemental Tables: conomic Well-Being Supplemental Tables: Economic Wellbeing
Indicator: CHILD POVERTY
44
Percent of Children Under 18 Years Old, Living in Poverty, and Families Living in Poverty , Orange County and California, 2007 to 2016 Year <18 Living in Poverty (%) Families in Poverty (%) 2007 Orange County 12.0 6.1 California 17.3 9.3 2008 Orange County 13.3 6.8 California 18.5 10.0 2009 Orange County 15.2 6.7 California 19.9 9.8 2010 Orange County 12.2 7.1 California 15.8 10.2 2011 Orange County 17.7 7.6 California 22.8 10.8 2012 Orange County 16.0 8.3 California 21.3 11.5 2013 Orange County 16.9 8.8 California 22.1 12.0 2014 Orange County 17.6 9.2 California 22.7 12.3 2015 Orange County 17.6 9.1 California 22.5 12.2 2016 Orange County 16.9 8.7 California 21.9 11.8 Source: U.S. Census Bureau, American Community Survey, five year estimates. 117
Supplemental Tables: conomic Well-Being Supplemental Tables: Economic Wellbeing
xx 45
Number and Percent of Students Eligible to Receive Free and Reduced Price Lunch, By District, 2017/18
Orange County Department of Education Elementary Districts No. % Anaheim Elementary 15,410 85.4% Buena Park 3,533 72.6% Centralia 2,536 59.1% Cypress Elementary 1,405 39.8% Fountain Valley Elementary 1,585 24.3% Fullerton Elementary 5,009 40.1% Huntington Beach City Elementary 1,406 23.4% La Habra City 3,550 71.4% Magnolia 5,136 82.7% Ocean View 3,857 51.2% Savanna 1,657 61.3% Westminster 6,625 70.7% High School Districts No. % Anaheim Union High 22,147 70.6% Fullerton Joint Union High 6,924 52.2% Huntington Beach Union High 6,038 38.0% Unified Districts No. % Brea-Olinda Unified 1,804 32.6% Capistrano Unified 13,930 28.3% Garden Grove Unified 30,711 71.2% Irvine Unified 6,535 19.6% Laguna Beach Unified 358 12.3% Los Alamitos Unified 1,648 18.3% Newport-Mesa Unified 9,410 47.4% Orange Unified 13,242 51.2% Placentia-Yorba Linda Unified 9,410 37.1% Saddleback Valley Unified 8,392 33.6% Santa Ana Unified 42,729 83.1% Tustin Unified 9,662 41.7% County Totals 234,649 50.7% 118
Source:
Supplemental Tables: conomic Well-Being Supplemental Tables: Economic Wellbeing
Indicator: CALIFORNIA WORK OPPORTUNITY & RESPONSIBILITY TO KIDS (CALWORKS)
46
Number of Children Receiving Financial Assistance Countywide, 2007/08 to 2016/17 2007/08 2008/09 2009/10 2010/11 2011/12 2012/13 2013/14 2014/15 2015/16 2016/17 Receiving CalWORKs 31,932 35,962 42,793 46,809 45,950 43,916 42,877 42,345 38,982 34,485 Note: Average monthly number of OC children receiving CalWORKs by Fiscal Year Source: Orange County Social Services Agency 119
Supplemental Tables: conomic Well-Being Supplemental Tables: Economic Wellbeing
*City Populations Under 18 from 201122-201526 American Community Survey 5-Year Estimates, Demographic and Housing Estimates. 201122-201526 American Community Survey estimates no population under 18 in Laguna Woods. Source: Orange County Social Services Agency
xx 47
CalWORKs Recipients: Children by Age and City, January 2018 City <1 1 2 3 4 5 6 7 8 Aliso Viejo 3 7 4 5 7 1 7 5 10 Anaheim 283 389 382 421 392 458 392 441 482 Brea 5 8 7 8 9 10 10 8 8 Buena Park 46 58 68 65 54 66 61 59 76 Costa Mesa 34 31 38 45 31 38 41 53 42 Cypress 25 39 37 35 44 32 37 38 38 Dana Point 2 5 5 5 5 7 3 6 7 Fountain Valley 8 12 10 20 12 6 12 10 11 Fullerton 58 65 76 76 93 93 61 95 85 Garden Grove 86 127 101 129 113 112 113 120 151 Huntington Beach 43 48 44 64 63 47 69 57 47 Irvine 30 25 42 27 25 37 28 36 47 La Habra 29 35 44 42 35 48 39 51 48 La Palma 0 6 3 1 4 3 4 2 5 Laguna Beach 0 2 0 0 0 2 1 4 0 Laguna Hills 10 10 14 9 11 15 11 14 17 Laguna Niguel 5 7 14 11 12 10 13 4 13 Laguna Woods* 0 0 0 1 0 0 0 0 0 Lake Forest 21 27 22 22 18 20 23 28 28 Los Alamitos 4 1 3 4 7 6 4 6 8 Mission Viejo 10 16 9 13 12 14 17 18 10 Newport Beach 3 6 3 2 6 2 3 3 1 Orange 46 66 60 70 62 65 77 71 68 Placentia 22 34 23 28 36 22 35 31 42 Rancho Santa Margarita 4 8 5 3 3 3 2 6 2 San Clemente 7 12 13 7 12 12 9 13 13 San Juan Capistrano 2 10 11 4 12 10 11 8 16 Santa Ana 241 319 384 373 388 409 445 460 480 Seal Beach 0 1 1 2 1 5 1 3 2 Stanton 21 20 28 35 41 33 37 33 46 Tustin 23 37 40 37 40 38 35 43 41 Villa park 0 1 1 0 0 1 2 0 0 Westminster 44 50 50 51 55 61 47 52 44 Yorba Linda 5 11 8 7 13 11 11 8 7 Cities Subtotal 1,120 1,493 1,550 1,622 1,616 1,697 1,661 1,786 1,895 Unincorporated Areas Coto de Caza 0 0 0 0 0 0 0 0 0 Ladera Ranch 2 2 1 1 1 0 1 0 0 Midway City 7 1 2 6 5 9 5 7 8 North Tustin 0 0 0 1 0 0 0 0 0 Rossmoor 1 0 1 0 0 0 0 0 0 Silverado Canyon 0 0 1 0 0 0 1 0 1 Trabuco Canyon 3 1 0 1 0 2 0 0 1 Unincorporated Subtotal 13 4 5 9 6 11 7 7 10 Unassigned Subtotal 41 36 30 40 30 25 16 31 17 Total by Age 1,174 1,533 1,585 1,671 1,652 1,733 1,684 1,824 1,922 Percent by Age 3.8 5.0 5.1 5.4 5.4 5.6 5.5 5.9 6.2
120
Supplemental Tables: conomic Well-Being Supplemental Tables: Economic Wellbeing
CalWORKs Recipients: Children by Age and City, January 2018 (Continued)
48
City 9 10 11 12 13 14 15 16 17 Subtotal Aliso Viejo 6 9 3 5 5 3 8 6 2 96 Anaheim 509 437 490 432 393 416 365 358 309 7,349 Brea 7 12 14 5 6 14 8 8 8 155 Buena Park 65 70 63 67 55 52 58 41 48 1,072 Costa Mesa 50 53 64 34 50 35 47 31 40 757 Cypress 30 36 37 36 33 24 24 25 29 599 Dana Point 5 9 4 9 2 2 4 4 3 87 Fountain Valley 9 17 11 20 13 16 10 16 12 225 Fullerton 96 94 104 65 78 70 57 59 48 1,373 Garden Grove 124 146 152 145 117 130 129 116 110 2,221 Huntington Beach 58 65 60 66 39 48 36 42 56 952 Irvine 49 36 44 40 44 43 31 41 37 662 La Habra 66 51 63 40 41 39 35 32 40 778 La Palma 6 4 2 1 1 1 3 0 2 48 Laguna Beach 2 0 2 5 1 2 1 1 0 23 Laguna Hills 17 8 19 14 13 11 15 12 10 230 Laguna Niguel 23 10 17 11 7 12 10 13 6 198 Laguna Woods* 0 0 0 0 2 1 0 0 0 4 Lake Forest 24 32 30 22 22 19 15 20 14 407 Los Alamitos 1 3 4 4 2 8 2 3 1 71 Mission Viejo 14 20 17 13 21 12 15 15 12 258 Newport Beach 3 10 6 6 5 3 2 7 7 78 Orange 86 86 82 79 84 66 70 58 52 1,248 Placentia 39 30 35 25 32 32 27 33 26 552 Rancho Santa Margarita 4 2 4 5 3 6 7 4 5 76 San Clemente 7 10 10 13 12 11 10 14 7 192 San Juan Capistrano 19 15 19 16 18 9 12 11 5 208 Santa Ana 561 566 574 526 476 430 381 408 371 7,792 Seal Beach 1 1 0 1 1 5 3 2 1 31 Stanton 41 37 36 31 43 30 33 35 32 612 Tustin 58 59 34 56 68 52 48 55 29 793 Villa park 0 0 1 0 1 0 0 0 0 7 Westminster 54 68 55 66 67 48 57 48 39 956 Yorba Linda 11 6 8 9 3 10 7 9 8 152 Cities Subtotal 2,045 2,002 2,064 1,867 1,758 1,660 1,530 1,527 1,369 30,262 Unincorporated Areas Coto de Caza 0 0 0 0 0 0 0 0 0 0 Ladera Ranch 2 0 2 1 2 0 0 0 2 17 Midway City 7 10 6 13 4 4 4 9 7 114 North Tustin 0 0 0 0 0 0 0 0 0 1 Rossmoor 0 0 0 0 0 0 0 0 0 2 Silverado Canyon 0 0 0 0 1 0 0 1 0 5 Trabuco Canyon 1 2 1 1 2 4 0 3 0 22 Unincorporated Subtotal 10 12 9 15 9 8 4 13 9 161 Unassigned Subtotal 20 15 19 19 16 21 14 17 7 414 Total by Age 2,075 2,029 2,092 1,901 1,783 1,689 1,548 1,557 1,385 30,837 Percent by Age 6.7 6.6 6.8 6.2 5.8 5.5 5.0 5.0 4.5 100.0 121
Supplemental Tables: conomic Well-Being Supplemental Tables: Economic Wellbeing
Indicator: HOMELESS STUDENTS
xx 49
Homeless Children and Youth, by School District, 2007/08 TO 2016/17 Elementary Districts 2007/08 2008/09 2009/10 2010/11 2011/12 2012/13 2013/14 2014/15 2015/16 2016/17 Anaheim Elementary 3,259 4,029 3,983 1,870 1,410 1,355 2,065 2,210 2,242 2,076 Buena Park 841 972 1,151 1,280 1,112 1,022 593 201 281 313 Centralia 519 651 529 685 660 673 719 428 615 593 Cypress 13 4 3 59 95 127 240 353 445 435 Fountain Valley - - 4 4 4 1 3 7 12 14 Fullerton 103 114 144 131 428 309 234 163 173 176 Huntington Beach City 7 2 13 15 30 24 25 36 41 60 La Habra City 255 271 286 162 110 6 7 30 59 63 Magnolia 1,087 1,178 1,220 1,438 1,453 1,503 1,809 1,732 1,870 1,980 Ocean View 313 443 403 196 122 92 130 129 261 672 Savanna 72 70 345 315 356 418 345 294 289 299 Westminster 798 1,573 1,582 1,731 522 1,797 1,238 906 1,019 1,012 High School Districts Anaheim Union 172 191 2,197 2,467 3,732 4,352 4,272 4,145 3,138 2,863 Fullerton Joint 246 351 520 612 404 438 337 444 382 348 Huntington Beach Union 314 389 388 390 283 249 349 362 369 496 Unified Districts Brea-Olinda 6 10 14 52 55 42 37 12 16 27 Capistrano 1,508 3,030 3,533 3,566 2,244 2,657 3,060 2,574 2,681 1,890 Garden Grove 241 931 961 2,123 2,326 2,156 1,943 1,002 969 760 Irvine 31 77 172 128 155 121 172 127 58 90 Laguna Beach 7 5 4 11 0 5 5 2 19 13 Los Alamitos 15 18 30 26 18 15 8 5 32 37 Newport-Mesa 115 138 146 211 344 320 205 147 152 108 OCDE-ACCESS 125 132 249 610 1,561 1,854 1,709 231 1,503 1,282 Orange 120 137 126 172 243 262 213 216 270 326 Placentia-Yorba Linda 28 220 346 701 614 817 2745 2,977 3,555 2,841 Saddleback Valley 6 19 31 30 760 935 1510 574 680 600 Santa Ana 6,731 6,815 7,357 8,738 9,136 8,492 8,105 6,507 6,997 7,306 Tustin 60 245 259 349 418 500 249 250 322 439 Total Homeless Students 17,051 22,025 25,996 28,072 28,625 30,542 32,510 26,064 28,450 27,119 Homeless % of Total Students 3.4% 4.4% 5.2% 5.6% 5.7% 6.1% 6.50% 5.2% 5.8% 5.5% Note: Information provided by districts on their LEA Reporting Form Title 1, Part A, and Homeless Education Consolidated Appl ication submitted to California Department of Education Source: Orange County Department of Education 122
Supplemental Tables: conomic Well-Being Supplemental Tables: Economic Wellbeing
50
Primary Nighttime Residency of Homeless Students, 2007/0 8 to 2016/17 Primary Nighttime Residency: 2007/08 2008/09 2009/10 2010/11 2011/12 2012/13 2013/14 2014/15 2015/16 2016/17 Shelters 385 441 667 928 1,034 1,621 1,730 1,232 1,254 1,055 Doubledup/Tripled-up 15,817 20,549 24,114 26,084 26,113 27,491 29,300 23,533 25,545 24,274 Unsheltered 60 143 170 106 155 195 241 247 315 367 Hotels/Motels 0 892 1,078 973 1,323 1,235 1,239 1,052 1,336 1,423 Unknown 789 0 n/a n/a n/a n/a n/a n/a n/a n/a Total 17,051 22,025 26,029 28,091 28,625 30,542 32,510 26,064 28,450 27,119 Source: California Department of Education Homeless High School Students 9th to 12th Grade, 2016/17 District Grade 9 Grade 10 Grade 11 Grade 12 Total H.S. Homeless % of Total OC Homeless Students ACCESS/OCDE 209 376 375 364 1,324 4.9 Anaheim Union 217 265 767 841 2,090 7.7 Brea-Olinda Unified N/A N/A N/A N/A 0 0.0 Capistrano Unified 123 138 114 110 485 1.8 Fullerton Joint Union 70 87 111 91 359 1.3 Garden Grove 65 88 73 108 334 1.2 Huntington Beach Union 71 109 143 195 518 1.9 Irvine Unified 9 12 8 8 37 0.1 Laguna Beach Unified N/A N/A N/A N/A 0 0.0 Los Alamitos N/A N/A N/A N/A 0 0.0 Newport-Mesa Unified N/A N/A N/A N/A 0 0.0 Orange Unified 19 27 24 23 93 0.3 Placentia-Yorba Linda 199 188 171 167 725 2.7 Saddleback Valley 42 43 39 42 166 0.6 Santa Ana Unified 654 740 705 632 2,731 10.1 Tustin Unified 34 35 35 42 146 0.5 H.S. TOTAL 1,712 2,108 2,565 2,623 9,008 33.2 OC TOTAL 27,119 Source: Abridged from California Department of Education Consolidated Report, 2016/17 123
Supplemental Tables: conomic Well-Being Supplemental Tables: Economic Wellbeing
Indicator: SUPPLEMENTAL NUTRITION PROGRAMS
Number of Participants Served by the WIC Program, 2007/08 to 2016/17
*Participation is based on the number of women, infants and children served during the month of September by the four WIC agencies serving Orange County.
**Caseload is based on the combined caseload allocations for the four WIC agencies serving Orange County.
Sources: Orange County Health Care Agency/Nutrition Services-WIC Program
Camino Health Center-WIC Program
Planned Parenthood of Orange and San Bernardino Counties-WIC Program PHFE Management Solutions-WIC Program
CalFresh Recipients, 2007/08 to 2016/17
*California Department of Finance (DOF) county population estimates for
based on
estimates were used through
thereafter. Source: Orange County Social Services Agency
xx 51
Participants 2007/08 2008/09 2009/10 2010/11 2011/12 2012/13 2013/14 2014/15 2015/16 2016/17 Number of participants* 117,188 104,622 100,434 103,563 98,219 92,303 87,408 78,856 71,367 61,406 Caseload Allocation** 106,883 107,668 105,621 111,051 105,417 104,075 106,909 102,726 90,331 83,127 Percent of Caseload Served 109.9 97.2 95.1 93.3 93.2 88.7 81.8 76.8 79.0 73.9
2007/08 2008/09 2009/10 2010/11* 2011/12 2012/13 2013/14 2014/15 2015/16 2016/17 Number of Recipients 88,284 109,491 150,141 185,489 213,919 230,964 247,517 258,676 263,556 232,689 Percent Change (from Prior Year) 7.5% 24.0% 37.1% 23.5% 15.3% 8.0% 7.2% 4.5% 1.9% -11.7% Recipients less than 18 on CalFresh 60,793 74,127 98,259 116,978 130,263 136,835 141,688 141,716 140,410 131,670 Percent Change (from Prior Year) 7.7% 21.9% 32.6% 19.1% 11.4% 5.0% 3.5% 0.02% -0.92% -6.2% Percent of CalFresh that are Children 68.9% 67.7% 65.4% 63.1% 60.9% 59.2% 57.2% 54.8% 53.3% 56.6% OC Population under 18 800,820 800,489 799,845 798,699 726,908 723,109 720,532 710,562 731,553 723,961
Fiscal Year 2010/2011.
from 2013 were
124
children
2007
Estimates
used
Supplemental Tables: conomic Well-Being Supplemental Tables: Economic Wellbeing
CalFresh Recipients, by Age and City, January 2018
The
also includes cash
52
Cities and Communities Age 0 -<6 Age 6-<13 Age 13<18 TOTAL RECEIVING CalFresh TOTAL Children % of CalFresh Recipients <18 East Costa Mesa 1,089 1,590 852 3,531 7,020 50% Newport Beach 79 131 105 315 1,335 24% Santa Ana 9,395 13,616 7,341 30,352 50,879 60% Tustin 944 1,473 886 3,303 5,805 57% East Totals 11,507 16,810 9,184 37,501 65,039 58% North Anaheim 8,098 10,862 6,009 24,969 44,928 56% Brea 218 288 172 678 1,607 42% Buena Park 1,199 1,587 901 3,687 7,429 50% Fullerton 1,636 2,249 1,201 5,086 9,987 51% La Habra 900 1,338 710 2,948 5,230 56% La Palma 82 92 51 225 508 44% Orange 1,757 2,386 1,219 5,362 9,632 56% Placentia 606 924 493 2,023 3,694 55% Villa Park 4 4 3 11 40 28% Yorba Linda 185 239 149 573 1,484 39% North Totals 14,685 19,969 10,908 45,562 84,539 54% South Aliso Viejo 192 265 147 604 1,477 41% Dana Point 158 196 100 454 1,148 40% Irvine 775 1,113 742 2,630 6,830 39% Laguna Beach 31 45 34 110 517 21% Laguna Hills 248 345 186 779 1,784 44% Laguna Niguel 262 364 188 814 1,760 46% Laguna Woods 2 1 5 8 396 2% Lake Forest 526 689 336 1,551 3,064 51% Mission Viejo 357 459 283 1,099 2,630 42% Rancho Santa Margarita 173 210 122 505 1,085 47% San Clemente 296 433 228 957 2,136 45% San Juan Capistrano 343 536 256 1,135 1,936 59% South Totals 3,363 4,656 2,627 10,646 24,763 43% West Cypress 407 515 300 1,222 2,737 45% Fountain Valley 251 389 280 920 2,528 36% Garden Grove 3,139 4,446 2,976 10,561 22,265 47% Huntington Beach 1,250 1,674 981 3,905 9,662 40% Los Alamitos 75 100 74 249 600 42% Seal Beach 29 35 17 81 484 17% Stanton 704 997 578 2,279 4,342 52% Westminster 1,421 1,993 1,448 4,862 11,023 44% West Totals 7,276 10,149 6,654 24,079 53,641 45% Unincorporated Totals 288 431 316 1,035 2,349 44% Out of County Totals 392 340 148 880 2,358 37% Total all Orange County 37,511 52,355 29,837 119,703 232,689 51%
125
Note:
report
aided persons. Source: MR0007E and MR0009E December 2017, Orange County Social Services Agency
Supplemental Tables: conomic Well-Being Supplemental Tables: Economic Wellbeing
Indicator: CHILD SUPPORT
xx 53
Number of Child Support Cases, Net and Per Case Collection, 2008/09 to 2017/18 Year Total Number of Cases* Total Net Collections (in Millions) Per Case Collection 2008/09 103,598 $180.3 $ 1,741 2009/10 100,056 $177.2 $ 1,771 2010/11 89,852 $177.4 $ 1,975 2011/12 77,582 $180.1 $ 2,321 2012/13 70,608 $178.6 $ 2,530 2013/14 68,635 $177.9 $ 2,593 2014/15 67,732 $178.8 $ 2,640 2015/16 68,117 $182.3 $ 2,677 2016/17 67,685 $184.0 $ 2,719 2017/18 66,296 $184.3 $ 2,781
12-month average
Orange County Department of Child Support Services Child Support Collections, 2008/09 to 2017/18 Year Net Collections (in Millions) Dollar Increase From Prior Year (in Millions) Percent Difference From Prior Year 2008/09 $180.3 $0.7 0.4% 2009/10 $177.2 -$3.1 -1.7% 2010/11 $177.4 $0.2 0.1% 2011/12 $180.1 $2.7 1.5% 2012/13 $178.6 -$1.5 -0.8% 2013/14 $177.9 -$0.7 -0.4% 2014/15 $178.8 $0.9 0.5% 2015/16 $182.3 $3.5 2.0% 2016/17 $184.0 $1.7 0.9% 2017/18 $184.3 $0.3 0.2% Source: Orange County Department of Child Support Services Child Support Collections Percent of Current Support Distributed (CSD), 2008/09 to 2017/18 Year 2008/09 2009/10 2010/11 2011/12 2012/13 2013/14 2014/15 2015/16 2016/17 2017/18 % CSD 53.0% 54.3% 59.0% 62.7% 64.8% 65.7% 66.7% 68.0% 68.0% 68.3% Case Count 103,598 100,056 89,852 77,582 70,608 68,635 67,735 68,117 70,403 66,296 Source: Orange County Department of Child Support Services 126
*Total number of cases is a
Source:
Supplemental Tables: conomic Well-Being Supplemental Tables: Economic Wellbeing
Secondary Indicator: COST OF EARLY CARE AND EDUCATION
Definition
“Early care and education” refers to preschool and childcare programs that provide care and education for young children (typically ages 0 to 12). This indicator tracks the average cost of early care and education per week in Family Child Care Homes (FCCH) and Child Care Centers for infants, preschool and school -aged children. Both the state and federal government for low-income families support subsidized early education programs. The California Department of Education (CDE) funds agencies to provide quality childcare and development services to low -income families in licensed childcare centers, licensed family childcare homes and license -exempt sett ings. Head Start is a federally-funded program that provides comprehensive educational, health and social services to low -income children ages prenatal to five years and their families.
*Cost of child care per week represents an average of the rates given to Children’s Home Society staff during the intake process and through phone calls made to child care providers during quarterly updates.
**Family Child Care providers care for children in their homes and are licensed as follows: Small child care - 1) 4 infants only, 2) 6 children, no more than 3 of whom may be infants, 3) 8 children, no more than 2 infants, and 2 must be 6 years of age or older. Large family child care - which requires a full time assistant to work with the licensed care provider - 1) 12 children, no more than 4 of whom may be infants, 2) 14 children, not more than 3 of whom may be infants and 2 must be 6 years of age or older.
*** Child care centers include private for-profit centers, parent-run cooperatives and church -based non-profits. The state regulates the ratio of caregivers, square footage and staff qualifications.
Source: Children's Home Society of California's Child Care Resource and Referral Program
54
County-Wide
Child
Hom
Child
Centers Costs*, 2008/09 to 2017/18 Licensed Family Child Care Homes** 2008/09 2009/10 2010/11 2011/12 2012/13 2013/14 2014/15 2015/16 2016/17 2017/18 Infant Care $189 $194 $198 $200 $202 $203 $205 $206 $207 $216 Preschool - 2 through 5 years of age $173 $178 $181 $185 $186 $187 $189 $189 $191 $196 School -age - 6 through 13 years of age $155 $159 $160 $164 $166 $166 $168 $169 $170 $174 Child Care Centers*** 2008/09 2009/10 2010/11 2011/12 2012/13 2013/14 2014/15 2015/16 2016/17 2017/18 Infant Care $252 $257 $263 $250 $264 $261 $270 $275 $278 $288 Preschool - 2 through 5 years of age $158 $162 $169 $172 $178 $185 $191 $194 $195 $200 School -age - 6 through 13 years of age $140 $142 $137 $157 $156 $172 $180 $181 $183 $183 All Licensed Child Care Providers $175 $182 $182 $188 $192 $196 $200 $202 $204 $210
Average Weekly Licensed Family
Care
es and
Care
127
Supplemental Tables: conomic Well-Being Supplemental Tables: Economic Wellbeing
*Cost of child care per week represents an average of the rates rate given to Children’s Home Society staff during the intake process and through phone calls made to child care providers during quarterly updates.
Source: Children's Home Society of California's Child Care Resource and Referral Program
xx 55
County-Wide Average Weekly Orange County Family Child Care Homes and Child Care Centers Costs*, by Region, 201 7/18 CENTERS Infant (0-2) Preschool (2-5) School Age (6-12) East County $ 265.29 $ 185.04 $ 164.30 West County $ 268.46 $ 182.28 $ 163.03 South County $ 312.74 $ 233.63 $ 223.47 North County $ 283.10 $ 188.21 $ 165.55 HOMES Infant (0-2) Preschool (2-5) School Age (6-12) East County $ 208.14 $ 189.11 $ 170.26 West County $ 205.37 $ 189.30 $ 173.35 South County $ 228.96 $ 211.74 $ 188.22 North County $ 213.75 $ 188.73 $ 166.26
128
Supplemental Tables: conomic Well-Being Supplemental Tables: Economic Wellbeing
Birth to 13 Years of Age Child Care Centers (CCTR) Priorities Report , by Board of Supervisor (BOS) District, 2016 Note: Reprint due to data not available at time of printing. *California Department of
56
12
old
City # of Children that Qualify for CDE* Child Care Total Spaces Available % Qualified Children Served BOS District 1 Garden Grove 9,010 509 6% Midway 513 63 12% Santa Ana 32,624 1,196 4% Westminster 5,458 223 4% Total 47,605 1,991 4% BOS District 2 Costa Mesa 4,941 220 4% Fountain Valley 2,588 67 3% Huntington Beach 6,749 459 7% Los Alamitos 1,014 19 2% Newport Beach 1,673 98 6% Seal Beach 1,105 10 1% Stanton 1,840 128 7% Total 19,910 1,001 5% BOS District 3 Brea 1,521 63 4% Irvine 7,234 349 5% Orange 6,806 336 5% Silverado Ranch 117 4 3% Trabuco Canyon 1,261 25 2% Tustin 4,616 833 18% Villa Park 261 0 0% Yorba Linda 2,500 49 2% Total 24,316 1,659 7% BOS District 4 Anaheim 22,994 1,698 7% Buena Park 4,691 462 10% Cypress 2,298 102 4% Fullerton 7,975 386 5% La Habra 2,713 432 16% Placentia 2,768 144 5% Total 43,439 3,224 7% BOS District 5 Dana Point 709 32 5% Ladera Ranch 736 11 1% Laguna Beach 1,545 96 6% Laguna Niguel 1,363 76 6% Lake Forest 3,928 138 4% Mission Viejo 1,974 104 5% Rancho Santa Margarita 1,295 37 3% San Clemente 1,512 43 3% San Juan Capistrano 807 34 4% Total 13,869 571 4% 129
Education (CDE) full -day child care and development services for birth to
year
children
Supplemental Tables: conomic Well-Being Supplemental Tables: Economic Wellbeing
Subsidized Part-Day Eligibility, 2016
Note: *Reprint due to data not available at time of printing.
Source: Children's Home Society of California's Child Care Resource and Referral Program
xx 57
City # of Children who qualify for CDE Child Care Total Spaces % Eligible Qualified Children Served BOS District 1 Garden Grove 6,335 1,558 25% Midway 377 101 27% Santa Ana 25,333 3,655 14% Westminster 4,005 803 20% Total 36,050 6,117 17% BOS District 2 Costa Mesa 3,398 959 28% Fountain Valley 1,787 45 3% Huntington Beach 5,285 542 10% Los Alamitos 727 57 8% Newport Beach 1,395 22 2% Seal Beach 792 6 1% Stanton 1,349 310 23% Total 14,733 1,941 13% BOS District 3 Brea 1,050 51 5% Irvine 4,696 240 5% Orange 4,725 621 13% Silverado Ranch 81 1 1% Trabuco Canyon 955 8 1% Tustin 3,092 466 15% Villa Park 183 1 1% Yorba Linda 1,698 17 1% Total 16,480 1,405 9% BOS District 4 Anaheim 16,007 2,862 18% Buena Park 3,367 613 18% Fullerton 1,650 46 3% La Habra 6,282 791 13% Placentia 1,913 499 26% Total 2,122 366 17% BOS District 5 Dana Point 547 111 20% Ladera Ranch 583 2 0% Laguna Beach 1,403 85 6% Laguna Niguel 1,049 108 10% Lake Forest 2,620 62 2% Mission Viejo 878 126 14% Rancho Santa Margarita 936 44 5% San Clemente 1,171 167 14% San Juan Capistrano 605 318 53% Total 9,245 912 10%
130

131
Supplemental Tables: conomic Well-Being Supplemental Tables: Educational Achievement
Secondary Indicator: EARLY CARE AND EDUCATION
Definition
“Early care and education” refers to preschool and childcare programs that provide care and education for young children (typically ages 0 to 12). This indicator tracks the average cost of early care and education per week in Family Child Care Homes (FCCH) and Child Care Centers for infants, preschool and school-aged children. Subsidized early education programs are supported by both the state and federal government for low -income families. The California Department of Education (CDE) funds agencies to provide quality childcare and development services to l ow -income families in licensed child care centers, licensed family child care homes and license -exempt settings. Head Start is a federally-funded program that provides comprehensive educational, health and social services to low -income children ages prenat al to five years and their families.
Total Licensed Early Care and Education Capacity, Family Child Care Homes (FCCH) and Child Care Centers, 2008/09 to 2017/18
xx 59
2008/09 2009/10 2010/11 2011/12 2012/13 FCCH Child Care Centers FCCH Child Care Centers FCCH Child Care Centers FCCH Child Care Centers FCCH Child Care Centers Infant (0-2) 3,594 5,048 3,556 4,866 3,532 5,006 3,336 3,279 N/A 3,503 Preschool (2-5) 6,412 46,009 6,314 46,847 6,252 47,378 4,267 43,341 N/A 43,791 School Age (6-12) 3,594 20,272 3,556 50,590 3,532 51,221 2,766 20,864 N/A 13,801 Total 13,600 71,419 13,426 102,303 13,316 103,605 10,269 67,484 12,688 61,095 2013/14 2014/15 2015/16 2016/17 2017/18 FCCH Child Care Centers FCCH Child Care Centers FCCH Child Care Centers FCCH Child Care Centers FCCH Child Care Centers Infant (0-2) N/A 3,859 N/A 4,137 N/A 4,149 N/A 4,123 N/A 4,194 Preschool (2-5) N/A 49,757 N/A 51,032 N/A 50,788 N/A 49,122 N/A 48,878 School Age (6-12) N/A 15,317 N/A 16,030 N/A 15,867 N/A 15,712 N/A 15,280 Total 13,594 68,933 13,706 71,199 13,288 70,804 12,696 68,957 12,060 68,352 Source: Children's Home Society of California's Child Care Resource and Referral Program Requests for Child Care Referrals, Reason, and Type of Child Care Needed, 201 7/18 Reason Care is Needed Number of Families that Called Type of Care # of Children Employed 814 Full Time 2,969 Seeking Employment 40 Part Time* 377 School/Training 59 Daytime Hours 2,989 Other 378 Alternative Care Hours** 242 *** Includes requests for before and after school care **Includes evening, weekend, drop -in or overnight care. Source: Children’s Home Society of California’s Child Care Resource and Referral Program 132
Supplemental Tables: conomic Well-Being Supplemental Tables: Educational Achievement
Secondary Indicator: SCHOOL ENROLLMENT
60
Total Public School
Enrollment by District, 2008/09 to 2017/18 2008/09 2009/10 2010/11 2011/12 2012/13 2013/14 2014/15 2015/16 2016/17 2017/18 Elementary Districts Anaheim Elementary 19,278 19,312 19,095 19,312 19,126 19,308 19,164 18,852 18,558 17,911 Buena Park 5,574 5,395 5,296 5,345 5,349 5,226 4,985 4,869 4,837 4,684 Centralia 4,752 4,556 4,540 4,440 4,501 4,480 4,491 4,437 4,417 4,327 Cypress 4,082 4,007 3,950 3,916 3,879 3,916 3,990 3,942 3,969 3,957 Fountain Valley 6,145 6,315 6,312 6,317 6,344 6,337 6,305 6,371 6,387 6,362 Fullerton 13,458 13,616 13,661 13,656 13,830 13,822 13,678 13,520 13,363 13,307 Huntington Beach City 6,679 6,759 7,002 7,173 7,056 7,002 6,864 7,008 7,155 7,073 La Habra City 5,633 5,574 5,430 5,234 5,250 5,149 5,022 4,913 4,726 4,713 Magnolia 6,317 6,310 6,347 6,372 6,353 6,418 6,403 6,418 6,277 6,080 Ocean View 9,503 9,759 7,607 9,461 9,418 9,223 9,010 8,725 8,467 8,263 Savanna 2,473 2,463 2,323 2,363 2,398 2,433 2,392 2,397 2,331 2,272 Westminster 9,880 9,772 9,725 9,637 9,620 9,720 9,503 9,401 9,338 9,264 High School Districts Anaheim Union 33,719 33,187 33,156 32,704 32,085 31,889 31,659 31,276 30,964 30,729 Fullerton Joint 16,343 15,130 14,726 14,783 14,608 14,501 13,678 14,235 13,983 13,901 Huntington Beach Union 16,125 16,162 16,317 16,442 16,400 16,431 16,343 16,048 16,140 16,188 Unified Districts Brea-Olinda 5,944 5,950 5,927 5,960 5,972 5,973 5,977 5,856 5,909 5,951 Capistrano 52,661 53,381 53,192 53,170 53,785 58,833 54,036 53,878 53,613 53,622 Garden Grove 48,574 47,914 48,659 47,999 47,599 46,936 46,177 45,252 44,223 43,163 Irvine 26,522 26,822 27,258 28,179 29,072 30,123 31,392 32,319 33,381 34,617 Laguna Beach 2,947 2,920 3,037 3,034 3,045 3,005 3,074 3,029 3,025 2,929 Los Alamitos 9,475 9,582 9,640 9,714 9,912 9,922 9,914 9,948 9,904 9,833 Newport-Mesa 21,507 21,718 21,811 21,857 22,003 22,018 21,905 21,736 21,581 21,234 OC Dept of Education 8,204 7,717 7,607 7,602 7,184 6,050 5,306 5,037 6,485 6,539 Orange 30,170 30,210 30,373 30,136 29,854 29,750 29,473 28,899 28,522 27,915 Placentia/Yorba Linda 26,094 25,920 25,821 25,747 25,622 25,843 25,595 25,826 25,798 25,741 Saddleback Valley 32,936 32,387 31,724 30,885 30,355 29,731 29,028 28,706 27,803 27,378 Santa Ana 57,439 56,937 57,319 57,250 57,410 57,499 56,815 55,909 54,505 53,131 Tustin 21,682 22,454 23,093 23,507 23,771 23,949 24,059 24,079 24,130 24,015 Total 504,136 502,239 502,895 502,195 501,801 500,487 497,116 492,886 489,791 485,099
K-12
133
Source: California Department of Education
Supplemental Tables: conomic Well-Being Supplemental Tables: Educational Achievement
Note: Total # includes "other" Race/Ethnicity counts. Source: Orange County Department of Education California Department of Education, DataQuest
xx 61
Number and Percent of Total Public School K-12 Enrollment, by Race/Ethnicity, 2008/09 to 2017/18 2008/09 2009/10 2010/11 2011/12 2012/13 Race/Ethnicity No. % No. % No. % No. % No. % American Indian 2,472 0.5 2,516 0.5 2,520 0.5 2,267 0.5 2,281 0.5 Asian 82,198 16.3 82,814 16.5 84,319 16.8 85,066 16.9 85,850 17.1 Black 8,484 1.7 8,241 1.6 8,129 1.6 7,988 1.6 7,660 1.5 Hispanic 225,500 44.7 235,778 46.9 237,831 47.3 241,473 48.1 242,613 48.3 Non- Hispanic White 165,374 32.8 159,533 31.8 156,875 31.2 151,947 30.3 148,089 29.5 Multiple or No Response 20,108 4 13,357 2.7 13,221 2.6 13,454 2.7 15,308 3.1 O.C. Total 504,136 502,239 502,895 502,195 501,801 2013/14 2014/15 2015/16 2016/17 2017/18 Race/Ethnicity No. % No. % No. % No. % No. % American Indian 2,121 0.4 1,784 0.4 1,502 0.3 1,313 0.3 972 0.2 Asian 86,464 17.3 88,007 17.7 88,843 18.0 78,154 15.9 91,337 18.8 Black 7,380 1.5 7,088 1.4 6,877 1.4 6,784 1.4 6,316 1.3 Hispanic 243,967 48.7 243,781 49 242,064 49.1 240,843 49.1 238,545 49.1 Non- Hispanic White 144,012 28.8 139,186 28 135,693 27.5 131,974 26.9 126,317 26.0 Multiple or No Response 16,543 3.3 17,270 3.5 18,051 3.7 19,512 4.0 21,863 4.5 O.C. Total 500,487 497,116 493,030 490,430 485,835
134
Supplemental Tables: conomic Well-Being Supplemental Tables: Educational Achievement
Secondary Indicator: ENGLISH LEARNERS
Definition
According to California Education Code 306(a), an English Learner (EL) is “a child who does not speak English or whose native language is not English and who is not currently able to perform ordinary classroom work in English.” The process of identifying an English Learner begins with the home language survey, but this survey alone does not qualify a student as an EL. Districts administer the Ca lifornia English Language Development Test (CELDT) to students whose home language is other than English within 30 calendar days of initial enrollment. The CELDT assesses English comprehension, speaking, listening, reading and writing, and it determines whether a student is an EL. An overall CELDT score of Early Advanced or Advanced indicates a student is proficient provided no domain score (listening, speaking, reading or writing) falls below Intermediate. Students who do not achieve proficiency on the CEL DT are considered ELs and are assessed annually until reclassified. Reclassified Fluent English Proficient (R -FEP) students are former ELs who have met multiple criteria to succeed in an English-only classroom. These reclassified students are monitored for two years to ensure their success.
"All other languages" includes 54 other languages listed on the California Department of Education website at http://dq.cde.ca.gov/dataquest/.
Source: Orange County Department of Education
62
Number and Percent of English Language Learners, 2008/0 9 to 2017/18 2008/09 2009/10 2010/11 2011/12 2012/13 Primary Languages No. % No. % No. % No. % No. % Spanish 115,366 81.9 115,431 81.5 102,623 81.3 106,871 82.2 100,998 81.9 Vietnamese 12,042 8.5 12,430 8.8 11,746 9.3 10,960 8.4 10,221 8.3 Korean 4,122 2.9 4,011 2.8 3,237 2.6 3,191 2.5 2,936 2.4 Arabic 1,005 0.7 1,124 0.8 1,116 0.9 1,359 1.0 1,556 1.3 Filipino 1,234 0.9 1,144 0.9 1,087 0.9 1,139 0.9 1,090 0.9 All Other Languages* 7,118 5.1 7,465 5.3 6,417 6.3 6,556 5.0 6,489 5.3 Total 140,887 141,605 126,226 130,076 123,290 2013/14 2014/15 2015/16 2016/17 2017/18 Primary Languages No. % No. % No. % No. % No. % Spanish 106,022 81.2 103,706 80.2 97,911 79.6 93,808 78.6 88,644 77.8 Vietnamese 10,784 8.3 11,121 8.6 10,149 8.3 9,756 8.2 9,115 8.0 Korean 3,205 2.5 3,160 2.4 3,006 2.4 2,965 2.5 2,962 2.6 Arabic 1,772 1.4 2,026 1.6 2,133 1.7 2,308 1.9 2,279 2.0 Filipino 1,178 0.9 1,137 0.9 1,077 0.9 1,066 0.9 1,025 0.9 All Other Languages* 7,588 5.8 8,240 6.3 8,725 7.1 9,412 7.3 9,913 8.7 Total 130,570 129,390 123,001 119,315 113,938
135
Supplemental Tables: conomic Well-Being Supplemental Tables: Educational Achievement
xx 63
English Learners Number and Percent, by District, 2008/09 to 2017/18 2008/09 2009/10 2010/11 2011/12 2012/13 School Districts No. % No. % No. % No. % No. % Elementary Districts Anaheim Elementary 11,074 57.4 10,984 56.9 10,941 57.3 10,547 54.6 10,357 54.2 Buena Park 2,417 43.4 2,510 46.5 2,224 42.0 2,187 40.9 2,159 40.4 Centralia 1,548 32.6 1,622 35.5 1,502 33.1 1,481 33.4 1,424 31.6 Cypress 914 22.4 900 22.5 933 23.6 940 24.0 906 23.4 Fountain Valley 485 7.9 648 10.3 664 10.5 640 10.1 683 10.8 Fullerton 4,271 31.7 4,172 30.6 3,906 28.6 4,014 29.4 4,006 29.0 Huntington Beach City 471 7.1 494 7.3 - - 421 5 .9 402 5.7 La Habra City 2,263 40.2 2,233 40.1 - - 2,048 38.9 1,928 36.7 Magnolia 3,435 54.4 3,698 58.6 3,399 53.6 3,136 49.2 3,147 49.5 Ocean View 2,109 22.2 2,288 23.4 2,083 21.8 2,196 23.2 2,181 23.2 Savanna 1,115 45.1 1,121 45.5 1,150 49.5 1,042 44.1 977 40.7 Westminster 4,972 27.9 5,312 54.4 4,996 51.4 4,776 49.6 4,579 47.6 High School Districts Anaheim Union 8,040 23.8 7,726 23.3 - - 6,580 20.1 6,356 19.8 Fullerton Joint Union 2,270 13.9 2,472 16.3 2,049 13.9 1,969 13.3 1,635 11.2 Huntington Beach Union 1,632 10.1 1,680 10.4 1,462 9.0 1,366 8 .3 1,255 7.7 Unified Districts Brea-Olinda 651 11.0 743 12.5 627 10.6 611 10.3 546 9.1 Capistrano 6,224 11.8 5,890 11.0 5,407 10.2 5,424 10.2 5,404 10.0 Garden Grove 22,465 46.2 21,603 45.1 21,093 43.3 20,221 42.1 18,831 39.6 Irvine 3,463 13.1 3,954 14.7 3,628 13.3 3,655 13.0 3,827 13.2 Laguna Beach 95 3.2 43 1.5 115 3.8 111 3 .7 99 3.3 Los Alamitos 252 2.7 223 2.3 197 2.0 157 1 .6 180 1.8 Newport-Mesa 5,693 26.5 5,883 27.1 5,387 24.7 5,242 24.0 5,101 23.2 OC Dept of Education 2,554 31.3 1,853 24.0 2,500 32.9 2,602 22.8 2,285 31.8 Orange 7,255 24.0 7,739 25.6 7,812 25.7 6,856 34.1 6,521 21.8 Placentia-Yorba Linda 3,606 13.8 3,890 15.0 3,256 12.6 3,170 12.3 3,063 12.0 Saddleback Valley 4,090 12.4 4,260 13.2 4,135 13.0 4,045 13.1 4,128 13.6 Santa Ana 32,202 56.1 31,819 55.9 31,379 54.7 29,382 51.3 26,226 45.7 Tustin 5,321 24.5 5,845 26.0 5,381 23.3 5,257 22.4 5,084 47.6 County Total 140,887 27.9 141,605 28.2 126,226 25.1 130,076 25.9 123,290 24.6 California Total 1,513,233 24.4 1,468,235 23.0 1,057,075 17.4 1,387,665 22.4 1,346,333 22.0
136
Source: Orange County Department of Education
Supplemental Tables: conomic Well-Being Supplemental Tables: Educational Achievement
*Data was found in Los Angeles County Public Schools Report in DataQuest.
Source: California Department of Education, DataQuest
64
English Learners Number and Percent, by District, 2008/09 to 2017/18 (Continued) 2013/14 2014/15 2015/16 2016/17 2017/18 School Districts No. % No. % No. % No. % No. % Elementary Districts Anaheim Elementary 11,254 58.0 11,540 60.2 11,353 60.2 10,807 58.2 10,284 57.4 Buena Park 2,288 44.0 2,187 43.9 2,091 42.9 1,915 39.6 1,792 38.3 Centralia 1,581 35.0 1,563 34.8 1,404 31.6 1,484 33.6 1,257 29.1 Cypress 820 21.0 704 17.6 533 13.5 598 15.1 648 16.4 Fountain Valley 782 12.0 810 12.8 881 13.8 882 13.8 825 13.0 Fullerton 4,098 30.0 4,083 29.9 3,906 28.9 3,770 28.2 3,573 26.9 Huntington Beach City 362 5.0 416 6.1 399 5.7 393 5.5 351 5.0 La Habra City 2,090 41.0 1,986 39.5 1,830 37.2 1,542 32.6 1,477 31.3 Magnolia 3,525 55.0 3,358 52.4 3,365 52.4 3,236 51.6 2,936 48.3 Ocean View 2,286 25.0 2,326 25.8 2,305 26.4 2,185 25.8 2,014 24.4 Savanna 1,047 43.0 994 41.6 1,045 43.6 980 42.0 912 40.1 Westminster 4,807 50.0 4,685 49.3 4,395 46.8 4,072 43.6 3,707 40.0 High School Districts Anaheim Union 6,866 22.0 6,658 21.0 6,461 20.7 6,555 21.2 6,611 21.5 Fullerton Joint Union 1,661 11.0 1,591 11.1 1,440 10.1 1,334 9.5 1,253 9.0 Huntington Beach Union 1,311 8.0 1,455 8.9 1,445 9.0 1,430 8.9 1,401 8.7 Unified Districts Brea-Olinda 638 0 .5 716 12.0 735 12.6 576 9.7 573 9.6 Capistrano 5,403 4 .1 5,276 9.8 5,204 9.7 5,076 9.5 5,045 9.4 Garden Grove 19,220 15.0 19,510 42.3 17,745 39.2 17,047 38.5 15,752 36.5 Irvine 4,744 4 .0 5,323 17.0 5,676 17.6 6,330 19.0 6,884 19.9 Laguna Beach 115 0 .1 131 4.3 125 4.1 132 4.4 106 3.6 Los Alamitos 243 0 .2 262 2.6 232 2.3 214 9.5 213 2.2 Newport-Mesa 5,443 4 .2 5,346 24.4 5,266 24.2 5,097 2.2 4,671 22.0 OC Dept of Education 1,943 1 .5 1,466 27.6 1,209 24.0 1,478 23.6 1,377 21.1 Orange 7,204 5 .5 7,185 24.4 6,928 24.0 6,790 22.8 6,607 23.7 Placentia-Yorba Linda 3,596 3 .0 3,520 13.8 3,774 14.6 4,035 23.8 3,986 15.5 Saddleback Valley 4,576 4 .0 4,641 16.0 4,775 16.6 4,792 15.6 4,752 17.4 Santa Ana 27,499 21.1 26,377 46.4 23,530 42.1 21,718 17.2 20,575 38.7 Tustin 5,209 4 .0 5,266 21.9 4,931 20.5 4,626 39.8 4,109 17.1 County Total 130,570 26.0 129,390 26.0 123,001 24.9 119,315 24.3 113,938 23.5 California Total 1,413,549 22.7 1,392,263 22.3 1,373,724 22.4 1,332,405 21.4 1,271,150 20.4
137
Supplemental Tables: conomic Well-Being Supplemental Tables: Educational Achievement
Secondary Indicator: AVERAGE DOLLAR EXPENDITURE PER PUPIL Definition
The current annual expenditures for public schools for each pupil are based on average daily attendance during the school year. Elementary School Districts include K -8, High School Districts include 9 -12 and Unified Districts include K -12.
xx 65
Annual Expenditure Per Pupil (K-12), by District, 2007/08 to 2016/17 School 2007/08 2008/09 2009/10 2010/11 2011/12 2012/13 2013/14 2014/15 2015/16 2016/17 Elementary Districts Anaheim Elementary 8,820 8,928 8,399 7,527 8,091 7,862 8,299 9,312 11,030 12,135 Buena Park 8,824 8,305 8,034 7,278 7,566 7,470 8,047 9,270 10,905 11,656 Centralia 8,475 8,161 7,578 7,420 7,541 7,729 8,206 9,025 10,316 10,915 Cypress 8,101 7,718 7,395 6,801 7,000 7,302 7,378 7,922 8,993 9,716 Fountain Valley 7,716 7,593 6,981 6,755 6,895 6,741 6,949 7,672 8,363 8,893 Fullerton 7,851 7,949 7,290 7,084 7,403 7,165 7,696 8,440 9,467 10,119 Huntington Beach City 7,529 7,612 7,178 6,453 6,614 6,850 7,371 7,890 9,145 9,728 La Habra City 8,280 8,377 7,805 7,912 7,599 7,853 8,177 8,980 10,330 10,923 Magnolia 7,994 8,268 8,341 7,375 7,546 7,529 8,155 8,853 10,634 10,835 Ocean View 8,185 8,119 7,874 7,715 7,880 7,621 7,853 9,004 9,850 10,366 Savanna 8,225 8,154 7,809 7,682 7,716 7,586 7,726 8,254 9,919 10,920 Westminster 8,180 8,387 8,013 7,697 7,948 8,080 8,037 9,221 10,146 10,982 High School Districts Anaheim Union 8,336 8,506 8,168 8,425 8,783 8,678 8,936 9,966 11,004 11,585 Fullerton Joint Union 7,977 8,753 8,766 8,591 8,471 8,627 8,806 8,932 9,845 11,407 Huntington Beach Union 8,287 8,637 8,284 8,285 8,374 8,598 9,039 9,650 10,698 11,415 Unified Districts Brea-Olinda 7,617 7,684 7,271 7,136 7,442 7,254 7,343 8,082 7,536 9,556 Capistrano 7,694 7,614 7,246 7,228 7,469 7,002 7,419 8,042 7,361 9,675 Garden Grove 8,420 8,461 8,193 7,787 7,840 8,030 8,572 9,538 7,717 10,807 Irvine 7,906 7,893 7,606 7,562 7,700 7,577 7,845 8,522 7,789 10,395 Laguna Beach 12,246 12,783 13,773 13,670 13,945 13,702 14,580 15,823 11,235 18,516 Los Alamitos 7,266 7,388 6,878 6,727 6,978 7,198 7,770 8,411 7,120 9,945 Newport-Mesa 10,187 10,674 10,669 10,625 10,468 10,483 10,690 11,492 9,375 12,925 Orange 7,954 7,649 7,208 6,987 6,959 7,390 7,649 8,791 7,690 11,022 Placentia-Yorba Linda 7,949 8,040 7,826 7,914 7,846 7,715 7,926 8,673 7,485 10,365 Santa Ana 8,944 8,763 8,396 9,060 9,098 7,235 9,171 10,053 8,903 12,520 Saddleback Valley 7,562 7,652 7,472 6,830 6,984 9,049 7,409 8,687 7,302 10,012 Tustin 7,474 7,363 7,096 6,679 6,722 6,944 7,452 7,952 7,064 9,905
138
Source: Orange County Department of Education, 2016/17 Financial Report
Supplemental Tables: conomic Well-Being Supplemental Tables: Educational Achievement
66
Average Expenditure Per Pupil, by District Level for Orange County and California, 2007/8 to 2016/17 District Level 2007/08 2008/09 2009/10 2010/11 2011/12 2012/13 2013/14 2014/15 2015/16 2016/17 Elementary Average 8,182 8,131 7,725 7,308 7,483 7,482 7,825 8,653 9,925 10,599 High School Average 8,200 8,632 8,406 8,434 8,543 8,634 8,927 9,516 10,516 11,469 Unified District Average 8,435 8,497 8,303 8,184 8,288 8,298 8,652 9,505 10,535 11,304 Orange County (K-12) Average 8,224 8,267 7,955 7,827 7,952 7,950 8,274 9,128 9,105 10,926 California Average* 8,594 8,736 8,452 8,323 8,382 8,448 8,867 9,794 9,794 11,548 Source: Orange County Department of Education, 2016/17 Financial Report 139
Supplemental Tables: conomic Well-Being Supplemental Tables: Educational Achievement
Indicator: KINGERGARTEN READINESS
xx 67
Number and Percent of Children Developmentally Vulnerable on One or More Areas, by Community, 201 8 City/CDP Number Physical Health and Well-being Social Competence Emotional Maturity Language and Cognitive Development Communication Skills and General Knowledge Aliso Viejo 410 7.6% 9.3% 8.8% 7.1% 9.3% Anaheim 3,816 10.5% 8.5% 8.0% 11.0% 11.2% Brea 385 3.1% 5.2% 3.9% 7.3% 5.2% Buena Park 726 11.6% 9.4% 9.3% 7.9% 8.5% Costa Mesa 940 8.2% 7.1% 6.9% 8.1% 8.6% Coto de Caza 51 2.0% 2.0% 3.9% 5.9% 5.9% Cypress 503 2.4% 6.0% 5.6% 4.6% 5.0% Dana Point 175 5.7% 5.1% 7.4% 8.6% 8.0% Fountain Valley 464 5.0% 10.6% 8.2% 9.7% 10.6% Fullerton 1,340 7.5% 8.1% 7.5% 7.8% 9.3% Garden Grove 1,709 8.2% 10.5% 7.6% 12.1% 13.5% Huntington Beach 1,531 5.2% 7.6% 6.6% 7.6% 7.4% Irvine 2,456 5.0% 6.2% 5.9% 4.4% 7.1% La Habra 573 7.9% 12.0% 10.8% 11.0% 14.3% La Palma 120 9.2% 8.3% 7.5% 9.2% 11.7% Ladera Ranch 334 2.1% 3.0% 2.7% 3.3% 3.0% Laguna Beach 97 10.3% 12.4% 4.5% 10.3% 7.2% Laguna Hills 184 4.3% 3.8% 4.4% 7.6% 10.9% Laguna Niguel 417 5.3% 7.0% 7.0% 7.2% 7.0% Lake Forest 663 7.2% 8.3% 7.0% 11.8% 9.7% Los Alamitos 118 5.1% 7.6% 5.9% 0.8% 5.9% Midway City 94 10.6% 14.9% 10.6% 12.8% 12.8% Mission Viejo 708 3.5% 5.4% 5.4% 4.9% 4.7% Newport Beach 445 6.1% 7.0% 7.7% 3.8% 4.9% North Tustin 102 3.9% 4.9% 4.0% 2.0% 2.0% Orange 1,348 8.2% 8.2% 6.3% 8.9% 9.3% Placentia 506 6.5% 6.7% 5.8% 9.1% 9.3% Rancho Mission Viejo 30 16.7% 3.3% 3.3% 0.0% 0.0% Rancho Santa Margarita 446 7.4% 9.6% 8.2% 7.2% 8.5% San Clemente 542 7.9% 5.7% 5.9% 7.7% 6.6% San Juan Capistrano 295 5.1% 9.2% 9.2% 9.2% 9.2% Santa Ana 3,940 10.4% 10.6% 8.8% 12.5% 12.8% Seal Beach 70 4.3% 2.9% 14.3% 4.3% 5.7% Stanton 341 7.9% 5.3% 5.4% 8.8% 11.7% 140
Supplemental Tables: conomic Well-Being Supplemental Tables: Educational Achievement
Percent of Children Developmentally Vulnerable on One or More Areas, by Community, 2018 (Continued)
Source: Early Development Index, 2018
Percent of Children Developmentally Vulnerable or At Risk on One or More Areas and On Track on all Areas, by Community, 2018
68
City/CDP No. Physical Health and Well-being Social Competence Emotional Maturity Language and Cognitive Development Communication Skills and General Knowledge Trabuco Canyon 151 6.0% 8.6% 6.6% 4.0% 5.3% Tustin 897 7.0% 7.8% 7.8% 9.3% 9.6% Villa Park 41 19.5% 12.2% 12.2% 4.9% 9.8% Westminster 752 7.7% 10.6% 8.2% 8.7% 9.9% Yorba Linda 568 5.3% 5.5% 7.2% 3.9% 6.2% Orange County 28,306 7.7% 8.3% 7.4% 8.8% 9.5%
City/CDP Number Developmentally Vulnerable on One or More Areas Developmentally At Risk on One or More Areas Developmentally On Track on all Areas1 Multiple Challenges2 Aliso Viejo 410 23.4% 25.6% 51.0% 2.4% Anaheim 3,816 24.9% 27.0% 48.0% 5.2% Brea 385 13.5% 26.8% 59.7% 2.1% Buena Park 726 24.0% 23.3% 52.8% 5.0% Costa Mesa 940 21.4% 25.0% 53.6% 2.9% Coto de Caza 51 11.8% 21.6% 66.7% 2.0% Cypress 503 12.5% 27.0% 60.4% 1.8% Dana Point 175 20.0% 21.7% 58.3% 2.3% Fountain Valley 464 23.3% 23.7% 53.0% 5.8% Fullerton 1,340 19.7% 25.2% 55.1% 4.3% Garden Grove 1,709 25.0% 27.2% 47.7% 5.5% Huntington Beach 1,531 18.4% 23.7% 57.9% 3.7% Irvine 2,456 16.0% 19.9% 64.1% 2.1% La Habra 573 25.1% 29.0% 45.9% 6.6% La Palma 120 20.0% 25.0% 55.0% 4.2% Ladera Ranch 334 8.7% 15.3% 76.0% 0.9% Laguna Beach 97 26.8% 27.8% 45.4% 4.1% Laguna Hills 184 17.9% 32.6% 49.5% 2.2% Laguna Niguel 417 16.1% 18.7% 65.2% 4.3% Lake Forest 663 21.9% 19.0% 59.1% 3.8% Los Alamitos 118 15.3% 16.9% 67.8% 0.8% Midway City 94 36.2% 27.7% 36.2% 6.4% Mission Viejo 708 14.4% 23.4% 62.1% 1.7% Newport Beach 445 15.5% 24.0% 60.4% 2.2% North Tustin 102 6.9% 16.7% 76.5% 1.0% 141
Supplemental Tables: conomic Well-Being Supplemental Tables: Educational Achievement
Percent of Children Developmentally Vulnerable or At Risk on One or More Areas and On Track on all Areas, by Community, 2015 (Continued)
1. Developmentally On Track on All Areas refers to children on track on all valid areas. A record may be valid with just four completed areas.
2. Multiple challenges defined as not ready on 9 or more subdomains (16 total subdomains).
Source: Early Development Index, 2018
xx 69
City/CDP Number Developmentally Vulnerable on One or More Areas Developmentally At Risk on One or More Areas Developmentally On Track on all Areas1 Multiple Challenges2 Orange 1,348 22.3% 26.4% 51.3% 3.9% Placentia 506 19.2% 24.3% 56.5% 4.2% Rancho Mission Viejo 30 16.7% 20.0% 63.3% 0.0% Rancho Santa Margarita 446 20.2% 27.6% 52.2% 4.3% San Clemente 542 20.5% 26.0% 53.5% 3.1% San Juan Capistrano 295 19.3% 26.1% 54.6% 4.7% Santa Ana 3,940 27.3% 28.6% 44.1% 5.9% Seal Beach 70 21.4% 30.0% 48.6% 1.4% Stanton 341 21.7% 26.7% 51.6% 2.9% Trabuco Canyon 151 17.2% 17.9% 64.9% 2.0% Tustin 897 22.3% 28.0% 49.7% 3.3% Villa Park 41 22.0% 26.8% 51.2% 4.9% Westminster 752 24.7% 26.3% 48.9% 4.3% Yorba Linda 568 16.0% 21.1% 62.9% 2.6% Orange County 28,332 21.5% 25.2% 53.2% 4.1%
142
Supplemental Tables: conomic Well-Being Supplemental Tables: Educational Achievement
Percent of Children Developmentally Vulnerable or At Risk on One or More Area s and On Track on all Areas, by Student Characteristic, 2018
Not
Developmentally
70
on Track
Developmentally On Track on all Areas1
Vulnerable on One or
Areas
At Risk on One or More Areas Currently in Kindergarten - No Transition Kindergarten (TK) Experience 24.6% 26.3% 49.1% Currently in Kindergarten - Had TK Experience 14.6% 21.6% 63.8% Not English Language Learner 17.7% 23.7% 58.6% English Language Learner 27.2% 27.4% 45.4% No Individual Education Plan (IEP) 19.6% 25.0% 55.5% Has IEP 46.2% 28.6% 25.2% Parent has Volunteered 14.8% 22.5% 62.7% Parent has not Volunteered 26.3% 27.2% 46.5% Receives Free/Reduced Price Lunch 28.6% 28.8% 42.6% Does Not Receive Free/Reduced Price Lunch 15.3% 22.7% 62.0% Hispanic, Latino/a 26.9% 28.1% 45.0% White 16.0% 23.3% 60.8% Asian 15.4% 20.1% 64.6% Other 18.9% 24.7% 56.4% All 21.5% 25.2% 53.2% All results are statistically significant at p=.05 level. 1. Developmentally On Track on All Areas refers to children on
on
mpleted areas. Source: Early Development Index, 2018 143
More
Developmentally
track
all valid areas. A record may be valid with just four co
Supplemental Tables: conomic Well-Being Supplemental Tables: Educational Achievement
Indicator: ACADEMIC PERFORMANCE , THIRD GRADE ENGLISH LANGUAGE ARTS AND MATHEMATICS
Note: Data no longer updated as of 2015/16. Due to the change in academic standards, Senate Bill 172 (Liu) was signed by the Governor to suspend the administration of th e CAHSEE and the requirement that students pass the CAHSEE to receive a high school diploma for the 2015–16, 2016–17, and 2017–18 school years
*The California High School Exit Exam (CAHSEE) tests high school sophomores, juniors and seniors on proficiency in English an d Mathematics. Students take both parts separately and only retake the parts they did not pass. A mean scale score is the statistical average of a group of scale scores. The CAHSEE provides scale sco res for individual students and a mean or average scale score for groups of students. The exam is administered in March; schools with year-round tracks may test in March and May. Since June 2006, passing the CAHSEE is a requirement for graduation. Students are req uired to take the CAHSEE in 10th grade, and may take it up to five more times as a junior or senior if they have not passed. The State Board of Education has also determined that alternative means to demonstrate proficiency on the CAHSEE are feasible (July, 2010). **Scores based on 10 or fewer students to protect confidentiality.
Source: California Department of Education
xx 71
Number and Percent of 10th Grade Students Who Passed English Language Arts and Math, by School District, March 2015 Math English Language Arts No. Tested Passing % No. Tested Passing % All students tested 38,156 90 37,727 89 Anaheim Union High 4,980 82 4,974 83 Brea-Olinda Unified 448 96 461 93 Capistrano Unified 3,874 93 3,888 94 Fullerton Joint Union High 3,352 90 3,356 90 Garden Grove Unified 3,540 88 3,544 86 Huntington Beach Unified High 3,739 93 3,749 92 Irvine Unified 2,207 97 2,215 95 Laguna Beach Unified 7 - 5Los Alamitos Unified 797 97 807 97 Newport-Mesa Unified 1,717 89 1,730 89 OC Dept of Education 468 52 477 60 Orange County HS of the Arts 373 100 368 93 Orange Unified 2,266 89 2,273 90 Placentia-Yorba Linda Unified 2,046 92 2,049 92 Saddleback Valley Unified 2,437 92 2,440 92 Santa Ana Unified 3,470 85 3,481 81 Tustin Unified 1,919 93 1,921 92
144
Supplemental Tables: conomic Well-Being Supplemental Tables: Educational Achievement
Indicator: HIGH SCHOOL DROPOUT RATES
Note: California Department of Education, DataQuest, 2016/17 data. A cohort is a defined group of students that could potentially g raduate during a 4-year time period (grade 9 through grade 12). The 2016- 17 Four-Year Adjusted Cohort Graduation Rate (ACGR) and Outcome data has been released. Beginning in 2016-17, the ACGR and Outcome data were calculated using different business rules and are not comparable with the Cohort Outcome data from previous years. Indicates County Office of Education (COE), which receives the County-wide rate * Indicates ten or fewer students in order to protect privacy.
Source: California Department of Education
72
Number and Percent of Grade 9-12 Cohort Dropouts, by District, 2009/10 to 2016/17 2010/11 2011/12 2012/13 2013/14 2014/15 2015/16 2016/17 No. % No. % No. % No. % No. % No. % No. % Anaheim Union High 655 13.1 652 12.1 444 8.6 447 8.6 373 7.3 317 6.4 359 7.1 Brea-Olinda Unified 17 3.3 23 4.2 12 2.3 * 1.4 * 1.9 * 2.0 13 2.7 Capistrano Connections Academy 66 21.4 107 25.4 134 23.2 Capistrano Unified 76 1.8 71 1.8 62 1.6 73 1.9 57 1.4 57 1.4 41 1.0 Fullerton Joint Union High 397 10.5 221 5.9 151 4.3 125 3.5 105 3 101 3.0 90 2.7 Garden Grove Unified 384 9.8 389 10.1 353 9.1 292 8.0 233 6.2 212 6.2 295 8.3 Huntington Beach Union 160 4.2 103 2.7 105 2.8 90 2.3 98 2.5 87 2.4 100 2.7 Irvine Unified 26 1.2 41 1.8 53 2.4 55 2.6 67 2.8 35 1.5 63 2.7 Laguna Beach Unified * 1.2 * 1.2 * 2.8 * 1.9 * 3.5 13 4.7 12 4.8 Los Alamitos Unified 20 2.4 24 2.8 12 1.4 * 1.1 * 0.7 * 0.8 * Magnolia Science Acad. Santa Ana * 0.0 * 0.0 * Newport-Mesa Unified 78 4.5 62 3.5 65 3.8 68 4.1 74 4.3 66 3.8 95 5.3 Nova Academy * 3.3 * 5.4 84 96.6 OCSA * 1.4 * 1.7 * Opportunities for Learning –Capistrano 13 41.9 * 29.0 12 21.8 Orange Unified 160 6.8 127 5.1 105 4.4 120 5.2 111 4.8 68 3.1 130 5.7 PlacentiaYorba Linda Unified 114 5.1 120 5.4 60 2.9 81 3.8 60 2.8 122 5.7 52 2.4 Saddleback Valley Unified 94 3.4 68 2.5 63 2.4 66 2.5 62 2.5 54 2.3 66 2.7 Santa Ana Unified 507 13.4 387 10.5 360 9.6 310 8.2 223 6.2 150 4.3 160 4.7 Tustin Unified 42 2.6 67 4.2 30 1.8 36 2.1 20 1.1 28 1.5 20 1.0 County 4,021 10 3,911 9 3,049 7.3 2,750 6.7 2,311 5.7 2,145 5.4 2,185 5.3 California 74,101 15 65,249 13 56,711 11.4 56,756 11.5 52,249 10.7 48,118 9.8 45,052 9.1
145
Supplemental Tables: conomic Well-Being Supplemental Tables: Educational Achievement
Note: Asian dropout totals include Pacific Islander and Filipino dropout numbers for all years.
Note: California Department of Education, DataQuest, 2016/17 data. A cohort is a defined group of students that could potentially graduate during a 4-year time period (grade 9 through grade 12). The 2016- 17 Four-Year Adjusted Cohort Graduation Rate (ACGR) and Outcome data has been released. Beginning in 2016 -17, the ACGR and Outcome data were calculated using d ifferent business rules and are not comparable with the Cohort Outcome data from previous years.
Source: California Department of Education
xx 73
Number and Percent of Grade 9-12 Cohort Dropouts, by Race/Ethnicity, 2009/10 to 2016/17 2009/10 2010/11 2011/12 2012/13 2013/14 Race/Ethnicity No % No. % No. % No. % No. % Asian 488 9.4 307 7.6 296 7.6 248 3.4 243 2.5 White 878 5.7 701 4.7 649 4.5 531 3.9 517 3.9 Hispanic 3,554 20.1 2,767 15.3 2,635 14.0 2,100 11.3 1,834 10.0 Black 143 17.2 120 14.7 112 13.2 94 12.6 78 10.2 American Indian 40 9.9 38 10 29 7.4 22 5.6 18 4.5 Multiple or No Response 97 13.7 88 11.5 108 12.9 54 5.6 60 6.6 County Total 5,200 12.3 4,021 9.5 3,829 8.9 3,049 7.3 2,750 6.7 2014/15 2015/16 2016/17 Race/Ethnicity No. % No. % No. % Asian 170 2.6 164 9.9 182 8.5 White 478 3.7 478 3.8 436 3.5 Hispanic 1,484 8.1 1,342 7.4 1,392 7.4 Black 70 10.4 67 9.4 59 8.4 American Indian 16 4.8 14 5.3 17 7.3 Multiple or No Response 64 6.6 71 6.7 99 23.6 County Total 2,311 5.7 2,145 5.4 2,185 5.3
146
Supplemental Tables: conomic Well-Being Supplemental Tables: Educational Achievement
Secondary Indicator: HIGH SCHOOL GRADUATION Definition
The California Education Code establishes a minimum set of requirements for graduation from California high schools. These include a total of 13 required courses and passage of the California High School Exit Exam (CAHSEE). Local school boards can include additional requirements that t hey consider important for their local school district. Graduation rates are collected annually and included in the Annual Yearly Progress (AYP) accountability system. The data shows the percentage of students entering Orange County high schools that could potentially graduate during the four -year time period (2008 to 2012). Data includes students who completed high school with a standard high school diploma or special education waiver or exemption, an adult education high school diploma or the California H igh School Proficiency Exam.
74
Number and Percent of Grade 9-12 Cohort Graduates, by District, 2010/11 to 2016/17 2012/13 2013/2014 2014/15 2015/16 2016/17 District Name No. % No. No. % No. % % No. % Anaheim Union High 4,335 84.3 4,402 4,410 88.5 4,410 88.5 84.8 4,486 87.3 Brea-Olinda Unified 514 96.4 485 488 96.4 488 96.4 96.4 506 96.6 Capistrano Unified 3,812 97.2 177 3,877 97.1 3,877 97.1 67.3 3,914 96.6 Fullerton Joint Union High 3,232 91.9 3,354 3,141 94.4 3,141 94.4 93.4 3,467 94.5 Garden Grove Unified 3,452 89.2 3,267 3,162 92.1 3,162 92.1 89.7 3,772 91.8 Huntington Beach Union High 3,444 93.1 3,674 3,506 94.7 3,506 94.7 94.1 3,888 94.2 Irvine Unified 2,133 95.5 2,042 2,213 96.3 2,213 96.3 95.7 2,361 94.8 Laguna Beach Unified 244 96.1 255 259 93.8 259 93.8 97.7 230 95.7 Los Alamitos Unified 827 97.2 743 835 98.2 835 98.2 97.9 714 98.2 Newport-Mesa Unified 1,617 93.4 1,539 1,616 93.6 1,616 93.6 93.1 1,614 93.5 Orange Unified 2,254 93.9 2,148 2,142 96.4 2,142 96.4 92.7 2,151 93.6 Placentia-Yorba Linda Unified 1,927 93.2 1,997 1,988 92.4 1,988 92.4 93.9 2,012 95 Saddleback Valley Unified 2,529 95.3 2,449 2,293 95.7 2,293 95.7 94.7 2,316 95 Santa Ana Unified 3,237 85.9 3,320 3,214 91.6 3,214 91.6 87.4 3,212 88.9 Tustin Unified 1,625 96.8 1,698 1,782 97.6 1,782 97.6 97 1,769 98.1 Cohort Enrollment 41,539 41,126 39,820 39,820 40,872 Orange County Total 36,363 87.5 36,429 36,162 90.8 36,162 90.8 88.6 36,770 90.0 147
Supplemental Tables: conomic Well-Being Supplemental Tables: Educational Achievement
Secondary Indicator: SAT REASONING TEST
Definition
The SAT Reasoning Test (formerly known as the SAT I: Reasoning Test) assesses a student’s reasoning in Mathematics, Verbal and Writing Skills.1 It is taken by college-bound juniors and seniors and is used by college admissions officers as one key factor to determine who will be admitted. The participation rate of seniors who took the SAT test is presented in order to assess the entire student body’s college orientation.
Average Combined SAT Reasoning Test Scores* for Orange County, Califo rnia and the United States, 2007/08 to
* Figures reflect public and private schools’ results combined.
Note: SAT Reasoning Test Scores are no longer reported as of 2016/17. It has been replaced by the percent of 12 th grade students meeting ELA and Math Benchmarks. Note. Increases in scores are due to the writing component added to the test in 2005/06.
Source: California Department of Education. The College Board (for U.S. numbers)
Percent of Highschool Students Meeting Benchmarks for ELA and Math for Orange County, California and the United States, 2016/17
Sources: California Department of Education DataQuest
xx 75
Percent of Graduates, by Race/Ethnicity, 2010/11 to 2016/17 2010/11 2011/12 2012/13 2013/14 2014/15 Race/Ethnicity No. % No. % No. % No. % No. % American Indian 323 0.9 339 0.92 350 1.0 354 1.0 300 0.8 Asian 6,755 18.6 6,924 18.9 6,829 18.8 6,974 19.1 7,140 19.4 Hispanic 14,052 38.8 14,719 40.1 14,996 41.2 15,259 41.9 15,659 42.6 Black 633 1.7 679 1.9 597 1.6 652 1.8 569 1.5 White 13,815 38.1 13,309 36.3 12,743 35.1 12,377 34.0 12,232 33.3 Multiple or No Response 650 1.8 725 2.0 848 2.3 815 2.2 870 2.4 Orange County Total 36,228 100.0 36,695 100.0 37,363 100.0 36,429 100.0 36,770 100.0 2015/16 2016/17 Race/Ethnicity No. % No. % American Indian 235 0.6 199 0.5 Asian 6,706 18.5 6,962 19.1 Hispanic 15,746 43.5 15,977 43.9 Black 604 1.7 596 1.6 White 11,791 32.6 11,433 31.4 Multiple or No Response 1,080 3.0 1,193 3.3 Orange County Total 36,162 100.0 36,360 100.0 Source: California Department of Education
2015/17 2007/08 2008/09 2009/10 2010/11 2011/12 2012/13 2013/14 2014/15 2015/16 Orange County Combined 1598 1600 1621 1597 1588 1588 1567 1565 1560 California Combined 1500 1502 1521 1502 1492 1492 1487 1473 1455 United States Combined* 1511 1509 1509 1500 1498 1498 1497 1490 1484
%
ELA % Meeting Math Orange County Combined 79.69 61.97 California Combined 72.25 50.76
Meeting
148
Supplemental Tables: conomic Well-Being Supplemental Tables: Educational Achievement
Comparison of Lowest and Highest Free and Reduced-Price Lunch Program (FRL) w ith % of Students Meeting Benchmarks by District 2016/17
Sources:
Percent of Highschool Students Meeting Benchmarks for ELA and Math, by District, for Orange County and California , 2016/17
76
School District % of Students Eligible in FRL Program % of Students Meeting ELA Benchmarks % of Students Meeting Math Benchmarks Laguna Beach Unified 6.9% 96.88 82.81 Los Alamitos Unified 9.6% 90.70 74.22 Irvine Unified 15.1% 95.70 90.49 Anaheim Union 56.9% 74.53 52.29 Garden Grove 56.9% 76.27 54.6 Santa Ana Unified 84.3% 62.68 39.26
Student
California Department of Education DataQuest (percent meeting benchmarks) California Department of Education
Poverty FRPM Data (Free and Reduced Lunch program)
District Name Grade 12 Enrollment Number Tested Percent Meeting ELA Benchmarks Percent Meeting Math Benchmarks Anaheim Union 5,199 1,983 74.53% 52.29% Brea-Olinda Unified 467 191 93.72% 76.96% Capistrano Unified 4,524 1,961 92.96% 76.24% Fullerton Joint Union 3,429 1,689 83.78% 69.33% Garden Grove Unified 3,648 2,099 76.27% 54.60% Huntington Beach Union 4,062 1,851 87.74% 75.42% Irvine Unified 2,380 1,094 95.70% 90.49% Laguna Beach Unified 246 64 96.88% 82.81% Los Alamitos Unified 835 516 90.70% 74.22% Newport-Mesa Unified 1,802 616 86.85% 63.64% Orange Unified 2,263 1,921 60.54% 40.19% Orange County Department of Ed 1,034 88 63.64% 46.59% Placentia-Yorba Linda Unified 2,129 1,032 90.31% 76.84% Saddleback Valley Unified 2,435 1,048 93.13% 76.91% Santa Ana Unified 3,950 1,913 62.68% 39.26% Tustin Unified 1,962 1,563 69.42% 50.67% Total Orange County 40,379 19,640 79.69% 61.97% Total California 484,169 221,433 72.25% 50.76% Source: California Department of Education 149
Supplemental Tables: conomic Well-Being Supplemental Tables: Educational Achievement
Indicator: COLLEGE READINESS
xx 77
Number of High School Graduates with UC/CSU Required Courses, by School District, 2007/08 to 2016/17 School District 2007/08 2008/09 2009/10 2010/11 2011/12 2012/13 2013/14 2014/15 2015/16 2016/17 Anaheim Union High 1,279 1,383 1,764 1,615 1,681 1,534 1,785 1,754 1,752 1,825 Brea-Olinda Unified 278 282 214 267 272 290 268 274 250 249 Capistrano Unified 1,517 1,712 1,729 2,015 2,003 2,127 2,130 2,299 2,289 2,338 Fullerton Joint Union High 1,142 1,081 991 1,326 1,372 1,581 1,780 1,716 1,730 1,767 Garden Grove Unified 965 1,126 1,387 1,720 1,739 1,814 1,821 1,860 1,643 1,849 Huntington Beach Union 1,905 1,877 1,569 1,654 1,666 1,824 2,047 2,316 2,096 1,668 Irvine Unified 1,329 1,155 1,260 1,265 1,263 1,391 1,266 1,558 1,489 1,550 Laguna Beach Unified 156 166 156 154 167 242 182 160 174 182 Los Alamitos Unified 395 220 450 504 491 514 498 484 600 607 Newport-Mesa Unified 621 648 794 823 854 857 853 937 971, 996 Orange Unified 780 716 562 779 891 864 853 722 915 1,012 PlacentiaYorba Linda Unified 816 797 762 885 894 955 1,005 1,068 1,047 1,090 Saddleback Valley Unified 1,063 1,179 1,107 1,159 1,181 1,139 1,202 1,198 1,186 1,239 Santa Ana Unified 802 979 578 1,166 1,255 1,495 1,694 1,765 1,777 1,806 Tustin Unified 527 599 592 671 749 887 935 1,032 1,056 1,185 Orange County Total 13,575 13,920 13,915 16,003 16,478 17,514 18,319 19,147 18,986 19,425 150
Supplemental Tables: conomic Well-Being Supplemental Tables: Educational Achievement
78
Number and Percent of High School Graduates with UC/CSU Required Courses, by Race/Ethnicity, 2007/08 to 2016/17 2007/08 2008/09 2009/10 2010/11 2011/12 Race/Ethnicity No. % No. % No. % No. % No. % American Indian 177 48 157 42.8 120 33.3 123 36.5 143 40.9 Asian 3,947 29.1 4,063 29.2 4,044 30.8 4,549 28.4 4,724 28.7 Hispanic 2,335 22.1 2,896 23.8 2,731 19.8 3,927 26.7 4,222 27.1 Black 148 24 180 27.4 189 27.4 204 31 211 29.7 White 6,655 45.3 6,457 45.2 5,769 40.8 6,876 49.2 6,810 50.4 Multiple or No Response 313 36.9 122 40.9 240 48.2 324 44.8 368 46.7 Orange County Total 13,575 40.7 13,920 40.3 13,142 36.2 16,003 43 16,478 43.3 State Total 127,594 33.9 135,370 35.3 82,083 39.7 164,598 40.3 160,494 38.3 2012/13 2013/14 2014/15 2015/16 2016/17 Race/Ethnicity No. % No. % No. % No. % No. % American Indian 160 44.8 163 45.8 170 53.1 132 55.0 69 32.9 Asian 4,871 28 5,198 28.4 4,758 77.3 4,432 77.1 5,355 62.8 Hispanic 15,761 30.6 5,385 33.6 5,617 34.1 5,863 35.6 6,267 38.0 Black 228 36.1 252 38.4 215 36.1 240 38.5 235 38.3 White 6,948 53.4 6,880 55 7,211 57.9 7,041 59.0 6,810 58.1 Multiple Race 444 54.8 369 54.2 452 56.0 559 55.8 611 56.7 Orange County Total 17,514 46.6 18,319 48.9 19,147 50.4 18,986 51.1 19,425 52.0 State Total 166,521 39.4 176,688 41.9 185,179 43.4 194,698 45.4 200,911 46.8
151
Source: California Department of Education
Supplemental Tables: conomic Well-Being Supplemental Tables: Educational Achievement
Secondary Indicator: SPECIAL EDUCATION
Definition
Special education refers to specially designed instruction and related services at no cost to the parent that meets the unique needs of individuals whose educational needs cannot be met with modification of the regular instruction program. Special education is an integral part of the total public educa tion system and provides education in a manner that promotes maximum interaction between children or youth with disabilities and children or youth who are not disabled in a manner that is appropriate to the needs of both. Special education provides a full continuum of program options including instruction conducted in the classroom in the home in hospitals and institutions and in other settings; and instruction in physical education to meet the educational and service needs of individuals with exceptional needs in the least restrictive environment.
*Data reporting cycle: December 1st of the year reported. Numbers include the category “All Others” students ages 0 to 22. Note: Lowell School District’s enrollment numbers are included. Source: California Department of Education DataQuest
xx 79
Number of K-12 Students Receiving Special Education Services, by Type of Disability, for Orange County and California, 2008 to 2017 Type of Disability 2008 2009 2010 2011 2012 2013 2014 2015 2016 2017 Specific Learning Disability 17,190 16,527 15,715 15,635 15,565 14,514 15,436 15,602 16,164 16,703 Speech/Language Impairment 15,531 15,210 14,888 14,544 14,198 13,927 14,132 14,039 13,727 13,825 Intellectual Disability 2,741 2,716 2,797 2,808 2,868 2,210 2,927 2,827 2,810 2,770 Orthopedic Impairment 1,153 1,194 1,177 1,147 1,089 1,246 940 864 755 685 Multiple Disabilities 446 423 439 447 420 349 441 530 573 617 Other Health Impairment 4,831 5,029 5,167 5,391 5,628 5,663 6,329 6,767 7,328 7,844 Deaf 315 310 303 281 277 199 208 197 169 165 Emotional Disturbance 1,381 1,376 1,447 1,402 1,369 1,246 1,382 1,405 1,439 1,504 Visual Impairment 336 331 306 299 291 223 233 197 192 179 Hard of Hearing 775 822 851 895 863 810 793 785 792 786 Deaf-Blind 9 13 14 14 12 0 0 197 0 0 Autistic 6,629 7,294 7,960 8,614 9,207 8,998 9,869 10,076 10,235 10,511 Traumatic Brain Injury 149 149 144 136 118 67 54 26 47 35 No Category 0 0 0 0 0 0 0 0 0 0 K-12 OC Special Education* 51,486 51,394 51,208 51,613 51,905 52,216 53,005 53,512 54,231 55,908 K-12 OC Total Enrollment 504,136 497,291 502,903 502,195 501,801 500,487 497,116 493,030 490,430 485,835 Percent OC Special Education to Regular Enrollment 10.20% 10.30% 10.20% 10.30% 10.30% 10.40% 10.70% 10.90% 11.05% 11.51% K-12 State Special Education Enrollment* 678,105 680,164 678,929 686,352 695,173 705,308 717,961 734,422 754.337 774,665 K-12 State Total Enrollment (million) 6.252 6.189 6.217 6.214 6.227 6.237 6.312 6.226 6.228 6.220 Percent State Special Education to Regular Enrollment 10.80% 11.10% 10.90% 11.00% 11.20% 11.30% 11.50% 11.80% 12.10% 12.45%
152
Supplemental Tables: conomic Well-Being Supplemental Tables: Educational Achievement
80
Number of Students Receiving Special Education Services, by Age and Type of Disability, 2008 to 2017 2008 2009 2010 2011 0 to 5 6 to 12 13 to 18 0 to 5 6 to 12 13 to 18 0 to 5 6 to 12 13 to 18 0 to 5 6 to 12 13 to 18 Type of Disability Intellectual Disability 15,565 14,514 15,436 15,602 18,755 17,655 283 1,000 1,081 279 1,004 1,058 Hard of Hearing 14,198 13,927 14,132 14,039 16,054 15,852 186 358 299 218 376 289 Deaf 2,868 2,210 2,927 2,827 2,782 2,776 49 100 140 50 92 129 Speech or Language Impairment 1,089 1,246 940 864 1,133 1,125 4,241 8,890 1,744 4,263 8,588 1,673 Visual Impairment 420 349 441 530 687 560 44 126 119 37 130 115 Emotional Disturbance 5,628 5,663 6,329 6,767 4,293 4,593 4 387 1,020 1 389 972 Orthopedic Impairment 277 199 208 197 384 347 188 465 405 167 456 387 Other Health Impairment 1,369 1,246 1,382 1,405 1,290 1,339 279 2,100 2,724 300 2,261 2,763 Specific Learning Disability 291 223 233 197 349 332 11 6,282 9,250 16 6,362 9,064 Deaf-Blindness 863 810 793 785 648 697 1 4 9 2 5 7 Multiple Disability 12 0 0 197 12 11 82 166 140 88 173 129 Autism 9,207 8,998 9,869 10,076 4,606 5,629 1,763 4,032 1,952 1,844 4,338 2,178 Traumatic Brain Injury 118 67 54 26 138 131 10 46 73 3 48 76 Total 51,905 49,452 52,744 53,512 51,131 51,047 7,141 23,956 18,956 7,268 24,222 18,840 2012 2013 2014 2015 0 to 5 6 to 12 13 to 18 0 to 5 6 to 12 13 to 18 0 to 5 6 to 12 13 to 18 0 to 5 6 to 12 13 to 18 Type of Disability Intellectual Disability 296 1,041 1,052 265 1,086 1,027 247 1,119 1,073 214 1,069 1,061 Hard of Hearing 218 330 301 212 321 300 225 292 276 214 303 268 Deaf 47 98 118 40 76 83 27 89 92 22 88 87 Speech or Language Impairment 4,175 8,386 1,609 4,167 8,328 1,524 4,053 8,573 1,492 4,064 8,557 1,405 Visual Impairment 29 120 126 ** 105 134 - 97 136 11 63 123 Emotional Disturbance 6 354 975 ** 380 971 - 389 969 0 405 982 Orthopedic Impairment 159 416 395 105 405 373 112 374 350 111 339 325 Other Health Impairment 292 2,392 2,874 315 2,637 2,944 321 2,877 3,055 340 3,131 3,217 Specific Learning Disability 16 6,584 8,811 13 6,564 2,944 13 6,885 8,429 21 7,242 8,241 Deaf-Blindness 1 4 7 ** ** ** - - - - -Multiple Disability 81 166 121 55 175 136 59 185 149 71 230 170 Autism 1,873 4,590 2,449 1,832 4,793 2,603 1,855 4,941 2,689 1,852 5,017 2,798 Traumatic Brain Injury 4 42 65 ** ** 67 - - 54 - - 26 Total 7,197 24,523 18,903 7,004 24,870 13,106 6,912 25,821 18,764 6,920 26,444 18,703 153
Supplemental Tables: conomic Well-Being Supplemental Tables: Educational Achievement
81
Number of Students Receiving Special Education Services, by Age and Type of Disability, 2008 to 2017 (Continued) 2016 2017 0 to 5 6 to 12 13 to 18 0 to 5 6 to 12 13 to 18 Type of Disability Intellectual Disability 196 1,025 1,093 198 960 1,109 Hard of Hearing 216 305 271 230 306 250 Deaf 0 101 68 * 87 78 Speech or Language Impairment 4,127 8,317 1,283 4,185 8,433 1,207 Visual Impairment 0 88 104 0 88 91 Emotional Disturbance 0 447 974 0 486 1,005 Orthopedic Impairment 89 301 285 81 269 266 Other Health Impairment 332 3,418 3,501 357 3,664 3,760 Specific Learning Disability 13 7,696 8,380 14 7,909 8,702 Deaf -Blindness 0 0 0 0 0 0 Multiple Disability 72 250 175 76 260 199 Autism 1,843 5,026 2,924 1,926 5,097 3,042 Traumatic Brain Injury 0 12 35 0 11 24 Total 6,888 26,974 19,058 7,067 27,570 19,733 *Denotes values under 11 Source: California Department of Education DataQuest 154
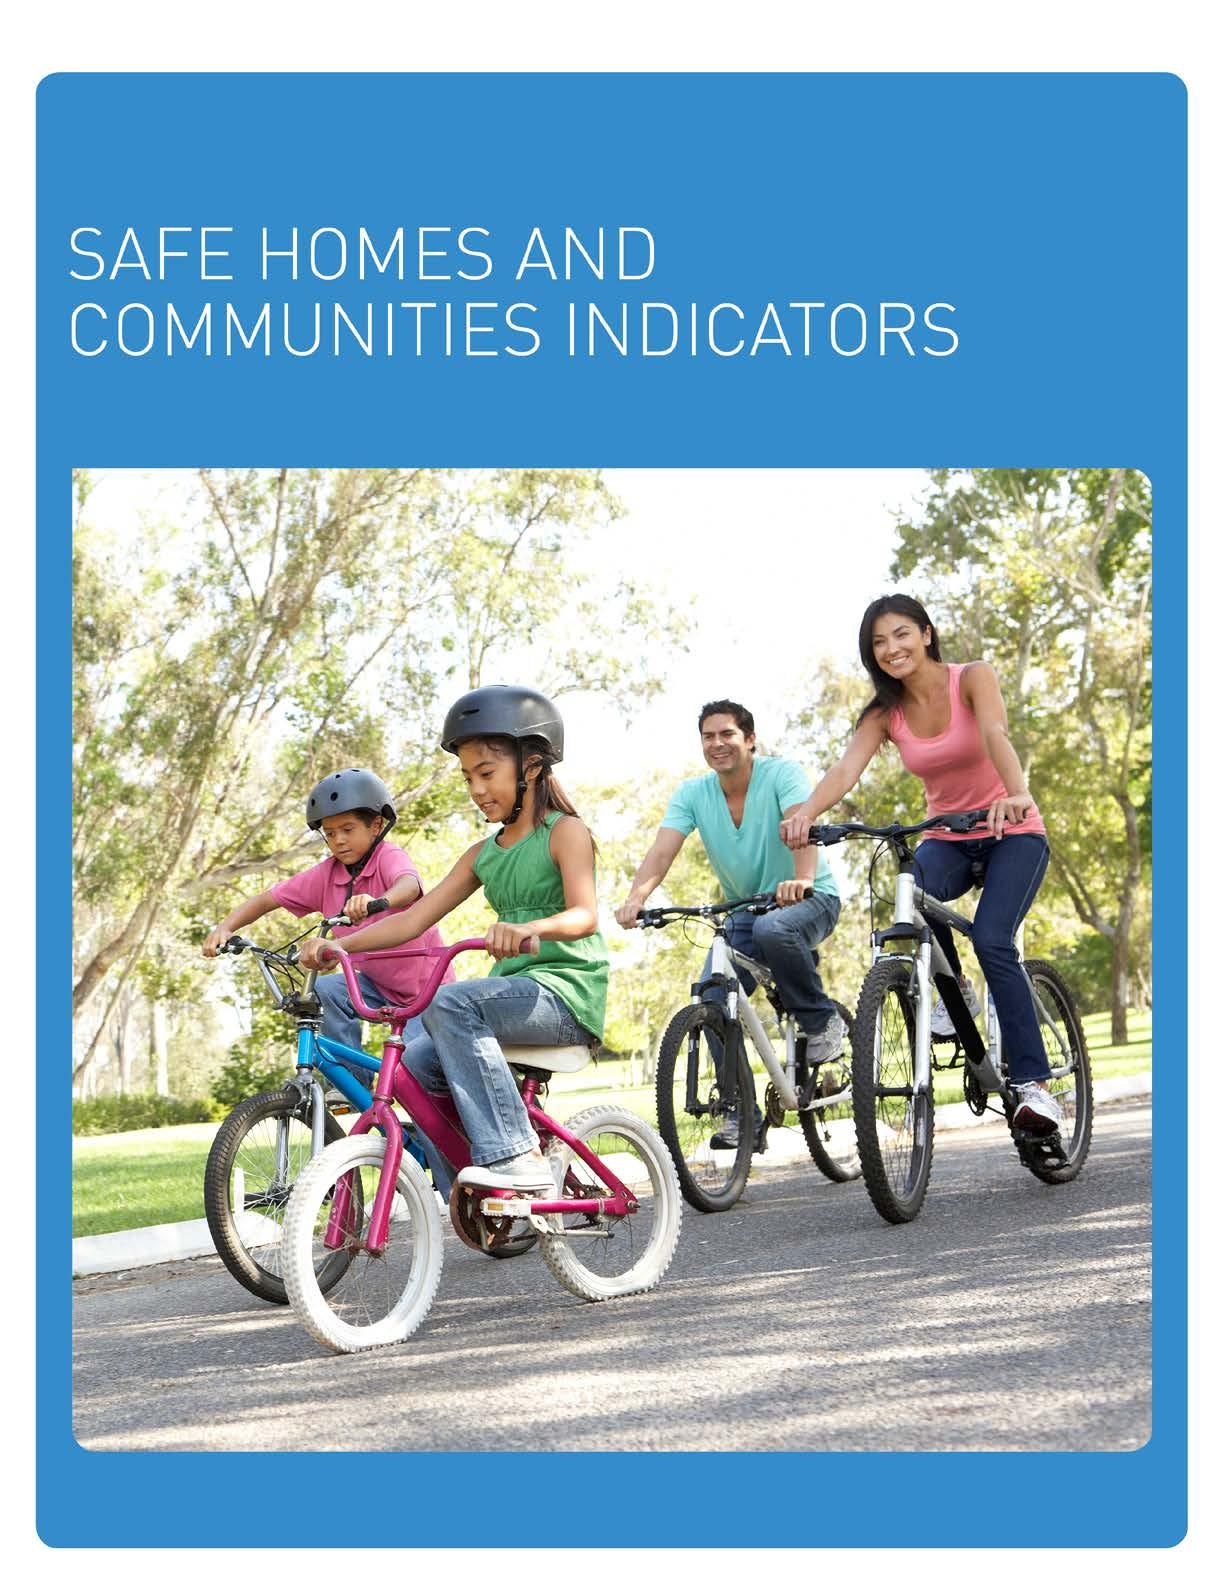
Supplemental Tables: Safe Homes and Communities
Secondary Indicator: CHILD MORTALITY
xx 83
Overall Death Rate Per 100,000 Children and Youth 1 to 19 Years of Age, 2007-2016 Source: Orange County Master Death File and California Department of Finance Number of Deaths and Rate Per 100,000 Population for Persons 0 to 19 Years of Age from Unintentional Injury Homicide and Suicide, 2007-2016 2007 2008 2009 2010 2011 Cause of Death No. Rate No. Rate No. Rate No. Rate No. Rate Unintentional Injury 57 6.7 52 6.1 44 5.3 33 4 39 4.7 Homicide 10 1.2 19 2.2 21 2.5 13 1.6 15 1.8 Suicide 8 0.9 10 1.2 12 1.4 19 2.3 12 1.4 2012 2013 2014 2015 2016 Cause of Death No. Rate No. Rate No. Rate No. Rate No. Rate Unintentional Injury 34 4.1 49 5.9 94 4.7 30 3.6 32 3.9 Homicide 12 1.4 7 0.8 9 1.1 10 1.2 12 1.4 Suicide 12 1.4 8 1.0 11 1.3 14 1.7 16 1.9 Source: Orange County Health Care Agency, Public Health Services Age 2007 2008 2009 2010 2011 2012 2013 2014 2015 2016 1-4 Years 18.5 18.7 8.9 21.9 16.2 15.6 15.0 15.0 13.0 15.0 5-9 Years 11 8.7 6 7.0 6.0 7.4 6.9 7.9 8.0 11.5 10-14 Years 8.5 13.3 2.4 9.5 9.0 12.0 10.0 7.2 4.8 9.1 15-19 Years 37.6 36 8.1 31.1 6.5 26.4 24.5 25.0 22.0 28.7 1-19 Years 18.9 19.4 19.9 17.5 15.8 15.8 14.4 14.1 12.2 16.7 156
Supplemental Tables: Safe Homes and Communities
Death Rate per 100,000 Population for Persons Age 0-19 Years from Unintentional Injury, Homicide and Suicide, by Age Group and Gender, 2007-2016
* Rates based on less than five deaths are unstable and therefore should be interpreted with caution.
84
AGE AND GENDER UNINTENTIONAL
2007 2008 2009 2010 2011 2012 2013 2014 2015 2016 < 15 Years 3.0 4.5 3.0 2.5 2.8 2.5 3.3 3.0 3.0 1.5 15-19 Years 17.6 17.5 17.6 8.0 9.5 8.1 12.5 9.1 5.2 10.0 Males 10.3 7.6 7.1 5.7 4.4 4.9 6.5 6.3 5.4 5.2 Females 2.9 4.6 3.5 2.2 4.9 3.2 5.2 3.0 1.7 2.5 AGE AND GENDER HOMICIDE 2007 2008 2009 2010 2011 2012 2013 2014 2015 2016 < 15 Years 0.3* 1.3 2.1 0.7* 0.8 0.5* 0.2* 0.2* .5 0.2* 15-19 Years 3.7 5.0 3.6 4.0 4.3 3.8 2.6 3.4 3.0 4.8 Males 1.8 3.5 2.8 2.4 3.3 2.6 1.6 1.4 2.3 2.6 Females 0.5* 1.0* 2.2 0.7* 0.2* 0.2* 0.0 0.7* 0.0 0.2* AGE AND GENDER SUICIDE 2007 2008 2009 2010 2011 2012 2013 2014 2015 2016 < 15 Years 0.0 0.2* 0.3 0.3* 0.2* 0.2* 0.3* 0.2* 0.2* 0.3* 15-19 Years 3.7 4.1 4.5 7.5 4.7 4.7 2.6 4.3 5.6 6.1 Males 1.6 2.3 1.6 3.3 1.9 1.9 1.6 1.9 1.9 3.3 Females 0.2* 0.0 1.2 1.2 1.0* 1.0* 0.2* 0.7* 1.5 0.5*
INJURY
Population
CA
Finance population
Race/Ethnic Popula tion with Age and Sex Detail, 2010-2060. Sacramento, California, February 2017
Health Services 157
Note
data from the
Department of
estimates in
Source: Orange County Health Care Agency Public
Supplemental Tables: Safe Homes and Communities
* Rates based on less than five deaths are unstable and therefore should be interpreted with caution. Population data from the CA Department of Finance population estimates in Race/Ethnic Population with Age and Sex Detail,
Source: Orange County Health Care Agency, Public Health Services
xx 85
Death Rate Per 100,000 Persons 0-19 Years of Age, by Race/Ethnicity and Cause, 2007-2016 RACE / ETHNICITY UNINTENTIONAL INJURY 2007 2008 2009 2010 2011 2012 2013 2014 2015 2016 Asian/PI 9.0 4.8 5.8 3.1* 2.3* 3.1* 5.3 1.5* 3.0* 3.8 Black 8.3* 8.4* 8.9* 9.1* 0.0 9.1* 18.3* 27.7* 9.4* 9.5* Hispanic 5.5 4.7 3.9 3.1 3.9 3.3 5.3 5.6 3.6 4.3 White 8.0 9.2 7.5 6.0 7.5 5.7 7.3 4.7 4.3 3.6 RACE / ETHNICITY HOMICIDE 2007 2008 2009 2010 2011 2012 2013 2014 2015 2016 Asian/PI 0.0 4.0* 0.8* 0.0 2.3* 0.0 0.0 0.8* 0.0 2.3* Black 0.0 8.0* 8.9* 0.0 0.0 0.0 0.0 0.0 9.4* 0.0 Hispanic 2.3 3.4 3.9 3.1 2.6 3.1 1.8 1.5 2.3 1.8 White 0.3* 0.0 1.4* 0.4* 0.7* 0.0 0.0 0.8* 0.0 0.8* RACE / ETHNICITY SUICIDE 2007 2008 2009 2010 2011 2012 2013 2014 2015 2016 Asian/PI 2.4* 1.6* 0.8* 1.5* 2.3* 2.3 0.0 0.8* 1.5* 3.0* Black 0.0 0.0 0.0 0.0 18.1* 9.1* 0.0 0.0 0.0 0.0 Hispanic 0.0 1.0* 1.0* 2.4 0.5* 0.5* 0.8* 1.0* 2.0 1.3 White 1.7 1.4* 2.5 3.0 1.9 2.3* 1.9 2.3 1.6* 2.8
2017.
158
2010-2060. Sacramento, California, February
Supplemental Tables: Safe Homes and Communities
86
2007-2016 2007 2008 2009 2010 2011 Age Group # Rate # Rate # # # Rate # Rate < 15 Years of Age 19 3.0 29 4.5 19 3.0 15 2.5 17 2.8 15-19 Years of Age 38 17.6 37 17.5 38 17.6 18 8.0 22 9.5 TOTAL 57 6.7 66 7.7 57 6.7 33 4.0 39 4.7 2012 2013 2014 2015 2016 Age Group # Rate # Rate # Rate # Rate # Rate < 15 Years of Age 15 2.5 20 3.3 18 3.0 18 3.0 9 1.5 15-19 Years of Age 19 8.1 29 12.5 21 901 12 5.2 23 10.0 TOTAL 34 4.1 49 5.9 39 4.7 30 3.6 32 3.9
2007 2008 2009 2010 2011 Gender # Rate # Rate # Rate # Rate # Rate Male 45 10.3 33 7.6 30 7.1 24 5.7 19 4.4 Female 12 2.9 19 4.6 14 3.5 9 2.2 20 4.9 TOTAL 57 6.7 52 6.1 44 5.3 33 4.0 39 4.7 2012 2013 2014 2015 2016 Gender # Rate # Rate # Rate # Rate # Rate Male 21 4.9 28 6.5 27 6.3 23 5.4 22 5.2 Female 13 3.2 21 5.2 12 3.0 7 1.7 10 2.5 TOTAL 34 4.1 49 5.9 39 4.7 30 3.6 32 3.9 *
Note: Population data from
CA Department
Finance population
2010-2060. Sacramento,
February 2017
2013
rates
Source:
Care
Health Services 159
Secondary Indicator: UNINTENTIONAL INJURY DEATHS Number and Rate per 100,000 Persons of Unintentional Injury Deaths, by Age Group,
Source: Orange County Health Care Agency Public Health Services Number and Rate per 100,000 Persons 0 to 19 Years of Age for Unintentional Injury Deaths, by Gender, 2007-2016
Rates based on less than five deaths are unstable and therefore should be interpreted with caution.
the
of
estimates in Race/Ethnic Population with Age and Sex Detail,
California,
Rates for years 2010-
have been adjusted accordingly and may differ from
computed in previous report s.
Orange County Health
Agency Public
Supplemental Tables: Safe Homes and Communities
*Includes motor vehicle versus bicycle and pedestrian. *Please note: Rates based on less than five deaths are unstable and therefore should be interpreted with caution. Population data from the CA Department of Finance population estimates in Race/Ethnic Popul ation with Age and Sex Detail.
Health Care Agency, Public Health Services
** Rates based on less than five deaths are unstable and therefore should be interpreted with caution Population data from the CA Department of Finance population estimates in Race/Ethnic Populat ion with Age and Sex Detail, 2010-2060. Sacramento, California, February 2017. Source: Orange County Health Care Agency, Public Health Services
xx 87
Number and Rate per 100,000 Persons 0 to 19 Years of Age for Unintentional Injury Deaths, by Cause, 2007-2016 2007 2008 2009 2010 2011 Cause # Rate # Rate # # # Rate # Rate Motor Vehicle** 32 3.8 31 3.7 21 2.5 13 1.6 19 2.3 Drowning 8 0.9 8 .9 3 0.4* 2 0.2* 1 0.1* Other 17 2.0 13 1.5 20 2.4 18 2.2 19 2.3 TOTAL 57 6.7 52 6.1 44 5.3 33 4.0 39 4.7 2012 2013 2014 2015 2016 Cause # Rate # Rate # Rate # Rate # Rate Motor Vehicle** 12 1.4 27 3.2 27 3.2 16 1.9 21 2.5 Drowning 9 1.1 7 0.8 5 0.6 5 0.6 3 0.4* Other 13 1.6 15 1.8 7 0.8 9 1.1 8 1.0 TOTAL 34 4.1 49 5.9 39 4.7 30 3.6 32 3.9
Sacramento, California, February 2017. Source: Orange County
Number and Rate per 100,000 Persons 0 to 19 Years of Age for Unintentional
Deaths, by Race/Ethnicity, 2007-201 6 2007 2008 2009 2010 2011 Ethnicity # Rate # Rate # Rate # Rate # Rate White 24 8.0 27 9.2 21 7.5 16 6.0 20 7.5 Black 1 8.3* 1 8.4* 1 8.9* 1 9.1* 0 0.0 Hispanic 21 5.5 18 4.7 15 3.9 12 3.1 15 3.9 Asian/Pacific Islander 11 9.0 6 4.8 7 5.8 4 3.1* 3 2.3* TOTAL 57 6.7 52 6.1 44 5.3 33 4.0 39 4.7 2012 2013 2014 2015 2016 Ethnicity # Rate # Rate # Rate # Rate # Rate White 15 5.7 19 7.3 12 4.7 11 4.3 9 3.6 Black 1 9.1* 2 18.3* 3 27.7* 1 9.4* 1 9.5* Hispanic 13 3.3 21 5.3 22 5.6 14 3.6 17 4.3 Asian/Pacific Islander 4 3.1* 7 5.3 2 1.5* 4 3.0* 5 3.8 TOTAL 34 4.1 49 5.9 39 4.7 30 3.6 32 3.9
2010-2060,
Injury
160
Supplemental Tables: Safe Homes and Communities
*Rates based on less than five deaths are unstable and therefore should be interpreted with caution.
*Rates based on less than five deaths are unstable and therefore should be interpreted with caution.
88
2007 2008 2009 2010 2011 Age Group # Rate # Rate # Rate # Rate # Rate < 15 Years of Age 2 0.3* 8 1.3 13 2.1 4 0.7* 5 0.8 15-19 Years of Age 8 3.7 11 5.0 8 3.6 9 4.0 10 4.3 TOTAL 10 1.2 19 2.2 21 2.5 13 1.6 5 0.8 2012 2013 2014 2015 2016 Age Group # Rate # Rate # Rate # Rate # Rate < 15 Years of Age 3 0.5* 1 0.2* 1 0.2* 3 0.5 1 0.2* 15-19 Years of Age 9 3.8 6 2.6 8 3.4 7 3.0 11 4.8 TOTAL 3 0.5* 1 0.2* 1 0.2* 3 0.5 12 1.4
Source:
2007 2008 2009 2010 2011 Gender # Rate # Rate # Rate # Rate # Rate Male 8 1.8 15 3.5 12 2.8 10 2.4 14 3.3 Female 2 0.5* 4 1.0* 9 2.2 3 0.7* 1 0.2* TOTAL 10 1.2 19 2.2 21 2.5 13 1.6 15 1.8 2012 2013 2014 2015 2016 Gender # Rate # Rate # Rate # Rate # Rate Male 11 2.6 7 1.7 6 1.5 10 2.3 11 2.6 Female 1 0.3* 0 0.0 3 0.8* 0 0.0 1 0.2* TOTAL 12 1.5 7 0.9 9 1.1 10 1.2 12 1.4
Secondary Indicator: HOMICIDE DEATHS/LEGAL INTERVENTIONS Number and Rate per 100,000 Persons of Homicide Deaths, by Age Group, 2007-2016
Orange County Health Care Agency Public Health Services Number and Rate per 100,000 Persons 0 to 19 Years of Age for Homicide Deaths, by Gender, 2007-2016
161
Source: Orange County Health Care Agency Public Health Services
Supplemental Tables: Safe Homes and Communities
*Rates based on less than five deaths are unstable and therefore should be interpreted with caution. Population data from the CA Department of Finance population estimates in Race/Ethnic Population with Age and Sex Detail. 2010-2060, Sacramento, California, February 2017. Source: County of Orange Health Care Agency, Public Health Services. Source: Orange County Health Care Agency Public Health Services
Orange County Health Care Agency Public Health Services
*Please note: Rates based on less than five deaths are unstable and therefore should be interpreted with caution. Population data from the CA Department of Finance population estimates in Race/Ethnic Population with Age and Sex Detail, 2010-2060, Sacramento, California, February 2017. Source: Orange County Health Care Agency, Public Health Services
xx 89
Number and Rate per 100,000 Persons 0 to 19 Years of Age for Homicide Deaths, by Race/Ethnicity, 2007-2016 2007 2008 2009 2010 2011 Ethnicity # Rate # Rate # Rate # Rate # Rate White 1 0.3* 0 0.0 4 1.4* 1 0.4* 2 0.7* Black 0 0.0 1 8.4* 1 8.9* 0 0.0 0 0.0 Hispanic 9 2.3 13 3.4 15 3.9 12 3.1 10 2.6 Asian/Pacific Islander 0 0.0 2 1.6* 1 0.8* 0 0.0 3 2.3* TOTAL 10 1.2 19 2.2 21 2.5 13 1.6 15 1.8 2012 2013 2014 2015 2016 Ethnicity # Rate # Rate # Rate # Rate # Rate White 0 0.0 0 0.0 2 0.8* 0 0.0 2 0.8* Black 0 0.0 0 0.0 0 0.0 1 9.4* 0 0.0 Hispanic 12 3.1 7 1.8 6 1.5 9 2.3 7 1.8 Asian/Pacific Islander 0 0.0 0 0.0 1 0.8* 0 0.0 3 2.3* TOTAL 12 1.4 7 0.9 9 1.1 10 1.2 12 1.4
Percent of Homicides of Total Deaths from Unintentional Injury, Homicide and Suicide for Persons 0 to 19 Years of Age , 20072016 DEATHS 2007 2008 2009 2010 2011 2012 2013 2014 2015 2016 % Homicide 13.3 23.5 27.3 20.0 22.7 20.7 10.9 15.3 18.5 20.0
Homicides Death Rate Per 100,000 Persons 0 to 19 Years of Age in Orange County and California , 2007-2016 AREA 2007 2008 2009 2010 2011 2012 2013 2014 2015 2016 Orange County 1.2 2.2 2.5 1.6 1.8 1.4 0.8 1.1 1.2 1.4 California 4.6 4.5 4.4 3.8 3.6 3.3 2.8 2.4 2.7 2.4
Source:
162
Supplemental Tables: Safe Homes and Communities
90
Secondary Indicator: SUICIDE DEATHS Number and Rate per 100,000 Persons of Suicide Deaths, by Age Group, 2007-2016 2007 2008 2009 2010 2011 Age Group # Rate # Rate # Rate # Rate # Rate < 15 Years of Age 0 0.0 1 0.2* 0 0.0 2 0.3* 1 0.2* 15-19 Years of Age 8 3.7 12 5.7 8 3.7 17 7.5 11 4.7 TOTAL 8 0.9 13 1.5 8 0.9 19 2.3 12 1.4 2012 2013 2014 2015 2016 Age Group # Rate # Rate # Rate # Rate # Rate < 15 Years of Age 1 0.2* 2 0.3* 1 0.2* 1 0.2* 2 0.3* 15-19 Years of Age 11 4.7 6 2.6 10 4.3 13 5.6 14 6.1 TOTAL 12 1.4 8 1.0 11 1.3 14 1.7 16 1.9 Source: Orange County Health Care Agency Public Health Services Number and Rate per 100,000 Persons 0 to 19 Years of Age for Suicide Deaths, by Gender, 2007-2016 2007 2008 2009 2010 2011 Gender # Rate # Rate # Rate # Rate # Rate Male 7 1.6 10 2.3 7 1.6 14 3.3 8 1.9 Female 1 0.2* 0 0.0 5 1.2 5 1.2 4 1.0* TOTAL 8 0.9 10 1.2 12 1.4 19 2.3 12 1.5 2012 2013 2014 2015 2016 Gender # Rate # Rate # Rate # Rate # Rate Male 8 1.9 7 1.6 8 1.9 8 1.9 14 3.3 Female 4 1.0* 1 0.2* 3 0.7* 6 1.5 2 0.5* TOTAL 12 1.5 8 1.0 11 1.3 14 1.7 16 1.9 * Rates based on less than five deaths are unstable and therefore should be interpreted with caution. Source: Orange County Health Care Agency Public Health Services 163
Supplemental Tables: Safe Homes and Communities
*Rates based on less than five deaths are unstable and therefore should be interpreted with caution. Population data from the CA Department of Finance population estimates in Race/Ethnic Popul ation with Age and Sex Detail,
Health Care Agency, Public Health Services
xx 91
Number and Rate per 100,000 Persons 0 to 19 Years of Age for Suicide Deaths, by Race and Ethnicity, 2007-2016 2007 2008 2009 2010 2011 Ethnicity # Rate # Rate # Rate # Rate # Rate White 5 1.7 9 2.9 5 1.7 8 3.0 5 1.9 Black 0 0.0 0 0.0 0 0.0 0 0.0 2 18.1* Hispanic 0 0.0 1 0.3* 0 0.0 9 2.4 2 0.5* Asian/PI 3 2.4* 3 2.5* 3 2.4* 2 1.5* 3 2.3* TOTAL 8 0.9 13 1.5 8 0.9 19 2.3 12 1.4 2012 2013 2014 2015 2016 Ethnicity # Rate # Rate # Rate # Rate # Rate White 6 2.3 5 1.9 6 2.3 4 1.6* 7 2.8 Black 1 9.1* 0 0.0 0 0.0 0 0.0 0 0.0 Hispanic 2 0.5* 3 0.8* 4 1.0* 8 2.0* 5 1.3 Asian/PI 3 2.3* 0 0.0 1 0.8* 2 1.5* 4 3.0* TOTAL 12 1.4 8 1.0 11 1.3 14 1.7 16 1.9
2010-2060, Sacramento, California, February 2017. Source: Orange County
Total Number and Rate per 100,000 Population of Leading Causes of Death, by Age Group, 2007-2016 2007 Cause <1 Year 1-4 Years 5-9 Years 10-14 Years 15-19 Years 0-19 Years No. Rate No. Rate No. Rate No. Rate No. Rate No. Rate Accidents 1 2.5* 10 6.2 4 1.9* 4 1.8* 38 17.6 57 6.7 Cancer 2 5.0* 6 3.7 8 3.8 7 3.1 10 4.6 33 3.9 Congenital Anomalies 55 136.2 1 0.6* 0 0.0 2 0.9* 0 0.0 58 6.8 Homicide 1 2.5* 1 0.6* 0 0.0 0 0.0 8 3.7 10 1.2 Suicide 0 0.0 0 0.0 0 0.0 0 0.0 8 3.7 8 0.9 SIDS 3 7.4* 0 0.0 0 0.0 0 0.0 0 0.0 0 0.0 Short Gestation and Low Birth Weight 16 39.6 0 0.0 0 0.0 0 0.0 0 0.0 0 0.0 Diseases of the Heart 2 5.0* 0 0.0 1 0.5* 2 0.9* 2 0.9* 7 0.8 Cerebrovascular 0 0.0 0 0.0 0 0.0 0 0.0 1 0.5* 1 0.1* Neonatal Hemorrhage 6 14.9 0 0.0 0 0.0 0 0.0 0 0.0 0 0.0 Other 101 250.2 12 7.4 10 4.8 4 1.8 14 6.5 166 19.5 Total Deaths 187 463.2 30 18.5 23 11.0 19 8.5 81 37.6 340 40.0 Age Group Population 40,367 162,577 209,282 222,734 215,558 850,518 164
Supplemental Tables: Safe Homes and Communities
92
Total Number and Rate per 100,000 Population of Leading Causes of Death, by Age Group, 2007-2016 (continued) 2008 Cause <1 Year 1-4 Years 5-9 Years 10-14 Years 15-19 Years 0-19 Years No. Rate No. Rate No. Rate No. Rate No. Rate No. Rate Accidents 3 7.5* 14 8.7 0 0.0 5 2.3 30 13.7 52 6.1 Cancer 1 2.5* 4 2.5* 7 3.4 10 4.6 10 4.6 32 3.8 Congenital Anomalies 64 159.0 4 2.5* 0 0.0 2 0.9* 3 1.4* 73 8.6 Homicide 2 5.0* 2 1.2* 2 1.0* 2 0.9* 11 5.0 19 2.2 Suicide 0 0.0 0 0.0 0 0.0 1 0.5* 9 4.1 10 1.2 SIDS 4 9.9* 0 0.0 0 0.0 0 0.0 0 0.0 4 0.5* Short Gestation and Low Birth Weight 14 34.8 0 0.0 0 0.0 0 0.0 0 0.0 14 1.7 Diseases of the Heart 9 22.4 1 0.6* 1 0.5* 1 0.5* 3 1.4* 15 1.8 Cerebrovascular 0 0.0 0 0.0 1 0.5* 0 0.0 1 0.5* 2 0.2* Neonatal Hemorrhage 5 12.4 0 0.0 0 0.0 0 0.0 0 0.0 5 0.6 Other 100 248.4 5 3.1 7 3.4 8 3.7 12 5.5 132 15.6 Total Deaths 202 501.9 30 18.7 18 8.7 29 13.3 79 36.0 358 42.3 Age Group Population 40,250 160,738 206,586 218,622 219,703 845,899 2009 Cause <1 Year 1-4 Years 5-9 Years 10-14 Years 15-19 Years 0-19 Years No. Rate No. Rate No. Rate No. Rate No. Rate No. Rate Accidents 4 10.7* 8 5.1 3 1.5* 5 2.4 24 10.8 44 5.3 Cancer 2 5.4* 3 1.9* 5 2.5 11 5.3 6 2.7 27 3.3 Congenital Anomalies 56 150.3 3 1.9* 1 0.5* 1 0.5* 4 1.8* 65 7.9 Homicide 6 16.1 6 3.8 1 0.5* 0 0.0 8 3.6 21 2.5 Suicide 0 0.0 0 0.0 0 0.0 2 1.0* 10 4.5 12 1.4 SIDS 0 0.0 0 0.0 0 0.0 0 0.0 0 0.0 0 0.0 Short Gestation and Low Birth Weight 5 13.4 0 0.0 0 0.0 0 0.0 0 0.0 5 0.6 Diseases of the Heart 4 10.7* 2 1.3* 0 0.0 1 0.5* 3 1.3* 10 1.2 Cerebrovascular 3 8.1* 0 0.0 1 0.5* 0 0.0 0 0.0 4 0.5* Neonatal Hemorrhage 0 0.0 0 0.0 0 0.0 0 0.0 0 0.0 0 0.0 Other 85 228.2 14 8.9 12 6.0 5 2.4 18 8.1 134 16.2 Total Deaths 165 442.9 36 22.9 23 11.4 25 11.9 73 32.8 322 38.9 Age Group Population 37,256 157,469 200,945 209,259 222,784 827,713 165
Supplemental Tables: Safe Homes and Communities
xx 93
Total Number and Rate per 100,000 Population of Leading Causes of Death, by Age Group, 2007-2016 (Continued) 2010 Cause <1 Year 1-4 Years 5-9 Years 10-14 Years 15-19 Years 0-19 Years No. Rate No. Rate No. Rate No. Rate No. Rate No. Rate Accidents 2 5.4* 10 6.4 1 0.5* 2 0.9* 18 8.0 33 4.0 Cancer 0 0.0 4 2.6* 4 2.0* 2 0.9* 6 2.7 16 1.9 Congenital Anomalies 41 110.5 8 5.2 1 0.5* 0 0.0 2 0.*9 52 6.3 Homicide 2 5.4* 0 0.0 1 0.5* 1 0.5* 9 4.0 13 1.6 Suicide 0 0.0 0 0.0 0 0.0 2 0.9* 17 7.5 19 2.3 SIDS 2 5.3* 0 0.0 0 0.0 0 0.0 0 0.0 2 0.2* Short Gestation and Low Birth Weight 8 21.6 0 0.0 0 0.0 0 0.0 0 0.0 8 1.0 Diseases of the Heart 2 5.4* 1 0.6* 1 0.5* 2 0.9* 1 0.4* 7 0.8 Cerebrovascular 0 0.0 0 0.0 0 0.0 1 0.5* 1 0.4* 2 0.2* Neonatal Hemorrhage 3 8.1* 0 0.0 0 0.0 0 0.0 0 0.0 3 0.4* Other 87 234.4 11 7.1 6 3.0 10 4.7 16 7.1 130 15.7 Total Deaths 147 396.0 34 21.9 14 7.0 20 9.5 70 31.1 285 34.4 Age Group Population 37,119 155,043 199,228 210,908 225,190 827,488 2011 Cause <1 Year 1-4 Years 5-9 Years 10-14 Years 15-19 Years 0-19 Years No. Rate No. Rate No. Rate No. Rate No. Rate No. Rate Accidents 3 7.9* 9 5.8 3 1.5* 2 1.0* 22 9.5 39 4.7 Cancer 2 5.2* 3 1.9* 2 1.0* 4 1.9* 10 4.3 21 2.5 Congenital Anomalies 50 130.9 2 1.3* 1 0.5* 4 1.9* 2 0.9* 59 7.1 Homicide 3 7.9* 1 0.6* 0 0.0 1 0.5* 10 4.3 15 1.8 Suicide 0 0.0 0 0.0 0 0.0 1 0.5* 11 4.7 12 1.4 SIDS 0 0.0 0 0.0 0 0.0 0 0.0 0 0.0 0 0.0 Short Gestation and Low Birth Weight 10 26.2 0 0.0 0 0.0 0 0.0 0 0.0 10 1.2 Diseases of the Heart 1 2.6* 3 1.9* 0 0.0 1 0.5* 0 0.0 5 0.6 Cerebrovascular 1 2.6* 0 0.0 0 0.0 1 0.5* 0 0.0 2 0.2* Neonatal Hemorrhage 4 10.5* 0 0.0 0 0.0 0 0.0 0 0.0 4 0.5* Other 86 225.1 7 4.5 6 3.0 5 2.4 15 6.5 119 14.3 Total Deaths 160 418.8 25 16.2 12 6.0 19 9.0 70 30.1 286 34.3 Age Group Population 38,207 154,446 199,292 210,448 232,510 834,963 166
Supplemental Tables: Safe Homes and Communities
94
Total Number and Rate per 100,000 Population of Leading Causes of Death, by Age Group, 2007-2016 (Continued) 2012 Cause <1 Year 1-4 Years 5-9 Years 10-14 Years 15-19 Years 0-19 Years No. Rate No. Rate No. Rate No. Rate No. Rate No. Rate Accidents 0 0.0 9 6.0 3 1.5 3 1.5 19 8.7 34 4.2 Cancer 0 0.0 3 2.0 2 1.0 6 2.9 8 3.7 19 2.4 Congenital Anomalies 50 133.4 4 2.7 1 0.5 3 1.5 0 0.0 58 7.2 Homicide 1 2.7 0 0.0 0 0.0 2 1.0 9 4.1 12 1.5 Suicide 0 0.0 0 0.0 0 0.0 1 0.5 11 5.0 12 1.5 SIDS 2 5.3 0 0.0 0 0.0 0 0.0 0 0.0 2 0.2 Short Gestation and Low Birth Weight 12 32.0 0 0.0 0 0.0 0 0.0 0 0.0 12 1.5 Diseases of the Heart 0 0.0 1 0.7 2 1.0 0 0.0 4 1.8 7 0.9 Cerebrovascular 1 2.7 0 0.0 1 0.5 1 0.5 0 0.0 3 0.4 Neonatal Hemorrhage 0 0.0 0 0.0 0 0.0 0 0.0 0 0.0 0 0.0 Other 64 170.8 7 4.7 6 3.0 9 4.4 11 5.0 97 12.0 Total Deaths 130 346.9 24 16.0 15 7.6 25 12.3 62 28.4 256 31.7 Age Group Population 37,692 151,170 197,689 205,204 222,302 814,057 2013 Cause <1 Year 1-4 Years 5-9 Years 10-14 Years 15-19 Years 0-19 Years No. Rate No. Rate No. Rate No. Rate No. Rate No. Rate Accidents 3 8.0* 8 5.2 4 2.0* 5 2.4 29 12.5 49 5.9 Cancer 0 0.0 2 1.3* 3 1.5* 5 2.4 5 2.1 15 1.8 Congenital Anomalies 26 69.0 4 2.6* 1 0.5* 1 0.5* 2 0.9* 34 4.1 Homicide 0 0.0 0 0.0 0 0.0 1 0.5* 6 2.6 7 0.8 Suicide 0 0.0 0 0.0 0 0.0 2 1.0* 6 2.6 8 1.0 SIDS 0 0.0 0 0.0 0 0.0 0 0.0 0 0.0 0 0.0 Short Gestation and Low Birth Weight 11 29.2 0 0.0 0 0.0 0 0.0 0 0.0 11 1.3 Diseases of the Heart 1 2.7* 0 0.0 0 0.0 1 0.5* 2 0.9* 4 0.5* Cerebrovascular 0 0.0 1 0.7* 0 0.0 1 0.5* 0 0.0 2 0.2* Neonatal Hemorrhage 1 2.7* 0 0.0 0 0.0 0 0.0 0 0.0 0 0.0 Other 81 215 8 5.2 6 3.0 5 2.4 7 3.0 108 12.9 Total Deaths 123 326.4 23 15.0 14 6.9 21 10.0 57 24.5 238 29.5 Age Group Population 37,679 152,957 152,957 208,995 232,835 835,252 167
Supplemental Tables: Safe Homes and Communities
xx 95
Total Number and Rate per 100,000 Population of Leading Causes of Death, by Age Group, 2007-2016 (Continued) 2014 Cause <1 Year 1-4 Years 5-9 Years 10-14 Years 15-19 Years 0-19 Years No. Rate No. Rate No. Rate No. Rate No. Rate No. Rate Accidents 1 2.6* 5 3.3 3 1.5* 9 4.3 21 9.1 39 4.7 Cancer 0 0.0 2 1.3* 5 2.5 4 1.9* 3 1.3* 14 1.7 Congenital Anomalies 39 102.7 4 2.6* 2 1.0* 1 0.5* 3 1.3* 49 5.9 Homicide 0 0.0 0 0.0 1 0.5* 0 0.0 8 3.4 9 1.1 Suicide 0 0.0 0 0.0 0 0.0 1 0.5* 10 4.3 11 1.3 SIDS 0 0.0 0 0.0 0 0.0 0 0.0 0 0.0 0 0.0 Short Gestation and Low Birth Weight 4 10.5* 0 0.0 0 0.0 0 0.0 0 0.0 0 0.0 Diseases of the Heart 1 2.6* 1 0.7* 0 0.0 0 0.0 1 0.4* 3 0.4* Cerebrovascular 0 0.0 0 0.0 0 0.0 0 0.0 0 0.0 0 0.0 Neonatal Hemorrhage 2 5.3* 0 0.0 0 0.0 0 0.0 0 0.0 2 0.2* Other 68 179.0 11 7.2 5 2.5 0 0.0 12 5.2 100 12.0 Total Deaths 115 302.8 23 15.0 16 7.9 15 7.2 58 25.0 227 27.2 Age Group Population 37,984 153,191 202,151 208,554 231,924 833,804 2015 Cause <1 Year 1-4 Years 5-9 Years 10-14 Years 15-19 Years 0-19 Years No. Rate No. Rate No. Rate No. Rate No. Rate No. Rate Accidents 5 13.0 6 3.9 5 2.5 2 1.0* 12 5.2 30 3.6 Cancer 0 0.0 2 1.3* 2 1.0* 1 0.5* 1 0.4* 6 0.7 Congenital Anomalies 16 41.5 3 2.0* 3 1.5* 0 0.0 2 0.9* 24 2.9 Homicide 2 5.2* 1 0.7* 0 0.0 0 0.0 7 3.0 10 1.2 Suicide 0 0.0 0 0.0 0 0.0 1 0.5* 13 5.6 14 1.7 SIDS 0 0.0 0 0.0 0 0.0 0 0.0 0 0.0 0 0.0 Short Gestation and Low Birth Weight 7 18.2 0 0.0 0 0.0 0 0.0 0 0.0 7 0.8 Diseases of the Heart 1 2.6* 1 0.7* 1 0.5* 1 0.5* 2 0.9* 6 0.7 Cerebrovascular 0 0.0 0 0.0 0 0.0 0 0.0 2 0.9* 2 0.2* Neonatal Hemorrhage 4 10.4* 0 0.0 0 0.0 0 0.0 0 0.0 4 0.5* Other 65 168.6 7 4.6 5 2.5 5 2.4 12 5.2 94 11.3 Total Deaths 100 259.4 20 13.0 16 8.0 10 4.8 51 22.0 197 23.7 Age Group Population 38,546 153,793 200,568 207,602 231,533 832,042 168
Supplemental Tables: Safe Homes and Communities
Total Number and Rate per 100,000 Population of Leading Causes of Death, by Age Group, 2007 -2016 (Continued)
*Rates based on fewer than five events are statistically unreliable. Population data from the CA Department of Finance population estimates in Race/Ethnic Population with Age and Sex
2060, Sacramento, California, February 2017. Source: Orange County Health Care Agency Family Health Division
96
201 0-
Detail,
2016 Cause <1 Year 1-4 Years 5-9 Years 10-14 Years 15-19 Years 0-19 Years No. Rate No. Rate No. Rate No. Rate No. Rate No. Rate Accidents 1 2.7 3 2.0 2 1.0 3 1.5 23 10.0 32 3.9 Cancer 0 0.0 8 5.2 10 5.0 7 3.4 8 3.5 33 4.0 Congenital Anomalies 29 77.9 3 2.0 4 2.0 1 0.5 1 0.4 38 4.6 Homicide 0 0.0 0 0.0 0 0.0 1 0.5 11 4.8 12 1.4 Suicide 0 0.0 0 0.0 0 0.0 2 1.0 14 6.1 16 1.9 SIDS 0 0.0 0 0.0 0 0.0 0 0.0 0 0.0 0 0.0 Short Gestation and Low Birth Weight 8 21.5 0 0.0 0 0.0 0 0.0 0 0.0 8 1.0 Diseases of the Heart 3 8.1 0 0.0 1 0.5 0 0.0 0 0.0 4 0.5 Cerebrovascular 1 2.7 0 0.0 0 0.0 0 0.0 0 0.0 1 0.1 Neonatal Hemorrhage 3 8.1 0 0.0 0 0.0 0 0.0 0 0.0 3 0.4 Other 59 158.5 9 5.9 6 3.0 6 2.9 9 3.9 89 10.7 Total Deaths 104 279.3 23 15.0 23 11.5 20 9.7 66 28.7 236 28.5 Age Group Population 37,230 153,774 200,276 206,817 229,967 828,064 169
Supplemental Tables: Safe Homes and Communities
Secondary Indicator: CHILD AND YOUTH DEATHS
xx 97
Manner of Death, Children Less than 18 Years of Age, 2017 Manner No. % of Child of Deaths Reviewed, by Manner Type of Death No. % of Child of Deaths Reviewed % of Manner Natural 25 50.0% Congenital 4 8.0% 16.0% Diseases/ Conditions 21 42.0% 84.0% SIDS 0 0.0% 0.0% Unintentional Injury 15 30.0% Asphyxia 1 2.0% 6.7% Drowning 4 8.0% 26.7% Overdose 1 2.0% 6.7% Vehicular 9 18.0% 60.0% Homicide 2 4.0% Gunshot 1 2.0% 50.0% Fall 1 2.0% 50.0% Suicide 8 16.0% Asphyxia 4 8.0% 50.0% Gunshot 4 8.0% 50.0% Total 50 100.0% Source: 2017 Orange County Child Death Review Team (CDRT). Orange County CDRT examined deaths of children who resided in Orange County r eported to the Coroner in 2017 The age range for child death is defined as live birth through 17 years. CDRT does not examine all deaths. 170
Supplemental Tables: Safe Homes and Communities
Secondary Indicator: MOTOR VEHICLE ACCIDENTS
* Includes motor vehicle versus bicycle and pedestrian. http://epicenter.cdph.ca.gov/ReportMenus/DataSummaries.aspx
98
Number of Victims 0 to 19 Years of Age Killed or Injured as a Result of Motor Vehicle Accidents*, by Age Group, 2007-2016 2007 2008 2009 2010 2011 AGE Killed Injured Killed Injured Killed Injured Killed Injured Killed Injured 0-4 5 35 6 35 2 36 3 28 2 48 5-9 2 34 0 47 3 49 1 40 3 48 10-14 1 78 5 62 3 51 2 58 1 59 15-19 24 269 20 226 13 192 7 159 13 160 TOTAL 32 416 31 370 21 328 13 285 19 315 2012 2013 2014 2015 2016 AGE Killed Injured Killed Injured Killed Injured Killed Injured Killed Injured 0-4 1 24 1 4 1 22 3 N/A 3 N/A 5-9 1 48 4 21 2 26 4 N/A 2 N/A 10-14 1 58 3 37 8 32 2 N/A 2 N/A 15-19 9 141 19 138 16 160 7 N/A 14 N/A TOTAL 12 271 27 236 27 240 16 N/A 21 N/A
171
Supplemental Tables: Safe Homes and Communities
*Non-fatal data are derived from hospitalization records non -fatal injuries not resulting in hospitalization are not included in the table. Data from EPI Center California Injury Data Online. http://epicenter.cdph.ca.gov/ReportMenus/CustomTables.aspx
Source: Orange County Health Care Agency Public Health Services
xx 99
Secondary Indicator:
Number of Gun-Related Incidents with Children 0 to 19 Years of Age, by Type of Incident, 2007-2016 NON-FATAL* FATAL YEAR Assault SelfInflicted Accidental Total Injured by Guns Homicide Suicide Accidental Total Killed by Guns 2007 34 0 3 37 8 0 0 8 2008 39 0 9 48 12 2 0 14 2009 21 0 5 26 10 4 0 14 2010 25 1 9 35 10 4 1 15 2011 16 0 9 25 8 3 1 12 2012 16 0 10 26 8 2 0 10 2013 7 1 4 12 5 2 0 7 2014 21 0 3 24 9 2 1 12 2015 N/A N/A N/A N/A 7 4 0 11 2016 N/A N/A N/A N/A 7 6 0 13
CHILDREN AND GUNS
172
Supplemental Tables: Safe Homes and Communities
Indicator: SUBSTANTIATED CHILD ABUSE ALLEGATIONS
Counts of Children with One or More Reports, by Age and Disposition, 2017 Disposition
Notes: Total count and percent calculations do not include disposition “not yet determined”
Source: CWS/CMS 2017 Quarter 4 Extract. Webster, D., Armijo, M., Lee, S., Dawson, W., Magruder, J., Exel, M., Cuccaro-Alamin, S., Putnam-Hornstein,
A., Yee, H., Xiong, B., Benton, C., White, J., & Cotto, H. (2018). CCWIP reports. Retrieved 5/1/2018, from University of Cali fornia at Berkeley California Child Welfare Indicators Project website. URL: <http://cssr.berkeley.edu/ucb_childwelfare>
Substantiated Child Abuse Allegations, by Percent for Children Under 18 Years, by Type of Abuse, 2008-2017
Note: A child is counted only once in category of highest severity. Percent calculations do not include "missing"
Source: CWS/CMS 2017 Quarter 4 Extract. Webster, D., Armijo, M., Lee, S., Dawson, W., Magruder, J., Exel, M., Cuccaro -Alamin, S., Putnam-Hornstein, E., Wiegmann, W., Rezvani, G., Eyre, M., Sandoval, A., Yee, H., Xiong, B., Benton, C., White, J., & Cotto, H. (2017). CCWIP reports. Retrieved 5/1/2018, from Universi ty of California at Berkeley California Child Welfare Indicators Project website. URL: <http://cssr.berkeley.edu/ucb_child welfare>
100
Age-Class Substantiated Inconclusive Unfounded Assessment Only Total No. % No. % No. % No. % No. % <1 Year 591 12.8% 321 6.6% 438 4.4% 256 4.3% 1,810 5.7% 1-2 Years 624 13.5% 576 11.8% 794 8.0% 338 5.6% 2,697 8.5% 3-5 Years 795 17.2% 873 17.9% 1,503 15.2% 743 12.4% 4,607 14.5% 6-10 Years 1,293 27.9% 1,410 28.9% 3,235 32.7% 1,767 29.5% 9,506 30.0% 11-15 Years 983 21.2% 1,256 25.7% 2,905 29.3% 1,942 32.4% 9,267 29.2% 16-17 Years 342 7.4% 451 9.2% 1,023 10.3% 945 15.8% 3,796 12.0% Total 4,628 100.0% 4,887 100.0% 9,898 100.0% 5,991 100.0% 31,683 100.0%
E., Wiegmann, W., Rezvani, G., Eyre, M.,
Sandoval,
Type of Abuse 2008 2009 2010 2011 2012 2013 2014 2015 2016 2017 Sexual Abuse 10.8% 10.3% 8.1% 6.6% 5.4% 5.7% 6.1% 6.4% 5.0% 5.1% Physical Abuse 7.5% 6.9% 6.7% 6.6% 6.5% 6.0% 5.5% 4.8% 4.60% 3.8% Severe Neglect 2.2% 2.2% 2.5% 1.9% 2.8% 2.9% 3.3% 4.5% 4.40% 5.2% General Neglect 65.0% 66.6% 70.2% 70.9% 72.8% 72.2% 71.6% 70.9% 71.6% 71.0% Exploitation 0.0% 0.0% 0.0% 0.0% 0.0% 0.0% 0.0% 0.1% 0.4% 0.8% Emotional Abuse 0.2% 0.1% 0.3% 0.2% 0.1% 0.1% 0.2% 0.2% 0.3% 0.3% Caretaker Absence/Incapacity 1.8% 1.6% 1.8% 1.6% 2.2% 1.7% 2.1% 1.9% 3.0% 2.5% At Risk Sibling Abused 10.5% 11.5% 10.4% 12.1% 10.1% 11.4% 11.2% 11.3% 10.5% 11.3% Substantial Risk 1.9% 0.8% 0.0% 0.0% 0.0% 0.0% 0.0% 0.0% 0.0% 0.0% Total 100% 100% 100% 100% 100% 100% 100% 100% 100% 100.0%
173
Supplemental Tables: Safe Homes and Communities
Total Number of Children with One or More Child Abuse Allegations and Substantiated Allegations, 2008-2017
xx 101
Age Group Child Abuse Allegations # Substantiated Allegations # Substantiated Rate per 1000 Age Group Child Abuse Allegations # Substantiated Allegations # Substantiated Rate per 1000 2008 2009 Under 1 1,911 792 19.7 Under 1 1,739 729 19.6 1-5 Years 7,910 2,533 12.6 1-5 Years 7,729 2,480 12.6 6-10 Years 8,028 2,215 10.6 6-10 Years 7,235 2,006 9.9 11-15 Years 7,900 2,039 9.2 11-15 Years 7,301 1,919 9.0 16-17 Years 3,280 915 10.3 16-17 Years 2,940 796 8.8 Total 29,029 8,494 11.2 Total 26,944 7,930 10.7 2010 2011 Under 1 1,666 683 18.4 Under 1 1,516 604 15.8 1-5 Years 7,671 2,416 12.4 1-5 Years 7,088 2,293 11.8 6-10 Years 7,495 1,909 9.5 6-10 Years 6,775 1,877 9.3 11-15 Years 7,237 1,671 7.9 11-15 Years 6,642 1,585 7.4 16-17 Years 2,882 685 7.9 16-17 Years 2,537 475 5.5 Total 26,951 7,364 10.1 Total 24,558 6,834 9.3 2012 2013 Under 1 1,570 599 15.8 Under 1 1,552 556 14.8 1-5 Years 7,053 2,008 10.3 1-5 Years 7,028 1,781 9.2 6-10 Years 6,986 1,564 7.8 6-10 Years 7,586 1,484 7.3 11-15 Years 6,532 1,249 5.9 11-15 Years 6,926 1,157 5.5 16-17 Years 2,422 399 4.6 16-17 Years 2,716 382 4.4 Total 24,563 5,819 7.9 Total 25,808 5,360 7.3 174
Supplemental Tables: Safe Homes and Communities
Total Number of Children with One or More Child Abuse Allegations and Substantiated Allegations, 2008-2017 (Continued)
Population Data Source: CA Department of Finance
Source: CWS/CMS 2017 Quarter 4 Extract. Webster, D., Armijo, M., Lee, S., Dawson, W., Magruder, J., Exel, M., Cuccaro -Alamin, S., Putnam-Hornstein, E., Wiegmann, W., Rezvani, G., Eyre, M., Sandoval, A., Yee, H., Xiong, B., Benton, C., White, J., & Cotto, H. (2017). CCWIP reports. Retrieved
from Universi ty of California at Berkeley California Child Welfare Indicators Project website. URL: http://cssr.berkeley.edu/ucb_childwelfare
Source: Orange County Social Services Agency
102
Age Group Child Abuse Allegations # Substantiated Allegations # Substantiated Rate per 1,000 Age Group Child Abuse Allegations # Substantiated Allegations # Substantiated Rate per 1,000 2014 2015 Under 1 1,780 605 15.9 Under 1 1,893 679 17.6 1-5 Years 7,564 1,764 9.2 1-5 Years 7,913 1,777 9.2 6-10 Years 8,861 1,566 7.7 6-10 Years 9,656 1,671 8.2 11-15 Years 8,103 1,217 5.8 11-15 Years 8,885 1,198 5.7 16-17 Years 3,284 387 4.5 16-17 Years 3,633 433 5.1 Total 29,592 5,539 7.6 Total 31,980 5,758 7.9 2016 2017 Under 1 1,777 647 17.4 Under 1 1,810 591 16.0 1-5 Years 7,614 1,602 8.3 1-5 Years 7,304 1,419 7.4 6-10 Years 9,451 1,585 7.9 6-10 Years 9,506 1,293 6.4 11-15 Years 8,790 1,235 5.9 11-15 Years 9,267 983 4.7 16-17 Years 3,536 409 4.8 16-17 Years 3,796 342 4.0 Total 31,168 5,478 7.5 Total 31,683 4,628 6.4
5/1/2017,
175
Supplemental Tables: Safe Homes and Communities
Secondary I ndicator: CHILD ABUSE – DEPENDENCY PETITIONS
Note: The percentages are based on the number of child abuse reports
Source: Orange County Social Services Agency
Percent of "Recurrence of Maltreatment" in 12- month Time Period for children with a Substantiated Child Abuse Allegation Orange County and California ,
to
Note: Fiscal year represents the year each cohort received their initial substantiated maltreatment allegation. Methodology changed from CFSR2 to CFSR3 so recurrence is reported rather than no reoccurrence and the time-period reported changed from six month time period to 12 month time period. Because of methodology change the study period FY are a year behind what would have been reported.
Source: Source: CWS/CMS 2017 Quarter 4 Extract. Webster, D., Armijo, M., Lee, S., Dawson, W., Magruder, J., Exel, M., Cuccaro -Alamin, S., Putnam-Hornstein, E., Wiegmann, W., Rezvani, G., Eyre, M., Sandoval, A., Yee, H., Xiong, B., Benton, C., White, J., & Cotto, H. (2017). CCWIP reports. Retrieved 5/1/2018, from University of California at Berkeley California Child Welfare Indicators Project website. URL: <http://cssr.berkeley.edu/ucb_childwelfare>
xx 103
Number and Percent of Dependency Petitions Filed, 2007/0 8 to 2016/17 2007/08 2008/09 2009/10 2010/11 2011/12 No. % No. % No. % No. % No. % Petitions Filed 2,294 6 1,955 5 1,874 4.9 1,617 4.5 1,436 4.2 2012/13 2013/14 2014/15 2015/16 2016/17 No. % No. % No. % No. % No. % Petitions Filed 1,357 3.7 1,282 2.9 1,162 2.5 1,341 2.6 1,431 2.9
2006/07
2015/16 2006/07 2007/08 2008/09 2009/10 2010/11 Orange County 8.8% 8.5% 7.6% 7.2% 8.5% California 10.1% 9.9% 10.0% 10.5% 10.1% 2011/12 2012/13 2013/14 2014/15 2015/16 Orange County 7.5% 7.6% 7.4% 9.1% 7.9% California 10.1% 10.5% 10.2% 9.7% 9.0%
176
Supplemental Tables: Safe Homes and Communities
Secondary Indicator: DEPENDENTS OF THE COURT
Dependents of the court are children who have been found by Juvenile Court action to require protection and supervision by the Juvenile Court from abuse and/or neglect. These children can be either in their own homes under Social Services Agency (SSA) supervision or in out -of -home care such as in the care of a relative nonrelated extended family member (NREFM) foster parent or group home.
104
Definition
Monthly Number of Dependents of the Court by End of Month Cases, 2007/08 to 2016/17 Month 2007/08 2008/09 2009/10 2010/11 2011/12 2012/13 2013/14 2014/15 2015/16 2016/17 July 3,566 3,622 3,235 2,704 2,805 2,835 2,816 2,874 2,627 2,708 August 3,601 3,561 3,167 2848 2,827 2,868 2,832 2,881 2,581 2,730 September 3,668 3,514 3,153 2,810 2,786 2,828 2,757 2,891 2,597 2,734 October 3,626 3,458 3,125 2,803 2,757 2,810 2,769 2,881 2,608 2,756 November 3,690 3,452 3,119 2,835 2,734 2,838 2,762 2,812 2,587 2,720 December 3,788 3,446 3,081 2,843 2,752 2,880 2,808 2,835 2,626 2,766 January 3,723 3,451 3,056 2,838 2,729 2,914 2,622 2781 2,631 2,808 February 3,701 3,468 3,023 2,810 2,738 2,889 2,626 2,765 2,641 2,807 March 3,718 3,421 3,005 2,764 2,834 2,879 2,580 2,768 2,679 2,780 April 3,764 3,379 2,910 2,749 2,855 2,885 2,536 2,731 2,650 2,774 May 3,731 3,368 2,885 2,740 2,869 2,857 2,543 2,681 2,642 2,777 June 3,669 3,297 2,840 2,794 2,807 2,859 2,547 2,686 2,651 2,789 Average 3,687 3,453 3,050 2,795 2,791 2,862 2,683 2,799 2,627 2,762
177
Source: Orange County Social Services Agency
Supplemental Tables: Safe Homes and Communities
xx 105
Percent of Children by Race/Ethnicity in Out-of -Home Care, April 2009 to April 2018 Race/Ethnicity 2009 2010 2011 2012 2013 2014 2015 2016 2017 2018 White 31 33 34 34 34 33 33 37 36 32 Hispanic 57 55 55 57 58 58 58 52 53 55 Black 8 7 6 5 5 5 5 6 4 6 Asian 4 5 5 4 3 4 4 4 7 4 Other 0.5 1 0 0 0 0 0 0.6 1 1 Source: Orange County Social Services Agency Wraparound Referrals by Agency and Year, 2007/08 to 2016/17 Referral Agency 2007/08 2008/09 2009/10 2010/11 2011/12 2012/13 2013/14 2014/15 2015/16 2016/17 Social Services 295 173 203 172 208 178 172 175 212 244 Probation 138 247 241 202 163 180 213 245 215 262 Health Care 90 96 72 27 27 23 22 24 21 24 Total 523 516 516 401 398 381 407 444 448 530 Source: Orange County Social Services Agency Average Monthly Number of Children in Out-of -Home Care, 2007/08 to 2016/17 Year Dependents of the Court Out-of- Home Care 2007/08 3,687 2,668 2008/09 3,453 2,466 2009/10 3,050 2,195 2010/11 2,795 2,018 2011/12 2,791 2,215 2012/13 2,862 2,257 2013/14 2,826 2,279 2014/15 2,799 2,192 2015/16 2,627 2,107 2016/17 2,762 2,134 Source: Orange County Social Services Agency 178
Supplemental Tables: Safe Homes and Communities
Secondary Indicator: FOSTER CARE
Definition
When the Juvenile Court determines that a child cannot safely remain with his or her own family the Social Services Agency (SSA) identifies a placement for the child. Relative/guardian care is the primary placement considered in order to comply with state law and best practice of placing children in the least restric tive most family-like setting. If relatives are not available the next best option is a non-related extended family member (NREFM). If relatives and NREFMs are not available SSA may place the child in a county licensed foster family home (FFH) or a home pr ovided by a Foster Family Agency (FFA). FFA-certified homes are provided by non-profit agencies licensed by the state to develop and supervise specialized foster homes for the placement of children who require a higher level of care due to emotional or beh avioral problems. A child with even more significant behavioral issues may be temporarily placed in a state licensed group home or other residential setting to meet their treatment needs.
* Due to the implementation of Resource Family Approval process (February 2016), the new "Resource Family" placement type con sists of combination of placements previously identified as Foster Family Homes, Relative Homes and Non -Related Extended Family Member Homes. During this transition period, it is difficult to classify youth into these placement homes and therefore comparis ons between 2017 data and past years should not be made for youth placed in these family-like settings.
^Includes Relative, Guardian, NREFM, and RFA-Relative Homes placements
** Includes Foster Family Homes and Resource Family Agency placements.
***Includes Group Homes and STRTP placements
Note: Due to rounding percentages may not add up to 100%. Source: Orange County Social Services Agency
106
Number and Percent of Placement Type, April 2009- April 2018 Annual Point-in-Time Comparison 2009 2010 2011 2012 2013 2014 No. % No. % No. % No. % No. % No. % Relative/Guardian 1,377 52% 1,220 52% 1,241 54% 1,320 60% 1,344 60% 1,309 58% Foster Family Homes 249 9% 243 10% 245 11% 197 9% 171 8% 196 9% Foster Family Agency Certified Homes 629 24% 568 24% 449 20% 398 18% 346 15% 311 14% Group Homes 169 6% 136 6% 150 7% 89 4% 96 4% 81 4% Orangewood Family Center 68 3% 78 3% 98 4% 56 3% 46 2% 72 3% Other 163 6% 122 5% 111 5% 150 7% 246 11% 298 13% Total 2,655 100% 2,367 100% 2,294 100% 2,210 100% 2,249 100% 2,267 100% Annual Point-in-Time Comparison 2015 2016 2017 2018 10 Year Average No. % No. % No. % No. % No. % Relative/Guardian 1,183 56% 1,149 54% 1,123* 52% 1,167^ 54% 1,243 55% Foster Family Homes/Resource Family* 197 9% 237 11% 361* 17% 314** 14% 241 11% Foster Family Agency Certified Homes 305 14% 284 13% 277 13% 284 13% 385 17% Group Homes 72 3% 72 3% 80 4% 71*** 3% 102 4% Orangewood Family Center 51 2% 73 3% 55 3% 60 3% 66 3% Other 318 15% 307 14% 269 12% 281 13% 227 10% Total 2,126 100% 2,122 100% 2,165 100% 2,177 100% 2,277 100%
179
Supplemental Tables: Safe Homes and Communities
Children and Family Services – Out-Of -Home Placements by Age and City of Placement, April 2018
xx 107
RELATIVE/ GUARDIAN FOSTER FAMILY HOME (County Licensed) FOSTER FAMILY ASSOCIATION CERTIFIED HOME GROUP HOME OTHER PLACEMENT TYPE CITIES AND COMMUNITIES 0<6 6<13 13+ 0<6 6<13 13+ 0<6 6<13 13+ 0<6 6<13 13+ 0<6 6<13 13+ Aliso Viejo 5 0 * * * 0 0 0 0 0 0 0 0 0 0 Anaheim 73 73 40 14 15 13 7 6 16 0 0 0 11 7 24 Brea * * * 0 0 0 0 * 0 0 0 0 * * * Buena Park 11 8 9 14 * * * * * 0 0 * 0 0 9 Costa Mesa 16 8 7 5 0 * 0 0 6 0 15 5 * * * Cypress * 7 * 7 * * 0 0 * 0 0 0 0 * 5 Dana Point * * * 0 0 0 0 0 * 0 0 0 0 0 * Fountain Valley * 7 6 6 * * * 0 0 0 * 0 * 0 0 Fullerton 7 9 * 8 * 5 * 7 20 0 0 * * * 9 Garden Grove 33 18 17 8 5 7 * 0 0 0 0 0 * * 7 Huntington Beach 23 11 15 10 5 6 * 0 0 0 0 0 * * 11 Irvine 11 * * 5 * * * 0 * 0 0 0 0 * * La Habra 9 * * 7 * * * * * 0 0 0 0 0 * La Palma 0 0 * 0 0 0 0 * 0 0 0 0 0 0 * Laguna Beach * * * 0 0 * 0 0 0 0 0 0 0 0 0 Laguna Hills * 0 0 * 0 0 0 0 0 0 0 0 * 0 * Laguna Niguel 7 * * * 0 * 0 0 * 0 0 0 * 0 0 Laguna Woods 0 0 0 0 0 0 0 0 0 0 0 0 0 0 0 Lake Forest 9 7 * * * * 6 * * 0 0 0 * * 6 Los Alamitos * 0 0 0 0 0 * 0 0 0 0 * 0 * * Mission Viejo 5 5 * 6 * * * * * 0 0 0 * * * Newport Beach 5 * 6 0 0 0 0 * 0 0 0 0 0 0 0 Orange 24 9 18 9 * * 8 7 6 (7)+ 0 (24) + 0 (29) + 25 5 * 23 Placentia * * 6 * * * * 0 0 0 * 8 * 0 0 Rancho Santa Margarita * 0 0 * * * * 0 0 0 0 0 * 0 0 San Clemente * * * 0 * * 0 * 0 0 0 0 * * 0 San Juan Capistrano 0 * 0 0 * 0 * 0 0 0 0 0 * 0 * Santa Ana 62 43 20 7 10 6 10 * 14 0 0 7 9 5 35 Seal Beach 0 0 0 0 0 0 0 0 0 0 0 0 * 0 0 Stanton * * * 5 * * 0 0 0 0 0 0 0 0 * Tustin 10 8 * * * 0 * 0 15 6 * 15 * * 8 Unincorporated * 5 * * * 0 * 0 0 0 0 0 * * 0 Villa Park 0 0 0 0 0 0 0 0 0 0 0 0 0 0 0 Westminster 9 6 5 0 0 0 * 0 0 0 0 0 * * * Yorba Linda * 0 * * 0 * 6 0 0 0 0 0 0 0 * Los Angeles County 41 28 15 5 6 0 5 * 8 0 0 * 7 * 16 Riverside County 38 26 21 12 6 6 8 10 21 0 * 9 15 5 9 Note: Parentheses indicate the number of children placed at Orangewood Children and Family Center (OCFC) 180
Supplemental Tables: Safe Homes and Communities
Children and Family Services – Out-Of -Home Placements, by Age and City of Placement, April 2018 (Continued)
108
RELATIVE/ GUARDIAN FOSTER FAMILY HOME (County Licensed) FOSTER FAMILY ASSOCIATION CERTIFIED HOME GROUP HOME OTHER PLACEMENT TYPE CITIES AND COMMUNITIES 0<6 6<13 13+ 0<6 6<13 13+ 0<6 6<13 13+ 0<6 6<13 13+ 0<6 6<13 13+ San Bernardino 25 16 7 0 * * 0 * * 0 0 0 * * 5 San Diego County 5 * * 0 * 0 0 * * 0 0 * * * 5 Non-Adjacent County or Out of State 21 24 11 5 * 0 0 * * 0 * 0 * * 20 TOTALS 481 345 246 159 86 76 81 56 128 13 47 81 87 52 214 TOTAL COMMUNITY (#) TOTAL COMMUNITY (%) CITIES AND COMMUNITIES 0<6 6<13 13 + TOTAL 0<6 6<13 13 + TOTAL Aliso Viejo 7 * * 10 0.3% 0.0% 0.1% 0.5% Anaheim 105 101 93 299 4.8% 4.6% 4.3% 13.7% Brea * 6 * 13 0.2% 0.3% 0.1% 0.6% Buena Park 28 14 26 68 1.3% 0.6% 1.2% 3.1% Costa Mesa 24 26 25 75 1.1% 1.2% 1.1% 3.4% Cypress 9 9 11 29 0.4% 0.4% 0.5% 1.3% Dana Point * * 7 13 0.1% 0.1% 0.3% 0.6% Fountain Valley 10 10 10 30 0.5% 0.5% 0.5% 1.4% Fullerton 22 20 39 81 1.0% 0.9% 1.8% 3.7% Garden Grove 46 26 31 103 2.1% 1.2% 1.4% 4.7% Huntington Beach 36 19 32 87 1.7% 0.9% 1.5% 4.0% Irvine 20 9 9 38 0.9% 0.4% 0.4% 1.7% La Habra 18 6 10 34 0.8% 0.3% 0.5% 1.6% La Palma 0 * * 3 0.0% 0.0% 0.1% 0.1% Laguna Beach * * * 5 0.0% 0.0% 0.1% 0.2% Laguna Hills 9 0 * 10 0.4% 0.0% 0.0% 0.5% Laguna Niguel 14 * * 19 0.6% 0.1% 0.1% 0.9% Laguna Woods 0 0 0 0 0.0% 0.0% 0.0% 0.0% Lake Forest 19 14 9 42 0.9% 0.6% 0.4% 1.9% Los Alamitos * * * 5 0.1% 0.0% 0.1% 0.2% Mission Viejo 16 11 9 36 0.7% 0.5% 0.4% 1.7% Newport Beach 5 * 6 14 0.2% 0.1% 0.3% 0.6% Orange 53 45 102 200 2.4% 2.1% 4.7% 9.2% Placentia 10 8 16 34 0.5% 0.4% 0.7% 1.6% Rancho Santa Margarita 6 * * 9 0.3% 0.0% 0.1% 0.4% San Clemente 6 6 * 15 0.3% 0.3% 0.1% 0.7% San Juan Capistrano * 5 * 9 0.1% 0.2% 0.0% 0.4% 181
Supplemental Tables: Safe Homes and Communities
Children and Family Services – Out-Of -Home Placements, by Age and City of Placement, April 2018 continued
Moves: Number of Placement Moves Per Day for Children in Foster Care in a 12 Month Period, 2007/08 to 2016/17
Source: Child Welfare Services Reports for California. University of California Berkeley Center for Social Services Research
Source: CWS/CMS 2016 Quarter 4 Extract. Webster, D., Armijo, M., Lee, S., Dawson, W., Magruder, J., Exel, M., Cuccaro -Alamin, S., Putnam-Hornstein, E., Wiegmann, W., Rezvani, G., Eyre, M., Sandoval, A., Yee, H., Xiong, B., Benton, C., White, J., & Cotto, H. (2017). CCWIP reports. Retrieved 5/1/2017, from University of California at Berkeley California Child Wel fare Indicators Project website. URL: <http://cssr.berkeley.edu/ucb_childwelfare>
xx 109
TOTAL COMMUNITY (#) TOTAL COMMUNITY (%) CITIES AND COMMUNITIES 0 - <6 6 - <13 13 + TOTAL 0 - <6 6 - <13 13 + TOTAL Santa Ana 88 62 82 232 4.0% 2.8% 3.8% 10.7% Seal Beach * 0 0 2 0.1% 0.0% 0.0% 0.1% Stanton 6 * 7 16 0.3% 0.1% 0.3% 0.7% Tustin 21 14 41 76 1.0% 0.6% 1.9% 3.5% Unincorporated 12 9 * 24 0.6% 0.4% 0.1% 1.1% Villa Park 0 0 0 0 0.0% 0.0% 0.0% 0.0% Westminster 11 8 6 25 0.5% 0.4% 0.3% 1.1% Yorba Linda 11 0 5 16 0.5% 0.0% 0.2% 0.7% Los Angeles County 58 38 42 138 2.7% 1.7% 1.9% 6.3% Riverside County 73 49 66 188 3.4% 2.3% 3.0% 8.6% San Bernardino 27 21 16 64 1.2% 1.0% 0.7% 2.9% San Diego County 7 6 12 25 0.3% 0.3% 0.6% 1.1% Non-Adjacent County or Out of State 29 28 33 90 1.3% 1.3% 1.5% 4.1% TOTALS 821 586 770 2,177 37.7% 26.9% 35.4% 100.0%
Total Community
children
placements Court-Specified Placements and placement settings such as hospitals
CFS Research CWS/CMS Database Number of Placement
2007/08 2008/09 2009/10 2010/11 2011/12 2012/13 2013/14 2014/15 2015/16 2016/17 Orange County 5.03 5.50 5.21 4.44 3.81 3.53 3.55 4.02 4.99 4.31 California 5.02 4.88 4.74 4.44 4.33 4.02 3.98 3.95 3.90 3.73
*Numbers between 1 and 4 are masked to protect confidentiality Note:
also includes
in pre-adoptive
Source:
182
Supplemental Tables: Safe Homes and Communities
Indicator: CHILD WELFARE
Percent of Children Reaching Reunification and Guardian ship within 12 Months and Reentry Following Reunification and Guardianship, Orange County and California , 2006/07 to 2015/16
Note: Since the re-entry measure sample (below) is based on those who reach Reunification and Guardianship within 12 months, above measure is mo dified to now include exits to guardianship, not just reunification.
*Due to methodological differences the reporting periods for No Reentry Following Reunification will always be one year behind what is reported for the other measures
Source:
Source: CWS/CMS 2017 Quarter 4 Extract. Webster, D., Armijo, M., Lee, S., Dawson, W., Magruder, J., Exel, M., Cuccaro -Alamin, S., Putnam-Hornstein, E., Wiegmann, W., Rezvani, G., Eyre, M., Sandoval, A., Yee, H., Xiong, B., Benton, C., White, J., & Cotto, H. (2017). CCWIP reports. Retrieved 5/1/2018, from University of California at Berkeley California Child Welfare Indicators Proj ect website. URL: <http://cssr.berkeley.edu/ucb_childwelfare>
Secondary Indicator: ADOPTIONS
Definition
Adoption is a legal process that permanently gives parental rights and responsibilities to adoptive parents. The Social Services Agency (SSA) provides public adoption services to children who are dependents of the Juvenile Court and are receiving out-of -home foster care services. Adoption Within 12 Months (Legally Free) is a measure of foster care children who were legally free for adoption during the year who were subsequently discharged to a finalized adoption within 12 months. Adoption Within 24 Months (Exit Cohort) is a measure of foster care children who were discharged to a finalized adoption during the year who achieved adoption within 24 months.
Percent with Finalized Adoptions within 12 and 24 Months, Orange County and California, 2005/06 to 2014/15
Adoptions 12 Months of being Legally Free
Adoptions 24 month (Exit Cohort)
*This is no longer a federal measure and consequently no longer publicly available as of 2015/16.
Source: Orange County SSA Children and Family Services
110
2006/07 2007/08 2008/09 2009/10 2010/11 2011/12 2012/13 2013/14 2014/15 2015/16 % % % % % % % % % % Reunification Within 12 Months Orange County 38.1% 37.5% 41.1% 42.9% 33.9% 34.1% 26.4% 29.8% 32.3% 37.2% California 39.5% 41.8% 41.4% 41.5% 40.0% 37.6% 35.7% 35.7% 35.0% 34.8%
Reentry
Reunification* Orange County 5.5% 4.3% 7.0% 8.4% 5.2% 4.1% 6.2% 9.1% 10.4% * California 11.7% 12.1% 12.3% 11.8% 11.9% 12.0% 11.6% 11.4% 10.7% *
No
Following
2005/06 2006/07 2007/08 2008/09 2009/10 2010/11 2011/12 2012/13 2013/14 2014/15* Orange County 42.5 39.3 32.8 36.3 33.3 35.1 36.7 34.4 38.7 34.6 California 30.0 32.6 29.8 29.8 29.9 33.5 35.7 36.1 39.4 38.0
2005/06 2006/07 2007/08 2008/09 2009/10 2010/11 2011/12 2012/13 2013/14 2014/15* Orange County 66.8 61.3 55.1 50.5 56.1 71.2 66.5 57.3 59.7 68.8 California 56.0 53.0 55.9 56.5 61.8 64.8 62.8 64.3 61.7 62.6
183
Supplemental Tables: Safe Homes and Communities
Secondary Indicator: EMANCIPATION SERVICES
Definition
Social Services Agency’s (SSA) Transitional Planning Services (TPS) is a broad -based Independent Living Program (ILP) designed to prepare foster youth for self -sufficiency. SSA submits an annual statistical report to the state describing ILP activities. Select youth characteristics and program outcome information are presented from the report to describe emancipation services offered received and/or provided. Services may be provided to youth as young as 14 and as old as 24. These youths include those who were in the custody of SSA due to parental abuse and neglect former probation wards who were involved in the juvenile j ustice system and children with mental health needs placed in foster care by the Health Care Agency. TPS also serves youth who were in foster care in other counties and have relocated to Orange County. TPS is the responsibility of the SSA Children and Fami ly Services and involves many community partners committed to assisting youth and young adults in a wide array of Independent Living Program support services including but not limited: to basic life skills training employment career and vocational assessme nts and placements educational resources and funding and medical and mental health services.
xx 111
Youth Who Received Independent Living Program Services , 2000/01 to 2007/08 Characteristics of Youth Served 2000/01 2001/02 2002/03 2003/04 2004/05 2005/06 2006/07 2007/08 Youth to whom ILP services were offered during the year 1,885 2,063 2,254 2,582 2,752 2,875 3,022 2,679 Youth who received ILP services and have special needs N/A 69 89 140 98 133 228 130 Youth in the Probation Department who received ILP services 216 193 233 398 182 178 335 226 Youth in the Child Welfare Dept who received ILP services 1,268 1,086 1,272 1,742 1,471 1,657 2,432 1,696 Program Outcomes/Client Progress 2000/01 2001/02 2002/03 2003/04 2004/05 2005/06 2006/07 2007/08 Youth who completed ILP services or a component of services 1,484 1,279 1,505 2,404 1,653 1,835 2,767 1,920 Youth who completed high school/ GED or adult education N/A 69 129 176 144 206 146 140 Youth enrolled in college N/A 81 134 265 323 388 368 384 Youth who obtained employment N/A 14 223 481 413 447 454 265 Data showing trends in ILP service delivery have not been updated because of significant reporting changes made in October 20 08. Source: SOC 405A 184
Supplemental Tables: Safe Homes and Communities
The SOC 405E Report was discontinued on April 1 2015)* This measure reflects the percent of foster children who exited foster care placement due to attaining age 18 or 19 or those foster youth under age 18 who were legally emancipated from foster care pursuant to Fa mily Code Section 7000 who receive appropriate education and training and/or achieve employment or economic self-sufficiency based on what is known about the youth's status at the month of exiting care.
FY 2014/15 data (only includes data from Jul 2014- Mar 2015
112
Who Received Independent Living Services, 2009/10 to 2014/15 2009/10 2010/11 2011/12 2012/13 2013/14 2014/15 Number of youth (where
known) who exited foster care
emancipating
turning age 18
foster care: 122 99 61 29 41 60 Percent of these youth who: Completed High School or Equivalency 52% 51% 66% 48% 51% 57% Obtained Employment 30% 28% 34% 10% 20% 40% Have Housing Arrangements 85% 89% 82% 72% 71% 78% Received ILP Services 88% 82% 90% 83% 93% 77% Permanency Connection with an Adult 75% 70% 66% 34% 44% 38%
Youth
about
after
or
or 19 while in
185
Supplemental Tables: Safe Homes and Communities
Indicator: JUVENILE ARRESTS
xx 113
Orange County Juvenile Arrests 10 to 17 Years Old, 2007-2016 2007 2008 2009 2010 2011 2012 2013 2014 2015 2016 2007 to 2016 A. Overview Felony Arrests 4,090 4,087 4,131 3,671 2,875 2,284 1,866 1,659 1,178 1,195 -70.8% Misdemeanor Arrests 9,060 8,812 8,593 8,223 6,216 5,030 3,902 3,534 2,832 2,581 -71.5% Arrest for Status Offenses 1,838 2,015 1,617 1,591 1,706 1,252 1,124 1,387 819 745 -59.5% Total Juvenile Arrests 14,988 14,914 14,341 13,485 10,797 8,566 6,892 6,580 4,829 4,521 -69.8% B. Juvenile Felony Arrest Trends Homicide 26 19 13 10 13 6 3 3 0 9 -65.4% Forcible Rape 10 6 10 11 15 8 11 17 16 22 120.0% Robbery 252 284 289 273 218 179 132 113 128 134 -46.8% Assault 416 513 512 395 306 257 223 237 206 218 -47.6% Kidnapping 5 2 8 1 10 6 2 3 3 3 -40.0% Total Violent Crimes 709 824 832 690 562 456 371 373 353 386 -45.6% Burglary 1,036 1,081 1,081 936 758 602 437 356 157 153 -85.2% Theft 490 412 446 412 275 219 182 136 106 86 -82.4% Auto Theft 158 169 141 109 101 91 63 36 71 74 -53.2% Forgery 29 14 10 21 11 7 3 6 3 5 -82.8% Arson 35 40 26 14 10 17 10 11 8 9 -74.3% Total Property Offenses 1,751 1,719 1,704 1,492 1,155 936 695 545 345 327 -81.3% Drug Offenses 413 435 467 572 480 331 349 324 113 120 -70.9% Sex Offenses 93 88 107 107 96 60 73 55 51 38 -59.1% Other Offenses 691 609 589 479 307 284 206 205 174 162 -76.6% Weapons 425 410 424 325 269 210 168 155 140 160 -62.4% Others 11 5 8 6 6 7 4 2 2 2 -81.8% C. Juvenile Misdemeanor Arrest Trends Assault & Battery 1,045 1,094 1,085 1,039 870 707 594 570 507 437 -58.2% Vandalism 1,064 972 1,039 892 740 529 404 322 281 220 -79.3% Weapons 151 131 107 122 108 104 92 97 117 130 -13.9% Drunk 154 174 165 176 130 104 102 78 59 43 -72.1% Liquor Laws 661 673 682 613 566 443 357 366 204 138 -79.1% Marijuana and Other Drugs 1,480 1,483 1,655 1,619 620 610 542 497 483 523 -64.7% Trespassing 187 260 194 199 171 165 93 112 108 92 -50.8% Total California Juvenile Arrests 236,105 228,527 204,294 185,506 149,273 120,352 96,718 86,636 71,792 62,646 -73.5% Source: California Department of Justice 186
Supplemental Tables: Safe Homes and Communities
* * 2013 thru 2015 figures for OC Sheriffs may include Yorba Linda
114
Arrests by City Youth 10 to 17 Years Old, 2007 to 2016 CITY 2007 2008 2009 2010 2011 2012 2013 2014 2015 2016 ALISO VIEJO 106 187 178 141 93 95 107 91 44 18 ANAHEIM 1,623 1,792 1,781 1,434 917 693 628 566 438 420 BREA 293 297 289 269 292 141 86 95 80 92 BUENA PARK 421 424 394 337 243 197 153 212 141 84 COSTA MESA 589 543 467 328 249 206 181 132 143 144 CYPRESS 99 44 36 62 57 58 38 17 14 14 DANA POINT 158 174 182 191 114 86 54 64 36 53 FOUNTAIN VALLEY 314 392 351 284 249 178 187 167 120 97 FULLERTON 888 704 609 523 422 384 422 382 225 263 GARDEN GROVE 1,107 1,027 1,035 1,007 799 778 602 515 447 366 HUNTINGTON BEACH 1,028 867 699 769 654 656 345 279 211 125 IRVINE 871 583 612 612 463 295 191 168 136 131 LA HABRA 525 534 548 437 335 294 209 187 148 114 LA PALMA 43 64 33 38 29 24 20 9 7 8 LAGUNA BEACH 74 80 93 82 65 61 50 81 48 46 LAGUNA HILLS 94 132 135 112 89 121 82 52 26 36 LAGUNA NIGUEL 119 145 127 98 71 41 14 29 20 15 LAGUNA WOODS 1 2 2 - 3 - - 1 -LAKE FOREST 207 299 289 281 209 205 155 102 88 122 LOS ALAMITOS 113 55 52 36 29 19 25 10 7 11 MISSION VIEJO 344 373 382 387 293 226 136 118 82 119 NEWPORT BEACH 708 600 542 535 461 369 337 208 194 163 ORANGE 1,440 1,474 1,138 1,250 1,000 684 490 502 280 293 PLACENTIA 315 261 313 359 263 182 224 222 118 83 RANCHO SANTA MARGARITA 153 151 125 143 164 86 51 39 23 41 SAN CLEMENTE 109 114 160 139 158 128 110 89 53 64 SAN JUAN CAPISTRANO 92 189 209 195 124 92 58 129 60 62 SANTA ANA 1,719 1,832 1,938 1,820 1,621 1,314 1,112 970 881 907 SEAL BEACH 36 34 64 40 30 20 13 10 10 15 STANTON 120 130 115 147 108 49 44 36 19 13 TUSTIN 343 343 262 352 222 182 139 120 94 99 VILLA PARK 18 39 57 34 24 20 19 17 9 6 WESTMINSTER 392 379 408 375 255 213 171 129 124 66 YORBA LINDA * 174 149 129 132 120 68 - 1 - 1 OC SHERIFF'S * 252 410 473 430 476 331 385 787 472 396 OTHER 100 91 114 106 96 70 54 44 31 34 TOTAL 14,988 14,914 14,341 13,485 10,797 8,566 6,892 6,580 4,829 4,521
Juvenile
187
Source: California Department of Justice
Supplemental Tables: Safe Homes and Communities
xx 115
Number of Juvenile Arrests and Rates Per 100,000 Youth Ages 10 to 17, Orange County and California , 2007 to 2016 2007 2008 2009 2010 2011 2012 2013 2014 2015 2016 No. of Juvenile Arrests Orange County 14,988 14,914 14,341 13,485 10,797 8,566 6,892 6,580 4,829 4,521 California 236,105 228,527 204,294 185,506 149,273 120,279 96,718 86,636 71,792 62,646 Juvenile Arrest Rates Orange County 4,110.8 4,121.0 4,010.3 3,809.5 3,069.4 2,456.6 2,075.9 1,993.9 1421.8 1331.7 California 5,070.5 4,960.1 4,501.5 4,145.0 3,351.9 2,718 2 2,370.1 2,133.7 1725.0 1500.1 Felony Arrests Orange County 4,090 4,087 4,131 3,671 2,875 2,284 1,866 1,659 1,178 1,195 California 65,955 64,756 58,421 51,879 43,307 36,289 30,734 27,583 21,343 19,619 Felony Arrest Rates Orange County 1,121.8 1,129.3 1,155.2 1,037.0 817.3 655.0 562.0 502.7 346.8 352.0 California 1,416.4 1,405.5 1,287.3 1,159.2 972.4 819.6 753.2 679.3 512.8 469.8 Misdemeanors - Orange County Total Case 9,060 8,812 8,593 8,223 6,216 5,030 3,902 3,534 2,832 2,581 Rate per 100,000 2,484.9 2,434.9 2,403.0 2,323.0 1,767.1 1,442.5 1,175.3 1,070.9 833.8 35,710 Total Pop 10-17 (x1000)* Orange County 364.6 361.9 357.6 354.0 351.8 348.7 332.0 330.0 339.7 339.5 California 4,656.4 4,607.3 4,538.3 4,475.4 4,453.4 4,427.6 4,080.7 4,060.4 4,161.8 4,176.0 * 2005 to 2012 figures were based on population projections as of 2007 while 2013 and 2014 figures were based on revised projections as of Dec 2014 and 2015 figures were based on revised projections as of Feb 2017 Sources: California Department of Justice; Demographic Research Unit, California State Department of Finance 188
Supplemental Tables: Safe Homes and Communities
Secondary Indicator: REFERRALS TO PROBATION
Definition
Referrals to the Orange County Probation Department pertain to individuals who received a final disposition. In contrast to juvenile arrests which includes ages 10-17 with 18-year-olds handled by the juvenile court as adult, arrests referrals include ages up to 24 years. Almost all of these referrals involve a criminal offense because arrests for status offenses are generally handled by the arresting agency. Disposition action s on referrals can include diversion informal supervision under the Welfare Institution Code 654 deferred entry of judgment or consideration by the juvenile court for wardship or dismissal. This indicator counts only one disposition per minor per day.
116
Total Probation Referrals with Final Case Disposition, 2007 to 2016 2007 2008 2009 2010 2011 2012 2013 2014 2015 2016 Total Case Dispositions 11,900 12,456 11,531 11,533 10,454 8,882 7,821 7,156 5,808 5,617
189
Source: Juvenile Court and Probation Statistical System
Supplemental Tables: Safe Homes and Communities
xx 117
Total Number and Percent of Juvenile Probation Referrals by Age, 2007 to 2016 2007 2008 2009 2010 2011 Age in years No. % No. % No. % No. % No. % 10 & Under 37 0.3 37 0.3 35 0.3 34 0.3 35 0.3 11 46 0.4 44 0.4 34 0.3 24 0.2 30 0.3 12 186 1.6 140 1.1 138 1.2 121 1.0 113 1.1 13 627 5.3 587 4.7 505 4.4 484 4.2 403 3.9 14 1,262 10.6 1,323 10.6 1,187 10.3 1,027 8.9 919 8.8 15 2,021 17.0 2,172 17.4 2,109 18.3 1,929 16.7 1,780 17.0 16 2,707 22.7 3,049 24.5 2,566 22.3 2,766 24.0 2,527 24.2 17 3,332 28.0 3,350 26.9 3,116 27.0 3,174 27.5 2,927 28.0 18 & Older 1,682 14.1 1,754 14.1 1,841 16.0 1,974 17.1 1,720 16.5 Total Referrals 11,900 100.0 12,456 100.0 11,531 100.0 11,533 100.0 10,454 100.0 2012 2013 2014 2015 2016 Age in years No. % No. % No. % No. % No. % 10 & Under 20 0.2 10 0.1 6 0.1 8 0.1 8 0.1 11 19 0.2 19 0.2 7 0.1 10 0.2 11 0.2 12 96 1.1 80 1.0 50 0.7 49 0.8 60 1.1 13 276 3.1 291 3.7 231 3.2 184 3.2 185 3.3 14 718 8.1 659 8.4 584 8.2 419 7.2 479 8.5 15 1,456 16.4 1,168 14.9 1,131 15.8 915 15.8 844 15.0 16 2,073 23.3 1,807 23.1 1,594 22.3 1,408 24.2 1,322 23.5 17 2,621 29.5 2,260 28.9 1,997 27.9 1,601 27.6 1,655 29.5 18 & Older 1,603 18.0 1,527 19.5 1,556 21.7 1,214 20.9 1,053 18.7 Total Referrals 8,882 100.0 7,821 100.0 7,156 100.0 5,808 100.0 5,617 100.0
Due to rounding percentages may not add up to 100.
Juvenile Court and Probation Statistical System 190
Note:
Source:
Supplemental Tables: Safe Homes and Communities
118
Probation Referrals, by City of Residence*, 2007 to 2016 CITY 2007 2008 2009 2010 2011 2012 2013 2014 2015 2016 ALISO VIEJO 61 84 62 80 74 56 60 66 45 33 ANAHEIM 1,746 1,962 1,793 1,699 1,621 1,410 1,439 1,259 1,059 1005 BREA 77 73 68 69 67 41 39 27 36 24 BUENA PARK 324 304 324 359 314 230 242 202 166 166 COSTA MESA 428 394 376 416 328 299 279 246 223 232 CYPRESS 100 106 81 82 97 63 66 50 30 36 DANA POINT 77 71 71 73 64 58 71 28 23 31 FOUNTAIN VALLEY 107 118 115 124 105 73 66 61 24 25 FULLERTON 658 562 507 509 431 352 374 370 326 288 GARDEN GROVE 745 752 649 780 643 612 496 482 342 312 HUNTINGTON BEACH 489 451 412 422 380 300 325 249 184 143 IRVINE 254 305 336 342 312 229 231 170 150 155 LA HABRA 260 322 304 333 290 183 183 154 128 127 LA PALMA 35 21 29 32 26 16 17 13 5 15 LAGUNA BEACH 35 45 22 60 45 25 15 22 20 14 LAGUNA HILLS 48 42 52 53 54 73 41 24 26 20 LAGUNA NIGUEL 95 97 100 115 114 93 75 50 59 54 LAGUNA WOODS 1 1 LAKE FOREST 183 196 174 159 167 156 154 90 89 84 LOS ALAMITOS 57 45 32 24 21 14 16 19 12 12 MISSION VIEJO 180 189 159 173 144 129 97 82 88 72 NEWPORT BEACH 127 130 100 118 77 79 94 73 58 43 ORANGE 572 602 523 602 580 411 378 369 279 318 PLACENTIA 190 165 164 187 170 135 121 123 105 87 RANCHO SANTA MARGARITA 123 91 80 103 83 64 65 39 41 39 SAN CLEMENTE 141 135 148 159 124 99 97 83 59 43 SAN JUAN CAPISTRANO 101 159 176 195 163 120 121 110 92 66 SANTA ANA 2,006 2,170 2,097 2,303 2,172 1,707 1,616 1,465 1,188 1168 SEAL BEACH 22 16 26 15 14 6 6 10 3 3 STANTON 148 148 137 163 145 109 95 104 75 82 TUSTIN 378 367 293 338 272 218 178 134 139 161 VILLA PARK 3 9 5 8 4 2 4 3 1 2 WESTMINSTER 356 296 262 289 255 162 171 197 125 93 YORBA LINDA 126 77 91 91 88 51 56 73 52 60 UNINCORPORATED AREAS 113 112 109 122 101 79 80 72 48 43 OUT OF COUNTY/UNKNOWN 1,535 1,840 1,654 936 908 1,227 453 637 508 561 TOTAL 11,900 12,456 11,531 11,533 10,454 8,882 7,821 7,156 5,808 5,617
of last known address Source: Orange County Probation Department Strategic Support Division Juvenile Court and Probation Statistical System 191
*As
Supplemental Tables: Safe Homes and Communities
xx 119
2007
2016 2007 2008 2009 2010 2011 OFFENSE No. % No. % No. % No. % No. % Homicide 71 7.9 97 10.9 43 5.0 26 3.4 17 2.5 Manslaughter-Vehicular 0 0.0 1 0.1 0 0.0 3 0.4 4 0.6 Forcible Rape 21 2.3 34 3.8 23 2.6 23 3.0 35 5.2 Robbery 277 31.0 322 36.1 317 36.5 314 40.5 264 39.3 Assault 525 58.7 438 49.1 485 55.9 409 52.8 351 52.3 TOTAL 894 100.0 892 100.0 868 100.0 775 100.0 671 100.0 Burglary 963 54.8 1,057 59.2 1,057 62.4 1,051 64.3 955 64.7 Theft 488 27.8 471 26.4 431 25.4 427 26.1 366 24.8 Motor Vehicle Theft 207 11.8 194 10.9 154 9.1 112 6.9 118 8.0 Forgery/Checks/Access Card 37 2.1 19 1.1 16 0.9 17 1.0 13 0.9 Arson 61 3.5 44 2.5 36 2.1 27 1.7 25 1.7 TOTAL 1,756 100.0 1,785 100.0 1694 100.0 1,634 100.0 1,477 100.0 Narcotics 128 25.2 157 29.7 111 22.5 135 21.5 154 26.4 Marijuana 153 30.1 142 26.9 157 31.8 157 25.0 155 26.5 Dangerous Drugs 226 44.5 221 41.9 220 44.6 325 51.7 272 46.6 Other Drug Violations 1 0.2 8 1.5 5 1.0 12 1.9 3 0.5 TOTAL 508 100.0 528 100.0 493 100.0 629 100.0 584 100.0 TOTAL ALL OTHER 1,755 100.0 1,962 100.0 1,867 100.0 1,881 100.0 1,622 100.0 TOTAL FELONY 4,913 100.0 5,167 100.0 4,922 100.0 4,919 100.0 4,354 100.0 192
Total Felony Referrals Broke n Down by Offense at Time of Arrest,
to
Supplemental Tables: Safe Homes and Communities
Tota l Felony Referrals Broken Down by Offense at Time of Arrest, 2007 to 2016 (Continued)
120
2012 2013 2014 2015 2016 OFFENSE No. % No. % No. % No. % No. % Homicide 15 2.6 10 2.2 8 1.9 6 1.2 8 1.5 Manslaughter-Vehicular 2 0.3 1 0.2 2 0.5 1 0.2 1 0.2 Forcible Rape 24 4.1 21 4.6 24 5.6 23 4.6 21 4.0 Robbery 220 37.7 154 33.5 128 30.0 163 32.7 162 30.8 Assault 323 55.3 274 59.6 264 62.0 305 61.2 334 63.5 TOTAL 584 100.0 460 100.0 426 100.0 498 100.0 526 100.0 Burglary 745 64.3 601 64.2 494 63.0 425 63.2 411 63.0 Theft 295 25.5 238 25.4 214 27.3 162 24.1 155 23.8 Motor Vehicle Theft 77 6.6 66 7.1 44 5.6 63 9.4 75 11.5 Forgery/Checks/Access Card 18 1.6 11 1.2 13 1.7 8 1.2 4 0.6 Arson 24 2.1 20 2.1 19 2.4 15 2.2 7 1.1 TOTAL 1,159 100.0 936 100.0 784 100.0 673 100.0 652 100.0 Narcotics 85 22.1 80 20.2 66 17.1 55 17.5 68 23.6 Marijuana 130 33.9 161 40.6 165 42.7 104 33.0 95 33.0 Dangerous Drugs 165 43.0 155 39.0 148 38.3 145 46.0 120 41.7 Other Drug Violations 4 1.0 1 0.3 7 1.8 11 3.5 5 1.7 TOTAL 384 100.0 397 100.0 386 100.0 315 100.0 288 100.0 TOTAL ALL OTHER 1,300 100.0 1,084 100.0 1,035 100.0 883 100.0 1004 100.0 TOTAL FELONY 3,427 100.0 2,877 100.0 2,631 100.0 2,369 100.0 2,470 100.0 Note: Due to rounding percentages may not add up to 100. Source: Juvenile Court and Probation Statistical System 193
Supplemental Tables: Safe Home and Communities
xx 121
Total Number and Percent of Probation Referrals, by Final Case Disposition, 2007 to 2016 2007 2008 2009 2010 2011 Final Case Disposition No. % No. % No. % No. % No. % Closed/Dismissed 3,826 32.2 4,450 35.7 4,980 43.2 4,942 42.9 3,915 37.4 Informal Probation: 'W&I 654A W&I 725A : Referral to Peer Court / Contract Diversion Programs 1,732 14.6 1,606 12.9 1,506 13.1 1,753 15.2 1,801 17.2 Formal Probation as a Ward of the Juvenile Court 2,500 21.0 2,448 19.7 1,846 16.0 1,835 15.9 1,790 17.1 Incarceration: County Institution (Juvenile Hall or an Open Institution) 2,832 23.8 2,956 23.7 2,511 21.8 2,365 20.5 2,334 22.3 Incarceration: State Institution (Division of Juvenile Justice) 6 0.1 8 0.1 4 0.0 4 0.0 4 0.0 Other Dispositions* 1004 8.4 988 7.9 684 5.9 634 5.5 610 5.8 Total 11,900 100.0 12,456 100.0 11,531 100.0 11,533 100.0 10,454 100.0 2012 2013 2014 2015 2016 Final Case Disposition No. % No. % No. % No. % No. % Closed/Dismissed 2,716 30.6 2,561 32.7 2,627 36.7 2,477 42.6 2,550 45.4 Informal Probation: 'W&I 654A W&I 725A : Referral to Peer Court / Contract Diversion Programs 1,669 18.8 1,393 17.8 1,124 15.7 688 11.8 784 14.0 Formal Probation as a Ward of the Juvenile Court 1,801 20.3 1,608 20.6 1,311 18.3 1,005 17.3 984 17.5 Incarceration: County Institution (Juvenile Hall or an Open Institution) 2,254 25.4 2,038 26.1 1,889 26.4 1,428 24.6 1,084 19.3 Incarceration: State Institution (Division of Juvenile Justice) 0 0.0 1 0.0 0 0.0 0 0.0 1 0.0 Other Dispositions* 442 5.0 220 2.8 205 2.9 210 3.6 214 3.8 Total 8,882 100.0 7,821 100.0 7,156 100.0 5,808 100.0 5,617 100.0 * For 2016 other dispositions include 170 Deferred Entry of Judgment cases 41 direct files to Adult Court and 3 remands of juvenile cases to Adult Court. Placements in other public and private facilities were previously included in this category but are now included in the ward category. Note: Due to rounding percentages may not add up to 100. Source: Juvenile Court and Probation Statistical System 194
Supplemental Tables: Safe Home and Communities
122
Total
Referrals,
Race and Ethnicity, 2007 to 2016 2007 2008 2009 2010 2011 Race and Ethnicity No. % No. % No. % No. % No. % Non- Hispanic White 3,320 27.9 3,104 24.9 2,793 24.2 2,697 23.4 2,301 22.0% Hispanic 7,234 60.8 7,832 62.9 7,440 64.5 7,593 65.8 7,049 67.4% Asian & Pacific Islander 583 4.9 639 5.1 536 4.6 534 4.6 503 4.8% Black or African American 576 4.8 602 4.8 489 4.2 480 4.2 392 3.7% All Other Races 187 1.6 279 2.2 273 2.4 229 2.0 209 2.0% Total Referrals 11,900 100.0 12,456 100.0 11,531 100.0 11,533 100.0 10,454 100.0 2012 2013 2014 2015 2016 Race and Ethnicity No. % No. % No. % No. % No. % Non- Hispanic White 1,859 20.9 1,641 21.0 1,345 18.8 981 16.9 983 17.5 Hispanic 6,135 69.1 5,361 68.5 5,100 71.3 4,159 71.6 3,914 69.7 Asian & Pacific Islander 370 4.2 331 4.2 325 4.5 239 4.1 188 3.3 Black or African American 355 4.0 305 3.9 246 3.4 294 5.1 310 5.5 All Other Races 163 1.8 183 2.3 140 2.0 135 2.3 222 4.0 Total Referrals 8,882 100.0 7,821 100.0 7,156 100.0 5,808 100.0 5,617 100.0 Note: Due to rounding percentages may not add up to 100. Source: Orange County Probation Department
Juvenile
Statistical
California Department
Corrections & Rehabilitation, 2007 to 2016 2007 2008 2009 2010 2011 2012 2013 2014 2015 2016 Total Number of Referrals Incarcerated in County & State Institutions 2,838 2,964 2,515 2,369 2,338 2,254 2,039 1,889 1,428 1,085 Rate Per 100,000* 575 593 500 469 464 448 409 382 288 219 *Based on age group 11-21 where majority of referrals fall within Sources: Orange County Probation Department Strategic Support Division Juvenile Court and Probation Statistical System; California State Department of Finance Demographic Research Unit (Population Projections for 2010 to 2060; Jan 2018 Population Projections for 2016) 195
Number and Percent of Probation
by
Research Division
Court and Probation
System Total Number and Rate per 100,000 of Probation Referrals Incarcerated in County Institutions and the Division of Juvenile Justice
of
Supplemental Tables: Safe Home and Communities
Indicator: JUVENILE SUSTAINED PETITIONS
xx 123
Juvenile Sustained Petitions by City Referred Youth 10-17 Years Old, 2016 City Number Percent City Number Percent ALISO VIEJO 10 0.7 LAKE FOREST 25 1.7 ANAHEIM 326 21.7 LOS ALAMITOS 0 0.0 BREA 7 0.5 MISSION VIEJO 21 1.4 BUENA PARK 22 1.5 NEWPORT BEACH 3 0.2 COSTA MESA 51 3.4 ORANGE 111 7.4 CYPRESS 7 0.5 PLACENTIA 21 1.4 DANA POINT 7 0.5 RANCHO SANTA MARGARITA 2 0.1 FOUNTAIN VALLEY 5 0.3 SAN CLEMENTE 7 0.5 FULLERTON 59 3.9 SAN JUAN CAPISTRANO 17 1.1 GARDEN GROVE 93 6.2 SANTA ANA 385 25.6 HUNTINGTON BEACH 24 1.6 SEAL BEACH 0 0.0 IRVINE 29 1.9 STANTON 31 2.1 LA HABRA 35 2.3 TUSTIN 34 2.3 LA PALMA 2 0.1 WESTMINSTER 23 1.5 LAGUNA BEACH 6 0.4 YORBA LINDA 13 0.9 LAGUNA HILLS 8 0.5 UNINCORPORATED AREAS/CENSUS DESIGNATED PLACES 7 0.5 LAGUNA NIGUEL 16 1.1 OUT OF COUNTY/UNKNOWN/MISSING 94 6.3 TOTAL 1,501 100.0 Source: Orange County Probation Department, Strategic Support Division 196
Supplemental Tables: Safe Home and Communities
Juvenile Sustained Petitions Youth 10 to 17 Years Old, by Sex, 2016
Source: Juvenile Court and Statistical System
Juvenile Sustained Petitions Youth 10 to 17 Years Old, by Age, 2016
Source: Juvenile Court and Statistical System
Juvenile Sustained Petitions Youth 10 to 17 Years Old, by Race and Ethnicity, 2016
Source: Juvenile Court and Statistical System
124
Frequency Percent Female 221 14.7 Male 1,280 85.3 Total 1,501 100.0
Frequency Percent 10 to 11 1 .1 12 to 14 165 11.0 15 to 17 1,335 88.9 Total 1,501 100.0
Frequency Percent Asian & Pacific Islander 33 2.2 Black 70 4.7 Hispanic 1,183 78.8 White 182 12.1 Other/Unknown 33 2.2 Total 1,501 100.0
197
Supplemental Tables: Safe Home and Communities
xx 125
Indicator:
Gang Related Prosecutions by Crime Type, 2008 to 2017 2008 2009 2010 2011 2012 2013 2014 2015 2016 2017 Assault 230 203 179 147 77 76 69 51 45 28 Burglary 44 29 50 40 31 10 6 11 2 0 Homicide/Manslaughter 26 26 12 24 8 7 0 6 6 4 Narcotics sales 23 30 16 35 6 6 17 4 15 2 Narcotics possession 6 18 27 30 7 7 2 5 1 2 Other 270 284 230 236 162 108 85 49 59 33 Robbery 65 116 102 87 84 36 33 27 38 26 Theft 39 37 23 22 16 13 5 9 2 13 Weapons 156 146 110 76 77 49 30 51 46 28 # of Total Cases 859 889 749 697 468 312 247 213 214 136 Source: Orange County District Attorney’s Office Number of Gang Related Prosecutions, Total and by Unique Individuals, and Percent by Repeat Offenders, 2008 to 2017 2008 2009 2010 2011 2012 2013 2014 2015 2016 2017 2018 Number of Gang Related Prosecutions 859 889 749 697 468 312 247 213 214 136 859 Number of Unique Juveniles with Gang Related Prosecutions 625 587 491 411 313 212 187 153 153 110 625 Percent of Gang Related Prosecutions by Repeat Offenders 27% 34% 34% 41% 33% 32% 24% 28% 29% 19% 27% Source: Orange County District Attorney's Office 198
GANG ACTIVITY AMONG YOUTH
Supplemental Tables: Safe Home and Communities
126
Number and Percent of Gang Related Prosecutions, by Age, 2008 to 2017 2008 2009 2010 2011 2012 Race/Ethnicity No. % No. % No. % No. % No. % 13 and under 41 7% 35 6% 17 3% 15 4% 17 5% 14 81 13% 59 10% 57 12% 43 10% 24 8% 15 156 25% 129 22% 104 21% 82 20% 62 20% 16 173 28% 170 29% 152 31% 122 30% 95 30% 17 174 28% 194 33% 161 33% 149 36% 115 37% Total 625 100% 587 100% 491 100% 411 100% 313 100% 2013 2014 2015 2016 2017 Race/Ethnicity No. % No. % No. % No. % No. % 13 and under 11 5% 8 4% 9 6% 11 7% 6 5% 14 23 11% 27 14% 15 10% 14 9% 12 11% 15 39 18% 28 15% 32 21% 35 23% 23 21% 16 61 29% 55 29% 49 32% 46 30% 31 28% 17 78 37% 69 37% 48 31% 47 31% 38 35% Total 212 100% 187 100% 153 100% 153 100% 110 100% Source: Orange County District Attorney's Office Number and Percent of Gang Related Prosecutions, by Race and Ethnicity, 2008 to 2017 2008 2009 2010 2011 2012 Race/Ethnicity No. % No. % No. % No. % No. % Asian or Pacific Islander 28 4% 25 4% 21 4% 22 5% 9 3% Black or African American 7 1% 10 2% 4 1% 1 0% 0 0% Hispanic or Latino 573 92% 530 90% 449 91% 370 90% 294 94% Non- Hispanic White 14 2% 14 2% 9 2% 12 3% 7 2% Other/ Unknown 3 0% 8 1% 8 2% 6 1% 3 1% Total 625 100% 587 100% 491 100% 411 100% 313 100% 2013 2014 2015 2016 2017 Race/Ethnicity No. % No. % No. % No. % No. % Asian or Pacific Islander 6 3% 5 3% 2 1% 6 4% 4 4% Black or African American 1 0% 1 1% 6 4% 0 0% 3 3% Hispanic or Latino 199 94% 172 92% 140 92% 145 95% 101 92% Non- Hispanic White 4 2% 6 3% 3 2% 2 1% 1 1% Other/ Unknown 2 1% 3 2% 2 1% 0 0% 1 1% Total 212 100% 187 100% 153 100% 153 100% 110 100% Source: Orange County District Attorney's Office 199
CONTRIBUTORS TO THE REPORT
Orange County District Attorney
Orange County Social Services Agency
Debra J. Baetz
Anne Bloxom, LCSW
Ryan Brooks, MA
Scott Burdick, MFT
Lillian Chang, Ph.D.
Lora Connor, MA
Peter Dinh, MA
Kimberly Goswiller, MS
Thu Le Phan, MA
Anne Light, MD
Andrea Lewis, Ph.D.
Adrian Llamas, MA
Brigette McLellan
Alyson Piguee, MPP
Mike Ryan, MS
Christine Smith Snapper, MSW
Nicole Strattman, LCSW
Saul Viramontes
Carol Wiseman
Orange County Department of Education
Jeanne Awrey
Diane Ehrle
Rick Martin
Children and Families Commission of Orange County
Sharon Boles, Ph.D
Kimberly Goll, MURP
Orange County
Probation Department
Naomi Nguyen
Doug Sanger
Lisa Sato
Orange County Health Care Agency
Richard Chhuon, MPH
Curtis Condon, Ph.D.
Mary Hale, MS
Eric Handler, MD, MPH
Joshua Jacobs, MA
Tiffany Kalaitzidis, MPH
Alicia Lemire, PsyD
Nathan Lopez, Ph.D.
Alaka Nafday, MS, MSc
Hang Nguyen, MPH
David L. Núñez, MD, MPH, FAAP
Patrick Pham, Ph.D.
Richard Sanchez
Jenna Sarin, MSN, RN, PHN
Miriam Son, MPH
Deepa Shanadi, MPS, MS
Maya Thona, MBA, RN, PHN
Orange County Child Support Services
Steven Eldred, J. D.
Additional Agencies
Diane Jasso
Children’s Home Society of California
Patrice Rogers
Department of Motor Vehicles
Steven Villafranca, MA
Department of Motor Vehicles
Gurwinder K. Rakkar
California Highway Patrol Support Services Section
Michelle Ramos
California State University
Fullerton
Patrick Ruppe Regional Center of Orange County
Leanne Wheeler
California Department of Education
SPONSORED BY:
Orange County Board of Supervisors, 2018
Andrew Do, First District
Michelle Steel, Second District
Todd Spitzer, Third District
Shawn Nelson, Fourth District
Lisa A. Bartlett, Fifth District
SPECIAL THANKS TO: www.unitedwayoc.org

occhildrenandfamilies.com ocgov.com
