Orange County Health Improvement Plan


comprehensive assessment and plan to improve Orange County’s health
PUBLIC HEALTH SERVICES Orange County Health Care Agency 2014- 16 A
County of Orange, Health Care Agency, Public Health Services. Orange County Health Improvement Plan 2014-16. May 2014. Copies of this report are available online at: http://ochealthinfo.com/about/admin/pubs/OCHealthImprovementPlan
Orange County’s Healthier Together is a community-wide initiative that aligns public and private resources within the public health system to improve health for all who live, work, and play in Orange County. The initiative is administered by the Orange County Health Care Agency.
Suggested Citation:
ACKNOWLEDGEMENTS AND PARTNERS
OrangeCounty’sHealthierTogether initiative is a collaborative effort made possible by the dedication, expertise, leadership, and shared vision of many individuals and organizations.
ORANGE COUNTY COMMUNITY HEALTH PLANNING ADVISORY GROUP
The Orange County Community Health Planning Advisory Group provided guidance and leadership throughout this planning process. Member organizations include:
California State University at Fullerton
CalOptima
Children and Families Commission of Orange County
Children’s Hospital of Orange County
Coalition of Orange County Community Health Centers
Hoag Memorial Hospital Presbyterian
Hospital Association of Southern California
Irvine Health Foundation
Kaiser Permanente
Latino Health Access
OTHER PARTICIPATING AGENCIES
Memorial Care Health System
MOMS Orange County
Orange County Asian and Pacific Islander Community Alliance
Orange County Department of Education
Orange County Health Care Agency
Orange County Medical Association
Orange County Social Services Agency
Orange County United Way
Orange County Women’s Health Project
St. Joseph Health System
University of California at Irvine Medical Center
The Orange County Community Health Planning Advisory Group would like to thank the following organizations for their contribution through participation in assessments, focus groups, and work groups. Your input and feedback was invaluable in shaping this plan.
2-1-1 Orange County
Access California Services
Alliance for a Healthier Orange County
AltaMed Health Services
Alzheimer’s Association
American Academy of Pediatrics
American Diabetes Association
Boys and Girls Club
Braille Institute
Buena Park Community Clinic
Camp Fire Orange County
Casa de la Familia
Catholic Charities
Centralia School District
Children’s Health Initiative of Orange County
Community Action Partnership Orange County
Community SeniorServ
Community Service Programs
Council on Aging Orange County
County of Orange Office on Aging
Dayle Macintosh
Delhi Center
Ersoylu Consulting
Fountain Valley School District Genesis Consultants
Give for a Smile
Goodwill of Orange County
Healthcare Partners
Healthy Relationships Orange County
Horizon Cross Cultural Center
Hurtt Family Health Clinic
Illumination Foundation
Interval House
March of Dimes
Mental Health Association of Orange County
Mental Health Services Act Community Action Advisory Committee
Monarch Healthcare
National Alliance on Mental Illness
National Council on Alcoholism and Drug Dependence – Orange County
Newport-Mesa Unified School District
Nutrition and Physical Activity Coalition (NuPAC)
Office of Assembly member Sharon Quirk Silva
Office of Assembly member Tom Daly
Office of Congresswomen Loretta Sanchez
Office of Senator Lou Correa
Orange Coast Interfaith Shelter
Orange County Breastfeeding Coalition
Orange County Child Abuse Prevention Center
Orange County Department of Child Support Services
Orange County Korean American Health Information and Education Center
Orange Unified School District
Planned Parenthood
Providence Community Services
Public Law Center
Regional Perinatal Programs of California
Susan G. Komen Orange County
Taller San Jose
The G.R.E.E.N. Foundation
University of Southern California Keck School of Medicine
West Coast University
Special acknowledgements to National Association of County and City Health Officials (NACCHO) for funding and support under the Accreditation Support Initiative and to Ersoylu Consulting for assistance with the assessment and planning process.
Orange County Health Improvement Plan Acknowledgements and Partners i


Orange County Health Improvement Plan 1 Executive Summary An overview of our priorities, our findings, and our plan. 4 Background and Foundation Our approach and considerations for this plan. 5 Context for Improving Health A summary of the trends, events, and factors impacting health in Orange County. 7 Contents of Each Section A description of the contents of each section. 8 Priority Area #1: Infant and Child Health 9 11 12 13 Infant and Child Health Assessment Goals, Current Activities and Assets, Key Planning Partners Objective 1.1: Early Prenatal Care Objective 2.1: Exclusive Breastfeeding 14 Priority Area #2: Older Adult Health 15 17 18 19 20 21 Older Adult Health Assessment Goals, Current Activities and Assets, Key Planning Partners Objective 1.1: Early Identification of Conditions of Aging Objective 1.2: Chronic Diseases Health Complications Objective 1.3: Reduce Social Isolation Objective 1.4: Reduce Risk for Elder Abuse and Neglect 22 Priority Area #3: Obesity and Diabetes 23 25 26 27 Obesity and Diabetes Assessment Goals, Current Activities and Assets, Key Planning Partners Objective 1.1: Child and Adolescent Weight Objective 2.1: Diabetes Table of Contents


Orange County Health Improvement Plan Table of Contents 28 Priority Area #4: Behavioral Health 29 31 32 33 34 35 Behavioral Health Assessment Goals, Current Activities and Assets, Key Planning Partners Objective 1.1: Mental Health Needs, Gaps, and Resources Objective 1.2: Integration of Behavioral Health Objective 2.1: Adult Alcohol Misuse Objective 2.2: Prescription Drug Misuse 36 Public Health System 37 40 41 42 43 Public Health System Assessment Vision, Current Activities and Assets, Why is this important? Overall Public Health System, Infant and Child Health System Older Adult Health System Obesity and Diabetes System, Behavioral Health System 44 Next Steps Our next steps to improve health in Orange County. 45 Planning Process 46 47 48 49 50 51 52 53 54 Planning Framework and Timeline Vision for a Healthy Orange County Criteria for Selection of Priorities Organizing Health Indicators Reviewing Health Indicators Selecting Priority Health Areas Listening to Community Voices Feedback from the Community Other Community Assessments 55 Reference Documents 56 62 65 Summary of Key Health Indicators Citations Acronyms and Abbreviations
SUMMARY
OrangeCounty’sHealthierTogether is a community-wide initiative that aligns public and private resources within the public health system to improve health for all communities in Orange County The initiative began in late 2012 when the Orange County Health Care Agency’s Public Health Services formed the Orange County Community Health Planning Advisory Group (Advisory Group) in order to assess the county’s health and create a community-driven plan for a healthier Orange County. The Advisory Group was composed of representatives from 21 partner organizations including health care providers, academic institutions, collaboratives, community-based organizations, and other government agencies.
Orange County is located in Southern California, between Los Angeles and San Diego counties, and is composed of 798 square miles with 34 cities and several unincorporated areas. The county is home to over 3 million people and is the sixth most populous county in the nation. Orange County is a diverse region, with no single racial/ethnic group making up a majority of the population.
In general, Orange County’s health fares well compared to other areas. The County Health Rankings ranked Orange County the 6th healthiest county in California. However, an assessment of the county’s health shows that real health disparities exist between different populations in the county. A key emphasis of the plan and the OrangeCounty’sHealthierTogether initiative is that the health of all people, families, and communities is equally important.
After its assessment process, the Advisory Group identified four priority health areas for action: 1) Infant and Child Health; 2) Older Adult Health; 3) Obesity and Diabetes; and 4) Behavioral Health and improvements for the Orange County public health system The following pages describe the key findings, goals, objectives, and a highlighted strategy for each area.
Priority
Area
Key Findings:
#1: Infant and Child Health
While almost 90% of Orange County women who gave birth in 2010 received early prenatal care, subgroups, including Latinas and younger women, were less likely to do so.
Despite health benefits to the mother and infant, less than one in five women who gave birth in 2011 exclusively breastfed their babies through 3 months after delivery.
Goal 1: Improve birth outcomes in Orange County

Objective 1.1: By 2020, reduce disparities in early prenatal care by ensuring that at least 90% of pregnant women in all demographic or geographic subgroups in Orange County will receive early prenatal care.
Highlighted Strategy: Improve timeliness and quality of referrals and linkages between portals of entry for low-income women and prenatal care providers.
Goal 2: Improve infant and child health outcomes in Orange County.
Objective 2.1: By 2020, increase the proportion of mothers exclusively breastfeeding at 3 months by 10%.
Highlighted Strategy: Maintain and disseminate a directory of lactation services in Orange County.
EXECUTIVE
1 Executive Summary Orange County Health Improvement Plan
Priority Area #2: Older Adult Health
Key Findings:
By 2030, one in five residents of Orange County will be 65 or older and the county’s health system is challenged to understand and meet the needs of this growing population.
Complications from chronic conditions, lack of mobility, and elder abuse are important health concerns for older adults.
Goal 1: Improve wellness and quality of life of older adults in Orange County.
Objective 1.1: Increase early identification of conditions and safety risks that commonly affect older adults.
Objective 1.2: Reduce health complications of chronic diseases among older adults.
Objective 1.3: Reduce social isolation among older adults.
Objective 1.4: Reduce the risk for abuse and neglect of older adults.
Highlighted Strategy: Produce and disseminate Annual Wellness Visit toolkit to medical providers.

Priority Area #3: Obesity and Diabetes
Key Findings:
Almost one in four Orange County adults is obese and only 56.7% of 5th graders have healthy body composition
Rates of diabetes increased from 6.6% to 7.7% between 2003 and 2009. 7.4% of adults report having diabetes in 2011-12 (methodology changes prevent comparison to previous years).
Fewer adults are getting the recommended amount of exercise or fruit and vegetables.
Goal 1: Increase the proportion of Orange County residents who are in a healthy weight category.
Objective 1.1: By 2020, increase the proportion of children and adolescents who are in a healthy weight category and reduce disparities in subgroups with lower rates of healthy weight.
Highlighted Strategy: Work with school districts and educators to explore opportunities to align priorities for health and education.
Goal 2: Reverse the trend of increasing rates of diabetes among Orange County residents.
Objective 2.1: By 2020, stabilize the rates of diabetes among Orange County residents.
Highlighted Strategy: Work with health care providers to increase identification of and interventions for pre-diabetes and gestational diabetes.

EXECUTIVE SUMMARY
Orange County Health Improvement Plan Executive Summary 2
Priority Area #4: Behavioral Health

Key Findings:
Expansion of mental health services due to the Affordable Care Act and the Mental Health Parity and Addiction Equity Act will dramatically alter the system of care.
Improving understanding of behavioral health issues and services among the community and public health system is a key area for improvement.
14.9% of adults report binge drinking in the last month, a key contributor to poor health.
Community concerns about prescription drug use have increased due to prescription drug overdoses more than doubling in the past 13 years.
Goal 1: Increase the proportion of Orange County residents who experience emotional and mental wellbeing through the lifespan.
Objective 1.1: Improve understanding of mental health needs, gaps, and resources.

Objective 1.2: Improve provider capacity to integrate behavioral health into health assessments and services.
Highlighted Strategy: Conduct an assessment of current tools and capacities related to mental health services.
Goal 2: Reduce alcohol and drug misuse in Orange County.
Objective 2.1: By 2020, reduce adult alcohol misuse.
Objective 2.1: By 2020, reduce prescription drug misuse.
Highlighted Strategy: Assure medical providers have user-friendly resources for referrals and successful linkages.
Orange County Public Health System
Key Findings:
There are many quality programs and services within Orange County’s public health system.
Planning and coordination efforts across the system are key areas for improvement.
Proposed Improvements: Establish a permanent advisory group to increase accessibility, coordination, use of best practices, and planning to address public health challenges.
Next steps: The OrangeCounty’sHealthierTogether initiative will continue to engage stakeholders and the community in implementing this plan and optimizing health for all in Orange County.
EXECUTIVE
SUMMARY
3 Executive
Summary Orange County Health Improvement Plan
BACKGROUND AND FOUNDATION


At the end of 2012, the Orange County Health Care Agency created the Orange County Community Health Planning Advisory Group to engage in a process to assess the county’s health and create a plan for a healthier Orange County. The Advisory Group was composed of representatives from 21 partner organizations including health care providers, academic institutions, collaboratives, community-based organizations, and other government programs. Utilizing the Mobilizing Action through Planning and Partnerships (MAPP) model (see Planning Process), the Advisory Group identified four priority health areas for action: 1) Infant and Child Health; 2) Older Adult Health; 3) Obesity and Diabetes; and 4) Behavioral Health and improvements for the Orange County public health system
This community health improvement plan is the foundation of OrangeCounty’sHealthierTogether , a community-wide initiative that aligns public and private resources to improve health for all in Orange County Because this plan focuses on a restricted number of priorities, not all health issues or community initiatives are identified in the plan. This does not negate the importance of other public health issues; nor does it imply that resources and services should not continue for other public health needs. The plan is intended to bring the community together around a limited number of issues with the greatest opportunity for health improvements through collective efforts. The plan considered the following foundational principles shown in the graphic below:
Life course approach: The plan reflects an approach that each life stage influences the next and that social, economic, and physical environments interacting across the life course have a profound impact on individual and community health.
Cross-cutting health issues: The goals for the priority areas include health issues that cut across the priority areas. As an example, efforts to improve infant and child health such as promotion of breastfeeding may also reduce rates of obesity and diabetes. In the same way, efforts to improve alcohol and drug misuse, may also improve birth outcomes.
Public health system improvements: At the foundation of these strategies is a wellfunctioning public health system. Improvements to the system have the potential to impact all of these priority areas; while efforts to improve systems supporting each area would contribute to improvements in the overall public health system.
Orange County Health Improvement Plan Goals
Healthy birth outcomes
Healthy infant and child outcomes
Healthy weight Reduced rates of diabetes
Mental and emotional wellbeing
Reduced alcohol and drug misuse
Wellness and quality of life for older adults
Supported by a well-functioning Public Health System
Arrow depicts life course approach and cross-cutting effects of health issues.
4
Orange County Health Improvement Plan Background and Foundation
CONTEXT FOR IMPROVING HEALTH
Orange County is located in Southern California, between Los Angeles and San Diego counties, and is composed of 798 square miles with 34 cities and several unincorporated areas. The county is home to over 3 million people and is the sixth most populous county in the nation. In general, Orange County’s health fares well compared to other areas, ranking 6th in California in the 2014 County Health Rankings. However, an assessment of the county’s health shows that real health disparities exist between different populations in the county. The Orange County Community Health Planning Advisory Group began its assessment process by conducting the MAPP Forces of Change Assessment, which identifies forces such as legislation, technology, and other impending changes that affect the context in which the community and its public health system operate. The following is a summary of the identified overarching forces and the opportunities (+) and threats (-) associated with them.
Changes to Health Care System
There have been many recent changes to the health care system and many more are on the horizon. Most notably, the Patient Protection and Affordable Care Act (ACA), signed March 2010, requires most U.S. citizens and legal residents to have health insurance by 2014. Other provisions of the law make changes to requirements for employer health coverage and health insurance benefits. The ACA also extends the reach of the Mental Health Parity and Addiction Equity Act (MHPAEA), expanding coverage of treatment for mental illness and substance use disorders.
Changing Demographics
Orange County has experienced major changes in its demographic makeup. The county population has grown by 57% in the last 30 years and has become increasingly diverse. Today, no single racial/ethnic group composes a majority of the population. The county’s population is also growing older. By 2030, one in five people in Orange County is projected to be 65 years or older.
• Expansion of health care coverage, especially for lowincome individuals
• Expansion of mental health coverage
• Focus on preventative care
• Possibility of increased quality and continuity of care
• Opportunities for collaboration
• Better use of technology in sharing health information
• Patient and provider confusion about implementation of ACA
• Concerns that health coverage may threaten public health funding
• Health care system may not have capacity to meet needs

• False perception of access to health for all
• Potential for increased health care costs
• Concerns of government intrusion in medical decisions
• Opportunities for older adults to contribute as volunteers and mentors
• Diversity of perspectives
• Enriched cultural environment
• Health care system becoming more nuanced in providing care to diverse populations
• Increased support for older family members
• Increased costs to the health care system as individuals age
• Increased xenophobia, racism, and bullying
• Increased access issues for diverse populations due to language and culture
• Crowded living conditions due to multiple families living in one household
5 Context for Improving Health Orange County Health Improvement Plan
CONTEXT FOR IMPROVING HEALTH
Economic Climate
The recession of 2009 and the ensuing period of slow economic growth have impacted the local public health system. The rate of unemployment sharply increased and reached its peak at 9.4% in 2010. This has led to greater reliance on the public health system in a time when local, state, and national budgets have had decreased revenues.
Changing Built Environment
In the last few decades, America has experienced changes in its food and physical activity environments. Increased access to convenience foods and sedentary lifestyles has led to increases in rates of obesity, diabetes, and other chronic diseases. More recently, there has been increased attention on how structural and environmental changes can impact health and alter these trends.
Technology
Changes in how consumers and health care providers use technology can have a real impact on health and health care provision. More providers are implementing electronic medical records (EMRs), especially with incentives provided through the ACA. Meanwhile, more people are using the internet to get health information and communicate with their provider.
• More efficient use of public funds
• Increased focus on evidencebased and cost-effective practices
• Increased innovation
• Increased appreciation for service-oriented careers
• Increased burden on public health system
• Unpredictable employment and employer-sponsored health coverage for individuals
• Individuals prioritizing basic needs over health services
• Fewer affordable housing options for individuals
• Competition for limited funding in public health sector
• Increased awareness on the effect of food and dietary habits on health
• Increased appreciation of and options for healthy food
• Policies that increase access to information on food (nutrition labels and menus)
• Increased joint-use agreements and use of open space
• More funding available to address obesity
• Increased morbidity and mortality associated with chronic diseases
• Increased cost of care associated with chronic diseases
• Increased mental health issues
• Easy access to and advertising for unhealthful, high-calorie foods
• Larger portion sizes leading to obesity
• Reduced medical error with automated systems
• Ease of tracking medical records by electronic means
• Increased ability to share data between providers
• Ability to serve home-bound or remote patients through telemedicine
• Ability for providers and patients to instantly communicate
• Increased life expectancy with advances in medicine
• Increased consumer access to inaccurate health information
• Concerns about privacy and security of information stored in EMRs
• Reduced personal interaction between provider and patient
• Rigidity and inaccuracy of information in EMRs
• Increased cost of medical technology
• Gaps in care due to disparities in access to technology
Orange County Health Improvement Plan Context for Improving Health
6
This document includes a section for each of the four priority health areas: 1) Infant and Child Health; 2) Older Adult Health; 3) Obesity and Diabetes; and 4) Behavioral Health and the Orange County public health system. Each section provides an overview of findings from the community health assessment and a plan for addressing the area. The plans for each section were created by work groups composed of members of the Orange County Community Health Advisory Group and other community stakeholders with expertise in the area The work groups closely considered assessment findings and determined objectives and strategies for each goal based on available data, best use of resources, and alignment with local, state, and national initiatives Sections for each priority area include the following:
Assessment describing key findings from the various assessments of each priority area.

Current activities and assets describing activities and agencies that are currently working on the priority health area.
Key planning partners indicating organizations who participated in the work groups for each priority health area.
Goals defining the overall mission or purpose of each priority area as it relates to the Orange County’sHealthierTogether initiative.
Objectives defining the planned specific improvements to key focus areas of the goal. Some objectives define targets by the year 2020 to be consistent with HealthyPeople2020 timeline.
“Why is this important?” section describing findings from the assessment that led to the objective being identified as an important contributor to the goal. This section also includes how the objective aligns with state and national initiatives such as HealthyPeople2020 , CDC’s Winnable Battles , Let’sGetHealthyCalifornia , and the NationalPreventionStrategy
Short-term strategies indicating the strategies to be undertaken during the course of this plan (2014-2016). As this is Orange County’s first community health improvement plan, some of the strategies are investigative in nature and will help to inform actions in future plans.
Longer-term strategies to consider indicating the strategies to be undertaken in future plans. These strategies are provided to show the intended future actions, but may change based on findings from assessments conducted for this initial plan or future assessments.
To illustrate the cross-cutting themes among the various priority areas, the following icons for each priority area are shown at the end of objectives and/or strategies throughout the plans:


CONTENTS OF EACH SECTION
Infant and
Older Adult Health Obesity and Diabetes Behavioral Health Public Health System 7 Contents Orange County Health Improvement Plan
Child Health

County Health Improvement Plan 9 Infant and Child Health Assessment 11 Goals, Current Activities and Assets, Key Planning Partners 12 Objective 1.1: Early Prenatal Care 13 Objective 2.1: Exclusive Breastfeeding Priority Area #1: Infant and Child Health
Orange
Why is this important to health? Health begins with a healthy pregnancy (getting early prenatal care, preventing gestational diabetes) leading to healthy birth outcomes (healthy birth weight, birth at term) and continues with healthy practices such as breastfeeding, immunizations, physical activity, and proper nutrition through infancy and childhood.
What does the data show? This table shows a summary of indicators related to infant and child health. Indicator column: [LHI] indicates HealthyPeople2020 Leading Health Indicator. OC column: ! indicates the Orange County rate or proportion is at least 10% worse than California Trend column: indicates improvement of indicator indicates worsening of indicator. ! indicates that the indicator is trending at an average of at least 1% worse per year with at least four known data points. Sub-Group Disparities column: Shows sub-groups with rates or proportions at least 10% worse than Orange County as a whole.
Indicator
Prenatal care
% women received early prenatal care per 2010 OSPHD
Gestational diabetes
% mothers diagnosed with gestational diabetes per 2010 OSHPD
Low birth weight
% infants weighing less than 5 pounds, 8 ounces per 2010 Birth File
Preterm births [LHI]
% infants born between 17 and 37 gestational age per 2010 Birth File
Infant mortality [LHI]
Rate of deaths of infants under one year of age per 1,000 per 2010 Birth File
Exclusive breastfeeding
% mothers exclusively breastfeeding at 3 months per 2011 MIHA
Immunizations [LHI]
% of kindergarteners with upto-date immunizations per Kindergarten Assessment Results
Postpartum depression
% women reporting experiencing postpartum depressive symptoms per 20102011 MIHA
Child abuse
Rate of substantiated abuse per 1,000 children per 2011 Dept. of Social Services
OC
CA US Trend
89.6% 83.5% 73.1% No change (2001-2010)
7.2% Not available Not available +6.7% per year ! +2.7 (2001-2010)
6.4% 6.8% 8.2% +0.9% per year +0.5 (2001-2010)
Sub-Group Disparities

<20 year olds: 74.3%
APIs: 10.7% 30-34 year olds: 8.5% 35-39 year olds: 12.1% 40+ year olds: 15.7%
APIs: 7.7%
African Americans: 12.3% <20 year olds: 7.3% 35-39 year olds: 7.9% 40+ year olds: 10.3%
8.9% 9.9% 12.0% -0.7% per year -0.6 (2001-2010)
3.8 per 1,000 4.7 per 1,00 6.5 per 1,000 -1.7% per year -0.7 (2001-2010)
19.0%! 23.1% Not available Not comparable –methodology change
89.3% 90.3% Not available -0.4% per year -3.6 (2003-2012)
12.3% Not available Not available Not available
9.5 per 1,000 9.6 per 1,000 Not available -2.6% per year -2.9 (2002-2011)
African Americans: 13.5% 35-39 year olds: 10.6% 40+ year olds: 14.4%
Latinos: 4.5
Latinas: 11.5%
Capistrano USD: 75.4% Laguna Beach USD: 77.9%
15-19 year olds: 17.2% 20-24 year olds: 17.5% 25-29 year olds: 15.0%
Latinos: 12.9
African Americans: 24.9 < 1 year old: 16.9 1-2 years: 12.5 3-5 years: 12.2
INFANT AND CHILD HEALTH ASSESSMENT
9 Infant and Child Health Orange County Health Improvement Plan
What does the community say? The following includes feedback from focus groups about infant and child health. See Listening to Community Voices for more information about these focus groups.
Vision of optimal health:
Infants have healthy birth outcomes
Children’s health is viewed in a holistic sense
Infants are breastfed based on American Academy of Pediatrics (AAP) Guidelines
Children receive immunizations and there are no vaccine preventable diseases
Children have healthy body weight and access to healthy food
Children and families are educated about health and health resources
What’s working:
• Increased access to services
• Many programs and organizations provide quality services


• Services that provide personalized support are helpful for children and families
• Targeted outreach efforts are effective at reaching broad audiences
• There is accessible health information through CalOptima and other websites
• Faith and school-based efforts provide accessible services
Areas for improvement:
• Increase baby-friendly hospitals that support healthy pregnancies
• Increase access and affordability of healthy food
• Increase access to care for all
• Create changes in the environment and infrastructure that supports physical activity
• Ensure health information is based on science
• Increase access to and resources for mental health


• Improve coordination between service organizations
What should our focus be? Based on the assessment findings and the criteria for selection of priorities, the following were proposed as goals and focus areas for the Orange County health improvement plan.
CHILD
INFANT AND
HEALTH ASSESSMENT
PROPOSED GOALS AND FOCUS AREAS Goal 1: Improve birth outcomes in Orange County. Focus areas: 1. Early prenatal care 2. Gestational diabetes Goal 2: Improve infant and child health outcomes. Focus areas: 1. Exclusive breastfeeding 2. Childhood immunizations Cross cutting issues addressed in other areas: 1. Obesity and Diabetes: Childhood obesity 2. Behavioral Health: Childhood mental health 3. Public Health System: Developmental screening Orange County Health Improvement Plan Infant and Child Health 10
Current Activities and Assets:
There are many programs and resources that work to improve birth, infant, and child health outcomes within Orange County. The Orange County Perinatal Council (OCPC) plans and coordinates activities and messages around perinatal health and distributes messages through community networks of health plans, hospitals, providers, and Women, Infant, and Child (WIC) clinics. OCPC includes members from a broad range of community stakeholders, organizations, and health care providers with a mission to support optimal perinatal health and wellness for Orange County’s women and babies – before, during, and after birth.
Partnerships also exist between Orange County Health Care Agency Public Health programs, professional organizations, local hospitals, medical providers, and local school districts to promote health and well-being of the maternal and child populations by providing access and linkages to medical and social services. Such collaborative efforts have resulted in the development of the Orange County Breastfeeding Resource Guide There are also a variety of public health and community-based programs including Adolescent Family Life Program (AFLP), Bridges Maternal Child Health Network, Cal-Learn, Medically High Risk Newborns (MHRN), MOMS Orange County, Nurse Family Partnership® (NFP), Perinatal Substance Abuse Services Initiative/Assessment and Coordination Team (PSASI/ACT), and Public Health Community Nursing (PHCN) that work with at-risk populations to ensure early access to care, provide linkage to resources, and support clients in attaining optimal outcomes for moms and babies.
The Baby-Friendly Hospital Initiative, a global effort to implement practices that protect, promote, and support breastfeeding, was created in 1991 by the World Health Organization and UNICEF. Overwhelming evidence exists on the benefits of the Baby-Friendly designation on breastfeeding outcomes. Orange County hospitals are approved or at various stages of the application process seeking Baby Friendly status. As of 2013, six of the 17 birthing hospitals in Orange County achieved Baby Friendly designations.
Key Planning Partners
American Academy of Pediatrics, Orange County Chapter
CalOptima


Children and Families Commission of Orange County (CFCOC)

Children’s Hospital of Orange County (CHOC)
Health Care Agency Public Health Services

March of Dimes
MOMS Orange County
Regional Perinatal Programs of California
St. Joseph Hospital
INFANT AND CHILD HEALTH PLAN
Goal 1: Improve birth outcomes in Orange County.
11 Infant and Child Health Orange County Health Improvement Plan
Goal 2: Improve infant and child health outcomes in Orange County.
Early Prenatal Care
Goal 1: Improve birth outcomes in Orange County.
Objective 1.1: By 2020, reduce disparities in early prenatal care by ensuring that at least 90% of pregnant women in all demographic or geographic subgroups in Orange County will receive early prenatal care.
Why is this a priority?
Mothers who receive late or no prenatal care are more likely to have babies with low birth weight, stillborn, or who die in the first year of life [1]. Early prenatal care provides an excellent opportunity to detect and treat maternal medical problems such as anemia and diabetes [1]; it can also prevent major birth defects and increase opportunities for delivering a healthy baby [2, 3]. Fetal health has also been linked to adult health including reducing risks of heart disease, hypertension, and obesity, among other conditions [4]. HealthyPeople 2020 identifies early and adequate prenatal care as priorities in addressing maternal, infant, and child health
According to the Orange County Master Birth File, 89.6% of women who gave birth in 2010 initiated prenatal care within the first trimester. This proportion is higher than the state average (83.5%), the national average (73.1%), and exceeds the HealthyPeople2020 goal of 77.9%. However, some subgroups within Orange County receive prenatal care at a lower rate including Latinas (86.9%), women under 20 years of age (74.3%), women between 20-24 years of age (85.4%), and in 17 cities in Orange County (ranging from 85.0% to 89.7%). Addressing disparities in these groups is an important step in improving birth outcomes in Orange County.
Strategies
Short-term strategies
1. Identify barriers to prenatal care for women who are less likely to receive early prenatal care.
2. Improve timeliness, quality, and number of referrals and linkages between portals of entry for lowincome women and prenatal care providers.

Longer-term strategies to consider
1. Create targeted interventions that address barriers to prenatal care based on identified barriers for women less likely to receive early prenatal care.
Orange County Health Improvement Plan Infant and Child Health 12
Exclusive Breastfeeding
Goal 2: Improve infant and child health outcomes in Orange County.
Objective 2.1: By 2020, increase the proportion of mothers exclusively breastfeeding at 3 months by 10%.

Why is this a priority?
Human breast milk is the optimal source of nutrition and provides many benefits for healthy growth and development [5]. Breastfeeding helps protect against SIDS, respiratory infections, childhood obesity, and other conditions [6]. Mothers benefit from reduced risk of breast and other cancers [7]. HealthyPeople 2020 identifies various objectives related to breastfeeding, including increasing the proportion of infants who are breastfed exclusively through 3 months from 33.6% to 46.2% by 2020. Breastfeeding is also associated with the Behavioral Health priority area’s goal of increasing mental and emotional wellbeing. Research has shown that breastfeeding may lead to reduced risk of developing postpartum depression and that mothers with postpartum depression may be less likely to breastfeed [8,9].
According to the California Maternal and Infant Health Assessment (MIHA), less than one in five (19.0%) women who gave birth in 2011 exclusively breastfed their babies through 3 months after delivery. This proportion is lower than the state average (23.1%). It is important to note that this proportion is not comparable to previous years and the HealthyPeople2020 goal due to differences in definition and methodology. Recent passage of legislation and renewed efforts in this area has provided unique and timely opportunities to address this issue at this time.

Strategies
Short-term strategies
1. Identify ways to promote, support, and leverage WIC’s efforts to support breastfeeding. 2. Explore community-capacity building needs identified in the Children and Families Commission Orange County report. 3. Maintain and disseminate a directory of lactation services in Orange County. 4. Promote and support laws and policies increasing the number of hospitals with infant feeding policy and increasing the number of ‘baby friendly’ hospitals. 5. Promote workplace policies and practices supporting lactation. 6. Improve consistency of exclusive breastfeeding data collected through the Maternal and Infant Health Assessment (MIHA).
Longer-term strategies to consider
1. Create a centralized breastfeeding hotline. 2. Educate caregivers, providers, and family members to promote a culture that supports breastfeeding. 3. Promote best practices that address breastfeeding as part of postpartum and newborn care and assessments.
13 Infant and Child Health Orange County Health Improvement Plan


Orange County Health Improvement Plan Priority Area #2: Older Adult Health 15 Older Adult Health Assessment 17 Goals, Current Activities and Assets, Key Planning Partners 18 Objective 1.1: Early Identification of Conditions of Aging 19 Objective 1.2: Chronic Diseases Health Complications 20 Objective 1.3: Reduce Social Isolation 21 Objective 1.4: Reduce Risk for Elder Abuse and Neglect
OLDER ADULT HEALTH ASSESSMENT
Why is this important to health? Older adult health is an emerging issue as it relates to the capacity of the health care system to support their needs. The number of adults aged 65 and over is projected to grow from 377,180 in 2012 to 670,069 in 2030, when one in five residents of Orange County will be 65 or older. Aging is the best known risk factor for developing Alzheimer’s disease, which was the 4th leading cause of death in Orange County in 2010
What does the data show? This table shows a summary of indicators related to older adult health. Indicator column: [LHI] indicates HealthyPeople2020 Leading Health Indicator OC column: ! indicates the Orange County rate or proportion is at least 10% worse than California indicates improvement of indicator. indicates worsening of indicator. ! indicates that the indicator is trending at an average of at least 1% worse per year with at least four known data points Sub-Group Disparities column: Shows sub-groups with rates or proportions at least 10% worse than Orange County as a whole.
Indicator OC CA US Trend
Alzheimer’s
disease
Rate of deaths per 1,000 population per 2010 Death File
Health status
% adults 65+ reporting good to excellent health per 2011-12 CHIS
Disability
% adults 65+ disabled due to physical, mental, or emotional condition per 2011-12 CHIS
Obesity [LHI]
% adults 65+ obese per 2011-12 CHIS
Diabetes management

% adults 65+ with diabetes(16.0%) who are very confident in controlling and managing it per 2011-12 CHIS
Hypertension medication
% adults 65+ who have high blood pressure (58.5%) who take medicine for it per 2011-12 CHIS
Mammograms
% women 50+ who had mammogram in past 2 years per 2011-12 CHIS
Colorectal cancer screenings
% adults 50-75 years compliant with colorectal cancer screening recommendations per 2009 CHIS
Elder falls
% adults 65+ who fell and went to ER due to fall in past year per 2011-12 CHIS
34.2 per 1,000 ! 29.0 per 1,000 25.1 per 1,000 +12.1% per year ! +17.8 (2001-2010)
Sub-Group Disparities
White females: 42.2
71.7% 72.7% Not available Not comparable –methodology change None
52.7% 51.9% Not available Not comparable –methodology change None
22.5% 23.1% 25.9% Not comparable –methodology change None
67.0% 64.0% Not available Not comparable –methodology change
Males: 57.5%
91.8% 91.0% 94.3% Not comparable –methodology change Not available
85.1% 82.9% 81.5% Not comparable –methodology change Not available
72.4% 67.2% 73.1% +7.3% per year +22.0 (2003-2009)
Latino males: 57.6% Latina females: 54.0% Asian females: 63.6%
51.4% 62.8% Not available Not available initiated in 2011 Not available
15 Older Adult Health Orange County Health Improvement Plan
What does the community say? The following includes feedback from focus groups about older adult health. See Listening to Community Voices for more information about these focus groups.
Vision of optimal health:
Ability to be independent physically and financially
Access to healthy food
Ability to be physically active to the best of their ability
Planning for advanced care and end of life care
Engagement in meaningful social activities
Access to robust social support


What’s working:
• Many programs and organizations provide quality services
• Affordable housing is available in some areas
• One-on-one case management offers individual attention and links older adults to needed services
• Some cultural norms provide more support for older adults
Areas for improvement:
• Ensure that the medical system can meet the needs of the growing older adult population
• Increase awareness of available services
• Increase access to patient navigators
• Reduce gaps in care
• Improve coordination between service organizations
• Provide centralized services


• Reduce cost for medications, medical devices, and care
• Increase access to affordable housing
• Increase resources for transportation
What should our focus be? Based on the assessment findings and the criteria for selection of priorities, the following were proposed as goals and focus areas for the Orange County health improvement plan.
OLDER ADULT HEALTH ASSESSMENT
PROPOSED GOALS AND FOCUS AREAS Goal 1: Improve wellness and quality of life of older adults in Orange County. Focus areas: 1. Clinical preventive services 2. Chronic disease self-management 3. Physical independence (elderly falls, affordable housing) 4. Supportive care (caregiver, long-term care) Cross cutting issues addressed in other areas: 1. Obesity and Diabetes: Older adult healthy weight 2. Public Health System: Provider capacity and access Orange County Health Improvement Plan Older Adult Health 16
Goal 1: Improve wellness and quality of life of older adults in Orange County.
Current Activities and Assets:
Orange County benefits from numerous programs and agencies which serve the needs of older adults, including the Office on Aging (OoA), Council on Aging (CoA), other governmental agencies, healthcare systems, academic institutions with special research/focus on older adults (California State University at Fullerton and University of California at Irvine) and numerous community-based organizations. The Office on Aging is the lead advocate, systems planner, and facilitator relative to all aging issues, and oversees the Senior Citizen Advisory Council (SCAC), manages an information/assistance line for seniors, provides outreach and services, and coordinates state-required planning efforts. Council on Aging oversees the Ombudsman Program, a financial abuse team, a health insurance counseling program, and a friendly visitor program for seniors. Numerous entities and programs, from cities to small non-profits to large county-wide programs, serve specific needs of seniors, such as nutritional assistance, adult day health care, chronic disease self-management classes, and programs to promote health and socialization in seniors.
Seniors in Orange County enjoy a high level of health insurance coverage (almost 98%) and many resources exist to assist seniors with their healthcare and social needs. However, in a county as large and diverse as Orange County, coordination of services and outreach to diverse populations of seniors about these services can be challenging. Two large consortia of senior service providers have existed for a number of years, but they meet primarily for information sharing and networking purposes. In order to strengthen and improve collaboration among governmental and non-profit organizations serving seniors, the Orange County Aging Services Collaborative (OCASC) was formed just four years ago. OCASC serves to bring together many of the larger partners in senior services to jointly work on and advocate for initiatives/activities to benefit older adults However, many of these agencies are experiencing serious funding cutbacks and the only age-based segment of the OC population that is growing (those 65 and over will account for over 20% of the total OC population by 2030) may suffer from a lack of resources to meet their needs.
Key Planning Partners
Alzheimer’s Association
CalOptima
Council on Aging Orange County (COAOC)
California State University at Fullerton Department of Health Science
Health Care Agency Public Health Services
Hoag Hospital
Latino Health Access (LHA)

Office on Aging
University of California at Irvine Division of Geriatric Medicine and Gerontology
OLDER ADULT
HEALTH PLAN
Health Care Agency Behavioral Health Services
17 Older Adult Health Orange County Health Improvement Plan
Early Identification of Conditions of Aging
Goal 1: Improve wellness and quality of life of older adults in Orange County.

Objective 1.1: Increase early identification of conditions and safety risks (e.g. cognitive disorders, chronic diseases, falls, depression) that commonly affect older adults.

Why is this a priority?
Conditions and safety risks that commonly affect older adults include cognitive disorders like Alzheimer’s Disease, chronic diseases like heart disease, diabetes and high blood pressure (hypertension), falls, and depression. More than 75% of our nation’s health care spending is on people with chronic conditions [1], many of which are preventable. Health promotion activities, such as a healthful diet, exercise, and early detection efforts can help reduce the incidence of chronic disease or disability. Lifestyle changes in patients who are pre-diabetic can reduce the incidence of diabetes, and control of blood pressure and cholesterol can reduce the incidence of heart disease.
Chronic conditions are common among older adults in Orange County. According to the California Health Interview Survey (CHIS), almost one in six older adults (aged 65 and above) in Orange County has been diagnosed with diabetes (16.0%) and a similar proportion is obese (17.5%). Over half have ever been diagnosed with high blood pressure (58.5%). And over half (51.4%) of older adults who fell went to the emergency room due to a fall in the past year. Orange County’s rates of Alzheimer’s disease (34.2 per 1,000 older adults) are higher than rates in California and the United States (29.0 per 1,000 and 25.1 per 1,000, respectively). Increasing the proportion of persons with diagnosed Alzheimer’s disease and other dementias who are aware of the diagnosis is an objective in the CDC’s TheHealthyBrainInitiative. Nationally, one in four older adults have some type of mental health problem, such as a mood disorder, not associated with normal aging [2]. Early identification of these conditions and safety risks can lead to earlier treatment and control, and thus less morbidity and disability related to chronic conditions.
strategies 1. Complete and disseminate Orange County Healthy Aging Initiative’s Annual Wellness Visit toolkit to providers. 2. Identify opportunities to implement preventative screenings and assessments in community-based (non-medical) settings.
strategies to consider 1. Increase Annual Wellness Visit screenings by health care providers. 2. Promote health screenings in groups with regular contact with older adults. 3. Develop and disseminate non-medical screening tools and develop provider training to support implementation. Orange County Health Improvement Plan Older Adult Health 18
Strategies Short-term
Longer-term
Chronic Diseases Health Complications
Goal
County.
Objective 1.2: Reduce health complications of chronic diseases among older adults.
Why is this a priority?
Chronic diseases are common in older adults in Orange County. According to the California Health Interview Survey, at least 60% of Orange County adults 65 years or older surveyed in 2011 – 2012 reported one or more chronic diseases. Only about two out of three of surveyed seniors with diabetes and/or heart disease reported that they were “very confident” in managing their disease. These diseases can lead to disabling conditions, which reduce older adults’ independence or require expensive care. In the same survey, over half of older adults reported that they were disabled due to a mental or physical condition.
Evidence-based Chronic Disease Self-Management Programs (CDSMP) can help older adults experience reduced health distress, fewer visits to emergency rooms and physician offices, increased self-efficacy, and reduced health care costs [3] Increasing the proportion who report they are very confident in managing their disease may decrease the number experiencing morbidity due to these diseases
Strategies
Short-term strategies
3. See Objective 1.1 related to preventative screening.
Longer-term strategies to consider
1: Improve wellness and quality of life of older adults in Orange
1. Promote evidence-based programs and promising practices for disease self-management (e.g., Chronic Disease Self-Management Program, Savvy Caregiver, Powerful Tools for Caregivers, and Walk with Ease). 2. Increase participation in existing medication management programs and identify current and future needs and gaps.
19 Older Adult Health Orange County Health Improvement Plan
1. Increase availability of evidence-based programs for chronic disease self-management. 2. Increase availability of effective medication management strategies.
Reduce Social Isolation
Objective 1.3: Reduce social isolation among older adults.
Why is this a priority?
Social isolation affects the overall well-being of seniors, including their health and mental wellness. Social isolation can lead to malnutrition, cognitive impairment, depression and increased vulnerability to elder abuse, among other concerns. Experts on aging have long suspected that socialization improves physical and emotional well-being, increases mental alertness and encourages a more active lifestyle. A variety of research studies confirm these benefits and more, pinpointing the mechanisms behind the protective properties of human interaction that lessen the risk of Alzheimer's disease, promote heart health, lessen chronic pain, improve symptoms of depression and minimize the effects of stress [4]. Although social ties are one of the strongest predictors of well-being, nationally, about 12% of adults aged 65 or older report that they “rarely” or “never” receive the social and emotional support they need [5]. Decreasing social isolation among older adults will help to improve both health and quality of life among older adults. Addressing mental distress among older adults, such as those associated with diminished social ties, are among the calls to action in the CDC’s StateofAging and Health inAmerica 2013.
Strategies
Short-term strategies
1. Promote existing Friendly Visitor Programs and assess for needs and gaps.
2. Promote evidence-based interventions and promising practices to reduce social isolation (e.g., Healthy IDEAS, PEARLS, IMPACT, MECCA).
3. Identify opportunities and promote involvement in community programs (including adult day health centers and senior centers) and activities of isolated individuals based on client needs.
Longer-term strategies to consider
1. Increase geographically accessible and culturally/linguistically availability of Friendly Visitor Programs.
2. Increase availability and utilization of evidence-based interventions to reduce social isolation
Goal 1: Improve wellness and quality of life of older adults in Orange County.
Orange County Health Improvement Plan Older Adult Health 20
Reduce Risk for Elder Abuse and Neglect
Goal
County.
Objective 1.4: Reduce the risk for abuse and neglect of older adults.
Why is this a priority?
Almost one out of seven community-dwelling older adult (not living in assisted living or a nursing home) experiences physical, psychological, or sexual abuse, neglect, or financial exploitation annually [6]. In 2012, Orange County Adult Protective Services (APS) received over 7,700 unduplicated reports of abuse or neglect, with 73% involving elders. This represents a small proportion of those who likely suffer from abuse; for every report of abuse, it has been estimated that many more cases go unreported. Elder abuse and neglect take an enormous toll on victims and the communities they live in. Victims are four times more likely than non-abused older adults to go into nursing homes [7] and are three times more likely to die than their peers of the same age [8]. In order to prevent these occurrences, there is a need to increase public awareness, remove barriers to reporting, and develop and strengthen systems to meet the complex needs of victims of elder abuse
Strategies
Short-term strategies
1. Increase awareness of risk of elder abuse.
2. Identify areas to coordinate efforts with National Center on Elder Abuse.
Longer-term strategies to consider
1. Strengthen and improve policies relating to elder abuse.
1: Improve wellness and quality of life of older adults in Orange
21 Older Adult Health Orange County Health Improvement Plan

County Health Improvement Plan Priority Area #3: Obesity and Diabetes 23 Obesity and Diabetes Assessment 25 Goals, Current Activities and Assets, Key Planning Partners 26 Objective 1.1: Child and Adolescent Weight 27 Objective 2.1: Diabetes
Orange
OBESITY AND DIABETES ASSESSMENT
Why is this important to health? Obesity and diabetes are major contributors to the leading causes of death including heart disease, stroke, and certain cancers. Obesity is the 2nd leading contributing factor to death in the United States. Diabetes is itself a major cause of death. In Orange County, it is the 8th leading cause of death overall, 5th among Latinos, and 6th among Asians and Pacific Islanders.
What does the data show? This table shows a summary of indicators related to obesity and diabetes Indicator column: [LHI] indicates HealthyPeople2020 Leading Health Indicator Trend column: indicates improvement of indicator indicates worsening of indicator. ! indicates indicator is trending at an average of at least 1% worse per year with at least four known data points. Sub-Group Disparities column: Shows sub-groups with proportions at least 10% worse than Orange County as a whole.
Indicator OC CA US Trend Sub-Group Disparities
Adult obesity [LHI]
% adults reporting being obese per 2011-12 CHIS
Child (5th Grade) body composition [LHI]
% 5th graders within healthy fitness zone per 2012/13 OCDE
Adolescent (9th Grade) body composition [LHI]
% 9th graders within healthy fitness zone per 2012/13 OCDE
Diabetes
% adults reporting having diabetes per 2011-12 CHIS
Physically inactive
% adults reporting no leisuretime activity in last 30 days 2010 per BRFSS
Fruit & vegetable intake
% adults reporting eating 5 or more fruits & vegetables a day per 2009 BRFSS

Park access
% of population living within a ½ mile of a one-acre size park per 2013 U.S. Census
Healthy food availability
Median mRFEI score based on healthy food retailers as proportion of all food retailers per 2009 CDC
23.8% 25.4% 27.8% Not comparable –methodology change
56.7% 53.2% Not comparable -1.2% per year -1.4 (2010/12-2012/13)
Latina females: 39.8% 45-64 year olds: 27.0%
Latinos: 44.8 Santa Ana USD: 41.1% Orange USD: 50.6%
65.3% 58.9% Not comparable -1.5% per year -2.0 (2010/12-2012/13)
7.4% 8.4% 9.0% Not comparable –methodology change
Latinos: 56.0% Santa Ana USD: 53.6%
Latino males: 9.3% Latina females: 10.9% 45-64 year olds: 11.6% 65+ year olds: 16.0%
21.1% 20.4% 23.9% +2.0% per year ! +1.9 (2005-2010) None
27.4% 27.7% 23.4% - 1.6% per year -1.8 (2005-2009) None
87.9% 73.8% Not available Not available
Villa Park: 27.9%
Stanton: 65.7%
Garden Grove: 66.7%
Buena Park: 73.5%
Seal Beach: 74.8%
Orange: 78.2 Santa Ana: 79.1%
11.1 11.0 10.0 Not available
San Clemente: 4.0
Aliso Viejo: 5.9
Stanton: 6.7
Orange, Westminster: 7.1 Seal Beach: 7.7 Huntington Beach: 8.0
Buena Park, Tustin: 9.1 Lake Forest: 9.5 Cypress: 9.8
23 Obesity and Diabetes Orange County Health Improvement Plan
OBESITY AND DIABETES ASSESSMENT
What does the community say? The following includes feedback from focus groups about obesity and diabetes. See Listening to Community Voices for more information about these focus groups.
Vision of optimal health:
Lack of disease associated with obesity and diabetes
Individuals make healthy choices about food and physical activity
Everyone has access to healthy and affordable food
Everyone has access to resources for physical activity
The community is aware of ways to achieve health There is support for healthy lifestyles
What’s working:
• Increased resources, information, and support for obesity prevention
• Increased school and community involvement
• Increased collaborations around nutrition, physical activity, obesity, and diabetes
Areas for improvement:
• Increase access and affordability of healthy food
• Create changes in the environment and infrastructure that support physical activity
• Engage the community about health
• Improve coordination and consist ency in policies

• Fund programs that address obesity
What should our focus be? Based on the assessment findings and the criteria for selection of priorities, the following were proposed as goals and focus areas for the Orange County health improvement plan.
PROPOSED GOALS AND FOCUS AREAS


Goal 1: Increase the proportion of Orange County residents who are in a healthy weight category. Goal 2: Reverse the trend of increasing rates of diabetes among Orange County residents. Focus areas: 1. Physical activity 2. Nutrition Cross cutting issues addressed in other areas: 1. Public Health System: Early screening for chronic diseases Orange County Health Improvement Plan Obesity and Diabetes 24
OBESITY AND DIABETES PLAN
Current Activities and Assets:
Many Orange County organizations are working together to address obesity across the lifespan. Several programs champion breastfeeding as one of the first steps to establish a variety of health benefits including healthy weight. Programs are in place to educate individuals and families about healthy food and physical activity. Women, Infants, and Children (WIC) offers education and financial assistance for low-income residents to purchase healthy food. The Nutrition Education and Obesity Prevention (NEOP) program provides financial support that allows for nutrition education in school and community settings. ChampionMoms give real life examples of ways to eat healthier and encourage families to be more physically active. Various collaboratives exist to bring together partners working on prevention of obesity and other chronic diseases. The Nutrition and Physical Activity Collaborative (NuPAC) brings together partners throughout Orange County for the purpose of networking and collaboration in the areas of nutrition and physical activity. The Alliance for a Healthier Orange County, a county-wide collaborative whose mission is to champion policy strategies for improved health, has implemented an Move MoreEatHealthy campaign to inspire schools and cities to create healthier practices that support physical activity and healthy eating.
Environmental approaches are used by some programs to create community-level changes in the built environment or to increase access to healthy choices. An example is the Health Care Agency’s Fifteen inTwenty-twenty , which partners with jurisdictions to create environments that are walkable and include options for healthy eating. Orange County has been the recipient of several grants that are creating healthier communities and will help individuals to engage in healthier lifestyles. For example, BuildingHealthyCommunities is a ten-year initiative in Central Santa Ana funded by the California Endowment to support the development of healthy communities. Kaiser Permanente has funded the HealthyEatingActiveLiving(HEAL)Zone in Anaheim to increase access to healthy choices. Many cities have taken steps to promote physical activity through the development of joint use agreements with schools and also through General Plan updates that create bike lanes.
Key Planning Partners
Alliance for a Healthier Orange County (AHOC)
American Diabetes Association (ADA)
Children and Families Commission of Orange County (CFCOC)
Coalition of Orange County Community Health Centers (COCCC)
Health Care Agency Public Health Services
Hoag Hospital
Kaiser Permanente


Latino Health Access (LHA)
Orange County Asian Pacific Islander Community Alliance (OCAPICA)

Orange County United Way
Nutrition and Physical Activity Coalition (NuPAC)
CalOptima
Goal 1: Increase the proportion of Orange County residents who are in a healthy weight category.
25 Obesity and Diabetes Orange County Health Improvement Plan
Goal 2: Reverse the trend of increasing rates of diabetes among Orange County residents.
Child and Adolescent Weight

Objective 1.1: By 2020, increase the proportion of children and adolescents who are in a healthy weight category and reduce disparities in subgroups with lower rates of healthy weight
Why
is this a priority?
Obesity is the 2nd leading behavioral contributor to death in the United States [1]. Today’s children may lead less healthy lives and have shorter life spans than their parents due largely to heart disease, cancers, stroke, and diabetes associated with obesity [2]. Obesity is included as a priority in Let’sGetHealthy California and is a CDC Winnable Battle . Healthy eating and active living are contributing causes of obesity are both priorities in the NationalPreventionStrategy .
According to the California Physical Fitness Test, in 2012/13, only 56.7% of Orange County 5th graders had a healthy body composition in 2012/13. Latino and male 5th graders were less likely to have a healthy body composition with only 44.8% and 52.4%, respectively Rates of healthy body composition among 5th graders also varied by geography, with some school districts having half or less than half of students with healthy body weight. Among 9th graders, 65.3% had healthy body composition, with only 56.0% of Latino 9th graders having a healthy body composition in 2012/13. Working with schools, families, and communities to increase healthy body composition and address disparities in subgroups are important steps to increasing overall healthy weight status in Orange County.
Strategies (All strategies contribute to Infant and Child Health priority area )
Short-term strategies
1. Work with school districts and educators to explore opportunities to align priorities for health and education. 2. Promote implementation of school wellness plans and use of Wellness Councils in elementary schools. 3. Promote and expand community efforts involving parents and families such as WalktoSchoolDay, ChampionMoms, and youth engagement programs. 4. Promote and expand existing environmental efforts such as HEAL Cities , TheWellness Corridor , and increasing joint-use agreements.
5. Identify ways to retain WIC participants through age four to improve a “healthy start” for nutrition.
Longer-term strategies to consider
1. Initiate workplace wellness programs in schools to support healthy lifestyles for school staff.
2. Work with school districts, schools, Parent Teacher Student Associations (PTSAs), and educators to expand school-based programmatic and policy opportunities to improve nutrition and physical activity. 3. Coordinate consistent messages about obesity with health care providers, schools, and others. 4. Work with neighborhood and community-based programs and providers to target interventions for populations at greatest risk.

Goal 1: Increase the proportion of Orange County residents who are in a healthy weight category.
Orange County Health Improvement Plan Obesity and Diabetes 26
Objective 2.1: By 2020, stabilize the rates of diabetes among Orange County residents.
Why is this a priority?
Diabetes is a major cause of heart disease and stroke, which are the leading and third leading causes of death in Orange County, respectively [3]. Diabetes is itself a leading underlying cause of death; in Orange County, diabetes is the 8th leading cause of death overall, the 5th leading cause of death among Latinos, and the 6th leading cause of death among Asians and Pacific Islanders. Type 2 diabetes accounts for about 95% of diabetes cases and is associated with healthy eating and regular physical activity [3] New diagnosed cases of diabetes have tripled since 1990 in the United States and continue to increase [3]. Gestational diabetes, diabetes that develops during pregnancy, increases the likelihood of pregnancy complications and increases risks of diabetes for the mother and the child [3, 4]. Diabetes is included as a priority in Let’s Get HealthyCalifornia . Healthy eating and active living are contributing causes of diabetes and are both priorities in the NationalPreventionStrategy and CDC’s Winnable Battles . Early identification of and reducing complications of chronic diseases such as diabetes are identified as objectives in the Older Adult Health Section of this plan.
According to the California Health Interview Survey (CHIS), between 2003 and 2009, the proportion of Orange County adults reporting having ever been diagnosed with diabetes increased from 6.6% to 7.7%. The proportion of gestational diabetes among women who gave birth increased from 4.5% in 2001 to 7.2% in 2010. In 2011-12, 7.4% of Orange County’s adults reported ever being diagnosed with diabetes [4]. The rates were higher among Latinos, with about one in 10 Latinos reporting having been diagnosed with diabetes. Conclusions about trends in rates of diabetes since 2009 are difficult to draw due to changes in methodology. Regardless, stabilizing rates of diabetes would be an important first step to reversing the trend of increasing rates of diabetes in Orange County that took place between 2001 and 2010
Strategies
Short-term strategies
1. Work with health care providers to increase identification of and interventions for pre-diabetes and gestational diabetes.
2. Promote availability and use of effective diabetes self-management education programs by persons with pre-diabetes, diabetes, and gestational diabetes.
3. Coordinate consistent messages about ways to prevent and manage diabetes (e.g., proper nutrition, physical activity, smoking cessation).

Longer-term strategies to consider


1. Implement a community-wide campaign to increase general awareness about diabetes and ways to improve diabetes prevention and management (e.g., proper nutrition, physical activity, smoking cessation).
2. Expand use of best practices related to obesity and diabetes prevention and intervention at all primary care provider offices.
Diabetes
Goal 2: Reverse the trend of increasing rates of diabetes among Orange County residents.
27 Obesity and Diabetes Orange County Health Improvement Plan

County Health Improvement Plan Priority Area #4 : Behavioral Health 29 Behavioral Health Assessment 31 Goals, Current Activities and Assets, Key Planning Partners 32 Objective 1.1: Mental Health Needs, Gaps, and Resources 33 Objective 1.2: Integration of Behavioral Health 34 Objective 2.1: Adult Alcohol Misuse 35 Objective 2.2: Prescription Drug Misuse
Orange
BEHAVIORAL HEALTH ASSESSMENT

Why is this important to health? A comprehensive view of health also considers mental health and addiction to alcohol and other substances. Mental health conditions can severely impact health and quality of life. Alcohol and drug use are each among the top nine leading behavioral contributors of death in the United States. Chronic alcohol and drug use can lead to heart disease, stroke, and liver disease and can increase risks of injury, violence, and other social harms
What does the data show? This table shows a summary of indicators related to behavioral health. Indicator column: [LHI] indicates HealthyPeople2020 Leading Health Indicator Trend column: indicates improvement of indicator indicates worsening of indicator. ! indicates indicator is trending at an average of at least 1% worse per year with at least four known data points. Sub-Group Disparities column: Shows sub-groups with rates or proportions at least 10% worse than Orange County as a whole.
Indicator OC CA US Trend
Mental Health Suicides [LHI]
Rate of deaths per 100,000 per 2010 Death File
Depression
% adults with Major Depressive Episodes per 2011 NSUDH
Mental diseases and disorders hospitalizations
Crude rate per 10,000 population per 2010 OSPHD
Alcohol and Drug Use
Adult binge drinking
[LHI] % adults binge drinking in past month per 2010 BRFSS
Adolescent alcohol use [LHI] % 11th graders reporting alcohol use in past month per 2009/10 CHKS
Adolescent drug use [LHI] % 11th graders reporting drug use in past month per 2009/10 CHKS
Drug-Induced deaths
Crude rate per 100,000 population per 2010 Death File
Alcohol-related motor vehicle deaths
Rate of deaths per 100,000 per 2011 SWITRS
Alcohol outlet density
Off-sale alcohol outlets per 100,000 population per 2012 Calif. Alcohol Beverage Control
8.5 per 100,000 9.7 per 100,000 12.1 per 100,000 No change
Not available Not available 6.6% National data –No change (20052011)
39.2 per 10,000 Not available Not available Not available
Sub-Group Disparities*
All males: 13.6 White males: 19.3 Asian males: 9.7
Not available
White males: 58.3 White females: 66.0 Af Am males: 78.3 Af Am females: 74.7
14.9% 15.8% 15.1% -2.6% per year -0.8 (2008-2010) Not available
31.9% Not available Not available +1.6% per year +1.9 (2005/062009/10)
20.5% Not available Not available -2.3% per year -2.6 (2005/062009/10)
10.3 per 100,000 Not available Not available Not available
1.6 per 100,000 2.2 per 100,000 Not available -3.7% per year -0.8 (2002-2011)
60.5 per 100,000 76.0 per 100,000 Not available +0.5% per year +2.5 (2003-2012)
*White males: 35.1% White females: 37.1% Latino males: 36.2% Latina females: 35.9%
*All males: 23.7% White males: 26.5% Latino males: 26.6%
Af Am males: 34.4% PI males: 25.0%
All males: 13.8 White males: 23.8 White females: 13.4
Not available
*Stanton: 96.0
Los Alamitos: 95.1
La Habra: 90.3
*Cities shown for alcohol outlet density are highest three of county. For more detail on sub-groups, see Summary of Key Health Indicators and the Orange County Health Profile.
29 Behavioral Health Orange County Health Improvement Plan
BEHAVIORAL HEALTH ASSESSMENT


What does the community say? The following includes feedback from focus groups about behavioral health See Listening to Community Voices for more information about these focus groups.
Vision of optimal health: Individuals live without fear of stigma related to mental illness
are independent and productive
The social environment is safe and supportive
substance abuse
What’s working:
• Levels and types of services are increasing and use a comprehensive approach including prevention, early intervention, and transitional services
• Good public and private collaboration

• Increasing awareness about mental health issues
Areas for improvement:
• Reduce stigma associated with mental health
• Reduce cost for mental health medications and services
• Increase parity for mental health and primary health services
• Improve coordination and collaboration of services
• Provide more education to medical students
• Reduce gaps in care
• Increase community ownership of mental health issues
What should our focus be? Based on the assessment findings and the criteria for selection of priorities, the following were proposed as goals and focus areas for the Orange County health improvement plan.
GOALS AND FOCUS AREAS Goal 1: Increase the proportion of Orange County residents who experience emotional and mental wellbeing through the lifespan. Focus areas: 1. Mental health professionals 2. Awareness, education, and advocacy for mental health issues 3. Awareness, education, and advocacy for mental health services Goal 2: Reduce alcohol and drug misuse in Orange County. Focus areas: 1. Adult binge drinking 2. Underage drinking 3. Drug abuse, including prescription drug abuse Orange County Health Improvement Plan Behavioral Health 30
Individuals
Individuals are
free PROPOSED
Current Activities and Assets:
Orange County’s mental health system includes a collaboration of private and public partnerships involving Orange County Health Care Agency Behavioral Health Services, CalOptima, the Hospital Association of Southern California, private providers, and community providers. The Orange County Mental Health Board is advisory to the County Board of Supervisors and is the official community body that advocates for an accessible, appropriate, and effective mental health system. Orange County is also a recipient of Mental Health Services Act (MHSA) funds, which help to fund a full continuum of mental health and supportive services to address serious mental illness, as well as prevention efforts. Components of the system include community services and supports, workforce education and training, prevention and early intervention, housing, capital facilities and technology, and innovation.
Orange County agencies have a long history of working together to prevent misuse of alcohol and other drugs. Orange County Health Care Agency’s Alcohol Drug Education and Prevention Team (ADEPT) provides community-based interventions that address underage drinking, prescription drug misuse, and driving under the influence of alcohol or drugs These programs work with school personnel, members of faith-based organizations, parents, medical providers, youth, business owners and local law enforcement. Strategies include campaigns, trainings, youth development and environmental approaches. Examples of campaigns include one that informs parents of the growing concern about prescription drug use and another aimed at safe disposal of unused medications. The Health Care Agency’s Prevention and Intervention Team also addresses these issues through schoolbased programs and by working with parents. Several Orange County collaboratives have been successful in securing Drug Free Communities grants, which have brought additional resources to Orange County
Orange County Department of Education


Orange County Women’s Health Project
BEHAVIORAL HEALTH PLAN
Key
CalOptima Children and Families Commission of Orange County (CFCOC) Coalition of Orange
Community
Centers (COCCC) Health Care Agency Behavioral Health Services Health Care Agency Public Health Services Kaiser Permanente
Planning Partners
County
Health
Latino Health Access (LHA)
Goal 1: Increase the proportion of Orange County residents who experience emotional and mental wellbeing through the lifespan.
31 Behavioral Health Orange County Health Improvement Plan
Goal 2: Reduce alcohol and drug misuse in Orange County.
Mental Health Needs, Gaps, and Resources
Objective 1.1: Improve understanding of mental health needs, gaps, and resources.
Why is this a priority?
Mental health and depression are among the top priority health issues in Orange County. Suicide is the 10th leading cause of death in the county, which highlights risk factors such as depression and other mental health disorders [1]. Mental disorders such as depression can make common chronic conditions, such as heart disease, cancer, diabetes, and obesity, worse and result in increased work absenteeism and short-term disability [2]. Mental health issues often create a significant personal barrier to seeking and staying in medical care. By some accounts, it is the leading cause of disability. However, there are no local estimates on the prevalence of depression or other mental health conditions.
The implementation of the Affordable Care Act and the Mental Health Parity and Addiction Equity Act has brought about opportunities to expand services and address some existing gaps in mental health services. However, the implementation of these services and how they will impact the public health system and the services for residents in Orange County is still to be determined. The need to increase understanding of the prevalence of mental health conditions and Orange County’s capacity to meet these needs was identified as an area of need during the assessment process. The first step to helping to increase the emotional and mental wellbeing of Orange County residents through the lifespan is to increase public health’s understanding of mental health needs, gaps, and resources to better plan for those needs. These efforts are aligned with the CDC’s four-year action plan to integrate mental health and public health [3].
Strategies
Short-term strategies
1. Conduct a review of current tools and capacities related to mental health services (e.g., AgesandStages , HelpMeGrow , 2-1-1).

2. Monitor impact of legislation including expansion of Medi-Cal mental health benefit due to Affordable Care Act and mental health parity legislation specific to access consumer understanding of benefit, ability to access and navigate benefit, and community capacity to meet need (e.g., adequate number of providers, linguistic/cultural competence).
3. Identify and address data gaps related to population health (e.g., prevalence of depression, anxiety, and other mental health conditions), particularly at a sub-county level.
4. Explore the need to expand upon 2-1-1 as a resource directory for behavioral health services (in conjunction with the new OCLINKS resource).
Longer-term strategies to consider
1. Determine strategies to utilize above information for expanding behavioral health screenings and services among providers.
Goal 1: Increase the proportion of Orange County residents who experience emotional and mental wellbeing through the lifespan.
Orange County Health Improvement Plan Behavioral Health 32
Integration of Behavioral Health
Objective 1.2: Improve provider capacity to integrate behavioral health into health assessments and services.
Why is this a priority?
According to the Substance Abuse and Mental Health Services Administration (SAMHSA), despite the high prevalence of mental health and substance use problems, many Americans go without treatment – in part because their disorders go undiagnosed. Routine screenings in primary care and other healthcare settings enables earlier identification of mental health and substance use disorders, which translates into earlier care and better health outcomes. These screenings should occur across the lifespan, including during childhood, with perinatal and postpartum care, and during transition into older adulthood [4].
The public health system is often a key point of contact for many individuals with mental health or substance use issues. This provides a unique opportunity to screen, link, or serve individuals with behavioral health services who may otherwise go undiagnosed and untreated. Currently, many providers and agencies within the public health system lack the expertise or capacity to integrate behavioral health services into their programs. Improving provider capacity in this area will help to increase the proportion of residents whose mental health and/or substance use issues are addressed and opportunities for improved emotional and mental wellbeing These efforts are aligned with the CDC’s four-year action plan to integrate mental health [3] and public health and the NationalPreventionStrategy .
Strategies
Short-term strategies
1. Monitor whether medical providers have user-friendly and current resources for referrals and successful linkages.
2. Promote county-wide concept of wellness that includes behavioral health.
Longer-term strategies to consider
1. Increase use of behavioral health screening tools by providers.
2. Assess and address needs of non-medical providers to improve ability to discuss and address mental (and behavioral) health issues with the public in ways that emphasizes overall wellness and promotes mental health as an integrated aspect of health.
3. Implement social marketing strategies to reduce stigma associated with mental (and behavioral) health issues and integrate them into the concept of overall health and well-being.
4. Consider options for mental health care through Telehealth based on potential shortages in local mental health providers. Telehealth is the use of electronic information and telecommunication technologies to support long-distance clinical health care.
5. Ensure appropriate level of care for patients.
Goal 1: Increase the proportion of Orange County residents who experience emotional and mental wellbeing through the lifespan.
33 Behavioral Health Orange County Health Improvement Plan
Goal
Adult Alcohol Misuse
2: Reduce alcohol and drug misuse in Orange County.
Objective 2.1: By 2020, reduce adult alcohol misuse.
Why is this a priority?
Alcohol consumption is the 3rd leading contributor to death in the United States [5]. Acute alcohol abuse increases risks of injury, violence, poor birth outcomes, and alcohol poisoning, while chronic alcohol abuse increases risk of heart disease, stroke, and liver disease [6]. Preventing drug abuse and excessive alcohol use is a priority in the NationalPreventionStrategy Addressing alcohol misuse could also potentially impact the Infant and Child Health priority area Prenatal alcohol exposure is a risk factor for many adverse physical and behavioral outcomes including fetal alcohol syndrome and a continuum of fetal alcohol spectrum disorders [7]
According to the Behavioral Risk Factor Surveillance System (BRFSS), in 2010, 14.9% of Orange County adults reported binge drinking, defined as consumption of five or more drinks for males or four or more for females in a single occasion in the past month. More local data, acquired in the 2012 Survey of Orange County Adults, showed that almost nine out of ten (88%) frequent binge drinkers are males Half of all frequent binge drinkers are aged 18-34, double their proportion in the population at large One in ten alcohol users reported having driven a motor vehicle when they had too much to drink at least once during the past year. When combined with survey data on the frequency of drinking and driving, this prevalence rate yields an estimate of nearly 1,000 adult drinking and driving episodes each day in Orange County. Adult high-risk drinking is identified as a key problem in Orange County’s AlcoholandOtherDrug PreventionServicesStrategicPlan indicating it is as a contributor to health problems and a threat to community safety.
Strategies
Short-term strategies
1. Promote and expand existing efforts to educate the public about alcohol misuse (e.g. Community ServicesProgram-PositiveActionsToward Health and OrangeCountyDUI Task Force) 2. Monitor implementation of newly mandated SBIRT (Screening, Brief Intervention, Referral, and Treatment) by Medi-Cal providers as possible best practice to be promoted with non-Medi-Cal providers. SBIRT is an evidence-based based practice to identify, reduce, and prevent problematic use, abuse, and dependence on alcohol and illicit drugs in primary care and emergency room settings. 3. Monitor impact of Mental Health Parity and Addiction Equity Act on availability and accessibility of services.
Longer-term strategies to consider
1. Increase behavioral health screenings by health care and other public health providers.
Orange County Health Improvement Plan Behavioral Health 34
Prescription Drug Misuse
Goal 2: Reduce alcohol and drug misuse in Orange County.
Objective 2.2: By 2020, reduce prescription drug misuse.
Why is this a priority?
The nonmedical use and abuse of prescription drugs to get high is a serious public health problem. At the core of this problem is the rising tide of prescription opioid abuse, driven primarily by the nonmedical use of opioid pain relievers, such as hydrocodone and oxycodone. Compared to state and national survey results, Orange County residents generally have similar or even lower rates of prescription drug abuse and illicit drug use. According to the Orange County Coroner Annual Report, while the number of drug overdoses due to illicit drugs has declined, overdose deaths related to prescription drugs have more than doubled in the past 13 years In 1999, 88 people died from prescription drugs alone, compared to 188 in 2012, with the relative flattening of annual deaths from 2009 (191 deaths) to 2012 (188 deaths). Overdose deaths due to the combination of prescription and illicit drugs have increased from 21 in 1999 to 77 in 2012, with a doubling in the last five-year period alone (31 in 2008 to 77 in 2012) [8]
According to 2011/12 California Health Kids Survey (CHKS), pain killers (Vicodin, OxyContin) and cough/cold medicines were the most commonly abused prescription and over-the-counter drugs among youth at the local, state, and national levels. In Orange County, 13% of 11th graders report having used prescription pain killers to get high in their lifetime, a decline from a peak rate of 18% in 2005/06. In the case of young people, the relative ease with which they are able to obtain these drugs, and the fact that many believe that prescription drugs provide a “safe” high contribute to the problem. Abuse of prescription drugs and its impact on public health and community safety was identified as a key problem in Orange County’s Alcohol andOtherDrugPreventionServicesStrategicPlan . Preventing drug abuse and excessive alcohol use is a priority in the NationalPreventionStrategy
The National Survey on Drug Use and Health (NSDUH) found that over half (54%) of individuals reporting nonmedical use of psychotherapeutics got them “from a friend or relative for free” [9] While the proper use of these drugs can be lifesaving, the consequences of their abuse can be as dangerous as those from illegal drugs, leading to emergency department visits and deaths.
Strategies
Short-term strategies
1. Increase education to health care professionals (providers and pharmacists) regarding prescribing practices and drug disposal. 2. Expand community campaigns addressing the consequences of prescription drug misuse.
Promote medication management programs. (Also see Older Adult Health Plan).
Longer-term strategies to consider
1. Explore promotion of alternative pain management strategies that reduce dependence on medication.
consumer education campaigns that reduce access to prescription drugs for purposes other than as prescribed.
3.
35 Behavioral Health Orange County Health Improvement Plan
2. Expand

County Health Improvement Plan 37 Public Health System Assessment 40 Vision, Current Activities and Assets , Why is this important? 41 Overall Public Health System, Infant and Child Health System 42 Older Adult Health System 43 Obesity and Diabetes System, Behavioral Health System Orange County Public Health System
Orange
ASSESSING THE PUBLIC HEALTH SYSTEM
Improving the health of the community requires a well-coordinated and functioning public health system that supports efforts to provide high-quality programs and services The Orange County Public Health System Assessment helped to identify strengths, weaknesses, and opportunities for improvements in the public health system. As depicted in the illustration below, the public health system is a partnership between many entities including residents, health care providers, communitybased organizations, schools, businesses, and government that contribute to the public’s health.
At its initial meeting in October 2012, the Community Health Planning Advisory Group established a vision for a public health system that would support a healthy Orange County (shown on right). In August 2013, the Community Health Planning Advisory Group held a four-hour meeting to conduct an assessment of the Orange County public health system. Over 30 stakeholders representing 16 different agencies in the public health system including the Orange County Health Care Agency, social service providers, health care providers, and others participated in this assessment. Participants were asked to rate how well the current system compared to the Advisory Group’s vision of Orange County’s public health system on a scale of 1 (not at all) to 5 (optimal). Work groups were then organized to engage discussions about the strengths, weaknesses, immediate opportunities, and longer-term priorities for the system. Feedback regarding the public health system that resulted from the community discussions at the Community Alliances forum and Health Care Agency staff forum were also considered in the assessment of the system.
VISION FOR ORANGE COUNTY PUBLIC HEALTH SYSTEM


A partnership between many entities including residents, health providers, community-based organizations, schools, businesses, and government that is:
• responsive, accessible, and accountable to the communities it serves
• well-connected and coordinated across various sectors


• driven by data and seeks to promote best practice
• positioned to anticipate and respond to current and future challenges and opportunities impacting health
Behavioral Health
Elected Officials
Hospitals Social Services City Planners
Businesses
Public Health
Schools
Transit Health Collaboratives Residents Faith-Based Institutions
Public Safety Research Health Care Providers
Community-Based Organizations 37 Orange County Public Health System Orange County Health Improvement Plan
Corrections Civic Groups Parks and Recreation
PUBLIC HEALTH SYSTEM ASSESSMENT
The following is a summary of the scores on a scale of 1 (not at all) to 5 (optimally) for each ideal and the number of participants who gave each rating during the Orange County Public Health System Assessment in August 2013.
Ideals for Optimal System
The system is responsive, accessible, and accountable to the communities it serves.
The system is well connected and coordinated across various sectors.
The system is driven by data and seeks to promote best practices.
The system is positioned to anticipate and respond to current and future challenges and opportunities impacting health.
Average Score
Number of Participants Giving Each Rating (Highest count is bolded)
Not at all=1 Minimally=2 Moderately=3 Significantly=4 Optimally=5
2.8 0 8 20 1 0
2.8 0 10 16 5 0
2.6 0 17 8 4 0
2.4 2 15 11 2 0
What does the community say? In June 2013, focus groups were conducted to learn community perspectives about the four priority health areas. (See Listening to Community Voices for more information about these focus groups.) Comments about the public health system were a key theme throughout those conversations and are shown below. Letters in parenthesis indicate the priority health area of the focus group in which the bullet was discussed: IC = Infant and Child Health, OA = Older Adult Health, OD = Obesity and Diabetes, and BH = Behavioral Health.
Vision of optimal system:
Services are accessible and easy to navigate for all (IC, OA, OD, BH)
What’s working:
• Many programs and organizations provide quality services (IC, OA)
Areas for improvement:
Programs are culturally competent (IC, OD) Services focus on early intervention and prevention (IC, OD)
Individuals have access to services that allow for selfmanagement of diseases (OA, OD)
Programs accommodate differences in physical ability and age (OD)
Services are coordinated between organizations (IC)
• Increased access to services and information(IC, OD)
• Increasing numbers of collaborations (OD, BH)
• Personalized support such as case management to help individuals access services (IC, OA)
• Community-based efforts are increasing and provide accessible services (IC, OD)
• Levels and types of services are increasing and use a comprehensive approach (BH)
• Increase access to care (including ability to find and navigate existing services) for all and reduce gaps in care (IC, OA, BH)
• Improve coordination between service organizations (IC, OA, BH)
• Ensure that the medical system can meet the needs of the population (OA, BH)
• Reduce cost for medications, medical devices, and care (OA, BH)
• Increase awareness of available services (OA)
• Provide centralized services (OA)


Orange County Health Improvement Plan Orange County Public Health System 38
PUBLIC HEALTH SYSTEM ASSESSMENT
The following were themes identified as strengths, weaknesses, opportunities for immediate improvements and partnerships, and priorities for longer term improvement during the Orange County Public Health System Assessment in August 2013:
System Strengths System Weaknesses
1. Many and varied collaborations: There are various collaborations around specific health issues (e.g. tobacco, nutrition, etc.), population groups (e.g. children, youth, older adults), neighborhoods that work to improve health.
2. Availability and quality of individual programs and efforts: There are many individual programs that offer quality services, use best practices, and maintain a wealth of data and information.
3. Addressing acute problems: The system works well to address one-time, immediate problems (e.g. pertussis outbreak, wildfires), but does not do well in addressing longer-term health issues (e.g. obesity, diabetes).
4. Multitude of data and reports: The Health Care Agency, individual programs, and providers gather a lot of data and publish many reports that show the status of various health topics.
1. Lack of shared goals: There is no single, sustained coordinating body working towards a common goal, addressing root cause of issues across populations.
2. Lack of coordination and information sharing: Providers have little time to coordinate services with each other; this can leave clients to manage their care between health systems and can create duplicative services and efforts. Programs could do more to share their best practices and data with each other to build understanding and improve systems overall.
3. Addressing preventative health problems: The system does not do well in addressing prevention issues that require longer-term, sustained efforts (e.g. obesity, diabetes). There are often changes in priorities, funding directives, and leadership and make longer-term goals difficult to meet.
Opportunities for Immediate Improvements
1. Resource inventory: Create an inventory of existing groups and their focus areas across Orange County.
2. Resource directory: Streamline existing service information into a single site for referrals (optimize 2-1-1)
3. Coordinate data efforts: Share data and methodology between providers and standardize activities where possible
4. Linkages between providers: Improve information sharing between providers and determine points where linkages can be made to improve patient navigation of services.
5. Better use of technology: Improve use of available technologies to share information with the public, provide services to individuals, and share information between providers.
Priorities for Longer Term Improvement
1. Long-term planning: Establish and sustain planning efforts that focus on long-term, shared goals across the public health system
2. Broad-based coalition: Create a broad-based coalition to address health that includes stakeholders from outside the healthcare system such as education, social services, and urban planning with the Health Care Agency leading efforts
3. Health indicator sharing: Maintain a mechanism for sharing health indicators that can be used to review and set health priorities.
4. Emphasize preventive health: Emphasize the value of preventive health, which take longerterm joint efforts.
5. Engage policy makers: Improve engagement of policy makers about public health issues.
39 Orange County Public Health System Orange County Health Improvement Plan
PUBLIC HEALTH SYSTEM PLAN


Vision: A partnership between many entities including residents, health providers, community-based organizations, schools, businesses, and government that is: responsive, accessible, and accountable to the communities it serves well-connected and coordinated across various sectors driven by data and seeks to promote best practice positioned to anticipate and respond to current and future challenges and opportunities impacting health

Current Activites and Assets:


Orange County’s public health system is composed of a mix of private and public agencies. Government entities that make up the public health system include the Orange County Health Care Agency, Orange County Social Services Administration, Orange County Department of Education, among others. There are over 30 hospitals in Orange County including several large hospital systems. Two of the larger health plans in Orange County, CalOptima and Kaiser Permanente, combine to serve a large portion of the county’s population. CalOptima is the county organized health system that administers health insurance for low-income individuals including Medi-Cal recipients. Orange County has two large public universities with public health programs including California State University at Fullerton and University of California at Irvine. There are also many community-based organizations that provide a range of health and human services throughout the county. Coordination amongst programs largely occurs through collaboratives and planned efforts based on geography, health issue, and population groups. Orange County United Way, the Children and Families Commission of Orange County, and Health Funders Partnership of Orange County all provide planning and coordination functions for various health topics of interest.
Why is this important?
In its assessment process, improving the functioning of the public health system was identified as an important driver in the success of a community health improvement plan. The Orange County Public Health System Assessment showed that stakeholders believe the current public health system is minimally to moderately meeting the ideals of an optimal public health system. The assessment also revealed that while community members and stakeholders felt that there were quality programs in the community, access to and coordination of these programs were a challenge. A more thorough description is provided in the summary of the Public Health System Assessment Planning efforts for Orange County’s Healthier Together has brought forth opportunities to collectively work on improvements to this system.
40
Orange County Health Improvement Plan Orange County Public Health System
Overall and Infant & Child Health Systems

The following are strategies to move the public health system toward the vision of an ideal public health system. Icons indicate the previously identified system ideals that each strategy addresses. Strategies include those addressing the overall public health system as well as system improvements related to each of priority health areas
Overall Public Health System
1. Formalize the structure of the Community Health Planning Advisory Group as a planning body focusing on long-term public health planning and monitoring of the Orange County health improvement plan.
2. Create a website to communicate events and community health planning efforts with the community and key partners.

3. Create a web-based platform for health indicators accessible to the community and health planners.
4. Establish a core set of standard indicators and a mechanism to assure availability in the future of robust data for use in Orange County health planning.
5. Engage 2-1-1 and key partners to determine opportunities for expansion and improvement of referral and linkage system.

Infant and Child Health
Short-term strategies related to goals
1. Improve timeliness, quality, and number of referrals and linkages between portals of entry for lowincome women and prenatal care providers.
2. Maintain and disseminate a directory of lactation services in Orange County


Longer-term strategies related to goals
1. Create a centralized breastfeeding hotline.
2. Promote best practices that address breastfeeding as part of postpartum and newborn care and assessments.
Strategies addressing improvements in the system
1. Improve consistency of data regarding of exclusive breastfeeding collected through the Maternal and Infant Health Assessment.
2. Address gaps and quality of data regarding adequate prenatal care, breastfeeding, and developmental screening.
41
Orange County
Improvement Plan
Orange County Public Health System
Health
Older Adult Health System
Older Adult Health
Short-term strategies related to goals
1. Promote evidence-based programs and promising practices for disease self-management
2. Increase participation in existing medication management programs and identify current and future needs and gaps
3. Promote existing Friendly Visitor Programs and assess for needs and gaps

4. Promote evidence-based interventions and promising practices to reduce social isolation (e.g. Healthy IDEAS, PEARLS, IMPACT, MECCA).
5. Identify areas to coordinate efforts with National Center on Elder Abuse
Longer-term strategies related to goals
1. Increase availability of evidence-based programs for chronic disease self-management.
2. Increase geographically accessible and culturally/linguistically availability of Friendly Visitor Programs.
3. Increase availability and utilization of evidence-based interventions to reduce social isolation.
Strategies addressing improvements in the system
1. Address data gaps including depression and chronic diseases estimates in older adults.
2. Initiate regular meetings for all senior centers.
3. Further strengthen collaborations with academic institutions (California State University of Fullerton and University of California at Irvine).
4. Expand planning and coordination efforts to include broader-based network (including faith-based organizations, non-governmental organizations, senior housing managers, hospital parish nurses, etc.). Orange County Health
42
Improvement Plan Orange County Public Health System
Obesity & Diabetes and Behavioral Health Systems
Obesity and Diabetes
Short-term strategies related to goals
1. Work with schools districts and educators to explore opportunities to align priorities for health and education.
Longer-term strategies related to goals
1. Coordinate consistent messages about obesity with health care providers, schools, and others.
Strategies addressing improvements in the system
1. Address data gaps including more robust estimates sub-county and sub-group estimates for adult obesity and a reliable countywide system for childhood obesity surveillance
2. Address data gaps including more robust estimates for adult diabetes and prediabetes
Behavioral Health
Short-term strategies related to goals
1. Conduct a review of current tools and capacities related to mental health services (e.g. AgesandStages , HelpMeGrow , 2-1-1).
2. Explore the need to expand upon 2-1-1 as a resource directory for behavioral health services (in conjunction with the new OCLINKS resource).
3. Monitor whether medical providers have user-friendly and current resources for referrals and successful linkages.
4. Monitor implementation of newly mandated SBIRT (Screening, Brief Intervention, Referral, and Treatment) by Medi-Cal providers as possible best practice to be shared with providers.
5. Monitor impact of Mental Health Parity and Addiction Equity Act on availability and accessibility of services.
Longer-term strategies related to goals
1. Determine strategies to utilize findings about mental health needs, gaps, and resources for expanding behavioral health screenings and services among providers.
Strategies addressing improvements in the system
1. Address data gaps including prevalence of depression and other mental illnesses.
2. Address data gaps including improving estimates of current drug and alcohol misuse.
43 Orange County Public Health System Orange County Health Improvement Plan
NEXT STEPS
The process involved in creating the Orange County Health Improvement Plan has helped to launch some important community health activities. The following are some next steps that will help ensure the success and sustainability of this plan. The activities below focus on improvements to the public health system and highlight the most immediate needs related to creating a coordinated planning effort to improve health for all in Orange County. Strategies for the priority health areas will continue with guidance and support Community Health Planning Advisory Group in conjunction with existing coalitions and partners.
Formalize a Community Health Planning Body
Formalize the structure of Community Health Planning Advisory Group as a planning body focusing on long-term public health planning and monitoring of the Orange County health improvement plan.
Create a Website to Share Information
Create a website to communicate events and community health planning efforts with the community and key partners.
Create a Community Health Indicator Platform
Create a web-based plaftorm for health indicators accessible to the community and health planners.
Assure a Core Set of Indicators for Community Health Planning
Establish a core set of standard indicators and assure the future availiability of robust data for use in community health planning.
Orange County Health Improvement Plan Next Steps 44
Orange County Health Improvement Plan Planning Process 46 Planning Framework and Timeline Our planning model and timeline. 47 Vision for a Healthy Orange County Our vision and values. 48 Criteria for Selection of Priorities Our guide for deciding what to include in the plan. 49 Organizing and Reviewing Health Indicators How we organized health indicators for planning purposes. 50 Reviewing Health Indicators How we reviewed health indicators for the Community Health Status Assessment. 51 Selecting Priority Health Areas How we selected priority health areas for further assessment. 52 Listening to Community Voices A description of our Community Themes and Strengths Assessment. 53 Feedback from the Community A description of our process to gather public comment about the plan. 54 Other Community Assessments Findings from community health assessments by our partners.
At the end of 2012, Orange County Health Care Agency assembled the Orange County Community Health Planning Advisory Group to establish a plan to improve health in Orange County. The Advisory Group was composed of representatives from 21 partner organizations including health care providers, academic institutions, collaboratives, community-based organizations, and other government agencies. The plan is the foundation of the OrangeCounty’sHealthierTogether initiative and seeks to align efforts by the various parts of the public health system to improve health for all communities in Orange County.
Orange County chose Mobilizing for Action through Planning and Partnerships (MAPP) as its framework for this planning process. MAPP was developed by the National Association of City and County Health Officials (NACCHO) and the CDC as a tool to bring together stakeholders to identify community health issues and take action. Key phases of MAPP include 1) organizing and partnership development; 2) visioning; 3) conducting assessments; 4) identifying strategic issues; 5) formulating goals and strategies; and 6) acting A distinctive feature of MAPP is the use of four coordinated assessments, each yielding important information and, taken as a whole, providing a comprehensive understanding of a community’s health. The following is a summary of each assessment:
Forces of Change Assessment
Conduct a brainstorm session with Advisory Group to determine:
• What is occurring or might occur that affects the health of our community?
• What are specific threats or opportunities generated by these occurrences?
Community Themes and Strengths Assessment
Hold community focus groups to determine:
• What is our community’s vision of optimal health?
• What is working well in how we address health?
• What are areas for improvement?
Community Health Status Assessment
Review key health indicators with Advisory Group to determine:
• What does the health status of Orange County look like?
• How healthy are our residents?
OC Public Health System Assessment
Conduct assessment with key stakeholders to determine:
• How responsive, accessible, and accountable is our system?
• How well connected and coordinated is our system?
• How data-driven and focused on best practices is our system?
• How well positioned to anticipate and respond to health impacts is our system?
The table below shows the Advisory Group’s timeline for the completion of this plan. As shown, assessments were conducted and findings were reviewed in a series of meetings to guide the Advisory Group in determining goals, objectives, and strategies to be published in its final plan.
Planning Activity
Foundational Advisory Group meetings
Forces of Change Assessment
Community Health Status Assessment
Determine priority areas of interest
Community Themes and Strengths Assessment
OC Public Health System Assessment
Disseminate assessment findings
Publish and disseminate OC Health Profile
Determine goals, objectives, and strategies
Disseminate Plan for public comment
Finalize and publish OC Health Improvement Plan
PLANNING FRAMEWORK
AND TIMELINE
Oct ‘12 Dec ‘12 Jan ‘13 Mar ‘13 Jun ‘13 Aug ‘13 Nov ‘13 Dec ‘13 Jan ‘14 Feb ‘14 Apr ‘14 May ‘14
Orange County Health Improvement Plan Planning Process 46
VISION FOR A HEALTHY ORANGE COUNTY
At its first meeting in October 2012, the Community Health Planning Advisory Group participated in a process to determine a vision for a healthy Orange County and the system that would support it
VISION
Orange
VALUES
Our vision for a healthy Orange County is driven by the following common values:
Equity - The health of all people, families, and communities is equally important.
Comprehensive - Health includes physical, mental, spiritual, economic, environmental, and educational factors that contribute to it.
Collaborative - Optimal health requires a partnership between many entities including residents, health providers, community-based organizations, schools, businesses, and government.
Multi-dimensional - Health must be understood at the individual, family, and neighborhood level.
Prevention and Health Promotion - Optimal health starts with the prevention of disease and injury, and is supported by access to high quality care and treatment.
Self Sufficiency - Health and wellness includes promotion of self-sufficiency and functional independence for those with disabilities and illness.
VISION FOR A SYSTEM THAT WILL SUPPORT A HEALTHY ORANGE COUNTY
Our vision for a healthy Orange County must be supported by a partnership between many entities including residents, health providers, community-based organizations, schools, businesses, and government that is:
responsive, accessible, and accountable to the communities it serves
well-connected and coordinated across various sectors
driven by data and seeks to promote best practice
positioned to anticipate and respond to current and future challenges and opportunities impacting health
County is a community where everyone feels safe and has opportunities and resources to be healthy and enjoy optimal quality of life.
47 Planning Process Orange County Health Improvement Plan
CRITERIA FOR SELECTION OF PRIORITIES
On February 20, 2013, the Orange County Community Health Planning Advisory Group met and discussed criteria to be used for the selection of priority issues that may be included in Orange County’s community health improvement plan. These criteria would be used to help guide the Advisory Group in determining priority issues that indicated greatest need and opportunity for improvement through collective action as it reviewed findings from the four MAPP assessments.
The criteria were first used to determine the list of preliminary areas of interest after review of the health indicators in March 2013 as part of the Community Health Status Assessment. With the completion of the focus groups and the Orange County Public Health System Assessment, the criteria were used again at the Advisory Group’s November 2013 meeting to determine focus areas for each of the priority areas.
The following were the criteria for selection of priority issues:
1. Health Impact: To what degree would action on this health issue improve overall health in Orange County?
2. Disparity: To what degree does addressing this health issue reduce health disparities within the county?
3. Trends: To what degree does addressing this health issue assist Orange County in intervening with a health indicator that is trending negatively or progressing too slowly?
4. Root Cause: To what degree does the health issue address a root cause of disease and disability in Orange County?
5. Efficiency: To what degree can action on this health issue address multiple issues?
6. Economic Impact: To what degree would addressing this health issue decrease economic impact downstream?
7. Prevention: To what degree does the health issue benefit from primary prevention?
8. Early Intervention: To what degree does the health issue benefit from early intervention?
9. Collaboration: To what degree would collaborative or multi-sector approaches to address this health issue improve chances for success?
10. Under-addressed Issue: To what degree is this health issue not addressed or is underaddressed in Orange County?
Orange County Health Improvement Plan Planning Process 48
ORGANIZING HEALTH INDICATORS
Good health planning starts with good data. In mid-2012, the Orange County Health Care Agency assembled the Community Health Indicator (CHI) Work Group to assess the current status of Orange County health data; identify gaps and needs related to data; and develop sustainable mechanisms to provide community heath indicators to planners and stakeholders in both the near and distant future. The group is composed of health and research experts in the Orange County Health Care Agency, with input from community partners.
A review of recent health-related reports in Orange County revealed more than 300 unique health and health-related indicators were being used by community partners. Data were available from a variety of sources. Vital statistics and reportable diseases were available through Orange County’s Master Birth and Death files and Health Care Agency Epidemiology and Assessment. Demographic information was available through the American Community Survey. Information about health behaviors and conditions were available through a variety of surveys including the Behavioral Risk Factor Surveillance System (BRFSS), California Health Interview Survey (CHIS), and the California Healthy Kids Survey (CHKS). Hospital discharge information was available through the Office of Statewide Health Planning and Development (OSHPD). Despite the abundance of data sources, many data sets were not of sufficient methodological consistency to show trends over time or robust enough to show sub-county geographic or demographic information. In addition, data gaps exist for critical issues such as mental health and oral health.
The CHI Work Group narrowed the over 300 indicators to 170 that could become part of an ongoing resource for Orange County partners. They established criteria for prioritizing indicators into the following three tiers:
46 select indicators for use by the Advisory Group in the Community Health Status Assessment. As a whole, these indicators present a general picture of health in Orange County and are potentially actionable by the community Most of these indicators have reliable data sources that can be trended over time and analyzed at the sub-county geographic and demographic level.
75 indicators to be published in the Orange County Health Profile. These indicators include the 46 select indicators and are useful to the broader community in describing community health.
170 indicators to be maintained, without narrative or physical publication, in an Online Health Indicator Library. These indicators include indicators published in the OC Health Profile and additional indicators that are useful and reliable, but may not be as actionable for community health planning purposes.


46 Select Indicators for Community Health Status Assessment 75 Published Indicators in OC Health Profile 170 Indicators in Online Health Indicator Library
49 Planning Process Orange County Health Improvement Plan
After determining which health indicators to review, the Community Health Planning Advisory Group conducted the Community Health Status Assessment in March 2013. The assessment involved a review of a demographic profile of Orange County and 46 health indicators (shown below) over a four-hour meeting in March 2013. Staff from the Orange County Health Care Agency provided an overview of each indicator including its impact on health, how Orange County was doing compared to state and national benchmarks and HealthyPeople2020 goals, 10-year trends, and comparisons by demographic and sub-county geographic categories. A summary of trends and disparities of these key indicators is provided in Summary of Key Health Indicators. A full account of these and other key health indicators are published in the Orange County Health Profile.
SOCIAL, ECONOMIC, AND ENVIRONMENTAL FACTORS
Demographic Profile (Not considered indicators) Summary Measures of Health
• Population distribution by race/ethnicity
• Population distribution by age group
• Population distribution by educational attainment
• Student distribution by English language learning
• Population distribution by city of residence
REVIEWING HEALTH INDICATORS
1.
2. Summary
3.
4.
5.
6.
Life expectancy
of deaths
Summary of births
Leading causes of death
Leading causes of hospitalizations
Leading causes of unintentional injury deaths
1. %
2. %
3. %
4.
1. % of residents
2. % of
are
3. % of adults and children with dental visit in last year HEALTH BEHAVIORS AND OUTCOMES Maternal, Child, and Adolescent Health Chronic Diseases and Conditions 1. Infant mortality rate 2. % of births that are preterm 3. % of births with low birth weight 4. % of infants exclusively breastfed at three months 5. % of 2 years olds and kindergarteners immunized 6. Rate of births to teens 1. % of adults with diabetes 2. % of adults with high blood pressure 3. % of adolescents with healthy body composition 4. % of adults obese 5. Asthma hospitalization rate of children 5 and under Chronic Disease Deaths Cancer 1. Heart disease death rate 2. Cerebrovascular disease (stroke) death rate 3. Alzheimer’s disease death rate 4. Chronic lower respiratory diseases (CLRD) death rate 1. Lung cancer death rate 2. Colorectal cancer death rate 3. Female breast cancer death rate 4. Prostate cancer death rate Communicable Diseases Injuries and Accidents 1. Chlamydia incidence rate 2. HIV incidence rate 3. HIV prevalence rate 1. Injury death rate 2. Unintentional injury death rate Health Behaviors Mental Health 1. % of adults physically inactive 2. % of adults who smoke 3. % of adolescents who smoke 4. % of adults who binge drink 5. % of adolescents who used alcohol or drugs 6. Drug-related death rate 1. Suicide rate 2. % of adults experiencing Major Depressive Episodes 3. Mental disease and disorder hospitalization rate Orange County Health Improvement Plan Planning Process 50
Social and Economic Indicators Health Care Access and Utilization
of residents living in poverty
of adults with high school diploma or equivalent
of housing units defined as crowded
Violent crime rate
with health insurance
emergency department visits that
avoidable
SELECTING PRIORITY HEALTH AREAS
After reviewing all 46 health indicators as part of the Community Health Status Assessment, the Orange County Community Health Advisory Group rated each health issue based on what they thought were the highest priority issues for collective action. The Advisory Group considered their criteria for selection of priorities including trends, disparities, and the health and economic impact of addressing the issue. The following 10 health issues received the highest average ratings (in order):
1. Depression: No local data exists, but an estimated 6.6% of adults in the U.S. experienced Major Depressive Episodes in 2011 Depression interferes with a person’s sense of wellbeing; can worsen chronic conditions such as heart disease, cancer, and diabetes; creates obstacles to accessing care; and, untreated, too often results in disability and loss of life [1, 2]
2. Obesity: Obesity is the 2nd leading contributor to death in the U.S. [3], increasing the risk of heart disease, diabetes, stroke, and other conditions [4] In 2011-12, 23.8% of Orange County adults were obese.
3. Diabetes: Diabetes is a major cause of heart disease and stroke and is itself an underlying cause of death [5]. In 2011-12, 7.4% of Orange County adults had been diagnosed with diabetes.
4. Alzheimer’s Disease: Alzheimer’s disease (AD) is the 4th leading cause of death and the only leading cause of death with an increase in rate in the last 10 years. [6]. Orange County’s aging population makes health issues associated with aging a growing concern.
5. Alcohol Abuse: Alcohol consumption is the 3rd leading contributor to death in the U.S. [3]. Acute alcohol abuse increases risks of injury, violence, and certain chronic diseases [7]. In 2010, 14.9% of Orange County adults reported binge drinking in the past month.
6. Physical Activity: Physical activity is a key factor in maintaining a healthy weight and preventing obesity. In 2010, 21.1% of Orange County adults reported no leisure-time physical activity in the past 30 days.
7. Child Abuse: In 2011, there were 6,836 substantiated cases of child abuse in Orange County. Child abuse causes stress that can disrupt early development, placing children at higher risk for health problems [8]. Children who are abused or neglected often exhibit emotional, cognitive, and behavioral problems [9]
8. Immunizations: Childhood immunizations have largely reduced once-common diseases such as polio, measles, and mumps [10]. Over the past decades, there has been reduced vaccine coverage and herd immunity. In 2012, 89.3% of Orange County kindergarteners were up to date with their immunizations.
9. Mental Diseases and Disorders: In 2010, 11,789 hospitalizations were due to mental diseases and disorders. Mental illness often co-occurs with somatic conditions and complicating treatment [11].
10. Drug Abuse: Illicit drug use is the 9th leading contributor to death in the U.S. [3]. In 2010, 20.5% of 11th graders reported using drugs in the past month and there were 311 drug-induced deaths among individuals of all ages
The 10 health issues were considered as representing topical issues and led to the creation of the following four preliminary priority health areas for further review.
Infant and Child Health
Older Adult Health
Obesity and Diabetes
Behavioral Health
The next step in the assessment process included a more detailed look at health indicators, community feedback, and the systems supporting each priority area. Summaries of the assessment findings are provided in the section for each priority area.
51 Planning Process Orange County Health Improvement Plan
LISTENING TO COMMUNITY VOICES


The Community Health Status Assessment helped to identify four health areas of interest for further assessment:
1) Infant and Child Health
2) Older Adult Health
3) Obesity and Diabetes
4) Behavioral Health
The Community Themes and Strengths Assessments helped to find out more about the community’s perspectives on these areas of interest. This was accomplished through two sets of focus groups conducted in June 2013 and a review of community health assessments conducted by planning partners. The first set of focus groups were conducted at the CalOptima Community Alliances Forum on June 12, 2013. The forum included 100 attendees from 40 community partner organizations with representatives from community-based organizations, health care providers, policy makers, and other individuals/organizations that are working to make positive impacts to community health. The second set of focus groups included approximately 80 Orange County Health Care Agency staff on June 26, 2013. At each of these forums, participants were provided information about the planning process and assessment findings. Participants then engaged in focus groups about one of the four priority areas and answered the following questions:
Summaries of the focus groups are shown in the “What does the community say” section in the assessment for each priority area. Comments about the public health system were a key theme throughout conversations about the four health areas and are included as part of the Public Health System Assessment.

1. What does optimal health look like related to this topic area?
2. What is working well in the way that this topic area is currently addressed in Orange County?
Orange County Health Improvement Plan Planning Process 52
3. What can be improved in the way this topic area is addressed?
FEEDBACK FROM THE COMMUNITY

In April 2014, the Orange County Health Care Agency shared findings from this report with the public. The report was posted on the Health Care Agency’s website and a call for feedback was advertised on the Agency’s homepage. A letter was sent out to community partners to share the plan and invite public comment. Several local media including the OrangeCountyRegister and Voice of OC published articles about the plan and invited comments from the public. The public comment period was also shared through social media including Twitter and Facebook

Comments received showed enthusiasm for the plan and generally supported the identified priority areas. Comments also provided insight about resources and strategies that were helpful in finalizing the plan and directing next steps. Below are examples of some comments received.
I think this is an excellent report with four worthy priorities. I would like to highlight the importance of tobacco control within each of these priorities and hope that it will be included as an important prevention component.
This is an inspiring plan to us in the agency as it addresses important health issues in the best po ssible approach: by bringing the communities together to recognize and strategize the issues most affecting them.
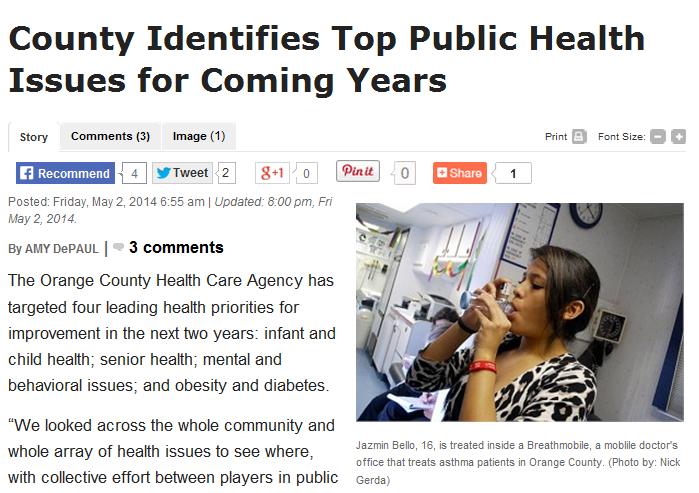
I am very impressed by the draft of the proposed OC Health Improvement Plan and the work that had gone into it…Early diagnosis of dementia is critical to this process and I am very satisfied to see it was included in your report.
I believe the guidance and focus [this plan] offers will aid in contributing to better coordinated efforts working toward a healthier Orange County.
I appreciate the opportunity to be able to read about the new Health Improvement Plan, and give feedback on the plan. I think it is very exciting that the initiative is being taken to look toward the future, and planning for improvement is being worked on now.
I am active in community events on the topic of prescription drug abuse. I want to help the goal of the plan to reduce prescription drug misuse.
53 Planning Process Orange County Health Improvement Plan
OTHER COMMUNITY ASSESSMENTS
Many partner agencies had recently completed community health assessments for hospital community benefits reports, strategic planning processes, or needs assessments processes. To ensure that the Orange County Health Improvement Plan included as many community voices as possible, the plan also considered findings from these assessments Methodologies for the assessments varied and included primary and secondary data collection, focus groups, and key informant interviews. Reviewing findings from these assessments allowed the Advisory Group to gain a broader understanding of the health issues and needs in Orange County. It also helped to ensure that priorities included in the health improvement plan would be aligned with those in the community.
Community assessments conducted by the following groups were considered in this planning process:
Children and Families Commission of Orange County
Health Funders Partnership of Orange County


Hoag Hospital
Kaiser Permanente
Health Care Agency Maternal, Child, and Adolescent Health Assessment
Orange County United Way
St. Joseph Health System
Key health issues, factors impacting health, and strategies identified through these assessments were generally consistent with those found in the Advisory Group’s process and are summarized below
Issues of
Concern Asthma Birth Outcomes Breast Cancer Diabetes Heart Disease HIV/AIDS and STDs Immunizations
Obesity Oral Health Mental Health Postpartum Depression Substance Use Teen Pregnancy
Economic conditions
Transportation to health and other services
Access to quality health care Community-level programs and efforts
Access to healthy foods
Implementation of Affordable Care Act
Community violence
Priorities and
Orange County Health Improvement Plan Planning Process 54
Identified
Health Strategies Addressing disparities in access to quality health services Holistic approaches to health that include promotion of wellness Comprehensive approaches to health that involve family, community, and environmental strategies Focus on prevention and early identification Ensuring health throughout the lifespan
Key Factors Impacting Health
Key Themes from Partner Community Assessments
County Health Improvement Plan Reference Documents 56 Summary of Key Health Indicators A summary of trends and disparities in key health indicators for Orange County. 62 Citations 65 Acronyms and Abbreviations
Orange
SUMMARY OF KEY HEALTH INDICATORS
This table provides an overview of the indicators reviewed as part of the Community Health Status Assessment A full account of these and other key health indicators are published in the Orange County Health Profile.
Please note the following: Indicator column: [LHI] indicates HealthyPeople2020 leading health indicator OC column: ! indicates Orange County rate or proportion is at least 10% worse than California Trend column: Percent in the top line indicates the average percentage change per year. Number in the second line indicates the numeric increase (+) or decrease (-) in the indicator over the period shown. indicates improvement and indicates worsening of the indicator over the period shown ! indicates that the indicator is trending at an average of at least 1% worse per year with at least four known data points Sub-Group Disparities column: Groups shown are sub-groups with rates or proportions that are at least 10% worse than Orange County as a whole
Indicator
OC CA US Trend Sub-Group Disparities
Summary Measures of Health
Life expectancy
Average life expectancy at birth of residents in 2010 per Death File
81.9 Not available 78.7 +0.3% per year +2.0 (2001-2010) None
Social and Economic Indicators
Poverty
% of population living under 100% of federal poverty level in 2011 per US Census Bureau
12.9% 16.6% 15.9% +7.8% per year ! +4.1 (2005-2011)
Latino males: 17.8% Latina females: 20.9% PI males: 14.7% PI females: 17.5%
<18 year olds: 16.3% Santa Ana: 21.1% Stanton: 19.0% Costa Mesa: 16.3% Garden Grove: 15.8% Anaheim: 15.5% Westminster: 15.1% Fullerton: 15.0%
High school diploma
% of individuals 25 and older who had a high school diploma or equivalent in 2011 per US Census Bureau
84.0% 81.1% 85.9% +0.3% per year +1.4 (2005-2011)
Latino males: 57.0% Latina females: 59.1% Santa Ana: 52.5% Stanton: 66.2% Garden Grove: 72.7% Anaheim: 73.8% Westminster: 74.4%
Orange County Health Improvement Plan Reference Documents 56
SUMMARY OF KEY HEALTH INDICATORS
Indicator OC CA US Trend Sub-Group Disparities Social and Economic Indicators (Continued)
Crowded living
% of housing units that have more than one person per room in 2011 per US Census Bureau
9.7% ! 8.3% 3.3% +1.9% per year ! +1.0 (2005-2011)
Latinos: 30.8%
Pacific Islanders: 20.8% Santa Ana: 33.5% Stanton: 22.3% La Habra: 20.9% Anaheim: 18.8% Garden Grove: 16.6% Westminster: 12.7% Buena Park: 12.0%
Violent crime
Rate of violent crimes per 10,000 in 2011 per US Department of Justice
21.3 per 10,000
Health Care Access and Utilization Health insurance coverage
% of residents who reported having health insurance per 2011 US Census Bureau
Avoidable emergency department visits
% of ED visits that could have been avoided per 2011 OCHCA
Dental visits - Children
% of children 12-17 who had seen a dentist in the last year per 2007 OCHNA
Dental visits - Adults
% of adults who had seen a dentist in the last year per 2007 OCHNA
41.1 per 10,000 38.6 per 10,000 -4.1% per year -6.9 (2002-2011)
82.7% 81.9% 84.9% +0.3% per year +0.5 (2009-2011)
44.6% Not available Not available Not available
Geographic comparison not shown as population size may impact crime rate.
Latinos: 68.5% Santa Ana: 65.7% Stanton: 71.9%
Latinos: 50.7% APIs: 51.4% <1 year olds: 68.6% 1-17: 49.2% Santa Ana: 49.7% Anaheim: 49.2%
92.2% Not available Not available Not available None
75.2% Not available Not available Not available
Maternal, Child, and Adolescent Health
Infant mortality [LHI] Rate of deaths of infants under one year of age per 1,000 per 2010 Birth File
Preterm births [LHI]
% infants born between 17 and 37 gestational age per 2010 Birth File
Low birth weight
% infants weighing less than 5 pounds, 8 ounces per 2010 Birth File
Exclusive breastfeeding
% mothers exclusively breastfeeding at 3 months per 2011 MIHA
3.8 per 1,000 4.7 per 1,000 6.5 per 1,000 -1.7% per year -0.7 (2001-2010)
8.9% 9.9% 12.0% -0.7% per year -0.6 (2001-2010)
African Americans: 45.3%
6.4% 6.8% 8.2% +0.9% per year +0.5 (2001-2010)
19.0%! 23.1% Not available Not comparable –methodology change
Latinos: 4.5
African Americans: 13.5% 35-39 year olds: 10.6% 40+ year olds: 14.4%
APIs: 7.7%
African Americans: 12.3% <20 year olds: 7.3% 35-39 year olds: 7.9% 40+ year olds: 10.3%
Latinas: 11.5%
57 Reference Documents Orange County Health Improvement Plan
SUMMARY OF KEY HEALTH INDICATORS
Indicator OC CA US Trend Sub-Group Disparities Immunizations [LHI]
% of kindergarteners with upto-date immunizations per Kindergarten Assessment Results
Births to Teens
Rate of births to teens 15-19 years of age per 1,000 per 2010 Birth File
89.3% 90.3% Not available -0.4% per year -3.6 (2003-2012)
22.4 per 1,000 31.5 per 1,000 34.2 per 1,000 -4.0% per year -12.8 (2001-2010)
Capistrano USD: 75.4% Laguna Beach USD: 77.9%
Latinos: 44.3 18-19 year olds: 37.4
Santa Ana: 53.5 Anaheim: 41.2
La Habra: 32.9 Stanton: 32.7 Garden Grove: 27.9 Costa Mesa: 25.6 Tustin: 24.9
Chronic Diseases and Conditions Diabetes
% adults reporting having diabetes per 2011-12 CHIS
High blood pressure
% adults reporting having been diagnosed with hypertension per 2011-12 CHIS
Child (5th Grade) body composition [LHI]
% 5th graders within healthy fitness zone per 2012/13 OCDE
Adolescent (9th Grade) body composition [LHI]
% 9th graders within healthy fitness zone per 2012/13 OCDE
Adult obesity [LHI]
% adults reporting being obese per 2011-12 CHIS
Asthma hospitalizations in children
Rate of hospitalizations due to asthma in children under 5 per 10,000 per 2010 OSHPD
Chronic Diseases Deaths
Heart Disease deaths
Rate of deaths per 100,000 population due to ischemic heart disease per 2010 Death File
7.4% 8.4% 9.0% Not comparable –methodology change
25.4% 27.2 30.8% Not comparable –methodology change
56.7% 53.2% Not comparable -1.2% per year -1.4 (2010/122012/13)
65.3% 58.9% Not comparable -1.5% per year -2.0 (2010/122012/13)
23.8% 25.4% 27.8% Not comparable –methodology change
19.3 per 10,000 Not available Not available -2.4% per year -5.4 (2001-2010)
Latino males: 9.3% Latina females: 10.9% 45-64 year olds: 11.6% 65+ year olds: 16.0%
White males: 28.7% 45-64 year olds: 33.5% 65+ year olds: 58.5%
Latinos: 44.8% Santa Ana USD: 41.1% Orange USD: 50.6%
Latinos: 56.0% Santa Ana USD: 53.6%
Latina females: 39.8% 45-64 year olds: 27.0%
Whites: 22.3
100.1 per 100,000
104.5 per 100,000 113.6 per 100,000 -5.0% per year -81.7 (2001-2010)
White males: 151.1
Orange County Health Improvement Plan Reference Documents 58
SUMMARY OF KEY HEALTH INDICATORS
Indicator OC CA US Trend Sub-Group Disparities Chronic Diseases Deaths (Continued)
Cerebrovascular
Disease (Stroke) deaths
Rate of deaths per 100,000 population due to cerebrovascular disease per 2010 Death File
Alzheimer’s Disease deaths
Rate of deaths per 1,000 population due to Alzheimer’s disease per 2010 Death File
Chronic Lower Respiratory Diseases (CLRD) deaths
Rate of deaths per 100,000 population due to CLRD per 2010 Death File
Cancer Deaths
Lung cancer deaths
Rate of deaths per 100,000 population due to lung cancer per 2010 Death File
Colorectal cancer
deaths
Rate of deaths per 100,000 population due to colorectal cancer per 2010 Death File
Female breast cancer deaths
Rate of deaths per 100,000 female population due to breast cancer per 2010 Death File
Prostate cancer deaths
Rate of deaths per 100,000 male population due to prostate cancer per 2010 Death File
Communicable Diseases Chlamydia
Rate of diagnosed Chlamydia infection per 100,000 population per 2011 OCHCA
35.8 per 100,000
36.4 per 100,000 39.1 per 100,000 -3.9% per year -19.6 (2001-2010)
34.2 per 1,000 !
32.1 per 100,000
29.0 per 1,000 25.1 per 1,000 +12.1% per year ! +17.8 (2001-2010)
None
33.8 per 100,000
12.9 per 100,000
35.5 per 100,000 42.2 per 100,000 -2.0% per year -7.2 (2001-2010)
White females: 42.2
20.8 per 100,000
35.0 per 100,000 47.6 per 100,000 -2.5% per year -9.6 (2001-2010)
White females: 41.6 White males: 39.6
White females: 35.2
13.8 per 100,000 15.8 per 100,000 -1.5% per year -2.0 (2001-2010)
White females: 13.7 Asian males: 15.6
20.0 per 100,000 22.1 per 100,000 -1.1% per year -2.2 (2001-10)
20.4 per 100,000
241.3 per 100,000
20.5 per 100,000 21.9 per 100,000 -1.5% per year -3.1 (2001-2010)
438.0 per 100,000
426.0 per 100,000 (2010)
+3.0% per year ! +51.3 (2002-2011)
Whites: 23.6
Whites: 23.0
Females 15-24 years: 1623.5
Males 15-24 years: 491.4
Females 25-44 years: 355.3
Santa Ana: 475.2
Anaheim: 396.4
Stanton: 364.0
Garden Grove: 306.6
Costa Mesa: 301.0
Los Alamitos: 297.0
Orange: 293.2
Fullerton: 293.0
59 Reference Documents Orange County Health Improvement Plan
SUMMARY OF KEY HEALTH INDICATORS
Indicator OC CA US Trend Sub-Group Disparities Communicable Diseases (Continued)
HIV – New Cases
Rate of new cases of HIV per 100,000 population per 2011 OC HIV Registry
9.8 per 100,000 13.2 per 100,000 15.8 per 100,000 -3.0% per year -1.7 (2006-2011)
White males: 15.2
Latino males: 26.2
Af Am males: 28.0
19-24 year olds: 20.6 25-39 year olds: 22.7
Laguna Beach: 33.7
Santa Ana: 21.1
Anaheim: 14.1 Orange: 12.0 Westminster: 11.9 Buena Park: 11.2
HIV – Living Cases
Rate of individuals living with HIV at year’s end per 100,000 population per 2011 OC HIV Registry
Injuries and Accidents
Injury deaths
Rate of deaths due to injury per 100,000 population per 2010 Death File
Unintentional injury deaths
Rate of deaths due to unintentional injury per 100,000 population per 2010 Death File
Health Behaviors
Physically inactive
% adults reporting no leisuretime activity in last 30 days 2010 per BRFSS
Adult smoking
% adults who currently smoke per 2011-12 CHIS
Adolescent smoking
Proportion of 11th graders who report having smoked a cigarette in the past 30 days per 2009/10 CHKS
219.6 per 100,000
31.1 per 100,000
299.7 per 100,000 Not Available +3.7% per year ! +34.0 (2006-2011)
White males: 443.3 Latino males: 452.6
Af Am males: 988.3
Af Am females: 431.3 25-39 year olds: 242.1 40-59 year olds: 493.1
41.5 per 100,000 57.9 per 100,000 -1.0% per year -3.1 (2001-2010)
18.9 per 100,000 (Male: 26.8; Female: 12.0)
25.7 per 100,000 38.0 per 100,000 -1.7% per year -3.4 (2001-2010)
All males: 46.1 Huntington Beach: 37.4
White males: 36.1 White females: 15.3 45-64: 26.0 65+ years: 53.2
21.1% 20.4% 23.9% +2.0% per year ! +1.9 (2005-2010)
12.0% 13.8% 21.2% Not comparable –methodology change
13.0% Not available Not available -5.1% per year -0.7 (2005/062009/10)
Not available
Males: 15.5% 18-44 year olds: 14.0%
White males: 17.2% White females: 14.3%
Af Am males: 23.5%
PI males: 18.5%
Laguna Beach USD: 23.8%
Newport-Mesa USD: 20.1%
Brea-Olinda USD: 17.7%
Capistrano USD: 17.4% Orange USD: 14.1%
Orange County Health Improvement Plan Reference Documents 60
SUMMARY OF KEY HEALTH INDICATORS
Indicator OC CA US Trend Sub-Group Disparities Health Behaviors (Continued)
Adult binge drinking [LHI]
% adults binge drinking in past month per 2010 BRFSS
Adolescent alcohol use [LHI]
% 11th graders reporting alcohol use in past month per 2009/10 CHKS
Adolescent drug use [LHI]
% 11th graders reporting drug use in past month per 2009/10 CHKS
14.9% 15.8% 15.1% -2.6% per year -0.8 (2008-2010) Not available
31.9% Not available Not available +1.6% per year +1.9 (2005/062009/10)
White males: 35.1%
White females: 37.1%
Latino males: 36.2%
Latina females: 35.9%
Newport-Mesa USD: 50.4% Laguna Beach USD: 47.7% Capistrano USD: 37.2%
20.5% Not available Not available -2.3% per year -2.6 (2005/062009/10)
All males: 23.7%
White males: 26.5% Latino males: 26.6%
Af Am males: 34.4%
PI males: 25.0%
Laguna USD: 29.8%
Newport-Mesa USD: 27.6% Capistrano USD: 25.0% Orange USD: 23.1% Anaheim USD: 23.0% Tustin USD: 22.9%
Drug-induced deaths
Crude rate per 100,000 population per 2010 Death File
Mental Health Suicides [LHI]
Rate of suicides per 100,000 per 2010 Death File
Depression
% adults reporting Major Depressive Episodes per 2011 National Survey on Drug Use and Health
Mental diseases and disorders hospitalizations
Crude rate per 10,000 population per 2010 OSPHD
10.3 per 100,000 Not available Not available Not available
8.5 per 100,000 9.7 per 100,000 12.1 per 100,000 No change
All males: 13.8 White males: 23.8 White females: 13.4
All males: 13.6 White males: 19.3 Asian males: 9.7
Not available Not available 6.6% Not available Not available
39.2 per 10,000 Not available Not available Not available
Acronyms and Abbreviations
Af
API
Birth File – Orange County Master Birth File
BRFSS – Behavioral Risk Factor Surveillance System
CDC – Centers for Disease Control and Prevention
CHIS – California Health Interview Survey
CHKS – California Healthy Kids Survey
Death File – Orange County Master Death File
Dept. – Department
ED – Emergency Department
HIV – Human Immunodeficiency Virus
MIHA
mRFEI
OCDE
White males: 58.3 White females: 66.0
Af Am males: 78.3
Af Am females: 74.7
Maternal and Infant Health Assessment
Orange County Department of Education
OCHCA – Orange County Health Care Agency
OCHNA
Orange County Health Needs Assessment
OSPHD – Office of Statewide Health Planning and Development
PI – Pacific Islander
SWITRS – Statewide Integrated Traffic Records System
US – United States
USD – Unified School District
Am – African-American
–
Asian and Pacific Islander
–
– Modified Retail Food Environment Index
–
–
61 Reference Documents Orange County Health Improvement Plan
Infant and Child Health Plan
1. U.S. Public Health Services (Expert Panel on the Content of Prenatal Care). Caring for our future: The content of prenatal care. Washington, DC: U.S. Department of Health and Human Services, 1989.
2. Kirkham C, et al. Evidence-based prenatal care: Part I. General prenatal care and counseling issues. Am Fam Physician 2005;17(7):1307-16.
3. Kirkham C, et al. Evidence-based prenatal care: Part II. Third-trimester care and prevention of infectious diseases. Am Fam Physician 2005;71(8):1555-60.
4. Calkins K, Devaskar SU. Fetal origins of adult disease. Curr Probl Pediatr Adolesc Health Care 2011;41(6):158-176.
5. Gartner LM, et al. Breastfeeding and the use of human milk. Pediatrics 2005;115:496-506.
6. Jackson KM and Nazar AM. Breastfeeding, the immune response, and long-term health. JAOA 2006;106(4):203-207.
7. Ip S, et al. Breastfeeding and maternal and infant health outcomes in developed countries. Evidence Report/Technology Assessment No 153. AHRQ Publication No. 07-E007. Rockville, MD: Agency for Healthcare Research and Quality, 2007.
8. Hamdan A, Tamim H. The relationship between postpartum depression and breastfeeding. Int J Psychiatry Med 2012;43(3)243-59.
9. Dennis CL, McQueen K. The relationship between infant-feeding outcomes and postpartum depression: a qualitative systemic review. Pediatrics 2009;123(4):3736-51.
Older Adult Health Plan
1. The Power of Prevention: Chronic Disease…The Public Health Challenge of the 21st Century; National Center for Chronic Disease prevention and Health Promotion, 2009
2. Centers for Disease Control and Prevention, National Association of Chronic Disease Directors. The State of Mental Health and Aging in America Issue Brief 1: What Do the Data Tell Us? Atlanta, GA: National Association of Chronic Disease Directors; 2008.
3. Agency for Healthcare Research and Quality (AHRQ) Factsheet: Preventing Disability in the Elderly with Chronic Disease, 2002. Accessed at http://www.ahrq.gov/research/findings/factsheets/aging/elderdis/index.html
4. Remy, J. Rx Friendship: Add more socialization to your healthy aging prescription. Seniors Digest, Seattle-King County Edition. June 1, 2009. Accessed at http://www.poststat.net/pwp008/pub.49/issue.1091/article.4525/
5. McGuire LC, Strine TW, Okoro CA, Ahluwalia IB, Ford ES. Modifiable characteristics of a healthy lifestyle in U.S. older adults with or without frequent mental distress: 2003 Behavioral Risk Factor Surveillance System. Am J Geriatr Psychiatry. 2007;15:754-761.
6. U.S. Government Accountability Office (2011). Elderjustice:Strongerfederalleadershipcouldenhance nationalresponsetoelderabuse (Report No. GAO-11-208). Accessed at http://www.gao.gov/products/GAO-11-208
CITATIONS
Orange County Health Improvement Plan Reference Documents 62
7. Teaster, P. B., Dugar, T., Mendiondo, M., Abner, E. L., Cecil, K. A., & Otto, J. M. The 2004 survey of adult protective services: Abuse of adults 60 years of age and older. Washington DC: National Center on Elder Abuse.
8. Lachs, M. S., Williams, C. S., O’Brien, S., Pillemer, K. A., & Charlson, M. E. The mortality of elder mistreatment. JAMA,280(5), 428-432. Doi:10.1001/jama.280.5.428
Obesity and Diabetes Plan
1. Mokdad AH, et al. Actual causes of death in the United States, 2000. JAMA. 2004;291(10):1238-1245.
2. Olshansky SJ, et al. A potential decline in life expectancy in the United States in the 21st century. New England Journal of Medicine 2005;352(11):1138-1145.
3. Centers for Disease Control and Prevention. Diabetes Report Card 2012. Atlanta, GA: Centers for Disease Control and Prevention, US Department of Health and Human Services; 2012.
4. Brody SC, et al. Screening for gestational diabetes: A summary of the evidence for the U.S. Preventive Services Task Force Obstetrics & Gynecology 2003;101(2):380-392.
Behavioral Health Plan
1. County of Orange, Health Care Agency, Public Health Services. OrangeCountyHealthProfile2013 December 2013.
2. Centers for Disease Control and Prevention. CDC Features, An estimated 1 in 10 U.S. adults report depression. Accessed 8/13. Accessed at: http://www.cdc.gov/features/dsdepression/
3. Centers for Disease Control and Prevention. PublicHealthActionPlantoIntegrateMentalHealth PromotionandMentalIllnessPreventionwithChronicDiseasePrevention,2011-2015 . Atlanta: U.S. Department of Health and Human Services, 2011.
4. SAMHSA-HRSA Center for Integrated Health Solutions. Screening Tools. Accessed 3/14. Available at: http://www.integration.samhsa.gov/clinical-practice/screening-tools.
5. Mokdad AH, et al. Actual causes of death in the United States, 2000. JAMA 2004; 291(10):1238-1245.
6. U.S. Department of Health and Human Services. Alcohol and Health. Bethesda, MD: U.S. Department of Health and Human Services, Public Health Service, National Institutes of Health, National Institute on Alcohol Abuse and Alcoholism, 2000.
7. Baily BA, Sokol RJ. Prenatal alcohol exposure and miscarriage, stillbirth, pretern delivery, and sudden infant death syndrome. Alcohol Res Health 2011;34(1):86-91.
8. County of Orange, Sheriff’s Department. CoronerDivisionAnnualReport2012.
9. Substance Abuse and Mental Health Services Administration, Resultsfromthe2012NationalSurveyon DrugUseandHealth:SummaryofNationalFindings , NSDUH Series H-46, HHS Publication No. (SMA) 13-4795. Rockville, MD: Substance Abuse and Mental Health Services Administration, 2013.
CITATIONS
63 Reference Documents Orange County Health Improvement Plan
Selecting Priorities
1. National Institute of Mental Health. Depression. Accessed 8/13. Available at: http://www.nimh.nih.gov/health/topics/depression/index.shtml.
2. Centers for Disease Control and Prevention. CDC Features, An estimated 1 in 10 U.S. adults report depression. Accessed 8/13. Available at: http://www.cdc.gov/features/dsdepression/
3. Mokdad AH, et al. Actual causes of death in the United States, 2000. JAMA. 2004; 291(10):1238-1245.
4. U.S. Department of Health and Human Services. The Surgeon General’s Vision for a Healthy and Fit Nation. Rockville, MD: U.S. Department of Health and Human Services, Office of the Surgeon General, January 2010.
5. Centers for Disease Control and Prevention Diabetes Report Card 2012 Atlanta, GA: Centers for Disease Control and Prevention, U.S. Department of Health and Human Services; 2012.
6. Centers for Disease Control and Prevention Healthy Aging, Alzheimer’s Disease Accessed 8/13 Available at: http://www.cdc.gov/aging/aginginfo/alzheimers.html.
7. U.S. Department of Health and Human Services Alcohol and Health Bethesda, MD: U.S. Department of Health and Human Services, Public Health Service, National Institutes of Health, National Institute on Alcohol Abuse and Alcoholism, 2000.
8. Middlebrooks JS and Audage NC The effects of childhood stress on health across the lifespan Atlanta, GA: Centers for Disease Control and Prevention, National Center for Injury Prevention and Control. 2008.
9. Child Welfare Information Gateway. Long-term consequences of child abuse and neglect. Washington, D.C.: U.S. Department of Health and Human Services, Children’s Bureau. 2013.
10. Centers for Disease Control and Prevention. Impact of vaccines universally recommended for children United States, 1990–1998. MMWR Morb Mortal Wkly Rep. 1999; 48:243–8.
11. Saba, DK, et al. Hospital stays related to mental health, 2006. HCUP Statistical Brief #62. October 2008. Agency for Healthcare Research and Quality, Rockville, MD. Accessed 8/13. Available at: http://www.hcupus.ahrq.gov/reports/statbriefs/sb62.pdf
CITATIONS
Orange County Health Improvement Plan Reference Documents 64
ACRONYMS AND ABBREVIATIONS
Where possible, acronyms and abbreviations are defined on each page of this report where it appears.
Due to space limitations, the following acronyms and abbreviations may not have been defined on the page of the report where it appears.
• < – Less than
• + – Before a number indicates increase
• + – After a number indicates age group equal to and older than the number
• - – Before a number indicates decrease
• – Improvement of health indicator
• – Worsening of health indicator
• Af Am – African-American
• API – Asian and Pacific Islander
• Birth File – Orange County Master Birth File
• BRFSS – Behavioral Risk Factor Surveillance System
• Calif. – California
• CDC – Centers for Disease Control and Prevention
• CHIS – California Health Interview Survey
• CHKS – California Healthy Kids Survey
• Death File – Orange County Master Death File
• Dept. – Department
• ED – Emergency Department
• ER – Emergency Room
• HIV – Human Immunodeficiency Virus
• LHI – Indicates Healthy People 2020 Leading Health Indicator
• MAPP – Mobilizing for Action through Planning and Partnerships
• MIHA – Maternal and Infant Health Assessment
• mRFEI – Modified Retail Food Environment Index
• NSUDH – National Survey on Drug Use and Health
• OC – Orange County
• OCDE – Orange County Department of Education
• OCHCA – Orange County Health Care Agency
• OCHNA – Orange County Health Needs Assessment
• OSPHD – Office of Statewide Health Planning and Development
• PI – Pacific Islander
• SWITRS – Statewide Integrated Traffic Records System
• UNICEF – United Nations Children’s Fund
• US – United States
• USD – Unified School District
65 Reference Documents Orange County Health Improvement Plan
Orange County Health Improvement Plan 2014-16 Public Health Services, Orange County Health Care Agency 405 W. 5th Street, Santa Ana, CA http://ochealthinfo.com For more information or to get involved contact: Jane Chai, Public Health Projects Manager (714) 796-0404 OCHIP@ochca.com

