
DRUGS AND ALCOHOL

Deaths, Emergency Department Visits, and Hospitalizations
Trends from 2009 to 2020, Orange County, California
Executive Summary
Drug and Alcohol-related mortality has generally been rising since 2012, with the most dramatic rise from 2019 to 2020 attributed to an increase in drug-related deaths. When accounting for all the substances involved in a drug or alcohol-related death, alcohol and opioids are most frequently present. In fact, there was a 45% increase in the number of deaths involving opioids from 2019 to 2020.
Non-Hispanic whites consistently had the highest rates of mortality from drugs and alcohol, although from 2015, those identified as other race (includes Alaska Native/American Indian, multi-race, other and/or unknown) nearly matched the rates of non-Hispanic whites. Males, compared to females, also had the highest rates of mortality, as well as those ages 45 to 64 years.
Unlike mortality rates, the rate of Emergency Department (ED) visits for drug and alcohol-related diagnoses has been decreasing since 2017. However, from 2019 to 2020, the visit rates for diagnoses relating to opioids increased by 22%. Those identified as “other” race consistently had the highest rates of ED visits for drug and alcohol-related reasons, followed by non-Hispanic whites for all years except 2019. Males had a higher rate of ED visits compared to females. Residents 15 to 24 years visited the ED at the greatest rates, until 2016, when residents 25 to 44 years had the highest ED visit rates through 2020.
The rate of hospitalizations for drug and alcohol-related diagnoses has been relatively constant since 2016. In particular, the hospitalization rate for opioids was similar between 2019 and 2020, which breaks from the trend of increased fatality and ED visits due to opioids in those years. Non-Hispanic whites and those identified as “other” race alternated between having the highest hospitalization rate, until 2017. By 2018, residents identified as “other” race surpassed the rate of hospitalization of non-Hispanic whites and continued on an upward trajectory until 2020. Males and residents 45 to 64 years had the highest rates of hospitalization. The exception was 2019 to 2020 where the rate of hospitalization for residents ages 25 to 44 surpassed all other age groups.
Geographically, the coastal ZIP Codes had the highest rates of mortality, ED visits, and hospitalizations, when looking at the aggregate three year trends in 2009 to 2011, and 2018 to 2020.
Based on the dramatic increase in mortality solely from 2019 to 2020, we can conjecture that the COVID-19 pandemic had an impact on behavior that led to the increase in mortality. Furthermore, the increase in mortality did not correspond with an increase in ED visit rates or hospitalizations, potentially suggesting that there could be some degree of avoidance or inability to seek care in hospitals. This conjecture is strengthened as there was not a corresponding increase of those who died while receiving care in a hospital from 2019 to 2020 for drug or alcohol-related reasons. Further study would be needed to see if these trends expand into 2021 as the pandemic continued, and whether these rates will fall again as COVID-19 infection rates decrease in our community.
from 2009 to 2020, Orange County, California
1
Trends
Introduction
The misuse of drugs and alcohol has long been associated with negative health consequences that ultimately impacts an individual’s longevity, and the longevity of communities, overall.
In the United States, for example, longevity decreased between 2014 and 2017, the first time in several years (Xu, Murphy, Kochanek, & Arias, 2016; Murphy, Xu, Kochanek, & E, 2018). During this same period, drug mortality increased (Hedegaard, Miniño, & Warner, 2018), leading many researchers to suggest that the decline in longevity was a result of rising drug mortality (Woolf & Schoomaker, 2019).
Drug and alcohol use not only affects mortality, but also the quality of life lived with the long-term health impacts of these substances. In the United States, drug-use disorders were associated with 2,019 disability adjusted life years (DALYs)1 per 100,000 people, and an age-adjusted mortality rate of 21 per 100,000 in the year 2019 (Pan American Health Organization, 2021a). Alcohol-related diseases were associated with 549 disability adjusted life years per 100,000, and an age-adjusted mortality of 7 per 100,000 in the United States for the same year (Pan American Health Organization, 2021b).
The COVID-19 pandemic further complicated the noted trends with drug and alcohol-related disease and mortality. At the national level, the overdose mortality was 58% higher in May 2020 of the pandemic year compared to May 2019 (Friedman & Akre, 2021). Similarly, in California, there was a 50% increase in the rate of drug overdose deaths from 2019 to 2020, and a 17% increase in alcohol-related deaths (California Department of Public Health, 2022).
By surveilling deaths, Emergency Department visits, and hospitalizations related to drugs and alcohol in Orange County (OC), we can better understand the impact these substances have on our community, as well as the persons and places most at risk.
The OC Health Care Agency had released prior reports on the burden of disease from drugs and alcohol to its residents (Orange County Health Care Agency and Orange County Sheriff-Coroner Department, 2014; 2017). Like prior reports, the data for this report is sourced from the California Department of Public Health (CDPH) Vital Records for death data, and the California Department of Health Care Access and Information (HCAI, formerly OSHPD) for Emergency Department visits and hospitalizations, and is limited to Orange County residents. Cases are selected based on the ICD-9 or 10 codes in the principal cause of death or the principal diagnosis.
The previous reports summarized the most recent two or three years in aggregate to describe the trends in drug and alcohol consequences in Orange County. While this was our initial approach, the unique circumstances of the COVID-19 pandemic led us to a different track in presenting our findings. During the first pandemic year, lifestyles and behaviors dramatically changed due to quarantine, isolation, and other pressures. Aggregating 2020 with prior years can mask the unique impacts of the COVID-19 pandemic. Even where the trend lines do not appear affected by the pandemic, we believe it important to show if and where the special circumstances regarding the response to COVID-19 affected the drug and alcohol morbidity and mortality measures.
For this reason, this report describes timeline trends, beginning in 2009 to 2020. We have avoided aggregating multiple years, except in places where the cell sizes were too small to have reliable rates and privacy of data (for example, with mortality by race and ethnicity).
1 DALY is a measure of the community burden of disease. One DALY year is the loss of one year of full health. (World Health Organization, 2022)
2022 Drugs and Alcohol - Deaths, Emergency Department Visits, and Hospitalizations
2
Also, this report departs from other Drug and Alcohol reports produced by the OC Health Care Agency, as the inclusion criteria was updated to align with the CDPH EpiCenter criteria for drug and alcohol poisonings (California Department of Public Health, 2017). Their criteria cover physical disease, mental disorders, and poisonings from drugs and alcohol. However, because this criterion is applied to the principal cause of death (mortality data) or the principal diagnosis (ED visit and hospitalization data), the report does not include cases where alcohol or drugs contributed to the deaths but was not the principal cause, such as accidental deaths from motor vehicle collisions involving intoxicated drivers.
The choice to use the CDPH criteria was due, in part, to the desire to better compare with state trends, but also because the prior selection criteria was based on ICD-9 coding schemes. Because the ICD coding schemes changed from ICD-9 to ICD-10 in late 2015 for hospitalizations and emergency department visits, the classification for drugs and alcohol system inevitably changed. The impact of this coding scheme change potentially affected some diagnostic patterns, particularly in 2015 and 2016, which may be noted in the trend line figures for ED visits and hospitalizations.

3
Trends from 2009 to 2020, Orange County, California
Mortality
35
30
25
20
15
10
5
FIGURE 1: DEATHS BY ALCOHOL AND DRUGS, 2009-2020
Overall, drug and alcohol-related deaths are on the rise since 2009 (Fig. 1; Table 1). During the pandemic year in particular, the mortality rate increased by 34% compared to the year prior. Drug-related deaths are responsible for the dramatic rise, increasing in rate by 60% from 2019 to 2020. Alcohol-related deaths were unchanged for those two years. Drug-related deaths consistently occurred at higher rates throughout the period of measure compared to alcohol-related deaths. 0

2009 2010 2011 2012 2013 2014 2015 2016 2017 2018 2019 2020 Age-Adj. Rate per 100,000 Alcohol (Any) Drug (Any) TOTAL
2022
Deaths, Emergency Department Visits, and Hospitalizations 4
Drugs and Alcohol -
FIGURE 2: DRUG AND ALCOHOL-RELATED MORTALITY, DOMESTIC AND NATIONAL TRENDS FIGURE 3: DRUG AND ALCOHOL DEATHS BY SPECIFIC SUBSTANCE(S) INVOLVED IN DEATH
15 20 25 30 35 40 45 2009 2010 2011 2012 2013 2014 2015 2016 2017 2018 2019 2020 US CA Orange Age-Adj. Rate per 100,000 134 155 27 59
10 451 284 27
461 256 31
464 254 32
585 501 77
498 274 44
131 160 27 72
175 155 25 60
5 Alcohol (Any) Opioids/Opiates Cocaine Stimulants (other than Cocaine) Sedatives Cannabis Other Drugs
293 193 54 32 0 100 200 300 400 500 600 700 2016 2017 2018 2019 2020


156 132 25 47
Trends from 2009 to 2020, Orange County, California
5
On the national and statewide scale, we find the drastic uptick in drug and alcohol-related deaths during the pandemic year of 2020 consistent with the trends in Orange County (Fig. 2). Between 2019 and 2020, there was a 20% increase in mortality in the US, and a 32% increase for California. Orange County’s increase between those years was only slightly higher (34%). However, despite a greater percent increase, Orange County always had a lower mortality rate than the US and California (Centers for Disease Control and Prevention, National Center for Health Statistics, 2021). 0
For the years 2016 to 2020, because this data became newly available, the multiple types of drugs and alcohol involved in the deaths were investigated. The numbers in Figure 3 represent the number of deaths caused by drugs and alcohol where the drug was present at the time of death (although the drug may not be the direct cause of death). One incident can be counted multiple times for this figure if more than one drug was noted at the time of death.
For each year, alcohol was noted most frequently among all the deaths with an underlying cause of drugs and alcohol. There was also a jump of 15% in alcohol-related deaths from 2019 to 2020. Among non-alcohol substances, opiates were the most frequently cited drug involved in a death for each year. Furthermore opiate-involved deaths increased by a large margin, from 274 deaths in 2019 to 501 deaths in 2020 (an increase of 45%). Stimulants and sedatives were the substances most commonly involved in drug and alcohol deaths after alcohol and opiates. From 2016 to 2017, sedatives were more common, but from 2018 to 2020, the number of deaths involving stimulants surpassed the number involving sedatives.
The number of deaths involving stimulants and the number involving sedatives increased sharply in 2020 as well, by 47% and 32%, respectively. In fact, all drug types had an increase from 2019 to 2020, except for the drugs listed under “other.” Drug deaths involving cannabis increased by the greatest percent, 54%, although the numbers of these deaths were relatively few compared to deaths with other substances involved.
FIGURE 4: DRUG & ALCOHOL MORTALITY BY RACE/ETHNICITY
Age-Adj. Rate per 100,000
0 5 10 15 20 25 30 35 40 2009-2011 2012-2014 2015-2017 2018-2020 Non-Hispanic White Hispanic Asian/Pacific Islander Black Other/Unknown
The mortality rate for each race/ethnicity2 increased from 2009 to 2020 (Fig. 4). Non-Hispanic whites had the highest mortality rates among all groups in the period of measure. Hispanic, black and those grouped under “other/unknown” race were interchanging places as the second, third and fourth highest rates. Most notably, those in “other/ unknown” race increased their rate dramatically in this time period, with the largest difference in rate. Asian/Pacific Islanders, while consistently having the lowest mortality rate, had the largest percent increase in rate.
2 Race (white, black, Asian & Pacific Islander, other) and ethnicity (Hispanic/Non-Hispanic) are combined in this report per the conventions from Centers for Disease Control and California Department of Public Health.
2022 Drugs and Alcohol - Deaths, Emergency Department Visits, and Hospitalizations
6
FIGURE 5: DEATHS BY DRUG AND ALCOHOL BY GENDER, 2009-2020
Male Female
During the pandemic year of 2020, the rate of death due to drugs and alcohol increased for both males and females (Fig. 5). The increase was steeper among males, with a 42% increase in rate from 2019 to 2020, compared to only an 11% increase among females. The mortality rate among males was at least twice as high as the mortality rate of females for each year of measure, with the exception of 2011, which was only 1.9 times as high as the rate among females. Up to 2019, the trend in drug and alcohol-related deaths diverged by gender. In the years immediately prior to the pandemic, the mortality rate among males was clearly already rising, while among females the trend was less obvious. Overall, the mortality rate among females did not increase more than 5 deaths per 100,000 between 2009 and 2019. Among males, the mortality rate declined from 2009 to 2012, then increased each year after (with the exception of 2017), with a sharp jump in the mortality rate in 2020.

Age-Adj. Rate per 100,000 0 5 10 15 20 25 30 35 40 45 50 2009 2010 2011 2012 2013 2014 2015 2016 2017 2018 2019 2020
7
Trends from 2009 to 2020, Orange County, California
FIGURE 6: DRUG AND ALCOHOL MORTALITY, AGE GROUPS
25-44 45-64 65+
Those ages 45 to 64 years had the highest rates of mortality for every year among all the age groups, and 15- to 24-year-olds consistently had the lowest mortality rate3 . The age groups of those 25 to 44 years and those 65 years and older interchanged places as the age group with the second or third highest mortality (Fig. 6).
For each age group, the mortality rate increased in the pandemic year of 2020. Particularly, the 15- to 24-year-olds increased by 165% from 2019 to 2020. The remaining age groups, by comparison, increased between 10% and 40% that year. This increase in the pandemic year is notable for ages 15-24 years because this age group was not experiencing a consistent and overall rise in mortality in the years prior to 2020. Among the 15-24 year-old age group, the rate of death due to drugs and alcohol was decreasing from 2017 to 2019, and the mortality rate in 2019 was lower than the rate in 2009.
Residents 25 to 44 years old had the second largest increase in mortality rate from 2009 to 2020. This age group is also the only age group that had an increase in mortality each year from 2013 to 2020 (with the exception of year 2016).4 3 Those less than 15 years were not included due to the small number of deaths among this age group, which was fewer than 10 for the period between 2009 and 2020. 4 Supplemental tables for demographic data, including the counts, rates and age-adjusted rates are found in the Appendix.
2022
Emergency Department
8
Drugs and Alcohol - Deaths,
Visits, and Hospitalizations
Age-Specific Rate per 100,000 0 10 20 30 40 50 60 2009 2010 2011 2012 2013 2014 2015 2016 2017 2018 2019 2020 15-24

TABLE 1: DRUG AND ALCOHOL-RELATED DEATHS Drug or Alcohol, Principal Cause of Death 2009 2010 2011 2012 2013 2014 2015 2016 2017 2018 2019 2020 Number Alcohol (Any) 271 259 267 265 291 316 333 325 346 351 369 383 Drug (Any) 336 311 320 320 359 375 386 417 375 413 413 648 TOTAL 607 570 587 585 650 691 719 742 721 764 782 1,031 Rate Alcohol (Any) 9.0 8.6 8.7 8.6 9.4 10.1 10.6 10.3 10.9 11.0 11.5 12.0 Drug (Any) 11.2 10.3 10.5 10.4 11.5 12.0 12.2 13.2 11.8 12.9 12.9 20.3 TOTAL 20.2 18.9 19.2 19.0 20.9 22.1 22.8 23.4 22.6 23.9 24.5 32.3 Age-Adjusted Rate Alcohol (Any) 8.7 8.3 8.2 7.8 8.5 9.0 9.4 9.0 9.5 9.4 10.3 10.3 Drug (Any) 10.9 9.9 10.1 10.0 11.0 11.5 11.7 12.4 11.4 12.6 12.7 20.3 TOTAL 19.6 18.2 18.2 17.8 19.5 20.5 21.1 21.4 20.8 22.0 23.0 30.7 Trends from 2009 to 2020, Orange County, California 9
Emergency Department Visits
FIGURE 7: ED VISITS FOR ALCOHOL AND DRUGS
Age-Adj. Rate per 100,000 0 50 100 150 200 250 300 350 400 450
500 2009 2010 2011 2012 2013 2014 2015 2016 2017 2018 2019 2020
Alcohol (Any) Drug (Any) TOTAL
The rate of Emergency Department visits due to drug and alcohol-related diagnoses had increased overall since 2009 by 44% (Fig. 7; Table 2). However, the visit rate had actually been decreasing since reaching its peak in 2017, with an even sharper decrease from 2019 to 2020. Specifically, from 2017 to 2019, the visit rate decreased by 5%, and from 2019 to 2020 the visit rate decreased by 8%. When looking at the visit rates of drug-related diagnoses versus alcohol, both were decreasing since 2017 or 2018, respectively, but drug-related visit rates decreased more sharply from 2019 to 2020 (12%), compared to alcohol (0.2%). Unlike with mortality where drug deaths occurred at higher rates, the visit rates for alcohol-related visits were higher than the rates for drug-related visits.
10
2022 Drugs and Alcohol - Deaths, Emergency Department Visits, and Hospitalizations
Opioids/Opiates
Hallucinogens Other Drugs
FIGURE 8: ED VISITS FOR DRUGS BY TYPE
Cocaine Sedatives
Stimulants (other than Cocaine) Cannabis
When looking at the type of drug involved in the Emergency Department visits, opioids were almost always the most frequently cited drug as the cause for the Emergency Department visits. The exception was 2018 when the rate of ED visits for stimulant use surpassed that of opioids (Fig. 8). Stimulants were the second most cited drug as the cause for visit among the drug-related ED visits since 2012. Emergency Department visits due to cocaine and hallucinogens occurred at the lowest rates for the entire period, with cocaine-related ED visits occurring the least frequently until 2015, when cocaine rates started to increase higher than the rate of hallucinogens.
The rate of opioid-related visits increased sharply from 2019 to 2020 by 22%. This was the only type of drug-related visit that increased in 2020, other than those related to hallucinogens, which only increased from 1.8 to 2.6 visits per 100,000. Prior to 2020, opioid-related emergency department visits were decreasing from its peak in 2016. In fact, the visit rate for all the remaining drug types were decreasing or relatively unchanged in the 3 to 4 years prior to 2020.
Special Note on Cannabis-related ED Visits
Cannabis-related ED visits were steadily increasing from 2013 until 2017, after which the visits decreased for the following 3 years. Recreational use of marijuana was legalized in California at the end of 2016. Therefore, after one year of increased visits since legalization, ED visits started a downward trend. A similar rate of increase and subsequent leveling-off were seen in about the same interval for stimulants and opioids.
Trends
11
from 2009 to 2020, Orange County, California
Rate per 100,000 0 10 20 30 40 50 60 70
2009 2010 2011 2012 2013 2014 2015 2016 2017 2018 2019 2020
FIGURE 9: ED
VISITS FOR ALCOHOL AND DRUGS BY RACE/ETHNICITY,
2009-2020
Age-Adj. Rate per 100,000 0 100 200 300 400 500 600 700 800 900 1000 2009 2010 2011 2012 2013 2014 2015 2016 2017 2018 2019 2020 Non-Hispanic White Hispanic Asian/Pacific Islander Black Other/Unknown
Residents identified under “other/unknown” race were the group with consistently highest rates of visits to the ED compared to non-Hispanic white, black, Hispanic, or Asian/Pacific Islander residents (Fig. 9). Those identified under “other/unknown” race were in the only group that increased their rate of visits to the ED from 2019 to 2020. All race/ ethnic groups had an overall percent increase in rate of visits to the ED in 2020 compared to 2009, however, non-Hispanic white residents had been on a downward trend since 2017, and the trend among Asian/Pacific Islanders was decreasing (although to a smaller extent compared to whites) since 2018. Black residents visit rate to the ED also had a sharp upward trend, although slightly less stable, which actually surpassed the ED visit rate among whites in 2019.
Prior to that year, the visit rate among black residents always fell below the visit rates of “other/unknown” race and non-Hispanic whites. With the exception of 2019, the order of highest ED visit rate to lowest among the race/ethnic groups identified was consistently Other, Non-Hispanic white, black, Hispanic, then Asian/Pacific Islander.
2022
12
Drugs and Alcohol - Deaths, Emergency Department Visits, and Hospitalizations
FIGURE 10: ED VISITS FOR ALCOHOL AND DRUGS BY GENDER, 2009-2020
Age-Adj. Rate per 100,000 0 100 200 300 400 500 600 700
2009 2010 2011 2012 2013 2014 2015 2016 2017 2018 2019 2020 Male Female
Much like the overall trend for drug and alcohol-related ED visits, both male and female visit rates trended upwards until 2017, then decreased to 2020 (Fig. 10). Males consistently had a higher rate of drug and alcohol-related ED visits compared to females, although the difference in rates diverged more by 2020 compared to 2009 (a 53% difference between the genders in 2009 compared to a 101% difference in 2020).
FIGURE 11: VISIT RATE FOR DRUG & ALCOHOL MORTALITY BY AGE GROUP
Age-Specific Rate per 100,000 0 200 400 600 800 1,000 2009 2010 2011 2012 2013 2014 2015 2016 2017 2018 2019 2020 <15 15-24 25-44 45-64 65+
While all age groups had a net increase in ED visits from 2009 (with the exception of those less than 15 years), most rates for each age group had leveled off or even began to decrease in the past few years (Fig. 11). For example, those between the ages of 25 and 44 increased their ED visit rate by 101%, although the trend leveled by 2017.5
5 Supplemental tables for demographic data, including the counts, rates and age-adjusted rates are found in the Appendix.
Trends from 2009 to 2020, Orange County, California
13
Drug or Alcohol
Principal Diagnosis or External Cause of Injury & Poisoning
Number
Alcohol (Any) 5,755 5,737 6,150 6,552 6,741 7,726 7,927 8,615 8,868 8,906 8,632 7,545 Drug (Any) 2,807 3,121 3,401 3,482 3,523 4,167 4,887 5,903 6,077 5,867 5,647 5,567
TOTAL 8,562 8,858 9,551 10,034 10,264 11,893 12,814 14,518 14,945 14,773 14,279 13,112
Rate
Alcohol (Any) 191.9 190.2 201.5 212.3 216.7 246.6 251.3 271.8 278.1 278.7 270.2 236.5 Drug (Any) 93.6 103.5 111.4 112.8 113.2 133.0 154.9 186.2 190.6 183.6 176.7 174.5
TOTAL 285.51 293.62 312.91 325.09 329.94 379.65 406.23 457.99 468.67 462.31 446.89 410.93
Age-Adjusted Rate
Alcohol (Any) 186.84 184.77 195.15 204.99 209.27 239.01 245.45 266.23 274.54 275.10 269.82 236.32 Drug (Any) 92.37 101.75 109.13 110.46 111.30 132.69 155.13 189.60 196.05 190.45 184.91 184.50
TOTAL 279.20 286.53 304.27 315.45 320.57 371.69 400.58 455.84 470.59 465.55 454.73 420.82
Disposition of ED Visits
In the past five years of analysis (2016 to 2020), the majority of people seen in the ED were discharged home (87%). Another 5% left against medical advice. Another 3% were discharged to a psychiatric hospital. Just under 2% were transferred to a skilled nursing facility or other rehabilitation facility, and another 1.6% were transferred to an outside hospital. Just over 1% of ED visits were transferred to the custody of court/law enforcement.
It is important to note that the figures discussed in this section do not include those that entered initially through the emergency department and were transferred as an inpatient within the same hospital. In fact, of all those entering the ED for drug and alcohol-related causes in the five-year period from 2016 to 2020, 22% were transferred to the inpatient unit.
2022
14
Drugs and Alcohol - Deaths, Emergency Department Visits, and Hospitalizations
TABLE 2: ED VISITS FOR DRUG AND ALCOHOL DIAGNOSES
2009 2010 2011 2012 2013 2014 2015 2016 2017 2018 2019 2020
Hospitalizations
FIGURE
12: HOSPITALIZATIONS FOR ALCOHOL AND DRUGS, 2009-2020
200
150
100
Age-Adj. Rate per 100,000 0
250 2009 2010 2011 2012 2013 2014 2015 2016 2017 2018 2019 2020
50
Alcohol (Any) Drug (Any) TOTAL
Overall, the rate of hospitalizations due to drug and alcohol increased in the period between 2009 and 2020 (Fig. 12; Table 1). The rate of hospitalizations was relatively level between 2009 and 2015, ranging between 155 and 165 hospitalizations per 100,000. The hospitalization rate increased in 2016, and remained somewhat level after that year until 2020. Alcohol-related hospitalizations follow a similar trend of having a mostly flat trend line up to 2015, increasing notably in 2016, then only minimally increasing in rate in the following years up to 2020. By 2020, there was a small decrease in the rate of alcohol-related hospitalizations. Alcohol-related hospitalizations also always occurred at a higher rate compared to drug-related hospitalizations, similar to the trend with the visit rates to the ED for drug versus alcohol-related causes.
Drug related hospitalizations, conversely, had a range between 56 and 70 for the twelve-year period between 2009 and 2020. In fact, the highest rate in that period for drug-related hospitalizations were in 2012, at 70.7 per 100,000. The highest rate overall for the total of drug and alcohol hospitalizations and alcohol-only hospitalizations occurred in 2019.
from 2009 to 2020, Orange County, California
15
Trends
FIGURE 13: HOSPITALIZATIONS FOR
BY TYPE, 2009-2020
40
35
30
25
20
15
10
Rate per 100,000 0
45 2009 2010 2011 2012 2013 2014 2015 2016 2017 2018 2019 2020
5
Opioids/Opiates
Stimulants (other than Cocaine) Sedatives
When looking at hospitalizations by type of drug, opioid-related hospitalizations were consistently occurring at the highest rates, followed by hospitalizations involving sedatives, then stimulants (Fig. 13). During the period between 2009 and 2020, opioid-related hospitalizations increased overall, with a sharp rise from 2018 to 2019 that maintained at that level in 2020. The rate of hospitalizations involving stimulants also increased from 2009 to 2020, although with a slight decrease from 2019 to 2020. Sedatives, however, were on a downward trend during this period. Other substances were excluded as their counts were too low to allow for a reliable rate comparison.

16
DRUGS
2022 Drugs and Alcohol - Deaths, Emergency Department Visits, and Hospitalizations
FIGURE 14: HOSPITALIZATION RATES FOR ALCOHOL AND DRUGS BY RACE, 2009-2020
500
400
300
200

Age-Adj. Rate per 100,000 0
600 2009 2010 2011 2012 2013 2014 2015 2016 2017 2018 2019 2020
100
Non-Hispanic White Hispanic Asian/Pacific Islander Black Other/Unknown
Non-Hispanic white residents and residents identified as “other/unknown” race had the highest rates of hospitalizations (Fig. 14). The hospitalization rate of “other/unknown” race increased sharply, in particular from 2017 to 2020, markedly surpassing the rate of hospitalizations for non-Hispanic whites. All race/ethnic groups increased overall from 2009 to 2020, although the rate of hospitalization among Hispanics decreased slightly from 2019 to 2020. Trends from 2009 to 2020, Orange County, California 17
FIGURE 15: HOSPITALIZATION FOR ALCOHOL AND DRUGS BY GENDER
Male Female
Hospitalizations among males were higher compared to females (Fig. 15). While the rate of hospitalization among females was relatively flat, hospitalizations among males increased by 28% from 2009 to 2020 .

Age-Adj. Rate per 100,000 0 50 100 150 200 250 300 2009 2010 2011 2012 2013 2014 2015 2016 2017 2018 2019 2020
2022
Department
18
Drugs and Alcohol - Deaths, Emergency
Visits, and Hospitalizations
FIGURE 16: HOSPITALIZATIONS FOR ALCOHOL AND DRUGS BY AGE GROUP, 2009-2020
400
350
300
250
200
150
100
50
Age-Specific Rate per 100,000 0
2009 2010 2011 2012 2013 2014 2015 2016 2017 2018 2019 2020 <15 15-24 25-44 45-64 65+
The age group of people 45 to 64 years had the highest rate of hospitalizations until 2019, but the hospitalization trend was mostly flat in this age group, and ultimately decreased their rate of hospitalization overall (Fig. 16). However, the rate of hospitalizations among 25- to 44-year-olds increased the most compared to all age groups (by 46%), particularly in the period after 2013. This age group had the second highest rate of hospitalization for the period from 2009 to 2018, and surpassed the hospitalization rate of those ages 45 to 64 years by 2019 and into 2020. The age group of those less than 15 years also had a 20% increase in the rate of hospitalizations from 2009 to 2020. Fifteento 24-year-olds decreased their hospitalization rate overall.6
6 Supplemental tables for demographic data, including the counts, rates and age-adjusted rates are found in the Appendix.
Trends from 2009 to 2020, Orange County, California
19
TABLE 3: HOSPITALIZATION ADMISSIONS FOR DRUG AND ALCOHOL DIAGNOSES
Drug or Alcohol
Principal Diagnosis or External Cause of Injury & Poisoning
Number
2009 2010 2011 2012 2013 2014 2015 2016 2017 2018 2019 2020
Alcohol (Any) 3,117 2,987 2,978 3,079 3,056 3,244 3,450 4,234 4,390 4,448 4,647 4,517 Drug (Any) 1,801 1,971 1,941 2,255 2,023 2,011 1,998 2,176 1,840 1,784 2,055 2,084
TOTAL 4,918 4,958 4,919 5,334 5,079 5,255 5,448 6,410 6,230 6,232 6,702 6,601
Rate
Alcohol (Any) 103.9 99.0 97.6 99.8 98.2 103.6 109.4 133.6 137.7 139.2 145.4 141.6 Drug (Any) 60.1 65.3 63.6 73.1 65.0 64.2 63.3 68.6 57.7 55.8 64.3 65.3
TOTAL 164.0 164.3 161.2 172.8 163.3 167.7 172.7 202.2 195.4 195.0 209.8 206.9
Age-Adjusted Rate
Alcohol (Any) 100.47 95.59 93.54 95.24 93.79 98.76 103.85 127.4 131.7 132.7 140.7 137.6 Drug (Any) 58.74 63.52 61.65 70.69 62.73 61.91 61.99 67.8 57.6 55.9 65.5 68.4
TOTAL 159.21 159.25 155.40 166.06 156.53 160.38 165.40 194.7 188.8 187.3 205.1 193.0
Geographic Trends
The following maps depict the rate of death, ED visits, and hospitalizations by Orange County ZIP Code. Case information has been aggregated in 3-year intervals to address small counts in certain ZIP Codes, lending more stability to the rates. Some ZIPs still had small counts after aggregation7. In those cases, the rate was suppressed, and they were excluded from the color range representation on the maps. These areas are instead represented by hatching (diagonal lines)8. The color ranges in the maps are divided into quartiles, meaning the ZIP Codes with the rates in the highest 25% are the darkest shades, and the ZIP Codes with the rates in the lowest 25% have the lightest shading.
Deaths
During 2009 to 2011, the highest rates of drug and alcohol-related deaths were along the ZIPs on Orange County’s coast, specifically in the cities of Newport Beach, Laguna Beach, Huntington Beach, Dana Point, San Clemente, and Seal Beach (map 1).
During 2018 to 2020, the highest rates of drug and alcohol-related deaths were still predominantly among the coastlines, particularly in ZIP Codes in Huntington Beach, Newport Beach, Costa Mesa, and Dana Point (map 2). However, ZIPs in San Clemente and Seal Beach no longer were among the highest. Instead, central parts of the county including the northern ZIP Codes of Garden Grove, Midway City, east Anaheim, and Fullerton had some of the highest rates of mortality.
7 Small counts in this situation are defined as counts fewer than 5 for the mortality data, and fewer than 25 for the ED and hospitalization data.
8 Supplemental tables for the rates by geography are found in the Appendix.
2022
20
Drugs and Alcohol - Deaths, Emergency Department Visits, and Hospitalizations


MAP 1


MAP 2
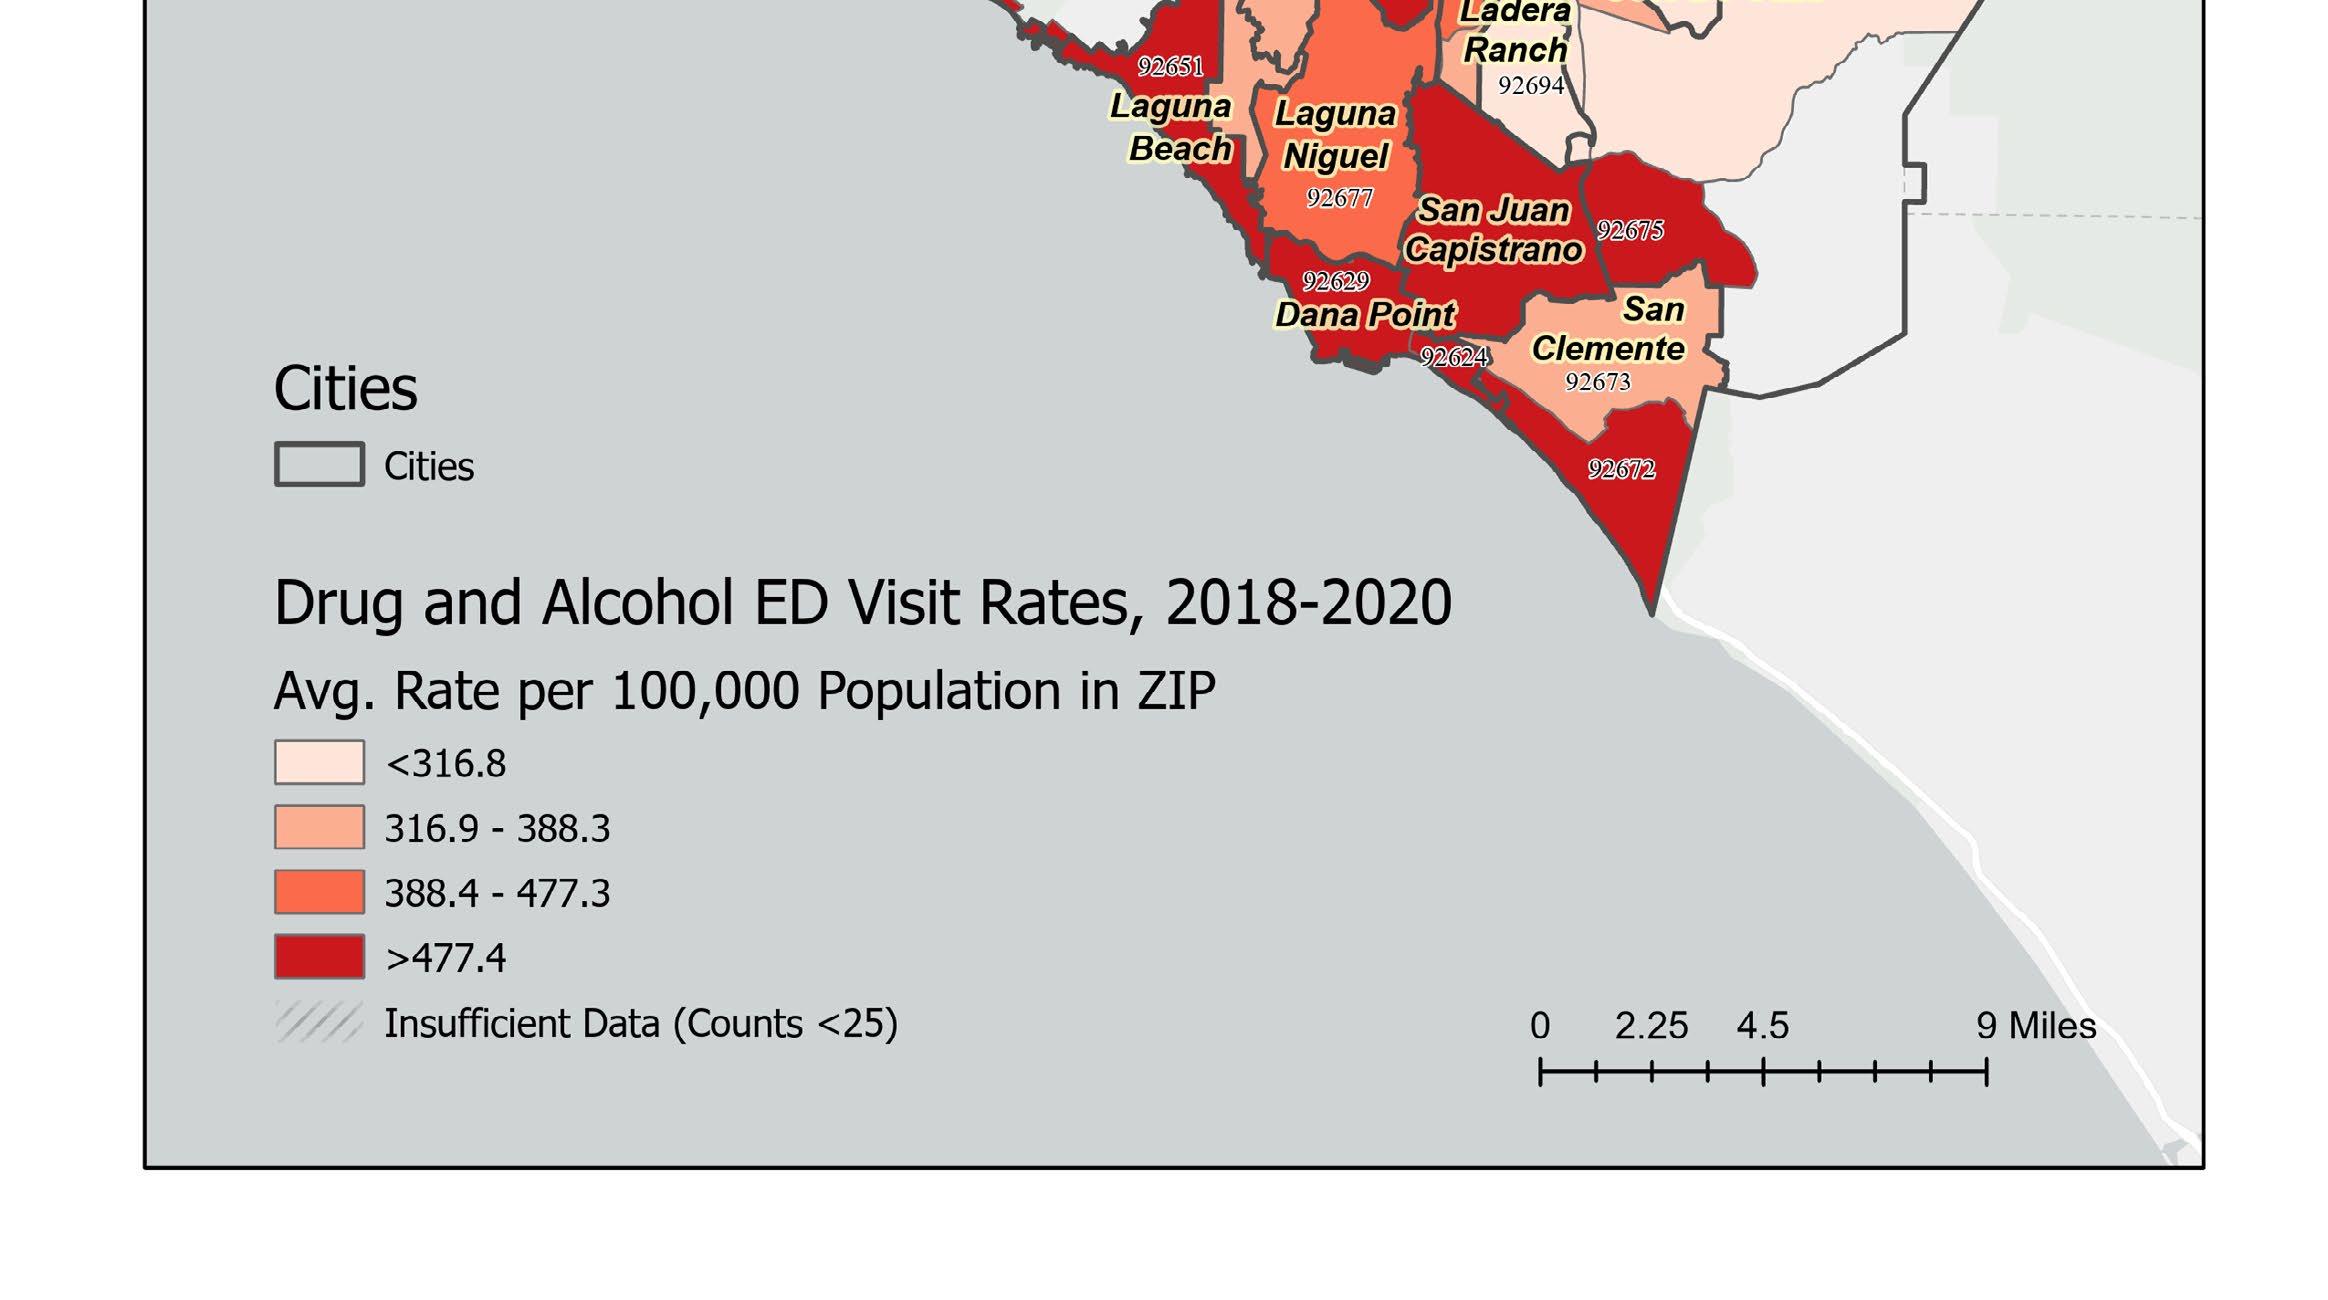
ED Visits
Not surprisingly, the highest ED visit rates were also along the ZIPs at Orange County’s coastline, in some of the same cities as the ZIPs with the highest mortality rates, including Costa Mesa, Dana Point, San Clemente, Newport Beach and Huntington Beach (map 3). Inland ZIPs in west Anaheim, Stanton, Fullerton, Orange, Yorba Linda, and even southern ZIPs in Laguna Hills and San Juan Capistrano also had higher ED visit rates.
By 2018 to 2020, inland areas of central Orange County in Anaheim and Fullerton no longer had the highest ED visit rates (map 4). Instead, ZIPs in northern Santa Ana had some of the highest ED visit rates. Many of the same coastal ZIPs maintained the highest ED visit rates compared to 2009 to 2011, as well as a few ZIPs in the central Orange County cities of Stanton and Orange.
 Trends from 2009 to 2020, Orange County, California
23


MAP 3

MAP 4
Hospitalizations

Hospitalization rates were still highest along the coast, like with mortality and ED visit rates. Interestingly, in 2009 to 2011, ZIP Codes in Rancho Santa Margarita and Mission Viejo also had higher hospitalization rates, as well as other southern ZIP Codes including Laguna Hills, Laguna Niguel, and San Juan Capistrano (map 5). There were no ZIPs in the central/northern part of Orange County that were in the highest quartile for the rate of hospitalization.
By 2018 to 2020, the hospitalization rates were still highest along the coastal ZIPs, and lower in the central and northern ZIP Codes, with the exception of a part of the city of Orange (map 6).
26
2022 Drugs and Alcohol - Deaths, Emergency Department Visits, and Hospitalizations


MAP 5


MAP 6
Insights
The pandemic year was clearly exceptional for the drug and alcohol mortality rate among Orange County residents. In 2020, the mortality rate jumped by 34% compared to the year prior. ED visit rates and hospitalization rates due to drugs and alcohol did not see a similar increase, but actually decreased their visit rate from 2019 to 2020. At this point, however, it is not obvious if the decrease in rate seen in our hospitals is an influence of the pandemic year, or instead part of a larger pattern. Additionally, the percent of persons who die in the ED or hospital from drugs or alcohol was relatively constant in the years prior and including 2020, which indicates that while the mortality rates are increasing, these deaths are occurring without the intervention of medical establishments.
While the data cannot fully explain why there was increased mortality and fewer ED visits and hospitalizations in 2020, the presence of the COVID-19 pandemic is an obvious variable. The pandemic may have influenced alcohol and drug behaviors, such as an increased use of these substances among residents.
Another conjecture is that people either avoided seeking care in hospitals due to concerns of exposure to COVID-19 in the hospital, or perhaps could not easily access care due to crowding and shortage of health care resources during the pandemic. Further research is needed to investigate if these trends continued into 2021, as the pandemic continued. At the time of investigation for this report, data for the year 2021 is still unavailable or not final. It will also be worthwhile to investigate whether mortality rates continue to be elevated post-pandemic or if the impact is limited.

29
Trends from 2009 to 2020, Orange County, California
References
California Department of Public Health. (2017). EpiCenter: Overview of ICD 9 and 10 codes. Retrieved from https:// www.cdph.ca.gov/Programs/CCDPHP/DCDIC/SACB/Pages/EpiCenter/OverviewofICD9and10codes.aspx
California Department of Public Health. (2022). California Community Burden of Disease. Retrieved February 2022, from https://skylab.cdph.ca.gov/communityBurden/
Centers for Disease Control and Prevention, National Center for Health Statistics. (2021). Underlying Cause of Death 1999-2020 on CDC WONDER Online Database. Retrieved March 2022, from http://wonder.cdc.gov/ ucd-icd10.html
Friedman, J., & Akre, S. (2021). “COVID-19 and the Drug Overdose Crisis: Uncovering the Deadliest Months in the United States, January‒July 2020. American Journal of Public Health, 111(7), 1284-1291. doi:https://doi. org/10.2105/AJPH.2021.306256
Hedegaard, H., Miniño, A., & Warner, M. (2018). Drug overdose deaths in the United States, 1999–2017. NCHS Data Brief, no 329. Hyattsville, MD: National Center for Health Statistics. Retrieved from https://www.cdc. gov/nchs/data/databriefs/db329-h.pdf
Murphy, S., Xu, J., Kochanek, K., & E, A. (2018). Mortality in the United States, 2017. NCHS Data Brief, no 328. Hy attsville, MD: National Center for Health Statistics.
Orange County Health Care Agency and Orange County Sheriff-Coroner Department. (2014). Drug & Alcohol Over dose Hospitalization & Death in Orange County. Santa Ana, CA. Retrieved from https://www.ochealthinfo. com/page/drug-alcohol-overdose-hospitalization-death-orange-county
Orange County Health Care Agency and Orange County Sheriff-Coroner Department. (2017). Drug & Alcohol Morbidity and Mortality in Orange County. Santa Ana, CA. Retrieved from https://www.ochealthinfo.com/page/drugalcohol-overdose-hospitalization-death-orange-county
Pan American Health Organization. (2021a). The burden of drug use disorders in the Region of the Americas, 20002019. Retrieved February 2022, from Noncommunicable Diseases and Mental Health Data Portal:https://www.paho.org/en/noncommunicable-diseases-and-mental-health/noncommunicable-dis eases-and-mental-health-data-34#:~:text=In%202019%2C%20drug%20use%20disorders%20were%20re sponsible%20for%3A,613.8%20DALYs%20per%20100%2C000%20population)
Pan American Health Organization. (2021b). The burden of selected alcohol-related diseases in the Region of the Americas, 2000-2019. Retrieved February 2022, from https://www.paho.org/en/noncommunicable-dis eases-and-mental-health/noncommunicable-diseases-and-mental-health-data-36
Woolf, S., & Schoomaker, H. (2019). Life Expectancy and Mortality Rates in the United States, 1959 - 2017. JAMA, 322(20), 1996-2016. doi:10.1001/jama.2019.16932
2022 Drugs and Alcohol - Deaths, Emergency Department Visits, and Hospitalizations
30
World Health Organization. (2022). Indicator Metadata Registry List: Disability-adjusted life years (DALYs). Retrieved from Global Health Observatory: https://www.who.int/data/gho/indicator-metadata-registry/imr-details/158
Xu, J., Murphy, S., Kochanek, K., & Arias, E. (2016). Mortality in the United States, 2015. NCHS Data Brief, no 267. Hyattsville, MD: National Center for Health Statistics. Retrieved from https://www.cdc.gov/nchs/data/data briefs/db267.pdf
 Trends from 2009 to 2020, Orange County, California 31
MORTALITY TABLES
Drug & Alcohol
Deaths
2009 2010 2011 2012 2013 2014 2015 2016 2017 2018 2019 2020 Counts
Male 437 382 382 389 433 469 476 489 493 539 541 765 Female 170 188 205 196 217 222 243 253 228 225 241 266 15-24 39 34 37 31 43 29 30 41 48 44 35 92 25-44 184 161 151 147 150 180 183 173 188 205 252 346 45-64 301 285 323 324 369 387 387 407 348 378 365 442 65+ 83 89 76 82 88 94 118 121 137 135 130 149 Rate
Male 29.4 25.6 25.3 25.4 28.0 30.1 30.4 31.0 31.1 33.9 34.0 48.1 Female 11.2 12.3 13.3 12.6 13.9 14.1 15.3 15.9 14.2 14.0 15.0 16.6 15-24 9.0 7.8 8.3 6.8 9.3 6.2 6.4 8.7 10.3 9.5 7.6 20.3 25-44 21.4 18.9 17.8 17.4 17.9 21.8 22.5 21.6 23.5 25.7 31.7 43.9 45-64 39.6 37.0 41.1 40.5 45.4 46.9 46.0 47.7 40.3 43.7 42.3 51.6 65+ 24.1 25.2 20.7 21.3 22.0 22.6 27.3 27.1 29.5 28.2 26.2 29.0
Age-Adjusted Rate
Male 28.9 25.3 24.2 24.2 26.6 28.2 28.7 28.9 28.8 31.5 32.2 45.7 Female 10.6 11.6 12.5 11.6 12.7 13.1 13.7 14.1 12.9 12.7 13.7 15.7
2022
and
Emergency Department
32 Appendix
Drugs
Alcohol - Deaths,
Visits, and Hospitalizations
Drug & Alcohol Deaths 2009-2011 2012-2014 2015-2017 2018-2020
Counts
Non-Hispanic White
1,244 1,358 1,477 1,606 Hispanic 392 422 515 735 Asian/Pacific Islander 69 75 102 126 Black 28 36 32 34 Other/Unknown 31 35 56 76 Rate
Non-Hispanic White 30.8 33.6 36.6 40.2 Hispanic 12.8 13.1 15.5 21.6 Asian/Pacific Islander 4.3 4.4 5.8 7.1 Black 20.7 25.6 22.2 23.3 Other/Unknown 13.9 14.5 21.9 28.2
Age-Adjusted Rate
Non-Hispanic White 26.8 28.5 30.9 36.3 Hispanic 17.8 16.4 17.8 22.8 Asian/Pacific Islander 3.9 4.1 5.4 6.7 Black 19.7 21.9 17.8 21.7 Other/Unknown 17.6 19.7 29.5 35.0
from 2009 to 2020, Orange County, California
Trends
33
ED VISITS TABLES
Counts
Male 5,213 5,420 5,823 6,290 6,367 7,545 8,238 9,392 9,579 9,535 9,092 8,796 Female 3,349 3,438 3,728 3,744 3,897 4,348 4,571 5,126 5,366 5,238 5,187 4,315 <15 218 258 195 120 162 149 151 187 262 241 299 207 15-24 2,087 2,353 2,348 2,502 2,355 2,634 2,885 3,237 3,188 2,905 2,727 2,373 25-44 3,272 3,151 3,347 3,476 3,568 4,316 4,848 5,867 6,149 6,148 6,286 6,037 45-64 2,699 2,754 3,276 3,506 3,691 4,270 4,267 4,505 4,545 4,653 4,105 3,773 65+ 286 342 385 430 488 524 659 722 801 826 862 722 Non-Hispanic White 5,981 6,007 6,594 6,760 6,917 7,895 8,243 8,887 8,933 8,578 7,967 7,411 Hispanic 1,883 2,080 2,112 2,237 2,414 2,976 3,392 4,218 4,501 4,654 4,728 4,263 Asian/Pacific Islander 208 269 282 337 300 378 433 507 563 581 562 411 Black 122 132 149 216 191 192 225 300 265 292 340 286 Other/Unknown 368 370 414 484 442 452 517 606 683 668 682 741
Rate
Male 350.8 363.0 385.0 410.9 412.3 484.8 525.3 595.5 603.5 599.3 571.4 553.6 Female 221.4 225.6 242.1 240.6 248.8 275.8 288.2 321.8 335.0 326.5 323.4 269.4 <15 36.0 42.8 32.3 19.9 26.9 24.8 25.2 31.4 44.0 40.7 51.1 35.8 15-24 482.4 537.2 526.3 549.9 512.0 566.8 615.8 686.5 681.2 627.8 595.4 522.6 25-44 381.3 369.2 393.5 411.2 426.5 522.7 596.0 730.9 769.4 770.9 791.9 766.3 45-64 355.5 357.8 416.6 438.8 454.5 517.3 507.4 528.3 526.9 538.3 476.3 440.1 65+ 83.2 96.8 105.0 111.9 122.0 125.9 152.4 161.5 172.7 172.3 173.7 140.7
Non-Hispanic White 438.8 450.1 491.9 502.3 513.7 586.3 612.1 661.0 664.8 641.3 597.8 558.9 Hispanic 186.7 204.6 203.8 211.9 225.3 274.1 308.6 380.0 401.3 412.4 417.4 375.5 Asian/Pacific Islander 40.8 49.3 51.0 60.2 53.0 66.2 75.0 87.1 95.7 98.1 95.1 69.7 Black 273.3 294.8 327.1 466.1 407.6 405.3 472.0 625.4 548.8 602.5 698.0 584.5 Other/Unknown 510.2 494.7 540.4 615.8 550.9 552.3 618.5 710.8 784.3 753.9 759.2 814.9
Age-Adjusted Rate
Male 338.4 350.0 369.3 394.8 395.7 469.2 514.0 584.8 599.5 595.5 573.6 559.0 Female 221.0 224.1 240.0 236.1 245.3 273.8 286.5 324.7 338.9 332.6 332.3 278.1
Non-Hispanic White 444.1 456.1 492.5 503.1 511.8 591.3 629.1 692.2 699.4 673.8 635.6 605.8 Hispanic 182.3 198.0 198.6 208.1 218.3 265.5 297.6 364.3 383.6 400.4 405.3 359.6 Asian/Pacific Islander 39.6 48.8 50.3 59.0 52.7 67.2 76.2 88.9 100.9 103.0 101.1 75.0 Black 252.9 261.6 300.3 426.4 372.8 371.2 430.8 579.8 523.5 583.0 690.5 583.6 Other/Unknown 575.3 543.3 588.9 691.8 619.4 623.9 700.8 792.5 882.1 836.7 878.4 923.2
2022
34
Drugs and Alcohol - Deaths, Emergency Department Visits, and Hospitalizations
Drug & Alcohol ED Visits 2009 2010 2011 2012 2013 2014 2015 2016 2017 2018 2019 2020
HOSPITALIZATIONS
Drug
Alcohol
Counts
Male 2,984 2,988 2,915 3,254 3,125 3,195 3,449 4,105 3,914 4,021 4,349 4,375 Female 1,933 1,970 2,004 2,080 1,954 2,060 1,999 2,305 2,316 2,211 2,353 2,226 <15 44 35 36 14 27 28 34 53 41 45 45 53 15-24 566 620 714 810 652 614 556 685 535 515 540 572 25-44 1,620 1,594 1,511 1,595 1,542 1,596 1,743 2,200 2,247 2,183 2,693 2,821 45-64 2,216 2,238 2,229 2,357 2,316 2,436 2,487 2,797 2,723 2,755 2,726 2,539 65+ 472 471 429 534 542 581 628 675 684 734 698 616
Non-Hispanic White 3,913 3,944 3,926 4,144 3,895 4,136 4,161 4,762 4,506 4,350 4,599 4,469 Hispanic 697 690 650 789 788 797 888 1,165 1,262 1,331 1,510 1,447 Asian/Pacific Islander 84 96 109 114 119 109 127 163 159 161 193 198 Black 52 58 59 82 90 66 83 107 86 119 109 116 Other/Unknown 172 170 175 205 187 147 189 213 217 271 291 371
Rate
Male 200.8 200.1 192.7 212.6 202.4 205.3 219.9 260.3 246.6 252.7 273.3 275.3 Female 127.8 129.3 130.1 133.7 124.7 130.7 126.0 144.7 144.6 137.8 146.7 139.0 <15 7.3 5.8 6.0 2.3 4.5 4.7 5.7 8.9 6.9 7.6 7.7 9.2 15-24 130.8 141.6 160.1 178.0 141.8 132.1 118.7 145.3 114.3 111.3 117.9 126.0 25-44 188.8 186.8 177.6 188.7 184.3 193.3 214.3 274.1 281.2 273.7 339.2 358.1 45-64 291.8 290.8 283.5 295.0 285.2 295.1 295.7 328.0 315.7 318.7 316.3 296.2 65+ 137.3 133.3 117.1 138.9 135.5 139.6 145.2 151.0 147.5 153.1 140.7 120.0
Non-Hispanic White 287.1 295.5 292.9 307.9 289.3 307.1 309.0 354.2 335.4 325.2 345.1 337.0 Hispanic 69.1 67.9 62.7 74.7 73.6 73.4 80.8 104.9 112.5 117.9 133.3 127.5
Asian/Pacific Islander 16.5 17.6 19.7 20.4 21.0 19.1 22.0 28.0 27.0 27.2 32.6 33.6 Black 116.5 129.5 129.5 177.0 192.1 139.3 174.1 223.1 178.1 245.6 223.8 237.1
Other/Unknown 238.5 227.3 228.4 260.8 233.1 179.6 226.1 249.8 249.2 305.9 323.9 408.0
Age-Adjusted Rate
Male 195.7 193.9 185.0 204.3 194.8 197.2 212.2 251.8 239.3 245.2 267.5 272.6
Female 123.9 124.8 126.1 127.9 118.8 124.5 119.8 138.2 138.9 131.6 144.0 138.0
Non-Hispanic White 267.5 276.9 277.4 290.3 270.9 287.1 293.4 342.6 325.4 315.1 345.3 346.3 Hispanic 84.7 81.4 74.5 85.5 82.8 80.1 88.7 114.6 118.5 124.9 138.5 130.0
Asian/Pacific Islander 15.9 17.2 19.1 19.4 19.8 18.6 21.1 26.8 26.1 26.2 30.5 34.1
Black 110.3 110.8 110.1 167.2 171.0 129.1 157.5 206.1 155.3 238.9 222.2 237.1
Other/Unknown 328.0 281.8 304.2 328.9 305.3 234.4 281.8 325.4 311.5 387.2 409.2 509.8
Trends from 2009 to 2020, Orange County, California 35
&
Hospitalizations 2009 2010 2011 2012 2013 2014 2015 2016 2017 2018 2019 2020
Deaths ED Visits Hospitalizations
ZIP 2010 Population Counts Avg. Rate Counts Avg. Rate Counts Avg. Rate
90620 45,113 28 20.7 419 309.6 190 140.4 90621 35,153 20 19.0 227 215.2 107 101.5 90623 15,554 5 10.7 59 126.4 60 128.6 90630 47,993 21 14.6 400 277.8 231 160.4 90631 67,619 35 17.3 560 276.1 230 113.4 90680 29,945 26 28.9 364 405.2 140 155.8 90720 21,751 15 23.0 172 263.6 140 214.5 90740 23,729 18 25.3 170 238.8 127 178.4 90742 831 * * * * * * 90743 456 * * * * * * 92602 22,871 * * 85 123.9 36 52.5 92603 20,184 * * 69 114.0 36 59.5 92604 26,853 5 6.2 177 219.7 66 81.9 92606 21,495 7 10.9 167 259.0 48 74.4 92610 11,248 * * 60 177.8 37 109.6 92612 27,522 10 12.1 197 238.6 89 107.8 92614 24,748 8 10.8 183 246.5 99 133.3 92617 14,044 * * 42 99.7 * * 92618 16,366 5 10.2 102 207.7 36 73.3 92620 38,486 14 12.1 177 153.3 107 92.7 92624 7,248 7 32.2 132 607.1 97 446.1 92625 12,478 7 18.7 128 341.9 103 275.2 92626 49,341 24 16.2 596 402.6 353 238.5 92627 61,510 63 34.1 1189 644.3 488 264.5 92629 25,756 28 36.2 387 500.9 327 423.2 92630 59,182 35 19.7 524 295.1 306 172.3 92637 16,012 12 25.0 152 316.4 131 272.7 92646 55,224 63 38.0 714 431.0 486 293.4 92647 57,245 49 28.5 887 516.5 403 234.7 92648 45,317 36 26.5 652 479.6 356 261.9 92649 32,463 29 29.8 325 333.7 246 252.6 92651 23,881 30 41.9 298 416.0 283 395.0 9 * Denotes suppression based on either mortality count <5, or ED Visits/Hospitalizations <25.
2022
36
BY ZIP9
Drugs and Alcohol - Deaths, Emergency Department Visits, and Hospitalizations
2009-2011 MAPS
Deaths ED Visits Hospitalizations
ZIP 2010 Population Counts Avg. Rate Counts Avg. Rate Counts Avg. Rate
92653 29,291 20 22.8 334 380.1 203 231.0 92655 8,337 9 36.0 87 347.8 42 167.9 92656 49,046 19 12.9 334 227.0 270 183.5 92657 9,741 * * 62 212.2 53 181.4 92660 34,797 22 21.1 342 327.6 237 227.0 92661 3,744 * * 44 391.7 35 311.6 92662 2,756 6 72.6 37 447.5 * * 92663 21,649 24 37.0 362 557.4 184 283.3 92672 34,464 35 33.9 611 591.0 378 365.6 92673 29,309 24 27.3 257 292.3 194 220.6 92675 34,731 28 26.9 332 318.6 280 268.7 92676 1,945 * * * * * * 92677 63,297 41 21.6 496 261.2 520 273.8 92679 32,611 9 9.2 187 191.1 215 219.8 92683 89,747 51 18.9 597 221.7 306 113.7 92688 43,792 20 15.2 284 216.2 309 235.2 92691 47,582 30 21.0 407 285.1 368 257.8 92692 47,222 24 16.9 318 224.5 296 208.9 92694 21,944 8 12.2 103 156.5 104 158.0 92701 53,908 37 22.9 524 324.0 221 136.7 92703 65,445 35 17.8 476 242.4 189 96.3 92704 88,123 50 18.9 596 225.4 198 74.9 92705 44,706 21 15.7 340 253.5 214 159.6 92706 36,457 15 13.7 236 215.8 72 65.8 92707 59,492 37 20.7 390 218.5 123 68.9 92708 56,004 25 14.9 472 280.9 308 183.3 92780 57,741 38 21.9 414 239.0 191 110.3 92782 23,032 5 7.2 109 157.8 55 79.6 92801 62,068 51 27.4 675 362.5 294 157.9 92802 42,709 23 18.0 319 249.0 135 105.4 92804 85,914 56 21.7 901 349.6 337 130.8 92805 70,401 45 21.3 581 275.1 219 103.7 92806 37,173 19 17.0 292 261.8 147 131.8
Trends from 2009 to 2020, Orange County, California 37 2009-2011 MAPS BY ZIP (CONTINUED)
Deaths ED Visits Hospitalizations
ZIP 2010 Population Counts Avg. Rate Counts Avg. Rate Counts Avg. Rate
92807 36,171 12 11.1 262 241.4 182 167.7 92808 20,039 * * 96 159.7 56 93.2 92821 35,533 17 15.9 294 275.8 142 133.2 92823 3,613 * * * * * * 92831 34,204 19 18.5 242 235.8 87 84.8 92832 24,752 15 20.2 273 367.6 115 154.9 92833 51,767 20 12.9 371 238.9 143 92.1 92835 24,010 8 11.1 119 165.2 72 100.0 92840 54,083 23 14.2 458 282.3 178 109.7 92841 32,845 17 17.3 265 268.9 102 103.5 92843 45,214 17 12.5 294 216.7 119 87.7 92844 24,307 10 13.7 165 226.3 45 61.7 92845 16,333 10 20.4 176 359.2 108 220.4 92861 5,781 * * 30 173.0 * * 92865 19,704 11 18.6 140 236.8 74 125.2 92866 14,885 9 20.2 132 295.6 77 172.4 92867 44,515 21 15.7 294 220.2 148 110.8 92868 25,404 12 15.7 262 343.8 125 164.0 92869 37,184 23 20.6 277 248.3 166 148.8 92870 52,033 20 12.8 410 262.7 203 130.0 92886 46,564 15 10.7 511 365.8 186 133.2 92887 20,006 8 13.3 154 256.6 94 156.6
2022 Drugs and Alcohol - Deaths, Emergency Department Visits, and Hospitalizations 38 2009-2011 MAPS BY ZIP (CONTINUED)
Deaths ED Visits Hospitalizations
ZIP 2019 Population Counts Avg. Rate Counts Avg. Rate Counts Avg. Rate
90620 46,133 34 24.6 572 413.3 197 142.3 90621 37,006 26 23.4 468 421.6 158 142.3 90623 16,429 5 10.1 89 180.6 * * 90630 49,835 33 22.1 482 322.4 222 148.5 90631 70,355 54 25.6 1058 501.3 332 157.3 90680 31,900 28 29.3 471 492.2 147 153.6 90720 22,660 17 25.0 264 388.3 125 183.9 90740 25,301 22 29.0 206 271.4 147 193.7 90742 1,117 * * * * * * 90743 430 * * * * * * 92602 29,792 6 6.7 122 136.5 53 59.3 92603 22,096 7 10.6 112 169.0 74 111.6 92604 27,837 13 15.6 276 330.5 143 171.2 92606 23,561 * * 191 270.2 96 135.8 92610 11,173 * * 65 193.9 * * 92612 32,639 14 14.3 312 318.6 131 133.8 92614 26,442 12 15.1 279 351.7 117 147.5 92617 16,429 * * 111 225.2 25 50.7 92618 32,902 8 8.1 399 404.2 139 140.8 92620 49,159 15 10.2 326 221.1 134 90.9 92624 7,148 15 69.9 161 750.8 91 424.4 92625 12,689 7 18.4 128 336.2 88 231.2 92626 52,387 58 36.9 958 609.6 389 247.5 92627 65,426 91 46.4 1555 792.2 677 344.9 92629 27,090 34 41.8 582 716.1 295 363.0 92630 64,450 60 31.0 961 497.0 379 196.0 92637 17,195 14 27.1 227 440.1 122 236.5 92646 57,123 67 39.1 932 543.9 538 313.9 92647 60,876 46 25.2 916 501.6 465 254.6 92648 48,013 45 31.2 879 610.3 414 287.4 92649 34,135 37 36.1 571 557.6 288 281.2 92651 25,579 13 16.9 591 770.2 263 342.7 10 * Denotes suppression based on either mortality count <5, or ED Visits/Hospitalizations <25.
39 2018-2020 MAPS BY ZIP10
Trends from 2009 to 2020, Orange County, California
Deaths ED Visits Hospitalizations
ZIP 2019 Population Counts Avg. Rate Counts Avg. Rate Counts Avg. Rate
92653 29,340 23 26.1 452 513.5 203 230.6 92655 8,758 18 68.5 130 494.8 63 239.8 92656 52,945 32 20.1 558 351.3 355 223.5 92657 12,105 5 13.8 71 195.5 54 148.7 92660 35,965 33 30.6 515 477.3 342 317.0 92661 4,036 * * 54 446.0 33 272.5 92662 2,952 * * * * * * 92663 22,722 28 41.1 740 1085.6 248 363.8 92672 42,387 38 29.9 669 526.1 361 283.9 92673 33,321 25 25.0 323 323.1 184 184.1 92675 38,642 45 38.8 650 560.7 320 276.0 92676 2,030 * * * * * * 92677 66,767 58 29.0 881 439.8 487 243.1 92679 33,391 14 14.0 258 257.6 181 180.7 92683 93,644 76 27.1 890 316.8 362 128.9 92688 45,850 24 17.4 516 375.1 265 192.7 92691 49,084 42 28.5 597 405.4 315 213.9 92692 48,492 32 22.0 483 332.0 297 204.2 92694 31,332 12 12.8 223 237.2 108 114.9 92701 55,463 67 40.3 1033 620.8 291 174.9 92703 69,080 58 28.0 895 431.9 333 160.7 92704 89,838 56 20.8 1188 440.8 408 151.4 92705 47,093 40 28.3 580 410.5 261 184.7 92706 37,645 20 17.7 613 542.8 141 124.9 92707 63,137 52 27.5 892 470.9 266 140.4 92708 57,934 60 34.5 621 357.3 330 189.9 92780 57,166 39 22.7 815 475.2 311 181.3 92782 29,020 12 13.8 197 226.3 118 135.5 92801 63,999 63 32.8 912 475.0 399 207.8 92802 44,698 43 32.1 511 381.1 193 143.9 92804 92,684 73 26.3 1206 433.7 390 140.3 92805 76,907 67 29.0 1021 442.5 346 150.0 92806 42,179 32 25.3 562 444.1 242 191.2
2022 Drugs and
Emergency Department
and
40 2018-2020 MAPS BY ZIP (CONTINUED)
Alcohol - Deaths,
Visits,
Hospitalizations
Deaths ED Visits Hospitalizations
ZIP 2019 Population Counts Avg. Rate Counts Avg. Rate Counts Avg. Rate
92807 37,439 24 21.4 354 315.2 140 124.6 92808 21,316 12 18.8 151 236.1 87 136.0 92821 40,159 27 22.4 424 351.9 160 132.8 92823 4,704 * * 41 290.5 * * 92831 35,911 35 32.5 449 416.8 151 140.2 92832 26,461 41 51.6 334 420.7 151 190.2 92833 55,876 43 25.7 607 362.1 243 145.0 92835 26,254 16 20.3 225 285.7 100 127.0 92840 55,810 53 31.7 656 391.8 237 141.6 92841 34,074 32 31.3 380 371.7 134 131.1 92843 48,682 43 29.4 635 434.8 190 130.1 92844 26,237 14 17.8 245 311.3 106 134.7 92845 16,718 7 14.0 170 339.0 96 191.4 92861 5,905 * * * * * * 92865 21,084 16 25.3 228 360.5 94 148.6 92866 15,466 9 19.4 172 370.7 51 109.9 92867 46,425 31 22.3 531 381.3 212 152.2 92868 26,775 24 29.9 585 728.3 204 254.0 92869 38,577 30 25.9 423 365.5 214 184.9 92870 54,292 40 24.6 742 455.6 261 160.2 92886 49,917 38 25.4 495 330.5 221 147.6 92887 21,356 13 20.3 187 291.9 72 112.4
2018-2020
ZIP
Trends from 2009 to 2020, Orange County, California 41
MAPS BY
(CONTINUED)
Deaths ED Visits Hospitalizations
City 2010 Population Counts Avg. Rate Counts
Avg. Rate Counts Avg. Rate
Aliso Viejo 47,411 20 14.1 334 234.8 271 190.5
Anaheim 336,208 214 21.2 3,197 317.0 1,404 139.2
Brea 39,259 19 16.1 329 279.3 156 132.5
Buena Park 80,477 50 20.7 648 268.4 298 123.4
Costa Mesa 110,008 87 26.4 1,822 552.1 857 259.7
Cypress 47,750 21 14.7 400 279.2 231 161.3
Dana Point 33,403 36 35.9 519 517.9 424 423.1
Fountain Valley 55,274 27 16.3 472 284.6 310 186.9
Fullerton 135,108 63 15.5 1,025 252.9 423 104.4
Garden Grove 170,672 81 15.8 1,370 267.6 561 109.6
Huntington Beach 190,136 178 31.2 2,595 454.9 1,504 263.7
Irvine 212,117 52 8.2 1,215 190.9 537 84.4
La Habra 60,235 35 19.4 564 312.1 232 128.4
La Palma 15,561 5 10.7 59 126.4 60 128.5
Laguna Beach 22,760 30 43.9 304 445.2 288 421.8
Laguna Hills 30,396 21 23.0 344 377.2 207 227.0
Laguna Niguel 63,005 40 21.2 503 266.1 527 278.8
Laguna Woods 16,242 15 30.8 152 311.9 131 268.9
Lake Forest 77,200 39 16.8 593 256.0 345 149.0
Los Alamitos 11,454 15 43.7 172 500.6 140 407.4
Mission Viejo 93,394 54 19.3 738 263.4 669 238.8
Newport Beach 85,093 65 25.5 1,030 403.5 666 260.9
Orange 136,233 77 18.8 1,145 280.2 602 147.3
Placentia 50,515 20 13.2 415 273.8 204 134.6
Rancho Santa Margarita 47,853 20 13.9 284 197.8 309 215.2
San Clemente 63,562 60 31.5 962 504.5 580 304.2
San Juan Capistrano 34,594 27 26.0 334 321.8 288 277.5
Santa Ana 325,036 198 20.3 2,292 235.1 831 85.2
Seal Beach 23,864 18 25.1 173 241.6 128 178.8
Stanton 38,166 26 22.7 364 317.9 140 122.3
Tustin 75,400 44 19.5 544 240.5 257 113.6
Villa Park 5,817 * * 30 171.9 * *
Westminster 89,694 52 19.3 613 227.8 312 115.9
Yorba Linda 64,118 23 12.0 671 348.8 286 148.7
Orange County (Total) 3,008,855 1,764 19.5 26,971 298.8 14,795 163.9 Red fill
2022 Drugs and Alcohol - Deaths, Emergency Department Visits, and Hospitalizations 42 2009-2011 MAPS BY ORANGE COUNTY CITY11
* Denotes suppression based on either mortality count <5, or ED Visits/Hospitalizations <25.
denotes cities with rates higher than Orange County average 11
Deaths ED Visits Hospitalizations
City 2019
Population Counts Avg. Rate Counts
Avg. Rate Counts Avg. Rate
Aliso Viejo 50,206 31 20.6 558 370.5 355 235.7
Anaheim 356,618 320 29.9 4,797 448.4 1,823 170.4
Brea 44,655 30 22.4 566 422.5 188 140.3
Buena Park 82,837 60 24.1 1,047 421.3 361 145.3
Costa Mesa 114,075 148 43.2 2,526 738.1 1,074 313.8
Cypress 48,887 35 23.9 482 328.6 222 151.4
Dana Point 33,564 50 49.7 743 737.9 386 383.3
Fountain Valley 55,718 61 36.5 629 376.3 337 201.6
Fullerton 142,251 135 31.6 1,643 385.0 654 153.3
Garden Grove 174,038 149 28.5 2,113 404.7 768 147.1
Huntington Beach 199,742 195 32.5 3,336 556.7 1,718 286.7
Irvine 274,641 81 9.8 2,157 261.8 928 112.6
La Habra 63,464 54 28.4 1,063 558.3 336 176.5
La Palma 15,704 6 12.7 89 188.9 * *
Laguna Beach 22,868 14 20.4 608 886.2 273 397.9
Laguna Hills 31,583 23 24.3 473 499.2 214 225.9
Laguna Niguel 65,038 58 29.7 893 457.7 498 255.2
Laguna Woods 16,314 16 32.7 227 463.8 122 249.3
Lake Forest 84,543 59 23.3 1,031 406.5 403 158.9
Los Alamitos 11,622 16 45.9 264 757.2 125 358.5
Mission Viejo 95,728 75 26.1 1,099 382.7 616 214.5
Newport Beach 86,419 81 31.2 1,570 605.6 809 312.0
Orange 140,368 111 26.4 1,983 470.9 796 189.0
Placentia 51,871 40 25.7 754 484.5 264 169.7
Rancho Santa Margarita 48,987 24 16.3 516 351.1 265 180.3
San Clemente 64,558 66 34.1 1,000 516.3 558 288.1
San Juan Capistrano 36,124 44 40.6 659 608.1 322 297.1
Santa Ana 334,231 293 29.2 4,786 477.3 1,485 148.1
Seal Beach 24,798 24 32.3 207 278.2 156 209.7 Stanton 39,194 28 23.8 471 400.6 147 125.0 Tustin 80,701 52 21.5 1,028 424.6 441 182.2 Villa Park 5,852 * * * * * * Westminster 92,289 77 27.8 897 324.0 368 132.9
144.9
Trends
43 2018-2020 MAPS BY ORANGE COUNTY CITY12
from 2009 to 2020, Orange County, California
Yorba Linda 68,304 52 25.4 686 334.8 297
Orange County (Total) 3,185,378 2,577 27.0 42,164 441.2 19,535 204.4 Red fill denotes cities with rates higher than Orange County average 12 * Denotes suppression based on either mortality count <5, or ED Visits/Hospitalizations <25.
Note on Population Sources:
Rates, except for those appearing in the City and ZIP tables, are from the California Department of Finance Population Projections, P-3 file. For years 2010 through 2020, the file was from the estimates for 2010-2060, the July 2021 update. For the year 2009, the file was from the estimates for 2000-2050, updated March 19, 2013.
The rates for the Cities tables for 2010 and 2019 are from the California Department of Finance E-4 Population Estimates for Cities, Counties and the State. The 2010 estimate is from the 2000-2010 version 1.3 (revised November 2012). The 2019 estimate is from the 2010-2020 version (May 2021).

44
2022 Drugs and Alcohol - Deaths, Emergency Department Visits, and Hospitalizations
Drugs and Alcohol – Deaths, Emergency Department Visits, and Hospitalizations
Orange County Health Care Agency
Clayton Chau, MD, PhD, MASL, Director
Regina Chinsio-Kwong, DO, Chief Medical Officer, County Health Officer
Mindy Winterswyk, PT, DPT, PCS, Assistant Agency Director
Mental Health and Recovery Services
Veronica Kelley, DSW, LCSW, Chief
Annette Mugrditchian, LCSW, Director of Operations
Mark Lawrenz, LCSW, Division Manager
Ian Kemmer, LMFT, Director
Strategies and Special Projects -Research
Tiffany Kalaitzidis, MPH, Research Analyst
Richard Chhuon, MPH, Research Analyst
Curtis Condon, PhD, Research Manager
Jenny Qian, MA, Chief and Public Guardian
Drugs and Alcohol – Deaths, Emergency Department Visits, and Hospitalizations: Trends from 2009 to 2020. Orange County Health Care Agency. Santa Ana, CA, June, 2022.
This report is available online at: https://ochealthinfo.com/page/drug-alcohol-overdose-hospitalization-deathorange-county
OC LINKS: Where Wellbeing Begins

Depression. Anxiety. Drug and alcohol misuse. Hopelessness. There are many conditions that can affect your ability to manage your everyday thoughts, emotions and actions, also known as your “behavioral health.” And in Orange County, there’s one place to start getting help for all of them: OC Links.
Chat Now: https://www.chorusplatform.io/m/oc-links/chat
Website: https://ochealthinfo.com/about-hca/mental-health-and-recovery-services/navigation-help-resources/ oc-links-0
Call Now: (855) 625-4657
405 W. 5th St. Santa Ana, CA 92701