Ocean, Harbor and Bay Water Quality Report

2019
– 2020

The 2019 – 2020 Ocean, Harbor and Bay Water Quality Report provides updated data on sewage spills and their impacts resulting in ocean water closures and provides an analysis of bacteriological water quality data collected at Orange County’s (OC) ocean, harbor and bay waters. The OC Health Care Agency (HCA) Water Quality Team (WQ) has been collecting information on sewage spill incidents in Orange County for a 33-year period (1987 – 2020) and this data is utilized to identify the main causes of sewages spills and to reduce the number of ocean water closures in Orange County.
In addition, the WQ has been collecting bacteriological water quality data for the 20-year period (2000 – 2020) established by the California Assembly Bill 411 (AB 411) Ocean WaterContact Sports Standards. This data is used to present an overview of the year-to-year variability and long-term trends associated with ocean, harbor and bay water quality in Orange County.

A total number of 88 sewage spills were reported to the WQ in 2020, which was well below the 33-year average of 191 spills per year.
In 2020, 2% of the 88 sewage spills reported, resulted in ocean, harbor and bay water closures representing a total of 2 ocean water closures for the year.
Of the 2 ocean water closures that occurred in 2020, sewage spills originating on private property accounted for 1 of the ocean, harbor and bay water closures for the year.
Blockages in pipelines have been responsible for an average of 62% of all beach closures since 1999. The major causes of pipeline blockages during this period are the infiltration of roots (10%), buildup of grease (18%), and unknown (55%).
Bay District Beach monitoring locations from April 1 to October 31. A summary of this data is available in Annex A: Postings by Open Coastal Water Areas 2000 – 2020.
The beach areas in 2020 exceeded a total number of 4.0 BMDs from April 1 to October 31 were Seal Beach/Surfside/Sunset (5.97 BMDs), Doheny State Beach (12.4 BMDs), and San Clemente City Beach (6.53 BMDs). A summary of this data is available in Annex A: Postings by Open Coastal Water Areas 2000 –2020.
from April 1 to October 31 (2000 – 2020)
In 2020, the total number of Beach Mile Days (BMDs) posted for Orange County beaches due to violations of bacteriological water quality standards was 60.4 BMDs. From 2000 – 2012 the average number of posted warnings was 205.2 BMDs, but over the past 7-year period (2013 - 2020) the average number of posted warnings dropped significantly to 44 BMDs a year.
In 2020, Bolsa Chica Beach, Newport Slough, South County Beach, Laguna Beach, and Capistrano County Beach did not exceed any AB 411 bacteriological standards from April 1 to October 31. A summary of this data is available in Annex A: Postings by Open Coastal Water Areas 2000 – 2020.
Excellent bacteriological water quality (less than 1.0 BMDs) was recorded at Huntington City Beach, Crystal Cove Beach, Dana Point Beach, and Capistrano
Although COVID-19 caused a major disruption to everyday life in 2020, it posed only a minimal disruption for beach sampling. We observed several stations that had reduced accessibility when the “Stay at Home” orders were issued. This information was communicated to the public by gray pins to represent “No Data” on our website, www.ocbeachinfo.com. Links for updated Orange County beach closure or restriction information were provided on our website and sent out in the email Hotline updates.
The pandemic also affected the ways and locations water was used and wastewater was produced. An increase in Private Property sewage spills was observed, although both the overall number of sewage spills and closures resulting from sewage spills declined.
It was of upmost importance to keep both the public and staff safe and informed. Staff wore additional Personal Protective Equipment (PPE) and the Water Quality Lab employed additional COVID-19 prevention methods when receiving and processing the samples.

As part of the OC Health Care Agency (HCA), the Environmental Health (EH) Water Quality Team (WQ) is responsible for protecting the public from exposure to ocean and bay waters that may be contaminated with sewage or may cause illness along Orange County’s 42 miles of open ocean coastline and 70 miles of harbor and bay frontage. Ocean and bay waters used for recreational activities such as swimming, surfing and diving must meet specific bacteriological water quality standards to be considered safe for such purposes.
water closures. This report also provides an analysis of bacteriological water quality data for samples collected from Orange County’s ocean, harbor and bay waters. Additional detailed statistical information regarding year-to-year variability, rain advisories issued, trends for each beach area and for sewage spill incidents can be found in the 2019 - 2020 Annex for the Ocean, Harbor & Bay Water Quality Report.
The HCA along with the Orange County Sanitation District (OCSD), South Orange County Wastewater Authority (SOCWA) and Orange County Public Works (OCPW) collaboratively sample and analyze the coastal waters in Orange County for bacteria that indicates the possible presence of disease-causing

organisms (see Appendix A, page 25). Staff from these agencies cooperate in the weekly collection of water samples at 141 ocean, harbor and bay monitoring stations throughout coastal Orange County (Figure 1, page 6). Last year, over 7,600 ocean, harbor and bay water samples were collected and approximately 23,000 analyses (see Appendix B, page 26) were performed to determine the results for three indicator bacteria used for compliance purposes (i.e., total coliform, fecal coliform and enterococcus).
HCA’s WQ Team reviews the bacteriological sample results daily and issues ocean, harbor and bay water closures, posts warnings and health advisories under the requirements stipulated by the California Health
It is critical to accurately measure and assess the overall health of our coastal waters through a full range of indicators and provide this information to the public in an annual report. The annual report does not set goals, make recommendations or offer advice; rather, it provides factual data for use by government officials, public agencies, environmental groups, concerned citizens and all other interested parties. In addition, this report provides a foundation for future projects aimed at assessing the health of Orange County’s ocean, harbor and bay waters. The report and its appendices contains data on sewage spills and their impacts resulting in ocean
and Safety Code and Title 17 of the California Code of Regulations (see Appendix C, page 27). When the results of testing indicate that one or more of the AB 411 Ocean Water-Contact Sports Standards has been exceeded, the public is notified (see Appendix D), signs are posted at the beach (see Appendix E), and the sampling frequency and monitoring locations may increase until the sample results meet established standards and/or the source of the problem is eliminated. A metric called “Beach Mile Days” (BMDs) is used as a measurement that takes into account the length of the beach and amount of time a posted warning or closure is in place (see Appendix F). The numeric value associated with a Beach Mile Day represents the public’s loss of recreational water use and allows for beach-to-beach comparisons.
WQ staff are on-call 24 hours/7 days a week to respond to and investigate any reports of sewage or other potential contamination incidents that may affect public health at any of Orange County’s ocean, harbor and bay water areas. The WQ Team maintains an Ocean, Harbor and Bay Water Posting and Closure webpage, telephone hotline and social media account (Twitter), all of which provide current information regarding Orange County beach closures, posted warnings and advisories. The telephone hotline and webpage are immediately updated and social media messages are sent when a change of status occurs at any ocean, harbor or bay water area in Orange County.
Ocean, Harbor and Bay Water Closure & Posting Telephone Hotline (714) 433-6400

Ocean, Harbor and Bay Water Closure & Posting Web Page www.ocbeachinfo.com
QUALITY REPORT

Sewage waste discharges commonly known as “sewage spills,” occur when wastewater being transported via underground pipes overflows through a manhole, clean-out drain or broken pipe. Sewage spills can cause health hazards, damage homes and businesses, and threaten the environment, local waterways and beaches. Untreated sewage has high levels of disease-causing bacteria and viruses. Orange County WQ is responsible for protecting public health by closing ocean, harbor and bay water areas affected by sewage spills
Local and state agencies have legal jurisdiction and enforcement authority to ensure sewage spills are remediated. Allowing sewage to discharge or not reporting the sewage spill from a home, business or public property may subject the responsible party to penalties and/or out-of-pocket costs to reimburse local and state agencies for cleanup efforts. As mandated by the California Health and Safety Code, any person who causes or permits a sewage discharge to any state waters must immediately notify the local health agency of the discharge. After a significant increase in the number of ocean water closures due to sewage spills in 1998, the WQ Team started collecting detailed data on all sewage spills occurring in Orange County. Therefore, the type of sewage waste discharges data (e.g., private property owner, pipeline blockages and pipeline breaks) are only available from 1999 onward.


1987 – 2020
The number of sewage discharges reported to the Orange County WQ by sanitation districts, cities that operate sewage collection systems and private property owners from 1987 – 2020 is detailed in Figure 2. The number of spills in both 2019 and 2020 were well below the average of 191 spills per year.
Number of Sewage Spills Reported 1987 – 2020 Figure 2.

Source: Orange County Ocean, Harbor and Bay Water Quality Report Historical Data
2019 – 2020 OCEAN, HARBOR AND BAY WATER QUALITY REPORT
Figure 3 depicts the percentage of sewage spills due to overflows from privately owned sewage systems (e.g. residential homes, apartment/ condominium complexes, strip malls, etc.) reported each year from 1999 – 2020. In 2020, privately owned sewage systems were responsible for 38% of all sewage waste discharges reported in Orange County and equal to the 21-year average of 38%. Although, the percentage of spills was higher, the actual number of overflows from privately owned sewage systems stayed consistent in years 2019 and 2020.
 Source: Orange County Ocean, Harbor and Bay Water Quality Report Historical Data
1999 – 2020
The percentage of sewage spills caused by pipeline blockages from 1999 – 2020 is detailed in Figure 4. The percentage of sewage spills caused by pipeline blockages continues to be the leading cause of sewage waste discharges from 1999 – 2020. Since 2009, the increase in the percentage of sewage spills caused by pipeline blockages is primarily due to the significant decrease in the percentage of sewage spills caused by pipeline breaks as shown in Figure 5 (page 11). The significant reduction in pipeline breaks can be attributed to the wastewater collection agencies having to adopt “Sewer System Management Plans” which require the routine inspection, maintenance and rehabilitation of aging sewers. This reduction in pipeline breaks has been maintained at 5% - 8% for the past 10 years.
 Source: Orange County Ocean, Harbor and Bay Water Quality Report Historical Data

1999 – 2020
Percent of Sewage Spills Caused by Pipeline Breaks 1999 – 2020 Figure 5.
Source: Orange County Ocean, Harbor and Bay Water Quality Report Historical Data

The percentage of sewage spills reported that resulted in an ocean, harbor or bay water closure from 1987 – 2020 is shown in Figure 6. The past two years have shown a significant decline in the number of ocean water closure, both well below the 10% annual average from 1987 - 2020.

6.
 Source: Orange County Ocean, Harbor and Bay Water Quality Report Historical Data
When a known release of sewage or other harmful waste is reported to the WQ Team, the ocean, harbor or bay water areas that may be affected by the sewage discharge are immediately closed to water-contact recreational activities. The area closure is based on many factors including type of sewage (e.g., untreated, secondary treated, etc.), volume of spill, location of spill, ocean currents and tides, historical sewage spills in the area and other pertinent information. After the initial closure is established, the appropriate agencies are notified, the area is posted with closure signs, a press release is issued, the Ocean, Harbor and Bay Water Closure & Posting Telephone Hotline and Webpage are updated with the beach closure information, and daily bacterial sampling of the affected area is initiated.
The closed ocean or bay water area will be reopened or reduced in size when the contamination source has been eliminated and after two daily consecutive sampling results indicate the affected area meets the AB 411 Ocean Water-Contact Sports Standards.
The WQ Team began recording information on ocean water closures in 1987. After a significant increase in the number of ocean water closures due to sewage spills in 1998, the WQ Team started collecting detailed data on all sewage spills occurring in Orange County the following year (1999).

1987 – 2020
The total number of ocean, harbor and bay water closures in Orange County due to sewage spills from 1987 – 2020 is summarized in Figure 7. In 2020, the total number of closures due to sewage spills (2) is the lowest amount since closures were tracked in Orange County.
Number of Ocean, Harbor and Bay Water Closures Due to Sewage Spills 1987 – 2020 Figure 7.

Source: Orange County Ocean, Harbor and Bay Water Quality Report Historical Data

1999 – 2020
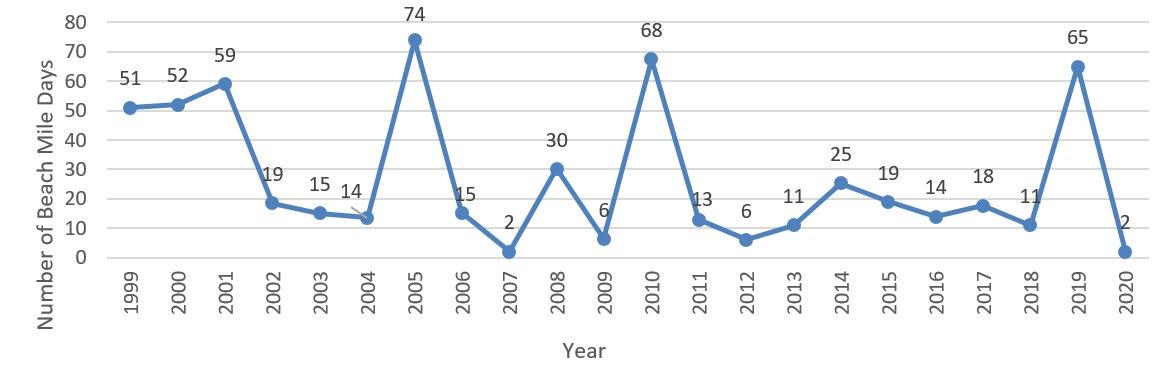
The following graphs depict the total number of closures (Figure 8), total number of closure days (Figure 9) and total number of BMDs (Figure 10, page 16) of closure due to sewage spills in Orange County. In 2020, the total number of closures (2), and the total number of closure days (6) continued to remain consistently below the 21year averages of 19 closures and 65 closure days for the period from 1999 – 2020.
Total Number of Closures 1999 – 2020 Figure 8.
Total Number of Closure Days 1999 – 2020 Figure 9.

Source: Orange County Ocean, Harbor and Bay Water Quality Report Historical Data

The 2020 total number of BMDs (2) ties for the lowest number of BMDs since this data has been tracked in 1999. Additionally, in the prior year of 2019, 57 of the 65 BMDs were from one large sewage spill that occurred over a holiday weekend due to a force main break.

 Source: Orange County Ocean, Harbor and Bay Water Quality Report Historical Data
Figure 11 illustrates the distribution of different causes of sewage spills that resulted in ocean, harbor and bay water closures from 1999 – 2020. Sewage system pipeline blockages caused the majority (62%) of all ocean, harbor and bay water closures in Orange County for the 21-year period from 1999 - 2020. The remaining 38% of sewage closures were caused by pipeline breaks (12%), vessel pump stations (11%), pump station failures (9%), treatment plant discharges (2%), storm water surcharges (1%) and miscellaneous (3%).
Figure 12 illustrates the distribution of different causes of pipeline blockages that resulted in ocean, harbor and bay water closures from 1999-2020. The infiltration of roots (31%) and deposition of grease (25%) into sewer pipes accounted for slightly more than half (56%) of the pipeline blockages that resulted in ocean, harbor and bay water closures in Orange County for the 21year period from 1999 – 2020. Other causes of pipeline blockages that resulted in water closures were debris (15%), miscellaneous (6%) and vandalism (1%). The remaining 22% of pipeline blockages that caused ocean, harbor and bay water closures were not able to be determined (unknown).

Causes of Ocean, Harbor and Bay Water Closures 1999 – 2020 Figure 11. Types of Pipeline Blockages Causing Closures 1999 – 2020 Figure 12.
 Source: Orange County Ocean, Harbor and Bay Water Quality Report Historical Data Source: Orange County Ocean, Harbor and Bay Water Quality Report Historical Data
The percentage of ocean, harbor and bay water closures that were due to private property owner sewage system spills for the 21-year period from 1999 – 2020 is shown in Figure 13. Of the 6 ocean water closures that occurred in 2019, private property owner sewage spills accounted for 17% of the closures for the year which is significantly below the 41% annual average percentage of private property owner caused sewage spill closures from 1999 – 2020. Only 1 of the 2 closures in 2020 was from a private property source.
 Source: Orange County Ocean, Harbor and Bay Water Quality Report Historical Data
Upon implementation of the AB 411 Ocean Water-Contact Sports Standards in July of 1999, the WQ Team began posting the required health warning signs at public beaches where the ocean, harbor or bay waters failed to meet state mandated recreational water quality standards.
To better protect the health of the residents and visitors to Orange County, WQ collects bacteriological water samples at 141 ocean, harbor and bay locations throughout Orange County, year-round, even though regulations only require collection from April 1 through October 31. Sample results are reviewed daily by the WQ Team to determine compliance with the seven AB 411 bacteriological standards established by the State of California. Each year the WQ Team reviews the bacteriological water quality results for over 3,800 water samples collected from April 1 to October 31. Because ocean, harbor or bay water areas that violate the AB 411 Ocean Water-Contact Sports Standards may cause illness to recreational water users, the WQ staff recommends staying out of the water at all beach areas that are posted with the health warning sign.
and Bay Water Closure and Posting Hotline at (714) 433-6400, Webpage at www.ocbeachinfo.com and on Twitter http://twitter.com/ochealth.

Follow-up bacteriological water samples are collected at the posted location and the results are evaluated daily to determine if the posted warning area should be modified, kept the same or removed.
When a bacteriological water sample fails to meet an AB 411 Ocean Water-Contact Sports Standard, the following actions are taken:
Warning signs are posted at the affected ocean, harbor or bay water area indicating that bacteria levels have exceeded health standards and ocean water contact may cause illness.
The information regarding the posted area is updated on the Ocean, Harbor
As required by the California Health and Safety Code Section 115910, violations of the AB 411 Ocean Water-Contact Sports Standards between April 1 and October 31, must be reported to the California State Water Resources Control Board by all California coastal counties, on a monthly basis. The information provided in this section is the data reported to the California State Water Resources Control Board beginning with the year 2000, the first full calendar year that the AB 411 Ocean Water-Contact Sports Standards were put in place.
The total number of posted warnings, total number of posting days, and total number of BMDs that were posted due to AB 411 standards violations between April 1 and October 31 for all Orange County ocean, harbor and bay water areas, are shown in Table 1. There has been a significant reduction in the total number days and BMDs for the 20-year period from 2000 – 2020. This reduction is due to multiple mitigation measures and strategies being implemented by local, County and state agencies to reduce the amount of urban runoff being discharged into storm drains, creeks and rivers that impact ocean, harbor and bay waters.
Total Number of Posting Warnings, Posting Days and BMDs 2000 – 2020 Table 1.
Year Posted Warnings Posting Days BMDs
2000 199 2,123 362.8 2001 208 2,454 282.4 2002 308 2,456 366.0 2003 160 1,732 247.5 2004 141 1,877 196.8 2005 102 1,512 197.6 2006 183 1,381 177.4 2007 116 1,037 139.0 2008 121 857 132.2 2009 109 791 135.6 2010 102 843 87.6 2011 114 855 164.0 2012 119 1,135 178.6 2013 87 458 34.6 2014 115 632 35.4 2015 109 674 36.2 2016 74 662 29.1 2017 99 777 38.9 2018 103 807 51.6
2019 112 1,052 63.9
2020 121 1,095 60.4
2019 – 2020 OCEAN, HARBOR AND BAY WATER QUALITY REPORT

The trend in the total number of BMDs that were posted due to AB 411 standards violations between April 1 and October 31 from 2000 –2020 is detailed in Figure 14. BMDs have gone down by 3.5 BMDs from the previous year and both years are largely below the 20-year average of 144 BMDs.
Total Number of BMDs Posted 2000 – 2020 (April 1 – October 31) Figure 14.
Source:


During and after a significant rainstorm event, storm drains, creeks and rivers carry floodwaters with urban runoff into local ocean, harbor and bay waters. Urban runoff may include fertilizers, road oils, litter and large amounts of bacteria from a variety of sources, such as animal waste and decomposing vegetation. The levels of bacteria can rise significantly in ocean and bay waters close to discharging storm drains and outlets of creeks, rivers, and streams during and after rainstorms. To ensure that public health and safety is protected, WQ staff advise against body-contact recreational use of ocean, harbor or bay waters where there may be contamination due to storm water carrying urban runoff. The elevated bacterial levels in ocean, harbor and bay waters may continue for a period of at least three days, depending on the intensity of the rain and the volume of runoff.
should avoid contact with any storm drain or creek runoff on the beach during dry or wet weather conditions.
WQ issues a Rain Advisory during or immediately after a rainstorm event that results in measured rainfall greater than or equal to two-tenths of an inch (0.20”). If multiple rainstorm events occur during the 72-hour window of the previous rainstorm, the existing Rain Advisory continues for an additional 72 hours. Rain Advisory information is provided by issuing a Rain Advisory Press Release to media outlets and on the Ocean, Harbor and Bay Water Closure and Posting Hotline at (714) 4336400, Webpage at www.ocbeachinfo.com, and on Twitter http://twitter.com/ochealth.
Upon implementation of the AB 411 Ocean Water-Contact Sports Standards in July of 1999, the WQ Team began issuing Rain Advisories for all coastal ocean, harbor or bay waters in Orange County. The annual report uses data beginning in 2000 when the first full year of the Rain Advisories were issued. Appendix G provides the total number of Rain Advisory Days for each year and the dates the advisories were in effect (2000 – 2020).
Swimmers, surfers and divers should avoid body-contact recreation with Orange County’s ocean, harbor and bay waters during and after a rainstorm event and all beach users
The following graph (Figure 15) depicts the total number of Rain Advisory Days issued for ocean, harbor and bay waters from 2000 – 2020. In 2020, Orange County experienced a total of 49 Rain Advisory Days which is below the 20-year average of 57 Rain Advisory Days per year from 2000 – 2020.

Total Number of Rain Advisory Days 2000 – 2020 Figure 15.
Source: Orange County Ocean, Harbor and Bay Water Quality Report Historical Data
2019 – 2020 OCEAN, HARBOR AND BAY WATER QUALITY

The following graph (Figure 16) compares the total number of Rain Advisory Days to the total number of sewage spill beach closures from 2000 – 2020. For the 12-year period from 2000 – 2012, an increase or decrease in the total number of Rain Advisory Days generally resulted in a similar increase or decrease in the total number of sewage spill beach closures. However, since 2013, it appears this relationship between sewage spill beach closures increasing and decreasing along with the number of Rain Advisory Days no longer exists.
 Source: Orange County Ocean, Harbor and Bay Water Quality Report Historical Data
Contaminated runoff and untreated sewage released into ocean and bay waters may result in swimmer exposure to pathogenic bacteria, viruses or protozoa. These disease-causing microorganisms may be present at or near the sites where discharges enter the water.

Disease-Causing Microorganisms
Escherichia coli (E. coli) Gastroenteritis
Salmonella (not typhi)
Gastroenteritis, usually with fever; less commonly septi¬cemia (generalized infection - organisms multiply in the bloodstream)
Some strains of Shigella Gastroenteritis, usually with fever
The following table lists the types of microorganisms and the diseases (or symptoms) they may cause.
Protozoa (Intestinal Parasites)
Cryptosporidium Diarrhea - Cryptosporidiosis Giardia lamblia Diarrhea - Giardiasis
Viruses
Rotavirus Gastroenteritis
Enteroviruses
Respiratory infection, rash, fever, meningitis
Norwalk and Norwalk-like viruses Gastroenteritis
Adenovirus
Hepatitis A (outbreaks associated with eating shellfish from sewage-contaminated water)
Respiratory infection and gastroenteritis
Infectious hepatitis (liver malfunction)
The levels of bacteria, viruses and protozoa typically decrease in ocean and bay waters over time due to the following reasons:
• Die-off due to sun (ultraviolet exposure), salt water or age.
• Predation by other organisms.
• Dispersion and dilution.
The detection and enumeration of disease-causing organisms (pathogens) identified with waterborne illness is difficult, time-consuming and costly. Thus, most water quality laboratories are required to test for fecal indicator bacteria (i.e., total coliforms, fecal coliforms and enterococci) as a means to ascertain the likelihood that human pathogens may be present in recreational waters. Fecal indicator bacteria normally occur in the intestines of all warm-blooded animals, are excreted in high numbers in feces, but can also be found in soil and decaying vegetation. Since there is no ideal indicator group, testing is done for more than one indicator. Total coliforms are a broad group of organisms that include fecal coliform bacteria as well as E. coli. The enterococci group has been determined to be a good indicator of water-contact associated gastroenteritis. The methods most commonly used to detect fecal indicator bacteria in water include:
Membrane Filtration (MF)
Multiple-Tube Fermentation (MTF)
Colilert®
Enterolert®
All of the methods are culture based, which means that the indicator bacteria present in water must be allowed to grow in order to be detected. Differences between the methods include how the bacteria are detected and counted, how soon the results become known and cost. Each method has its advantages and disadvantages. Most of the limitations depend on factors such as the other types of constituents in the water and density of bacteria present, and all require at least an 18hour incubation period. The following is a brief summary of the Membrane Filtration method, the method used by the HCA/Public Health Laboratory, the South Orange County Wastewater Authority Laboratory, and the Orange County Sanitation District Laboratory for the analyses of total coliforms, fecal coliforms, and enterococci in ocean and bay waters. Detailed descriptions for the Membrane Filtration (MF), Multiple-Tube Fermentation (MTF), Colilert® and Enterolert® methods are available in the latest edition of Standard Methods for the Examination of Water and Wastewater.
culture medium designed to encourage the growth of the target indicator. The filter is incubated for 22–24 hours to allow the bacterial cells to multiply into visible colonies. Theoretically, each bacterial cell (or clump of cells) produces a single colony on the membrane.
The colonies are viewed under a 10X magnifying lens and distinguished from non-target bacteria based on the type, size and color of the colonies. Target bacteria are indicated by pigment production resulting from bacterial enzymatic reactions to specific substrates. The number of colonies present in 100 milliliters of water, also known as
“Colony Forming Units” (CFUs), is counted and the concentration of organisms in the original sample is calculated.

The Membrane Filtration method involves filtering water through a porous membrane to concentrate or trap bacteria from the water sample on the filter surface. The membrane filter is placed onto a
Enterococcus Colonies


In 1998, AB 411 (Wayne) was chaptered into law and added Sections 115875115915 to the California Health and Safety Code. The law authorized the creation of bacteriological ocean water quality standards that are considered protective of public health (California Code of Regulations Sections 7956-7962).

The standards are informally called “AB 411 Standards” and include the following:
Required testing of the waters adjacent to all ocean and bay public beaches for total coliforms, fecal coliforms and enterococci bacteria that may indicate the presence of possible disease-causing bacteria, viruses or protozoa.
Required maintenance and updates of the Ocean, Harbor and Bay Posting and Closure Hotline.
Established single sample standards for total coliforms, fecal coliforms and enterococci bacteria which shall not exceed:
6 Total Coliforms: 10,000 organisms per 100 milliliter sample.
6 Fecal Coliforms: 400 organisms per 100 milliliter sample.
6 Enterococci: 104 organisms per 100 milliliter sample.
6 Fecal Coliform to Total Coliform ratio: >1,000 total coliforms if ratio exceeds 0.1.
Established 30-day geometric mean standards (of five weekly samples) for total coliforms, fecal coliforms and enterococci bacteria which shall not exceed:
6 Total Coliforms: 1,000 organisms per 100 milliliter sample.
6 Fecal Coliforms: 200 organisms per 100 milliliter sample.
6 Enterococci: 35 organisms per 100 milliliter sample.
When any waters adjacent to a public beach fail to meet any of the standards
described above, the local health officer shall post signs on the beach to restrict access to the affected waters.
Weekly testing is required from April 1 – October 31 if the following apply:
6 The beach is visited by more than 50,000 people annually.
6 The beach is located in an area adjacent to a storm drain that flows in the summer.
In the case of a known release of sewage into ocean or bay waters adjacent to a public beach, the local health officer is required to:
6 Immediately close the affected ocean or bay waters until the source of the sewage is eliminated.
6 Collect bacterial samples from the affected waters.
6 Continue the closure until testing results of water samples meet the established standards.
Public notification and risk communication are a critical component of the WQ Team. Public awareness and enhancing the capacity for informed personal choice are important factors in ensuring public health protections are provided to recreational water users. The WQ Team has established and maintains an integrated management system to inform the public of the potential health risks associated with water contact activities in coastal recreational waters that do not meet applicable water quality standards. Multiple communication measures are promptly taken to notify the public when ocean, harbor or bay water areas do not meet or are expected not to meet AB 411 Ocean Water-Contact Sports Standards. The WQ Team implements the following types of public notification measures to communicate information regarding beach water quality and to protect the health of beach users:
Email Hotline – The Email Hotline is the digital written version of the information that is provided on the Telephone Hotline that is sent out when changes occur to a list serve of stakeholders and the public.
Social Media – Public notification of ocean water quality status changes are being communicated to the public through the social media network of Twitter. For the latest information and instant ocean water quality updates when they occur, follow us on Twitter at http://twitter.com/ochealth
Press Releases – Public notification of a beach closure or rain advisory is provided in a press release issued by the HCA. The press release will indicate whether a closure or advisory is being issued, the reason for the closure or advisory, the area affected and the anticipated duration of the closure or advisory.
Beach Signs – Signs are posted to notify beach users of the current status of the ocean, harbor or bay water area. Posted beach signs are located where they are most likely to be noticed by beach users and provide a visual notice at the point of ocean water access.
Telephone Hotline – The Ocean, Harbor and Bay Water Closure & Posting Telephone Hotline has been established to inform the public about all beaches that are currently closed, posted with a health warning or when a rain advisory has been issued. The telephone hotline message is immediately updated when a change in the status of beach closures, postings or advisories occurs. The Ocean, Harbor and Bay Water Closure & Posting Telephone Hotline is (714) 433-6400
Annual Reports – To assess the health of the ocean, harbor and bay waters being monitored, the WQ Team compiles a report of the beach closures, postings and advisories after the year has ended. The annual or biennial Ocean, Harbor and Bay Water Quality Report provides an updated analysis of bacteriological water quality, describes year-to-year variability and trends for Orange County’s recreational waters, and includes data on sewage spills and beach closures. Reports from 2002 to present can be viewed and downloaded from the Ocean, Harbor and Bay Water Closure & Posting Web Page at www.ocbeachinfo.com.
The yellow closure sign is posted when a sewage spill affects ocean or bay waters adjacent to a public beach. This sign is also available in Spanish language.


The warning sign with the red and black border is posted when a violation of the AB 411 Ocean Water-Contact Sports Standards occurs.
The warning sign with the yellow and black border is permanently posted near storm drains, creeks and rivers to advise the public of the risks associated with possible contamination from urban runoff and violations of the AB 411 Ocean Water-Contact Sports Standards where runoff enters the ocean. The ocean water warning area is from 75 feet upcoast to 75 feet downcoast of the flowing storm drain, creek or river.

The term “Beach Mile Days” is used to represent the measurement of the number of days and the linear area of ocean, harbor or bay front waters that are closed due to a sewage spill or posted for a violation of the AB 411 Ocean Water-Contact Sports Standards.
BMDs are calculated by multiplying the number of days of a closure or posting by the number of miles of beach closed or posted: (Number of Days) x (Miles of Beach Closed or Posted) = BMDs
For example, if a sewage spill resulted in the closure of ½ mile of beach for 7 days, then: (7 days) x (0.5 miles of beach closed) = 3.5 BMDs of closure
Another example, if 300 feet of beach is posted for a violation of the AB 411 Ocean Water-Contact Sports Standards for 5 consecutive days, then: (5 days) x (0.06 miles of beach posted) = 0.3 BMDs of posting
Using BMD as a measurement of ocean and bay water availability is more meaningful than using the number of incidences or the number of days since BMD takes into account both the length of beach and number of days for a closure or posting. The State of California Water Resources Control Board and all California coastal counties use BMD for reporting closures and postings which provides a standardized measurement that allows comparison of different areas (beach to beach or county to county) and the assessment of closure and posting trends over time.

Listed

This Annex provides graphic representations of the data summarized for the 2019-2020 Ocean, Harbor and Bay Water Quality Report. The source of the detailed statistical information in this Annex is from the Orange County WQ division. This Annex offers supplemental data and information which can be used by government officials, public agencies, environmental groups and concerned citizens to examine, evaluate and compare yearto-year variability and trends for beach areas and sewage spill incidents.
List of Annexes:
Annex A: Postings by Open Coastal Water Areas 2000 – 2020
Annex B: Postings by Harbor and Bay Water Areas 2000 – 2020
Annex C: Unauthorized Discharges of Waste and Ocean/Harbor/Bay Closures 1987 – 2020
Annex D: Sewage Spill Closures for Ocean, Harbor and Bay Water Areas – 2020

2000 – 2020
The following tables and graphs provide monitoring information from April 1 – October 31 for each of Orange County‘s open coastal ocean water areas and is arranged geographically from north to south along the Orange County shoreline. The appendix information provided for each open coastal ocean water area includes:
Total number of posted warnings, total number of posted warning days and total number of BMDs (BMD) that were posted due to AB 411 standards violations from April 1 – October 31 in 2000 – 2020;
A trend graph depicting the total number of BMDs that the open coastal water area was posted from April 1 – October 31 in 2000 –2020; and
The open coastal ocean water area monitoring station descriptions and the number of posted warnings, posting days and BMDs that were posted at each monitoring station due to AB 411 standards violations from April 1 –October 31, 2020.


Projection

2000 – 2020 Number of Posted Warnings, Posting Days and BMDs

Year Posted Warnings Posting Days BMDs
2000 6 12 5.4 2001 1 1 0.1 2002 7 11 0.9 2003 8 14 0.8 2004 1 1 0.1 2005 4 7 0.4 2006 7 13 0.7 2007 3 6 0.6 2008 2 2 0.2 2009 1 1 0.1 2010 1 1 0.1 2011 2 2 0.1 2012 5 9 0.5 2013 0 0 0.0 2014 2 2 0.1 2015 4 4 0.2 2016 1 1 0.1 2017 1 1 0.1 2018 0 0 0.0 2019 0 0 0.0 2020 0 0 0.0


Year Posted Warnings Posting Days BMDs
2000 9 21 1.3 2001 3 5 0.3 2002 1 1 0.1 2003 1 4 0.2 2004 1 2 0.1 2005 0 0 0.0 2006 1 2 0.4 2007 1 1 0.1 2008 1 2 0.4 2009 0 0 0.0 2010 2 3 0.2 2011 1 1 0.1 2012 2 4 0.3 2013 1 1 0.1 2014 3 5 0.3 2015 0 0 0.0 2016 1 1 0.1 2017 1 2 0.1 2018 0 0 0.0 2019 1 1 0.1 2020 1 2 0.1
Crystal
Crystal
Pelican
Crystal
Muddy


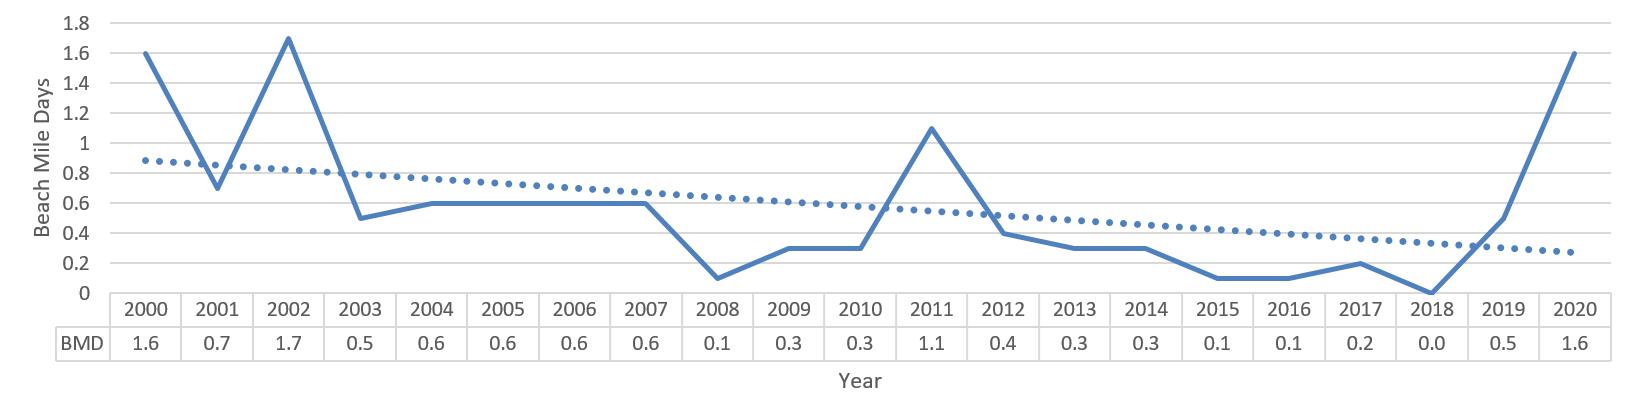
Laguna Beach - Number of BMDs Posted & Trend 2000 – 2020 (April 1 – October 31)

Laguna Beach - 2020 Number of Posted Warnings, Posting Days and BMDs
Station Description Postings Days BMDs
Emerald Bay Beach 0 0 0.0
Crescent Bay Beach 0 0 0.0
Diver's Cove 0 0 0.0
Laguna Main Beach 0 0 0.0
Hotel Laguna 0 0 0.0
Cleo Street 0 0 0.0
Bluebird Canyon 0 0 0.0
Between Pearl & Agate Street 0 0 0.0
Victoria Beach 0 0 0.0
Blue Lagoon 0 0 0.0
2019 – 2020 OCEAN, HARBOR AND BAY WATER QUALITY REPORT

Year
Warnings
2000 12 22 1.6 2001 4 5 0.7 2002 4 9 1.7 2003 5 9 0.5 2004 4 6 0.6 2005 6 11 0.6 2006 7 11 0.6 2007 3 11 0.6 2008 1 1 0.1 2009 5 5 0.3 2010 3 6 0.3 2011 6 8 1.1 2012 1 2 0.4 2013 3 6 0.3 2014 3 6 0.3 2015 1 2 0.1 2016 1 1 0.1 2017 3 6 0.2 2018 0 0 0.0 2019 3 10 0.5 2020 6 36 1.6
Aliso County Beach & South Laguna Beach - Number of BMDs Posted & Trend 2000 – 2020 (April 1 – October 31)
Aliso County Beach & South Laguna Beach - 2020 Number of Posted Warnings, Posting Days and BMDs
Station Description Postings Days BMDs
Goff Island Beach at Christmas Cove 1 2 0.11
Treasure Island Beach 0 0 0.0
Aliso Beach - North 0 0 0.0
Aliso Creek - Ocean Interface 4 32 1.33
Aliso Beach Middle 0 0 0.0
Aliso Beach South 0 0 0.0
Camel Point 0 0 0.0
West Street 0 0 0.0
Table Rock 0 0 0.0
Laguna Lido 0 0 0.0
9th Street / 1000 Steps Beach 0 0 0.0
Three Arch Bay 1 2 0.11
2019 – 2020 OCEAN, HARBOR AND BAY WATER QUALITY REPORT


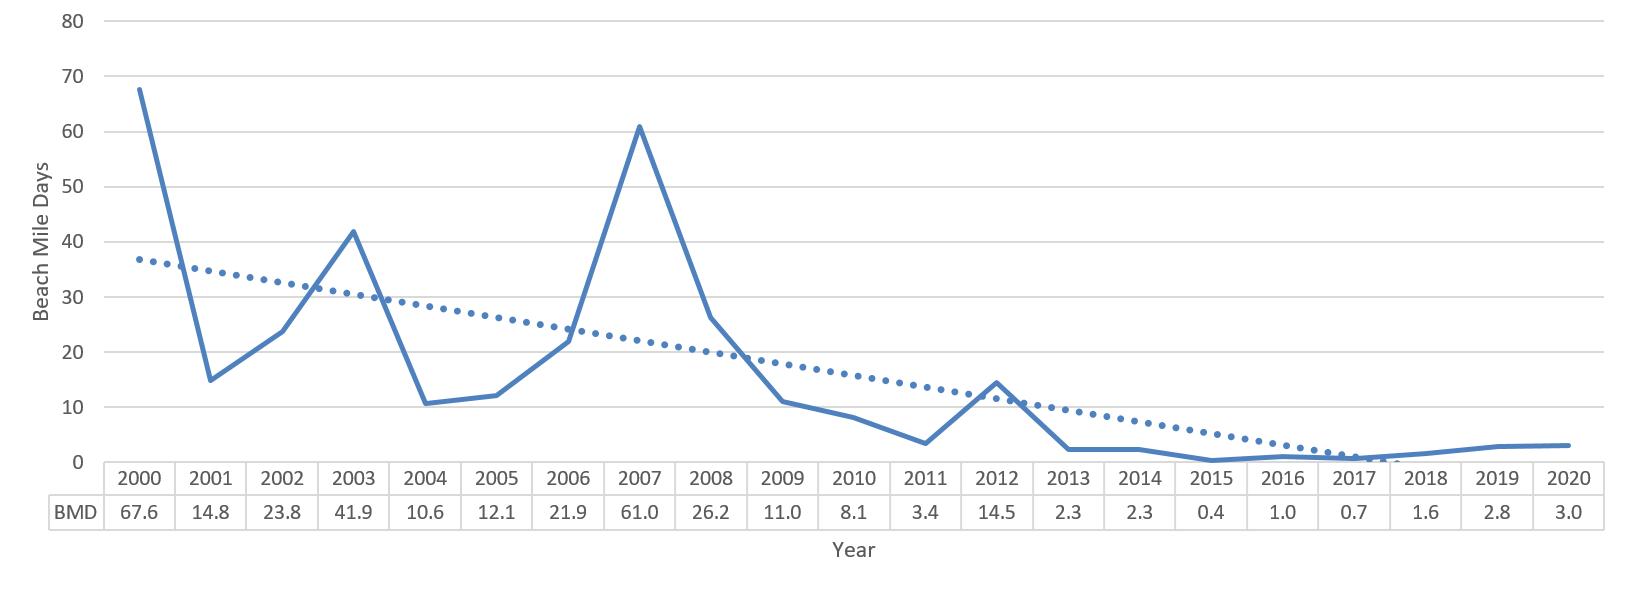
Year Posted Warnings Posting Days BMDs 2000 9 165 140.0 2001 5 191 148.4 2002 7 216 142.5 2003 6 207 116.5 2004 12 226 107.6 2005 3 123 107.9 2006 11 130 71.0 2007 13 180 36.1 2008 10 183 60.0 2009 11 117 53.3 2010 19 184 46.0 2011 9 234 121.1 2012 12 167 74.9 2013 11 19 1.8 2014 9 19 1.1 2015 11 56 3.3 2016 6 33 1.9 2017 5 13 0.8 2018 7 32 2.0 2019 8 45 12.6 2020 7 118 12.4

North
First
South
Pedestrian

Year
2000 4 128 12.4 2001 5 98 5.8 2002 7 104 6.2 2003 2 11 2.6 2004 1 2 0.3 2005 4 12 2.4 2006 4 15 3.6 2007 0 0 0 2008 3 48 12.0 2009 3 33 1.1 2010 2 3 0.6 2011 2 27 1.5 2012 2 53 13.3 2013 1 2 0.1 2014 1 2 0.1 2015 0 0 0.0 2016 0 0 0.0 2017 0 0 0.0 2018 1 2 0.1 2019 0 0 0.0 2020 0 0 0.0


Year
Warnings Posting Days BMDs 2000 3 104 5.7 2001 3 145 19.8 2002 4 153 18.8 2003 7 88 11.0 2004 7 160 12.4 2005 5 68 5.1 2006 4 104 7.8 2007 2 154 9.0 2008 6 147 11.4 2009 2 184 14.8 2010 2 179 14.0 2011 3 153 13.5 2012 2 187 23.2 2013 8 26 2.4 2014 1 3 0.2 2015 4 38 1.5 2016 3 6 0.2 2017 4 177 5.2 2018 8 44 2.1 2019 2 193 5.6 2020 7 93 3.0


2000 5 13 3.9 2001 4 13 3.8 2002 6 10 0.6 2003 4 7 0.6 2004 2 5 0.3 2005 2 4 0.2 2006 4 6 0.3 2007 3 6 0.3 2008 6 10 1.1 2009 8 20 1.1 2010 1 2 0.1 2011 7 17 1.1 2012 5 42 2.4 2013 2 4 0.2 2014 0 0 0.0 2015 8 21 1.7 2016 6 148 7.0 2017 8 66 2.5 2018 9 147 19.4 2019 17 162 18.1 2020 10 78 6.5

San Clemente City & State Beach - Number of BMDs Posted & Trend 2000 – 2020 (April 1 – October 31)

San Clemente City & State Beach - 2020 Number of Posted Warnings, Posting Days and BMDs
Station Description Postings Days BMDs
Pico Drain at North Beach 3 29 2.71
North Beach 0 0 0.0
El Portal Beach 0 0 0.0
Mariposa Beach 0 0 0.0
Linda Lane Beach 0 0 0.0
South Linda Lane Beach 0 0 0.0
450 Feet North of Pier 0 0 0.0
San Clemente Pier Up 1 2 0.15
San Clemente Pier 4 43 3.41
San Clemente Pier Down 1 2 0.15
Trafalgar Canyon Creek - “T” Street 1 2 0.11
Riviera Beach 0 0 0.0
Avenida Calafia 0 0 0.0
Las Palmaras 0 0 0.0
2000 – 2020
The following tables and graphs provide monitoring information between April 1 and October 31 for each of Orange County‘s harbor, bay and slough water areas and is arranged geographically from north to south along the Orange County shoreline. The appendix information provided for harbor, bay and slough water area includes:
Total number of posted warnings, total number of posted warning days and total number of BMDs that were posted due to AB 411 standards violations from April 1 and October 31 in 2000 – 2020; and
A trend graph depicting the total number of BMDs that the open coastal water area was posted from April 1 and October 31 in 2000 –2020.
2000 – 2020 Number of Posted Warnings, Posting Days and BMDs (April 1 – October 31)
Huntington Harbour
2000 16 100 4.7 2001 34 182 18.0 2002 24 134 7.3 2003 15 73 4.0 2004 8 31 1.2 2005 15 68 3.5 2006 21 110 6.1 2007 8 16 0.8 2008 12 34 1.7 2009 5 18 1.0 2010 4 6 0.2 2011 8 19 1.0 2012 4 12 0.7 2013 12 28 0.8 2014 7 12 0.7 2015 10 20 1.0 2016 9 11 0.6 2017 10 15 0.8 2018 8 9 0.5 2019 5 8 0.2 2020 16 117 5.1


Newport Bay
2000 56 929 32.0 2001 68 931 39.0 2002 43 905 35.6 2003 40 730 32.3 2004 31 768 31.5 2005 21 719 28.8 2006 30 492 26.7 2007 18 471 25.0 2008 15 246 13.2 2009 19 266 13.3 2010 18 307 14.2 2011 25 267 14.5 2012 22 263 13.9 2013 21 249 13.2 2014 19 295 13.8 2015 17 271 15.0 2016 10 330 13.9 2017 21 290 14.0 2018 21 310 15.4 2019 18 272 15.4 2020 28 370 16.1


2001 – 2020 Number of Posted Warnings, Posting Days and BMDs (April 1 – October 31)
Newport Slough
2001 6 324 3.5 2002 5 181 2.1 2003 6 111 1.4 2004 3 96 1.1 2005 2 15 0.2 2006 10 61 0.7 2007 1 2 0.1 2008 4 13 0.1 2009 3 6 0.1 2010 2 6 0.1 2011 1 1 0.1 2012 3 12 0.1 2013 1 2 0.1 2014 2 28 0.3 2015 1 2 0.1 2016 0 0 0.0 2017 2 2 0.1 2018 2 3 0.1 2019 5 24 0.3 2020 0 0 0.0


2000 – 2020 Number of Posted Warnings, Posting Days and BMDs (April 1 – October 31)
Dana Point Harbor
2000 10 206 7.9 2001 8 420 20.0 2002 9 410 19.2 2003 8 298 12.3 2004 9 362 18.6 2005 6 322 14.3 2006 14 264 10.4 2007 9 27 0.5 2008 6 13 0.2 2009 5 53 0.7 2010 12 74 1.0 2011 8 59 2.2 2012 14 82 1.9 2013 10 41 1.4 2014 1 5 0.3 2015 4 9 0.2 2016 3 25 0.4 2017 4 45 0.5 2018 8 36 0.6 2019 12 71 1.0 2020 9 97 3.8


The following table lists both the total annual number of unauthorized discharges of waste reported to the HCA and the total number of ocean, harbor and bay water closures from 1987 –2020. The total number of unauthorized discharges of waste reported is categorized by sewage type and by waste discharge causes for each year. The total number of ocean, harbor and bay water closures is categorized by waste type and closure causes. In addition, the total number of BMDs for ocean, harbor and bay water closures from sewage spills and miscellaneous causes is shown for 1999 – 2020.

1987
Total Number of Discharges 63 83 59 76 101 118 97 125 120 170 226 252 276 377 412 522 534
By Waste Type
Raw Sewage 60 83 58 70 96 108 91 112 111 117 142 205 236 331 378 404 392
Primary Treated Effluent 0 0 1 0 0 0 1 1 0 1 1 0 0 1 0 0 0
Secondary Treated Effluent 0 0 0 3 3 5 0 2 3 1 10 12 2 6 9 3 6
Tertiary Treated Effluent 0 0 0 1 1 4 3 5 5 47 68 28 31 37 25 114 135
Miscellaneous 3 0 0 2 1 1 2 5 1 4 5 7 7 2 0 1 1
Pipeline Breaks 16 12 13 25 11 17 21 18 20 57 61 60 38 51 60 92 133
Pipeline Blockages 26 42 32 34 72 86 61 89 72 65 118 139 210 288 308 409 358
Pump Station Failures 14 26 13 12 12 6 9 9 8 24 15 16 14 8 15 11 17
Treatment Plant Discharges 0 1 0 2 2 3 0 2 3 1 1 2 0 0 4 2 4
Storm Surcharge 0 0 0 0 0 1 2 0 10 0 4 14 0 1 0 3 6
Vessel Pump Stations 0 0 0 0 0 0 1 0 0 1 0 0 0 4 9 3 6
Miscellaneous 7 2 1 3 4 5 3 7 7 22 27 21 14 25 16 2 10
Total
By Waste Type
Raw Sewage 362 357 333 287 257 199 180 180 171 165 153 130 127 106 79 100 65
Primary Treated Effluent 2 0 0 0 1 2 3 0 0 0 1 0 0 0 6 19 20
Secondary Treated Effluent 10 9 7 6 4 6 3 0 2 2 3 2 1 3 1 1 0
Tertiary Treated Effluent 122 112 113 101 121 113 102 128 142 132 3 3 0 0 0 0 2 Miscellaneous 0 1 1 0 4 1 2 1 0 1 0 1 1 0 1 3 1
Pipeline Breaks 114 128 113 94 108 90 118 110 112 103 13 8 10 9 4 10 8
Pipeline Blockages 329 289 277 225 215 170 135 154 140 136 119 110 113 80 69 84 60
Pump Station Failures 12 7 15 10 13 4 8 6 10 5 11 4 2 6 1 0 3
Treatment Plant Discharges 9 4 6 4 9 11 6 1 3 2 0 1 1 1 0 2 0
Storm Surcharge 2 7 3 3 3 1 11 2 0 2 2 1 1 4 0 2 0
Vessel Pump Stations 9 4 1 3 1 1 0 0 0 0 2 1 0 0 1 1 1
Miscellaneous 21 41 39 55 38 44 12 36 50 51 13 5 2 9 12 24 16
The following table provides a summary of each sewage spill that resulted in an ocean, harbor or bay water closure in 2019 and 2020. The table shows the closure dates; number of days closed; number of Beach Mile Days of the closure; the ocean, harbor or bay water area that was closed; the responsible agency or a private property owner (PPO) responsible for the closure; the cause of the sewage spill closure; and the estimated volume of sewage spilled, recovered and released to the ocean, harbor or bay water area.

1 2/6/18 1/6/19 2 1.22 Bayside Dr. Beach to China Cove
2 3/13/18 1/12/19 3 0.282 250’ upcoast to 250’ downcoast from the projection of Upland Road
3 3/31/18 3/23/19 3 1.83 Bayside Dr. Beach to China Cove
4 4/13/18 8/30/19 1 4.51
Anaheim Bay, Sunset Aquatic Marine, Portofino Cove, Anderson St. Marina, Mother’s Beach & Admiralty Dr.
5 5/31/18 9/27/19 1 0.11 North Star Beach
6a 6/18/18 12/2/19 5 57
Pelican Point at Crystal Cove to Poche Creek in Dana Point/San Clemente 11/29/19 - Reduced to: Closure of El Morro Creek to the southernmost point of Dana Strands
6b 8/14/18 12/2/19 5 *Included in BMD above City of Laguna Beach/Debris in main line
City of Newport Beach/line blockage due to roots and grease
City of Laguna Beach/main line blockage due to roots
City of Newport Beach/Grease interceptor overflow
City of Stanton Public Works/ Sewer main blockage
~425 gallons/sewage ~50 gallons recovered ~375 gallons released
~600 gallons/sewage ~300 gallons recovered ~300 gallons released
~600 gallons/sewage ~300 gallons recovered ~300 gallons released
~60,000 gallons/sewage (~60,000 recovered)
City of Newport Beach/Sewer main blockage ~0 released
City of Laguna Beach/Force main breakage
City of Laguna Beach/Debris in the main line
~1,400,000 gal/sewage ~0 gallons recovered ~1,400,000 gallons released
~900 gallons/sewage ~0 gallons recovered ~900 gallons released
1 6/7/20 1/6/19 3 0.36
2 6/22/20 1/12/19 3 1.62
The ocean water from Sleepy Hollow Lane to Cleo Street in the City of Laguna Beach
All of Huntington Harbour
PPO/Sewage tank pump motor failure
City of Huntington Beach/ Break in the force main
~600 gallons/sewage ~0 gallons recovered ~600 gallons released
~100 gallons/sewage ~0 gallons recovered ~100 gallons released
