CLIENT Informational PACKET


Jordan
D. 513.878.7735


jordan.dickman@marcusmillichap.com

nicholas.andrews@marcusmillichap.com
austin.sum@marcusmillichap.com

01 - current inventory
Andrews
Vice President Investments Cincinnati Office
LEAD AGENTS Nick
First
D. 513.878.7741
Dickman
President Investments Cincinnati Office
First Vice
Austin Sum Senior Associate Cincinnati Office
D. 513.878.7747
02 - the marcus advantage 03 - Q4 MARKET TRENDS
SECTIONS
“OUR COMMITMENT IS TO HELP OUR CLIENTS CREATE AND PRESERVE WEALTH BY PROVIDING THEM WITH THE BEST REAL ESTATE INVESTMENT SALES, FINANCING, RESEARCH AND ADVISORY SERVICES AVAILABLE.”

CURRENT INVENTORY
01


CALABASAS, CALIFORNIA | HQ 2,500 | EMPLOYEES 80+ | OFFICES
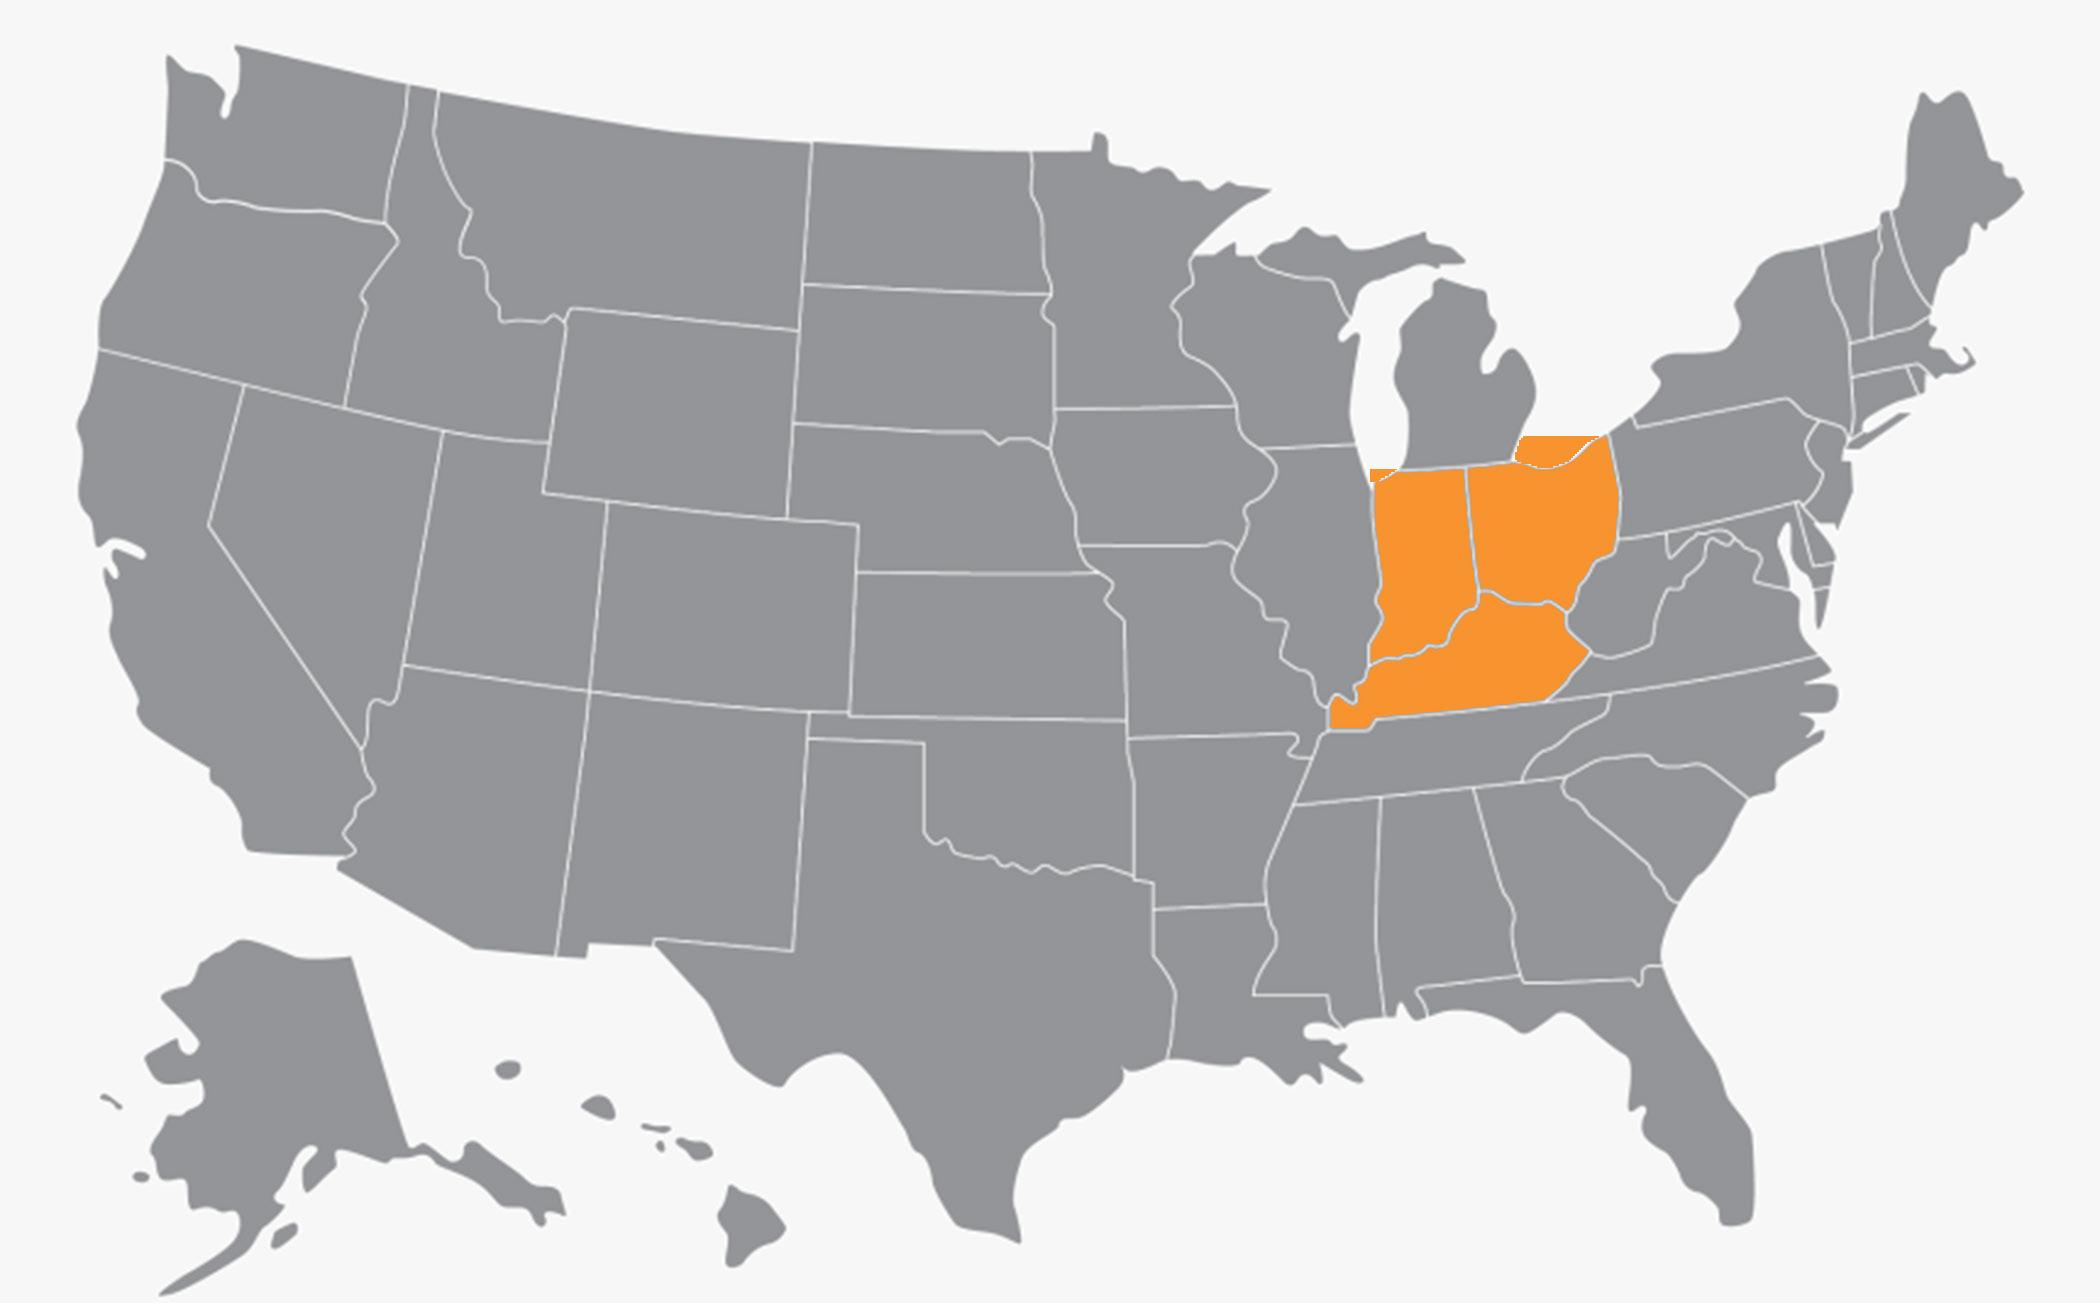
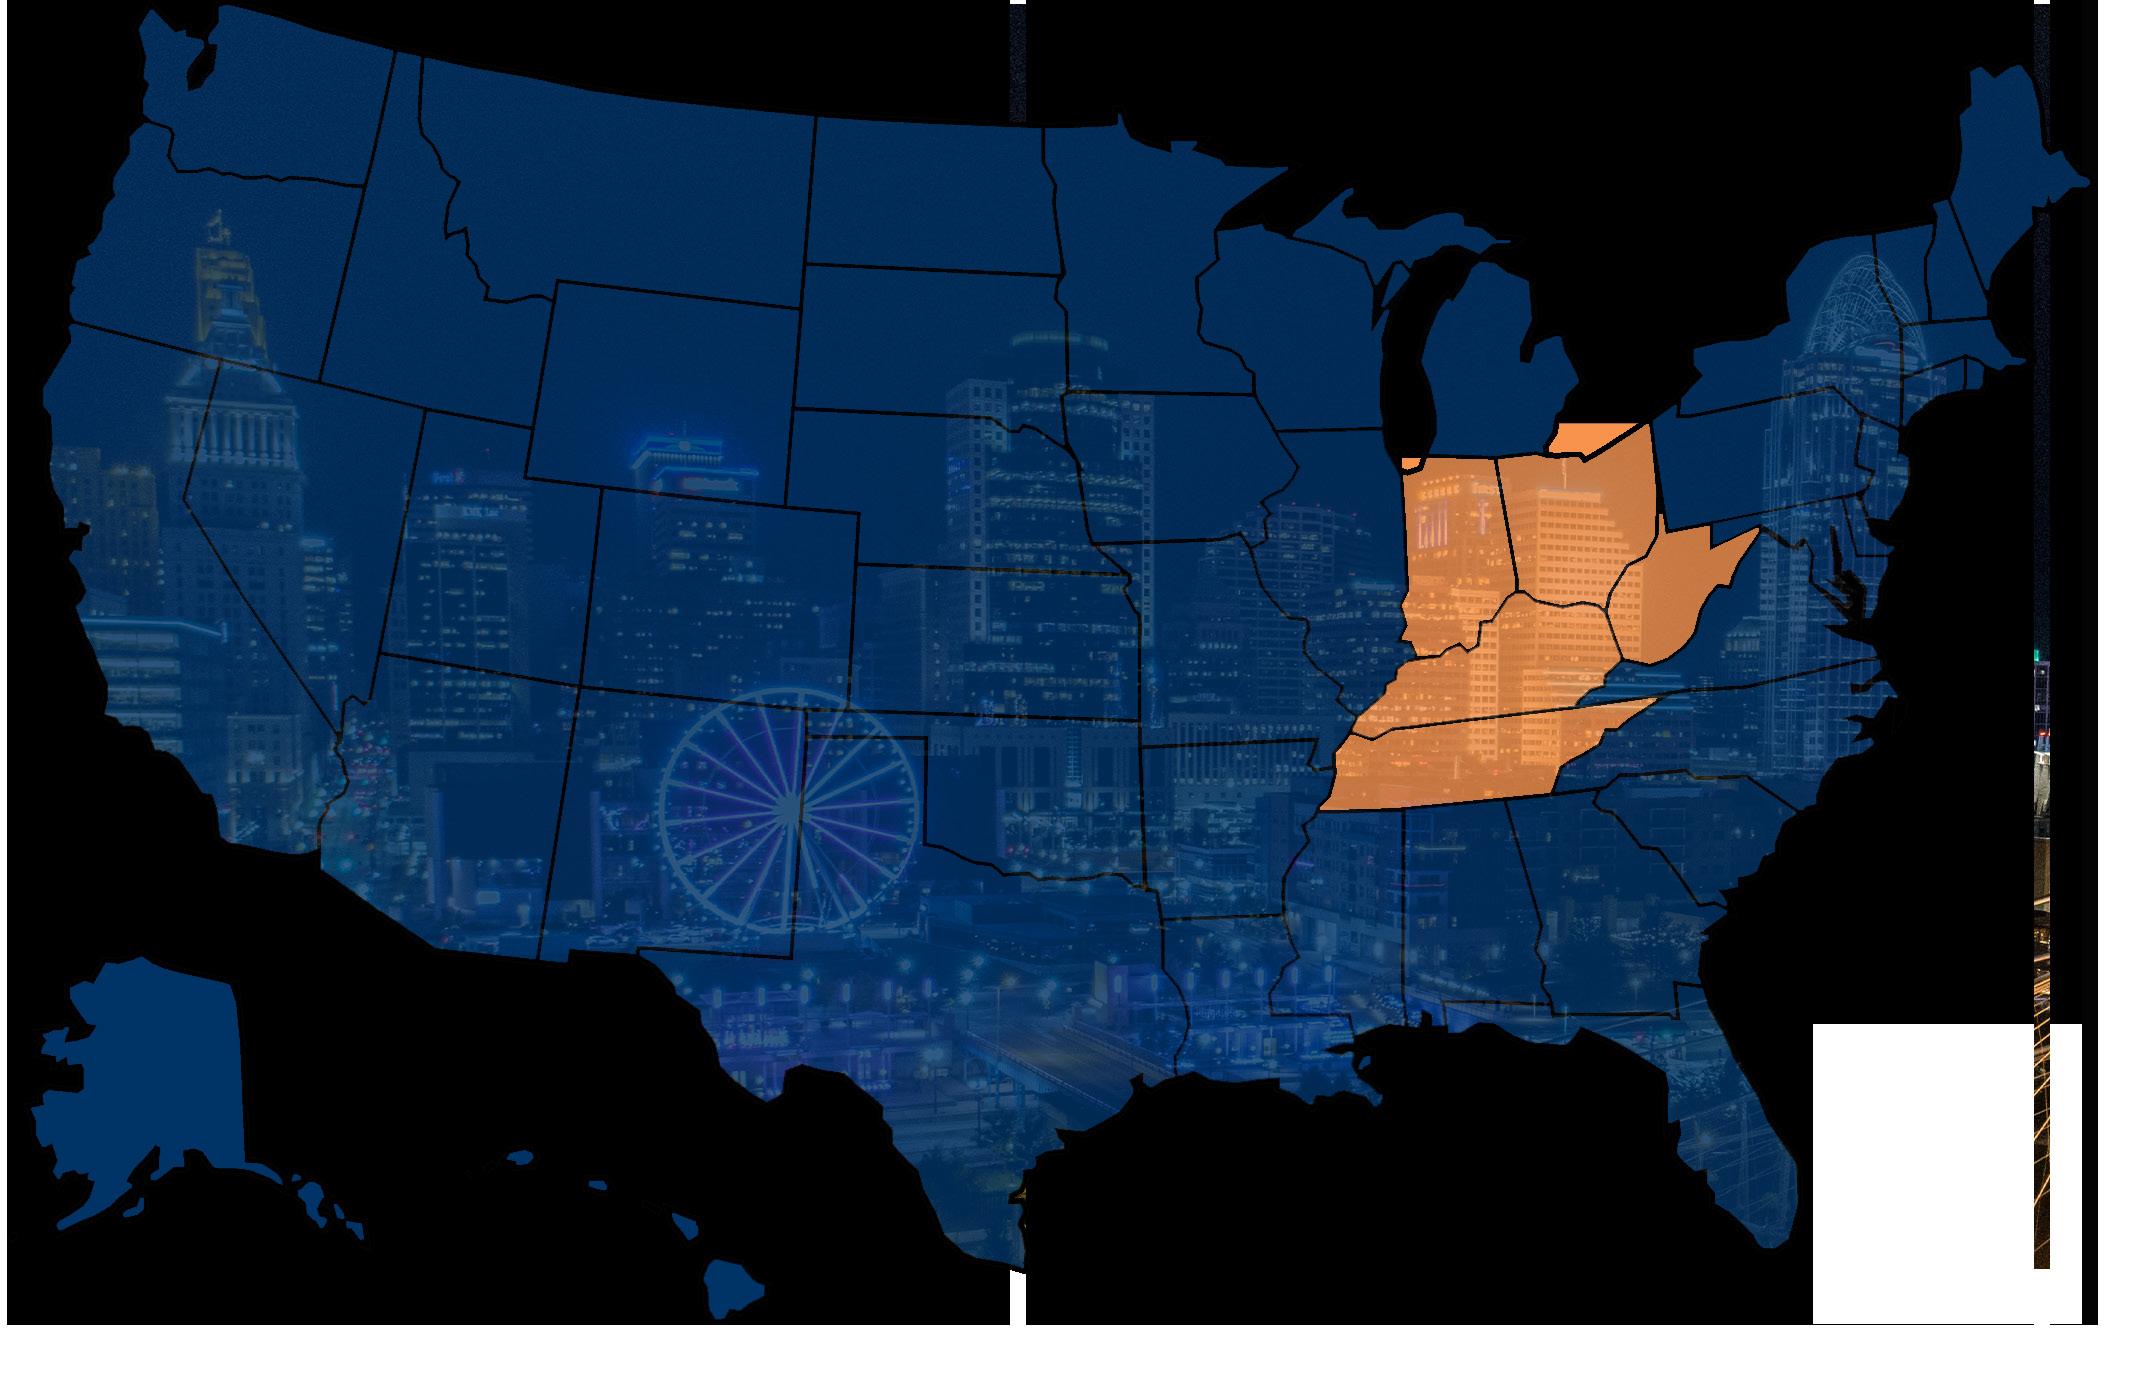
UNRIVALED SUCCESS IN THE MIDWEST
YOUR TEAM
JORDAN DICKMAN
FIRST VICE PRESIDENTS DIRECTOR, NMHG
NICK ANDREWS
FIRST VICE PRESIDENTS DIRECTOR, NMHG
AUSTIN SUM
SENIOR INVESTMENT ASSOCIATE
JD SCHMERGE INVESTMENT ASSOCIATE
BRIAN JOHNSTON INVESTMENT ASSOCIATE
TIM VANWINGERDEN INVESTMENT ASSOCIATE
AUSTIN Hall INVESTMENT ASSOCIATE
ALDEN SIMMIS INVESTMENT ASSOCIATE
BROKER SUPPORT
SAM PETROSNIO
VALUATION & RESEARCH
CORPORATE SUPPORT
LIZ POPP
MIDWEST OPERATIONS MANAGER
JOSH CARUANA
VICE PRESIDENT
REGIONAL MANAGER
INDIANAPOLIS | CINCINNATI | LOUISVILLE | ST LOUIS | KANSAS CITY
JOHN SEBREE
SENIOR VICE PRESIDENT
NATIONAL DIRECTOR
NATIONAL MULTI HOUSING GROUP
MICHAEL GLASS
SENIOR VICE PRESIDENT
MIDWEST DIVISION MANAGER
NATIONAL DIRECTOR, MANUFACTURED HOME COMMUNITIES GROUP
SKLYER WILSON
CLIENT RELATIONS MANAGER
BRITTANY CAMPBELL-KOCH
DIRECTOR OF OPERATIONS
ALEX PAPA
MARKETING COORDINATOR
2022 YEAR END REVIEW


UNDER CONTRACT
CLOSED
82M | 1,100 UNITS 278M
MARKET CLOSED IN CINCINNATI | DAYTON | LOUISVILLE | LEXINGTON | COLUMBUS | WEST VIRGINIA OH KY | MULTIFAMILY
3,100 UNITS CLOSED

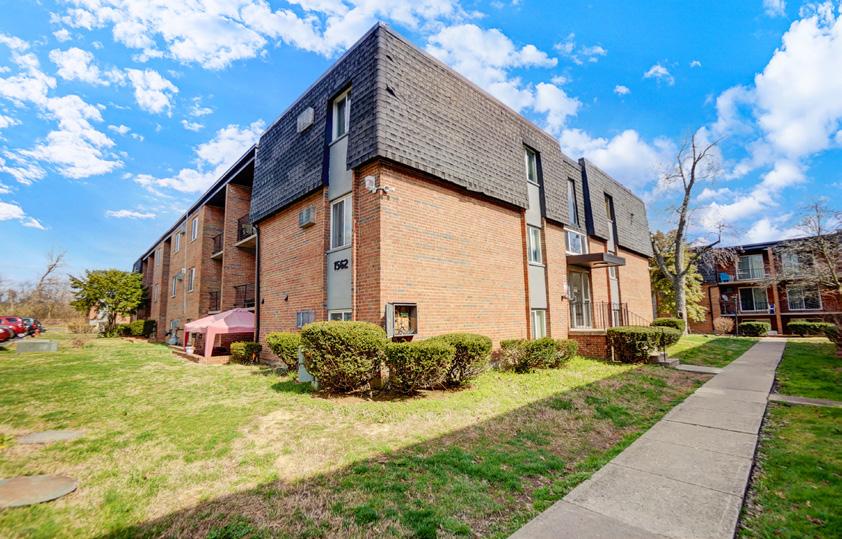
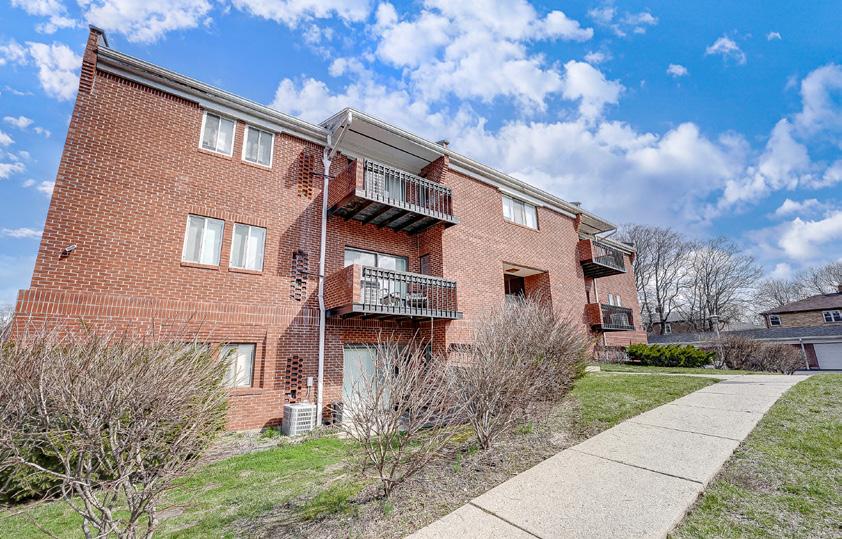
19 properties $280m in volume exclusive inventory available MIDWEST CINCINNATI, OHIO LOUISVILLE, KENTUCKY DAYTON, OHIO
KY
LEXINGTON,

* UNION SQUARE | 255 * THE DISTILLERY * THE AUGUST | 120 UNITS * CANE RUN | 152 UNITS * STAR ON SOUTHSIDE | 150 UNITS * CRESTWOOD COMMONS | 216 UNITS * NORSE LANDING | 130 UNITS * THE GEM | 56 UNITS * LAKESHORE | 265 UNITS * CIMARRON WOODS | 292 BEDS * 145 UNIT PORTFOLIO | 145 UNITS * ROYAL THE 222 | 9 PROPERTIES * * HARRISON WOODLAWN | 28 UNITS UNION HILL | 100 UNITS * AVONDALE 69 | 69 UNITS MOSS CREEK | 104 UNITS * 5661 GLENWAY | 20 UNITS GEQ | 319 UNITS GOBEL WORTHINGTON | 20 TROTWOOD VILLAS | 32 UNITS

900 ON LEE | 65 UNITS * 255 UNITS MEADOWCREEK | 256 UNITS * THE LANDING | 112 UNITS * DISTILLERY | 232 UNITS OAKS AT PEA RIDGE | 204 UNIT * PROPERTIES UNITS
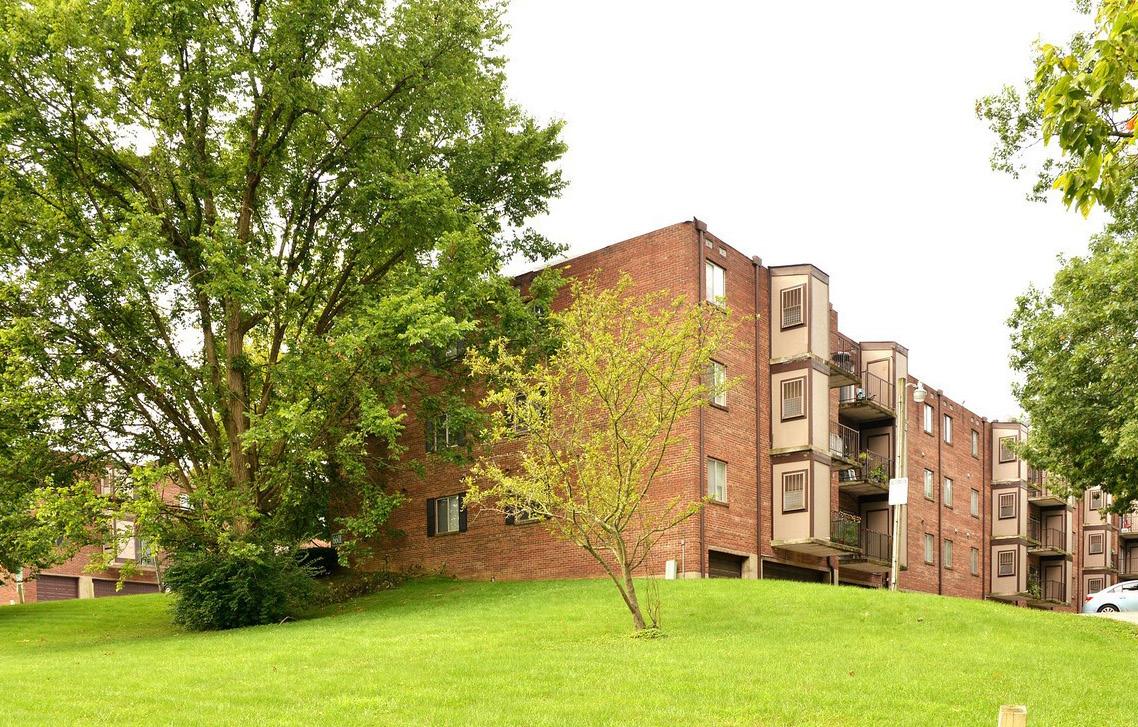
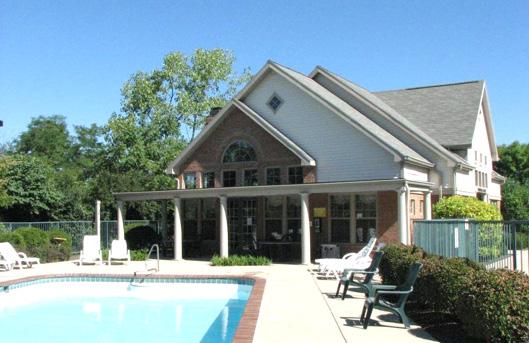
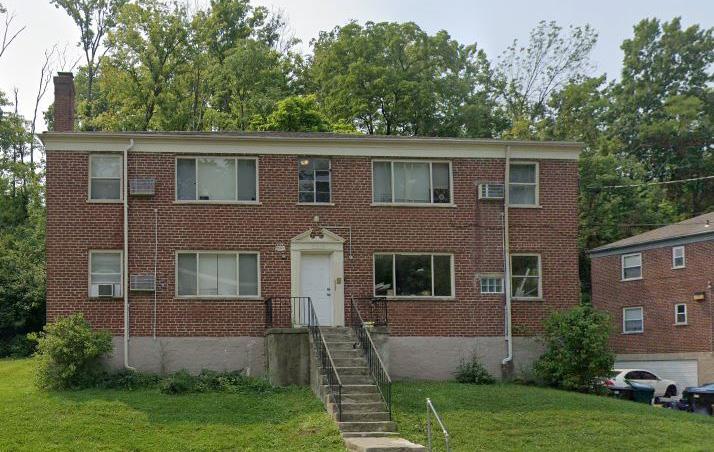

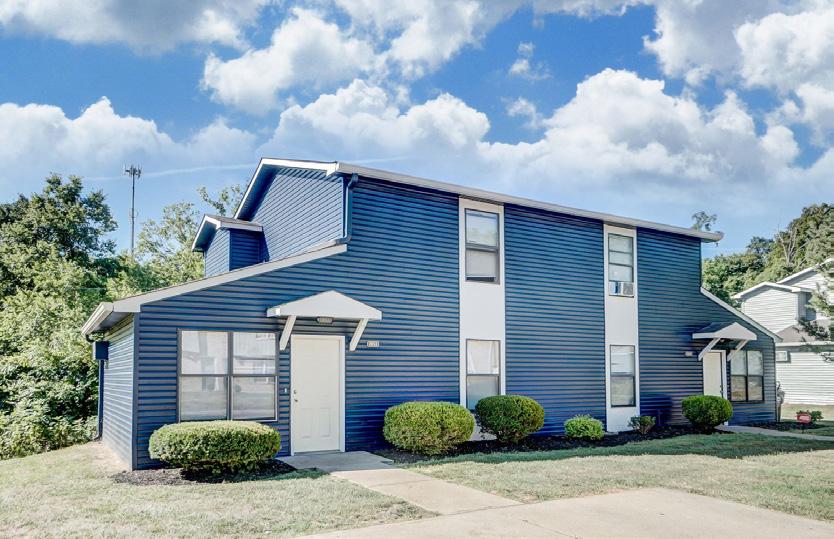
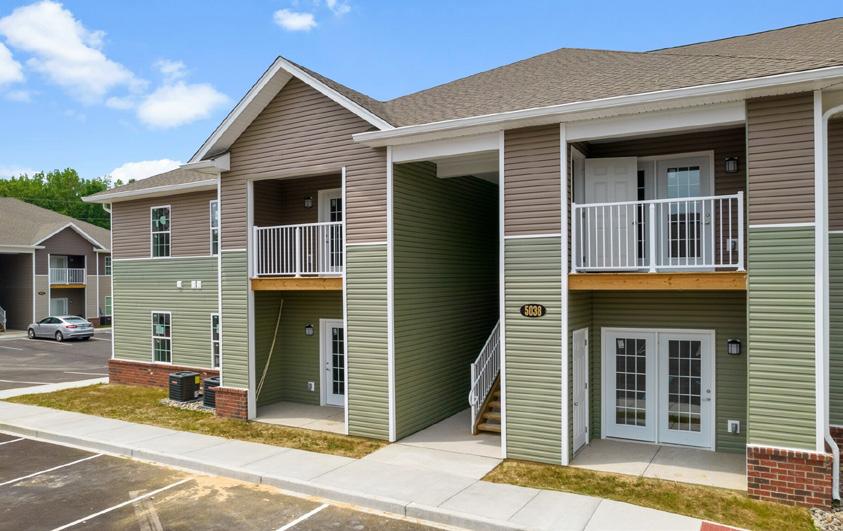
AVAILABLE LISTINGS THE 222 | AVONDALE, WESTSIDE | 9 PROPERTIES 222 UNITS BERKSHIRE APTS | MT. WASHINGTON | 1980 65 UNITS UNION HILL | DAYTON, OH | 1992 100 UNITS NORTHCREEK | CINCINNATI OH | 1973 LAKESHORE PATTERSON | DAYTON OH | 1966,1963 141 UNITS 124 UNITS GOBEL WORTHINGTON | WESTWOOD | 1951 GEQ | CINCINNATI, OH | 1950s, 1970s 20 UNITS 319 UNITS NORSE LANDING | COLD SPRING, KY | 1995 CANE RUN | LOUISVILLE, KY | 2021 130 UNITS 152 UNITS OH KY | MULTIFAMILY
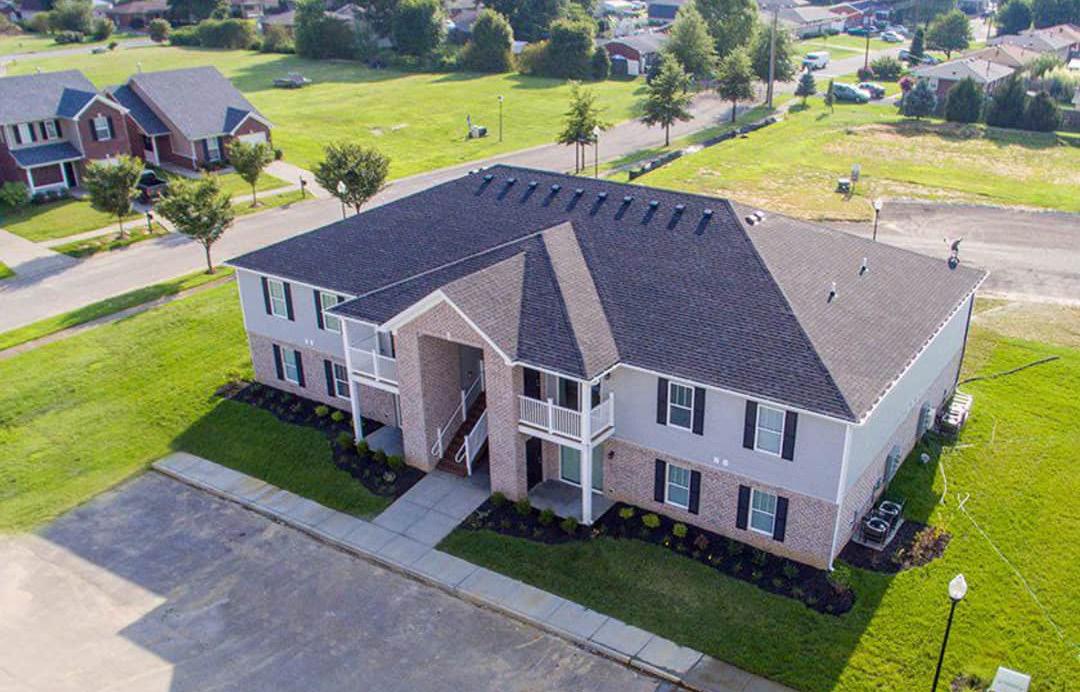
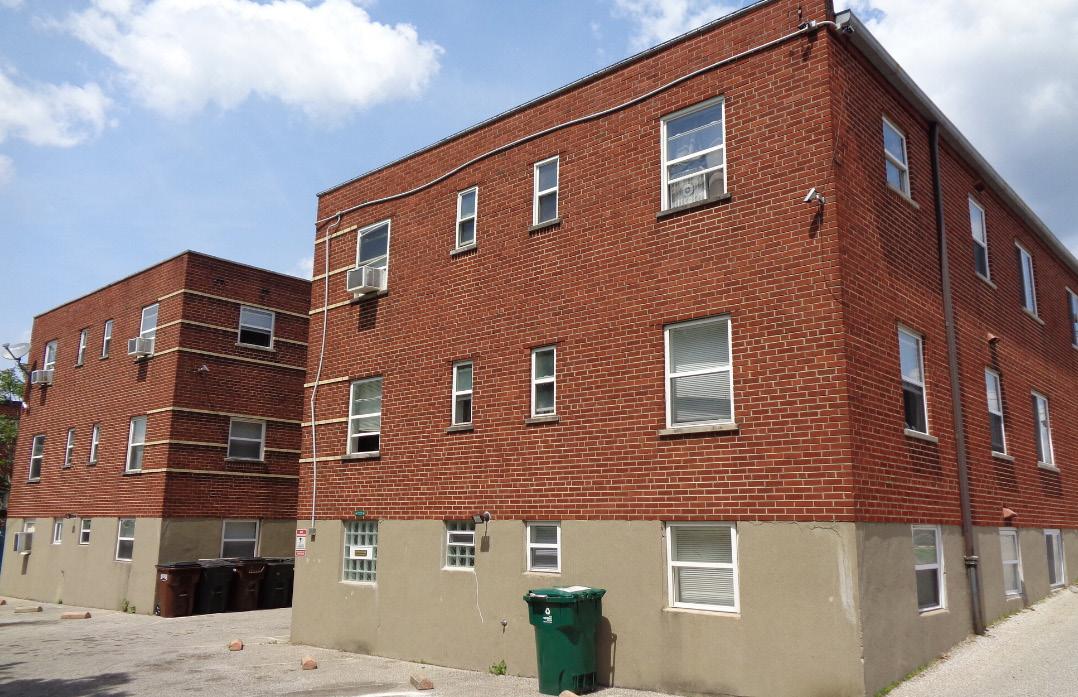
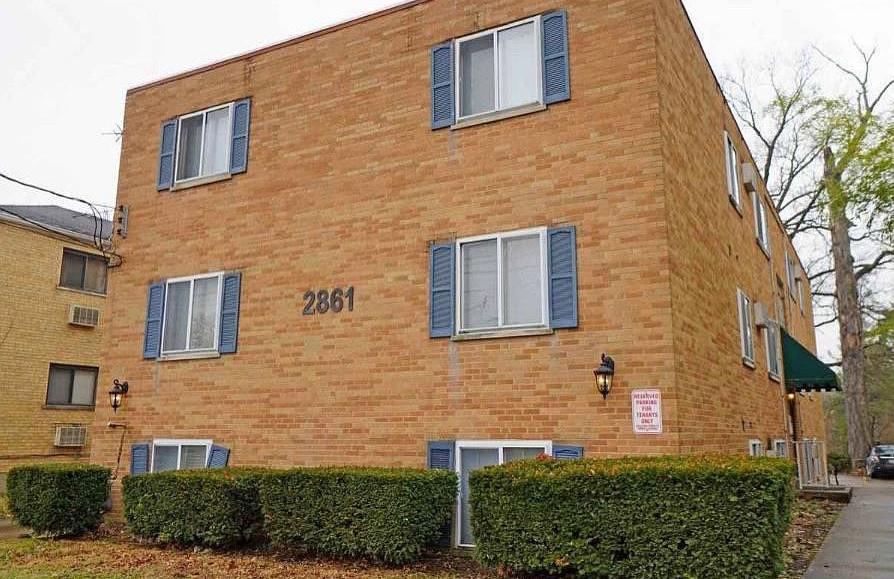
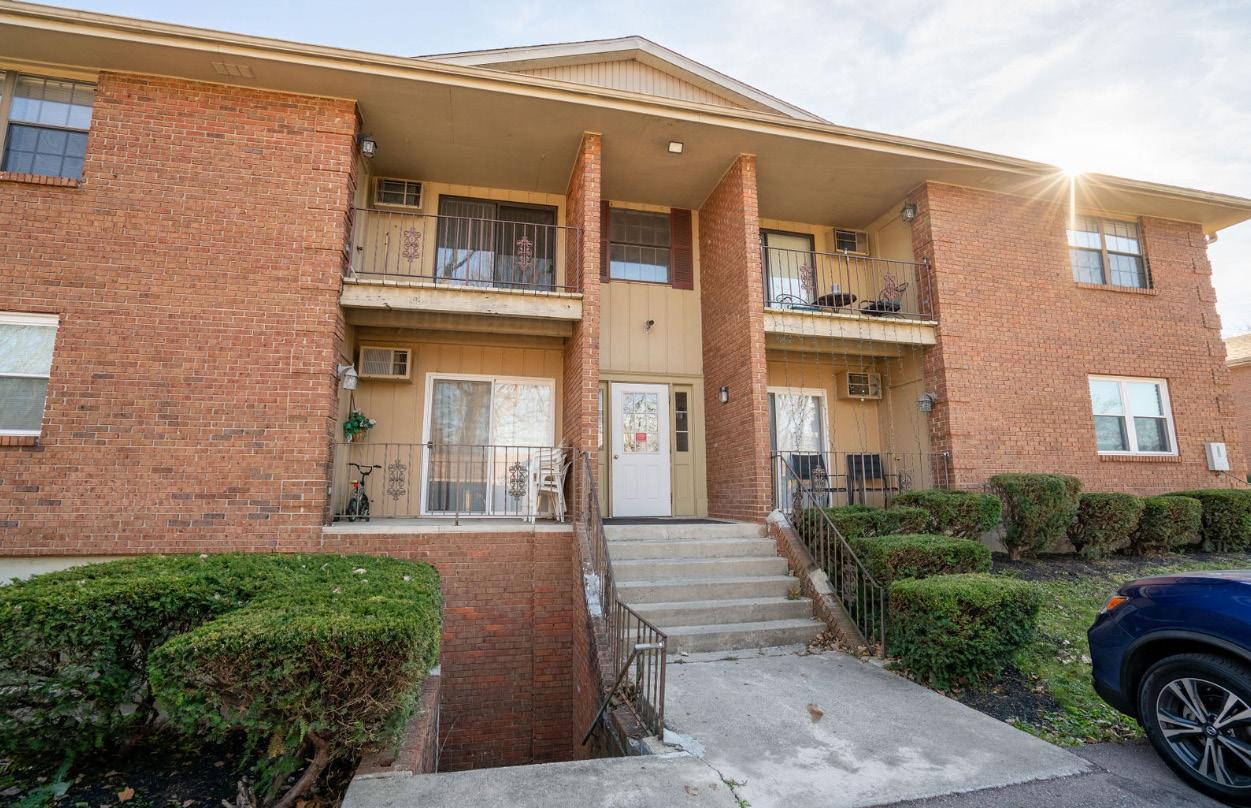
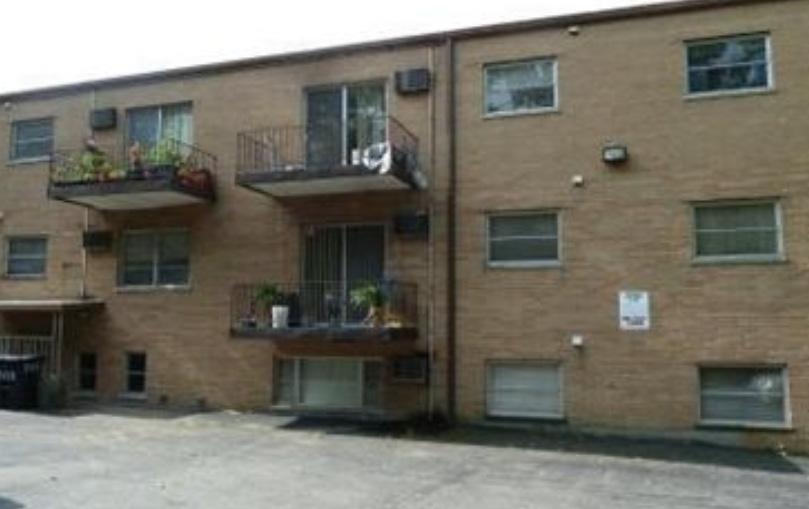
AVAILABLE LISTINGS MOSS CREEK | LOUISVILLE, KY | 2020 104 UNITS ROYAL OAKS | HUNTINGTON, WV | 2008 204 UNITS AVONDALE 69 | AVONDALE OH | 1920 69 UNITS THE FLATS | CINCINNATI, OH | 1960 HIGHLAND PARK | TRIADELPHIA, WV | 2017 56 UNITS 222 UNITS 5661 GLENWAY | WESTWOOD | 1951 2861 HARRISON AVE | WESTWOOD | 1972 20 UNITS 12 UNITS TROTWOOD VILLAS | TROTWOOD OH | 1973 503 WOODLAWN | EAST PRICE HILL | 1965 32 UNITS 16 UNITS OH KY | MULTIFAMILY
SELECT CLIENTS


SELECT CLIENTS


THE MARCUS ADVANTAGE
02
value of recently closed
$84.4 billion transactions in most recent year

AREN’T
GEOGRAPHIC BOUNDARIES

INBOUND / OUTBOUND
$2.1B - MW. OUTBOUND

$3.8B - MW. INBOUND
$9.2BB - W. OUTBOUND
$1.6B - W. INBOUND
$3.1B - S. OUTBOUND
$7.8B - S. INBOUND
$1.8B - TX/OK OUTBOUND

$6.4B - TX/OK INBOUND
$6.4B - NE. OUTBOUND
$1.4B - NE. INBOUND
$3.3B - MOUNTAIN OUTBOUND
$5.0B - MOUNTAIN INBOUND
BOUND BY
GLOBAL CAPITAL GROUP
The Marcus & Millichap GLOBE Capital Group provides the opportunity to expose your property to more foreign buyers with the guided expertise of our senior investment specialists. Our firm is comprised of 80+ offices throughout the US and Canada, and we provide investors with exclusive investment opportunities, financing capabilities, research, and advisory services.
& MILLICHAP
MARCUS
$22.58
FRANCE
$49.65 BILLION CANADA $808 MILLION $4.84 BILLION $6.82 BILLION $10.87 BILLION
BILLION $5.80 BILLION $2.08 BILLION $2.14 BILLION
GERMANY CHINA JAPAN
SOUTH K
SINGAPORE ISRAEL
SWITZERLAND
OREA
INVESTMENT OPTIONS & OPPORTUNITIES
The success of Marcus & Millichap is based on our collaborative culture of information sharing across our network of more than 2,000 investment professionals, which maximizes value for each of our clients.
Working with a unique platform that is antithetical to the concept of “pocket listings,” our investment professionals share all listings with the entire Marcus & Millichap team. Each professional specializes in a property type and has a database of local properties and owners, which is leveraged in every client assignment. Because each local agent specializes in a single product type in a specific geographic region, our clients have exposure across the U.S. and Canada with every investment..
Our foundation of information sharing maximizes pricing for our clients and gives us the largest inventory of any firm in the industry.
THE SIZE AND ACCESSIBILITY OF OUR INVENTORY ENABLES YOU TO SELL YOUR PROPERTY AND QUICKLY MOVE INTO ANOTHER PROFITABLE INVESTMENT.

2,000+

INVESTMENT PROFESSIONALS
VALUE OF RECENTLY CLOSED TRANSACTIONS IN MOST RECENT YEAR
#1 choice in multifamily
Marcus & Millichap’s National Multi Housing Group (NMHG) provides the industry’s most dynamic and effective marketplace for the acquisition and disposition of apartment properties. With multifamily specialists in offices throughout the U.S. and Canada, NMHG is the industry leader in apartment transactions, having successfully executed on our clients’ behalf more than $106 billion of sales volume in the past five years.

13,255


TRANSACTIONS IN MOST RECENT YEAR
$84.4B
VOLUME IN MOST RECENT YEAR
6.73 TRANSACTIONS CLOSED EVERY BUSINESS HOUR
CBRE
MARCUS & MILLICHAP
CUSHMAN & WAKEFIELD
JLL NKF NAI
LEE & ASSOCIATES COLDWELL BANKER 4,400 3,311 2,169 1,626 1,550 1,414 961 918 600 593
COLLIERS INTERNATIONAL
KELLER WILLIAMS
PLANNING FOR THE FUTURE. EXECUTING TODAY.
Our cutting-edge market research helps us advise our clients of existing asset performance and future opportunities.


ATTRACTING THE TARGET BUYER


To successfully execute a marketing campaign, it is critical to understand the likely buyer profiles that will be attracted to the asset, in addition to their respective approval process, corporate structure and underwriting methodology.


Whether it be a private investor, pension fund advisor, sponsored capital group, family office, or a discretionary fund manager, every investment group has an approval process/corporate structure that dictates their ability to process with a transaction. We pride ourselves on maintaining vast and deep relationships with each of the buyer profiles that are active in the market place today coupled with a thorough under standing of their required investor returns and standards of underwriting.

$731M $1.6B $427M $431M $645M $127M
PREMIER ACCESS TO INVESTOR PROFILES
1ST TIER INVESTORS
Pension funds, advisors, banks, REITs, and life insurance companies
2ND TIER INVESTORS
Syndicates, developers, merchant builders, general partnerships, and professional investors


FOREIGN & INTERNATIONAL BUYERS
Foreign investors seeking domestic opportunities and technology enablers that direct foreign demand
1031

EXCHANGE CAPITAL


Investors seeking acquisition opportunities for capital gains tax deferral
CROSS-PRODUCT CAPITAL
Opportunistic investors seeking diversification in other real estate property types
3RD TIER INVESTORS
Private, individual investors who account for the majority of transactions in the marketplace
Q4 MARKET TRENDS
03

CINCINNATI

More than $202.6 million in investments are planned in Ohio, through funding from the states Ohio Tax Credit Authority (TCA). The TCA approved 14 new projects which are slated to create $99.7 million in new payroll and 1,663 new jobs and also retain another 3,457 jobs across the state. In the Cincinnati area, the impact will be seen in Springdale, within the North Cincinnati submarket.
MARKET UPDATE AS OF RECENT,
Here, liquid sugar company Pennsylvania-based Sugaright LLC plans to create 39 new jobs and generate $2 million in new annual payroll, according to local news. The company’s new refinery in Hamilton County will produce sucrose products for baked goods and will receive a 1.066% tax credit for seven years.
As seen in many markets around the country, the Cincinnati apartment market gave back much of the absorption gains achieved in 2021 following the COVID-19 pandemic lockdowns. In the first two quarters of 2022, Cincinnati recorded basically no demand, followed by net move outs in 3rd quarter and 4th quarter.
Net move-outs totaled 1,253 units in 2022, driven down by 764 net move-outs recorded in the October to December time period. Although down from doubledigit growth in the previous three quarters, annual rent growth has been at record
highs for the past six quarters. Class B led the market with an 11.0% year-overyear increase in effective asking rents, followed by a 9.2% bump in Class A rents and a 9.1% increase (a record high) in Class C units. Every submarket continued to post hefty rent hikes, ranging from 7.0% in West Cincinnati to 11.9% in North Cincinnati. Completions in Cincinnati totaled 2,249 units in 2022, and with 176 units removed from stock, inventory grew 1.3%, on net.
CINCINNATI

4TH QUARTER SNAPSHOT

Cincinnati recorded net move-outs from 764 units during 4th quarter 2022, in what is usually a seasonally strong period, while inventory grew by 457 units. Annually, the market recorded net moveouts from 1,253 units and inventory expanded by 2,249 units. In turn, occupancy fell 0.7 points quarter-over-quarter and 2.0 points year-over-year, with the 4th quarter 2022 occupancy rate landing at 96.2%. On the pricing side, effective asking rents increased 0.4% quarter-over-quarter and 9.9% year-over-year. As of 4th quarter 2022, effective asking rental rates in Cincinnati averaged $1,304 per month, or $1.399 per square foot.
DAYTON
LEXINGTON
Quarterly Rent Growth – 0.3% Rent- $1,077 Rent/SF- $1.182 Occupancy- 96.2% Units Completed in last 4 quarters- 412 Annual Supply Growth- 0.7% Units under construction- 886 Projected Supply growth- 1.17% YTD 2022 Job Change- 2,900
Rent Growth- 0.4% Rent- $1,304 Rent/SF- $1.399 Occupancy- 96.2% Units Completed in last 4 quarters- 2,249 Annual Supply Growth- 1.3% Units under construction- 6,462 Projected Supply growth- 2.82% YTD 2022 Job Change- 12,800 LOUISVILLE Quarterly Rent Growth: -0.3% Rent- $1,154 Rent/SF- $1.219 Occupancy- 95.0% Units Completed in last 4 quarters- 2,157 Annual Supply Growth- 2.3% Units under construction- 1,159 Projected Supply growth- 1.12% YTD 2022 Job Change- 28,200
Quarterly
Quarterly Rent Growth-: -1.1% Rent- $1,140 Rent/SF- $1.239 Occupancy-
Units Completed in last 4 quarters- 369 Annual Supply Growth- 0.8% Units under construction- 920 Projected Supply growth- 0.8% YTD 2022 Job Change- 6,200
95.2%
CINCINNATI OVERVIEW
ECONOMY

1| Prior to the pandemic, Cincinnati’s real gross metropolitan product grew at an average annual rate of 1.9% from 2015 to 2019. During that same fiveyear period, job growth averaged 1.4% annually, with roughly 15,500 jobs added on average each year. In 2020, COVID-19 mitigation measures and limited business activity caused the local economy to contract as much as 9.4% year-over-year in 2nd quarter. 2| In 2022, the metros inflation-adjusted economic output contracted 0.4%. At the same time, the metro recorded a net gain of 12,800 jobs, expanding the employment base 1.2%.
CAPITAL MARKETS

1| Transaction dollar volumes in Cincinnati totaled roughly $520.8 million in 2022, down about 22% year-over-year. 2| Meanwhile, the number of transactions decreased about 40% over the past year, with 31 apartment properties trading hands. 3| Transactions in 2022 yielded an average cap rate of 5.39%, down 34 basis points year-over year. By comparison, cap rates averaged 5.05% in the Midwest region and 4.54% nationally. 4| Meanwhile, the average price per unit in Cincinnati came in at roughly $170,200, up 66.0% annually.
1| Over the past five years, annual change in effective asking rents in Cincinnati ranged from 1.7% to 11.9%. 2| In 4th quarter 2022, effective asking rents for new leases were up 9.9% year-over- year. That annual rent performance was above the market’s five-year average of 5.0%. 3| Looking at product classes in Cincinnati, in 4th quarter 2022 annual effective rent change registered at 9.2% in Class A units, 11.0% in Class B units and 9.1% in Class C units. 4| Among submarkets, the strongest annual rent change performances over the past year were in North Cincinnati and Butler County. In the coming year, samestore effective asking rent change in Cincinnati is expected to slow from the current level.
RENT
0 500 1,000 1,500 2,000 2,500 UNITS COMPLETIONS BY QUARTER Historic & Projected 21’ Q4 22’ Q1 22’ Q2 22’ Q3 22’ Q4 23’ Q1 23’ Q2 23’ Q3 23’ Q4 COMPLETED UNDER CONSTRUCTION
RENT GROWTH
CINCINNATI VS NATIONAL RENT GROWTH Year-over-Year
Q1 2022 MARKET SNAPSHOT EMPLOYMENT

OCCUPANCY
1| Occupancy in the Cincinnati apartment market has ranged from 94.4% to 98.2% over the past five years, averaging 96.5% during that period. 2| Over the past year, occupancy lost 2.0 points, with the 4th quarter 2022 rate landing at 96.2%. 3| Product classes in Cincinnati, 4th quarter 2022 occupancy registered at 95.2% in Class A units, 96.2% in Class B units and 97.1% in Class C units. 4| Among submarkets, 4th quarter 2022 occupancy was strongest in Southeast Cincinnati and West Cincinnati.
RENT GROWTH BY ASSET
Sector Quarterly Yearly North Cincinnati 3.1% 11.9% Butler County -0.4% 11.8% Southeast Cincinnati 0.6% 11.1% Northeast / Warren County 0.3% 10.1% Boone County / Erlanger 1.6% 10.0% Campbell / Kenton Counties 0.1% 9.1% Central Cincinnati -0.5% 8.2% North Central Cincinnati -2.2% 7.4% West Cincinnati 1.9% 7.0%
Unemployment Rate 3.0% Jobs Added YTD 12,800 Pre-1970s 1970s 1980s 1990s 2000+ Occupancy 95.5% 96.5% 96.3% 95.6% 96.4% Y-O-Y Rent Growth 12.7% 12.5% 11.0% 8.5% 7.8% Average Rent Per Unit $1,041 $1,093 $1,231 $1,306 $1,656 20% 15% 10% 5% 0% MAR 22’ APR 22’ MAY 22’ JUN 22’ JUL 22’ AUG 22’ SEP 22’ OCT 22’ NOV 22’
CINCINNATI NATIONAL 12% 8% 4% 0% CINCINNATI
CLASS
LIFESTYLE RENTERS BY NECESSITY MAR 22’ APR 22’ MAY 22’ JUN 22’ JUL 22’ AUG 22’ SEP 22’ OCT 22’ NOV 22’
Year-over-Year
Q4 MARKET
DEMAND
1| Over the past five years, annual absorption in Cincinnati has ranged from net move-outs from 1,253 units to demand for 4,544 units, averaging 2,182 units annually during that time. 2| In 2022, the market recorded net move-outs from 1,253 units, trailing concurrent supply volumes.
SUPPLY
1| New apartment completions in Cincinnati were modest recently, as 2,249 units delivered in 2022. That annual completion volume was a six-year high. With 176 units removed from existing stock over the past year, the local inventory base grew 1.3%. 2| In the past year, supply was greatest in Central Cincinnati and Campbell/Kenton Counties. 3| New supply was concentrated in Central Cincinnati, Campbell/Kenton Counties and Northeast Cincinnati/Warren County, which received 66% of the markets total completions. 4| At the end of 2022, there were 6,462 units under construction with 4,669 of those units scheduled to complete in the next four quarters. Scheduled deliveries in the coming year are expected to be concentrated in North Central Cincinnati and Butler County.
2,249 units completed in past 12 months
6,462 units currently in progress
Overall Performing Submarket
OVERALL PERFORMING SUBMARKETS
UNITS UNDER CONSTRUCTION
Sector Units Central Cincinnati 1,211 Butler County 1,177 North Central Cincinnati 902 Boone County/Erlanger 776 Southeast Cincinnati 775 TOTAL
Submarket Change Central Cincinnati 8.5% Boone County/Erlanger 7.1% Butler County 5.9% Southeast Cincinnati 4.6% Campbell/Kenton Counties 3.7% Highest
Submarkets Rent Occupancy YOY Dearborn County $1,112 96.0% 22.7% Fairfield $1,272 94.9% 14.0% Summerside $1,191 97.5% 13.2% Florence – east/Erlanger $1,065 96.9% 13.2% Dent/Harrison $997 97.8% 12.7%
Submarkets Rent Occupancy YOY Cincinnati – English Woods/Price Hill $828 93.7% 4.5% Cincinnati – Mt. Auburn/Corryville $1,905 94.4% 4.4% Oxford $1,623 - 3.3% Cincinnati – Avondale $1,431 96.4% 1.5% Taylor Mill/Independence $1,186 97.5% 0.3%
FUTURE INVENTORY GROWTH
LOWEST
DEVELOPMENT PIPELINE MAP - CINCINNATI
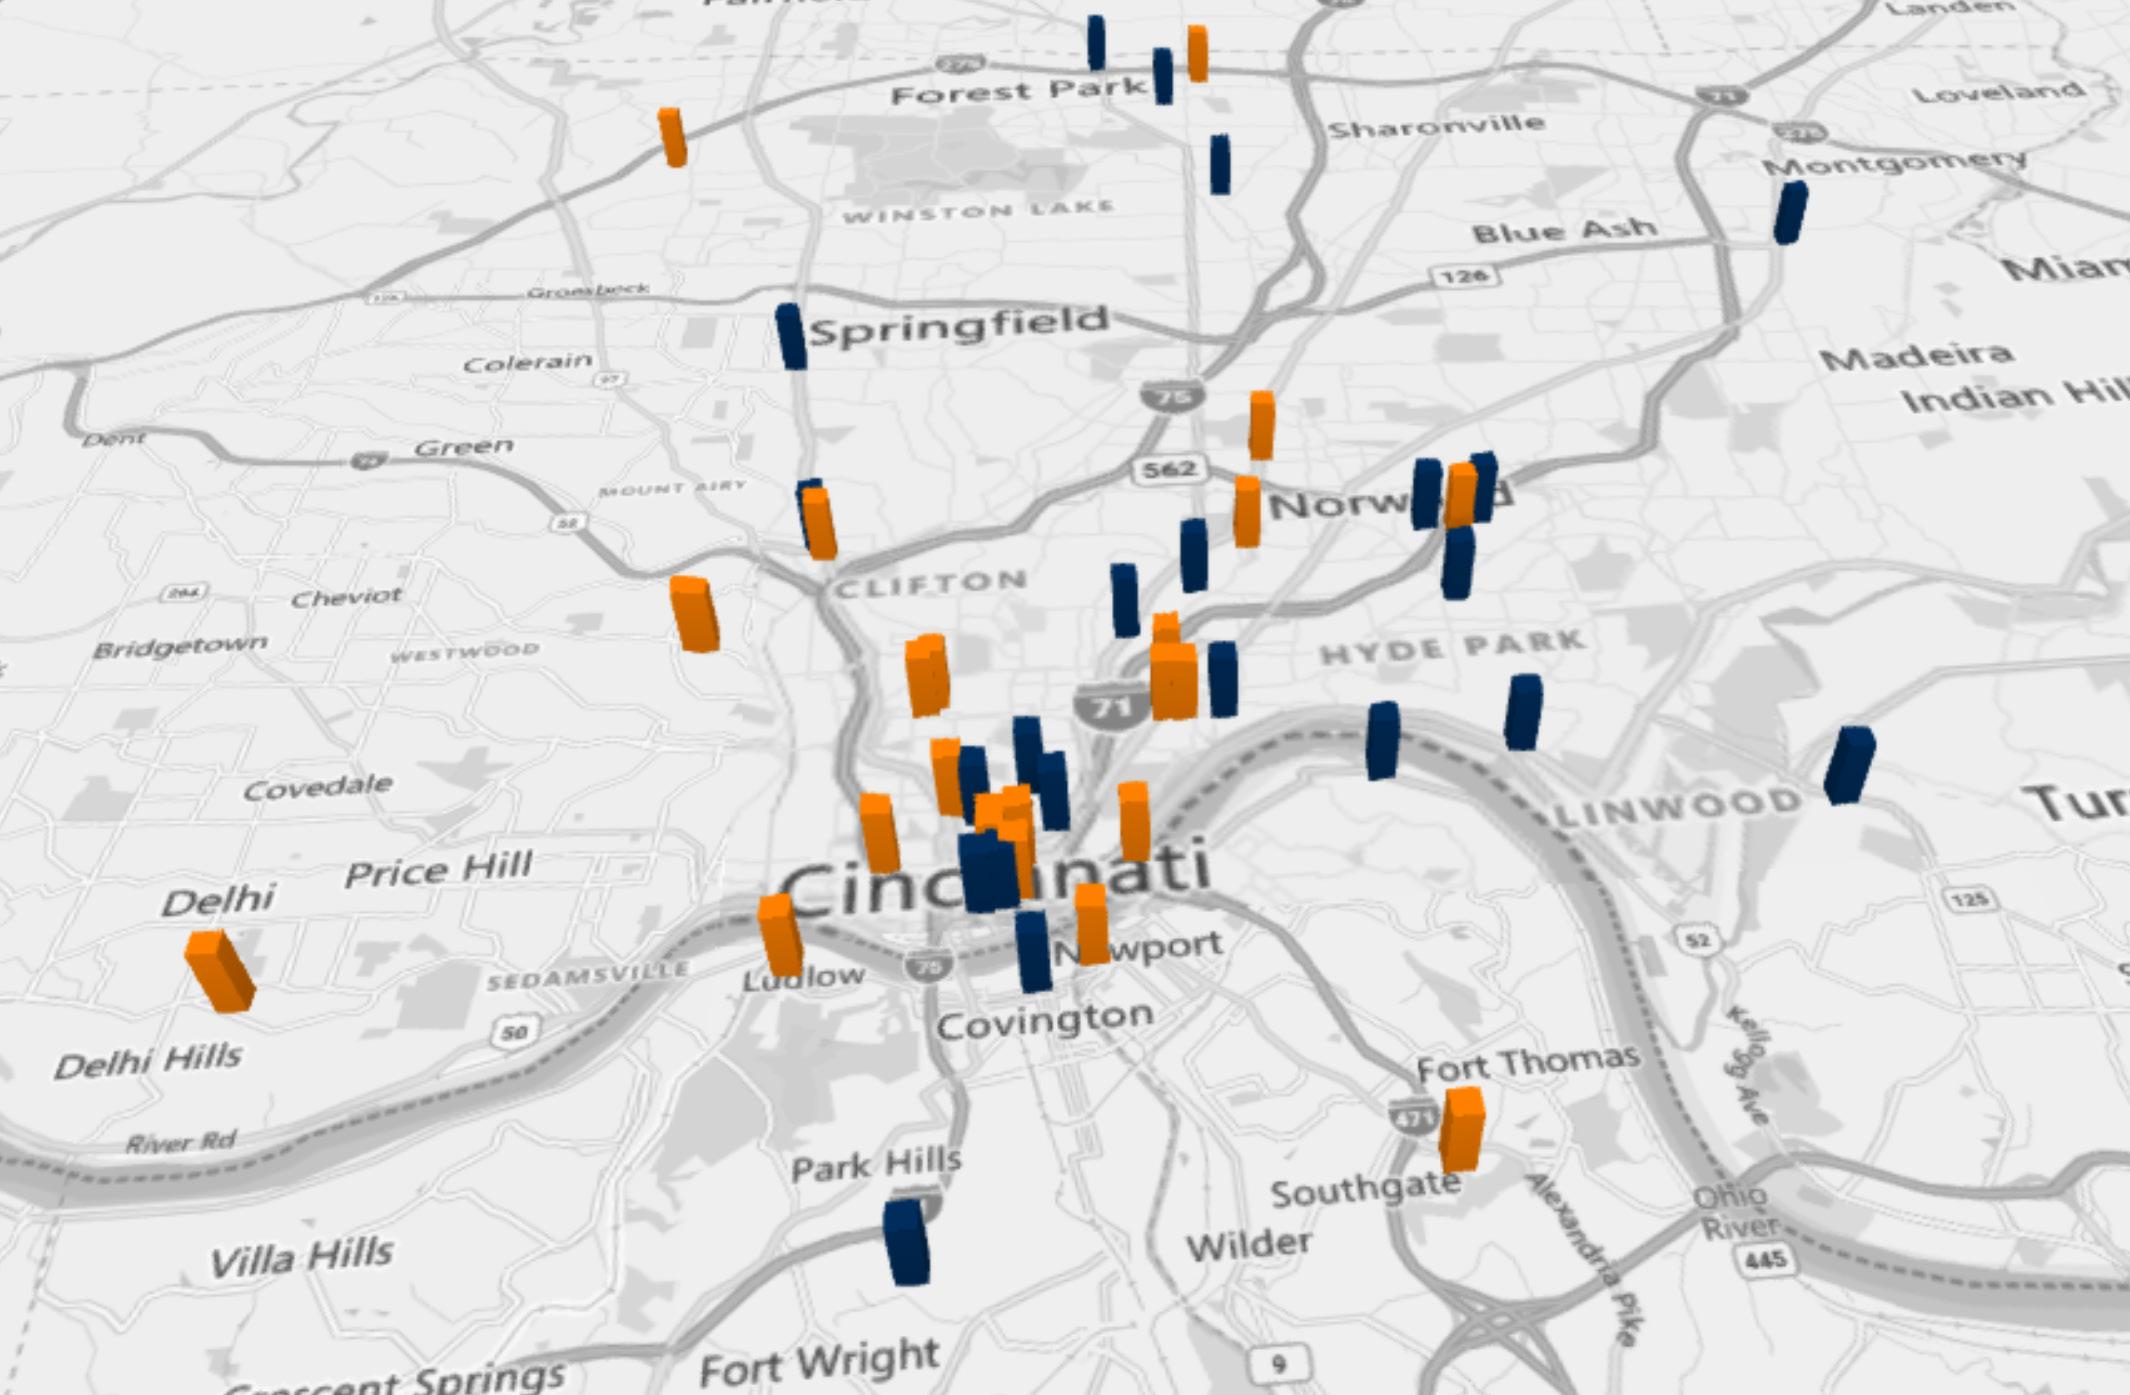
UNDER CONSTRUCTION PLANNED
DAYTON

DAYTON OVERVIEW
1| Prior to the pandemic, Dayton’s real gross metropolitan product grew at an average annual rate of 1.6% from 2015 to 2019. During that same five-year period, job growth averaged 1.0% annually, with roughly 3,900 jobs added on average each year. In 2020, COVID-19 mitigation measures and limited business activity caused the local economy to contract as much as 9.6% year-over-year in 2nd quarter. In 2022, the metros inflation-adjusted economic output contracted 0.8%. 2| At the same time, the metro recorded a net gain of 2,900 jobs, expanding the employment base 0.8%. 3| Dayton’s unemployment rate in November 2022 declined 0.4 points year-over-year to 3.2%, below the national average of 3.4%. 4| Job gains in Dayton were most pronounced in the Leisure/Hospitality Services sector followed by Government and Professional/Business Services. 5| Due to job losses stemming from the pandemic, Dayton’s current employment base now sits roughly 5,100 jobs or about 1% below the pre-pandemic level in February 2020.
1| Over the past five years, annual change in effective asking rents in Dayton ranged from 1.9% to 10.3%. In 4th quarter 2022, effective asking rents for new leases were up 8.4% year-over-year. That annual rent performance was well above the market’s five-year average of 4.8%. 2| Product classes in Dayton, Class A led for rent performance over the past five years. In 4th quarter 2022, annual effective rent change was fairly even across the board, registering at 8.3% in Class A units, 8.2% in Class B units and 8.7% in Class C units. 3| Among submarkets, the strongest annual rent change performances over the past year were in Northwest Dayton, North Dayton/Miami County and Greene County, all at 10% or greater. 4| The weakest performances were in Central Dayton/Kettering and South Montgomery County, but both were around 6.5%.
ECONOMY
RENT
UNITS COMPLETIONS BY QUARTER Historic & Projected COMPLETED UNDER CONSTRUCTION 0 100 200 300 400 500 21’ Q4 22’ Q1 22’ Q2 22’ Q3 22’ Q4 23’ Q1 23’ Q2 23’ Q3 23’ Q4
RENT GROWTH
Q1 2022 MARKET SNAPSHOT
DAYTON VS NATIONAL RENT GROWTH Year-over-Year
OCCUPANCY
BY ASSET CLASS Year-over-Year
1|
Occupancy in the Dayton apartment market has ranged from 93.9% to 98.0% over the past five years, averaging 96.5% during that period. Over the past year, occupancy lost 1.8 points, with the 4th quarter 2022 rate landing at 96.2%. 2| Product classes in Dayton, 4th quarter 2022 occupancy registered at 95.3% in Class A units, 96.5% in Class B units and 96.7% in Class C units. 3| In 4th quarter 2022 occupancy was strongest in Greene County and Central Dayton/Kettering. 4| The weakest reading was in Northwest Dayton at just less than 94%.
Sector Quarterly Yearly Northwest Dayton 1.0% 10.9% North Dayton / Miami County 1.0% 10.9% Greene County 0.5% 10.0% South Montgomery County 0.4% 6.6% Northwest Dayton 1.0% 10.9%
EMPLOYMENT Unemployment Rate 3.2% Jobs Added YTD 2,900 Pre-1970s 1970s 1980s 1990s 2000+ Occupancy 95.6% 96.5% 96.4% 96.8% 96.0% Y-O-Y Rent Growth 8.8% 8.2% 10.3% 8.0% 7.6% Average Rent Per Unit $882 $923 $1,013 $1,168 $1,432 20% 15% 10% 5% 0%
DAYTON NATIONAL 14% 10% 6% 0% DAYTON RENT GROWTH
LIFESTYLE RENTERS BY NECESSITY MAR 22’ APR 22’ MAY 21’ JUN 22’ JUL 22’ AUG 22’ SEP 22’ OCT 22’ NOV 22’ MAR 22’ APR 22’ MAY 21’ JUN 22’ JUL 22’ AUG 22’ SEP 22’ OCT 22’ NOV 22’
Q4 MARKET
SUPPLY
1| New apartment completions in Dayton were modest recently, as 412 units delivered in 2022. Completions over the past year expanded the local inventory base 0.7%. 2| In the past year, supply was limited to Central Dayton/Kettering and Greene County. 3| Annual new supply averaged 553 units, and annual inventory growth averaged 1.0% over the past five years. During that period, new supply was concentrated in South Montgomery County and Central Dayton/Kettering, which received 64% of the markets total completions. 4| At the end of 2022, there were 886 units under construction with 661 of those units scheduled to complete in the next four quarters.
412 units completed in past 12 months
886 units currently in progress
UNDER CONSTRUCTION Sector Units Central Dayton / Kettering 694 North Dayton / Miami County 192 TOTAL FUTURE INVENTORY GROWTH Submarket Change Central Dayton / Kettering 4.5% North Dayton / Miami County 2.3% Highest Overall
Submarket Submarkets Rent Occupancy YOY Springfield $896 98.2% 17.1% West Carrollton $1,1039 96.3% 16.9% Huber Heights $1,123 97.1% 15.3% Kettering West $1,146 96.6% 15.1% Xenia $879 97.5% 13.7% LOWEST OVERALL PERFORMING SUBMARKETS Submarkets Rent Occupancy YOY Miami $1,196 97.6% 6.1% Kettering-East $930 96.0% 5.4% Centerville $1,248 96.4% 4.9% Bellbrook $1,453 94.0% 3.8% Dayton-Downtown $1,254 95.6% 1.7%
UNITS
Performing
DEVELOPMENT PIPELINE MAP - DAYTON
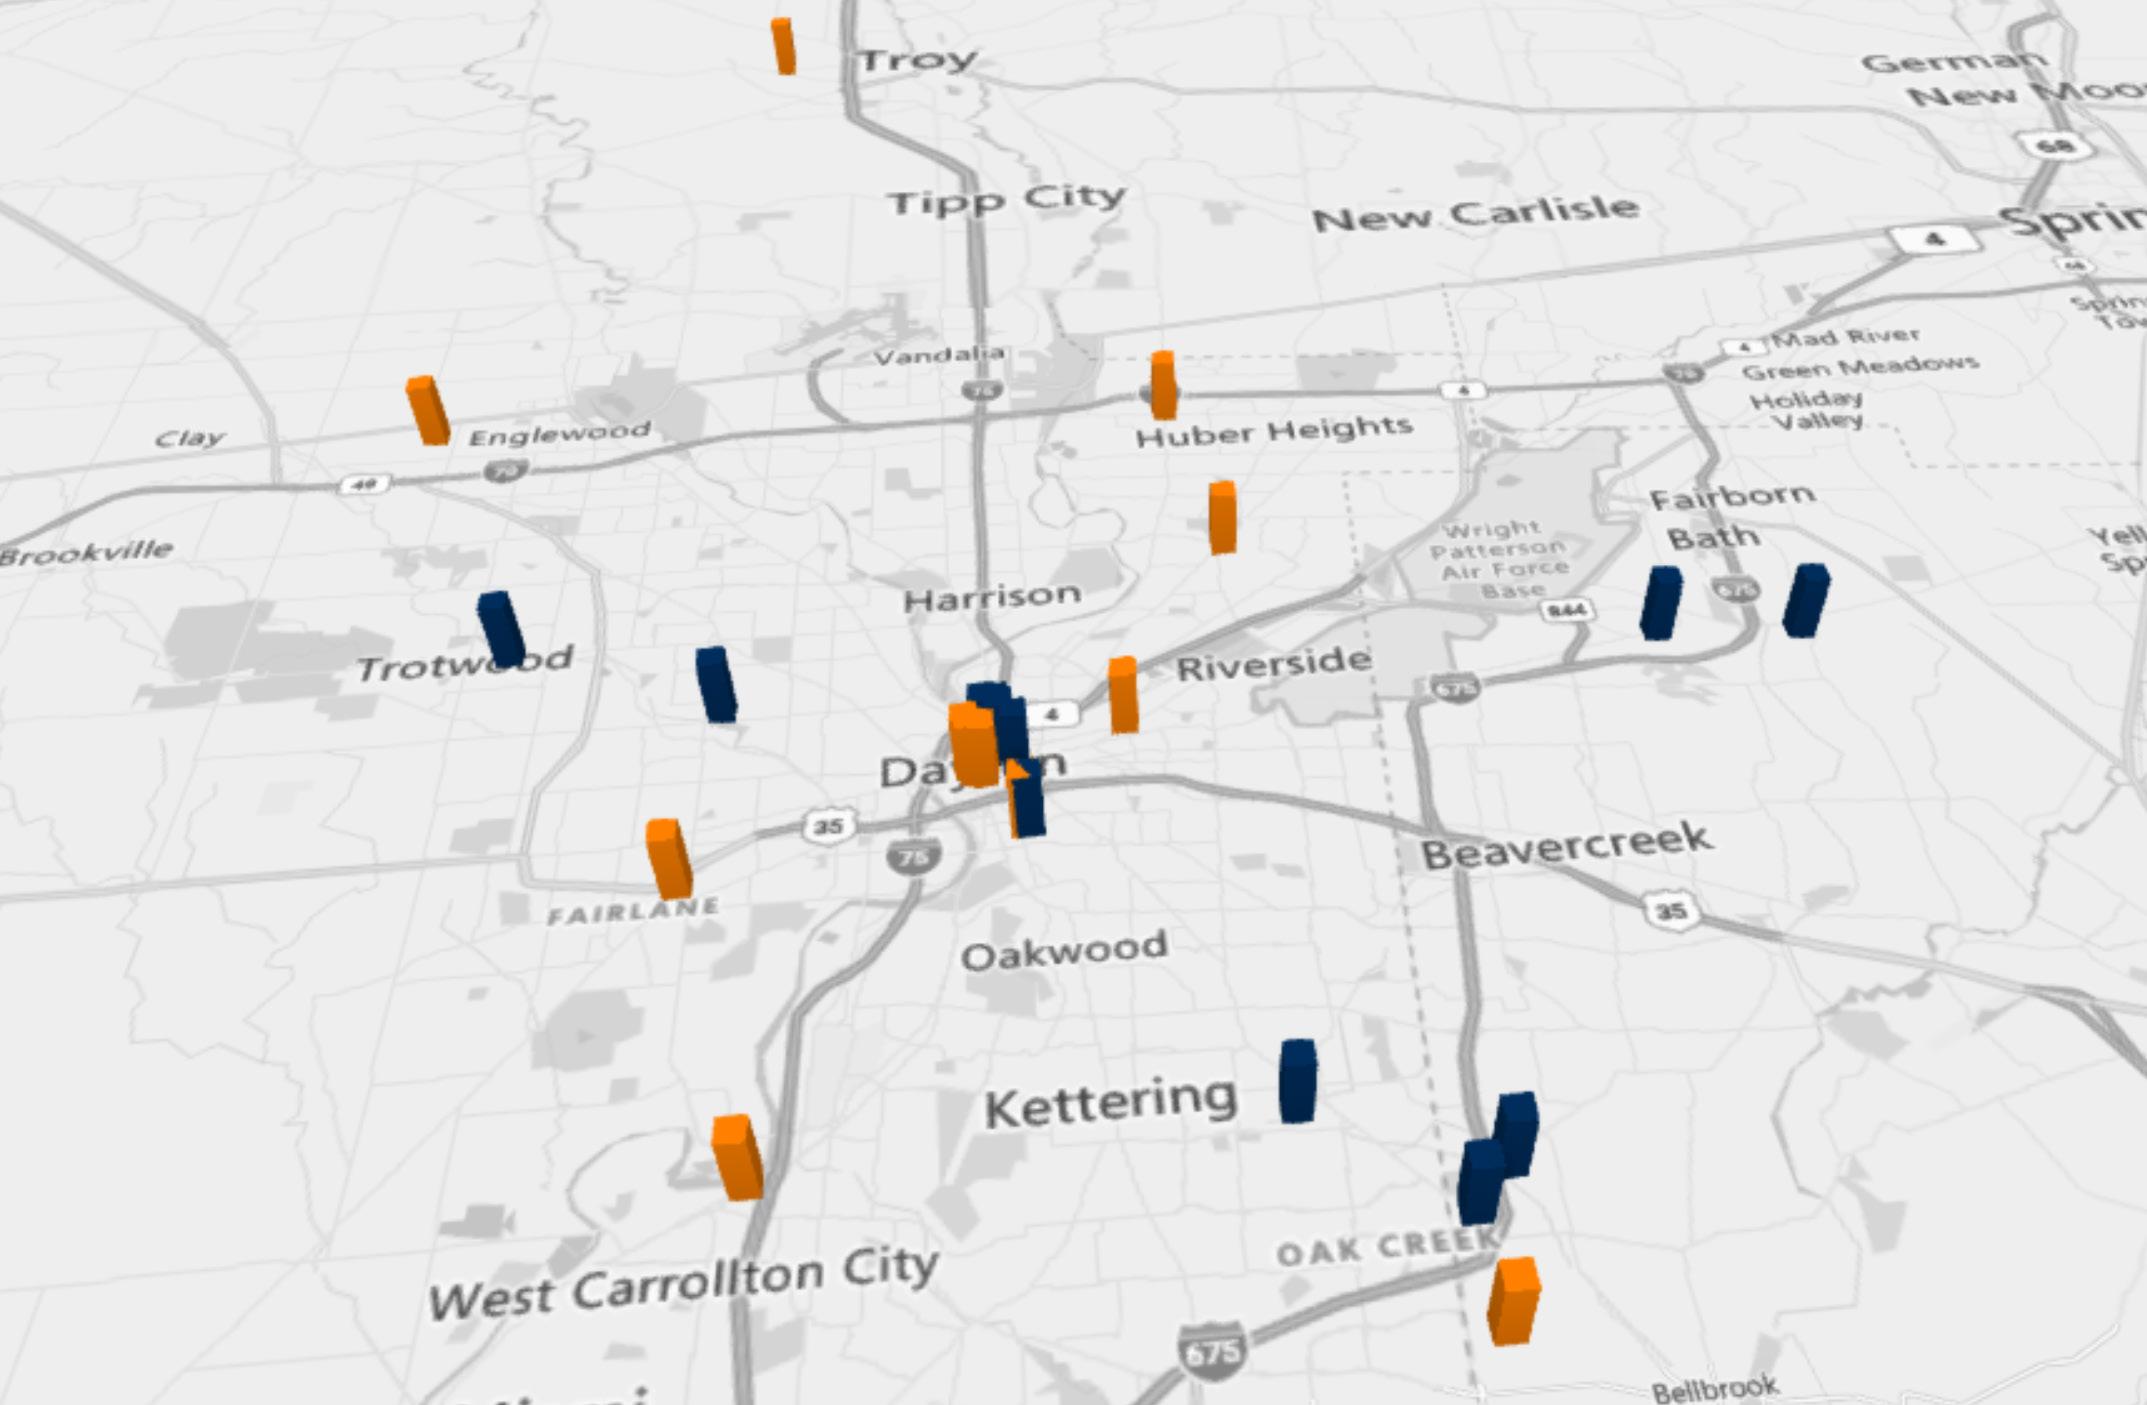
UNDER CONSTRUCTION PLANNED
LOUISVILLE

LOUISVILLE OVERVIEW
1| Prior to the pandemic, Louisville/Jefferson County’s real gross metropolitan product grew at an average annual rate of 2.0% from 2015 to 2019. During that same five-year period, job growth averaged 1.5% annually, with roughly 9,800 jobs added on average each year. In 2020, COVID- 19 mitigation measures and limited business activity caused the local economy to contract as much as 8.0% year-over-year in 2nd quarter. 2| In 2022, the metros inflation-adjusted economic output contracted 0.6%. At the same time, the metro recorded a net gain of 28,200 jobs, expanding the employment base 4.2%. 3| Louisville/Jefferson County’s unemployment rate in November 2022 declined 0.7 points year-over-year to 3.0%, below the national average of 3.4%. 4| During the past year, job gains in Louisville/Jefferson County were most pronounced in the Education/Health Services sector followed by Leisure/Hospitality Services.
RENT
1| Over the past five years, annual change in effective asking rents in Louisville/Jefferson County ranged from a decline of 0.1% to an increase of 11.9%.
2| In 4th quarter 2022, effective asking rents for new leases were up 8.5% year-over-year. That annual rent performance was almost double the market’s five-year average of 4.4%. 3| In 4th quarter 2022, annual effective rent change registered at 8.4% in Class A units, 9.9% in Class B units and 6.5% in Class C units. 4| Among submarkets, the strongest annual rent change performances over the past year were in Southeast Louisville (11.4%) and Southwest Louisville (9.8%). The weakest performances were in Central Louisville (6.7%) and Northwest Louisville (6.8%). 5| As of 4th quarter 2022, effective asking rental rates in Louisville/Jefferson County averaged $1,154 per month, or $1.219 per square foot.
ECONOMY
UNITS COMPLETIONS BY QUARTER Historic & Projected COMPLETED UNDER CONSTRUCTION 0 500 1,000 1,500 2,000 21’ Q4 22’ Q1 22’ Q2 22’ Q3 22’ Q4 23’ Q1 23’ Q2 23’ Q3 23’ Q4
RENT GROWTH
Q1 2022 MARKET SNAPSHOT
OCCUPANCY
Occupancy in the Louisville/Jefferson County apartment market has ranged from 94.4% to 97.4% over the past five years, averaging 95.5% during that period. Over the past year, occupancy lost 1.7 points, with the 4th quarter 2022 rate landing at 95.0%. 2| Product classes in Louisville/Jefferson County, 4th quarter 2022 occupancy registered at 93.4% in Class A units, 95.0% in Class B units and 96.8% in Class C units. Occupancy in Class C product was generally tightest over the past five years, averaging 96.6%. 3| Among submarkets, 4th quarter 2022 occupancy was strongest in South Central Louisville and Northwest Louisville. The weakest reading was seen in Central Louisville at just 93.6%.
1|
Sector Quarterly Yearly Southeast Louisville 0.4% 11.4% Southwest Louisville 1.4% 9.8% Northwest Louisville 6.8% 9.6% South Central Louisville 1.9% 8.6% Northeast Louisville -1.7% 8.1% Central Louisville -2.0% 6.7%
EMPLOYMENT Unemployment Rate 3.0% Jobs Added YTD 28,200 Pre-1970s 1970s 1980s 1990s 2000+ Occupancy 92.5% 96.0% 94.8% 97.1% 94.7% YoY Rent Growth 9.2% 9.1% 9.2% 12.2% 7.4% Average Rent Per Unit $980 $988 $1,111 $1,057 $1,339 20% 15% 10% 5% 0% LOUISVILLE
LOUISVILLE NATIONAL 12% 8% 4% 0% LOUISVILLE RENT GROWTH
LIFESTYLE RENTERS BY NECESSITY MAR 22’ APR 22’ MAY 21’ JUN 22’ JUL 22’ AUG 22’ SEP 22’ OCT 22’ NOV 22’ MAR 22’ APR 22’ MAY 21’ JUN 22’ JUL 22’ AUG 22’ SEP 22’ OCT 22’ NOV 22’
VS NATIONAL RENT GROWTH Year-over-Year
BY ASSET CLASS Year-over-Year
Q4 MARKET
SUPPLY
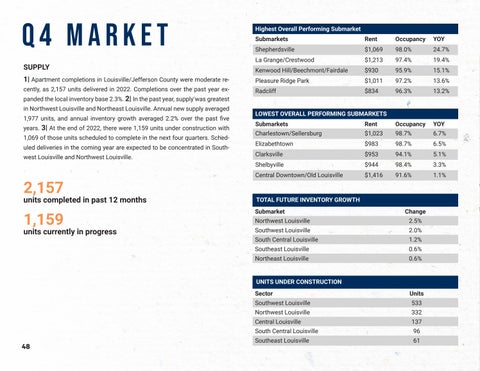
1| Apartment completions in Louisville/Jefferson County were moderate recently, as 2,157 units delivered in 2022. Completions over the past year expanded the local inventory base 2.3%. 2| In the past year, supply was greatest in Northwest Louisville and Northeast Louisville. Annual new supply averaged 1,977 units, and annual inventory growth averaged 2.2% over the past five years. 3| At the end of 2022, there were 1,159 units under construction with 1,069 of those units scheduled to complete in the next four quarters. Scheduled deliveries in the coming year are expected to be concentrated in Southwest Louisville and Northwest Louisville.
2,157 units completed in past 12 months
1,159 units currently in progress
UNITS UNDER CONSTRUCTION Sector Units Southwest Louisville 533 Northwest Louisville 332 Central Louisville 137 South Central Louisville 96 Southeast Louisville 61 TOTAL FUTURE INVENTORY GROWTH Submarket Change Northwest Louisville 2.5% Southwest Louisville 2.0% South Central Louisville 1.2% Southeast Louisville 0.6% Northeast Louisville 0.6% Highest Overall Performing Submarket Submarkets Rent Occupancy YOY Shepherdsville $1,069 98.0% 24.7% La Grange/Crestwood $1,213 97.4% 19.4% Kenwood Hill/Beechmont/Fairdale $930 95.9% 15.1% Pleasure Ridge Park $1,011 97.2% 13.6% Radcliff $834 96.3% 13.2% LOWEST OVERALL
SUBMARKETS Submarkets Rent Occupancy YOY Charlestown/Sellersburg $1,023 98.7% 6.7% Elizabethtown $983 98.7% 6.5% Clarksville $953 94.1% 5.1% Shelbyville $944 98.4% 3.3% Central Downtown/Old Louisville $1,416 91.6% 1.1%
PERFORMING
DEVELOPMENT PIPELINE MAP - LOUISVILLE
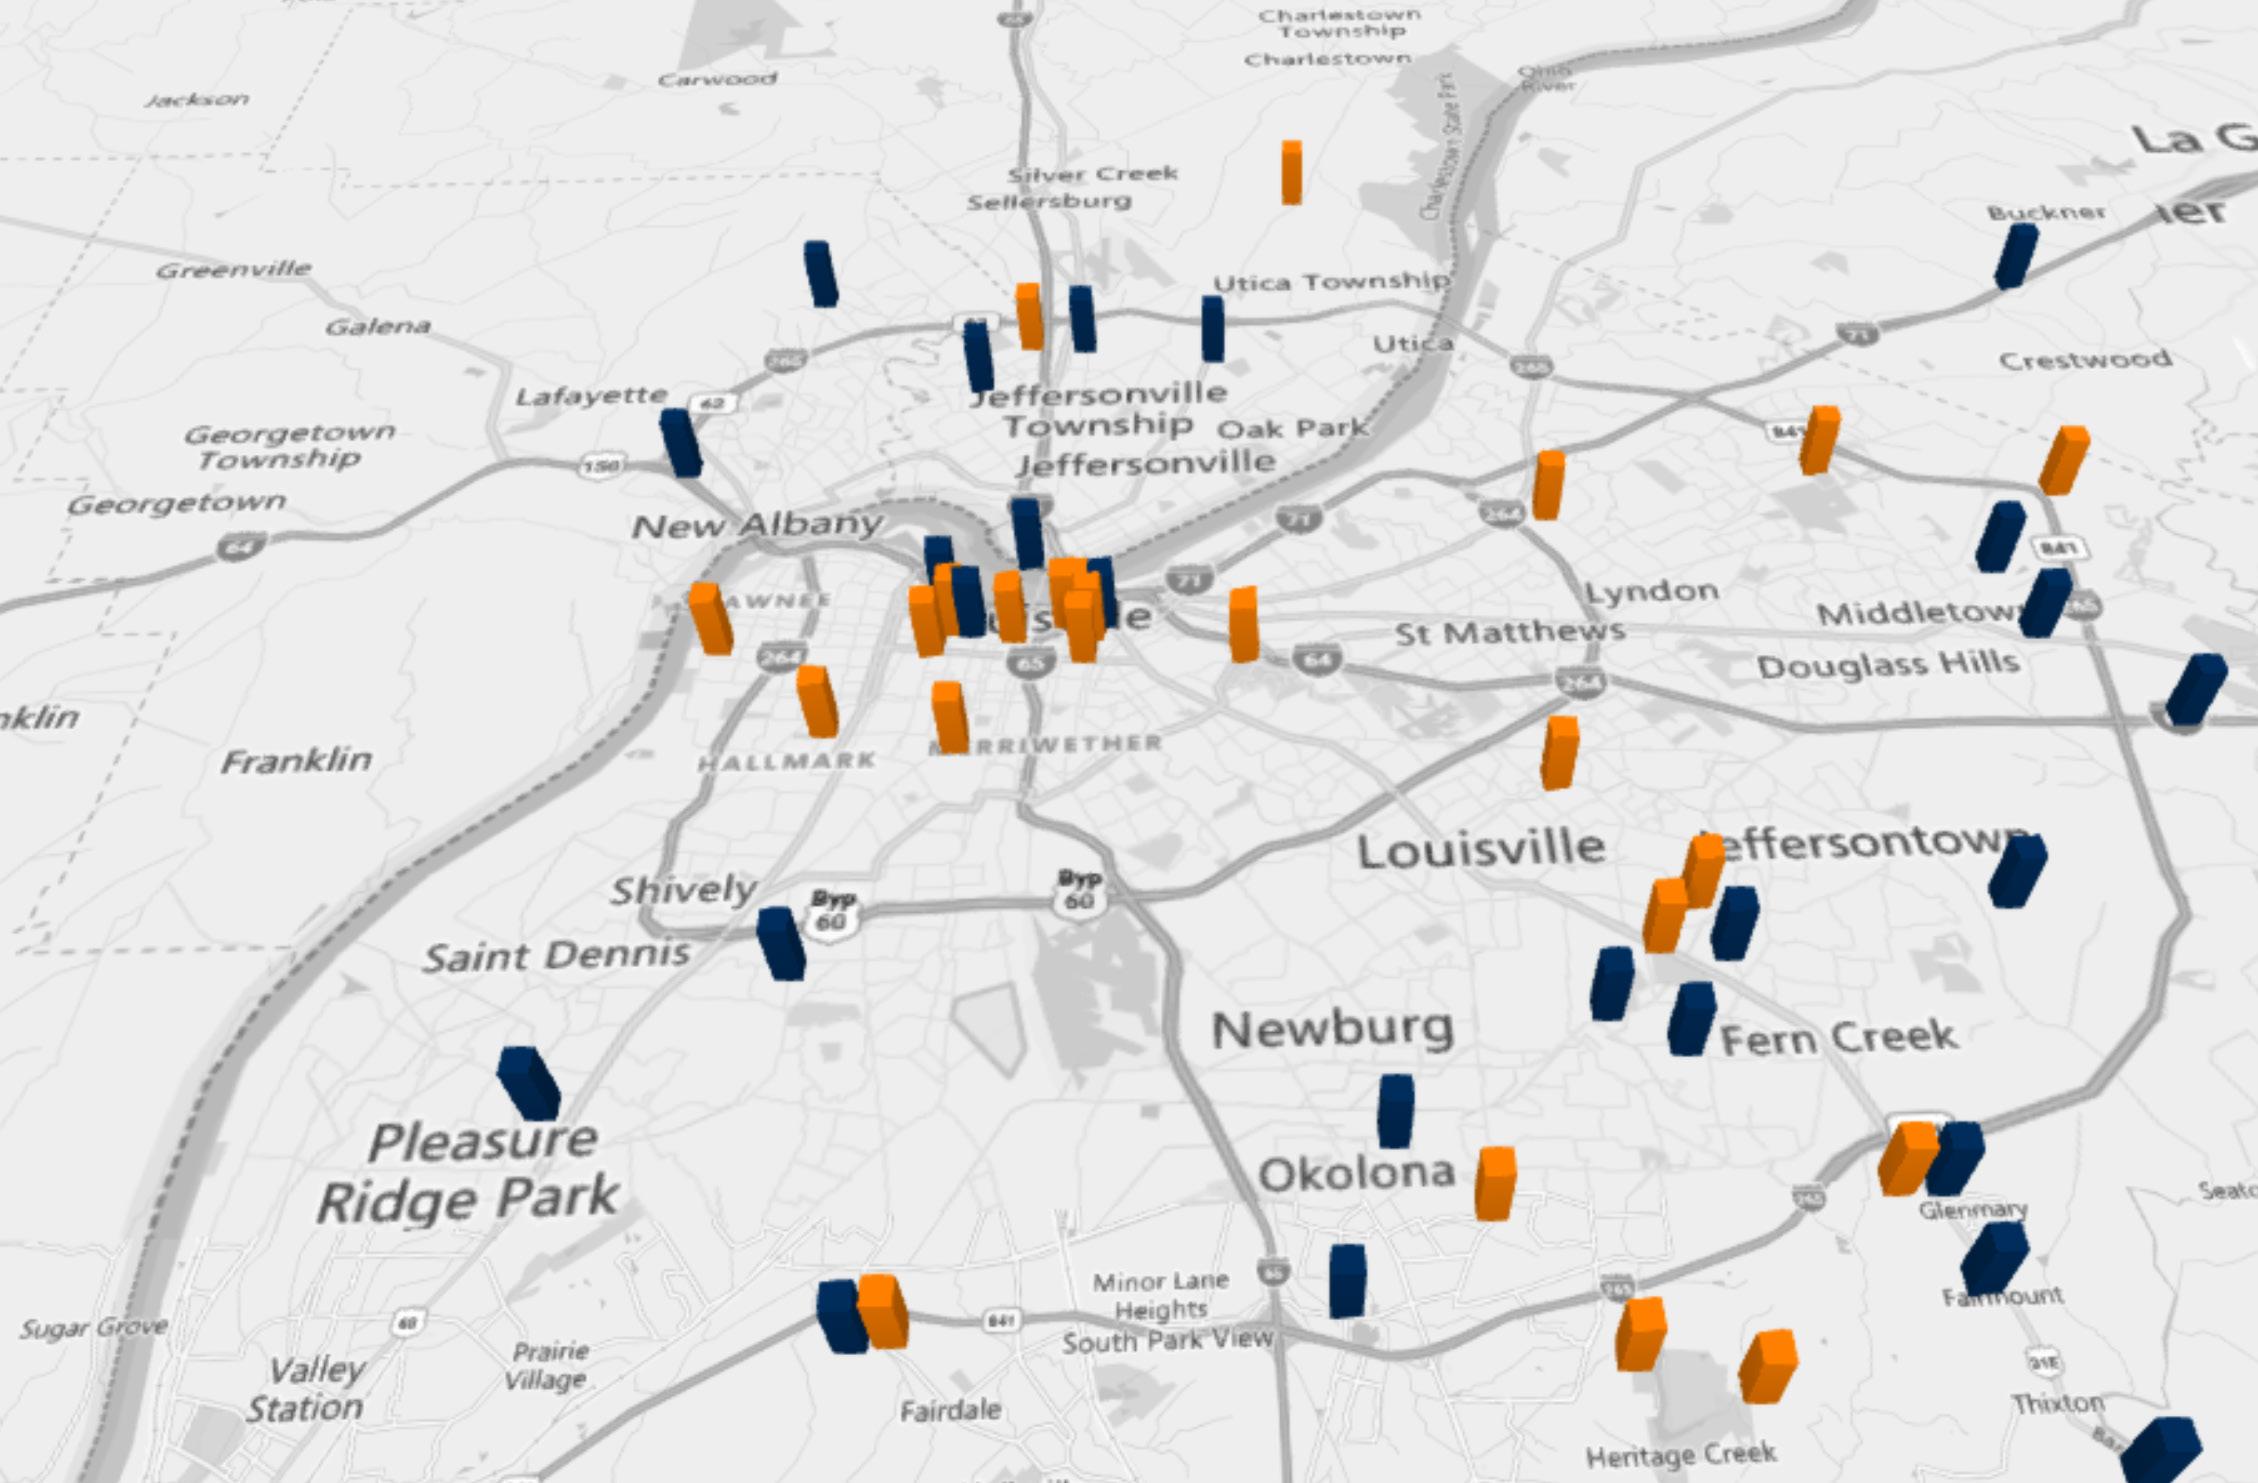
UNDER CONSTRUCTION PLANNED
LEXINGTON

LEXINGTON OVERVIEW
1| Prior to the pandemic, Lexington-Fayette’s real gross metropolitan product grew at an average annual rate of 1.6% from 2015 to 2019. During that same five-year period, job growth averaged 1.2% annually, with roughly 3,100 jobs added on average each year. In 2020, COVID-19 mitigation measures and limited business activity caused the local economy to contract as much as 7.8% year-over-year in 2nd quarter. 2| In 2022, the metros inflation-adjusted economic output contracted 0.3%. At the same time, the metro recorded a net gain of 6,200 jobs, expanding the employment base 2.2%. 3| Lexington-Fayette’s unemployment rate in November 2022 rose 0.1-point year-over-year to 3.1%, below the national average of 3.4%. 4| During the past year, job gains in Lexington-Fayette were most pronounced in the Leisure/Hospitality Services sector followed by Government. 5| Despite job losses stemming from the pandemic, Lexington-Fayette’s current employment base now sits roughly 5,800 jobs or about 2% above the pre-pandemic level in February 2020.
RENT
1| In 4th quarter 2022, effective asking rents for new leases were up 9.6% year-over-year. That annual rent performance was above the market’s fiveyear average of 5.6%. 2| In the 4th quarter 2022, annual effective rent change registered at 9.7% in Class A units, 9.4% in Class B units and 9.7% in Class C units. 3| Among submarkets, the strongest annual rent change performance over the past year was in Downtown Lexington/University (14.5%). 4| The weakest performance was in South Lexington (7.2%). Over the past five years, rent growth was strongest in Downtown Lexington/University and South Lexington. In the coming year, same-store effective asking rent change in Lexington-Fayette is expected to slow from the current level. As of 4th quarter 2022, effective asking rental rates in Lexington-Fayette averaged $1,140 per month, or $1.239 per square foot.
ECONOMY
UNITS COMPLETIONS BY QUARTER Historic & Projected COMPLETED UNDER CONSTRUCTION 0 200 400 600 800 1,000 21’ Q4 22’ Q1 22’ Q2 22’ Q3 22’ Q4 23’ Q1 23’ Q2 23’ Q3 23’ Q4
Q1 2022 MARKET SNAPSHOT
1| Occupancy in the Lexington-Fayette apartment market has ranged from 92.9% to 97.6% over the past five years, averaging 95.4% during that period.
2| Over the past year, occupancy lost 2.4 points, with the 4th quarter 2022 rate landing at 95.2%. 3| Looking at product classes in Lexington-Fayette, 4th quarter 2022 occupancy registered at 94.9% in Class A units, 95.5% in Class B units and 95.1% in Class C units. 4| Among submarkets, 4th quarter 2022 occupancy was strongest in North Lexington (96.7%). The weakest reading was seen in Downtown Lexington/University (93.9%).
OCCUPANCY RENT GROWTH Sector Quarterly Yearly Downtown Lexington / University (0.3)% 14.5% South Lexington 3.2% 13.6% North Lexington (2.5)% 7.2%
EMPLOYMENT Unemployment Rate 3.1% Jobs Added YTD 6,200 Pre-1970s 1970s 1980s 1990s 2000+ OCCUPANCY 94.1% 94.6% 94.9% 95.7% 95.8% YOY RENT GROWTH 14.0% 12.4% 10.3% 4.2% 9.6% AVERAGE RENT PER UNIT $886 $1,003 $1,032 $1,167 $1,339 20% 15% 10% 5% 0% LEXINGTON
LEXINGTON NATIONAL 15% 10% 5% 0% LEXINGTON RENT GROWTH BY ASSET CLASS Year-over-Year LIFESTYLE RENTERS BY NECESSITY MAR 22’ APR 22’ MAY 21’ JUN 22’ JUL 22’ AUG 22’ SEP 22’ OCT 22’ NOV 22’ MAR 22’ APR 22’ MAY 21’ JUN 22’ JUL 22’ AUG 22’ SEP 22’ OCT 22’ NOV 22’
VS NATIONAL RENT GROWTH Year-over-Year
Q4 MARKET
SUPPLY
1| New apartment completions in Lexington-Fayette were modest recently, as 369 units delivered in 2022. Completions over the past year expanded the local inventory base 0.8%. 2| In the past year, supply was greatest in North Lexington. 3| At the end of 2022, there were 920 units under construction with 375 of those units scheduled to complete in the next four quarters.
369 units completed in past 12 months
920 units currently in progress
Highest Overall Performing Submarket
LOWEST OVERALL PERFORMING SUBMARKETS
UNITS UNDER CONSTRUCTION
Sector Units North Lexington 619 South Lexington 301 TOTAL
Submarket Change North Lexington 5.0% South Lexington (0.6)% Downtown Lexington / Downtown (1.7)%
FUTURE INVENTORY GROWTH
Submarkets Rent Occupancy YOY Franklin $948 93.6% 14.9% Lexington – west $991 95.6% 14.2% Scott $1,218 97.1% 13.6% Lexington – South Central $1,066 93.8% 11.4% Lexington - Southwest $1,320 94.5% 10.5%
Submarkets Rent Occupancy YOY Lexington – South $1,169 95.4% 9.2% Lexington – Northeast $818 93.6% 9.0% Lexington – North $936 97.6% 8.3% Lexington – Downtown $1,105 87.6% 7.1% Jessamine $1,143 98.3% 5.3%
DEVELOPMENT PIPELINE MAP - LEXINGTON
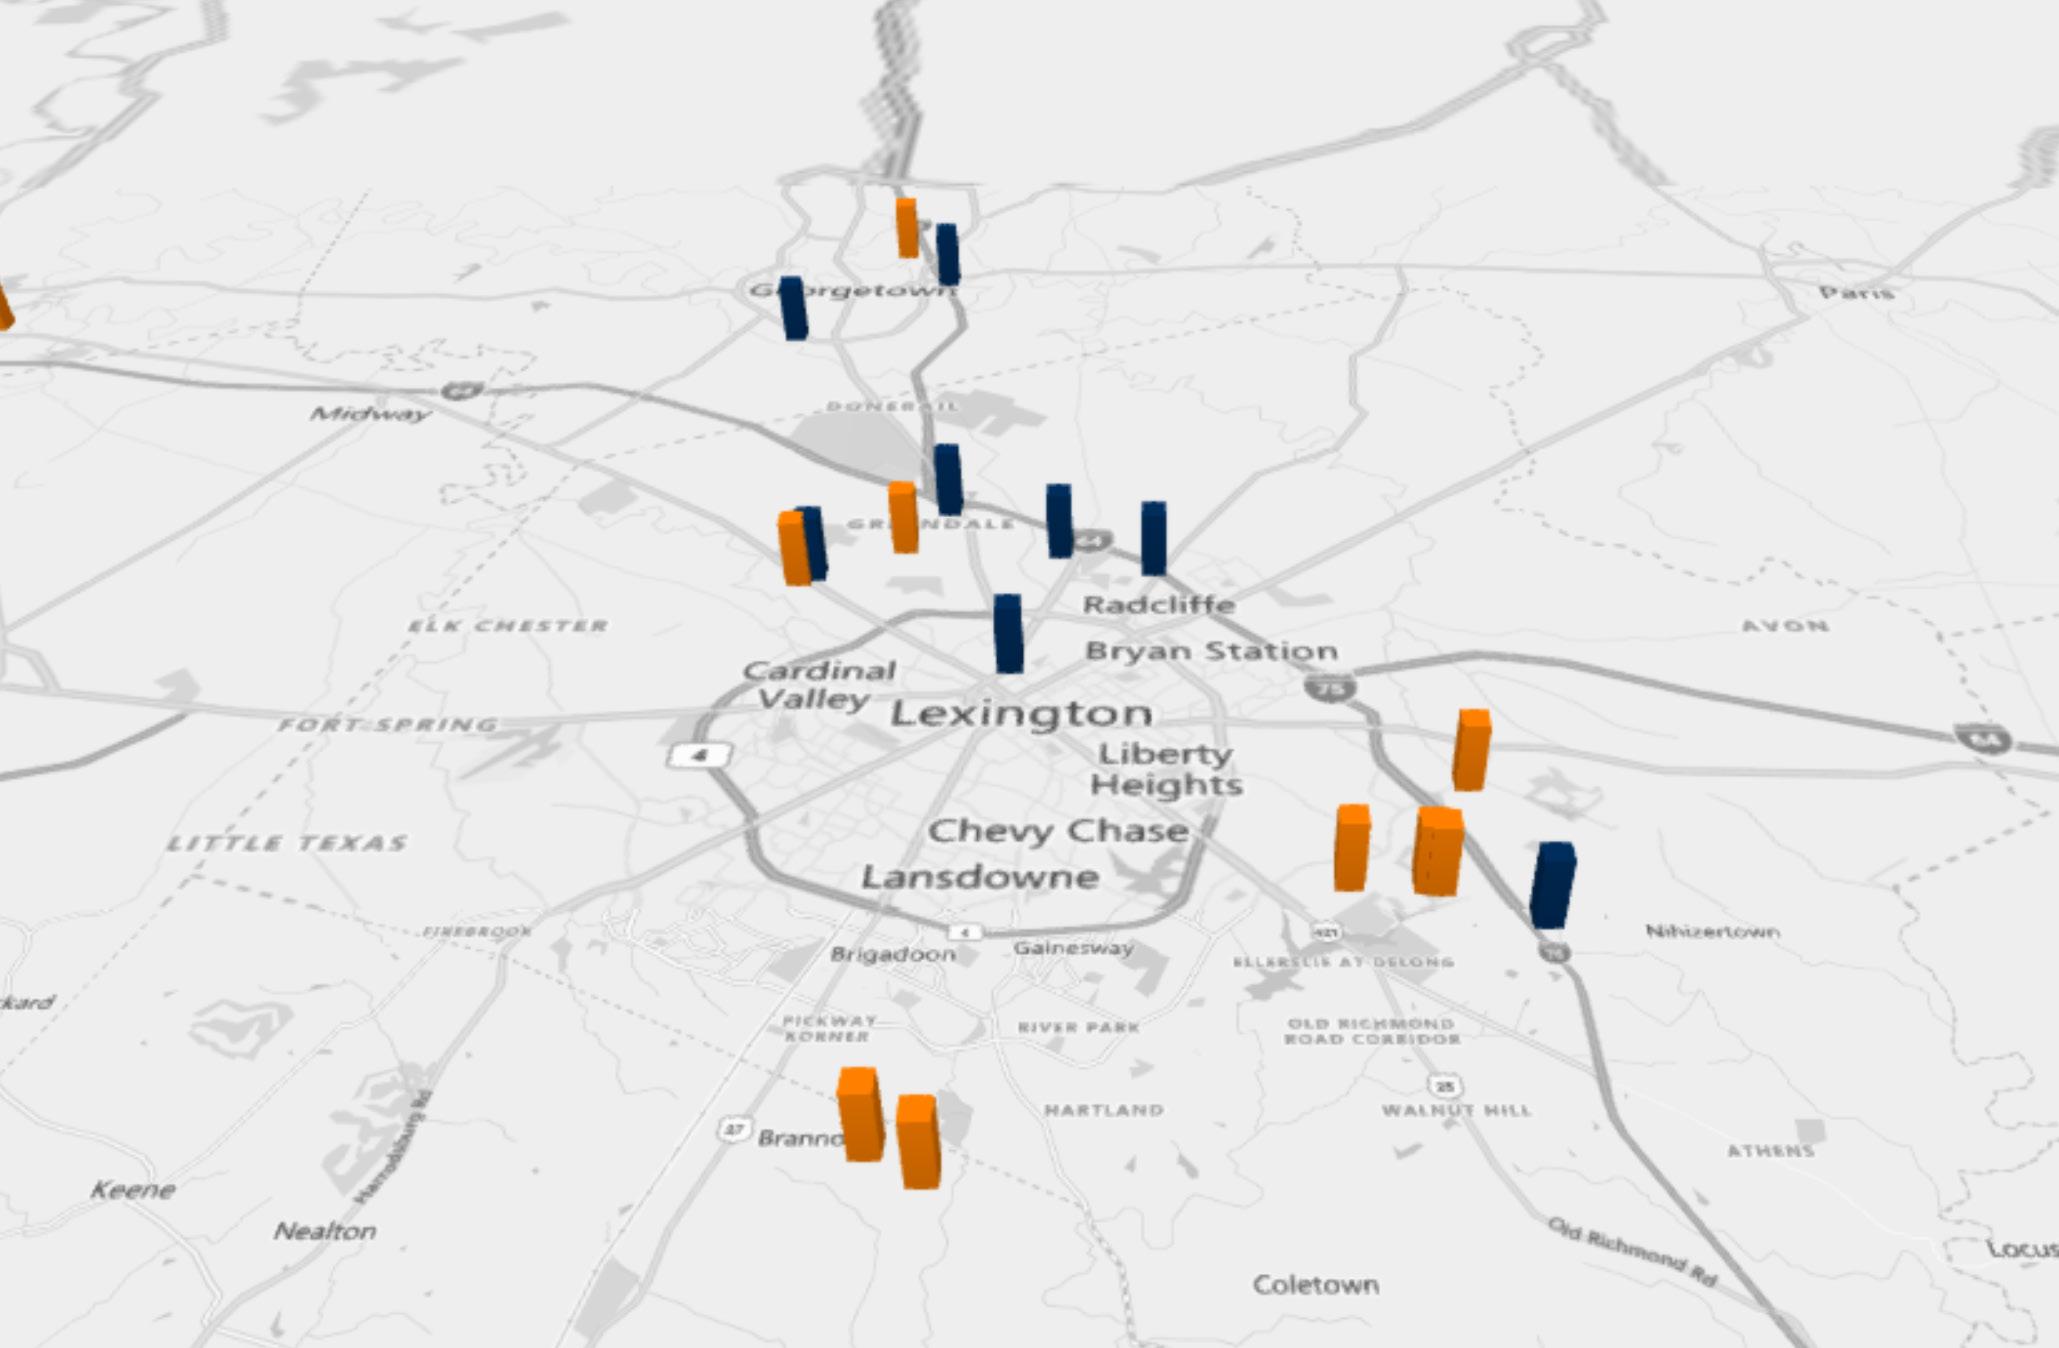
UNDER CONSTRUCTION PLANNED