1 minute read
Q4 MARKET


Demand
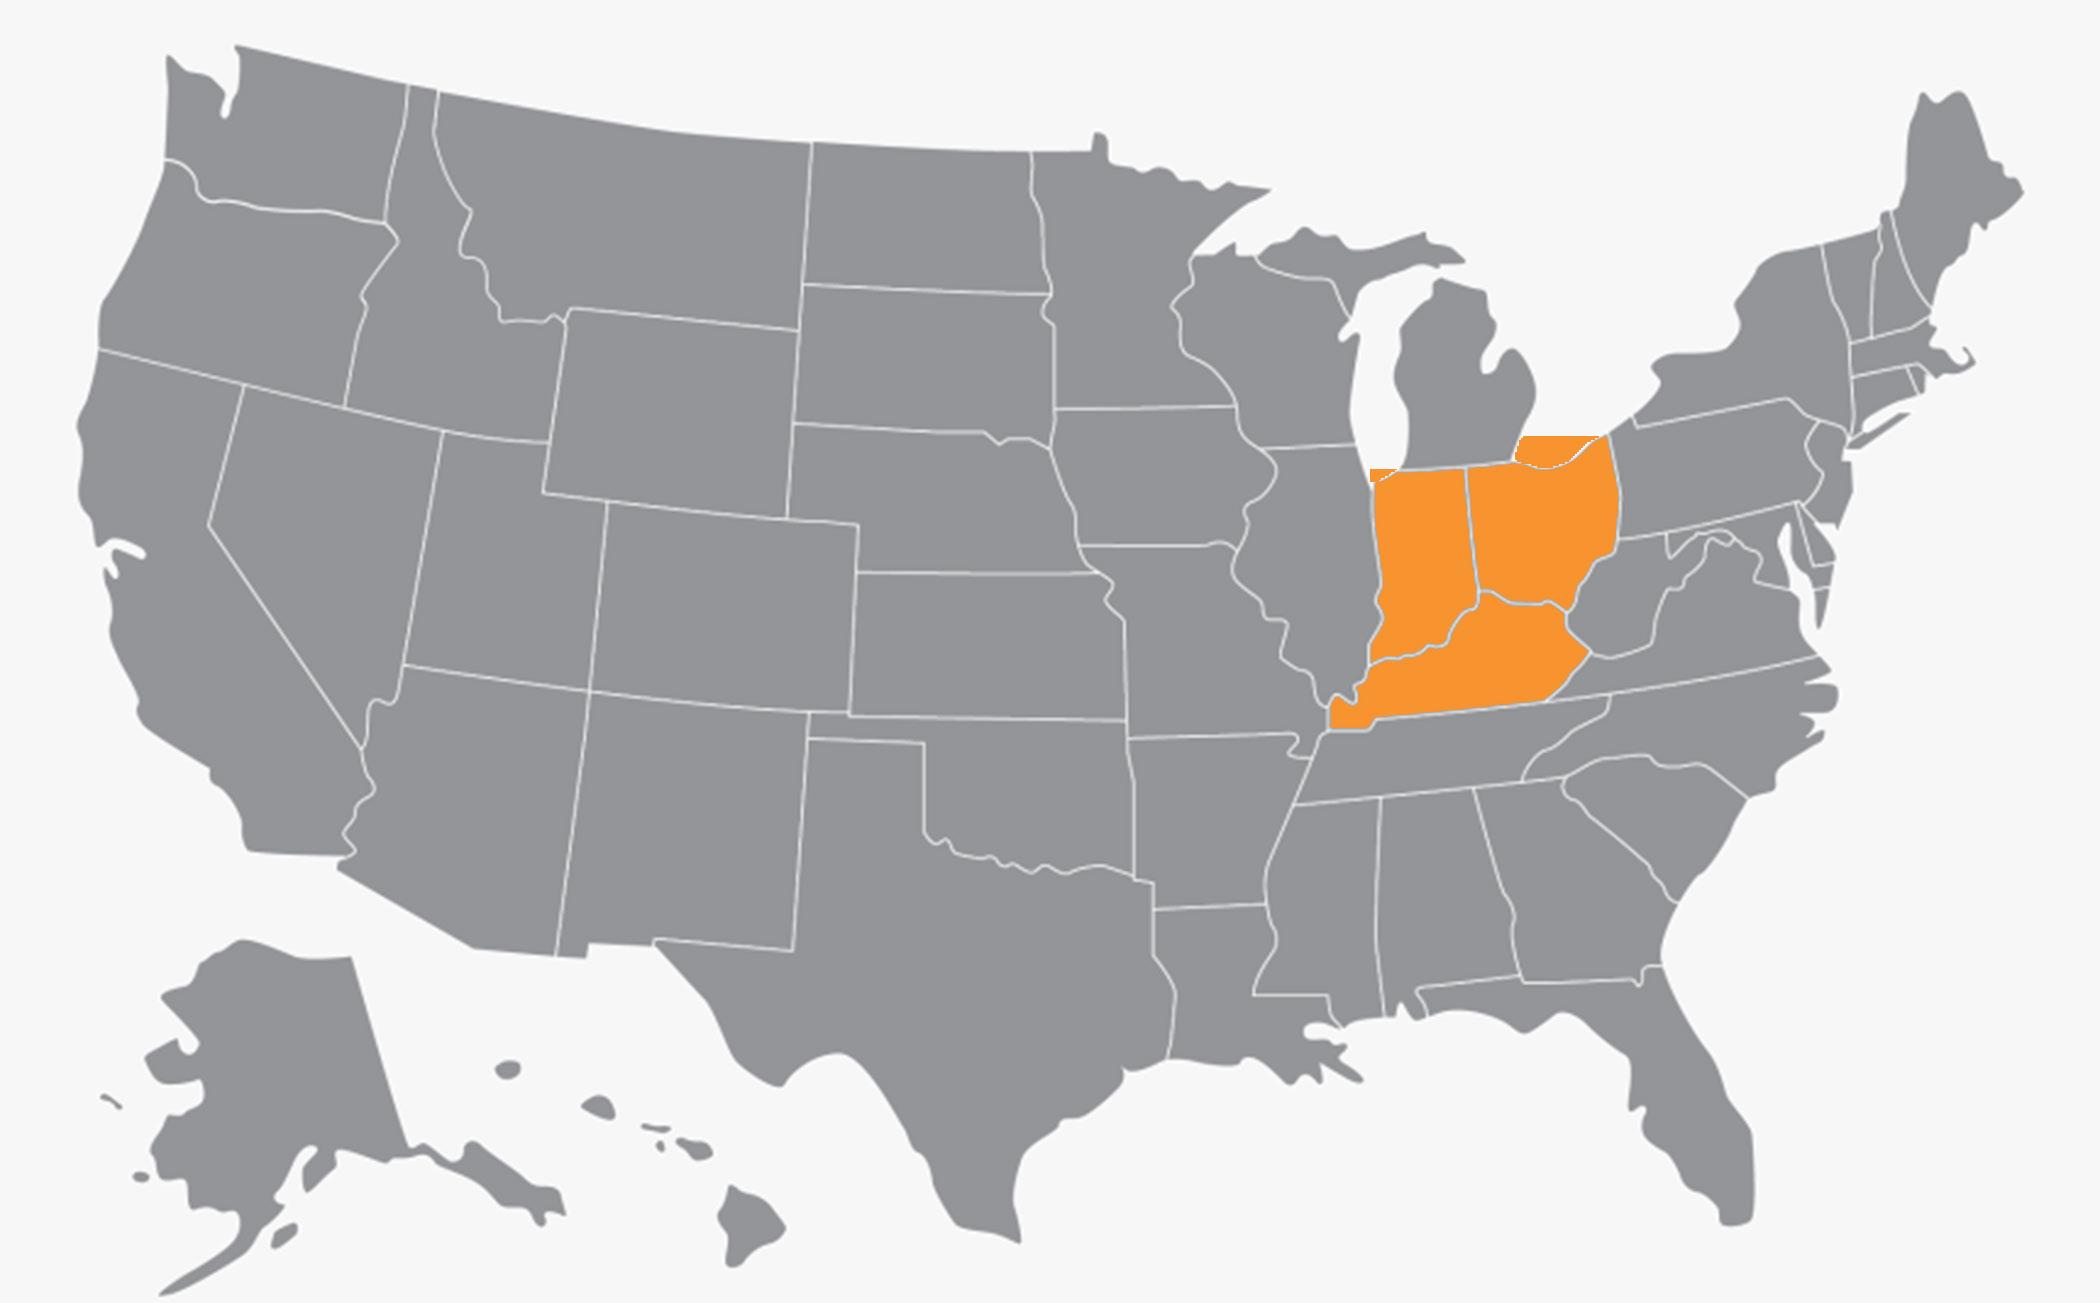
1| Over the past five years, annual absorption in Cincinnati has ranged from net move-outs from 1,253 units to demand for 4,544 units, averaging 2,182 units annually during that time. 2| In 2022, the market recorded net move-outs from 1,253 units, trailing concurrent supply volumes.
Supply
1| New apartment completions in Cincinnati were modest recently, as 2,249 units delivered in 2022. That annual completion volume was a six-year high. With 176 units removed from existing stock over the past year, the local inventory base grew 1.3%. 2| In the past year, supply was greatest in Central Cincinnati and Campbell/Kenton Counties. 3| New supply was concentrated in Central Cincinnati, Campbell/Kenton Counties and Northeast Cincinnati/Warren County, which received 66% of the markets total completions. 4| At the end of 2022, there were 6,462 units under construction with 4,669 of those units scheduled to complete in the next four quarters. Scheduled deliveries in the coming year are expected to be concentrated in North Central Cincinnati and Butler County.
2,249 units completed in past 12 months
6,462 units currently in progress