Students’ Corner
Application of Tableau in Business Analytics
Mr. Ayush Kumar Student IIM Amritsar
Data visualization tool tableau is one of the fastest-growing tools used in Business Intelligence. By using this tool, the data is simplified and presented in an easy-to-understand format. It allows any level of professional in an organization to understand data created by Tableau easily. Moreover, users without technical expertise can create customized dashboards using Tableau. Data analysis with the Tableau tool is incredibly fast, and the visualizations are created in dashboards and worksheets. Tableau can be used for the following purposes: ? BI (Business Intelligence) ? Data Visualization ? Data Blending
A-GRAM | 18
? Data Collaboration ? Visualization of queries ? To create no-code data queries ? To analyze data in real-time ? To manage extensive size metadata ? to import data of large size
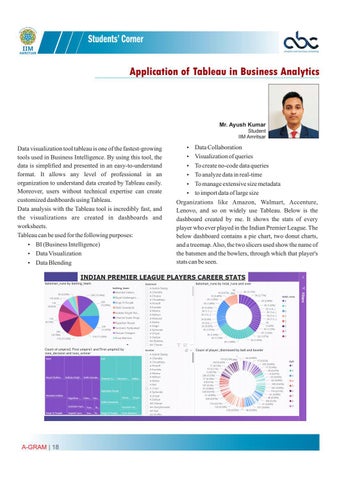
Organizations like Amazon, Walmart, Accenture, Lenovo, and so on widely use Tableau. Below is the dashboard created by me. It shows the stats of every player who ever played in the Indian Premier League. The below dashboard contains a pie chart, two donut charts, and a treemap. Also, the two slicers used show the name of the batsmen and the bowlers, through which that player's stats can be seen.


