JUNE 2023
INSIGHT REPORT
Terms of use and disclaimer
The analysis presented in the Global Gender Gap Report 2023 (herein: “Report”) is based on a methodology integrating the latest statistics from international organizations and a survey of executives.
The findings, interpretations and conclusions expressed in this work do not necessarily reflect the views of the World Economic Forum. The Report presents information and data that were compiled and/or collected by the World Economic Forum (all information and data referred herein as “Data”). Data in this Report is subject to change without notice. The terms country and nation as used in this Report do not in all cases refer to a territorial entity that is a state as understood by international law and practice. The terms cover well-defined, geographically self-contained economic areas that may not be states but for which statistical data are maintained on a separate and independent basis.
Although the World Economic Forum takes every reasonable step to ensure that the Data thus compiled and/or collected is accurately reflected in this Report, the World Economic Forum, its agents, officers and employees: (i) provide the Data “as is, as available” and without warranty of any kind, either express or implied, including, without limitation, warranties of merchantability, fitness for a particular purpose and non-infringement; (ii) make no representations, express or implied, as to the accuracy of the Data contained in this Report or its suitability for any particular purpose; (iii) accept no liability for any use of the said Data or reliance placed on it, in particular, for any interpretation, decisions, or actions based on the Data in this Report. Other parties may have ownership interests in some of the Data contained in this Report.
The World Economic Forum in no way represents or warrants that it owns or controls all rights in all Data, and the World Economic Forum will not be liable to users for any claims brought against users by third parties in connection with their use of any Data. The World Economic Forum, its agents, officers and employees do not endorse or in any respect warrant any third-party products or services by virtue of any Data, material or content referred to or included in this Report. Users shall not infringe upon the integrity of the Data and in particular shall refrain from any act of alteration of the Data that intentionally affects its nature or accuracy. If the Data is materially transformed by the user, this must be stated explicitly along with the required source citation. For Data compiled by parties other than the World Economic Forum, users must refer to these parties’ terms of use, in particular concerning the attribution, distribution, and reproduction of the Data. When Data for which the World Economic Forum is the source (herein “World Economic Forum”), is distributed or reproduced, it must appear accurately and be attributed to the World Economic Forum. This source attribution requirement is attached to any use of Data, whether obtained directly from the World Economic Forum or from a user. Users who make World Economic Forum Data available to other users through any type of distribution or download environment agree to make reasonable efforts to communicate and promote compliance by their end users with these terms.
Users who intend to sell World Economic Forum Data as part of a database or as a stand-alone product must first obtain the permission from the World Economic Forum (CNES@weforum.org).
World Economic Forum
91-93 route de la Capite
CH-1223 Cologny/Geneva
Switzerland
Tel.: +41 (0)22 869 1212
Fax: +41 (0)22 786 2744
E-mail: contact@weforum.org www.weforum.org
Copyright © 2022 by the World Economic Forum
All rights reserved. No part of this publication may be reproduced, stored in a retrieval system, or transmitted, in any form or by any means, electronic, mechanical, photocopying, or otherwise without the prior permission of the World Economic Forum.
ISBN-13: 978-2-940631-97-1
The report and an interactive data platform are available at http://reports.weforum.org/globalgender-gap-report-2023
Global Gender Gap Report 2023 June 2023 First part of the title: Second part of the title 2
Preface
Key Findings
1 Benchmarking gender gaps, 2023
1.1 Country coverage
1.2 Global results
1.3 Performance by subindex
1.4 Progress over time
1.5 Performance by region
1.6 In-focus country performances: Top 10 and 15 most populous
Endnotes
2 Gender gaps in the workforce
2.1 Evolving gender gaps in the global labour market
2.2 Workforce representation across industries
2.3 Representation of women in senior leadership
2.4 Gender gaps in the labour markets of the future
2.5 Gender gaps in the skills of the future
2.6 Gender gaps in political leadership
2.7 DEI programmes to close gender gaps
2.8 Putting gender parity at the heart of economic recovery and transformation
Endnotes
Contents
References Appendix A Appendix B Endnotes References User’s Guide Contributors and Acknowledgements 4 5 9 9 10 12 15 19 27 32 33 33 37 38 44 47 53 55 57 59 60 61 62 75 76 77 373 Global Gender Gap Report 2023 3
Preface
 Saadia Zahidi Managing Director
Recent years have been marked by major setbacks for gender parity globally, with previous progress disrupted by the COVID-19 pandemic’s impact on women and girls in education and the workforce, followed by economic and geopolitical crises. Today, some parts of the world are seeing partial recoveries while others are experiencing deteriorations as new crises unfold. Global gender gaps in health and education have narrowed over the past year, yet progress on political empowerment is effectively at a standstill, and women’s economic participation has regressed rather than recovered.
The tepid progress on persistently large gaps documented in this seventeenth edition of the Global Gender Gap Report creates an urgent case for renewed and concerted action. Accelerating progress towards gender parity will not only improve outcomes for women and girls but benefit economies and societies more widely, reviving growth, boosting innovation and increasing resilience. The report provides a tool for consistent tracking of gender gaps across the economic, political, health and education spheres, and is designed for leaders to identify areas for individual and collective action.
At the World Economic Forum, the Centre for the New Economy and Society complements measurement of gender gaps with a set of initiatives and coalitions dedicated to advancing progress. The Gender Parity Accelerators are working towards gender parity in economic participation –scaling policies and strategies to improve women’s representation in the workforce and in leadership – as well as pay equity. Accelerators are currently present in 14 countries in Latin America and the Caribbean, the Middle East and North Africa, Central Asia, East Asia and the Pacific, and SubSaharan Africa. The Global Learning Network linked to the Accelerators surfaces successful policies and practices and promotes knowledge exchange
between participating countries and a wider network of leaders. Focusing on corporate action, the Diversity, Equity and Inclusion (DEI) Lighthouse Programme brings together a cross-industry group of organizations taking action to drive better and faster DEI outcomes through CEO leadership, and knowledge-sharing on initiatives that have achieved significant, quantifiable and sustained impact for underrepresented groups.
This year’s edition of the Global Gender Gap Report also analyses new data on labour market outcomes for women, at both the macro-economic and industry level. We are grateful to LinkedIn and Coursera for their continued collaboration in providing unique data and new measures to track gender gaps in workforce participation, senior leadership and online skilling. We also thank the members of the Centre for the New Economy and Society Advisory Board for their leadership, the over 150 partners of the Centre, and the Global Future Council on the Future of the Care Economy and Community of Chief Diversity and Inclusion Officers for expert guidance, as well as a network of national ministries of economy, education and labour for their commitment to advancing gender parity.
We would like to express our gratitude to Silja Baller, Kusum Kali Pal, Kim Piaget and Ricky Li for their leadership of this project. We would also like to thank our colleagues Attilio Di Battista, Eoin O’Cathasaigh, Gulipairi Maimaiti and Mark Rayner for their support.
We hope the data and analysis provided in this report can further accelerate the speed of travel towards parity by catalysing and informing action by public- and private-sector leaders in their efforts to close the global gender gap. With the myriad challenges the world faces, we need the full power of human creativity and collaboration to find pathways to shared prosperity.
Global Gender Gap Report 2023 June 2023
Global Gender Gap Report 2023 4
Key Findings
The Global Gender Gap Index annually benchmarks the current state and evolution of gender parity across four key dimensions (Economic Participation and Opportunity, Educational Attainment, Health and Survival, and Political Empowerment). It is the longest-standing index tracking the progress of numerous countries’ efforts towards closing these gaps over time, since its inception in 2006.
This year, the 17th edition of the Global Gender Gap Index benchmarks gender parity across 146 countries, providing a basis for robust crosscountry analysis. Further, examining a subset of 102 countries that have been included in every edition of the index since 2006 provides a large constant sample for time-series analysis. The Global Gender Gap Index measures scores on a 0 to 100 scale and scores can be interpreted as the distance covered towards parity (i.e. the percentage of the gender gap that has been closed). Cross-country comparisons support the identification of the most effective policies to close gender gaps.
Key findings include the index results in 2023, trend analysis of the trajectory towards parity and data deep dives through new metrics partnerships and contextual data.
Global results and time to parity
The global gender gap score in 2023 for all 146 countries included in this edition stands at 68.4% closed. Considering the constant sample of 145 countries covered in both the 2022 and 2023 editions, the overall score changed from 68.1% to 68.4%, an improvement of 0.3 percentage points compared to last year’s edition.
When considering the 102 countries covered continuously from 2006 to 2023, the gap is 68.6% closed in 2023, recovering to the level reported in the 2020 edition and advancing by a modest 4.1 percentage points since the first edition of the report in 2006. At the current rate of progress, it will take 131 years to reach full parity. While the global parity score has recovered to pre-pandemic
levels, the overall rate of change has slowed down significantly. Even reverting back to the time horizon of 100 years to parity projected in the 2020 edition would require a significant acceleration of progress.
– According to the 2023 Global Gender Gap Index no country has yet achieved full gender parity, although the top nine countries (Iceland, Norway, Finland, New Zealand, Sweden, Germany, Nicaragua, Namibia and Lithuania) have closed at least 80% of their gap. For the 14th year running, Iceland (91.2%) takes the top position. It also continues to be the only country to have closed more than 90% of its gender gap.
– The global top five is completed by three other Nordic countries – Norway (87.9%, 2nd), Finland (86.3%, 3rd) and Sweden (81.5%, 5th) – with one country from East Asia and the Pacific – New Zealand (85.6%, 4th) – ranked 4th. Additionally, from Europe, Germany (81.5%) moves up to 6th place (from 10th), Lithuania (80.0.%) returns to the top 10 economies, taking 9th place, and Belgium (79.6%) joins the top 10 for the first time in 10th place. One country from Latin America (Nicaragua, 81.1%) and one from Sub-Saharan Africa (Namibia, 80.2%) – complete this year’s top 10, taking the 7th and 8th positions, respectively. The two countries that drop out of the top 10 in 2023 are Ireland (79.5%,11th, down from 9th in 2022) and Rwanda (79.4%, 12th, down from 6th).
–
For the 146 countries covered in the 2023 index, the Health and Survival gender gap has closed by 96%, the Educational Attainment gap by 95.2%, Economic Participation and Opportunity gap by 60.1%, and Political Empowerment gap by 22.1%.
– Based on the constant sample of 102 countries covered in all editions since 2006, there is an advancement from 95.3% to 96.1% on Educational Attainment between 2022 and 2023, moving beyond pre-pandemic levels, and an improvement from 95.7% to 95.9% for the Health and Survival dimension. The Political
Global Gender Gap Report 2023 June 2023 Global Gender Gap Report 2023 5
–
Empowerment score edges up from 22.4% to 22.5% and Economic Participation and Opportunity regresses from 60.0% in 2022 to 59.8% in 2023.
At the current rate of progress over the 20062023 span, it will take 162 years to close the Political Empowerment gender gap, 169 years for the Economic Participation and Opportunity gender gap, and 16 years for the Educational Attainment gender gap. The time to close the Health and Survival gender gap remains undefined.
Regional results and time to parity
Gender parity in Europe (76.3%) surpasses the parity level in North America (75%) this year to rank first of eight geographic regions. Closely behind Europe and North America is Latin America and the Caribbean, with 74.3% parity. Trailing more than 5 percentage points behind Latin America and the Caribbean are Eurasia and Central Asia (69%) as well as East Asia and the Pacific (68.8%). SubSaharan Africa ranks 6th (68.2%), slightly below the global weighted average score (68.3%). Southern Asia (63.4%) overtakes the Middle East and North Africa (62.6%), which is, in 2023, the region furthest away from parity.
– Across all subindexes, Europe has the highest gender parity of all regions at 76.3%, with one-third of countries in the region ranking in the top 20 and 20 out of 36 countries with at least 75% parity. Iceland, Norway and Finland are the best-performing countries, both in the region and in the world, while Hungary, Czech Republic and Cyprus rank at the bottom of the region. Overall, there is a decline of 0.2 percentage points in the regional score based on the constant sample of countries. At the current rate of progress, Europe is projected to attain gender parity in 67 years.
–
Just behind Europe, North America ranks second, having closed 75% of the gap, which is 1.9 percentage points lower than the previous edition. While Canada has registered a 0.2 percentage-point decline in the overall parity score since the last edition, the United States has seen a reduction of 2.1 percentage points. At the current rate of progress, 95 years will be needed to close the gender gap for the region.
– With incremental progress towards gender parity since 2017, Latin America and the Caribbean has bridged 74.3% of its overall gender gap, a 1.7 percentage-point increase in overall gender parity since last year. After Europe and North America, the region has the third-highest level of parity. Nicaragua, Costa Rica and Jamaica register the highest parity scores in this region and Belize, Paraguay and Guatemala the lowest. At the current rate of
–
progress, Latin America and the Caribbean will take 53 years to attain full gender parity.
At 69% parity, Eurasia and Central Asia ranks 4th out of the eight regions on the overall Gender Gap Index. Based on the aggregated scores of the constant sample of countries included since 2006, the parity score since the 2020 edition has stagnated, although there has been an improvement of 3.2 percentage points since 2006. Moldova, Belarus and Armenia are the highest-ranking countries in the region, while Azerbaijan, Tajikistan and Türkiye rank the lowest. The difference in parity between the highest and the lowest ranked country is 14.9 percentage points. At the current rate of progress, it will take 167 years for the Eurasia and Central Asia region to reach gender parity.
– East Asia and the Pacific is at 68.8% parity, marking the fifth-highest score out of the eight regions. Progress towards parity has been stagnating for over a decade and the region registers a 0.2 percentage-point decline since the last edition. New Zealand, the Philippines and Australia have the highest parity at the regional level, with Australia and New Zealand also being the two most-improved economies in the region. On the other hand, Fiji, Myanmar and Japan are at the bottom of the list, with Fiji, Myanmar and Timor-Leste registering the largest declines. At the current rate of progress, it will take 189 years for the region to reach gender parity.
–Sub-Saharan Africa’s parity score is the sixthhighest among the eight regions at 68.2%, ranking above Southern Asia and the Middle East and North Africa. Progress in the region has been uneven. Namibia, Rwanda and South Africa, along with 13 other countries, have closed more than 70% of the overall gender gap. The Democratic Republic of the Congo, Mali and Chad are the lowest-performing countries, with scores below 62%. Based on the constant sample, this marks a marginal improvement of 0.1 percentage points. At the current rate of progress, it will take 102 years to close the gender gap in Sub-Saharan Africa.
– Southern Asia has achieved 63.4% gender parity, the second-lowest score of the eight regions. The score has risen by 1.1 percentage points since the last edition on the basis of the constant sample of countries covered since 2006, which can be partially attributed to the rise in scores of populous countries such as India, Pakistan and Bangladesh. Along with Bhutan, these are the countries in Southern Asia that have seen an improvement of 0.5 percentage points or more in their scores since the last edition. Bangladesh, Bhutan and Sri Lanka are the best-performing countries in the region, while Pakistan, Iran and Afghanistan are at the bottom of both the regional and global ranking tables. At the current rate of progress,
Global Gender Gap Report 2023 6
–
full parity in the region will be achieved in 149 years.
In comparison to other regions, the Middle East and North Africa remains the furthest away from parity, with a 62.6% parity score. This is a 0.9 percentage-point decline in parity since the last edition for this region, based on the constant sample of countries covered since 2006. The United Arab Emirates, Israel and Bahrain have achieved the highest parity in the region, while Morocco, Oman and Algeria rank the lowest. The region’s three most populous countries – Egypt, Algeria and Morocco –register declines in their parity scores since the last edition. At the current rate of progress, full regional parity will be attained in 152 years.
Evolving gender gaps in the global labour market
The state of gender parity in the labour market remains a major challenge. Not only has women’s participation in the labour market globally slipped in recent years, but other markers of economic opportunity have been showing substantive disparities between women and men. While women have (re-)entered the labour force at higher rates than men globally, leading to a small recovery in gender parity in the labour-force participation rate since the 2022 edition, gaps remain wide overall and are apparent in several specific dimensions.
– Evolving gender gaps in the global labour market: Women have been (re-)entering the workforce at a slightly higher rate than men, resulting in a modest recovery from last year’s low. Between the 2022 and 2023 edition, parity in the labour-force participation rate increased from 63% to 64%. However, the recovery in women’s labour-force participation remains unfinished, as parity is still at the second-lowest point since the first edition of the index in 2006 and significantly below its 2009 peak of 69%. Compounding these patterns, women continue to face higher unemployment rates than men, with a global unemployment rate at around 4.5% for women and 4.3% for men. Even when women secure employment, they often face substandard working conditions: a significant portion of the recovery in employment since 2020 can be attributed to informal employment, whereby out of every five jobs created for women, four are within the informal economy; for men, the ratio is two out of every three jobs.
– Workforce representation across industries: Global data provided by LinkedIn shows persistent skewing in women’s representation in the workforce and leadership across industries. In LinkedIn’s sample, which covers 163 countries, women account for 41.9% of the workforce in 2023, yet the share of women in senior leadership positions (Director, VicePresident (VP) or C-suite) is at 32.2% in 2023,
nearly 10 percentage points lower. Women’s representation drops to 25% in C-suite positions on average, which is just more than half of the representation in entry-level positions, at 46%. Different industries display different intensities and patterns when it comes to this “drop to the top”. Women fare relatively better in industries such as Consumer Services, Retail, and Education, which register ratios of C-suite vs entry level representation between 64% and 68%. Construction, Financial Services, and Real Estate present the toughest conditions for aspiring female leaders, with a ratio of C-suite to entry-level representation of less than 50%. For the past eight years, the proportion of women hired into leadership positions has been steadily increasing by about 1% per year globally. However, this trend shows a clear reversal starting in 2022, which brings the 2023 rate back to 2021 levels.
– Gender gaps in the labour markets of the future: Science, technology, engineering and mathematics (STEM) occupations are an important set of jobs that are well remunerated and expected to grow in significance and scope in the future. Linkedin data on members’ job profiles show that women remain significantly underrepresented in the STEM workforce. Women make up almost half (49.3%) of total employment across non-STEM occupations, but just 29.2% of all STEM workers. While the percentage of female STEM graduates entering into STEM employment is increasing with every cohort, the numbers on the integration of STEM university graduates into the labour market show that the retention of women in STEM even one year after graduating sees a significant drop. Women currently account for 29.4% of entry-level workers; yet for high-level leadership roles such as VP and C-suite, representation drops to 17.8% and 12.4%, respectively. When it comes to artificial intelligence (AI) specifically, talent availability overall has surged, increasing six times between 2016 and 2022, yet female representation in AI is progressing very slowly. The percentage of women working in AI today is approximately 30%, roughly 4 percentage points higher than it was in 2016. –
Gender gaps in the skills of the future: Online learning offers flexibility, accessibility and customization, enabling learners to acquire knowledge in a manner that suits their specific needs and circumstances. However, women and men currently do not have equal opportunties and access to these online platforms, given the persistent digital divide. Even when they do use these platforms, there are gender gaps in skilling, especially those skills that are projected to grow in importance and demand. Data from Coursera suggests that as of 2022, except for teaching and mentoring courses, there is disparity in enrolment in every skill category. For enrolment in technology skills such as
Global Gender Gap Report 2023 7
technological literacy (43.7% parity) and AI and big data (33.7%), which are among the top 10 skills projected to grow, there is less than 50% parity and progress has been sluggish. Across all skill categories, the gender gaps tend to widen as proficiency levels increase. However, when women do enrol, they tend to attain most proficiency levels across skill categories studied in less time compared to men.
– Gender gaps in political leadership: Much like in the case of representation of women in business leadership, gender gaps in political leadership continue to persist. Although there has been an increase in the number of women holding political decision-making posts worldwide, achieving gender parity remains a distant goal and regional disparities are significant. As of 31 December 2022, approximately 27.9% of the global population, equivalent to 2.12 billion people, live in countries with a female head of state. While this indicator experienced stagnation between 2013 and 2021, 2022 witnessed a significant increase. Another recent positive trend is observed for the share of women in parliaments. In 2013, only 18.7% of parliament members globally were women among the 76 countries with consistent data. By 2022, this number had risen steadily to 22.9%. Significant strides have also been made in terms of women’s representation in local government globally. Out of the 117 countries with available data since 2017, 18 countries, including Bolivia (50.4%), India (44.4%) and France (42.3%), have achieved representation of women of over 40% in local governance.
DEI programmes to close gender gaps: In the private sector, the scope of gender parity action by pioneering firms has begun to broaden from a focus on the workforce to whole-of-business approaches encompassing inclusive design, inclusive supply chains and community impact. The World Economic Forum’s 2023 Future of Jobs Survey suggests that more than two-thirds of the organizations surveyed have implemented a Diversity, Equity and Inclusion (DEI) programme. The majority (79%) of companies surveyed are implementing DEI programmes with a focus on women.
Increasing women’s economic participation and achieving gender parity in leadership, in both business and government, are two key levers for addressing broader gender gaps in households, societies and economies. Collective, coordinated and bold action by private- and public-sector leaders will be instrumental in accelerating progress towards gender parity and igniting renewed growth and greater resilience. Recent years have seen major setbacks and the state of gender parity still varies widely by company, industry and economy. Yet, a growing number of actors have recognized the importance and urgency of taking action, and evidence on effective gender parity initiatives is solidifying. We hope the data and analysis provided in this report can further accelerate the speed of travel towards parity by catalysing and informing action by public- and private-sector leaders in their efforts to close the global gender gap.
–
Global Gender Gap Report 2023 8
Benchmarking gender gaps, 2023
The Global Gender Gap Index was first introduced by the World Economic Forum in 2006 to benchmark progress towards gender parity and compare countries’ gender gaps across four dimensions: economic opportunities, education, health and political leadership.
The goal of the report is to offer a consistent annual metric for the assessment of progress over time. Using the methodology introduced in 2006, the index and the analysis focus on benchmarking parity between women and men across countries and regions.
The level of progress toward gender parity (the parity score) for each indicator is calculated as the ratio of the value of each indicator for women to the value for men. A parity score of 1 indicates full parity. The gender gap is the distance from full parity.
The analysis in this report is focused on assessing gender gaps between women and men across economic, educational, health and political outcomes based on the data available (Figure 1.1).
For further information on the index methodology, please refer to Appendix B.
To ensure a global representation of the gender gap, the report aims to cover as many economies as possible. For a country to be included, it must report data for a minimum 12 of the 14 indicators that comprise the index. We also aim to include the latest data available, reported within the last 10 years.
The report this year covers 146 countries. In this edition, Croatia rejoins the index, whereas Guyana drops out.
Among the 146 countries included this year are a set of 102 countries that have been covered in all editions since the inaugural one in 2006. Scores based on this constant set of countries are used to compare regional and global aggregates across time.
It should be noted that there may be time lags in the data collection and validation processes across the organizations from which the data is sourced, and that all results should be interpreted within a range of global, regional and national contextual factors. The Economy Profiles at the end of the report provide a large range of additional data.
1
Country coverage 1.1 Source The Global Gender Gap Index Framework FIGURE 1.1 Subindex
Economic Participation
Opportunity Subindex
Educational Attainment Subindex
Health
Political
1
and
2
3
and Survival Subindex 4
Empowerment
World Economic Forum, Global Gender Gap Index , 2023
Global Gender Gap Report 2023 June 2023 Global Gender Gap Report 2023 9
Global results 1.2
The Global Gender Gap score in 2023 for all 146 countries included in this edition stands at 68.4% closed. Considering the constant sample of 145 countries covered in the 2022 and 2023 editions, the overall score changed from 68.1% to 68.4%, an improvement of 0.3 percentage points compared to last year’s edition. When considering the 102 countries covered continuously from 2006 to 2023, the gap is 68.6% closed.
Compared to last year, progress towards narrowing the gender gap has been more widespread: 42 of the 145 economies covered in both the 2022 and 2023 editions improved their gender parity score by at least 1 percentage point since the previous edition and 40 other countries registered gains of less than 1 percentage point. The economies with the greatest increase in score (gains of 4 percentage points or more) are Liberia (score: 76%, +5.1 percentage points since the previous edition), Estonia (78.2%, +4.8 percentage points), Bhutan (68.2%, +4.5 percentage points), Malawi (67.6%, +4.4 percentage points), Colombia (75.1%, +4.1 percentage points) and Chile (77.7%, +4.1 percentage points).
While there is an increase in the number of countries registering at least a marginal improvement, such progress is mitigated by an increase in the number of countries with declining scores steeper than 1 percentage point (from 12 in 2022 to 35 in 2023).
Table 1.1 shows the 2023 Global Gender Gap rankings and the scores for all 146 countries included in this year’s report. Although no country has yet achieved full gender parity, the top nine countries (Iceland, Norway, Finland, New Zealand, Sweden, Germany, Nicaragua, Namibia and Lithuania) have closed at least 80% of their gap. For the 14th year running, Iceland (91.2%) takes the top position. It also continues to be the only country to have closed more than 90% of its gender gap. The global top five is completed by three other Nordic countries – Norway (87.9%, 2nd), Finland (86.3%, 3rd) and Sweden (81.5%, 5th) – and one country from East Asia and the Pacific – New Zealand (85.6%, 4th). Additionally, from Europe, Germany (81.5%) moves up to 6th place (from 10th), Lithuania (80.0.%) returns to the top 10 economies, taking 9th place, and Belgium (79.6%) joins the top 10 for the first time in 10th place. One country from Latin America (Nicaragua, 81.1%) and one from Sub-Saharan Africa (Namibia, 80.2%) – complete this year’s top 10, taking the 7th and 8th positions, respectively. The two countries that drop out of the top 10 in 2023 are Ireland (79.5%,11th, down from 9th place) and Rwanda (79.4%, 12th, down from 6th place in 2022).
Global Gender Gap Report 2023 10
Country
Source World Economic Forum, Global Gender Gap Index, 2023.
Note
“–” indicates score or rank is unchanged from the previous year.
“n/a” indicates that the country was not covered in previous editions.
* New to index in 2023
Rank
Score Score change Rank change 0–1 2022 2022
Iceland 0.912 █ +0.004 -
Norway 0.879 █ +0.034 +1
Finland 0.863 █ +0.003 -1
New Zealand 0.856 █ +0.0145 Sweden 0.815 █ -0.0076 Germany 0.815 █ +0.014 +4 7 Nicaragua 0.811 █ +0.0018 Namibia 0.802 █ -0.0059 Lithuania 0.800 █ +0.001 +2 10 Belgium 0.796 █ +0.003 +4 11 Ireland 0.795 █ -0.010 -2 12 Rwanda 0.794 █ -0.017 -6 13 Latvia 0.794 █ +0.023 +13 14 Costa Rica 0.793 █ -0.003 -2 15 United Kingdom 0.792 █ +0.012 +7 16 Philippines 0.791 █ +0.009 +3 17 Albania 0.791 █ +0.004 +1 18 Spain 0.791 █ +0.002 -1 19 Moldova, Republic of 0.788 █ -0.001 -3 20 South Africa 0.787 █ +0.00521 Switzerland 0.783 █ -0.012 -8 22 Estonia 0.782 █ +0.048 +30 23 Denmark 0.780 █ +0.017 +9 24 Jamaica 0.779 █ +0.031 +14 25 Mozambique 0.778 █ +0.025 +9 26 Australia 0.778 █ +0.040 +17 27 Chile 0.777 █ +0.041 +20 28 Netherlands 0.777 █ +0.00929 Slovenia 0.773 █ +0.029 +10 30 Canada 0.770 █ -0.002 -5 31 Barbados 0.769 █ +0.005 -1 32 Portugal 0.765 █ -0.001 -3 33 Mexico 0.765 █ +0.001 -2 34 Peru 0.764 █ +0.015 +3 35 Burundi 0.763 █ -0.013 -11 36 Argentina 0.762 █ +0.006 -3 37 Cabo Verde 0.761 █ +0.024 +8 38 Serbia 0.760 █ -0.019 -15 39 Liberia 0.760 █ +0.051 +39 40 France 0.756 █ -0.035 -25 41 Belarus 0.752 █ +0.002 -5 42 Colombia 0.751 █ +0.041 +33 43 United States of America 0.748 █ -0.021 -16 44 Luxembourg 0.747 █ +0.011 +2 45 Zimbabwe 0.746 █ +0.012 +5 46 Eswatini 0.745 █ +0.017 +12 47 Austria 0.740 █ -0.041 -26 48 Tanzania, United Republic of 0.740 █ +0.020 +16 49 Singapore 0.739 █ +0.00550 Ecuador 0.737 █ -0.005 -9 51 Madagascar 0.737 █ +0.002 -3 52 Suriname 0.736 █ -0.002 -8 53 Honduras 0.735 █ +0.030 +29 54 Lao People's Democratic Republic 0.733 █ - -1 55 Croatia* 0.730 █ n/a n/a 56 Bolivia (Plurinational State of) 0.730 █ -0.004 -5 57 Brazil 0.726 █ +0.030 +37 58 Panama 0.724 █ -0.019 -18 59 Bangladesh 0.722 █ +0.008 +12 60 Poland 0.722 █ +0.012 +17 61 Armenia 0.721 █ +0.023 +28 62 Kazakhstan 0.721 █ +0.003 +3 63 Slovakia 0.720 █ +0.003 +4 64 Botswana 0.719 █ - +2 65 Bulgaria 0.715 █ -0.025 -23 66 Ukraine 0.714 █ +0.007 +15 67 Uruguay 0.714 █ +0.004 +5 68 El Salvador 0.714 █ -0.013 -9 69 Montenegro 0.714 █ -0.018 -15 70 Malta 0.713 █ +0.010 +15 71 United Arab Emirates 0.712 █ -0.004 -3 72 Viet Nam 0.711 █ +0.006 +11 73 North Macedonia 0.711 █ -0.005 -4 Rank Country Score Score change Rank change 0–1 2022 2022 74 Thailand 0.711 █ +0.002 +5 75 Ethiopia 0.711 █ +0.001 -1 76 Georgia 0.708 █ -0.022 -21 77 Kenya 0.708 █ -0.021 -20 78 Uganda 0.706 █ -0.017 -17 79 Italy 0.705 █ -0.015 -16 80 Mongolia 0.704 █ -0.010 -10 81 Dominican Republic 0.704 █ +0.001 +3 82 Lesotho 0.702 █ +0.002 +5 83 Israel 0.701 █ -0.026 -23 84 Kyrgyzstan 0.700 █ - +2 85 Zambia 0.699 █ -0.025 -23 86 Bosnia and Herzegovina 0.698 █ -0.012 -13 87 Indonesia 0.697 █ +0.001 +5 88 Romania 0.697 █ -0.001 +2 89 Belize 0.696 █ +0.002 +6 90 Togo 0.696 █ -0.001 +1 91 Paraguay 0.695 █ -0.012 -11 92 Cambodia 0.695 █ +0.005 +6 93 Greece 0.693 █ +0.005 +7 94 Cameroon 0.693 █ +0.002 +3 95 Timor-Leste 0.693 █ -0.037 -39 96 Brunei Darussalam 0.693 █ +0.013 +8 97 Azerbaijan 0.692 █ +0.005 +4 98 Mauritius 0.689 █ +0.011 +7 99 Hungary 0.689 █ -0.010 -11 100 Ghana 0.688 █ +0.016 +8 101 Czech Republic 0.685 █ -0.024 -25 102 Malaysia 0.682 █ +0.001 +1 103 Bhutan 0.682 █ +0.045 +23 104 Senegal 0.680 █ +0.012 +8 105 Korea, Republic of 0.680 █ -0.010 -6 106 Cyprus 0.678 █ -0.018 -13 107 China 0.678 █ -0.004 -5 108 Vanuatu 0.678 █ +0.008 +3 109 Burkina Faso 0.676 █ +0.017 +6 110 Malawi 0.676 █ +0.044 +22 111 Tajikistan 0.672 █ +0.009 +3 112 Sierra Leone 0.667 █ -0.005 -3 113 Bahrain 0.666 █ +0.034 +18 114 Comoros 0.664 █ +0.033 +20 115 Sri Lanka 0.663 █ -0.007 -5 116 Nepal 0.659 █ -0.033 -20 117 Guatemala 0.659 █ -0.006 -4 118 Angola 0.656 █ +0.018 +7 119 Gambia 0.651 █ +0.010 +2 120 Kuwait 0.651 █ +0.018 +10 121 Fiji 0.650 █ -0.026 -14 122 Côte d'Ivoire 0.650 █ +0.018 +11 123 Myanmar 0.650 █ -0.027 -17 124 Maldives 0.649 █ +0.001 -7 125 Japan 0.647 █ -0.002 -9 126 Jordan 0.646 █ +0.007 -4 127 India 0.643 █ +0.014 +8 128 Tunisia 0.642 █ -0.001 -8 129 Türkiye 0.638 █ -0.001 -5 130 Nigeria 0.637 █ -0.002 -7 131 Saudi Arabia 0.637 █ +0.001 -4 132 Lebanon 0.628 █ -0.015 -13 133 Qatar 0.627 █ +0.011 +4 134 Egypt 0.626 █ -0.008 -5 135 Niger 0.622 █ -0.013 -7 136 Morocco 0.621 █ -0.003137 Guinea 0.617 █ -0.030 -19 138 Benin 0.616 █ +0.004139 Oman 0.614 █ +0.006140 Congo, Democratic Republic of the 0.612 █ +0.036 +4 141 Mali 0.605 █ +0.003142 Pakistan 0.575 █ +0.011 +3 143 Iran (Islamic Republic of) 0.575 █ -0.002144 Algeria 0.573 █ -0.030 -4 145 Chad 0.570 █ -0.008 -3 146 Afghanistan 0.405 █ -0.030The Global Gender Gap Index 2023 rankings TABLE 1.1 Eurasia and Central Asia Middle East and North Africa East Asia and the Pacific Latin America and the Caribbean North America Southern Asia Sub-Saharan Africa Europe Global Gender Gap Report 2023 11
1
2
3
4
Performance by subindex 1.3
This section discusses the global gender gap scores across the four main components (subindexes) of the index: Economic Participation and Opportunity, Educational Attainment, Health and Survival, and Political Empowerment. In doing so, it aims to illuminate and explore the factors that are driving the overall average global gender gap score.
Summarized in Figure 1.2, this year’s results show that across the 146 countries covered by the 2023 index, the Health and Survival gender gap has closed by 96%, Educational Attainment by 95.2%, Economic Participation and Opportunity by 60.1% and Political Empowerment by 22.1%.
When looking at the sample of 145 countries included in both the 2022 and 2023 editions, results show that this year’s progress is mainly caused by a significant improvement on the Educational Attainment gap and more modest increases for the Health and Survival and Political Empowerment subindexes. The Economic Participation and Opportunity gender parity score has, however, receded since last year.
The score distributions across each subindex offer a more detailed picture of the disparities in country-specific gender gaps across the four dimensions. Figure 1.3 marks the distribution of individual country scores attained both overall and by subindex.
FIGURE 1.2
The state of gender gaps, by subindex
Percentage of the gender gap closed to date, 2023
More than two-thirds (69.2%) of countries score above the 2023 population-weighted average Gender Gap Index score (68.4%). Similar to 2022, Afghanistan (40.5%) ranks last, at the lower end of the distribution, with a difference of 27.8 percentage points compared to the mean. In fact, Afghanistan registers the lowest performance across all subindexes, with the exception of the Health and Survival subindex, where it takes the 141st position, ranking below the bottom 5th percentile. The country scoring penultimate in the global ranking is Chad (57.0%), which deviates from the average score by 11.3 percentage points.
Health and Survival, followed by Educational Attainment, continue to display the least amount of variation of scores, whereas the Economic Participation and Opportunity and Political Empowerment subindexes continue to show the widest dispersion of scores. The range of scores in this year’s gender gap in Economic Participation
and Opportunity has not changed since last year: the difference between the highest scores (89.5%) and the country with the lowest scores (18.8%) remains extensive (70.8%).
Countries that report relatively even access for men and women when it comes to Economic Participation and Opportunity include economies as varied as Liberia (89.5%), Jamaica (89.4%), Moldova (86.3%), Lao PDR (85.1%), Belarus (81.9%), Burundi (81.0%) and Norway (80%). At the bottom of the distribution, apart from Afghanistan, the countries that attained less than 40% parity include Algeria (31.7%), Iran (34.4%), Pakistan (36.2%) and India (36.7%).
A closer look at performance across the five indicators composing this subindex reveals that an important source of gender inequality stems from the overall underrepresentation of women in the labour market. The global population-weighted
The
Index Educational Attainment subindex Economic Participation and Opportunity subindex Health and Survival subindex Political Empowerment subindex 68.4% 60.1% 95.2% 96.0% 22.1% 0 25 50 75 100 Percentage points
Global Gender Gap
Source
Note
World Economic Forum, Global Gender Gap Index, 2023.
Population-weighted averages, 146 countries.
Global Gender Gap Report 2023 12
score indicates that, on average, only 64.9% of the gender gap in labour-force participation has been closed. Comparing the 102-country constant sample scores of 63.8% for 2023 and 62.9% for 2022, this marks a partial recovery. Chapter 2 examines recent dynamics in labour-force participation and related labour-market outcomes in more detail.
Though stark income gaps continue to hinder economic gender parity, with almost half (48.1%) of the overall earned income gap yet to close, results indicate that many countries experienced improvements since last year. Ninety-six countries (out of the 145 included in 2022 and 2023) progressed in bridging income gaps. The highestscoring countries on this dimension include Liberia, followed by Zimbabwe (97.6%), Tanzania (90.3%), Burundi (88.3%), Barbados (88.1%) and Norway (85.1%), which all stand at above 85% parity. At the bottom of the distribution, Iran (17.1%), Algeria (19.2%) and Egypt (19.7%) display some of the largest inequalities between the incomes of men and women, scoring less than 20% parity.
When it comes to wages for similar work, the only countries in which the gender gap is perceived as more than 80% closed are Albania (85.8%) and Burundi (84.1%). Merely a quarter of the 146 economies included in this year’s edition score between 70%-80% on this indicator. These include some of the most advanced economies, such as Iceland (78.4% of gap closed), Singapore (78.3%), United Arab Emirates (77.6%), United States (77.3%), Finland (76.3%), Qatar (74.5%), Saudi Arabia (74.1%), Lithuania (74.1%), Slovenia (73.5%), Bahrain (72.8%), Estonia (71.4%), Barbados (71.2%), Luxembourg (70.4%), New Zealand (70.4%), Switzerland (70.3%), and Latvia (70.1%). The lowest-ranking countries on this dimension are Croatia (49.7% of the gap closed) and Lesotho (49.4%). Compared to last year’s performance, Bolivia, El Salvador and South Africa registered the largest improvements in score, of 5 percentage points or more.
Cross-country disparities are more pronounced in terms of the gender gap in senior, managerial and legislative roles, which globally stands at 42.9%. Ten countries assessed this year – six of which located in Sub-Saharan Africa – report parity on this indicator. Afghanistan, Pakistan and Algeria rank at the bottom, with less than 5% of professionals in senior positions being women. When it comes to professional and technical positions, 71% of the gender gap has been closed globally. Whereas women’s representation in managerial roles relative to men’s has improved by at least 1 percentage points for 38 countries, gender parity in professional and technical roles has improved for only 20 countries by the same measure (at least 1 percentage points).
Educational Attainment is the subindex with the second-highest global parity score, with only 4.8% of the gender gap left to close. When looking
at the subset of 145 countries included in both 2022 and 2023, the number of economies with full gender parity in Educational Attainment has increased from 21 to 25. Cross-country scores on this dimension are less dispersed than for the Economic Participation or Political Empowerment subindices, with the majority (80.1%, or 117 out of 146) of participating countries having closed at least 95% of their educational gender gap. Similar to last year, Afghanistan is the only country where the educational gender parity score is below the 50% mark, at 48.2%. At the bottom of the distribution, we also encounter the Sub-Saharan countries of Chad, the Democratic Republic of the Congo, Guinea, Angola, Niger and Mali – all with scores above 60%, but below 80% in educational parity (between 63.7%-77.9%).
Across indicators of the subindex, gender parity is lowest for literacy rate: globally, 94% of the gender gap in the proportion of those over 15 years of age who are literate has closed. Fifty-six countries have achieved full parity in literacy rate, whereas Afghanistan and Sub-Saharan countries such as Mali, Liberia, Chad and Guinea all register parity scores below 55%. When it comes to enrolment in primary education, full parity scores are more widespread: 65 countries register equivalent rates of enrolment in primary education for boys and for girls. The rest of the countries included this year display at least 90% parity, apart from the SubSaharan countries of Mali, Guinea and Chad, which score within the 80.4%-89.9% range.
Cross-national variation is wider for both secondary and tertiary enrolment. Whereas most countries (135) included in this edition closed at least 80% of their gender gap in secondary enrolment, a handful of countries remain below this threshold, with Congo (64% of the gap closed), Chad (58.3%) and Afghanistan (57.1) ranking last. Geographical disparities are even starker for tertiary education. While 101 countries display full parity on this indicator, including Cambodia as the most recent to reach the 1 parity mark this year, 18 more countries stand within the 80.2%-99.5% range, while several countries from Sub-Saharan Africa (such as Burkina Faso, Mali and Côte d’Ivoire), Southern Asia (Afghanistan), and Eurasia and Central Asia (Tajikistan) still have between 21.7% (Côte d’Ivoire) and 71% (Afghanistan) of their gaps left to close.
The Health and Survival subindex displays the highest level of gender parity globally (at 96%) as well as the most clustered distribution of scores. The majority of countries (91.1%) register at most 2 percentage points above the average, and only a handful of others (13 out of 146) register at most 2.4 percentage points below the average. Twentysix countries – most from Europe, Latin America and the Caribbean, and Sub-Saharan Africa – display the top score of 98% parity,1 whereas Qatar, Viet Nam and populous countries such as Azerbaijan, India and China all score below the 95% mark.
Global Gender Gap Report 2023 13
Qatar’s lower overall ranking is driven by relatively lower parity in terms of healthy life expectancy. Though in most countries women tend to outlive men, in five Middle Eastern and North African countries (Morocco, 99.9%; Bahrain, 99.3%; Algeria, 99%; Jordan, 98.7%; Qatar, 95.5%), one from Sub-Saharan Africa (Mali, 99.3%) and two from Southern Asia (Pakistan, 99.9%, and Afghanistan, 97.1%), the reverse is true.
For Viet Nam, Azerbaijan, India and China, the relatively low overall rankings on the Health and Survival subindex is explained by skewed sex ratios at birth. Compared to top scoring countries that register a 94.4% gender parity at birth, the indicator stands at 92.7% for India (albeit an improvement over last edition) and below 90% for Viet Nam, China and Azerbaijan.
Finally, the Political Empowerment subindex registers once again the largest gender gap, at only 22.1% of the gap closed and the greatest spread of scores across countries. Iceland stands out as best performer, with a 90.1% parity score, which is 13.6 percentage points greater than the country ranking second (Norway) and 69 percentage points above the median global score (21.1%). In addition to the first two ranked, only 10 other countries out of the 146 included this year score above the 50% parity score: New Zealand (72.5%), Finland (70%), Germany (63.4%), Nicaragua (62.6%), Bangladesh (55.2%), Mozambique (54.2%), Rwanda (54.1%), Costa
Rica (52.4%), Sweden (51.2%) and Chile (50.2%). The lowest parity scores are found for: Myanmar (4.7%), Nigeria (4.1%), Iran (3.1%), Lebanon (2.1%), Vanuatu (0.6%) and Afghanistan (0%).
Iceland and Bangladesh are the only countries where women have held the highest political position in a country for a higher number of years than men. In 67 other countries, women have never served as head of state in the past 50 years.
In terms of the share of women in ministerial positions, 11 out of 146 countries, led by Albania, Finland and Spain, have 50% or more ministers who are women. However, 75 countries have 20% or less female ministers. Further, populous countries such as India, Türkiye and China have less than 7% ministers who are women and countries like Azerbaijan, Saudi Arabia and Lebanon have none.
As regards to parity in the number of seats in national parliaments, five countries stand at full parity: Mexico, Nicaragua, Rwanda, the United Arab Emirates and (as of this year’s edition) New Zealand. The countries with the least representation of women in parliament (less than 5%) are Maldives (4.8% of the gender gap closed), Qatar (4.6%), Nigeria (3.7%), Oman (2.4%) and Vanuatu (1.9%). Though still below the 40% parity threshold, Benin and Malta saw the largest improvements for this indicator, experiencing a rise of 26.6 and 23.2 percentage points, respectively.
Global Gender Gap Report 2023 14
Source World Economic Forum, Global Gender Gap Index, 2023. Note Blue diamonds correspond to population-weighted averages.
Progress over time 1.4
By calculating how much the gap has, on average, reduced each year since the report’s first edition in 2006, using a constant sample of 102 countries, it is possible to project how many years it will take to close each of the gender gaps for each of the dimensions tracked. The 17-year trajectory of global gender gaps is charted accordingly in Figure 1.4.
This year’s results leave the total progress made towards gender parity at an overall 4.1 percentagepoint gain since 2006. Hence, on average, over the past 17 years, the gap has been reduced by only 0.24 percentage points per year. If progress towards gender parity proceeds at the same average speed observed between the 2006 and 2023 editions, the overall global gender gap is projected to close in 131 years, compared to a projection of 132 years in 2022. This suggests that the year in which the gender gap is expected to close remains 2154, as progress is moving at the same rate as last year.
The Economic Participation and Opportunity subindex now stands at 59.8% based on the 102 countries in the constant sample (non-constant score 60.1%). This subindex is the only one that receded compared to 2022. There is a drop of 0.2 percentage points since 2022, but an improvement of 4.1 percentage points since 2006. The ebbing of the upward trend seen in last year’s edition can be partially attributed to the drop in the subindex scores for 66 economies including highly populated economies such as China, Indonesia, Nigeria, etc. As a result, it will take another 169 years to close the economic gender gap.
The Educational Attainment subindex displays the highest gender parity score (96.1%) on the basis of 102 countries in the constant sample (non-constant score 95.2%). The 0.8 percentage-point increase since last year places it from second to top-ranked across all subindices. While the development has not been unfaltering over time – accelerating then plateauing at various points in time and dropping
0.0 0.2 0.4 0.6 0.8 1.0 Score (0-1 scale) Political Empowerment subindex 0.221 Population-weighted average Iceland Rwanda United States India Saudi Arabia Norway United States Lao, PDR Germany Indonesia Italy Mexico India Pakistan Netherlands Peru Nigeria Chad Kenya China India Viet Nam Iceland United States Costa Rica France Sweden United Arab Emirates Japan Health and Survival subindex 0.960 Educational Attainment subindex 0.952 Economic Participation and Opportunity subindex 0.601 Global Gender Gap index 0.684 Range of scores, Global Gender Gap Index and subindexes, 2023 FIGURE 1.3
Global Gender Gap Report 2023 15
Evolution in scores, 2006-2023
Years to close the gap 131 Global Genger Gap Index 169 Economic Participation and Opportunity
Source
World Economic Forum, Global Gender Gap Index, 2023. Note Population-weighted averages for the the 102 economies featured in all editions of the index, from 2006–2023. The fourteenth edition of the Global Gender Gap Index, titled The Global Gender Gap Report 2020, was released in December 2019. There is no corresponding edition for 2019.
in 2017-2018 and 2022 – the time-series analysis shows a definitive upward trend overall. Its improved performance as well as a steady pace of progress on average over the 2006-2023 period leads to an estimation of 16 years to close the gap.
The Health and Survival gender parity score stands at 95.9% based on the constant sample of 102 countries (non-constant score 96%). It is a modest improvement compared to last year (+0.2 percentage points) and an actual drop of 0.3 percentage points compared to 2006. Despite this slight long-term drop, the index has consistently stayed above the 95% mark since the inception of the index in 2006.
Based on the constant sample of 102 countries included in each edition from 2006 to 2023, the global Political Empowerment gender gap this year is 22.5% (non-constant score 22.1%), which is a slight improvement of 0.1 percentage points over 2022. A slower pace of improvement, however, means that it will now take another 162 years to completely close this gap, a significant step backwards compared to the 2022 edition. Yet, the 2023 score is the highest absolute increase of all four subindexes since 2006: 8.2 percentage points compared to 4.4 percentage points for Educational Attainment, which is the subindex with the secondgreatest improvement.
Edition 2007 2006 2008 2009 2010 2011 2012 2013 2014 2015 2016 2017 2018 2019* 2020 2021 2022 0 0.1 0.2 0.3 0.4 0.5 0.6 0.7 0.8 0.9 1 Score (0-1, parity) 2023
Evolution of the Global Gender Gap Index and subindexes over time FIGURE 1.4
16 Educational Attainment n.a. Health and Survival Global Gender Gap Report 2023 16
162 Political Empowerment
Participation and Opportunity
1
Attainment
Rank Country Score (0–1) 1 Argentina 1.000 1 Belgium 1.000 1 Botswana 1.000 1 Canada 1.000 1 Colombia 1.000 1 Czech Republic 1.000 1 Dominican Republic 1.000 1 Estonia 1.000 1 Finland 1.000 1 France 1.000 1 Honduras 1.000 1 Ireland 1.000 1 Israel 1.000 1 Latvia 1.000 1 Lesotho 1.000 1 Malaysia 1.000 1 Malta 1.000 1 Namibia 1.000 1 Netherlands 1.000 1 New Zealand 1.000 1 Nicaragua 1.000 1 Slovakia 1.000 1 Slovenia 1.000 1 Sweden 1.000 1 Uruguay 1.000 26 India 1.000 27 Kazakhstan 1.000 28 Georgia 1.000 29 Kyrgyzstan 1.000 30 Luxembourg 1.000 31 Costa Rica 0.999 32 Philippines 0.999 33 Albania 0.999 34 United Kingdom 0.999 35 Armenia 0.999 36 Romania 0.999 37 Serbia 0.999 38 Croatia* 0.998 39 Spain 0.998 40 Denmark 0.998 41 Montenegro 0.998 42 Ecuador 0.998 43 South Africa 0.998 44 Brunei Darussalam 0.997 45 Paraguay 0.997 46 Fiji 0.997 47 Japan 0.997 48 North Macedonia 0.997 49 Panama 0.997 50 Poland 0.997 51 Kuwait 0.997 52 Belize 0.996 53 Moldova, Republic of 0.996 54 Azerbaijan 0.996 55 Austria 0.996 56 Ukraine 0.996 57 Bahrain 0.995 58 Hungary 0.995 59 United States of America 0.995 60 Italy 0.995 61 Thailand 0.995 62 Mexico 0.994 63 Bulgaria 0.994 64 Chile 0.994 65 Barbados 0.994 66 Jordan 0.994 67 Mongolia 0.994 68 Jamaica 0.993 69 El Salvador 0.993 70 Suriname 0.993 71 Mauritius 0.993 72 Singapore 0.993 73 Brazil 0.992 Rank Country Score (0–1)
Liberia 0.895
Jamaica 0.894
Moldova, Republic of 0.863 4 Barbados 0.860 5 Lao PDR 0.851 6 Eswatini 0.838 7 Belarus 0.819 8 Burundi 0.810
Botswana 0.807 10 Zimbabwe 0.801 11 Norway 0.800 12 Madagascar 0.800 13 Togo 0.796 14 Iceland 0.796 15 Sweden 0.795 16 Kenya 0.791 17 Philippines 0.789 18 Albania 0.786 19 Namibia 0.784
Finland 0.783 21 United States of America 0.780 22 Latvia 0.775 23 Singapore 0.774 24 Thailand 0.772 25 Estonia 0.771 26 Lithuania 0.767 27 Azerbaijan 0.766 28 Kazakhstan 0.765 29 Brunei Darussalam 0.760 30 Slovenia 0.760 31 Viet Nam 0.749
Cabo Verde 0.747 33 Mongolia 0.745 34 Portugal 0.745 35 Vanuatu 0.742
Canada 0.740 37 Suriname 0.740 38 Australia 0.740 39 Bulgaria 0.738 40 Zambia 0.734 41 Ireland 0.732 42 New Zealand 0.732 43 United Kingdom 0.731 44 Belgium 0.728 45 China 0.727 46 Denmark 0.727 47 Uruguay 0.726 48 Spain 0.722 49 Belize 0.720 50 Slovakia 0.718 51 France 0.717 52 Armenia 0.716 53 Tanzania, United Republic of 0.715 54 Nigeria 0.715 55 Ukraine 0.714 56 Montenegro 0.710 57 Luxembourg 0.710 58 Cambodia 0.710 59 Bhutan 0.708 60 Burkina Faso 0.708 61 Ecuador 0.705 62 Hungary 0.701 63 Switzerland 0.700 64 Poland 0.699 65 Dominican Republic 0.699 66 Honduras 0.699 67 Rwanda 0.699 68 Georgia 0.697 69 Serbia 0.697 70 Cameroon 0.694 71 Kyrgyzstan 0.694 72 Romania 0.693 73 Mozambique 0.692 Rank Country Score (0–1) 74 Vanuatu 0.991 75 Belarus 0.991 76 Portugal 0.991 77 Zimbabwe 0.991 78 Australia 0.991 79 Iceland 0.991 80 Cyprus 0.990 81 Greece 0.990 82 Germany 0.989 83 Lithuania 0.989 84 Norway 0.989 85 Sri Lanka 0.988 86 United Arab Emirates 0.988 87 Saudi Arabia 0.986 88 Eswatini 0.985 89 Viet Nam 0.985 90 Lebanon 0.984 91 Maldives 0.984 92 Bolivia (Plurinational State of) 0.984 93 Qatar 0.982 94 Guatemala 0.982 95 Cabo Verde 0.981 96 Cambodia 0.981 97 Timor-Leste 0.980 98 Bosnia and Herzegovina 0.980 99 Türkiye 0.980 100 Madagascar 0.979 101 Zambia 0.979 102 Switzerland 0.978 103 Myanmar 0.977 104 Korea, Republic of 0.977 105 Ghana 0.974 106 Indonesia 0.972 107 Lao PDR 0.964 108 Tanzania, United Republic of 0.964 109 Bhutan 0.963 110 Rwanda 0.963 111 Peru 0.960 112 Iran (Islamic Republic of) 0.960 113 Oman 0.957 114 Gambia 0.954 115 Morocco 0.953 116 Algeria 0.951 117 Tunisia 0.950 118 Comoros 0.949 119 Egypt 0.943 120 Burundi 0.942 121 Tajikistan 0.942 122 Bangladesh 0.936 123 China 0.935 124 Sierra Leone 0.932 125 Senegal 0.926 126 Uganda 0.924 127 Nepal 0.918 128 Côte d'Ivoire 0.902 129 Malawi 0.897 130 Mozambique 0.896 131 Liberia 0.896 132 Cameroon 0.895 133 Burkina Faso 0.893 134 Kenya 0.858 135 Ethiopia 0.854 136 Togo 0.837 137 Nigeria 0.826 138 Pakistan 0.825 139 Benin 0.802 140 Mali 0.779 141 Niger 0.769 142 Angola 0.738 143 Guinea 0.710 144 Congo, Dem. Rep. of the 0.683 145 Chad 0.637 146 Afghanistan 0.482 Rank Country Score (0–1) 74 Austria 0.692 75 Israel 0.688 76 Paraguay 0.685 77 Netherlands 0.684 78 Sierra Leone 0.684 79 Peru 0.683 80 Ghana 0.682 81 South Africa 0.676 82 Greece 0.676 83 Congo, Dem. Rep. of the 0.676 84 Costa Rica 0.676 85 Panama 0.674 86 Brazil 0.670 87 Indonesia 0.666 88 Germany 0.665 89 Malaysia 0.664 90 Bolivia (Plurinational State of) 0.658 91 Comoros 0.657 92 Colombia 0.657 93 Cyprus 0.652 94 Lesotho 0.648 95 Argentina 0.644 96 Chile 0.642 97 Malta 0.641 98 Nicaragua 0.640 99 Croatia* 0.639 100 Mauritius 0.637 101 Czech Republic 0.636 102 Uganda 0.623 103 El Salvador 0.619 104 Italy 0.618 105 Tajikistan 0.618 106 Gambia 0.609 107 Angola 0.605 108 North Macedonia 0.605 109 Malawi 0.602 110 Mexico 0.601 111 Côte d'Ivoire 0.601 112 Bosnia and Herzegovina 0.601 113 Myanmar 0.600 114 Korea, Republic of 0.597 115 Fiji 0.588 116 Ethiopia 0.587 117 Guatemala 0.580 118 Kuwait 0.579 119 Guinea 0.576 120 Timor-Leste 0.574 121 Niger 0.570 122 Bahrain 0.564 123 Japan 0.561 124 Sri Lanka 0.555 125 Jordan 0.542 126 Chad 0.538 127 Lebanon 0.538 128 United Arab Emirates 0.536 129 Benin 0.530 130 Saudi Arabia 0.521 131 Maldives 0.512 132 Qatar 0.508 133 Türkiye 0.500 134 Mali 0.489 135 Oman 0.488 136 Nepal 0.476 137 Senegal 0.475 138 Tunisia 0.451 139 Bangladesh 0.438 140 Egypt 0.420 141 Morocco 0.404 142 India 0.367 143 Pakistan 0.362 144 Iran (Islamic Republic of) 0.344 145 Algeria 0.317 146 Afghanistan 0.188
The Global Gender Gap Index 2023, results by subindex TABLE 1.2 Source World Economic Forum, Global Gender Gap Index, 2023. Eurasia and Central Asia Middle East and North Africa East Asia and the Pacific Latin America and the Caribbean North America Southern Asia Sub-Saharan Africa Europe Note * New to index in 2023 Global Gender Gap Report 2023 17
2
3
9
20
32
36
Educational
Economic
1
1
1
1
1
1
1
1
1
1
1
1
1
1
1 Mauritius
1
1
1
1
1
1
1
1
1
1
1
27
28
29
30
31
32
33
34
35
36
37
38
39
40
41
42
43
44
45
46
49
Empowerment
The Global Gender Gap Index 2023, results by subindex TABLE 1.2 Rank Country Score (0–1) 1 Iceland 0.901 2 Norway 0.765 3 New Zealand 0.725 4 Finland 0.700 5 Germany 0.634 6 Nicaragua 0.626 7 Bangladesh 0.552 8 Mozambique 0.542 9 Rwanda 0.541 10 Costa Rica 0.524 11 Sweden 0.503 12 Chile 0.502 13 South Africa 0.497 14 Switzerland 0.491 15 Mexico 0.490 16 Belgium 0.486 17 Ireland 0.482 18 Spain 0.475 19 United Kingdom 0.472 20 Lithuania 0.466 21 Netherlands 0.460 22 Peru 0.450 23 Namibia 0.443 24 Denmark 0.432 25 Ethiopia 0.431 26 Argentina 0.429 27 Latvia 0.424 28 Albania 0.419 29 Australia 0.412 30 Philippines 0.409 31 Estonia 0.377 32 Serbia 0.376 33 Canada 0.374 34 Colombia 0.373 35 United Arab Emirates 0.363 36 Slovenia 0.358 37 Senegal 0.353 38 Portugal 0.352 39 France 0.338 40 Cabo Verde 0.334 41 Burundi 0.320 42 Bolivia (Plurinational State of) 0.317 43 Luxembourg 0.315 44 Moldova, Republic of 0.314 45 Tanzania, United Republic of 0.309 46 Angola 0.305 47 Croatia 0.305 48 Austria 0.303 49 Uganda 0.297 50 Liberia 0.287 51 North Macedonia 0.283 52 Honduras 0.278 53 Ecuador 0.278 54 Nepal 0.276 55 El Salvador 0.265 56 Brazil 0.263 57 Jamaica 0.263 58 Barbados 0.256 59 India 0.253 60 Timor-Leste 0.253 61 Panama 0.252 62 Malta 0.251 63 United States of America 0.248 64 Italy 0.241 65 Bosnia and Herzegovina 0.240 66 Suriname 0.232 67 Malawi 0.224 68 Singapore 0.220 69 Belarus 0.217 70 Guinea 0.217 71 Armenia 0.215 72 Zimbabwe 0.214 73 Poland 0.211
Rank Country Score (0–1)
Belarus 0.980
Belize 0.980
Botswana 0.980
Brazil 0.980
Cabo Verde 0.980
Dominican Republic 0.980
El Salvador 0.980
Eswatini
0.980
Guatemala 0.980
Hungary
0.980
Kyrgyzstan
0.980
Lesotho 0.980
Lithuania
0.980
Malawi 0.980
0.980
Mongolia 0.980
Mozambique 0.980
Namibia 0.980
Poland 0.980
Romania 0.980
Slovakia 0.980
Sri Lanka 0.980
Uganda 0.980
Uruguay 0.980
Zambia 0.980
Zimbabwe 0.980
Burundi 0.979
Bulgaria 0.979
South Africa 0.979
Togo 0.979
Suriname 0.979
Estonia 0.979
Côte d'Ivoire 0.978
Nicaragua
0.978
Croatia* 0.978
Ghana 0.978
Czech Republic 0.978
Cambodia 0.978
Burkina Faso 0.978
Moldova, Republic of 0.977
Argentina 0.977
Thailand 0.977
Congo, Dem. Rep. of the 0.976
Angola 0.976
Ukraine 0.976
Korea, Republic of 0.976
Kazakhstan 0.975
Myanmar 0.975
47
47
Mexico 0.975
Lao PDR 0.975
Colombia 0.975
Latvia 0.975 53 Kenya 0.975
Paraguay 0.975 55 Rwanda 0.974
Georgia 0.974 57 Cameroon 0.973
Panama 0.973 59 Japan 0.973 60 Costa Rica 0.973 61 Benin 0.973 62 Portugal 0.973 63 Slovenia 0.972 64 Germany 0.972 65 Vanuatu 0.971 66 Singapore 0.971 67 Ethiopia 0.971 68 Lebanon 0.971 69 Chile 0.970 70 Tajikistan 0.970 71 Finland 0.970 72 Chad 0.970 73 Indonesia 0.970 Rank Country Score (0–1) 74 Cameroon 0.210 75 Kenya 0.209 76 Madagascar 0.201 77 Tunisia 0.197 78 Mali 0.192 79 Niger 0.185 80 Slovakia 0.183 81 Indonesia 0.181 82 Montenegro 0.180 83 Lesotho 0.179 84 Eswatini 0.178 85 Egypt 0.175 86 Togo 0.173 87 Ukraine 0.172 88 Korea, Republic of 0.169 89 Viet Nam 0.166 90 Morocco 0.165 91 Georgia 0.163 92 Benin 0.159 93 Tajikistan 0.156 94 Uruguay 0.152 95 Pakistan 0.152 96 Israel 0.150 97 Mauritius 0.148 98 Bulgaria 0.148 99 Bahrain 0.146 100 Kazakhstan 0.146 101 Lao PDR 0.140 102 Greece 0.140 103 Maldives 0.139 104 Dominican Republic 0.138 105 Chad 0.137 106 Sri Lanka 0.130 107 Kyrgyzstan 0.128 108 Czech Republic 0.128 109 Burkina Faso 0.125 110 Paraguay 0.125 111 Ghana 0.119 112 Côte d'Ivoire 0.118 113 Romania 0.117 114 China 0.114 115 Cambodia 0.112 116 Congo, Dem. Rep. of the 0.111 117 Cyprus 0.109 118 Türkiye 0.106 119 Zambia 0.102 120 Thailand 0.101 121 Mongolia 0.099 122 Malaysia 0.098 123 Guatemala 0.094 124 Jordan 0.093 125 Bhutan 0.093 126 Belize 0.090 127 Botswana 0.088 128 Sierra Leone 0.087 129 Comoros 0.083 130 Hungary 0.079 131 Saudi Arabia 0.077 132 Gambia 0.073 133 Qatar 0.071 134 Azerbaijan 0.071 135 Algeria 0.065 136 Brunei Darussalam 0.061 137 Kuwait 0.059 138 Japan 0.057 139 Fiji 0.052 140 Oman 0.051 141 Myanmar 0.047 142 Nigeria 0.041 143 Iran (Islamic Republic of) 0.031 144 Lebanon 0.021 145 Vanuatu 0.006 146 Afghanistan 0.000 Rank Country Score (0–1) 74 Bosnia and Herzegovina 0.970 75 Tanzania, United Republic of 0.970 76 France 0.970 77 Austria 0.970 78 United States of America 0.970 79 Serbia 0.969 80 Malaysia 0.969 81 Tunisia 0.969 82 Nepal 0.969 83 Gambia 0.968 84 Comoros 0.968 85 Ecuador 0.968 86 Philippines 0.968 87 Kuwait 0.968 88 Montenegro 0.968 89 Australia 0.968 90 Egypt 0.968 91 Belgium 0.968 92 Barbados 0.968 93 Canada 0.968 94 Jamaica 0.967 95 Italy 0.967 96 Greece 0.967 97 Senegal 0.967 98 Spain 0.967 99 Nigeria 0.967 100 Türkiye 0.966 101 New Zealand 0.966 102 Guinea 0.966 103 Madagascar 0.966 104 Sierra Leone 0.966 105 United Kingdom 0.965 106 Timor-Leste 0.965 107 Fiji 0.965 108 Luxembourg 0.965 109 Israel 0.964 110 Honduras 0.964 111 Ireland 0.964 112 Denmark 0.964 113 Niger 0.964 114 Saudi Arabia 0.964 115 Switzerland 0.964 116 Iran (Islamic Republic of) 0.964 117 Peru 0.964 118 Sweden 0.963 119 United Arab Emirates 0.963 120 Cyprus 0.963 121 Maldives 0.962 122 Bhutan 0.962 123 Liberia 0.962 124 Netherlands 0.962 125 Bolivia (Plurinational State of) 0.962 126 Bangladesh 0.962 127 Norway 0.961 128 Iceland 0.961 129 Oman 0.961 130 Morocco 0.961 131 Malta 0.961 132 Pakistan 0.961 133 Albania 0.960 134 North Macedonia 0.960 135 Mali 0.959 136 Bahrain 0.959 137 Algeria 0.958 138 Jordan 0.957 139 Armenia 0.955 140 Brunei Darussalam 0.953 141 Afghanistan 0.952 142 India 0.950 143 Qatar 0.947 144 Viet Nam 0.946 145 China 0.937 146 Azerbaijan 0.936
Health
Survival Eurasia and Central Asia Middle East and North Africa East Asia and the Pacific Latin America and the Caribbean North America Southern Asia Sub-Saharan Africa Europe Source World Economic Forum, Global Gender Gap Index, 2023. Note * New to index in 2023 Global Gender Gap Report 2023 18
50
51
52
54
56
58
Political
and
Performance by region 1.5
The Global Gender Gap Report 2023 categorizes countries into eight regions: Eurasia and Central Asia, East Asia and the Pacific, Europe, Latin America and the Caribbean, Middle East and North Africa, North America, Southern Asia, and SubSaharan Africa. Countries in each regional group are listed in Appendix A.
Gender parity in Europe (76.3%) surpasses the parity level in North America (75%) this year to rank first among regions. Closely behind Europe and North America is Latin America and the Caribbean, with 74.3% parity. Trailing more than 5 percentage points behind Latin America and the Caribbean are Eurasia and Central Asia (69%) as well as East Asia and the Pacific (68.8%). Sub-Saharan Africa ranks 6th (68.2%), slightly below the global weighted average score (68.3%). Southern Asia (63.4%) overtakes the Middle East and North Africa (62.6%), which is, in 2023, the region furthest away from parity.
Using the 102-country constant sample to assess trends over time suggests that Southern Asia as well as Latin America and the Caribbean experienced an improvement of 1.1 percentage points and 1.7 percentage points, respectively, since the last edition. Sub-Saharan Africa improves marginally (+0.1 percentage points) while Eurasia and Central Asia (-0.01 percentage points), East Asia and the Pacific (-0.02 percentage points), and Europe (-0.02 percentage points) show a slight
decline. North America (-1.9 percentage points) and the Middle East and North Africa (-0.09 percentage points) suffer more significant setbacks in overall gender parity.
The longer-term trends offer further insights into progress in the regional gender parity profiles. In comparison to the inaugural edition in 2006, the Latin America and the Caribbean region has improved the most, with an increase of 8.4 percentage points over the past 17 years. Europe (+6.1 percentage points) and Sub-Saharan Africa (+5.2 percentage points) are the other two regions that have improved by more than 5 percentage points. North America (+4.5 percentage points), the Middle East and North Africa (+4.2 percentage points) and Southern Asia (+4.1 percentage points) have improved by more than 4 percentage points, though parity scores in all three regions have backslid in recent editions. Eurasia and Central Asia (+ 3.2 percentage points) and East Asia and the Pacific (+ 2.8 percentage points) have seen the slowest to progress since 2006.
A more nuanced picture emerges from the heat map in Figure 1.6, which disaggregates regional scores by subindex and represents higher levels of parity using a darker colour. Most regions have achieved relatively higher parity in Educational Attainment and Health and Survival. The advancement in Economic Participation and Opportunity is more uneven, with Southern
1.5
0 10 20 30 40 50 60 70 80 90 100 Percentage points Middle East and North Africa Southern Asia East Asia and the Pacific Sub-Saharan Africa Europe North America Latin America and the Caribbean Eurasia and Central Asia 75.0% 74.3% 69.0% 68.2% 68.8% 63.4% 62.6% 76.3%
World Economic Forum, Global Gender Gap Index, 2023. Note Population-weighted averages for the 146 economies featured in the Global Gender Gap Index 2023.
Source
Gender gap closed to date, by region
Global Gender Gap Report 2023 19
FIGURE
Eurasia and Central Asia
East Asia and the Pacific
Europe
Latin America and the Caribbean
Middle East and North Africa
North America
Southern Asia
Sub-Saharan Africa
Global average
Source World Economic Forum, Global Gender Gap Index, 2023.
FIGURE 1.7
Regional gender gaps
Evolution in scores, 2006–2023
Note
Population-weighted averages for the 146 economies featured in the Global Gender Gap Index 2023. The percentages are indicative of the gender gap that has been closed.
Africa
Source
World Economic Forum, Global Gender Gap Index, 2023. Note
Population-weighted averages for the 102 economies featured in all editions of the Global Gender Gap Index, from 2006–2023. The fourteenth edition of the Global Gender Gap Index, titled The Global Gender Gap Report 2020, was released in December 2019. There is no corresponding edition for 2019.
2007 2006 2008 2009 2010 2011 2012 2013 2014 2015 2016 2017 2018 2019* 2020 2021 2022 2023 Sub-Saharan
East Asia
Eurasia and Central Asia Middle East and North Africa Europe Southern Asia North America Latin America and the Caribbean Score (0-1, parity) Edition 0.4 0.5 0.6 0.7 0.8 0.9 1 0 0.1 0.2 0.3
and the Pacific
Regional performance 2023, by subindex FIGURE 1.6
100% 0% 50% Parity 69.0% 68.8% 76.3% 74.3% 62.6% 75.0% 63.4% 68.8% 71.0% 69.7% 65.2% 44.0% 77.6% 37.2% 98.9% 95.5% 99.6% 99.2% 95.9% 99.5% 96.0% 97.4% 94.9% 97.0% 97.6% 96.4% 96.9% 95.3% 10.9% 14.0% 39.1% 35.0% 14.0% 26.1% 25.1% 68.2% 67.2% 86.0% 97.2% 22.6% 68.4% 60.1% 95.2% 96.0% 22.1% Overall Index Subindexes Economic Participation and Opportunity Educational Attainment Health and Survival Political Empowerment
Global Gender Gap Report 2023 20
Asia closing 37.2% of the gender gap and North America closing more than double. Regions continue to have the most significant gaps in the Political Empowerment subindex, with only Latin America and the Caribbean as well as Europe recording more than 35% parity.
Eurasia and Central Asia
At 69% parity, Eurasia and Central Asia ranks 4th out of the eight regions on the overall Gender Gap Index. Based on the aggregated scores of the constant sample of countries included since 2006, the parity score since the 2020 edition has stagnated, although there has been an improvement of 3.2 percentage points since 2006. Moldova, Belarus and Armenia are the highestranking countries in the region, while Azerbaijan, Tajikistan and Türkiye rank the lowest. The difference in parity between the highest- and the lowest-ranked country is 14.9 percentage points. At the current rate of progress, it will take 167 years for the Eurasia and Central Asia region to reach gender parity.
Regional gender parity on Economic Participation and Opportunity has been steadily increasing. Overall, 68.8% of the gender gap has closed, which is a 0.5 percentage-point improvement since the last edition. Six out of 10 countries, led by Moldova, Belarus and Azerbaijan, have at least 70% parity on this subindex. All countries in the region except Kyrgyzstan have made varying degrees of progress since the 2022 edition, with Moldova and Armenia making the most progress. Furthermore, all countries in the region have advanced towards parity in estimated earned income. Türkiye and Tajikistan demonstrate the least parity on Economic Participation and Opportunity, with Türkiye being the only country that has closed less than 60% of the gap on this subindex.
Eight out of 10 countries have more than 99% parity on the Educational Attainment subindex, resulting in 98.9% parity for the region. Türkiye and Ukraine, the region’s two most populous countries, have a persistent disparity in secondary enrolment. Barring Türkiye and Tajikistan, all countries have attained parity in enrolment in tertiary education.
At 97.4% parity, Eurasia and Central Asia has only three out of 10 countries that have less than 97% parity for the Health and Survival subindex. Azerbaijan and Armenia, home to more than 13 million people combined, have some of the lowest sex ratios at birth in the world. Finally, seven out of the 10 countries have reached parity in healthy life expectancy.
Compared to other regions, Eurasia and Central Asia has the lowest gender parity in Political Empowerment and suffers a 1 percentage-point setback since 2022. Its score of 10.9% is barely half the global score of 22.1%. Only Armenia, Ukraine
and Tajikistan have made at least a 1 percentagepoint improvement. While more than one-fifth of ministers in Moldova and Ukraine are women, Azerbaijan continues to be one of the handful countries with a male-only cabinet. Further, five of the 10 countries in the region have more than 25% women parliamentarians. With female presidents in Georgia and Moldova, there has been some improvement in female head-of-state representation in the last 50 years.
East Asia and the Pacific
East Asia and Pacific is at 68.8% parity, marking the fifth-highest score out of the eight regions. Progress towards parity has been stagnating for over a decade and the region registers a 0.2 percentagepoint decline since the last edition. While 11 out of 19 countries improve, one stays the same and eight (including China, the world’s second-most populous country) recede on the overall index. New Zealand, the Philippines and Australia have the highest parity at the regional level, with Australia and New Zealand also being the two most-improved economies in the region. On the other hand, Fiji, Myanmar and Japan are at the bottom of the list, with Fiji, Myanmar and Timor-Leste registering the highest declines. At the current rate of progress, it will take 189 years for the region to reach gender parity.
Compared to the last edition, six out of 19 countries improved on the Economic Participation and Opportunity subindex, depleting the regional parity score by 1.1% to 71.1%. Nine out of 17 countries that have the data have shown drops in the share of women in senior official positions. However, 13 out of 19 countries improved parity in estimated earned income since the last edition. Overall, Lao PDR, the Philippines and Singapore register the highest parity for the subindex and Fiji, Timor-Leste and Japan register the lowest.
At 95.5%, East Asia and the Pacific has the second-lowest score on the Educational Attainment subindex compared to other regions. Malaysia and New Zealand are at full parity, along with nine other countries in the region, with more than 99% scores. China, Lao PDR and Indonesia, with more than 1.7 billion people, have the lowest parity. Cambodia and Thailand are the only countries in this region with more than 1 percentage-point increase in parity over 2022. Thailand improves parity in enrolment in secondary education while Cambodia improves on literacy rate and enrolment in primary and tertiary education.
On the Health and Survival subindex, Singapore attains gender parity in sex ratio at birth, joining seven other countries across the world with the same achievement. However, 11 out of 19 countries saw declining parity in sex ratio. This contributes to the region’s slight depletion of parity on this subindex, by 0.02% to 94.9%.
Global Gender Gap Report 2023 21
Parity in Political Empowerment sees a partial recovery of 0.7 percentage points to 14.1% since the last edition. However, this is still below the 2018 edition score of 17.1%. Seven countries – including the populous countries such as China, Japan and Indonesia – have regressed on this subindex since 2017. Compared to the previous edition, 13 countries have improved, led by Australia, New Zealand and Philippines. Australia and New Zealand had a considerable increase in the share of women ministers. Fiji, Myanmar and Korea have regressed the most among the six other countries where progress on Political Empowerment has reversed.
Europe
Across all subindexes, Europe has the highest gender parity of all regions at 76.3%, with one-third of countries in the region ranking in the top 20 and 20 out of 36 countries with at least 75% parity. Iceland, Norway and Finland are the best-performing countries, both in the region and in the world, while Hungary, Czech Republic and Cyprus rank at the bottom of the region. Overall, there is a decline of 0.2 percentage points in the regional score based on the constant sample of countries. Out of the 35 countries covered in the previous and the current edition, 10 countries, led by Estonia, Norway and Slovenia, have made at least a 1 percentage-point improvement since the last edition. Ten countries show a decline of at least 1 percentage point, with Austria, France and Bulgaria receding the most. At the current rate of progress, Europe is projected to attain gender parity in 67 years.
At 69.7% parity in Economic Participation and Opportunity, Europe stands third behind North America and East Asia and Pacific on this dimension. Gender parity has receded by 0.5 percentage points compared to last year based on the constant sample of 102 countries. Norway, Iceland and Sweden have the highest parity on Economic Participation and Opportunity, while Italy, North Macedonia and Bosnia and Herzegovina have the lowest. In comparison to the last edition, 13 countries (including populous France and Germany) have declined by at least 1% and eight countries have improved by at least 1 percentage point. The shares of senior officer positions held by women have reduced in 17 out of 35 countries that have data. Only 10 countries have at least 60% parity in senior officer positions, yet 28 out of 36 countries have full parity in women’s share of technical roles.
On Educational Attainment, the region is almost at parity and all countries score more than 97%. There is full parity in enrolment in tertiary education, while 20 out of 35 countries reach parity in secondary education and 21 countries in primary education.
On Health and Survival, 97% parity is achieved. The trend, however, is negative. There has been a 0.6 percentage-point decline since the 2015 edition,
driven by the reduction in gender parity in healthy life expectancy by at least 1 percentage point in 23 out of 36 countries. On sex ratio at birth, 20 out of 36 countries are at full parity and the other countries are close to parity.
Gender parity in Political Empowerment had been consistently increasing in the last decade until last year; currently, it stands at 39.1%. Based on the constant sample of countries, there has been a decline of 0.5 percentage points since the last edition. Overall, Iceland, Norway and Finland have the highest score on the Political Empowerment subindex, while Romania, Cyprus and Hungary are at the bottom of the table. Led by Estonia, Slovenia and Latvia, 15 out of 35 countries have had at least a 1 percentage-point improvement while 13 countries have seen at least 1 percentage-point decline.
Latin America and the Caribbean
With incremental progress towards gender parity since 2017, Latin America and the Caribbean has bridged 74.3% of its overall gender gap. After Europe and North America, the region has the thirdhighest level of parity. Since the last edition, seven out of 21 countries (including relatively populous countries like Colombia, Chile, Honduras and Brazil) have improved their gender parity scores by at least 0.5 percentage points, while five countries have seen a decline in their parity scores by at least 0.5 percentage points. This has led to a 1.7 percentage-point increase in overall gender parity since last year. Nicaragua, Costa Rica and Jamaica register the highest parity scores in this region and Belize, Paraguay and Guatemala the lowest. At the current rate of progress, Latin America and the Caribbean will take 53 years to attain full gender parity.
Parity in Economic Participation and Opportunity in Latin America and the Caribbean is at 65.2%, the third-lowest regional score, ahead of the Middle East and North Africa as well as Southern Asia. Yet it marks an 0.7 percentage-point improvement since the last edition, with all countries except four improving their scores. Jamaica, Honduras and the Dominican Republic have seen the most progress on this subindex since the last edition. These three countries, along with 14 others have improved their parity scores in estimated earned income since 2022. Further, eight countries have a 1 percentagepoint higher share of senior positions held by women compared with the last edition.
Latin America and the Caribbean has achieved 99.2% parity on the Educational Attainment subindex: 14 out of 20 countries have more than 99% parity on their literacy rates. In addition, all of the 18 countries that have data on enrolment in tertiary education have attained full parity on this indicator. Further, the number of countries with parity in enrolment in secondary education is
Global Gender Gap Report 2023 22
16, while nine countries have attained full parity in enrolment in primary education.
In comparison to other regions, Latin America and the Caribbean has the highest parity on the Health and Survival subindex, at 97.6%. All countries have attained parity in sex ratio at birth and six out of 21 countries have perfect parity in healthy life expectancy.
At 35% parity, the region has the second-highest score, after Europe, on the Political Empowerment subindex. Based on the constant sample of countries there has been a 0.6 percentage-point improvement in parity since 2022. Overall, nine out of 21 countries have experienced at least a 0.5 percentage-point improvement and nine have seen a decline of more than 0.5%. Colombia, Chile and Brazil are not only the region’s top-ranked countries; they are also the most improved. Five out of 21 countries in this region have seen at least a 1 percentage-point improvement in the share of parliamentary positions held by women.
Middle East and North Africa
In comparison to other regions, Middle East and North Africa remains the furthest away from parity, with a 62.6% parity score. This is a 0.9 percentagepoint decline in parity since the last edition for this region, based on the constant sample of countries covered since 2006. The United Arab Emirates, Israel and Bahrain have achieved the highest parity in the region, while Morocco, Oman and Algeria rank the lowest. The three most populous countries – Egypt, Algeria and Morocco – register declines in their parity scores since the last edition. On the other hand, five countries, led by Bahrain, Kuwait and Qatar, have increased their parity by 0.5% or more. At the current rate of progress, full regional parity will be attained in 152 years.
When it comes to Economic Participation and Opportunity, 44% of the gender gap has been closed, ranking the region 7th out of eight regions, just above Southern Asia. There is highly uneven progress in parity on this subindex among different countries. Algeria’s level of parity, 31.7%, is less than half of that of Israel which has closed 68.9% of the gender gap. The United Arab Emirates and Egypt have registered increases in both the share of women senior officer positions and the share of women in technical positions. Further 10 out of 13 countries in the region have advanced towards parity in estimated earned income by at least 0.5 percentage points.
The Middle East and North Africa is at 95.9% parity on the Educational Attainment subindex, and Israel is the only country in the region to have full parity. Kuwait, Bahrain and Jordan come close, with more than 99% gender parity. Relatively more populous countries such as Morocco, Algeria, Tunisia and Egypt have the lowest parity on this subindex, and
they also have the lowest parity in literacy rate. Only four countries (Israel, Bahrain, Qatar and Jordan) have more than 99% parity in literacy rate. Seven countries achieve parity in secondary education and 10 countries in tertiary education.
The region records 96.4% parity in Health and Survival, and all countries except Qatar have achieved more than 95% parity, while all countries have attained perfect parity in sex ratio at birth. However, in five countries healthy life expectancy for women is lower than that of men.
The Middle East and North Africa also has the second-lowest regional parity in political empowerment at 14%. Based on the sample of countries covered continuously since 2006, parity on the Political Empowerment subindex has regressed by 1 percentage point since last year. Parity has declined in seven out of 13 countries, including the region’s most populous countries –Egypt, Algeria and Tunisia – and increased in six other countries, led by Bahrain, Qatar and Kuwait. Bahrain, Kuwait and Lebanon have also seen significant increases in the share of parliamentary positions held by women, while Israel and Tunisia have seen a drop on this indicator since 2022. In terms of ministerial positions held by women, only Tunisia, Bahrain and Morocco have more than 20% female ministers, while Saudi Arabia and Lebanon continue to have an all-male cabinet. Apart from Tunisia and Israel, no country in this region has had a female head of state in the last 50 years.
North America
Just behind Europe, North America ranks second, having closed 75% of the gap, which is 1.9 percentage points lower than the previous edition. While Canada has registered a 0.2 percentagepoint decline in the overall parity score since the last edition, the United States has seen a reduction of 2.1 percentage points. At the current rate of progress, 95 years will be needed to close the gender gap for the region.
North America has achieved the highest gender parity score among all regions, 77.6%, on the Economic Participation and Opportunity subindex. This marks a 0.2 percentage-point increase in the parity score since the last edition. Canada improved by 0.5 percentage points and the United States by 0.2 percentage points. Parity in wage equality for similar work and estimated earned income increased in both countries.
Regional parity on the Educational Attainment subindex stands at 99.5%. While Canada has achieved full parity, the United States, barring enrolment in secondary education, is virtually at parity for literacy rate, enrolment in primary education and enrolment in tertiary education.
Global Gender Gap Report 2023 23
With a score of 96.9%, North America ranks 5th out of eight regions on the Health and Survival subindex. The region has seen a 1 percentagepoint decline in parity in health since 2013. For example, parity for healthy life expectancy, at 1.03, is more than just Middle East and North Africa and Southern Asia. Women’s healthy life expectancy has declined more than that of men since 2013 in both Canada and the United States, further contributing to the reduction in parity on this subindex.
The decline in the overall regional gender parity score can be partially attributed to the 7.7 percentage-point decline on the Political Empowerment subindex, which currently stands at 26.1%. Both the United States and Canada have increased the share of parliamentary positions held by women. However, the measured share of women ministers has dropped significantly –particularly in the United States, where the share declined from 46.2% to 33.3% – which has affected the overall regional score on this subindex. This is partly explained by a stricter definition of what qualifies as a ministerial position being applied in the source database produced by UN Women. See Appendix B for more detail.
Southern Asia
Southern Asia has achieved 63.4% gender parity, the second-lowest score of the eight regions. The score has risen by 1.1 percentage points since the last edition on the basis of the constant sample of countries covered since 2006, which can be partially attributed to the rise in scores of populous countries such as India, Pakistan and Bangladesh. Along with Bhutan, these are the countries in this region that have seen an improvement of 0.5 percentage points or more in their scores since the last edition. On the other hand, parity has backslid by 0.5 percentage points or more in Sri Lanka, Afghanistan and Nepal. Bangladesh, Bhutan and Sri Lanka are the bestperforming countries in the region, while Pakistan and Afghanistan are at the bottom of both the regional and global ranking tables. At the current rate of progress, full parity will be achieved in 149 years.
Compared to other regions, Southern Asia remains the furthest away from parity on the Economic Participation and Opportunity subindex, having closed 37.2% of the gap. However, based on the constant sample of countries covered since 2006, there has been an improvement of 1.4 percentage points since the last edition. This can be partially attributed to the progress of Pakistan, India and Bangladesh. All three have advanced towards parity on the labour-force participation rate and estimated earned income indicators. On the other hand, parity has receded in the Maldives and Nepal. Bhutan, Sri Lanka and Maldives have the region’s highest parity scores on the Economic Participation and Opportunity subindex, while Pakistan and Afghanistan are the countries that lag the most behind.
Ranking fifth out of eight regions, Southern Asia has closed 96% of the gender gap on the Educational Attainment subindex. India, Sri Lanka and Maldives have the highest regional parity scores, while. Bangladesh, Nepal, Pakistan and Afghanistan have achieved less than 95% parity. Afghanistan is a negative outlier, having closed only 48.1% of the gender gap. Bangladesh, Bhutan, Sri Lanka and India are either at parity or close to parity in enrolment in secondary education. On enrolment in tertiary education – barring Afghanistan, Bangladesh and Pakistan – all countries are at full parity, though levels are low for both men and women.
Southern Asia has the second-lowest regional parity score on the Health and Survival subindex, at 95.3%. Based on the constant sample of countries covered by the index since 2006, that is a 1.1 percentage-point improvement since the last edition. Pakistan, India, the Maldives and Nepal have improved by varying degrees. All four countries have bettered their sex ratios at birth, with Pakistan and India making the most improvement. No country except Sri Lanka has attained full parity in healthy life expectancy.
Similar to other regions, the widest gender gap on the index is on the Political Empowerment subindex. Behind Europe, Latin America and the Caribbean, and North America, Southern Asia’s is the fourth-highest score among the eight regions, at 25.1% parity. Based on the constant sample of countries, this is the only subindex for this region that has experienced a setback: there has been a 1% reduction in parity since the last edition. Only the Maldives, Bangladesh and Nepal improved their scores. Parity has backslid in Iran, Sri Lanka and Afghanistan, as the share of ministerial positions held by women has dropped in these countries since 2022. Further, Nepal and Afghanistan have seen negative changes in parity in parliamentary positions, while other countries have not seen much change.
Sub-Saharan Africa
Sub-Saharan Africa’s parity score is the sixthhighest among the eight regions at 68.2%, ranking above Southern Asia and the Middle East and North Africa. Progress in the region has been uneven. Namibia, Rwanda and South Africa, along with 13 other countries, have closed more than 70% of the overall gender gap. The Democratic Republic of the Congo, Mali and Chad are the lowest-performing countries, with scores below 62%. And while there has been progress of 0.5 percentage points or more in 17 out of 36 countries, scores for 17 countries have seen decline of 0.5 percentage points or more since the last edition. Based on the constant sample, this marks a marginal improvement of 0.1 percentage points. At the current rate of progress, it will take 102 years to close the gender gap in Sub-Saharan Africa.
Global Gender Gap Report 2023 24
Sub-Saharan Africa has closed 67.2% of the gender gap on the Economic Participation and Opportunity subindex. Liberia, Eswatini and Burundi are at the top of the ranking table, while Benin, Mali and Senegal have attained the least parity. At the indicator level, there has been an improvement of 0.5 percentage points or more in parity in estimated earned income in 20 out of 36 countries. Further, the share of technical positions assumed by women has increased for more than 1 percentage point in six countries, including populous countries such as the Democratic Republic of Congo and Ethiopia. Seven countries – including the Democratic Republic of the Congo, Tanzania and Rwanda –have seen greater than 1 percentage-point rise in the share of senior officer positions held by women.
Sub-Saharan Africa is the lowest-ranked region in closing the gender gap on Educational Attainment, with a parity score of 86%, and only Botswana, Lesotho and Namibia have achieved full parity. Sixteen countries have achieved less than 90% parity on this subindex, with the Democratic Republic of the Congo and Chad achieving the lowest scores. There has been an improvement of
Eurasia and Central Asia
0.5 percentage points or more in parity in 23 out of 36 countries, with gains in parity in literacy rate in 23 out of 36 countries. However, the number of countries with 90% or more parity decreases with enrolment in successive levels of education. Apart from Mali, Guinea and Chad, all countries have more than 90% parity in enrolment in primary education, and 16 have reached full parity. Ten countries have less than 90% parity in secondary education and 21 countries less than 90% parity in tertiary education.
Sub-Saharan Africa has the third-highest parity score, 97.2%, on the Health and Survival subindex, following Latin America and the Caribbean and Eurasia and Central Asia. Twenty-five countries have more than 97% parity. Niger, Liberia and Mali are the lowest-performing countries on this subindex. All countries have attained parity in sex ratio at birth, and 11 out of 36 countries are at parity for healthy life expectancy.
With five countries having less than 10% parity and five countries with more than 40% parity, progress has been highly uneven when it comes
Country Rank Score Regional Global Moldova, Republic of 1 19 0.788 Belarus 2 41 0.752 Armenia 3 61 0.721 Kazakhstan 4 62 0.721 Ukraine 5 66 0.714 Georgia 6 76 0.708 Kyrgyzstan 7 84 0.700 Azerbaijan 8 97 0.692 Tajikistan 9 111 0.672 Türkiye 10 129 0.638
Country Rank Score Regional Global New Zealand 1 4 0.856 Philippines 2 16 0.791 Australia 3 26 0.778 Singapore 4 49 0.739 Lao PDR 5 54 0.733 Viet Nam 6 72 0.711 Thailand 7 74 0.711 Mongolia 8 80 0.704 Indonesia 9 87 0.697 Cambodia 10 92 0.695 Timor-Leste 11 95 0.693 Brunei Darussalam 12 96 0.693 Malaysia 13 102 0.682 Korea, Republic of 14 105 0.680 China 15 107 0.678 Vanuatu 16 108 0.678 Fiji 17 121 0.650 Myanmar 18 123 0.650 Japan 19 125 0.647 East Asia and the Pacific Country Rank Score Regional Global Iceland 1 1 0.912 Norway 2 2 0.879 Finland 3 3 0.863 Sweden 4 5 0.815 Germany 5 6 0.815 Lithuania 6 9 0.800 Belgium 7 10 0.796 Ireland 8 11 0.795 Latvia 9 13 0.794 United Kingdom 10 15 0.792 Albania 11 17 0.791 Spain 12 18 0.791 Switzerland 13 21 0.783 Estonia 14 22 0.782 Denmark 15 23 0.780 Netherlands 16 28 0.777 Slovenia 17 29 0.773 Portugal 18 32 0.765 Serbia 19 38 0.760 France 20 40 0.756 Luxembourg 21 44 0.747 Austria 22 47 0.740 Croatia 23 55 0.730 Poland 24 60 0.722 Slovakia 25 63 0.720 Bulgaria 26 65 0.715 Montenegro 27 69 0.714 Malta 28 70 0.713 North Macedonia 29 73 0.711 Italy 30 79 0.705 Bosnia and Herzegovina 31 86 0.698 Romania 32 88 0.697 Greece 33 93 0.693 Hungary 34 99 0.689 Czech Republic 35 101 0.685 Cyprus 36 106 0.678 Europe The
Global Gender Gap Report 2023 25
Global Gender Gap Index rankings by region, 2023 TABLE 1.3
Latin America and the Carribean
Middle East and North Africa
Sub-Saharan Africa
North America
Source
World Economic Forum, Global Gender Gap Index, 2023.
to Political Empowerment. On average across the region, 22.6% parity has been achieved. Based on the constant sample of countries covered on the index since 2006, this is an improvement of 1.1 percentage points compared to the last edition. Nineteen countries, including the populous Nigeria, Ethiopia and the Democratic Republic of
the Congo, have improved on this subindex by 0.5 percentage points or more. Further, Ethiopia, Togo, Tanzania, Namibia and Uganda currently have heads of states who are women.
The Global Gender Gap Index rankings by region, 2023 TABLE 1.3
Country Rank Score Regional Global Nicaragua 1 7 0.811 Costa Rica 2 14 0.793 Jamaica 3 24 0.779 Chile 4 27 0.777 Barbados 5 31 0.769 Mexico 6 33 0.765 Peru 7 34 0.764 Argentina 8 36 0.762 Colombia 9 42 0.751 Ecuador 10 50 0.737 Suriname 11 52 0.736 Honduras 12 53 0.735 Bolivia 13 56 0.730 Brazil 14 57 0.726 Panama 15 58 0.724 Uruguay 16 67 0.714 El Salvador 17 68 0.714 Dominican Republic 18 81 0.704 Belize 19 89 0.696 Paraguay 20 91 0.695 Guatemala 21 117 0.659 Country Rank Score Regional Global United Arab Emirates 1 71 0.712 Israel 2 83 0.701 Bahrain 3 113 0.666 Kuwait 4 120 0.651 Jordan 5 126 0.646 Tunisia 6 128 0.642 Saudi Arabia 7 131 0.637 Lebanon 8 132 0.628 Qatar 9 133 0.627 Egypt 10 134 0.626 Morocco 11 136 0.621 Oman 12 139 0.614 Algeria 13 144 0.573
Country Rank Score Regional Global Canada 1 30 0.770 United States of America 2 43 0.748 Country Rank Score Regional Global Bangladesh 1 59 0.722 Bhutan 2 103 0.682 Sri Lanka 3 115 0.663 Nepal 4 116 0.659 Maldives 5 124 0.649 India 6 127 0.643 Pakistan 7 142 0.575 Iran (Islamic Republic of) 8 143 0.575 Afghanistan 9 146 0.405 Southern Asia Country Rank Score Regional Global Namibia 1 8 0.802 Rwanda 2 12 0.794 South Africa 3 20 0.787 Mozambique 4 25 0.778 Burundi 5 35 0.763 Cabo Verde 6 37 0.761 Liberia 7 39 0.760 Zimbabwe 8 45 0.746 Eswatini 9 46 0.745 Tanzania, United Rep. of 10 48 0.740 Madagascar 11 51 0.737 Botswana 12 64 0.719 Ethiopia 13 75 0.711 Kenya 14 77 0.708 Uganda 15 78 0.706 Lesotho 16 82 0.702 Zambia 17 85 0.699 Togo 18 90 0.696 Cameroon 19 94 0.693 Mauritius 20 98 0.689 Ghana 21 100 0.688 Senegal 22 104 0.680 Burkina Faso 23 109 0.676 Malawi 24 110 0.676 Sierra Leone 25 112 0.667 Comoros 26 114 0.664 Angola 27 118 0.656 Gambia 28 119 0.651 Côte d'Ivoire 29 122 0.650 Nigeria 30 130 0.637 Niger 31 135 0.622 Guinea 32 137 0.617 Benin 33 138 0.616 Congo, Dem. Rep. of the 34 140 0.612 Mali 35 141 0.605 Chad 36 145 0.570
Global Gender Gap Report 2023 26
In-focus country performances: Top 10 and 15 most populous
This section illustrates the state of country-level gender parity across the four dimensions and sheds light on important dynamics. The share of the global female population represented by the countries discussed in this section is both statistically and strategically significant to monitoring and benchmarking efforts. Based on the data that was officially reported for the period covered in this edition, distinct trends and shifts were observed in the index’s top 10 as well as the 15 most populous countries,2 which, combined, represent two-thirds of the world’s female population.
Top 10 countries
Iceland continues to incrementally advance towards gender parity since the inaugural 2006 edition and ranks 1st for the 14th consecutive year. Iceland has closed 91.2% of the gender gap, which is 0.4 percentage points higher than the previous edition. The overall gender parity ranking is buoyed by its relatively strong performance across the Political Empowerment and Economic Participation and Opportunity subindexes. Iceland has almost doubled its gender parity score in Political Empowerment since 2006. Iceland has been led by a female head of state for 25 of the last 50 years and more than two-fifth of its ministerial and parliamentary positions are held by women, which has propelled the country to close 90.1% of the gender gap. While Iceland ranks relatively high at 14th (score 79.6%) on the Economic Participation and Opportunity subindex, the gender parity score has suffered setbacks since 2021 (84.6%) and now is closer to its 2017 level. Specifically, parity in wages and in representation among senior officials has declined since 2021. However, since 2006, Iceland maintains parity in the share of women in technical roles. On Health and Survival, parity marginally regresses, partly owing to the 1.5 years decline in the healthy life expectancy of women since the 2020 edition. On Education Attainment (99.1%) Iceland remains almost at parity.
Progress towards gender parity in Norway has been steady, resulting in Norway improving its gender parity score to 87.9% and climbing one rank to the 2nd position in this year’s index. A major part of Norway’s continuous improvement can be ascribed to its achievements on Political Empowerment (score 76.5%), which has increased by 27.1 percentage points since 2006. Women now assume 50% of the ministerial positions and 46.2% of parliamentary positions. Further, the country had a female head of state for 18 of the last 50 years. Norway also reaches parity in enrolment rates in primary education and tertiary education. However, gender parity on the Economic Opportunity and Participation (80%) subindex –though recovered slightly since the last edition – is still 1.8 percentage points below the 2016 level.
Since 2016, the gender gap in estimated earned income has shrunk and full parity in technical roles has been achieved and maintained. However, the gender gap in senior roles (score 50.3%) has been widening and its labour-force participation rate (84.5%) is yet to recover since the pandemic hit. Additionally, women’s healthy life expectancy at birth of 71.6 years is still 2.7 years below the 2020 edition, worsening the gap in health attainment by 1.1 percentage point to 96.1% compared to results from the 2020 edition.
After a sharp rebound in gender parity scores between 2017 and 2021, Finland’s progress has been marginal. It advances by 0.3 percentage points since the last edition to register 86.3% parity in the 2023 edition, ranking 3rd globally. Finland maintains its longstanding gender parity on Educational Attainment. The recent tenure of a female head of state and parity at ministerial position boosts parity on Political Empowerment to 70%, which is the fourth-highest score on this pillar globally. Yet, progress on Economic Participation and Opportunity (78.3%) seems to be stagnating, marked by slight reversals in parity at senior positions and wage equality since the last edition. However, women have been representing 50% or more of technical positions since the inaugural 2006 edition. On the other hand, like several other highincome economies,3 the healthy life expectancy of women declined by almost 1.5 years since 2006, partly widening the present gender gap on Health and Survival (97%).
In the last five years, New Zealand has gained more than 5 percentage points to close 85.6% of the overall gender gap, ranking 4th globally in 2023. With parity in parliamentary positions, and a female head of state for 16 of the last 50 years, New Zealand has the world’s third-highest level of parity on Political Empowerment. New Zealand has bridged the gender divide in enrolment across all levels of education and literacy rate. In terms of Economic Participation and Opportunity (73.2%), there remains a 12.5% gender gap in labour-force participation. Estimated earned incomes of both men and women have been increasing since 2006, but men’s income increased at a higher rate than that of women, worsening the gap (score 64.2%) by 4 percentage points since. On Health and Survival, women have lost three years of healthy life expectancy since the 2020 edition, reducing parity on the subindex (score 96.6%).
Sweden maintains its rank of 5th since the last edition; it has closed 81.5% of the gender gap, 0.7 percentage points lower than the 2018 edition. With 46.4% women parliamentarians and 47.8% women ministers who head ministries, Political Empowerment is at 50.3% parity. Parity on Economic Participation and Opportunity (79.5%)
1.6
Global Gender Gap Report 2023 27
has also stagnated recently, and even reversed by 1.7 percentage points since the last edition. The gap in labour-force participation seems to be at a standstill, while parity in estimated earned income declined by 7.3 percentage points since the last edition. On the upside, the share of women in technical positions has remained at more than 50% since the 2006 edition and there has mostly been steady progress in the share of women in senior positions over the last decade. Sweden also achieves a full parity score on Educational Attainment. However, parity in Health and Survival (96.3%) has been sliding because of an almost 1.3 years loss in female healthy life expectancy at birth since the 2020 edition.
Germany sustains its upward trajectory in gender parity, climbing four ranks since last year to 6th position and registering an additional 1.4 percentage points to a score of 81.5%. This advancement is due mainly to the increase of the share of women in parliamentary and ministerial positions, which have boosted the Political Empowerment subindex (63.4%) by 8.4 percentage points since 2022. Germany has also attained parity in enrolment in all levels of education except for secondary education. However, a backslide in parity in wage equality and estimated earned income has depleted the parity on Economic Participation and Opportunity (66.5%) by 6.9 percentage points since 2018. While parity has been achieved and sustained in technical roles, the share of women in senior positions is back at the 2018 level (parity score 41.3%). On Health and Survival, Germany is plateauing at 97.2% parity.
Nicaragua is the highest-ranking Latin American country on the index. It maintains its 7th rank from the last edition and only marginally improves to 81.1% parity. Progress has been plateauing since 2017 on the overall index. Nicaragua has achieved gender parity on Educational Attainment and has been at a standstill at 97.8% parity on the Health and Survival subindex. The share of women in ministerial and parliamentary positions has been surpassing the 50% mark in recent years. However, the overall parity score on Political Empowerment has stagnated, at 62.6% since the last edition. Despite ranking relatively high on the other dimensions, Nicaragua’s performance lags on the Economic Participation and Opportunity subindex, where only 64% parity is attained. The widest gap exists in the share of women in senior positions followed by wage equality.
Ranked 8th is Namibia, the highest-ranking SubSaharan African country in this edition, which has attained 80.2% gender parity, a 0.5 percentagepoint decline since the last edition. Namibia has achieved full parity on both the Health and Survival and Educational Attainment subindexes, although their absolute levels of attainment are low for both women and men. With 56% of technical workers and 43.6% of senior officers being women, Economic Participation and Opportunity is at 78.4% parity and is ranked 19th globally. However,
after a phase of rapid and broad-based increase in economic parity up until 2018, parity has been flagging. This is mostly due to a 4.8 percentagepoint decline in parity in estimated earned income and 2 percentage-point decline in parity in labourforce participation rate since 2018. Namibia has achieved 44.3% parity in Political Empowerment with 44.2% women parliamentarians, 31.6% women ministers and a female prime minister in power since 2015.
Lithuania re-enters the top 10 and ascends two ranks since the 2022 edition to 9th position. The parity score at 80.0%, is 0.1 percentage point higher than previous edition. Lithuania’s improvement in its gender parity profile after 2020 can be attributed to the surge in share of women in parliamentary positions and electing a female prime minister, resulting in 46.6% parity on the Political Empowerment subindex. Lithuania has covered 76.7% of the gender gap on the Economic Participation and Opportunity subindex. This dimension is however marked by mixed performance across the indicators. While parity has backtracked in senior positions and estimated earned income since 2022, full party in technical roles has been sustained, and perceptions of wage equality for similar jobs have improved by 0.2 percentage points. For Educational Attainment (98.9%) and Health and Survival (98%), Lithuania edges towards parity.
The newest entrant to the top 10 is Belgium at 10th position. It has closed 79.6% of the overall gender gap, indicating a recovery of 5.7 percentage points since 2017. Most of the development is on the Political Empowerment subindex, where it has reached full parity in ministerial positions and women in 42.7% of parliamentary seats, marking significant improvements since 2017. Further, Belgium remains at parity on Educational Attainment. Perception of wage equality for similar jobs and share of women in senior positions have also been increasing incrementally, and parity has been achieved in technical roles. Overall, 72.8% of the gender gap is closed on Economic Participation and Opportunity subindex. However, a decline in gender parity in healthy life expectancy since 2017 has been gradually depleting its parity in the Health and Survival subindex (96.8%).
15 most populous countries
China ranks 107th and has achieved 67.8% gender parity. Compared to the previous edition, this represents a 0.4 percentage-point decline in score and a decline of five positions in rank. China is at 93.5% parity on Educational Attainment, with full parity on tertiary education. On Economic Participation and Opportunity, China has closed 72.7% of the gender gap and attains 81.5% parity in labour-force participation rate. It also secures 11.4% parity on Political Empowerment, with 4.2% women ministers and 24.9% women parliamentarians. China continues to have one of the lowest sex ratios at birth (89%), affecting parity
Global Gender Gap Report 2023 28
levels on the Health and Survival subindex (93.7%, 145th).
India has closed 64.3% of the overall gender gap, ranking 127th on the global index. It has improved by 1.4 percentage points and eight positions since the last edition, marking a partial recovery towards its 2020 (66.8%) parity level. The country has attained parity in enrolment across all levels of education. However, it has reached only 36.7% parity on Economic Participation and Opportunity. On the one hand, there are upticks in parity in wages and income; on the other hand, the shares of women in senior positions and technical roles have dropped slightly since the last edition. On Political Empowerment, India has registered 25.3% parity, with women representing 15.1% of parliamentarians, the highest for India since the inaugural 2006 edition. On the Health and Survival index (95%), the improvement in sex ratio at birth by 1.9 percentage points to 92.7% has driven up parity after more than a decade of slow progress.
Ranked 43rd, the United States has closed 74.8% of its overall gender gap. On Educational Attainment, the country is at parity or virtually at parity across all levels of education except secondary education. On the Economic Participation and Opportunity subindex (78%), the United States has recovered almost to its 2018 level of parity. Income parity (67.5%) has been gradually improving, however the share of women in senior positions has been receding over the last two editions of the index. Further, over the last decade, women’s healthy life expectancy has declined by five years and men’s by close to three years. This has worsened gender parity in Health and Survival outcomes (97%) by 0.9 percentage points since the 2013 edition. The country’s parity on Political Empowerment stands at 24.8%, with a marginal improvement in the share of women parliamentarians and still no female head of state.
Indonesia’s gender parity scores were improving steadily until they dropped in 2021. In this edition, Indonesia (87th) maintains the same 69.7% score as last year, sustaining a recovery to almost match its 2020 parity level. On Economic Participation and Opportunity, there is 66.6% parity, indicating a partial recovery to its 2020 parity level (68.5%). Since 2020, the share of women senior officials has dropped from 55% to 31.7%, while the share of technical workers has increased from 40.1% to more than 50%, thus attaining parity. Further, there has been marginal improvement in parity in estimated earned income, though the gap remains wide: for every dollar of income earned by a man, a woman earns just 51.9 cents. The Political Empowerment subindex is at 18.1% parity, with 21.6% women parliamentarians and 20.7% women ministers. Parity across Educational Attainment (97.2%) and Health and Survival (97%) remain virtually unchanged compared to the 2022 edition.
Pakistan (142nd) is at 57.5% parity, its highest since 2006. It has improved by 5.1 percentage
points on the Economic Participation and Opportunity subindex in the last decade to attain 36.2% parity, though this level of parity remains one of the lowest globally. There is broad progress across all indicators on this subindex, but particularly in the share of women technical workers and the achievement of parity in wage equality for similar work. Despite relatively high disparities, parity in literacy rate and enrolment in secondary and tertiary education are gradually advancing, leading to 82.5% parity on the Educational Attainment subindex. On Health and Survival, Pakistan secures parity in sex ratio at birth, boosting subindex parity by 1.7 percentage points since 2022. Like most other countries, Pakistan’s widest gender gap is on Political Empowerment (15.2%). It has had a female head of state for 4.7 years of the last 50 years, and one-tenth of the ministers as well as one-fifth of parliamentarians are women.
Brazil’s parity at 72.6% is 57th globally and at its highest parity level since 2006. Brazil has appointed women in 36.7% of ministerial positions, the highest in its history. Further, there has also been a 2.9 percentage-point increase in women parliamentarians (share, 17.7%). Combined, they have almost doubled the parity level on Political Empowerment (26.3%) since the previous edition. There has also been marginal improvement on the Economic Participation and Opportunity dimension. While parity in technical positions is sustained, parity in estimated incomes is at 62.8%, despite registering some improvement compared to the 2022 edition. There is full parity in Health and Survival outcomes, based on sex ratio at birth and healthy life expectancy. On the Educational Attainment subindex (99.2%), apart from enrolment in primary education, there is full gender parity in literacy rate, secondary education and tertiary education.
Nigeria’s parity is at 63.7% (130th), 1 percentage point lower than its 2013 level. Since then, parity on the Political Empowerment subindex has receded from 11.9% to 4.1%, due to a decline in parity in both parliamentary and ministerial positions. Further, parity on Educational Attainment has been fluctuating in recent years and has only marginally improved over the last decade; currently, its 82.6% parity is one of the lowest in the world. Its absolute levels of women’s literacy rates and enrolment rates across levels of education have also been lagging. Nigeria has perfect parity for sex ratio at birth, which has contributed to a 96.7% parity on the Health and Survival subindex. Further, with a global ranking of 54th, its Economic Participation and Opportunity score (71.5%) has experienced both advances and setbacks over the last decade. Nigeria has more than 64% representation of women in senior positions, but women earn only 50% of the income earned by men.
With the highest gender parity in Southern Asia, Bangladesh ranks 59th globally, with a score of 72.2%. The country’s trajectory is mostly characterized by continuous progress on Political
Global Gender Gap Report 2023 29
Empowerment. At 55.2% parity, Bangladesh ranks seventh globally on this subindex. It has had a woman head of state for 29.3 years out of the last 50 years, the longest duration in the world. However, its shares of women in ministerial (10%) and parliamentary positions (20.9%) are relatively low. On Health and Survival (96.2%), there is parity in sex ratio at birth. However, gender parity in healthy life expectancy has been dropping as men’s life expectancy has been increasing faster than that of women since the 2020 edition. Bangladesh’s Educational Attainment parity is at 93.6%. Both women and men’s literacy rate and enrolment in secondary and tertiary education has been increasing steadily over the last decade. While there is now full parity in enrolment in secondary education, for literacy rate and enrolment in tertiary education, there remains a persistent gap. At 43.8% parity, Bangladesh’s Economic Participation and Opportunity subindex performance is one of the lowest globally (139th). However, this marks a recovery to its 2020 parity level. Improvement in the estimated earned income since 2021 edition has helped drive this recovery, as the gaps across the other indicators show less change.
Ranked 33rd, Mexico’s 76.5% parity is 0.1 percentage points better than the previous edition, though its rank drops by two positions. On Educational Attainment, Mexico is close to subindex parity, with full parity in enrolment in secondary and tertiary education and 98.4% parity in literacy rate. Despite this, there is persistent gender disparity in labour-force participation (57.6%), and women’s estimated earned income is only 52.3% of that of men. Further, only 38.5% of senior officers are women. However, women represent almost half of the country’s technical workers. Overall, Mexico’s 60.1% parity on Economic Participation and Opportunity stands at 110th globally. On Health and Survival, women have lost 2.4 years and men have lost 1.5 years of healthy life expectancy since the 2020 edition, widening the subindex gender gap by 0.4 percentage points (97.5%). With parity in parliamentary positions, 42.1% women ministers and no woman head of state yet, the Political Empowerment subindex is at 49% parity, the same as the last edition.
Japan’s parity declines slightly for the second consecutive year since the 2021 edition. With a parity of 64.7% (125th), it has slipped 0.25 percentage points compared to the previous editions and now stands nine positions lower in the rankings. Japan’s parity in Political Empowerment at 5.7% is one of the lowest in the world (ranking 138th). Ten percent of its parliamentary positions and 8.3% of ministerial positions are held by women, while there has not been any female head of state. There is almost full parity on both the Educational Attainment and Health and Survival subindexes. There has been 1.1% improvement in parity at estimated earned income since the last edition; 54.2% of women are in the labour force and 12.9% of senior officers are women. Japan’s Economic Participation and Opportunity parity is at
56.1% and ranks 123rd out of 146 countries.
Ethiopia ranks 75th, having closed 71.1% of the gender gap. Compared to the previous edition, it has improved by 0.6 percentage points. Ethiopia has had a woman president the past 4.35 years, along with 41.3% incumbent woman parliamentarians and 40.9% women ministers. This results in a closing 43.1% of the gender gap on the Political Empowerment subindex, almost triple its score since a decade back (14.6% in 2013). On Health and Survival, Ethiopia is close to parity (97.1%). By contrast, on Educational Attainment, though parity across the indicators is gradually improving, Ethiopia has one of the lowest parity levels globally (135th) at 85.4%. After some fluctuations, parity on Economic Participation and Opportunity is also low, at 58.7%. Labour-force participation parity is at 72.7% and women earn 66.1% of men’s estimated earned income. Only 25.4% of senior officers and 34.3% of technical positions are held by women.
The Philippines has achieved 79.1% gender parity and ranks 16th globally. Despite an improvement of three positions and 0.88 percentage points since last year, this is only a partial recovery towards its 2018 parity level (79.9%). With 26% women cabinet ministers, the Philippines has recovered on that indicator. However, the gap widened in the share of parliamentarians who are women (37.6% parity), thus effectively decreasing overall parity on the Political Empowerment subindex (40.9%) by 0.7 percentage points since 2018. The Philippines is almost at parity on Educational Attainment (99.9%). After being close to parity on Health and Survival since 2006, the country has regressed on this subindex (96.8%) due to a slight decline in sex ratio at birth. On Economic Participation and Opportunity, the Philippines maintains full parity in senior officer and technical workers, though women’s income is just 71.6% that of men.
Egypt is at 62.6% parity and ranks 134th. Egypt advanced towards parity between the 2017 editions (60.8%) and 2021 editions (63.9%), before regressing for the subsequent 2022 (63.5%) and the current edition. Since 2021, there has been a 3 percentage-point decline in parity on the Educational Attainment subindex, due to slight backslides in parity in enrolment in secondary and tertiary education. At 96.8% parity, Health and survival remains virtually unchanged. However, on Economic Participation and Opportunity, a 6.8 percentage-point increase in the share of women in senior officer (share 12.4%) and a 4.3 percentage-point increase in the share of women in technical positions (35.1%) since the 2022 edition have boosted subindex parity by 1.7 percentage points to 42%. Further, with 27.5% women parliamentarians and 18.8% women ministers, there is 17.5% parity on Political Empowerment.
Viet Nam, with a score of 71.1% and a global rank of 72nd, continues its gradual progress towards gender parity. It has progressed by 2.3 percentage
Global Gender Gap Report 2023 30
points since 2007 (score 68.9%) when it was first covered. As compared to the last edition, it has advanced by 0.62 percentage points as well as 11 positions in rank. While the 2022 edition reported no female ministers, there are now 11.1% women ministers, driving up the parity score on the Political Empowerment subindex from 13.5% to 16.6%. Viet Nam’s sex ratio at birth has been one of the country’s lowest-performing indicators and it suffered further setbacks, worsening the Health and Survival parity by 0.4 percentage points to 94.6%, which is among the lowest in the world. On Educational Attainment, Viet Nam is at 98.5% parity. There is also full parity in the share of women as technical workers, and women earn 81.4% of men’s estimated earned income. Labour-force participation parity is at 88.1%, though only 25.6% of the senior officials are women. Overall, Viet Nam is at 74.9% parity on the Economic Participation and Opportunity subindex.
The Democratic Republic of the Congo ranks 140th, with 61.2% of the gender gap closed. This is a 3 percentage-point improvement since 2018 when the country was first included in the index. Most of this improvement can be attributed to its progress on the Economic Participation and Opportunity and Political Empowerment subindexes. The country has advanced its parity in estimated earned income, senior officials and technical workers. Further, on the Political Empowerment subindex, the share of women in parliamentary and ministerial positions has also risen since the 2018 edition. The other dimension where the Democratic Republic of the Congo has advanced is Educational Attainment (68.3% parity), although it still ranks among the lowest (144th) globally. This increase is driven by progress in parity in literacy rate and enrolment in secondary education. On Health and Survival, the country has achieved full parity in sex ratio at birth, attaining 97.6% subindex parity.
Global Gender Gap Report 2023 31
Endnotes
1. See Appendix B for more detail on the upper threshold of the Health and Survival subindex.
2. With the exception of Russian Federation, which is not featured in the 2023 edition.
3. See research from Nordregio for more details: https://nordregio.org/maps/change-in-life-expectancy-2019-2020-bycountry-in-europe/.
Global Gender Gap Report 2023 32
2.1
Gender gaps in the workforce
This chapter sheds light on global workforce, leadership and skilling patterns across industries and across time to give a more nuanced picture of the current anatomy of gender gaps in labour
markets and senior leadership to equip decisionmakers with the data to tackle gender gaps in the most targeted and impactful way possible.
Evolving gender gaps in the global labour market
As we approach the middle of 2023, the global economy has resisted slipping into recession, yet the risks to future growth and broad-based prosperity remain many and expected volatility high. Risks include those inherent in ongoing geopolitical conflicts, open questions about the future of trade and global supply chains, large-scale climate events, as well as the disruptive impact of emerging technologies. Many of these risks are expected to have a disproportionately negative effect on women, especially for women in vulnerable situations.
The International Monetary Fund (IMF) predicts modest global growth in the near term at 2.8% in 2023, improving marginally in 2024.1 Yet, further down the line, the World Bank projects falling longterm global economic prospects in the absence of deep structural transformation.2 Unlocking all talent in the workforce, in innovation and leadership will be critical in brightening the current prospects.
Increases in the cost-of-living are set to remain elevated, with baseline global inflation expected around 7% in 2023, significantly above traditional central bank targets of 2%. This will continue to put disproportionate pressure on individuals with low incomes.3 Furthermore, labour markets are showing signs of cooling after a post-pandemic period of high demand for workers and upward pressures on wages. In the longer run, International Labour Organization (ILO) projections point to rising global unemployment and informal work as well as further slowing productivity growth.4
The 2022 edition of the Global Gender Gap Report raised concerns over the state of gender parity in the labour market. Not only was women’s participation slipping globally, but other markers of economic opportunity were showing substantive disparities between women and men. Since the last
edition, while women have (re-)entered the labour force at higher rates than men globally, leading to a small recovery in gender parity in the labour-force participation rate, gaps remain wide overall and in several specific dimensions.
Labour-force participation
Between 2019 and 2020, the global women’s labour-force participation rate declined by 3.4%, as compared to 2.4% for men.5 Women have been (re-)entering the workforce at a slightly higher rate than men since then, resulting in a modest recovery in gender parity. Between the 2022 and 2023 editions, parity in the labour-force participation rate increased from 63% to 64%. However, the recovery remains unfinished, as parity is still at the secondlowest point since the first edition of the index in 2006 and significantly below its 2009 peak of 69%.
At the regional level, developments have been uneven. After all regions saw a downturn in the 2022 edition, the most marked recovery this year is observed in Southern Asia, followed by Latin America and the Caribbean, Eurasia and Central Asia, East Asia and the Pacific, then Sub-Saharan Africa. Parity in labour-force participation in both Europe and North America saw virtually no change compared to the 2022 edition, while the Middle East and North Africa saw a slight drop.
Overall, the lowest levels of parity in participation on average at the regional level are in the Middle East and North Africa (30%) and Southern Asia (34%). Of all regions, North America attains the highest score of 84%, followed by Europe at 82% and East Asia and the Pacific at 80%.
2
Global Gender Gap Report 2023 June 2023
Global Gender Gap Report 2023 33
Source
World Economic Forum, Global Gender Gap Report, 2006-2023.
Source
World Economic Forum calculations based on Global Gender Gap Report, 2006-2023.
Note
The fourteenth edition of the Global Gender Gap Index, titled The Global Gender Gap Report 2020, was released in December 2019. There is no corresponding edition for 2019.
2007 2006 2008 2009 2010 2011 2012 2013 2014 2015 2016 2017 2018 2019* 2020 2021 2022 2023
Gender gap in labour-force participation (0-1, parity) Edition 0.690 0.620 0.630 0.640 0.650 0.660 0.670 0.680
Gender gap in labour-force
2006-2023 FIGURE
2006 2023 Eurasia and Central Asia 0 0.2 0.4 0.8 1.0 0.6 2006 2023 East Asia and the Pacific 2006 2023 Europe 2006 2023 Latin America and the Caribbean 0 0.2 0.4 0.8 1.0 0.6 2006 2023 Middle East and North Africa 2006 2023 North America 2006 2023 0 0.2 0.4 0.8 1.0 0.6 2006 2023 Sub-Saharan Africa Southern Asia Gender gap in labour-force participation (0-1, parity) Gender gap in labour-force participation, by region, 2006-2023 FIGURE 2.2
participation,
2.1
Global Gender Gap Report 2023 34
Unemployment
Labour-force participation rates mask trends in unemployment since the former counts both those working and those unemployed but actively looking for employment.
After the surge in unemployment due to pandemic lockdowns, both men’s and women’s unemployment rates have almost returned to prepandemic levels (Figure 2.3). Historically, women have consistently faced higher unemployment rates than men, except for a short period in 2020 when the pandemic led to a peak in unemployment for both genders (and slightly more so for men). Since then, the likelihood of women experiencing unemployment is again higher than for men, compounding the gender gap observed in labourforce participation: not only are fewer women participating in the labour market, but out of those who are, relatively fewer are employed. According to the latest data from the International Labour Organization (ILO), the global unemployment rate stands at approximately 4.5% for women and 4.3% for men.6
Disparity in female and male unemployment is highest in the Middle East and North Africa region, where the parity ratio currently stands at 2.69, followed by Latin America and the Caribbean, with 1.51 parity, and Eurasia and Central Asia at 1.21. East Asia and the Pacific is the only region below parity (1.0), meaning unemployment is lower for female workers than for men.
Figure 2.4 further illustrates that unemployment patterns for women tend to be an amplified version of what is experienced by men. The likelihood of unemployment among workers with different levels
of educational attainment tends to vary based on a country’s income level. In many advanced economies individuals with basic education face a higher risk of unemployment, and this pattern is particularly pronounced for women (Figure 2.4.a). Conversely, in low- and middle-income countries, individuals with advanced education are more susceptible to unemployment, with women again disproportionately affected (Figure 2.4.b).
Further, women face greater difficulties in their search for employment. An individual is considered unemployed if they are actively looking for work and are available to start a job within a short notice period, typically a week. However, this definition assumes that men and women face similar conditions in their job searches and are equally available to take up employment on short notice. To address these limitations, the ILO has introduced the “jobs gap” measure, which encompasses all individuals who desire employment but are currently unemployed, including those actively seeking employment and readily available to start work on short notice, those not actively searching employment opportunities and not available for immediate job placement, and those searching for employment but unable to join the workforce on short notice.
According to this ILO estimate, 12.3%, or 473 million people, fall into the jobs gap category. Women’s jobs gap rate of 15% is significantly higher than men’s jobs gap rate of 10.5%.7 Among both men and women actively seeking employment, women are also significantly less likely to be readily available to start work on short notice than men.8 Evidence suggests that these gaps persist due to both a lack of suitable job opportunities and lack of access to existing opportunities, in turn due to disproportionate care responsibilities and
2013 2014 2015 2016 2017 2018 2019 2020 2021 2022 Gender gap in unemployment (0-1, parity) Year 1.10 0.95 1.00 1.05 Parity line Source World Economic Forum calculations based on ILO modeled estimates, 100 countries, constant sample.
Gender gap in unemployment, 2013-2022
Global Gender Gap Report 2023 35
FIGURE 2.3
Unemployment by level of education, female and male workers, by income level, 2022 or latest year available
market economies
Unemployment of workers with basic education (%)
economies
Source International Labour Organization (ILO), ILOSTAT. Note
Educational attainment based on the International Standard Classification of Education (ISCED). Basic education is defined as primary and lower secondary education and advanced education is defined as short-cycle tertiary education, bachelor's, master's and doctoral or equivalent levels.
discouragement to search for opportunities, among other factors.9
Working conditions
When women secure employment, they often face substandard quality of working conditions. A significant portion of the recovery in employment since 2020 can be attributed to informal employment. The ILO estimates that out of every five jobs created for women, four are within the informal economy, whereas for men, the ratio is two out of every three jobs.10 While informal work is critical and may drive production and employment, it is often a “last-resort” option characterized by a lack of legal protections, social security, and decent working conditions, and poses numerous challenges for women’s economic and social wellbeing.
Overall, over the last decade, there has been insufficient progress in improving working conditions, interrupted by shocks in key labourforce indicators. Women still encounter barriers entering the workforce, struggle to find jobs, and face relatively poorer working conditions, calling for renewed focus by both governments and business leaders. Across the world, inadequate care systems are one of the largest roadblocks to improving gender gaps in the labour market.
Unemployment of workers with advanced education (%) 20 30 40 45 35 25 15 5 0 10 20 30 40 35 25 15 5 0 10 20 30 40 45 35 25 15 5 0 10
Advanced
Emerging
FIGURE 2.4
Georgia Eswatini Spain Algeria Slovakia South Africa Sweden Azerbaijan North Macedonia Jordan Rwanda Morocco Botswana Guinea Bulgaria Finland
A. Female
Tunisia Pakistan Jordan Morocco Algeria Botswana Spain South-Africa Sweden Bulgaria North Macedonia Lebanon Italy Rwanda USA Finland Greece Montenegro Slovakia Angola Cameroon Chad Saudi Arabia Mali
B. Male
Global Gender Gap Report 2023 36
FIGURE 2.5
Workforce representation across industries
In addition to overall barriers to labour-force participation and employment, global data provided by LinkedIn shows persistent skewing in women’s representation in the workforce across industries.11
In LinkedIn’s sample, which comprises all LinkedIn users in 163 countries, women account for 41.9% of the workforce (ILO reports 39.5% in 2021 for the global workforce12). Trends over time indicate that the share of women hired into the total workforce saw upward trends between 2016-2019, increasing from 41.6% to 42.1% before plateauing in 2020. In the last three years, the proportion of jobs held by women increased again in 2021 (+0.12 percentage points), followed by a slight drop in 2022 (-0.03 percentage points) and a steeper decline in 2023 (-0.31 percentage points).
A closer look across industries reveals that Healthcare and Care Services (64.7%) continues to be a female-dominated field. Women also outnumber men, though to a lesser degree, in Education (54.0%) and Consumer Services (51.8%). The Government and Public sector is the only one showcasing a fairly balanced distribution of men and women across occupations, with women accounting for almost half (49.7%) of the workforce in 2023 (down from 50% in 2022).
Industries where women are under-represented yet still make up more than 40% of the workforce (i.e. above the global average score of 41.9%, and the median score of 42.4%) are Retail (48.7%), Entertainment Providers (48.4%), Administrative and Support Services (46.5%), Real Estate (44.7%), Accommodation and Food (43.3%) and Financial Services (42.4%). Finally, women are poorly represented in sectors like Oil, Gas and Mining (22.7%) and Infrastructure (22.3%), where they account for less than one-quarter of workers.
The drop in women’s workforce representation between 2022 and 2023 noted earlier is observed across industries, but especially in Consumer Services (-0.71 percentage points), Accommodation and Food (-0.67 percentage points), Agriculture (-0.65 percentage points), and Wholesale (-0.62 percentage points).
The share of women in Accommodation and Food, however, has been experiencing a downward trend since 2020 – along with women’s share in Retail and, to a smaller extent, in Healthcare and Care Services and Financial Services (for the latter, the decline started in 2018).
Representation of women in the workforce, by industry, 2016-2023
2.2 2016 2017 2018 2019 2020 2021 2022 2023 Overall Healthcare and Care Services Education Consumer Services Government and Public Sector Retail Entertainment Providers Administrative and Support Services Real Estate Accommodation and Food Financial Services Professional Services Technology, Information and Media Wholesale Utilities Manufacturing Agriculture Supply Chain and Transportation Oil, Gas and Mining Infrastructure Share (%) Year 20 30 40 50 60 70
LinkedIn Economic Graph.
Source
Note The 2023 data points only include data for Q1 2023. Global Gender Gap Report 2023 37
The industries where women’s representation has been trending markedly upward since 2016 (albeit dipping at the beginning of 2023) are: Government and Public Sector (+1.8 percentage points in 2022 compared to 2016), Agriculture (+1.24 percentage
points), Infrastructure (+1.16 percentage points), Consumer Services (+1.1 percentage points), Professional Services (+0.95 percentage points) and Technology, Information and Media (+0.94 percentage points).
Representation of women in senior leadership
LinkedIn data indicates that the share of women in senior leadership positions – where “senior leadership” is defined as Director,13 Vice-President (VP)14 or C-suite15 – is at 32.2% in 2023 nearly 10 percentage points lower than women’s overall 2023 workforce representation of 41.9%.
Women continue to be outnumbered by men in senior leadership positions across all industries, especially so in fields like Manufacturing (24.6% women); Agriculture (23.3%); Supply Chain and Transportation (23.0%); Oil, Gas and Mining (18.6%); and Infrastructure (16.1%).
The sectors where gender diversity in senior leadership is more present, with women taking up between one-third and one-half of senior leadership roles, are: Healthcare and Care Services (49.5%), Education (46.0%), Consumer Services (45.9%), Government and Public Sector (40.3%), Retail (38.5%), Entertainment Providers (37.1%), Administrative and Support Services (34.7%), and Accommodation and Food (33.5%).
Organizational hierarchy levels
When further disaggregating the data by seniority levels, it becomes apparent that different industries display different intensities and patterns when it comes to the “drop to the top” – the degree to which female representation drops as seniority level increases. This is illustrated in Figure 2.7.
Representation drops to 25% in C-suite positions on average, which is just more than half of the representation in entry-level positions, at 46%. Women fare relatively better in industries such as Consumer Services, Retail, and Education, which register ratios of C-suite vs entry level representation between 64% and 68%, as shown in Table 2.1. Construction, Financial Services and Real Estate, on the other hand, present the toughest conditions for aspiring female leaders, with a ratio of C-suite to entry-level representation of less than 50%.
On average, across industries, a significant gap is seen when comparing the share of women in senior contributor positions (44.0%) to that of women in Manager (35.5%) or Director roles (36.8%). The disproportionate share of men holding top positions is even starker among higher-ranked positions, where men account for 71.7% of Vice-President (VP) roles and 74.6% of C-suite positions on average.
Industries with the greatest discrepancy between women’s share in senior contributor roles and that in either Director or higher-ranked roles (VP or C-suite) are Real Estate (-12.9 percentage points), Administrative and Support Services (-11.7 percentage points), Entertainment Providers (-10.9 percentage points) and Healthcare and Care Services (-10 percentage points). The fields with a better retention of women and thus less abrupt drops in women’s share in senior contributor versus senior leader roles are Education (-1.3 percentage points) and Consumer Services (-1.4 percentage points).
Despite a significant drop in gender diversity from more junior to more senior levels, Healthcare and Care Services is the only industry where women surpass men in either Manager (60.7%) or Director (53.8%) positions, while also displaying the highest share of women in either VP (46.8%) or C-suite (39.8%) roles. The next-best industries for female senior leaders are Consumer Services (e.g. 49.9% of Director positions, 46.3% of VP roles and 38.4% of C-suite roles are held by women) and Education (e.g. 49.3% of Director positions, 41.4% of VP roles and 38.6% of C-suite roles are held by women).
Senior leadership
Despite the overall “drop to the top”, women have increased their representation in senior leadership since 2016 across all industries. The sectors that made gains in women taking up Director roles, for instance, are Technology, Information and Media (an increase of 2.4 percentage points from 30.8% in 2016 to 33.2% in 2022), Professional Services (+2.1 percentage points) and Government and Public Sector (+2 percentage points). Slower progression over time is noticed in the field of Entertainment Providers (+0.4 percentage points) and in Healthcare and Care Services (+0.5 percentage points).
The latter, however, displays one of the more marked improvements of women’s representation in VP roles, with an increase of 1.6 percentage points between 2016-2022, alongside even more notable progress in Technology, Information and Media as well as Professional Services (both registering a rise of 1.9 percentage points). Women’s ranks in VP positions have not increased as quickly in either Accommodation and Food (+0.4 percentage points) or Administrative and Support Services (+0.3 percentage points).
2.3 Global Gender Gap Report 2023 38
0 10 20 30 40 50 60 70 80 90 100 Share (%) Government and Public Sector Healthcare and Care Services Financial Services Entertainment Providers Education Accommodation and Food Administrative and Support Services Agriculture Consumer Services Supply Chain and Transportation Retail Real Estate Professional Services Infrastructure Manufacturing Oil, Gas and Mining Overall Wholesale Technology, Information and Media Utilities 35% 25% 46% 46% 37% 32% 40% 34% 47% 32% 52% 54% 48% 42% 50% 50% 65% 16% 22% 25% 32% 19% 23% 32% 42% 32% 42% 29% 45% 39% 49% 23% 30% 28% 36% 25% 33% 25% 34% 43% Source LinkedIn Economic Graph. Women's representation in the workforce, overall vs. in leadership, by industry, 2022 FIGURE 2.6 Senior leaders All levels Global Gender Gap Report 2023 39
Share of women Entry(A)Senior(B)Manager(C)Director(D)Vicepresident(E)C-suite(F) Consumer Services 0 20 40 60 70 50 A B C D E F Retail A B C D E F Education A B C D E F Administrative and Support Service A B C D E F Professional Services A B C D E F Entertainment Providers A B C D E F Oil, Gas, and Mining A B C D E F Hospitals and Health Care A B C D E F Global A B C D E F Manufacturing A B C D E F Farming, Ranching, Forestry A B C D E F Technology, Information and Media A B C D E D Government Administration A B C D E D Accommodation and Food Services A B C D E D Utilities Share (%) 30 10 0 20 40 60 70 50 30 10 0 20 40 60 70 50 30 10 0 20 40 60 70 50 30 10 0 20 40 60 70 50 30 10 Industry representation of women, by seniority level, as of March 2023 FIGURE 2.7 Global Gender Gap Report 2023 40
Wholesale A B C D E F Transportation, Logistics, Supply Chain and Storage A B C D E F Construction A B C D E F Financial Services A B C D E F Real Estate and Equipment Rental Services Entry(A)Senior(B)Manager(C)Director(D)Vicepresident(E)C-suite(F) 0 20 40 60 70 50 Share (%) 30 10 0 20 40 60 70 50 30 10 Share of women Industry representation of women, by seniority level, as of March 2023 FIGURE 2.7
entry-level
Percentage of women in... Consumer Services Retail Education Administrative and Support Services Professional Services Entertainment Providers Oil, Gas, and Mining Hospitals and Health Care Overall Manufacturing Farming, Ranching, Forestry Technology, Information and Media Government Administration Accommodation and Food Services Utilities Wholesale Transportation, Logistics, Supply Chain and Storage Construction Financial Services Real Estate and Equipment Rental Services Entry-level position (a) C-suite level positions (b) “Drop to the top” (b)/(a) 53% 57% 60% 50% 45% 52% 24% 71% 46% 34% 36% 37% 55% 49% 35% 38% 34% 25% 49% 54% 36% 38% 39% 29% 26% 30% 14% 40% 25% 19% 20% 20% 29% 26% 18% 19% 17% 12% 23% 23% 0.67 0.68 0.64 0.59 0.58 0.57 0.57 0.56 0.56 0.55 0.54 0.53 0.53 0.53 0.52 0.50 0.50 0.49 0.47 0.43 0 1 Source LinkedIn Economic Graph. Drop to the top, by industry, as of March 2023 TABLE 2.1 Source The data presented in this graph is presented in descending order based on the ratio of women's representation in both entry-level and C-suite positions. The data presented in this graph is ordered in descending order based on the ratio of women's representation in both entry-level positions and C-suite positions. 100% 0% Share Global Gender Gap Report 2023 41
Source LinkedIn Economic Graph. Note Charts are arranged in descending order by the difference between women in
and C-suite positions as a share of the overall number of those positions.
Healthcare and
Education
Government
Overall
Professional Services
Note
The 2023 data points only include data for Q1 2023.
The global share of women taking up senior leadership roles (Director, VP or C-suite) had been on an upward slope in recent years, increasing from 31.1% in 2016 to 32.6% in 2022, yet dropping to 32.2% in the first quarter of 2023. Between 2016 and mid-2022, progress on women’s representation in senior leadership was seen across industries: upward trends were steeper in Technology, Information and Media (+1.98 percentage points); Professional Services (+1.96 percentage points); Government and Public Sector (+1.93 percentage points); Manufacturing (+1.84 percentage points); and Utilities (+1.75 percentage points).
Yet, women’s workforce representation decreased at all levels of seniority across the examined industries in the early 2023 data (-0.31 percentage points), and the decline is stronger for senior leader positions (-0.33 percentage points). The recent drop in the representation of women in top positions is especially visible in sectors like Consumer Services (-0.58 percentage points), Healthcare and Care Services (-0.42 percentage points), Real Estate (-0.41 percentage points), and Infrastructure and Agriculture (-0.4 percentage points).
Leadership hiring rates
A similar trajectory is observed when tracking the evolution of leadership hiring rates over time, which in turn affects the overall leadership representation rates as seen in Figure 2.8. For the past eight years, the proportion of women hired into leadership positions has been steadily increasing by about 1% per year globally. In the first months of the COVID-19 pandemic in 2020, there was a decline followed by a recovery matching or in some industries even exceeding the pre-pandemic trajectory. However, this trend shows a clear reversal starting in 2022, bringing the 2023 rate back to 2021 levels (Figure 2.9).
Progress in hiring women into top positions has not been advancing at the same rate across industries since 2016 (Figure 2.10). Some sectors are displaying upward trends over several years (Financial Services; Professional Services; Oil, Gas, and Mining), while others are fluctuating (Government Administration, Administrative and Support Services).
2016 2017 2018 2019 2020 2021 2022 2023
Care
Services
Consumer
Services
Retail
and Public Sector
Entertainment Providers Administrative and Support Services
Accommodation and Food
Estate
Media
Utilities
Agriculture Supply Chain and Transportation Oil, Gas and Mining Infrastructure Share (%) Year 10 20 30 40 60 50 Source LinkedIn Economic Graph. Share of women in senior leadership, by industry, 2016-2023 FIGURE 2.8
Financial Services Real
Technology, Information and
Wholesale
Manufacturing
Global Gender Gap Report 2023 42
The recent downturn shown in Figure 2.9 has been observed across industries. Estimates by LinkedIn show that as of May 2023, the proportion of women hired into leadership is lower than what would be predicted based on the pre-2022 trend line for most industries, apart from Construction; Real Estate; Oil, Gas and Mining; Education;
and Agriculture, which continue to stay on trend. The most affected industries are Technology and Professional Services, which in May 2023 was 4 percentage points below trend, and Entertainment Providers and Wholesale, which were 3 percentage points below trend (Figure 2.10).
Q1 2016 Q1 2017 Q1 2018 Q1 2019 Q1 2020 Q1 2021 Q1 2022 Q1 2023 Q2 Q3 Q4 Q2 Q3 Q4 Q2 Q3 Q4 Q2 Q3 Q4 Q2 Q3 Q4 Q2 Q3 Q4 Q2 Q3 Q4 Q2 Share (%) Year 33 25 26 27 28 29 30 31 32 Source LinkedIn
Proportion of women in leadership hires, seasonally adjusted, 2016-2023 FIGURE 2.9 Quarterly
Global Gender Gap Report 2023 43
Economic Graph.
share of hiring Yearly moving average
Note
The 2023 data points only include data for Q1 2023.
Retail
Real
2.4
Gender gaps in the labour markets of the future
STEM occupations
Examining more closely science, technology, engineering and math (STEM) occupations – an important set of jobs that are well remunerated and expected to grow in significance and scope in the future – LinkedIn data on members’ job profiles show that women remain significantly underrepresented in the STEM workforce.16 Women make up almost half (49.3%) of total employment across non-STEM occupations, but just 29.2% of all STEM workers (Figure 2.11). The fraction of women in STEM jobs has nonetheless grown by 1.58 percentage points from 27.6% in 2015, and the growth outpaces that for non-STEM jobs (0.37 percentage points).
This data from LinkedIn suggests that one first point of intervention in improving numbers could be to smooth the transition for female STEM graduates from university to the world of work. While the percentage of female STEM graduates entering into STEM employment is increasing with every
cohort, the numbers on the integration of STEM university graduates into the labour market show that the retention of women in STEM one year after graduating sees a significant drop. Figure 2.12 shows that among those graduating with a STEM degree in 2017, for instance, 35.5% were women; a year after graduation, 29.6% of those holding STEM jobs were women (a drop of 5.9 percentage points). In 2021, women comprised 38.5% of STEM degree recipients compared with 31.6% of STEM workers one year following graduation (a drop of 6.9 percentage points). Once in the workforce, however, women are generally less likely to drop out in the first years (until they start climbing the hierarchy, see Figure 2.12). For example, the difference between year 2 after graduation and year 1 after graduation is around 1 or 2 percentage points.
When it comes to STEM occupations, women are scarce throughout all industries, apart from Healthcare and Care Services, where they represent 51.5% of the workforce. Gender parity in STEM jobs across industries varies widely. In Technology,
2016 2017 2018 2019 2020 2021 2022 2023
Food Services Administrative
Support Services
Services
Entertainment
Financial
Administration
Oil, Gas
Accommodation and
and
Construction Consumer
Education
Providers Farming, Ranching, Forestry
Services Government
Hospitals and Health Care Manufacturing
and Mining Professional Services
Estate
Rental
and Equipment
Services
Technology,
Supply Chain
Storage
Wholesale Share (%) Year 15 25 35 55 45 Source LinkedIn Economic Graph. Share of women hired into senior leadership, by industry, 2016-2023 FIGURE 2.10
Information and Media Transportation, Logistics,
and
Utilities
Global Gender Gap Report 2023 44
Year Share (%) 60 2015 20 30 40 50 2023 2022 2021 2020 2019 2018 2017 2016 Share of women in STEM and non-STEM workforce, 2015-2023 FIGURE
LinkedIn
Non-STEM STEM Source LinkedIn Economic Graph. Years since graduation Share (%) 40 25 30 35 4 3 2 1 0 5 2021 2020 2019 2018 2017
Share of women STEM graduates (Bachelor's degree or higher), by years since graduation 0 Share (%) 20 40 50 60 70 30 10 Chief executive Vice president Entry Senior Manager Director Source LinkedIn Economic Graph. Share of women in the workforce, by seniority level and STEM occupation status
Non-STEM STEM Global Gender Gap Report 2023 45
2.11 Source
Economic Graph.
FIGURE 2.12
FIGURE 2.13
Information and Media, for example, the share of STEM occupations stands at 23.4% for women versus 43.6% for men, meaning that women are half (53.8%) as likely to take up STEM employment in this field. In other industries, such as Real Estate, women are only 35% as likely as men to work in STEM, whereas in Agriculture and Education, parity reaches 69% and 61.5% respectively.
Women generally tend to be underrepresented in leadership roles, but especially in STEM work: they account for 29.4% of entry-level workers and 29.9% of senior workers, but the share of women in Manager or Director positions drops to onequarter (25.5% and 26.7% respectively). Women’s representation in high-level leadership roles such as VP and C-suite drops even lower, to 17.8% and 12.4%, respectively.
AI occupation take-up
As AI continues to revolutionize the labour market, a new metric has been developed in collaboration with LinkedIn to analyse the gender gap in the distribution of AI talent across industries that have experienced significant impacts from AI.17
The concentration of AI talent overall has surged, increasing six times between 2016 and 2022. The extent of this increase varies across industries, with Technology, Education, Professional Services, and Financial Services exhibiting the highest concentration of AI talent.
However, when it comes to gender gaps, representation of female AI talent is lower compared
to men in all large industries, as depicted in Figure 2.14. Overall, as of 2022, only 30% of AI talent were female. The industries with the highest concentration of AI talent include those with a low representation of women, as well as those with higher representation, such as Financial Services (female representation of 28%); Education (40%); Professional Services (31%); and Technology, Information, and Media (25%). Additionally, Consumer Services (38%) and Government and Public Sector (35%) are industries with a large gender gap overall and in AI. Female representation in AI is progressing, yet very slowly. The percentage of women working in AI today is roughly 4% higher than it was in 2016 (~26%).
The gender gap in AI professionals has far-reaching implications that extend beyond the realm of technology. It exacerbates the existing gender disparities in the workforce, particularly in a rapidlygrowing sector like AI that holds significant influence over various industries. As AI is disrupting critical solutions in knowledge work, supply chains, hiring, education, health and the environment, among others, underrepresentation of women in AI can impede the realization of the innovation premium associated with diversity. In addition, when women’s perspectives, experiences and insights are not adequately incorporated into AI development and deployment, biased algorithms and technologies may be perpetuated, risking biased and suboptimal solutions to emerging challenges.
0 10 20 30 40 50 60 70 80 90 100 Share (%) Education Consumer Services Government and Public Sector Professional Services Overall Manufacturing Technology, Information and Media Financial Services 62% 65% 69% 73% 75% 78% 70% 60% 38% 35% 31% 727% 25% 22% 30% 40%
FIGURE 2.14 Source LinkedIn Economic Graph.
Gender representation for AI talent, by industry, 2022
Women Men
Global Gender Gap Report 2023 46
Gender gaps in the skills of the future
As labour markets get reconfigured with the emergence of new working arrangements and frontier technologies, education and skills do not only drive employability, productivity and wages, they also impact people’s access to temporal and geographical flexibility and their ability to balance caregiving responsibilities around work. This has been an important factor for labour-force participation choices among women and men, their career progression and their stress levels, especially since the COVID-19 pandemic began.18
It is no longer sufficient to frontload skills through training in the initial phase of the career for a single qualification throughout a lifetime.19 In the changing job market, demand for skills is rapidly shifting. As illustrated in Figure 2.15, creative thinking, analytical thinking, technological literacy, curiosity and lifelong learning and resilience, flexibility and agility are increasing in demand, according to the Forum’s Future of Jobs survey that studied the business expectations of evolution of the importance of these skills.
To match supply for these rapidly evolving demand for skills, governments and organizations have been calling for policy focus and financial investment into adult education, training and lifelong learning, in line with SDG 4 (“Ensure inclusive and equitable quality education and promote lifelong learning opportunities for all”).20 In this context, the emergence of online learning has introduced a wide array of new educational solutions that can assist individuals in adapting to the dynamic job market.
Online learning offers the advantages of flexibility, accessibility and customization, enabling learners to acquire knowledge in a manner that suits their specific needs and circumstances. However, women and men currently do not have equal opportunities and access to these online platforms, given the persistent digital divide.21 Even when they do use these platforms, there are gender gaps in skilling, especially those that are projected to grow in importance and demand. In the subsections that follow, analysis developed in collaboration with Coursera reveals important aspects related to gender gaps in the enrolment, attainment and efficiency in the acquisition of skills that are expected to grow in importance.
Online enrolment
The number of enrolments in courses on online learning platform Coursera experienced more than a fourfold growth in users between 2015 and 2022. In particular, the lockdown during the pandemic precipitated this growth across the education technology industry as learners of all levels had to shift to online platforms. Coursera witnessed its highest year-on-year increase in enrolments for both
men and women in 2020. Even after the lockdowns were relaxed, a combination of online, blended and hybridized modalities of learning continued, highlighting new opportunities in online skilling and adult training. However, studying the gap between women and men’s enrolment throughout this period points to persistent gender disparities and indicates missed opportunities and barriers for women to access and benefit from such learning opportunities.
As of 2022, except for teaching and mentoring courses, there is disparity in enrolment in every skill category. For enrolment in cognitive skills such as creative thinking (64.3% parity22), analytical thinking (52.7%) and systems thinking (55.6%), which are projected to become increasingly crucial in the next five years, gender gaps remain persistent and even register declines since 2015 parity levels.23 For enrolment in technology skills such as technological literacy (43.7% parity) and AI and big data (33.7%), which are within the top 10 skills projected to grow, there is less than 50% parity and progress has been sluggish since 2015.
However, there is a relatively higher degree of gender parity in enrolling in courses for obtaining attitudes and socio-emotional capabilities. This is particularly important as attitudes and socioemotional skills are among the most important skills to employers. Companies place great emphasis on these “human” skills that are less susceptible to automation and that allow their workforce to more efficiently respond to change.24 For self-efficacy skills, such as curiosity and lifelong learning (87.6% parity); resilience, flexibility and agility (77.1%); and motivation and self-awareness (86.8%), parity in enrolment has been relatively high. Gender gaps are also relatively lower in enrolling for skills under the category of working with others, for example, teaching and mentoring (131.5%), leadership and social influence (75.8%) and empathy and active listening (72.3%). However, women still tend to enrol in smaller numbers compared to men in all these skills except teaching and mentoring.
Over time since 2015, these gender gaps have reduced only slowly in most skills, including those with glaring gender differences such as AI and big data, technological literacy, analytical thinking and creative thinking. Further, in skills such as curiosity and lifelong learning, resilience, flexibility and agility, motivation and self-awareness, disparity in enrolment shows signs of worsening as gender parity in enrolment in these skills have declined in the last one or two years.
A closer examination of learning hours further supports and mirrors the analysis in gender disparities in enrollment across these skills. Overall, parity in enrolment in many key skills has been low. Further, they are slow to progress towards parity, and except for teaching and mentoring, talent
2.5 Global Gender Gap Report 2023 47
Share of companies which consider skills to be increasing or decreasing in importance, ordered by the net difference
Creative thinking
Analytical thinking
Technological literacy
Curiosity and lifelong learning
Resilience, flexibility and agility
Systems thinking
AI and big data
Motivation and self-awareness
Talent management
Service orientation and customer service
Leadership and social influence
Empathy and active listening
Dependability and attention to detail
Resource management and operations
Networks and cybersecurity
Quality control
Design and user experience
Teaching and mentoring
Environmental stewardship
Programming
Marketing and media
Multi-lingualism
Reading, writing and mathematics
Global citizenship
Sensory-processing abilities
Manual dexterity, endurance and precision
Increasing importance
Source
World Economic Forum, Future of Jobs Survey 2023. Note The Future of Jobs Survey uses the World Economic Forum's Global Skills Taxonomy. The share of companies which consider skills to be of stable importance to their workers is not plotted. For more information, see https://www1.reskillingrevolution2030.org/skills-taxonomy/index.html.
FIGURE 2.15
Skills on the rise
Share of companies surveyed (%) -25 0 25 50 75 100
Declining importance Skills, knowledge and abilities Net difference: Attitudes 73.2% 71.6% 67.7% 66.8% 65.8% 59.9% 59.5% 58.9% 56.4% 54.8% 53.1% 52.3% 50.3% 49.5% 48.4% 47.8% 43.2% 38.8% 38.4% 38.0% 26.4% 23.8% 22.6% 14.9% 52.0% 51.4%
Global Gender Gap Report 2023 48
2015 2022 Creative thinking Parity line 0 0.5 1.5 2.0 1.0 2015 2022 Analytical thinking 2015 2022 Technological literacy 2015 2022 0 0.5 1.5 2.0 1.0 2015 2022 2015 2022 Curiosity and lifelong learning Resilience, flexibility and agility Systems thinking 2015 2022 0 0.5 1.5 2.0 1.0 2015 2022 2015 2022 AI and big data Motivation and self-awareness Talent management 2015 2022 0 0.5 1.5 2.0 1.0 2015 2022 2015 2022 Service orientation and customer service Leadership and social influence Empathy and active listening 2015 2022 0 0.5 1.5 2.0 1.0 2015 2022 2015 2022 Dependability and attention to detail Resource management and operations Networks and cybersecurity Gender gap Working with others Engagement skills Cognitive skills Self-efficacy Ethics Technology skills Management skills Organized by the share of organizations which consider skills to be increasing or decreasing in importance, according to the Future of Jobs Report 2023 Gender gap in enrolment in lifelong learning courses, by skill, 2015-2022 FIGURE 2.16 Global Gender Gap Report 2023 49
Gender gap in enrolment in lifelong learning courses, by skill, 2015-2022
by the
management and design and user experience, parity in any skills has not progressed by more than 3 percentage points since last year.
Skill proficiency through online learning
The findings regarding parity in enrolment extend to patterns of parity in skilling outcomes. Gender differences in skilling outcomes reveal slightly varied patterns across different skill categories and proficiency levels.
Women are at parity with men in acquiring beginner and advanced levels of self-efficacy, working with others, and ethics skills. They also exhibit parity in attaining beginner-level management and engagement skills. However, when compared
to men, a smaller number of women achieve intermediate and advanced levels in this skill category. Notably, the most significant gender gap is found in the technology skills category, across all proficiency levels. Furthermore, gender disparity in cognitive skills also remains relatively high across all proficiency levels.
Across all skill categories, the gender gaps tend to widen as proficiency levels increase. The largest drop in attainment occurs in the management and engagement skills skill category, where parity observed at the beginner level decreases from 108.8% to 71.7% at the advanced level. There is also a 29% difference between parity in attaining beginner level (75.9%) and advanced level (46.8%) technology skills. For cognitive skills, there is 85.3% parity in attaining cognitive skills; however, this drops to 61.4% parity in advance level skill attainment.
2015 2022 Quality control 0 0.5 1.5 2.0 1.0 2015 2022 Design and user experience 2015 2022 Teaching and mentoring 2015 2022 0 0.5 1.5 2.0 1.0 2015 2022 2015 2022 Environmental stewardship Programming Marketing and media 2015 2022 0 0.5 1.5 2.0 1.0 2015 2022 Reading, writing and mathematics Global citizenship Gender gap Working with others Engagement skills Cognitive skills Self-efficacy Ethics Technology skills Management skills
Future
Jobs
Parity line
FIGURE
World Economic Forum calculations based on Coursera data. Source Skills are coloured according to the level-2 skill type in the Global Skills Taxonomy and ordered by increasing importance as per the Future of Jobs Survey. Global Gender Gap Report 2023 50
Organized
share of organizations which consider skills to be increasing or decreasing in importance, according to the
of
Report 2023
2.16 Source
The underlying factors contributing to this disparity and the disadvantages faced by women warrant further investigation. In the subsequent section, we delve into the examination of gender disparities in the time required to acquire these skills to study the efficiency with which women and men are attaining these skills.
Time required to attain proficiency in key skill categories
Even as women are getting fewer learning opportunities than men, they demonstrate relatively more efficiency in attaining them across proficiency levels for most skills. Women are especially outpacing men in achieving proficiency in skills that take relatively longer to acquire, as measured by median learning hours. Women tend to attain most proficiency levels in all the skill categories studied, such as cognitive skills, management
and engagement skills, self-efficacy, working with others, and ethics and technology skills, in less time compared to men. Only at beginner levels of proficiency for self-efficacy, working with others and ethics and management and engagement skills did women require slightly more learning hours.
The pattern may stem from factors like time poverty experienced by women, the efficiency of the enrolled women, or a combination of various elements.
The gendered patterns observed in skilling have significant ramifications for economic progress due to their effects on talent allocation, utilization and innovation in the context of fast evolving skill demands. This has the potential to impede progress in reducing occupational segregation, thereby restricting job opportunities, and limiting the available talent pool. This can consequently negatively impact economic growth.25 Moreover, the enduring nature of this segregation, combined
with obstacles to acquiring specific skills and the perpetuation of gender stereotypes, may result in missed opportunities for women to increase their earnings and advance in their careers. According to an OECD study based on data from the PIAAC Survey of Advanced Skills, there is a positive correlation between wages and adult training and learning for both male and female workers. Further, women who engage in job-related non-formal
trainings, such as courses, seminars, workshops or organized sessions, tend to earn higher wages than their male counterparts.26
Improving women’s access to skilling opportunities will be critical to respond to the rapid shifts in the skills needed in the job market. Research based on Coursera data in the Future of Jobs Report 2023 highlighted that learners without degrees can learn
0 0.5 1.0 1.5 0 0.5 1.0 1.5 0 0.5 1.0 1.5 0 0.5 1.0 1.5 Cognitive skills Management and engagement skills Gender gap in skill proficiency attainment (1 = gender parity) Advanced Intermediate Beginner Self-efficacy, working with others and ethics Technology skills Advanced Intermediate Beginner Proficiency level Not available Gender gap in skill proficiency attainment, by level of proficiency and skill category, 2022
Source World Economic Forum calculations based on Coursera data.
FIGURE 2.17
Global Gender Gap Report 2023 51
Women Men
Source World Economic Forum calculations based on Coursera data.
critical skills just as fast as degree holders. This will be particularly important for women without advanced formal education and there is significant potential for skills-based approaches such as industry micro-credentials and skills-based hiring to tackle skills gaps and talent shortages.27
0 10 20 30 Cognitive skills 0 10 20 30 Management and engagement skills Median number of learning hours Advanced Intermediate Beginner 0 10 20 30 Self-efficacy, working with others and ethics 0 10 20 30 Technology skills Advanced Intermediate Beginner Proficiency level Not available
number of learning hours, by gender, across proficiency levels, 2022 FIGURE 2.18
Median
Global Gender Gap Report 2023 52
Gender gaps in political leadership 2.6
Much like in the case of representation of women in business leadership, gender gaps in political leadership continue to persist. Although there has been an increase in the number of women holding political decision-making posts worldwide, achieving gender parity remains a distant goal and regional disparities are significant. The sections below examine the progress made so far, regional disparities and the challenges ahead.
Head of state level
As of 31 December 2022, approximately 27.9% of the global population, equivalent to 2.12 billion people, live in countries with a female head of state. While this indicator experienced stagnation between 2013 and 2021, 2022 witnessed a significant increase. This surge can primarily be attributed to
Global population under female head of state, 2013-2022
Source
Calculation based on World Economic Forum data and United Nations' World Population Prospects data.
India, the world’s most populous country, where a female president assumed power following the 2022 presidential election. In total, since January 2022, nine women have come into power, with eight of them still holding their positions as of March 2023. Depending on the political system of the country, these heads of state positions have varying powers in terms of national agenda setting and representation of the state.
Parliaments
Another recent positive trend is observed when examining the share of women in parliaments, weighted by population. In 2013, only 18.7% of parliament members globally were women among the 76 countries with consistent data. By 2022, this number had risen steadily to 22.9%, reflecting progress over the years. However, global trends do mask the regional disparities. At the regional level, as illustrated in Figure 2.20, the trends show diverse trajectories. Europe leads the way with the highest share of women in parliament, followed by Latin America and the Caribbean, North America, and Sub-Saharan Africa. Southern Asia, Eurasia and Central Asia, and East Asia and the Pacific have maintained stability in women’s representation
during recent years. Conversely, the Middle East and North Africa was the only region to experience a significant decline in women’s representation in parliament from 2020 to 2021, partly driven by the drastic drop in Algeria, from 26% to 8%.
Further, in 2022, Malta witnessed the most substantial jump in the share of women in parliament across all countries, followed by Colombia and Slovenia. Notably, these countries have implemented legislated candidate quotas in their electoral laws. Nicaragua has the strongest representation of women in its National Assembly in 2022, with 51.65% of members being women. Mexico’s Chamber of Deputies and New Zealand’s House of Representatives have achieved gender parity. More than one-third but less than one-half of the representatives were women in 28 economies in 2022. These countries include Iceland (47%), Costa Rica (47%), United Kingdom (35%) and Nepal (33%). Women make up less than one-third of parliamentarians in the remaining 45 countries, including Canada (31%), United States (29%), and Japan (10%), as well as in populous emerging markets such as China (25%), Brazil (18%), India (15%) and Türkiye (17%).
2013 2014 2015 2016 2017 2018 2019 2020 2021 2022 2023 Share of population (%) Year 100 0 20 40 60 80
FIGURE 2.19
Global Gender Gap Report 2023 53
Female head of state Male head of state
Source
World Economic Forum’s calculations based on data from Inter-Parliamentary Union and World Population Prospects data.
Local governance
Women’s equal political participation at all levels of government is recognized in international frameworks such as the Beijing Declaration and Platform for Action and the 2030 Agenda for Sustainable Development Goals (SDGs). Traditional efforts to promote gender equality in politics have primarily focused on national parliaments. However, the SDGs have introduced a new indicator that emphasizes women’s political representation in local decision-making positions. This expansion enables a broader understanding of the opportunities and challenges for leveraging women’s contributions to local decision-making.
Research indicates that women in local decisionmaking positions play a crucial role in redefining local priorities. They bring a unique perspective to governance, emphasizing inclusivity, prioritizing family-friendly policies, and promoting gender equality in areas such as income, employment and parental leave.28 By bringing these issues to
the forefront, women contribute to creating more equitable and responsive local communities.
Data reveals that significant strides have been made in terms of women’s representation in local government globally, though disparities remain between countries and regions. Out of the 117 countries with available data since 2017,29 only 18 countries, including Bolivia (50.4%), India (44.4%) and France (42.3%), have achieved representation of women of over 40% in local governance. On the other hand, 24 economies, mostly in the Middle East, North Africa, and Sub-Saharan Africa, such as Saudi Arabia (1.2%), Ghana (3.8%), Türkiye (10.1%) and Japan (14.31%), have below 15% representation. The remaining 75 economies fall within the 15%-30% range, including diverse nations such as Brazil (15.7%), Indonesia (15.7%), China (28.1%), Ireland (23.9%), Germany (30.3%) and the United Kingdom (35.3%).
Overall, almost 3 million women have been elected to local deliberative bodies in 136 countries. Encouragingly, 85 countries have introduced
2013 2022 Eurasia and Central Asia 10 20 30 40 2013 2022 East Asia and the Pacific 2013 2022 Europe 2013 2022 Latin America and the Caribbean 2013 2022 Middle East and North Africa 2013 2022 North America 2013 2022 2013 2022 Sub-Saharan Africa Southern Asia Share (%) 10 20 30 40 10 20 30 40 Women's representation in parliament (weighted by population), by region, 2013-2022 FIGURE 2.20
Global Gender Gap Report 2023 54
legislated gender quotas for local elections, with 66 countries legislating candidate quotas and 19 reserving seats for women.30
However, despite these positive developments, as of January 2020, out of the 6.02 million elected
2.7
members in local government worldwide, only 2.18 million (36%) are women. Although this is a higher percentage of women’s representation than in national parliaments (25%), achieving gender parity in local governance remains an urgent priority.
DEI programmes to close gender gaps
In the private sector, the scope of gender parity action by pioneering firms has begun to broaden from a focus on the workforce to whole-of-business approaches encompassing inclusive design, inclusive supply chains and community impact. Led by an overall post-pandemic reconfiguration of the workplace, companies have intensified efforts to provide more flexibility – although the overall impact on outcomes such as career progression is currently an open question. Further, a growing number of employers are boosting employee benefits related to caregiving.31
FIGURE 2.21
Industry investment in DEI targets and quotas
0 10 20 30 40 50 Share (%) Manufacturing Accommodation, Food and Leisure Information Technology and Digital Communications Professional Services Energy and Materials Agriculture and Natural Resources Non-governmental and Membership Organizations Supply Chain and Transportation Government and Public Sector Automotive and Aerospace Media, Entertainment and Sports Infrastructure Financial Services Care, Personal Services and Wellbeing Health and Healthcare Retail and Wholesale of Consumer Goods Education and Training Real Estate Source World Economic Forum, Future of Jobs Report 2023.
Share of organizations surveyed that select targets and quotas as the key component of their DEI programme 41.2% 37.3% 31.8% 31.2% 29.4% 28.9% 28.8% 27.3% 26.1% 23.5% 23.5% 21.4% 18% 17.6% 15.0% 15.0% 13.0% 12.5% Global Gender Gap Report 2023 55
Share of organizations surveyed that select women as the priority of their DEI programme
Economic Forum , Future of Jobs Report 2023.
The World Economic Forum’s 2023 Future of Jobs Survey suggests that more than two-thirds of the organizations surveyed have implemented a Diversity, Equity and Inclusion (DEI) programme. DEI programmes are one pathway to closing workplace gender gaps and can include mentoring, sponsorship, leadership training, specific policies for caregivers or increased flexibility of working arrangements. This can encompass action around gender parity, racial and ethnic equity, LGBTQI inclusion and inclusion of people with disabilities. DEI efforts, however, vary significantly across industries. The sectors that have invested the most in promoting a more inclusive workforce, with at least 30% of companies reporting DEI initiatives, are Nongovernmental and Membership Organizations (41.2%); Supply Chain and Transportation (37.3%);
Agriculture, Forestry and Fishing (31.8%); and Energy and Materials (31.2%). The sectors that have invested the least on DEI targets and quotas are Education and Training (13%) and Real Estate (12.5%).
The majority (79%) of companies surveyed are implementing DEI programmes with a focus on women. The survey suggests that those efforts are primarily designed around training, and less so around material actions to close gender gaps at both industry and economy level.
The industries which focus the highest percentage of their DEI activity on gender parity issues, and where female workers are typically scarce at all levels of seniority, are Energy and Materials
0 10 20 30 40 50 60 70 80 90 100 Share (%) Retail and Wholesale of Consumer Goods Infrastructure Care, Personal Services and Wellbeing Education and training Financial Services Supply Chain and Transportation Energy and Materials
and Natural Resources
Agriculture
Aerospace
and Public Sector
Automotive and
Government
Membership
Non-governmental and
Organisations
Healthcare Manufacturing Information Technology and Digital Communications
Food, and Leisure Professional Services Real Estate Media, Entertainment and Sports Source World
DEI programmes focusing on women, by industry FIGURE 2.22
Health and
Accommodation,
91.1% 90.9% 84.6% 84.3% 83.3% 81.8% 77.5% 77.1% 7.07% 75.8% 75% 74.3% 73.1% 72.7% 70.0% 68.8% 61.5% 60.0% Global Gender Gap Report 2023 56
2.8
(91.1%); Agriculture, Forestry and Fishing (90.9%); and Supply Chain and Transportation (84.6%) – alongside sectors with a relatively better representation of women, such as Financial Services (84.3%); Education and Training (83.3%); and Care, Personal Services and Wellbeing (81.8%). The sectors that place lower emphasis on gender parity in their overall DEI efforts are Real Estate (61.5%) and Media, Entertainment and Sports (60%).
There is further significant cross-national variation in DEI efforts promoting gender inclusion in the workplace. According to the Future of Jobs Survey, the countries where companies are particularly committed to establishing a more gender-diverse workforce are Colombia, the Netherlands, Italy, United Kingdom and Canada. In Colombia and the
United Kingdom, DEI programmes tend to prioritize flexibility on degree requirements for roles and recruitment, as well as on Employment Resource Groups (ERGs).
The existence of DEI programmes alone is not enough for meaningful progress. A recent study identified five success factors that DEI initiatives with the highest impact for underrepresented groups had in common.32 These are (1) a nuanced understanding of the root causes of underrepresentation; (2) a meaningful definition of success; (3) accountable and invested business leaders; (4) a solution designed for its specific context; and (5) rigorous tracking and course correction. These factors must further be refined and customized across industries and regional contexts.
Putting gender parity at the heart of economic recovery and transformation
The 2022 edition of the Global Gender Gap Report called attention to a post-pandemic crisis in the workforce: gender parity across key indicators was slipping, implying large-scale disruption of economic opportunities for women worldwide in labour-market participation, in skilling, in wealth accumulation and in overall wellbeing.33 The recovery from the shock and ensuing polycrisis has been slow and, so far, incomplete, and the current context, coupled with technological and climate change, risks causing further regression in women’s economic empowerment. Not only are millions of women and girls losing out on economic access and opportunity, but these reversals also have wide-ranging consequences for the global economy.
Following a series of gradual but steady increases in the share of women in leadership roles over the past two decades, this share has edged up to, on average, 33.7% in 2023 from 33.4% in 2022 across public- and private-sector leadership roles. However, high-frequency data presented in the report shows that hiring rates for women into leadership positions across industries have been in decline since mid-2022.
Increasing women’s economic participation and achieving gender parity in leadership, in both business and government, are two key levers for addressing broader gender gaps in households, societies and economies. In addition, there are multiple mechanisms that link gender parity with firm-level and economic performance: a robust gender strategy is increasingly seen as essential to attracting the best talent and ensuring long-run economic performance, resilience and survival. Evidence on diversity in decision making shows that a diverse group of leaders makes more fact-based decisions that result in higher quality outcomes.
And at an economy-wide level, gender parity is increasingly being recognized as critical for financial stability and economic performance.34
Collective, coordinated and bold action by privateand public-sector leaders will be instrumental in accelerating progress towards gender parity and igniting renewed growth and greater resilience. Beyond leadership representation, companies can engage in strategies to transform organizational culture, and design products and services to serve a broader range of consumers by making innovation processes more inclusive. Impactful initiatives are emerging at the frontier of business strategy and government policy, yet adoption beyond the frontier too often remains on the surface, is incomplete or altogether deprioritized. Government policy can be better designed to increase women’s labourforce participation, wages, and financial and technology access, and improve care systems and representation in public-sector leadership.
Some governments are taking an equity and inclusion lens to economic policy-making, with recent gender mainstreaming efforts explicitly recognizing gender parity as critical to economic growth and financial stability. A number of governments are implementing more gender equal approaches to increasing labour force participation, pay equity and health and safety standards, preventing harassment and sexual violence at work. At the federal government level, progress can be enabled through gender-responsive budgeting which has in recent years been pioneered and expanded by a growing number of countries, including Sweden, India and Kenya. Further, governments are increasingly recognizing the importance of investing in the care economy and taking steps to support it. They are implementing policies such as expanding access to affordable
Global Gender Gap Report 2023 57
childcare, improving parental leave policies, and investing in healthcare and eldercare services to promote the wellbeing of individuals and the overall economy. Ongoing efforts are a step in the right direction yet will need significant scaling to overcome existing gender gaps in economic participation.
Recent years have seen major setbacks and the state of gender parity still varies widely by company, industry and economy. Yet, a growing number of actors have recognized the importance and urgency of taking action and evidence on effective gender parity initiatives is solidifying. We hope the data and analysis provided in this report can further accelerate the speed of travel towards parity by catalysing and informing action by public- and private-sector leaders in their efforts to close the global gender gap.
Global Gender Gap Report 2023 58
Endnotes
1. IMF, 2023.
2. Kose, et al., 2023.
3. IMF, 2022b.
4. ILO, 2023a.
5. Authors’ calculations based on ILO modelled estimates on labour-force participation rate (accessed 31 March 2023).
6. ILO, 2022.
7. Ibid.
8. ILO, 2023b.
9. Ibid.
10. ILO, 2023c.
11. See also Lara, et al., 2023.
12. ILO, 2023b.
13. LinkedIn categorizes a Director-level individual as one who is an experienced manager with direct reports and leadership responsibilities for multiple groups of individuals.
14. LinkedIn categorizes a Vice-President-level individual as someone who has direct reports and leadership responsibilities for a major portion of a business function.
15. LinkedIn categorizes a C-Suite-level individual as someone who has direct reports and leadership responsibilities for the entire business function.
16. Baird, Ghalawat, et al. (2023) presents the methodology for classifying STEM. Baird, Ko, et al (2023) present measurements for the United States and discussion around some of the metrics presented in this report.
17. The “AI talent concentration” metric is determined by comparing the number of AI professionals to the total number of LinkedIn members worldwide. An individual is considered AI talent if they have explicitly listed AI skills on their profile and/ or works in a job classified as an AI occupation. The concentration of AI talent is then calculated by taking the ratio of the number of AI talent by the number of LinkedIn members in that industry.
18. Goldin, 2022.
19. ILO, 2018.
20. For example, see UNESCO CONFINTEA VII Marrakech Framework for Action: Harnessing the transformational power of Adult Learning and Education, 2022, https://www.uil.unesco.org/sites/default/files/medias/fichiers/2022/06/FINAL%20 MarrakechFrameworkForActionEN_06_21_22_0.pdf
21. Plan International, 2023.
22. The level of progress toward gender parity (the parity score) is calculated as the ratio of the value of each indicator for women to the value for men. A parity score of 100% indicates full parity.
23. The gender gap is the distance from full parity.
24. World Economic Forum, 2023b.
25. EIGE, 2017.
26. Fialho, et al., 2019.
27. World Economic Forum, 2023b.
28. UN Women, 2022a.
29. UN Women, 2022b.
30. Ibid.
31. Care.com, 2023.
32. World Economic Forum, 2023a.
33. World Economic Forum, 2022.
34. IMF, 2022a.
Global Gender Gap Report 2023 59
References
Addati, Laura, Umberto Cattaneo and Emanuela Pozzan, Care at work: Investing in care leave and services for a more gender equal world of work, International Labour Organization (ILO), 2022.
Baird, M., N. Gahlawat, R. Hood, P. Ko and S. Lara, “LinkedIn STEM Classification Methodology”, LinkedIn Economic Graph Technical Note #1, 2023, https:// economicgraph.linkedin.com/content/dam/ me/economicgraph/en-us/PDF/measuringgender-gaps-in-the-us-stem-workforce.pdf
Baird, M., P. Ko, N. Gahlawat, S. Lara and R. Hood, “Measuring gender gaps in the U.S. STEM workforce”, LinkedIn Economic Graph White Paper, 2023, https:// economicgraph.linkedin.com/content/dam/ me/economicgraph/en-us/PDF/measuringgender-gaps-in-the-us-stem-workforce.pdf
Care.com, Future of Benefits Report 2023, 2023.
European Institute for Gender Equality (EIGE), Gender segregation in education, training and the labour market, 2017.
Fialho, P., G. Quintini and M. Vandeweyer, Returns to different forms of job related training: Factoring in informal learning, OECD Social, Employment and Migration Working Papers, no. 231, OECD, 2019. https://doi. org/10.1787/b21807e9-en.
Goldin, C., “Understanding the Economic Impact of COVID-19 on Women”, Brookings Papers on Economic Activity (Spring), pp. 65-110, 2022, https://scholar.harvard.edu/sites/ scholar.harvard.edu/files/goldin/files/bpeasp22_goldin_paper.pdf.
International Labour Organization (ILO), Assessing the current state of the global labour market: Implications for achieving the Global Goals, ILOSTAT.ilo.org, 2023a, https://ilostat.ilo. org/assessing-the-current-state-of-theglobal-labour-market-implications-forachieving-the-global-goals/.
, Financing life-long learning for the future of work, 2018, https://www.ilo.org/wcmsp5/ groups/public/---dgreports/---inst/ documents/publication/wcms_646046.pdf.
, ILO modelled estimates database, ILOSTAT, 2022 (accessed 2 June 2023).
, Spotlight on Work Statistics n°12, March 2023b (White paper), 2023b, https:// www.ilo.org/wcmsp5/groups/public/---
dgreports/-- stat/documents/publication/ wcms_870519.pdf.
, World Economic and Social Outlook, 2023c.
International Monetary Fund (IMF), IMF Strategy Toward Mainstreaming Gender, 2022a, https://www.imf.org/en/Publications/PolicyPapers/Issues/2022/07/28/IMF-StrategyToward-Mainstreaming-Gender-521344.
, World Economic Outlook, October 2022, 2022b, https://www.imf.org/en/Publications/ WEO/Issues/2022/10/11/world-economicoutlook-october-2022.
, World Economic Outlook, April 2023, 2023, https://www.imf.org/en/Publications/ WEO/Issues/2023/04/11/world-economicoutlook-april-2023.
Kose, M. Ayhan and Franziska Ohnsorge, Falling Long-Term Growth Prospects: Trends, Expectations, and Policies, World Bank, 2023, http://hdl.handle.net/10986/39497 License: CC BY 3.0 IGO.
Lara, Silvia, M. Baird, and R. Hood, Progress and barriers in global gender leadership, LinkedIn Economic Graph White Paper. https:// economicgraph.linkedin.com/content/dam/ me/economicgraph/en-us/PDF/globalgender-representation.pdf, 2023.
Plan International, Bridging the Digital Divide, 2023, https://plan-international.org/qualityeducation/bridging-the-digital-divide/ (accessed on 28 May 2023).
UN Women, Women’s representation in local government: A global analysis, 2022a.
, Global data on women’s political participation, 2022b (accessed 2 June 2023).
World Economic Forum, Global Gender Gap Report 2022, 2022.
, Global Parity Alliance: Diversity, Equity and Inclusion Lighthouses 2023, 2023a, https:// www.weforum.org/reports/global-parityalliance-diversity-equity-and-inclusionlighthouses-2023.
, Future of Jobs Report 2023, 2023b, https:// www.weforum.org/reports/the-future-ofjobs-report-2023/.
Global Gender Gap Report 2023 60
TABLE A.1
Appendix A
Regional Classifications
Regional classifications of the 146 countries included in the 2023 Global Gender Gap Index
The following regional classifications are used for creating the regional performance tables and figures in Chapter 1. Europe
Eurasia and Central Asia
Armenia
Azerbaijan
Belarus
Georgia
Kazakhstan
Kyrgyz Republic
Moldova, Republic of Tajikistan
Türkiye
Ukraine
Australia
Brunei Darussalam
Cambodia
China
Fiji
Indonesia
Japan
Korea, Republic of Lao PDR
Malaysia
Mongolia
Myanmar
New Zealand
Philippines
Singapore
Thailand
Timor-Leste
Vanuatu
Viet Nam
East Asia and the Pacific
Malta
Montenegro
Netherlands
North Macedonia
Norway
Poland
Portugal
Romania
Serbia
Slovakia
Slovenia
Spain
Sweden
Switzerland
United Kingdom
Latin America and the Caribbean
Argentina
Barbados
Belize
Bolivia (Plurinational State of)
Brazil
Chile
Colombia
Costa Rica
Dominican Republic
Ecuador
El Salvador
Guatemala
Honduras
Jamaica
Mexico
Nicaragua
Europe
Albania
Austria
Belgium
Bosnia and Herzegovina
Bulgaria
Croatia*
Cyprus
Czechia
Denmark
Estonia
Finland
France
Germany
Greece
Hungary
Iceland
Ireland
Italy
Latvia
Lithuania
Luxembourg
* New to index in 2023
North America
Canada
United States of America
Afghanistan
Bangladesh
Bhutan
India
Iran (Islamic Republic of)
Maldives
Nepal
Pakistan
Sri Lanka
Angola
Benin
Botswana
Burkina Faso
Burundi
Cape Verde
Cameroon
Chad
Comoros
Southern Asia
Panama
Paraguay
Peru
Suriname
Uruguay
Middle East and North Africa
Algeria
Bahrain
Sub-Saharan Africa
Congo, Democratic Republic of the
Côte d'Ivoire
Eswatini
Ethiopia
Gambia (Republic of the)
Ghana
Guinea
Kenya
Lesotho
Liberia
Madagascar
Malawi
Mali
Mauritius
Mozambique
Namibia
Niger
Nigeria
Rwanda
Senegal
Sierra Leone
South Africa
Tanzania, United Republic of
Togo
Uganda
Zambia
Qatar
Saudi Arabia
Tunisia
United
Zimbabwe
Global Gender Gap Report 2023 June 2023
Egypt Israel Jordan
Kuwait Lebanon Morocco Oman
Arab Emirates
Global Gender Gap Report 2023 61
Data and methodology
Section A: Computation and composition of the Global Gender Gap Index
The methodology of the index has remained stable since its original conception in 2006, providing a basis for robust cross-country and time-series analysis. This year’s edition introduces a minor but required update to one indicator under the Economic Participation and Opportunity subindex and sees an updated definition by the collecting institution for one indicator under the Political Empowerment subindex. The changes are detailed in Sections c and d.
Three underlying concepts
There are three basic concepts underlying the Global Gender Gap Index, forming the basis of how indicators were chosen, how the data is treated and how the scale can be used. First, the index focuses on measuring gaps rather than levels. Second, it captures gaps in outcome variables rather than gaps in input variables. Third, it ranks countries according to gender equality rather than women’s empowerment.
Gaps vs. levels
The index is designed to measure gender-based gaps in access to resources and opportunities in countries, rather than the actual levels of the available resources and opportunities in those countries. We do this to disassociate the Global Gender Gap Index from countries’ levels of development. In other words, the index is constructed to rank countries on their gender gaps not on their development level. For example, advanced economies, generally speaking, are able to offer more education and health opportunities to all members of society, although this is quite independent of the gender-related gaps that may exist within those higher levels of health or education. The Global Gender Gap Index rewards countries for smaller gaps in access to these resources, regardless of the overall level
of resources. Thus, in the case of education, for example, the index penalizes or rewards countries based on the size of the gap between male and female enrolment rates, but not for the overall levels of education in the country.
Outcomes versus inputs
The second basic concept underlying the Global Gender Gap Index is that it evaluates countries based on outcomes rather than inputs or means. Our aim is to provide a snapshot of where men and women stand with regard to some fundamental outcome indicators related to basic rights such as health, education, economic participation and political empowerment. Indicators related to country specific policies, rights, culture or customs – factors that we consider “input” or “means” indicators –are not included in the index but are discussed further in the analytic sections of this chapter, as well as featured in the report’s Economy Profiles. For example, the index includes an indicator comparing the gap between men and women in high-skilled jobs such as legislators, senior officials and managers (an outcome indicator) but does not include data on the length of maternity leave (a policy indicator). This approach has contributed significantly to the index’s distinctiveness over the years and, we believe, continues to provide the most objective basis for discussing underlying contextual factors.1
Gender equality vs. women’s empowerment
The third distinguishing feature of the Global Gender Gap Index is that it ranks countries according to their proximity to gender equality rather than to women’s empowerment. Our aim is to focus on whether the gap between women and men in the chosen indicators has declined, rather than whether women are winning the so-called “battle of the sexes”. Hence, the index rewards countries that reach the point where outcomes for women equal those for men, but it neither rewards nor penalizes cases in which women are outperforming men in particular indicators in some countries. Thus, a country that has higher enrolment for girls rather than boys in secondary school will score equal to a country where boys’ and girls’ enrolment is the same.
Appendix
Global Gender Gap Report 2023 June 2023
B
Global Gender Gap Report 2023 62
Subindex Indicator
Economic Participation and Opportunity
Economic Participation and Opportunity
Economic Participation and Opportunity
Economic Participation and Opportunity
Economic Participation and Opportunity
Labour-force participation rate
Wage equality for similar work
Estimated earned income
Legislators, senior officials and managers
Professional and technical workers
Educational Attainment Literacy rate
Educational Attainment Enrolment in primary education
Educational Attainment Enrolment in secondary education
Educational Attainment Enrolment in tertiary education
Health and Survival Sex ratio at birth
Health and Survival Healthy life expectancy
Political Empowerment Women in parliament
Political Empowerment Women in ministerial positions
Source
International Labour Organization (ILO), ILOSTAT database, Labour Force Surveys.
World Economic Forum, Executive Opinion Survey (EOS).
International Labour Organization (ILO), ILOSTAT database; World Population Prospects 2022; World Bank, World Development Indicators database.
International Labour Organization (ILO), ILOSTAT database.
International Labour Organization (ILO), ILOSTAT database.
UNESCO, UIS.Stat Education statistics data portal. When not available, data is sourced from United Nations Development Programme, Human Development Reports, most recent year available between 2013 and 2023.
UNESCO, UIS.Stat Education statistics data portal.
UNESCO, UIS.Stat Education statistics data portal.
UNESCO, UIS.Stat Education statistics data portal.
World Bank, World Development Indicators database.
World Health Organization (WHO), Global Health Observatory database.
Inter-parliamentary Union.
Inter-parliamentary Union-UN Women.
Political Empowerment Years with female/male head of state (last 50) World Economic Forum’s calculations.
Source
World Economic Forum, Global Gender Gap Index 2023.
Structure of the Global Gender Gap Index TABLE B.1 Global Gender Gap Report 2023 63
The four subindexes
The Global Gender Gap Index examines the gap between men and women across four fundamental categories (subindexes): Economic Participation and Opportunity, Educational Attainment, Health and Survival, and Political Empowerment. Table B1 displays all four of these subindexes and the 14 indicators that compose them, along with the sources of data used for each.
Economic Participation and Opportunity
This subindex contains three concepts: the participation gap, the remuneration gap and the advancement gap. The participation gap is captured using the difference between women and men in labour-force participation rates. The remuneration gap is captured through a hard data indicator (ratio of estimated female-to-male earned income)2 and a qualitative indicator gathered through the World Economic Forum’s annual Executive Opinion Survey (wage equality for similar work).3 Finally, the gap between the advancement of women and men is captured through two hard data statistics (the ratio of women to men among legislators, senior officials and managers, and the ratio of women to men among technical and professional workers).
Educational Attainment
This subindex captures the gap between women’s and men’s current access to education through the enrolment ratios of women to men in primary-, secondary- and tertiary-level education. A longerterm view of the country’s ability to educate women and men in equal numbers is captured through the ratio of women’s literacy rate to men’s literacy rate.
Health and Survival
This subindex provides an overview of the differences between women’s and men’s health using two indicators. The first is the sex ratio at birth, which aims specifically to capture the phenomenon of “missing women”, prevalent in countries with a strong son preference.4 Second, we use the gap between women’s and men’s healthy life expectancy. This measure provides an estimate of the number of years that women and men can expect to live in good health by accounting for the years lost to violence, disease, malnutrition and other factors.
Political Empowerment
This subindex measures the gap between men and women at the highest level of political decision-making through the ratio of women to men in ministerial positions and the ratio of women to men in parliamentary positions. In addition, the index includes the ratio of women to men in terms of years in executive office (prime minister or president) for the last 50 years. Differences between the participation of women and men at local levels of government are currently not captured. Should such data become available at a globally comparative level in future years, it will be considered for inclusion in the index.
Section B: Construction of the index
The Global Gender Gap Index is constructed using a four-step process, outlined below. Some of the indicators listed in Table B2 require specific standardization or modification to be used in the index. For further information on the indicatorspecific calculations, please refer to Section B of this appendix.
Step 1. Convert to ratios:
Initially, all data is converted to female-to-male ratios. For example, a country with 20% of women in ministerial positions is assigned a ratio of 20 women to 80 men, thus a value of 0.25. This is to ensure that the index is capturing gaps between women and men’s attainment levels, rather than the levels themselves.
Step 2. Data truncation at parity benchmark:
The ratios obtained above are truncated at the “equality benchmark”. For all indicators, except the two health indicators, this equality benchmark is considered to be 1, meaning equal numbers of women and men. In the case of sex ratio at birth, the equality benchmark is set at 0.944,5 and in the case of healthy life expectancy the equality benchmark is set at 1.06 to capture that fact that women tend to naturally live longer than men. As such, parity is considered as achieved if, on average, women live five years longer than men.6
Truncating the data at the equality benchmarks for each assigns the same score to a country that has reached parity between women and men and one where women have surpassed men. The type of rating scale chosen determines whether the index is rewarding women’s empowerment or gender equality.7 To capture gender equality, two possible scales were considered. One was a negative-positive scale capturing the size and direction of the gender gap. This scale penalizes either men’s advantage over women or women’s advantage over men and gives the highest points to absolute equality. The second choice was a one-sided scale that measures how close women are to reaching parity with men but does not reward or penalize countries for having a gender gap in the other direction. We find the one-sided scale more appropriate for our purposes, as it does not reward countries for having exceeded the parity benchmark. However, disparities in either direction are recorded in the Economy Profiles.
Step 3. Calculation of subindex scores:
Each of the four subindexes is computed as the weighted average of the underlying individual indicators. Averaging the different indicators would implicitly give more weight to the measure that exhibits the largest variability or standard deviation. We therefore first normalize the indicators by equalizing their standard deviations. For example, within the Educational Attainment subindex, standard deviations for each of the four indicators
Global Gender Gap Report 2023 64
Economic Participation and Opportunity
Note
Population-weighted averages, including the 102 economies featured throughout all the 20062023 editions of the Global Gender Gap Index.
are calculated. Then we determine what a 1 percentage-point change would translate to in terms of standard deviations by dividing 0.01 by the standard deviation for each indicator. These four values are then used as weights to calculate the weighted average of the four indicators. This way of weighting indicators allows us to make sure that each indicator has the same relative impact on the subindex. For example, an indicator with a small variability or standard deviation gets a larger weight within the subindex than an indicator with a larger variability. Therefore, a country with a large gender gap in the first indicator will be more heavily penalized. Another example is the case of the sex ratio at birth indicator (within the Health and Survival subindex): where most countries have a very high sex ratio and the spread of the data is small, the
larger weight will penalize more heavily those countries that deviate from this value. Table B2 displays the values of the weights used.8
Step 4. Calculation of final scores:
For all subindexes, the highest possible score is 1 (gender parity) and the lowest possible score is 0 (imparity).9 A simple average of each subindex score is used to calculate the overall Global Gender Gap Index score – a final value that, like subindex scores, ranges between 1 (parity) and 0 (imparity). The parity and imparity benchmarks have remained fixed through report editions to allow for the comparison and relative ranking of countries10 in a given year, and across time. This allows readers to track individual country progress. Furthermore, the option of roughly interpreting the final index scores
Calculation of weights within each subindex TABLE B.2 Ratio Standard deviation Standard deviation per 1% point change Weight Labour-force participation rate, % (females-to-males ratio) 0.160 0.063 0.199 Wage equality for similar work (survey), 1-7 scale (females-to-males ratio) 0.103 0.097 0.310 Estimated earned income, PPP, int.$ (females-to-males ratio) 0.144 0.069 0.221 Legislators, senior officials and managers, % (females-to-males ratio) 0.214 0.047 0.149 Professional and technical workers, % (females-to-males ratio) 0.262 0.038 0.121
Ratio Standard deviation Standard deviation per 1% point change Weight Literacy rate, % (females-to-males ratio) 0.145 0.069 0.191 Enrolment in primary education, % (females-to-males ratio) 0.060 0.167 0.459 Enrolment in secondary education, % (females-to-males ratio) 0.120 0.083 0.230 Enrolment in tertiary education, % (females-to-males ratio) 0.228 0.044 0.121 Educational Attainment Ratio Standard deviation Standard deviation per 1% point change Weight Women in parliament, % (females-to-males ratio) 0.166 0.06 0.31 Women in ministerial positions, % (females-to-males ratio) 0.208 0.048 0.247 Years with female head of state (last 50), Share of tenure years (females-to-males ratio) 0.116 0.086 0.443 Political
Ratio Standard deviation Standard deviation per 1% point change Weight Sex ratio at birth, % (females-to-males ratio) 0.010 0.998 0.693 Healthy life expectancy, years (females-to-males ratio) 0.023 0.441 0.307 Health and Survival
Empowerment
Global Gender Gap Report 2023 65
as a percentage value that reveals how a country has reduced its gender gap should help make the index more intuitively appealing to readers.11
Section C: Update of the labour-force participation rate indicator
Past editions (2006-2022) of the Global Gender Gap Report have used modelled estimates for the ‘Labour-force participation rate’ (LFPR) indicator as calculated by the International Labour Organization (ILO). These estimates are based on both nationally reported observations and imputed data for countries with missing data.
The ILO has recently issued guidance against the use of modelled estimates in country benchmarking efforts.12
Following consultations with the ILO, the Global Gender Gap Index has responded by adhering to ILO guidance. Consequently, this year’s edition no longer employs modelled estimates for the labourforce participation rate, and instead uses nationally reported labour-force data that complies with ILO standards and has been validated and reported in ILOSTAT
The update has been carried out with a view to maintaining coherence and continuity of the Global Gender Gap Index methodology, ensuring that conceptual proximity, empirical proximity and indicator quality and availability are respected.
Section D: Update in the share of women in ministerial positions indicator
The representation of women in ministerial positions has been included in the Political Empowerment pillar of the Global Gender Gap Index since its inception in 2006. This indicator is collected on a biennial basis, with the most recent collection occurring in March 2023, at which time the indicator definition was also updated.
Prior to 2023, the Inter-Parliamentary Union (IPU) collected the data for this indicator. Beginning in 2023, the data is being collected by UN Women.
The update to the definition has been implemented during the 2023 data collection period as part of a deliberate effort to enhance the precision of assessing women’s representation in executive positions. The measurement of women in ministerial
positions now focuses solely on Cabinet members who head ministries. Individuals who are not members of the Cabinet and Cabinet members who do not head ministries are excluded from the measurement, starting with this edition.
This methodological change allows for a more precise examination of women’s representation in executive positions by concentrating on top political executive roles. These roles possess two key characteristics: (a) the highest individual policy-making power as leaders of specific policy fields, and (b) the highest joint executive power as members of the collective decision-making body, i.e. the Cabinet.
By refining the measurement criteria, the updated methodology ensures greater consistency and comparability of data across countries.
Section E: Indicator definitions and sources
Indicators composing the Global Gender Gap Index
Labour-force participation rate, %
The labour-force participation rate is the labour force as a percentage of the working-age population. The labour force is the sum of all persons of working age who are employed and those who are actively looking for employment.
Period: 2010 or latest year available.
Source: International Labour Organization (ILO), ILOSTAT
Wage equality for similar work, 1–7 (best) Response to the World Economic Forum Executive Opinion Survey question, “In your country, for similar work, to what extent are wages for women equal to those of men?” (1 = not at all, significantly below those of men; 7 = fully, equal to those of men).
For the past 44 years, the World Economic Forum’s Executive Opinion Survey (referred to as the Survey) has played a vital role in flagship publications of the World Economic Forum, as well as at other organizations and research institutions. It stands as the most comprehensive and enduring survey of its kind, with responses from over 12,000 business leaders across 121 countries in 2022. The Survey delves into assessing crucial factors that drive economic growth and competitiveness, including aspects of diversity, equity and inclusion. The significance of this survey lies in its ability to offer valuable insights when statistical data is unavailable or is extremely difficult to measure on a global scale. It captures the perspectives of business leaders who are best positioned to assess their operating environment.
Global Gender Gap Report 2023 66
Period: Moving average 2021-2022 or most recent year available (no earlier than 2019-2020).
Source: World Economic Forum, Executive Opinion Survey (EOS).
Estimated earned income, int’l $1,000s
The estimated female earned income is a proxy for how much command women have over a country’s economic resources. For each country, it is computed using female and male shares of the economically active population, the ratio of the female to male wages (both indicators are sourced from the ILO), gross domestic product valued at constant 2017 international dollars (IMF), and female and male shares of population (World Bank). The methodology used to compute this indicator is adapted from the methodology developed by the United Nations Development Programme’s Human Development Report Office for computing the Gender Development Index (UNDP, 2021-2022, pages 6-7).13 Female and male wage measures used in the computation of the gender wage ratio correspond to the mean nominal monthly earnings of female and male employees, respectively. In the absence of wage data, a gender wage ratio of 0.75 is used in the computation of the wage bill. ILO’s measure of earning corresponds to the mean of monthly earnings of all employees in nominal terms. The earnings of employees relate to the gross remuneration in cash and in kind paid to employees, as a rule at regular intervals, for time worked or work done together with remuneration for time not worked, such as annual vacation, other type of paid leave or holidays. Earnings exclude employers’ contributions with respect to employees’ social security and pension schemes and also the benefits received by employees under these schemes. Earnings also exclude severance and termination pay. Statistics of earnings relate to the gross remuneration of employees, i.e. the total before any deductions are made by the employer. The measurement period of this indicator corresponds to that of the wage data. In the Economy Profiles, values reported are the estimated average annual earned income per capita in constant 2017 international dollars for women and men, respectively, and the ratio of the two values.
Period: 2021 or most recent year available.
Source: International Labour Organization (ILO), ILOSTAT; International Monetary Fund (IMF), World Economic Outlook; World Bank, World Development Indicators
International Standard Classification of Occupations (ISCO-08).14
Period: 2022 or most recent year available.
Source: International Labour Organization (ILO), ILOSTAT
Professional and technical workers, %
Ratio of women to men employed in professional and technical roles, defined by the ILO as those who increase the existing stock of knowledge, apply scientific or artistic concepts and theories or those who perform technical and related tasks that require advanced knowledge and skill. It corresponds to the sum of Major Groups 2 and 3 of the International Standard Classification of Occupations (ISCO-08).
Period: 2022 or most recent year available.
Source: International Labour Organization (ILO), ILOSTAT
Literacy rate, %
Percentage of the adult population (women and men over 15 years of age) with the ability to both read and write and make simple arithmetic calculations. For advanced economies for which data was unavailable in the last 10 years, the authors assumed based on older data that the gender gap on literacy rate is closed.
Period: 2021 or most recent year available.
Source: UNESCO, UIS.Stat education statistics data portal; when not available, data is sourced from the UNDP Human Development Reports, most recent data available.
Enrolment in primary education, %
Percentage of girls and boys in the official primary school age range (Net Enrolment rate in Primary education) who are enrolled in primary education (International Standard Classification of Education [ISCED] 1).15
Period: 2021 or most recent year available.
Source: UNESCO, UIS.Stat education statistics data portal.
Enrolment in secondary education, %
Legislators, senior officials and managers, % Ratio of women to men employed in senior roles, defined by the ILO as those who plan, direct, coordinate and evaluate the overall activities of enterprises, governments and other organizations, or of organizational units within them, and formulate and review their policies, laws, rules and regulations. It corresponds to Major Group 1 of the
Based on Gross Enrolment Ratio (GER). Measures the percentage of girls and boys enrolled in secondary education, regardless of age, expressed as a percentage of the official school-age population corresponding to secondary education. A high GER generally indicates a high degree of participation, whether the pupils belong to the official age group or not. A GER value approaching or exceeding 100% indicates that a country is, in
Global Gender Gap Report 2023 67
principle, able to accommodate all of its school-age population, but it does not indicate the proportion already enrolled. The achievement of a GER of 100% is therefore a necessary but not sufficient condition for enrolling all eligible children in school.
Period: 2021 or most recent year available.
Source: UNESCO, UIS.Stat education statistics data portal.
Enrolment in tertiary education, %
Total enrolment in tertiary education (gross rate), regardless of age, expressed as a percentage of the most recent five-year age cohort that has left secondary school. Tertiary education consists of ISCED levels 5 to 8, and gross enrolment data should be examined within the context of a country structure regarding military service as well as propensity of students to seek education abroad.
Period: 2021 or most recent year available.
Source: UNESCO, UIS.Stat education statistics data portal.
Sex ratio at birth, %
Sex ratio at birth refers to male births per female births. The data represents five-year averages.
Period: 2020 or most recent year available.
Source: World Bank, World Development Indicators database.
Healthy life expectancy, years
Average number of years that a person of each gender can expect to live in full health, calculated by taking into account years lived in less than full health due to disease and/or injury.
Period: 2019 or most recent year available.
Source: World Health Organization (WHO), Global Health Observatory data repository.
portfolio may occur. IPU-UN Women does not provide information for two of the 146 countries (Myanmar and Afghanistan) included in the sample. We consider the share of women holding cabinet positions in these two contexts to be zero.
Period: Data as of 1 January 2023.
Source: Inter-parliamentary Union-UN Women.
Years with female/male head of state (last 50)
The number of years in the past fifty-year period for which a woman has held a post equivalent to an elected head of state or head of government in the country. It takes into account prime ministers and/ or presidents. Royalties are not considered.
Period: 1 March 1973 – 1 March 2023.
Source: World Economic Forum’s calculations.
Contextual Indicators
General indicators
GDP, current US$ billions
Gross domestic product (GDP) at purchaser’s prices is the sum of gross value added by all resident producers in the economy plus any product taxes and minus any subsidies not included in the value of the products.
Period: 2021 or most recent year.
Source: World Bank.
GDP per capita, PPP (constant 2017 international $)
Per capita value for gross domestic product (GDP) expressed in current international dollars converted by purchasing power parity (PPP) conversion factor.
Period: 2021 or most recent year.
Source: World Bank.
Women in parliament, %
Percentage of women holding parliamentary seats as a share of total parliamentary seats. In instances where a parliamentary system is bicameral, the figure used is the one for the lower house.
Period: Data as of 1 February 2023.
Source: Inter-parliamentary Union (IPU).
Women in ministerial positions, %
Percentage of women holding ministerial portfolios as a share of total ministry positions in each government. Some overlap between ministers and heads of government that also hold a ministerial
Total population, million people
Estimate of the number of people of all ages living in a country, regardless of residency status or citizenship (except for refugees not permanently settled in the country of asylum who are generally considered part of the population of their country of origin).
Period: 2022.
Source: United Nations, Department of Economic and Social Affairs, Population Division, World Population Prospects
Global Gender Gap Report 2023 68
Population sex ratio (female/male), %
Ratio of the number of females (thousands) to males (thousands) in the population of a society. World Bank staff estimates based on age/sex distributions of United Nations Population Division’s World Population Prospects
Period: 2021.
Source: World Bank.
Population growth rate, %
Year-on-year percentage change in total population, calculated based on current and previous year.
Population is based on the de facto definition of population, which counts all residents regardless of legal status or citizenship.
Period: 2021.
Source: World Bank.
Work participation & leadership
Gender wage gap
The gender wage gap is defined as the difference between male and female median wages divided by male median wages. Wages are computed for full-time equivalent dependent employees and are expressed in US$ using current exchange rates and US$ Purchasing Power Parity rates (PPPs) for private consumption expenditures as conversion factors. For more details about the computation of wage estimates, refer to https://data.oecd.org/ earnwage/average-wages.htm.
Period: 2021 or most recent year.
Source: OECD, Employment database.
Share of women’s membership on boards, %
Share of board members of listed companies that are women. “Board members” refers to all members of the highest decision-making body in the given company, such as the board of directors for a company in a unitary system or the supervisory board in the case of a company in a two-tier system.
Period: 2021.
Source: OECD, Employment database.
Firms with female majority ownership, %
Percentage of firms answering, “More than 50%” to the question, “What percentage of the firm is owned by females?”. For African countries surveyed in 2009–2011, this indicator is the percentage of companies answering, “Majority are women” or “All women” to the question, “Are the owners of the firm?”. For more details refer to: https://www.enterprisesurveys.org/content/
dam/enterprisesurveys/documents/methodology/ Indicator-Descriptions.pdf.
Period: 2022 or most recent year.
Source: World Bank Enterprise Survey.
Firms with female top managers, %
Percentage of firms in the private sector who have females as top managers. “Top manager” refers to the highest-ranking manager or CEO of the establishment. This person may be the owner if he/ she works as the manager of the firm. The results are based on surveys of more than 100,000 private firms.
Period: 2021 or most recent year.
Source: World Bank Enterprise Survey.
Share of workers in informal sector, %
Ratio of employment of women/men in the informal sector to the total employment (irrespective of the informality/formality) of women/ men. Employment in the informal sector refers all persons who, during a given reference period, were employed in at least one informal sector enterprise, irrespective of their status in employment and whether it was their main or a secondary job. An informal sector enterprise is (1) an unincorporated enterprise, (2) a market enterprise (i.e. it sells at least some of the goods or services it produces), and (3) meets at least one of the following criteria: (i) the enterprise is not registered, (ii) the employees of the enterprise are not registered, or (iii) the number of persons engaged on a continuous basis is below a threshold determined by the country.
Period: 2022 or most recent year.
Source: International Labour Organization (ILO), ILOSTAT
Advancement of women to leadership roles, 1-7 (best)
Response to the survey question, “In your country, to what extent do companies provide women with the same opportunities as men to rise to positions of leadership?” 1=not at all; 7=to a great extent.
Period: 2022 or most recent year.
Source: World Economic Forum, Executive Opinion Survey (EOS).
Labour force, 1 million people (%)
Total number of people (M/F) participating in the labour force. The ratio is the percentage of women participating in the labour force with respect to the total labour force.
Period: 2022 or most recent year.
Global Gender Gap Report 2023 69
Source: International Labour Organization (ILO), ILOSTAT
Unemployed adults, % of labour force
Share of the labour force aged 15–64 (M/F) that is without work but available for and seeking employment. Definitions of labour force and unemployment differ by country.
Period: 2022 or most recent year.
Source: International Labour Organization (ILO), ILOSTAT
Share of workers employed part-time, %
The incidence of part-time employment, also known as the part-time employment rate, represents the percentage of employment that is part time. Part-time employment in this table is based on a common definition of less than 35 actual weekly hours worked. It is derived from both the indicator on employment by sex and actual weekly hours worked.
Period: 2022 or most recent year.
Source: International Labour Organization (ILO), ILOSTAT
Proportion of time spent on unpaid domestic and care work, by sex, age and location, %
Monitors the average time men and women spend on unpaid domestic and care work per day. Data is expressed as a proportion of time in a day. Domestic and care work includes food preparation, dishwashing, cleaning and upkeep of a dwelling, laundry, ironing, gardening, caring for pets, shopping, installation, servicing and repair of personal and household goods, childcare, and care of the sick, elderly or disabled household members, among others.
Period: 2020 or most recent year.
Source: United Nations, Department of Economic and Social Affairs.
rights to open a bank account and obtain credit at a formal financial institution to women and men, without legal exceptions regarding some groups of women. However, some customary, religious or traditional practices or laws discriminate against women’s legal rights; Uneven rights: Women and men have the same rights to open a bank account and obtain credit at a formal financial institution to women and men. However, this does not apply to all groups of women; Restricted rights: Women and men have the same rights to open a bank account at a formal financial institution. However, women do not have the same rights as men to obtain credit; Unequal rights: Women do not have the same rights as men to open a bank account at a formal financial institution.
Period: 2019.
Source: OECD, Gender, Institutions and Development Database (GID-DB).
Inheritance for widows & daughters
Index measuring whether women and men have the same legal rights to inheritance of land and non-land assets. For each case, the OECD numerical scores have been translated as: Equal rights: Widows and daughters enjoy the same rights as widowers and sons to inherit land and non-land assets. This applies to all groups of women. Customary, religious and traditional laws or practices do not discriminate against women’s inheritance rights; Near-equal rights: Widows and daughters enjoy the same rights as widowers and sons to inherit land and non-land assets. This applies to all groups of women. However, there are some customary, religious or traditional laws that discriminate against women’s inheritance rights; Uneven rights: Widows and daughters enjoy the same rights as widowers and sons to inherit land and non-land assets. However, this does not apply to all groups of women; Restricted rights: Widows or daughters do not enjoy the same rights as widowers and sons to inherit land and/or non-land assets; Unequal rights: Widows and daughters do not enjoy the same rights as widowers and sons to inherit land and/or non-land assets.
Period: 2019.
Source: OECD, Gender, Institutions and Development Database (GID-DB).
Access to finance
Access to financial services
Measures whether women and men have the same legal rights to open a bank account and obtain credit at a formal financial institution. For each case, the OECD numerical scores have been translated as: Equal rights: Women and men have the same rights to open a bank account and obtain credit at a formal financial institution, without legal exceptions regarding some groups of women. Customary, religious and traditional laws or practices do not discriminate against women’s above legal rights; Near-equal rights: Women and men have the same
Access to land assets
Index measuring whether women and men have the same legal rights and secure access to land assets. For each case, the OECD numerical scores have been translated as: Equal rights: Women and men have the same legal rights and secure access to land assets, without legal exceptions regarding some groups of women. Customary, religious and traditional laws or practices do not discriminate against women’s legal rights; Nearequal rights: Women and men have the same legal
Global Gender Gap Report 2023 70
rights and secure access to land assets, without legal exceptions regarding some groups of women. However, some customary, religious or traditional practices or laws discriminate against women’s legal right; Uneven rights: Women and men have the same legal rights and secure access to land assets. However, this does not apply to all groups of women; Restricted rights: Women and men have the same legal rights to own land assets, but not to use, make decisions and/or use land assets as collateral; Unequal rights: Women do not have the same legal rights as men to own land assets.
Period: 2019.
Source: OECD, Gender, Institutions and Development Database (GID-DB).
Access to non-land assets
Index measuring whether women and men have the same legal rights and secure access to non-land assets. For each case, the OECD numerical scores have been translated as: Equal rights: Women and men have the same legal rights and secure access to non-land assets, without legal exceptions regarding some groups of women. Customary, religious and traditional laws or practices do not discriminate against women’s legal rights; Nearequal rights: Women and men have the same legal rights and secure access to non-land assets, without legal exceptions regarding some groups of women. However, some customary, religious or traditional practices or laws discriminate against women’s legal right; Uneven rights: Women and men have the same legal rights and secure access to non-land assets. However, this does not apply to all groups of women; Restricted rights: Women and men have the same legal rights to own non-land assets, but not to use, make decisions and/or use land assets as collateral; Unequal rights: Women do not have the same legal rights as men to own non-land assets.
Period: 2019.
Source: OECD, Gender, Institutions and Development Database (GID-DB).
Civil and political freedom
Year women received right to vote
Refers to the year in which the right to vote or stand for election on a universal and equal basis was recognized. Where two years are shown, the first refers to the first partial recognition of the right to vote or stand for election.
Period: 2023.
Source: Inter-parliamentary Union (IPU) Parline.
over the past fifty-year period as head of state or head of government in a country.
Period: Data as of 1 March 2023.
Source: World Economic Forum’s calculations.
Access to justice
Measures whether women and men have the same rights to provide testimony in court, hold public or political office in the judiciary and sue. For each case, the OECD numerical scores have been translated as: Equal rights: A woman’s testimony holds the same evidentiary weight as a man’s in all types of court cases and women have the same rights as men to sue and to hold public or political office in the judiciary. Customary, religious and traditional laws or practices do not discriminate against women’s legal right to sue, to provide testimony in court or to be a judge, advocate or other court officer; Near-equal rights: A woman’s testimony holds the same evidentiary weight as a man’s in all types of court cases and women have the same rights as men to sue and to hold public or political office in the judiciary. Women’s testimony carries the same evidentiary weight in customary/religious courts/tribunals. However, some customary, traditional or religious practices or laws discriminate against women’s legal right to sue, to provide testimony in court or to be a judge, advocate or other court officer; Uneven rights: A woman’s testimony holds the same evidentiary weight as a man’s in all types of court cases and women have the same rights as men to sue. However, women do not have the same right as men to hold public or political office in the judiciary; Restricted rights: Women and men have the same rights to sue. However, a woman’s testimony does not hold the same evidentiary weight as a man’s in all types of court cases; Unequal rights: Women and men do not have the same rights to sue.
Period: 2019.
Source: OECD, Gender, Institutions and Development Database (GID-DB).
Freedom of movement
Number of female heads of state to date
The number of women who have ever taken office
Measures whether women and men have the same rights to apply for national identity cards (if applicable) and passports and travel outside the country. For each case, the OECD numerical scores have been translated as: Equal rights: Women and men have the same rights to apply for national identity cards (if applicable) and passports and to travel outside the country, without legal exceptions regarding some groups of women. Customary, religious and traditional laws or practices do not discriminate against these rights: Near-equal rights: Women and men have the same rights to apply for national identity cards (if applicable) and passports and to travel outside the country, without legal exceptions regarding some groups of women. However, some customary, traditional
Global Gender Gap Report 2023 71
or religious practices or laws discriminate against these rights; Uneven rights: Women and men have the same rights to apply for national identity cards (if applicable) and passports and to travel outside the country. However, this does not apply to all groups of women; Restricted rights: Women do not have the same rights as men to apply for national identity cards (if applicable) or passports or to travel outside the country; Unequal rights: Women do not have the same rights as men to apply for national identity cards (if applicable) or passports and to travel outside the country.
Period: 2019.
Source: OECD, Gender, Institutions and Development Database (GID-DB).
Election list quotas for women, national (yes/ no)
Reports if a country has in place electoral laws specifying quotas for female candidates in national elections to the lower parliamentary house.
Period: Data as of 1 March 2023.
Source: Institute for Democracy and Electoral Assistance (IDEA), Gender Quotas Database.
Party membership quotas, voluntary, (yes/no)
Reports if a country has in place voluntary quotas specifying the number of women for political party membership.
Period: Data as of 1 March 2023.
Source: IDEA, Gender Quotas Database
Seats held in upper house, % of total seats
Percentage of women holding seats in the higher house of representatives as a share of total seats. Applies only to bicameral parliamentary systems.
Period: 2023.
Source: Inter-parliamentary Union (IPU).
Family and care
Public spending on family benefits, % of GDP
Public spending on family benefits includes financial support that is exclusively for families and children. Spending recorded in other social policy areas such as health and housing may also assist families, but not exclusively, and is not included in the indicator.
Period: 2021 or latest year available.
Source: OECD, Family database.
Unmet family planning
Unmet need for family planning is defined as the percentage of women ages 15-49 who do not want to become pregnant but are not using contraception.
Period: 2021 or latest year available.
Source: USAID Demographic and Health Surveys Program
Early marriage, %
Percentage of girls aged 15–19 years who are or have ever been married, divorced, widowed or in an informal union.
Period: 2019.
Source: OECD, Gender, Institutions and Development Database (GID-DB).
Mean age of women at birth of first child
The mean age of mothers at first child’s birth is defined as the average completed year of age of women when their first child is born.
Period: 2020 or most recent year.
Source: United Nations, Department of Economic and Social Affairs, Population Division, World Population Prospects 2022
Right to divorce
Index measuring whether women and men have the same legal rights to initiate divorce and have the same requirements for divorce or annulment. For each case, the OECD numerical scores have been translated as: Equal rights = Women have the same rights to initiate divorce and the same requirements to finalize divorce or annulment as men, without negative repercussions from their parental authority. This applies to all groups of women. Customary, religious and traditional laws or practices do not discriminate against women’s rights regarding divorce or parental authority after divorce; Near equal rights = Women have the same rights to initiate divorce and the same requirements to finalize divorce or annulment as men, without negative repercussions from their parental authority. This applies to all groups of women. However, there are some customary, religious or traditional laws or practices that discriminate against women’s rights regarding divorce and/or parental authority after divorce; Uneven rights = Women have the same rights to initiate divorce and the same requirements to finalize divorce or annulment as men, without negative repercussions from their parental authority. However, this does not apply to all groups of women; Restricted rights = Women do not have the same rights over divorce as men: either their rights to initiate divorce and/ or the requirements to finalize divorce or annulment are unequal, or their freedom from parental authority after divorce is restricted;
Global Gender Gap Report 2023 72
Unequal rights = Women do not have the same rights over divorce as men: their rights to initiate divorce and/or the requirements to finalize divorce or annulment are unequal, and their freedom from parental authority after divorce is restricted.
Period: 2019.
Source: OECD, Gender, Institutions and Development Database (GID-DB).
Length of paid parental leave, calendar days
Parental leave refers to leave available equally to parents – regardless of gender – for the purpose of childcare immediately following maternity and paternity leave OR instead of maternity and paternity leave. Where the paid leave period is available only by sex, it is indicated under “female” or “male”. Where the leave period can be shared amongst the parents as they choose, the length of the paid leave period is indicated under “Value”.
Period: 2022.
Source: World Bank, Women, Business and the Law Database
Education and skills
Agriculture, Forestry, Fisheries & Veterinary graduates, %
Percentage of male/female tertiary education graduates from Agriculture, Forestry, Fisheries & Veterinary programmes.
Period: 2019 or most recent year.
Source: UNESCO, Education database.
Arts & Humanities graduates, %
Percentage of male/female tertiary education graduates from Arts & Humanities programmes.
Period: 2019 or most recent year.
Source: UNESCO, Education database.
Business, Administration and Law graduates, %
Percentage of male/female tertiary education graduates from Business, Administration and Law programmes.
Period: 2019 or most recent year.
Source: UNESCO, Education database.
Source: UNESCO, Education database.
Engineering, Manufacturing & Construction graduates, %
Percentage of male/female tertiary education graduates from Engineering, Manufacturing & Construction programmes.
Period: 2019 or most recent year.
Source: UNESCO, Education database.
Health & Welfare graduates, %
Percentage of male/female tertiary education graduates from Health and Welfare programmes.
Period: 2019 or most recent year.
Source: UNESCO, Education database.
Information and Communication Technologies graduates, %
Percentage of male/female tertiary education graduates from Information and Communication Technologies programmes.
Period: 2019 or most recent year.
Source: UNESCO, Education database.
Natural Sciences, Mathematics and Statistics graduates, %
Percentage of male/female tertiary education graduates from Natural Sciences, Mathematics and Statistics programmes.
Period: 2019 or most recent year.
Source: UNESCO, Education database.
Social Science, Journalism and Information graduates, %
Percentage of male/female tertiary education graduates from Social Science & Journalism programmes.
Period: 2019 or most recent year.
Source: UNESCO, Education database.
STEM graduates, %
Percentage of male/female tertiary education graduates from STEM (Science, Technology, Engineering and Mathematics) programmes.
Education graduates, %
Percentage of male/female tertiary education graduates from Education programmes.
Period: 2019 or most recent year.
Period: 2019 or most recent year.
Source: UNESCO, Education indicators.
Global Gender Gap Report 2023 73
Vocational training, % attainment
Percentage of 15–24-year-old girls/ boys enrolled in vocational education to the total 15–24-year-old population.
Period: 2022 or most recent year.
Source: UNESCO, Education database.
PhD graduates, % attainment
Percentage of 25+ year-old women/men who have attained a doctoral degree or equivalent (ISCED 8) relative to the total population of over-25-year-olds.
Period: 2021 or most recent year.
Source: UNESCO, Education database.
Tertiary education graduates, %
Percentage of male/female tertiary education graduates.
Period: 2022 or most recent year.
Source: UNESCO, Education database.
Health
Prevalence of gender violence in lifetime, % women
Percentage of ever-partnered women who ever suffered intimate partner physical and/or sexual violence.
Period: 2019.
Source: OECD, Gender, Institutions and Development Database (GID-DB).
Births attended by skilled personnel, % live births
Share of live births attended by skilled health personnel to total live births in a given year.
Period: 2021 or most recent year.
Source: UNICEF.
Maternal mortality ratio
Number of maternal deaths per 100,000 live births.
Period: 2017.
Source: UNICEF.
Total fertility rate, births per woman
Measures the average number of children a hypothetical cohort of women would have at the end of their reproductive period if they were subject during their whole lives to the fertility rates of a given period and if they were not subject to mortality.
Period: 2020 or most recent year.
Source: World Bank.
Reproductive autonomy
Index measuring whether the legal framework protects women’s reproductive health and rights. For each case, the following scores are assigned: 0 = The legal framework protects women’s reproductive health and rights in case of unwanted pregnancy, without any justifications; Near-equal rights = The legal framework protects women’s reproductive health and rights in case of unwanted pregnancy, but requires justifications; Uneven rights = The legal framework only protects women’s reproductive health and rights in case of unwanted pregnancy with some justifications; Restricted rights = The legal framework only protects women’s reproductive health and rights in case of unwanted pregnancy with strict justifications; Unequal rights = The legal framework does not protect women’s reproductive health and rights in case of unwanted pregnancy.
Period: 2019.
Source: OECD, Gender, Institutions and Development Database (GID-DB).
Global Gender Gap Report 2023 74
Endnotes
1. See Hausmann, 2016, for further detail.
2. Following a methodology originally developed by the United Nations Development Programme (UNDP), the Global Gender Gap Index estimates the average income earned by women, relative to income earned by men, in a calculation that takes into account a country’s GDP per capita (US$), the share of women and men in the labour force, and their mean nominal wages. To account for globally rising income levels, beginning with 2018’s edition, the report no longer caps the maximum income per capita value considered in the calculation. This follows UNDP’s own adjustment of the methodology and the fact that the $40,000 cap formerly used in previous editions of the Global Gender Gap Index had increasingly lost some of its ability to discern the level of gender-based income disparities among high-income nations such as the Nordics, the United States and the member states of the Gulf Cooperation Council. For a full overview of the 2016 methodology change, please refer to that report edition’s Appendix D.
3. For more information about the Executive Opinion Survey, see Appendix B.
4. The report utilizes the United Nations Population Division’s World Population Prospects as a source for the sex ratio at birth indicator. Previous editions of the report had utilized data from the U.S. Central Intelligence Agency’s World Factbook as an alternative data source.
5. This ratio is based on what is considered to be a “normal” sex ratio at birth: 1.06 males for every female born. See Klasen and Wink, 2003.
6. This ratio is based on the standards used in the UNDP’s Gender-Related Development Index, which uses 87.5 years as the maximum age for women and 82.5 years as the maximum age for men.
7. A first attempt to calculate the gender gap was made by the World Economic Forum in 2005; see Lopez-Claros and Zahidi, 2005. The 2005 index, which was attempting to capture women’s empowerment, used a scale in which the highest score was assigned to the country with the biggest gap in favour of women.
8. As in previous editions of the index, weights derived for the 2006 index were used again this year to allow for comparisons over time. They may be revised in future editions to reflect the evolution of the gender gap over the past decade.
9. Strictly, in the case of the Health and Survival subindex, the highest possible value a country can achieve is 0.9796. However, for purposes of simplicity, we will refer to this value as 1 throughout the chapters and in all tables, figures and Country Profiles.
10. Because of the special equality benchmark value of 0.9796 for the Health and Survival subindex, the equality benchmark for the overall index score is not strictly 1. This value is in fact (1 + 1 + 1 + 0.9796) / 4 = 0.9949. However, for purposes of simplicity, we will refer to the overall equality benchmark as 1 throughout the chapters and in all tables, figures and Economy Profiles.
11. Since the indicators in the subindexes are weighted by the standard deviations, the final scores for the subindexes and the overall index are not a pure measure of the gap vis-à-vis the equality benchmark, and therefore cannot be strictly interpreted as percentage values measuring the closure of the gender gap. However, for ease of interpretation and intuitive appeal, we will be using the percentage concept as a rough interpretation of the final scores.
12. “Impact of the pandemic on ILO modelled estimates and projections”, ILOSTAT Database Description: ILO Modelled Estimates (ILOSTAT database) https://ilostat.ilo.org/resources/concepts-and-definitions/ilo-modelled-estimates/ 13. UNDP, 2022.
14. International Standard Classification of Occupations (ISCO), https://www.ilo.org/public/english/bureau/stat/isco/docs/ groupdefn08.pdf.
15. International Standard Classification of Education (ISCED), http://uis.unesco.org/sites/default/files/documents/ international-standard-classification-of-education-isced-2011-en.pdf.
Global Gender Gap Report 2023 75
References
Hausmann, R., “Learning Without Theory”, Project Syndicate, 30 March 2016, https:// www. project-syndicate.org/commentary/ learningwithout-theory-by-ricardohausmann-201603?barrier=accesspaylog.
Klasen, S. and C. Wink, “Missing Women: Revisiting the Debate”, Feminist Economics, vol. 9, no. 2–3, 2003, pp. 263–299.
Lopez-Claros, A. and S. Zahidi, Women’s Empowerment: Measuring the Global Gender Gap, World Economic Forum, 2005.
United Nations Development Programme (UNDP), Human Development Report 2021-2022, 2022.
Global Gender Gap Report 2023 76
User’s Guide
How to read the Economy Profiles
The Economy Profiles section of the report presents a two-page profile for each of the 146 economies covered by this year’s edition. The first page corresponds to the index results, and the second offers a complementary set of contextual indicators and metrics for that economy.
The Global Gender Gap Report 2023 is complemented by a digital explorer, which provides detailed Economy Profiles of all economies featured in the index, as well as a Data Explorer tool enabling the reader to explore 2006-2023 detailed index results, rankings and comparisons by economy, region, indicator and subindex. The Global Gender Gap Data Explorer can be found at http://reports. weforum.org/global-gender-gap-report-2023
Economy selection
To monitor the state of gender parity across the widest possible range of countries, the index performance for an economy is computed when recent data is available for at least 12 of the 14 indicators composing the index. Obsolescence varies by indicator; while most data points date from the past two years or less, for a few cases, up to 10-year-old data points are used for the calculation. Given the update to the labour-force participation rate data series introduced this year, an allowance is made for this edition to include data up to 2010 in individual cases for this particular indicator.
Economy Profiles
Each Economy Profile is divided into three sections:
The first section 1 presents each country’s overall Global Gender Gap Index rank out of the 146 reviewed countries and its progress, represented on a 0-to-1 scale, towards closing the gender gap and achieving full gender parity (benchmark score of 1). The radar chart on the top left-hand side of each Economy Profile gives an overview of the country’s scores for each of the four subindexes relative to the ideal outcome of full gender parity (score of 1) and the global average score of all economies in the Index weighted by population across all economies.
The second section 2 of each Economy Profile provides an overview of each economy’s ranks and scores on the four subindexes of the Global Gender Gap Index, as well as on the individual indicators that compose each subindex. For each of the indicators, column one displays the country’s rank; column two displays the country’s score; column three locates the country’s score against the population-weighted global average for that indicator (out of 146 economies); column four displays the gap between the female and male value; column five charts the female and male value on a scale, respectively; and, finally, column six provides the minimum and maximum value used to scale each indicator in the previous column. Although full-precision values have been used for calculating ratios and scores, rounded values to one decimal are displayed to facilitate reading. The “n/a” symbol indicates where data is unavailable, and the symbol “-” indicates where the statistic cannot be computed. Economy scores are highlighted by a colour scale – increasing by 20% intervals from light blue (0.0–0.2; worst) to dark blue (0.8–1.0; best) – to help the reader visually interpret the index results. The female-male values and their gaps are
Global Gender Gap Report 2023 June 2023
G b G d G p d 2023 Ed A g g 0 605 E y 0 738 E d c n 0 976 Hea h 0 305 P c O de a d Sub de 2023 Sco e a 2022 Sco e a G oba Gender Gap ndex 0 656 118th 0 638 125 h E P p d Opp y 0 605 107 h 0 637 99 h Ed At 0 738 142 d 0 693 142 d H h d S 0 976 44th 0 976 50 h Po t ca Empowerment 0 305 46th 0 246 59 h Globa Gender Gap Index Indicators 2023 nd ca o Rank Sco e D f e ence F-M Min Max E P p d Opp y 0 h 0 60 -Labour- o ce pa c pat on a e % 3rd 0 956 -3 44W g q ty si k 1- b 95 h 0 600Est ma ed ea ned ncome n 1 000 53rd 0 682 -2 24 0-15 Leg sla o s, sen or o fic a s and manager % 126 h 0 181 -69 28 0- 0 P ssi d h k 126 h 0 420 -40 86 0-10 Educat ona A a nment 142nd 0 738 -L t y t % 130 h 0 755En o men n pr ma y educa on % - - -En o men n seconda y educa on % 138 h 0 643 -22 03 0- 0 E y d t 112 h 0 889 -1 25 0-20 Hea h and Surv va 44th 0 976 -S t b th % 1st 0 944Hea h e expec ancy yea s 56 h 1 050P E p 46th 0 305 -W p 46 h 0 06 -32 80 0-10 Women n m n ste a posi ons % 30 h 0 600 -25 00Y h / h d st st 50 80 h 0 000 -50 00 0-50 E y P fi Angola S p p 0.656 R k s) 118th d Ed t 2023 C p h G oba ave age 0 1 Fema e vs Ma e M M78 16 74 727 04 4 80 84 64 15 36 70 43 29 57-61 77 39 74 11 26 10 01-66 40 33 60 62 50 37 50 50 00 0 1 2
Global Gender Gap Report 2023 77
color-coded – purple for men and green for women. The gap between them is coloured based on which gender has the “lead”, or higher value. To calculate the index, all ratios are truncated at the parity benchmark of 1 and thus the highest score possible is 1 – except for the sex ratio at birth (0.944) and the healthy life expectancy (1.06) indicators.
The third section 3 of the Economy Profile includes contextual indicators, which are not incorporated into the calculation of the index but provide relevant information about gender parity in different aspects. These indicators are displayed separately because data is available for only a few economies or is not updated regularly. They are in turn organized into seven thematic groups: a) General indicators; b) Work participation and leadership; c) Access to finance; d) Civil and political freedom; e) Family and care; f) Education and skills; g) Health. The full definitions of all indicators are provided in Appendix B.
Data Explorer online features
A number of additional features may be accessed in the online Data Explorer (available at http://reports. weforum.org/global-gender-gap-report-2023). The reader has the possibility to switch between Economy Profiles and interactive index rankings in a tile, bar chart or world map format by clicking on the corresponding icon option at the top-right corner of the page 4 . The reader can also explore data from previous editions of the report and see results by economy income group or by regional grouping by selecting the corresponding option on the “refine by group” drop-down menu on the upper-left corner of the page 5
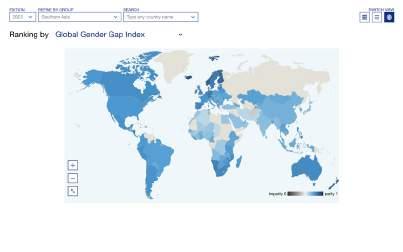
E y P fi Angola S 0 656 R k 118th P g 2 2 Complementary Targets and Contextual ndicators 2023 Genera nd ca o s d t U V GDP US$ b ons 67 4 GDP pe cap a const n 17 n $ 1000 5 91 P p 1 02 P p g h % 3 17 d t p p F Ma V To a popu a on 18 00 17 59 35 59 Wo k pa c pa on and eade sh p d V Gender pay gap % OECD y) n a S p % y) n a F th y sh p a F th p g % fi Sh k % 90 30 d t 1-7 b st V Advancement o women o eade sh p o es 3 78 nd cato U Fema e Ma e Va ue U p yed d % b 1 -6 16 33 16 34 16 34 Wo ke s emp oyed par -t me % o emp oyed 34 34 28 59 31 52 P p sp p d d % n a n a n a d t M p p F Ma V Labou -fo ce 5 02 4 77 9 79 Access o finance d t 0-1 E gh s) V Access o financ a services Nea -equa gh s h t gh d d d gh U gh Access o and assets Uneven gh s Access o non- and assets Uneven gh s C v and po ca freedom d t U V Yea women ece ved gh to vo e yea 1975 Numbe o ema e heads o sta e o da e numbe 0 S h d pp h % d V E ect on st quotas o women na ona Yes y p q s, y nd cato 0- qua g s) Va ue A st N - q gh F eedom o movemen Equa gh s Fam y and care d U V Pub c spend ng on am y benefi s % GPD n a Unme am y p ann ng % women 15-4 38 00 E y g 24 0 Me g b th fi st h d ye d - s) V R ght o d vorce Uneven gh s nd ca or Days Fema e Ma e Va e L g h p 90 00 1 00 0 Ed d k Gradua e A a nmen % Fema e Ma e Pa y STEM G d Agr Fo estry F she es & Vete na y 28 21 71 79 0 39 A t & Human es 36 43 63 57 0 57 B si ss, Ad & L 48 29 51 71 0 93 E g g Ma & C st H h & W f 66 83 33 17 2 02 n o ma on & Comm Techno og es 37 96 62 04 0 61 Natu a Sc Ma hema cs & S a st cs n a n a n a S S J & oca o a a g a a a PhD g adua es n a n a n a G % Gradua e om te a y educa on n a n a n a Hea th d U V P eva ence o gende vio ence n e me % women 34 80 s a e ded by sk ed pe so e % 9 60 Ma t ty d h 100 000 b h 241 00 T y t b 5 37 d 0-1 E h s) V Reproduct ve au onomy Equa gh s S 0 1 h h al si at P A d A d B d h d d d d Fo a nd ca o s, exc p he wo he h nd ca o s, par s benchmarked at n h case o sex a o a b h h gend pa y benchma k se 0 944 see K ase and W k 20 3 n t e case o p g p g g p y 3 5 4 Global Gender Gap Report 2023 78
Interactive ranking tables
By clicking on the icon menu at the top-right corner of the Data Explorer 6 , the interactive rankings may be switched between a tile view, which visualizes economies’ overall performance on each subindex for context; a bar-chart view, which depicts an economy’s performance for the selected indicator relative to other economies; and a world-map view, which allows the reader to explore geographical trends and patterns. In the map view, countries are highlighted by an extended colour scale to enhance contrast and readability—ranging in 20% intervals from light blue (0.0–0.2, worst) to dark blue (0.8–1.0, best). In addition, the reader has the possibility to switch between selected indicators and across the time series, narrow their selection to a specific region, or go directly to the results for a specific economy of interest through the drop-down menu strip at the top of the Data Explorer 7
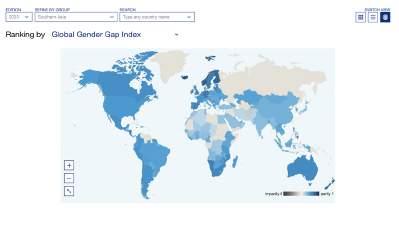
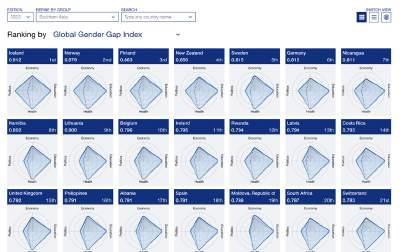
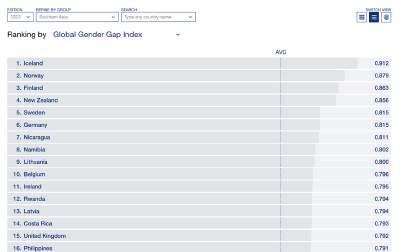
Economy Comparison Tool
The reader also has the possibility to directly compare two countries side-by-side and across the time series. The Economy Comparison Tool 8 can be accessed by first selecting an economy through the “search” drop-down menu on the topleft corner of the page, and then selecting a second economy from the “compare with” drop-down menu on the top right corner of the explorer. This feature enables a side-by-side view of indicators for the selected comparison economy relative to the original economy selected in the Economy Profile view of the Data Explorer. The reader may also select the time period for comparison 9 . The reader may return to the original view by clicking on the Back-to-Economy menu option at the top-left corner of the page or may continue exploring the data by clicking through to the other views of the Data Explorer.
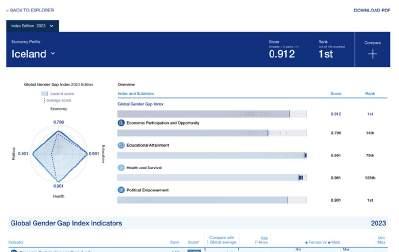
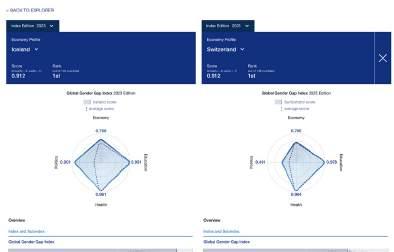
9 9 8 9 8 6 6 6 7 7 7 Global Gender Gap Report 2023 79
Index of Economy Profiles
Country Page Afghanistan 81 Albania 83 Algeria 85 Angola 87 Argentina 89 Armenia 91 Australia 93 Austria 95 Azerbaijan 97 Bahrain 99 Bangladesh 101 Barbados 103 Belarus 105 Belgium 107 Belize 109 Benin 111 Bhutan 113 Bolivia 115 Bosnia and Herzegovina 117 Botswana 119 Brazil 121 Brunei Darussalam 123 Bulgaria 125 Burkina Faso 127 Burundi 129 Cabo Verde 131 Cambodia 133 Cameroon 135 Canada 137 Chad 139 Chile 141 China 143 Colombia 145 Comoros 147 Congo, Dem. Rep. of the 149 Costa Rica 151 Côte d’Ivoire 153 Croatia 155 Cyprus 157 Czech Republic 159 Denmark 161 Dominican Republic 163 Ecuador 165 Egypt 167 El Salvador 169 Estonia 171 Eswatini 173 Ethiopia 175 Fiji 177 Country Page Finland 179 France 181 Gambia 183 Georgia 185 Germany 187 Ghana 189 Greece 191 Guatemala 193 Guinea 195 Honduras 197 Hungary 199 Iceland 201 India 203 Indonesia 205 Iran, Islamic Republic of 207 Ireland 209 Israel 211 Italy 213 Jamaica 215 Japan 217 Jordan 219 Kazakhstan 221 Kenya 223 Korea, Rep. 225 Kuwait 227 Kyrgyzstan 229 Lao PDR 231 Latvia 233 Lebanon 235 Lesotho 237 Liberia 239 Lithuania 241 Luxembourg 243 Madagascar 245 Malawi 247 Malaysia 249 Maldives 251 Mali 253 Malta 255 Mauritius 257 Mexico 259 Moldova, Republic of 261 Mongolia 263 Montenegro 265 Morocco 267 Mozambique 269 Myanmar 271 Namibia 273 Nepal 275 Country Page Netherlands 277 New Zealand 279 Nicaragua 281 Niger 283 Nigeria 285 North Macedonia 287 Norway 289 Oman 291 Pakistan 293 Panama 295 Paraguay 297 Peru 299 Philippines 301 Poland 303 Portugal 305 Qatar 307 Romania 309 Rwanda 311 Saudi Arabia 313 Senegal 315 Serbia 317 Sierra Leone 319 Singapore 321 Slovakia 323 Slovenia 325 South Africa 327 Spain 329 Sri Lanka 331 Suriname 333 Sweden 335 Switzerland 337 Tajikistan 339 Tanzania 341 Thailand 343 Timor-Leste 345 Togo 347 Tunisia 349 Türkiye 351 Uganda 353 Ukraine 355 United Arab Emirates 357 United Kingdom 359 United States 361 Uruguay 363 Vanuatu 365 Viet Nam 367 Zambia 369 Zimbabwe 371 Global Gender Gap Report 2023 80
Global Gender Gap Report 2023 81
Complementary Targets and Contextual Indicators 2023
Inheritance
Access
Health
Global Gender Gap Report 2023 82 Economy Profile Afghanistan Score 0.405 Rank 146th Page 2 of 2
General indicators Indicator Unit Value GDP US$ billions 14 79 GDP per capita constant '17 intl $ 1000 1 52 Population sex ratio female/male 0 98 Population growth rate % 2 85 Indicator Million people Female Male Value Total population 20 36 20 77 41 13 Work participation and leadership Indicator Unit Value Gender pay gap % (OECD countries only) n a Share of women's membership in boards % (OECD countries only) n a Firms with female majority ownership % firms 0 50 Firms with female top managers % firms 4 70 Share of workers in informal sector % workers 86 40 Indicator 1-7 (best) Value Advancement of women to leadership roles n a Indicator Unit Female Male Value Unemployed adults % of labour force (15-64) 5 46 5 65 5 60 Workers employed part-time % of employed people 26 76 21 64 22 86 Proportion of time spent on unpaid domestic and care work % n a n a n a Indicator Million people Female Male Value Labour-force 1 34 4 59 5 93 Access to finance Indicator 0-1 (Equal rights) Value
to financial services
rights
Access
Near-equal
rights for widows and daughters Restricted rights
to land assets Near-equal rights
to non-land assets Near-equal rights Civil and political freedom Indicator Unit Value Year women received right to vote year 1963 (Suspended) Number of female heads of state to date number 0 Seats held in upper house % total seats n a Indicator Yes/No Value Election list quotas for women, national Yes Party membership quotas, voluntary Yes Indicator 0-1 (Equal rights) Value Access to justice Restricted rights Freedom of movement Restricted rights Family and care Indicator Unit Value Public spending on family benefits % GPD n a Unmet family planning % women 15-49 24 47 Early marriage % 35 00 Mean age of women at birth of first child years n a Indicator 0-1 (Equal rights) Value Right to divorce Unequal rights Indicator Days Female Male Value Length of parental leave 90 00 14 00 0 Education and skills Graduates Attainment % Female Male Parity STEM Graduates n a n a n a Agri , Forestry, Fisheries & Veterinary 3 42 96 58 0 04 Arts & Humanities 28 22 71 78 0 39 Business, Admin & Law n a n a n a Education 23 22 76 78 0 30 Engineering, Manuf & Construction 4 09 95 91 0 04 Health & Welfare 32 34 67 66 0 48 Information & Comm Technologies n a n a n a Natural Sci , Mathematics & Statistics n a n a n a Social Sci , Jour nalism & Information n a n a n a Vocational training 0 34 1 48 0 23 PhD graduates n a n a n a Graduates % Female Male Value Graduates from tertiary education 6 10 15 35 10 85
Access
Value Prevalence
violence in lifetime % women 60 80 Births attended
skilled personnel % live births 61 80 Mater
mortality deaths per 100,000 live births 638 00 Total fertility rate births per woman 4 75
Value
Restricted rights *Scores
0
optimal situation
parity”
Appendix A
B
detailed methodology, definitions, sources
periods.
Indicator Unit
of gender
by
nal
Indicator 0-1 (Equal rights)
Reproductive autonomy
are on a
to 1 scale, where 1 represents the
or “
Please see
and
for
and
**For all indicators, except the two health indicators, parity is benchmarked at 1 In the case of sex ratio at birth the gender parity benchmark is set at 0 944 (see Klasen and Wink 2003) In the case of healthy life expectancy the gender parity benchmark is set at 1 06, given women's longer life expectancy
Global Gender Gap Index Indicators
Global Gender Gap Report 2023 83 Global Gender Gap Index 2023 Edition Albania score average score 0.786 Economy 0 999 E d u c a t i o n 0.960 Health 0 419 P o i t i c s Overview Index and Subindex 2023 Score Rank 2022 Score Rank Global Gender Gap Index 0 791 17th 0 787 18th Economic Participation and Opportunity 0.786 18th 0 774 23rd Educational Attainment 0 999 33rd 0 999 34th Health and Survival 0 960 133rd 0 956 137th Political Empowerment 0 419 28th 0 419 25th
2023 Indicator Rank Score* Difference F-M Min Max Economic Participation and Opportunity 18th 0 786 -Labour-force participation rate % 73rd 0 778 -15 06 0-100 Wage equality for similar work 1-7 (best) 1st 0 858Estimated ear ned income int'l $ 1,000 26th 0 756 -4 04 0-150 Legislators, senior officials and managers % 75th 0 518 -31 77 0-100 Professional and technical workers % 1st 1 000 11 66 0-100 Educational Attainment 33rd 0.999 -Literacy rate % 69th 0 995Enrolment in primary education % 1st 1 000 2 67 0-100 Enrolment in secondary education % 1st 1 000 2 95 0-200 Enrolment in tertiary education % 1st 1 000 27 96 0-200 Health and Survival 133rd 0 960 -Sex ratio at birth** % 138th 0 928Healthy life expectancy** years 79th 1 033Political Empowerment 28th 0 419 -Women in parliament % 37th 0 555 -28 60 0-100 Women in ministerial positions % 1st 1 000 33 33 0-100 Years with female/male head of state (last 50) 80th 0 000 -50 00 0-50 Economy Profile Albania Score (imparity = 0 parity = 1) 0.791 Rank (out of 146 countries) 17th Index Edition 2023 Compare with Global average 0 1 Female vs Male Min Max67 93 52 8716 54 12 50 65 89 34 12 44 17 55 8390 93 93 60 94 75 97 70 43 26 71 22-64 30 35 70 33 33 66 67 50 00 0
Complementary Targets and Contextual Indicators 2023
Global Gender Gap Report 2023 84 Economy Profile Albania Score 0.791 Rank 17th Page 2 of 2
General indicators Indicator Unit Value GDP US$ billions 18 26 GDP per capita constant '17 intl $ 1000 14 52 Population sex ratio female/male 1 00 Population growth rate % -0 93 Indicator Million people Female Male Value Total population 1 43 1 42 2 84 Work participation and leadership Indicator Unit Value Gender pay gap % (OECD countries only) n a Share of women's membership in boards % (OECD countries only) n a Firms with female majority ownership % firms 16 90 Firms with female top managers % firms 18 10 Share of workers in informal sector % workers 56 70 Indicator 1-7 (best) Value Advancement of women to leadership roles 6 43 Indicator Unit Female Male Value Unemployed adults % of labour force (15-64) 11 72 12 13 11 95 Workers employed part-time % of employed people 24 42 15 35 19 38 Proportion of time spent on unpaid domestic and care work % n a n a n a Indicator Million people Female Male Value Labour-force 0 57 0 70 1 27 Access to finance Indicator 0-1 (Equal rights) Value Access to financial services Near-equal rights Inheritance rights for widows and daughters Near-equal rights Access to land assets Near-equal rights Access to non-land assets Equal rights Civil and political freedom Indicator Unit Value Year women received right to vote year 1920 Number of female heads of state to date number 0 Seats held in upper house % total seats n a Indicator Yes/No Value Election list quotas for women, national Yes Party membership quotas, voluntary n a Indicator 0-1 (Equal rights) Value Access to justice Equal rights Freedom of movement Equal rights Family and care Indicator Unit Value Public spending on family benefits % GPD n a Unmet family planning % women 15-49 15 20 Early marriage % 7 20 Mean age of women at birth of first child years 26 60 Indicator 0-1 (Equal rights) Value Right to divorce Near-equal rights Indicator Days Female Male Value Length of parental leave 365 00 3 00 0 Education and skills Graduates Attainment % Female Male Parity STEM Graduates 46 65 53 35 0 87 Agri , Forestry, Fisheries & Veterinary n a n a n a Arts & Humanities 74 20 25 80 2 88 Business, Admin & Law n a n a n a Education 77 68 22 32 3 48 Engineering, Manuf & Construction n a n a n a Health & Welfare 78 93 21 07 3 75 Information & Comm Technologies 43 71 56 29 0 78 Natural Sci , Mathematics & Statistics n a n a n a Social Sci , Jour nalism & Information n a n a n a Vocational training 2 36 8 28 0 28 PhD graduates n a n a n a Graduates % Female Male Value Graduates from tertiary education 59 35 28 28 43 24 Health Indicator Unit Value Prevalence of gender violence in lifetime % women 24 60 Births attended by skilled personnel % live births 99 80 Mater nal mortality deaths per 100,000 live births 15 00 Total fertility rate births per woman 1 40 Indicator 0-1 (Equal rights) Value Reproductive autonomy Equal rights *Scores
0
1
where 1 represents
optimal situation
parity
see Appendix A and B for detailed methodology, definitions, sources and periods. **For all indicators, except the two health indicators, parity is benchmarked at 1 In the case of sex ratio at birth the gender parity benchmark is set at 0 944 (see Klasen and Wink 2003) In the case of healthy life expectancy the gender parity benchmark is set at 1 06, given women's longer life expectancy
are on a
to
scale,
the
or “
” Please
Global Gender Gap Index Indicators
Global Gender Gap Report 2023 85 Global Gender Gap Index 2023 Edition Algeria score average score 0.317 Economy 0 951 E d u c a t i o n 0.958 Health 0 065 P o i t i c s Overview Index and Subindex 2023 Score Rank 2022 Score Rank Global Gender Gap Index 0 573 144th 0 602 140th Economic Participation and Opportunity 0.317 145th 0 466 138th Educational Attainment 0 951 116th 0 915 126th Health and Survival 0 958 137th 0 958 135th Political Empowerment 0 065 135th 0 070 134th
2023 Indicator Rank Score* Difference F-M Min Max Economic Participation and Opportunity 145th 0 317 -Labour-force participation rate % 143rd 0 259 -48 91 0-100 Wage equality for similar work 1-7 (best) - - -Estimated ear ned income int'l $ 1,000 144th 0 192 -14 78 0-150 Legislators, senior officials and managers % 138th 0 091 -83 27 0-100 Professional and technical workers % 78th 0 916 -4 40 0-100 Educational Attainment 116th 0.951 -Literacy rate % 120th 0 862Enrolment in primary education % - - -Enrolment in secondary education % 1st 1 000 2 73 0-200 Enrolment in tertiary education % 1st 1 000 26 77 0-200 Health and Survival 137th 0 958 -Sex ratio at birth** % 1st 0 944Healthy life expectancy** years 143rd 0 990Political Empowerment 135th 0 065 -Women in parliament % 134th 0 086 -84 20 0-100 Women in ministerial positions % 106th 0 154 -73 33 0-100 Years with female/male head of state (last 50) 80th 0 000 -50 00 0-50 Economy Profile Algeria Score (imparity = 0 parity = 1) 0.573 Rank (out of 146 countries) 144th Index Edition 2023 Compare with Global average 0 1 Female vs Male Min Max66 04 17 1318 29 3 52 91 64 8 37 52 20 47 80-107 68 110 42 40 64 67 41-92 10 7 90 86 67 13 33 50 00 0
Complementary Targets and Contextual Indicators 2023
Global Gender Gap Report 2023 86 Economy Profile Algeria Score 0.573 Rank 144th Page 2 of 2
General indicators Indicator Unit Value GDP US$ billions 163 04 GDP per capita constant '17 intl $ 1000 11 04 Population sex ratio female/male 0 96 Population growth rate % 1 66 Indicator Million people Female Male Value Total population 22 04 22 86 44 90 Work participation and leadership Indicator Unit Value Gender pay gap % (OECD countries only) n a Share of women's membership in boards % (OECD countries only) n a Firms with female majority ownership % firms n a Firms with female top managers % firms n a Share of workers in informal sector % workers n a Indicator 1-7 (best) Value Advancement of women to leadership roles 5 05 Indicator Unit Female Male Value Unemployed adults % of labour force (15-64) n a n a n a Workers employed part-time % of employed people 36 23 15 67 19 39 Proportion of time spent on unpaid domestic and care work % n a n a n a Indicator Million people Female Male Value Labour-force 2 19 8 28 10 47 Access to finance Indicator 0-1 (Equal rights) Value Access to financial services Near-equal rights
rights for widows and daughters Unequal rights
to land assets Near-equal rights Access to non-land assets Near-equal rights Civil and political freedom Indicator Unit Value Year women received right to vote year 1944, 1958, 1962 Number of female heads of state to date number 0 Seats held in upper house % total seats 4 10 Indicator Yes/No Value Election list quotas for women, national Yes Party membership quotas, voluntary Yes Indicator 0-1 (Equal rights) Value Access to justice Restricted rights Freedom of movement Restricted rights Family and care Indicator Unit Value Public spending on family benefits % GPD n a Unmet family planning % women 15-49 14 10 Early marriage % 3 10 Mean age of women at birth of first child years n a Indicator 0-1 (Equal rights) Value Right to divorce Unequal rights Indicator Days Female Male Value Length of parental leave 98 00 3 00 0 Education and skills Graduates Attainment % Female Male Parity STEM Graduates 58 17 41 83 1 39 Agri , Forestry, Fisheries & Veterinary n a n a n a Arts & Humanities 80 57 19 43 4 15 Business, Admin & Law n a n a n a Education 80 37 19 63 4 10 Engineering, Manuf & Construction 48 46 51 54 0 94 Health & Welfare 70 52 29 48 2 39 Information & Comm Technologies n a n a n a Natural Sci , Mathematics & Statistics 83 06 16 94 4 90 Social Sci
Information n a n a n a Vocational training n a n a n a PhD graduates n a n a n a Graduates % Female Male Value Graduates from tertiary education 58 32 28 94 43 32
Unit Value Prevalence of gender violence in lifetime % women n a Births attended by skilled personnel % live births 98 80 Mater nal mortality deaths per 100,000 live births 112 00 Total fertility rate births per woman 2 94 Indicator 0-1 (Equal rights) Value Reproductive autonomy Restricted rights
two health indicators, parity is benchmarked at 1
the case of sex ratio at birth the gender parity benchmark is set at 0 944 (see Klasen and Wink 2003) In the case of healthy life expectancy the gender parity benchmark is set at 1 06, given women's longer life expectancy
Inheritance
Access
, Jour nalism &
Health Indicator
*Scores are on a 0 to 1 scale, where 1 represents the optimal situation or “parity” Please see Appendix A and B for detailed methodology, definitions, sources and periods. **For all indicators, except the
In
Global Gender Gap Index Indicators
Global Gender Gap Report 2023 87 Global Gender Gap Index 2023 Edition Angola score average score 0.605 Economy 0 738 E d u c a t i o n 0.976 Health 0 305 P o i t i c s Overview Index and Subindex 2023 Score Rank 2022 Score Rank Global Gender Gap Index 0 656 118th 0 638 125th Economic Participation and Opportunity 0.605 107th 0 637 99th Educational Attainment 0 738 142nd 0 693 142nd Health and Survival 0 976 44th 0 976 50th Political Empowerment 0 305 46th 0 246 59th
2023 Indicator Rank Score* Difference F-M Min Max Economic Participation and Opportunity 107th 0 605 -Labour-force participation rate % 3rd 0 956 -3 44 0-100 Wage equality for similar work 1-7 (best) 95th 0 600Estimated ear ned income int'l $ 1,000 53rd 0 682 -2 24 0-150 Legislators, senior officials and managers % 126th 0 181 -69 28 0-100 Professional and technical workers % 126th 0 420 -40 86 0-100 Educational Attainment 142nd 0.738 -Literacy rate % 130th 0 755Enrolment in primary education % - - -Enrolment in secondary education % 138th 0 643 -22 03 0-200 Enrolment in tertiary education % 112th 0 889 -1 25 0-200 Health and Survival 44th 0 976 -Sex ratio at birth** % 1st 0 944Healthy life expectancy** years 56th 1 050Political Empowerment 46th 0 305 -Women in parliament % 46th 0 506 -32 80 0-100 Women in ministerial positions % 30th 0 600 -25 00 0-100 Years with female/male head of state (last 50) 80th 0 000 -50 00 0-50 Economy Profile Angola Score (imparity = 0 parity = 1) 0.656 Rank (out of 146 countries) 118th Index Edition 2023 Compare with Global average 0 1 Female vs Male Min Max78 16 74 727 04 4 80 84 64 15 36 70 43 29 57-61 77 39 74 11 26 10 01-66 40 33 60 62 50 37 50 50 00 0
Complementary Targets and Contextual Indicators 2023
Global Gender Gap Report 2023 88 Economy Profile Angola Score 0.656 Rank 118th Page 2 of 2
General indicators Indicator Unit Value GDP US$ billions 67 4 GDP per capita constant '17 intl $ 1000 5 91 Population sex ratio female/male 1 02 Population growth rate % 3 17 Indicator Million people Female Male Value Total population 18 00 17 59 35 59 Work participation and leadership Indicator Unit Value Gender pay gap % (OECD countries only) n a Share of women's membership in boards % (OECD countries only) n a Firms with female majority ownership % firms n a Firms with female top managers % firms n a Share of workers in informal sector % workers 90 30 Indicator 1-7 (best) Value Advancement of women to leadership roles 3 78 Indicator Unit Female Male Value Unemployed adults % of labour force (15-64) 16 33 16 34 16 34 Workers employed part-time % of employed people 34 34 28 59 31 52 Proportion of time spent on unpaid domestic and care work % n a n a n a Indicator Million people Female Male Value Labour-force 5 02 4 77 9 79 Access to finance Indicator 0-1 (Equal rights) Value Access to financial services Near-equal rights
rights for widows and daughters Uneven rights
to land assets Uneven rights Access to non-land assets Uneven rights Civil and political freedom Indicator Unit Value Year women received right to vote year 1975 Number of female heads of state to date number 0 Seats held in upper house % total seats n a Indicator Yes/No Value Election list quotas for women, national Yes Party membership quotas, voluntary Yes Indicator 0-1 (Equal rights) Value Access to justice Near-equal rights Freedom of movement Equal rights Family and care Indicator Unit Value Public spending on family benefits % GPD n a Unmet family planning % women 15-49 38 00 Early marriage % 24 70 Mean age of women at birth of first child years n a Indicator 0-1 (Equal rights) Value Right to divorce Uneven rights Indicator Days Female Male Value Length of parental leave 90 00 1 00 0 Education and skills Graduates Attainment % Female Male Parity STEM Graduates n a n a n a Agri , Forestry, Fisheries & Veterinary 28 21 71 79 0 39 Arts & Humanities 36 43 63 57 0 57 Business, Admin & Law 48 29 51 71 0 93 Education n a n a n a Engineering, Manuf & Construction n a n a n a Health & Welfare 66 83 33 17 2 02 Information & Comm Technologies 37 96 62 04 0 61 Natural Sci
Mathematics
Statistics n a n a n a Social Sci
Information n a n a n a Vocational training n a n a n a PhD graduates n a n a n a Graduates % Female Male Value Graduates from tertiary education n a n a n a Health Indicator Unit Value Prevalence of gender violence in lifetime % women 34 80 Births attended by skilled personnel % live births 49 60 Mater nal mortality deaths per 100,000 live births 241 00 Total fertility rate births per woman 5 37 Indicator 0-1 (Equal rights) Value Reproductive autonomy Equal rights *Scores
methodology, de
periods. **For
two health indicators, parity is benchmarked at 1 In the case of sex ratio at birth the gender parity benchmark is set at 0 944 (see Klasen and Wink 2003) In the case of healthy life expectancy the gender parity benchmark is set at 1 06, given women's longer life expectancy
Inheritance
Access
,
&
, Jour nalism &
are on a 0 to 1 scale, where 1 represents the optimal situation or “parity” Please see Appendix A and B for detailed
finitions, sources and
all indicators, except the
Global Gender Gap Index Indicators
Global Gender Gap Report 2023 89 Global Gender Gap Index 2023 Edition Argentina score average score 0.644 Economy 1 000 E d u c a t i o n 0.977 Health 0 429 P o i t i c s Overview Index and Subindex 2023 Score Rank 2022 Score Rank Global Gender Gap Index 0 762 36th 0 756 33rd Economic Participation and Opportunity 0.644 95th 0 635 102nd Educational Attainment 1 000 1st 1 000 1st Health and Survival 0 977 41st 0 977 46th Political Empowerment 0 429 26th 0 413 28th
2023 Indicator Rank Score* Difference F-M Min Max Economic Participation and Opportunity 95th 0 644 -Labour-force participation rate % 92nd 0 709 -20 67 0-100 Wage equality for similar work 1-7 (best) 93rd 0 602Estimated ear ned income int'l $ 1,000 106th 0 554 -12 40 0-150 Legislators, senior officials and managers % 84th 0 486 -34 61 0-100 Professional and technical workers % 1st 1 000 2 87 0-100 Educational Attainment 1st 1.000 -Literacy rate % 1st 1 000Enrolment in primary education % - - -Enrolment in secondary education % 1st 1 000 4 77 0-200 Enrolment in tertiary education % 1st 1 000 52 85 0-200 Health and Survival 41st 0 977 -Sex ratio at birth** % 1st 0 944Healthy life expectancy** years 52nd 1 051Political Empowerment 26th 0 429 -Women in parliament % 14th 0 812 -10 40 0-100 Women in ministerial positions % 64th 0 286 -55 56 0-100 Years with female/male head of state (last 50) 16th 0 242 -30 53 0-50 Economy Profile Argentina Score (imparity = 0 parity = 1) 0.762 Rank (out of 146 countries) 36th Index Edition 2023 Compare with Global average 0 1 Female vs Male Min Max71 15 50 4827 79 15 39 67 31 32 69 48 57 51 43-107 79 112 56 73 15 126 00-55 20 44 80 77 78 22 22 40 26 9 74
Complementary Targets and Contextual Indicators 2023
Agri
Global Gender Gap Report 2023 90 Economy Profile Argentina Score 0.762 Rank 36th Page 2 of 2
General indicators Indicator Unit Value GDP US$ billions 487 23 GDP per capita constant '17 intl $ 1000 21 53 Population sex ratio female/male 1 02 Population growth rate % 0 95 Indicator Million people Female Male Value Total population 22 98 22 53 45 51 Work participation and leadership Indicator Unit Value Gender pay gap % (OECD countries only) 6 25 Share of women's membership in boards % (OECD countries only) n a Firms with female majority ownership % firms 7 90 Firms with female top managers % firms 8 00 Share of workers in informal sector % workers 48 90 Indicator 1-7 (best) Value Advancement of women to leadership roles 4 56 Indicator Unit Female Male Value Unemployed adults % of labour force (15-64) 10 05 8 08 8 95 Workers employed part-time % of employed people 53 31 29 93 40 02 Proportion of time spent on unpaid domestic and care work % 23 42 9 25 n a Indicator Million people Female Male Value Labour-force 5 15 6 58 11 73 Access to finance Indicator 0-1 (Equal rights) Value Access to financial services Equal rights Inheritance rights for widows and daughters Equal rights Access to land assets Near-equal rights Access to non-land assets Equal rights Civil and political freedom Indicator Unit Value Year women received right to vote year 1947 Number of female heads of state to date number 2 Seats held in upper house % total seats 43 10 Indicator Yes/No Value Election list quotas for women, national Yes Party membership quotas, voluntary Yes Indicator 0-1 (Equal rights) Value Access to justice Equal rights Freedom of movement Equal rights Family and care Indicator Unit Value Public spending on family benefits % GPD n a Unmet family planning % women 15-49 12 54 Early marriage % 12 90 Mean age of women at birth of first child years n a Indicator 0-1 (Equal rights) Value Right to divorce Equal rights Indicator Days Female Male Value Length of parental leave 90 00 2 00 0 Education and skills Graduates Attainment % Female Male Parity STEM Graduates n a n a n a
, Forestry, Fisheries & Veterinary n a n a n a
& Humanities n a n a n a
n a n a n a Education n a n a n a Engineering, Manuf & Construction n a n a n a Health & Welfare n a n a n a Information & Comm Technologies n a n a n a Natural Sci , Mathematics & Statistics n a n a n a Social Sci , Jour nalism & Information n a n a n a Vocational training n a n a n a PhD graduates n a n a n a Graduates % Female Male Value Graduates from tertiary education 24 13 10 30 17 12 Health Indicator Unit Value Prevalence of gender violence in lifetime % women n a Births attended by skilled personnel % live births 98 80 Mater nal mortality deaths per 100,000 live births 39 00 Total fertility rate births per woman 1 91 Indicator 0-1 (Equal rights) Value Reproductive autonomy Uneven rights *Scores
a 0 to 1 scale, where 1 represents the optimal situation or “parity” Please see Appendix A and B for detailed methodology, definitions, sources and periods. **For all indicators, except the two health indicators, parity is benchmarked at 1 In the case of sex ratio at birth the gender parity benchmark is set at 0 944 (see Klasen and Wink 2003) In the case of healthy life expectancy the gender parity benchmark is set at 1 06, given women's longer life expectancy
Arts
Business, Admin & Law
are on
Global Gender Gap Index Indicators
Global Gender Gap Report 2023 91 Global Gender Gap Index 2023 Edition Armenia score average score 0.716 Economy 0 999 E d u c a t i o n 0.955 Health 0 215 P o i t i c s Overview Index and Subindex 2023 Score Rank 2022 Score Rank Global Gender Gap Index 0 721 61st 0 698 89th Economic Participation and Opportunity 0.716 52nd 0 669 84th Educational Attainment 0 999 35th 1 000 28th Health and Survival 0 955 139th 0 954 139th Political Empowerment 0 215 71st 0 170 89th
2023 Indicator Rank Score* Difference F-M Min Max Economic Participation and Opportunity 52nd 0 716 -Labour-force participation rate % 26th 0 874 -9 04 0-100 Wage equality for similar work 1-7 (best) 35th 0 708Estimated ear ned income int'l $ 1,000 83rd 0 627 -6 66 0-150 Legislators, senior officials and managers % 93rd 0 422 -40 69 0-100 Professional and technical workers % 1st 1 000 17 86 0-100 Educational Attainment 35th 0.999 -Literacy rate % 57th 0 999Enrolment in primary education % 75th 0 998 -0 16 0-100 Enrolment in secondary education % 1st 1 000 2 66 0-200 Enrolment in tertiary education % 1st 1 000 20 27 0-200 Health and Survival 139th 0 955 -Sex ratio at birth** % 143rd 0 909Healthy life expectancy** years 1st 1 060Political Empowerment 71st 0 215 -Women in parliament % 38th 0 550 -29 00 0-100 Women in ministerial positions % 98th 0 182 -69 23 0-100 Years with female/male head of state (last 50) 80th 0 000 -50 00 0-50 Economy Profile Armenia Score (imparity = 0 parity = 1) 0.721 Rank (out of 146 countries) 61st Index Edition 2023 Compare with Global average 0 1 Female vs Male Min Max71 84 62 8017 86 11 20 70 35 29 65 41 07 58 9389 41 89 25 87 66 90 31 46 01 66 28-64 50 35 50 84 62 15 39 50 00 0
Complementary Targets and Contextual Indicators 2023
Global Gender Gap Report 2023 92 Economy Profile Armenia Score 0.721 Rank 61st Page 2 of 2
General indicators Indicator Unit Value GDP US$ billions 13 86 GDP per capita constant '17 intl $ 1000 14 19 Population sex ratio female/male 1 22 Population growth rate % -0 52 Indicator Million people Female Male Value Total population 1 53 1 25 2 78 Work participation and leadership Indicator Unit Value Gender pay gap % (OECD countries only) n a Share of women's membership in boards % (OECD countries only) n a Firms with female majority ownership % firms 18 10 Firms with female top managers % firms 19 10 Share of workers in informal sector % workers 50 20 Indicator 1-7 (best) Value Advancement of women to leadership roles 5 09 Indicator Unit Female Male Value Unemployed adults % of labour force (15-64) 7 82 13 54 10 59 Workers employed part-time % of employed people 18 13 13 63 16 04 Proportion of time spent on unpaid domestic and care work % n a n a n a Indicator Million people Female Male Value Labour-force 0 77 0 70 1 46 Access to finance Indicator 0-1 (Equal rights) Value Access to financial services Near-equal rights
rights for widows and daughters Near-equal rights Access to land assets Near-equal rights Access to non-land assets Equal rights Civil and political freedom Indicator Unit Value Year women received right to vote year 1918 Number of female heads of state to date number 0 Seats held in upper house % total seats n a Indicator Yes/No Value Election list quotas for women, national Yes Party membership quotas, voluntary Yes Indicator 0-1 (Equal rights) Value Access to justice Near-equal rights Freedom of movement Equal rights Family and care Indicator Unit Value Public spending on family benefits % GPD n a Unmet family planning % women 15-49 12 50 Early marriage % 4 80 Mean age of women at birth of first child years 25 20 Indicator 0-1 (Equal rights) Value Right to divorce Near-equal rights Indicator Days Female Male Value Length of parental leave 140 00 7 00 660 00 Education and skills Graduates Attainment % Female Male Parity STEM Graduates 39 81 60 19 0 66 Agri , Forestry, Fisheries & Veterinary 24 45 75 55 0 32 Arts & Humanities 82 48 17 52 4 71 Business, Admin & Law 49 80 50 20 0 99 Education 74 51 25 49 2 92 Engineering, Manuf & Construction n a n a n a Health & Welfare n a n a n a Information & Comm Technologies n a n a n a Natural Sci , Mathematics & Statistics n a n a n a Social Sci , Jour nalism & Information 58 40 41 60 1 40 Vocational training 10 00 10 78 0 93 PhD graduates n a n a n a Graduates % Female Male Value Graduates from tertiary education 58 18 37 07 46 84 Health Indicator Unit Value Prevalence of gender violence in lifetime % women 8 20 Births attended by skilled personnel % live births 99 80 Mater nal mortality deaths per 100,000 live births 26 00 Total fertility rate births per woman 1 57 Indicator 0-1 (Equal rights) Value Reproductive autonomy Equal rights *Scores
optimal situation
Appendix A
B for detailed methodology, definitions, sources
periods. **For
indicators, except the two health indicators, parity is benchmarked at 1 In the case of sex ratio at birth the gender parity benchmark is set at 0 944 (see Klasen and Wink 2003) In the case of healthy life expectancy the gender parity benchmark is set at 1 06, given women's longer life expectancy
Inheritance
are on a 0 to 1 scale, where 1 represents the
or “parity” Please see
and
and
all
Global Gender Gap Index Indicators
Global Gender Gap Report 2023 93 Global Gender Gap Index 2023 Edition Australia score average score 0.740 Economy 0 991 E d u c a t i o n 0.968 Health 0 412 P o i t i c s Overview Index and Subindex 2023 Score Rank 2022 Score Rank Global Gender Gap Index 0 778 26th 0 738 43rd Economic Participation and Opportunity 0.740 38th 0 741 38th Educational Attainment 0 991 78th 0 985 87th Health and Survival 0 968 89th 0 968 90th Political Empowerment 0 412 29th 0 258 50th
2023 Indicator Rank Score* Difference F-M Min Max Economic Participation and Opportunity 38th 0 740 -Labour-force participation rate % 30th 0 867 -9 41 0-100 Wage equality for similar work 1-7 (best) 53rd 0 664Estimated ear ned income int'l $ 1,000 71st 0 643 -21 69 0-150 Legislators, senior officials and managers % 39th 0 658 -20 60 0-100 Professional and technical workers % 1st 1 000 16 57 0-100 Educational Attainment 78th 0.991 -Literacy rate % 1st 1 000Enrolment in primary education % 70th 0 999 -0 12 0-100 Enrolment in secondary education % 112th 0 962 -5 16 0-200 Enrolment in tertiary education % 1st 1 000 37 25 0-200 Health and Survival 89th 0 968 -Sex ratio at birth** % 1st 0 944Healthy life expectancy** years 98th 1 023Political Empowerment 29th 0 412 -Women in parliament % 31st 0 623 -23 20 0-100 Women in ministerial positions % 19th 0 769 -13 04 0-100 Years with female/male head of state (last 50) 46th 0 064 -43 98 0-50 Economy Profile Australia Score (imparity = 0 parity = 1) 0.778 Rank (out of 146 countries) 26th Index Edition 2023 Compare with Global average 0 1 Female vs Male Min Max70 64 61 2360 69 39 01 60 30 39 70 41 71 58 2998 60 98 48 136 97 131 81 95 91 133 16-61 60 38 40 56 52 43 48 46 99 3 01
Complementary Targets and Contextual Indicators 2023
Global Gender Gap Report 2023 94 Economy Profile Australia Score 0.778 Rank 26th Page 2 of 2
General indicators Indicator Unit Value GDP US$ billions 1,552 67 GDP per capita constant '17 intl $ 1000 49 77 Population sex ratio female/male 1 01 Population growth rate % 0 13 Indicator Million people Female Male Value Total population 13 18 13 00 26 18 Work participation and leadership Indicator Unit Value Gender pay gap % (OECD countries only) 15 31 Share of women's membership in boards % (OECD countries only) 34 80 Firms with female majority ownership % firms n a Firms with female top managers % firms n a Share of workers in informal sector % workers 26 10 Indicator 1-7 (best) Value Advancement of women to leadership roles 5 20 Indicator Unit Female Male Value Unemployed adults % of labour force (15-64) 3 70 3 87 3 79 Workers employed part-time % of employed people 58 59 35 80 46 57 Proportion of time spent on unpaid domestic and care work % n a n a n a Indicator Million people Female Male Value Labour-force 5 60 6 26 11 86 Access to finance Indicator 0-1 (Equal rights) Value Access to financial services Equal rights Inheritance rights for widows and daughters Equal rights Access to land assets Equal rights Access to non-land assets Equal rights Civil and political freedom Indicator Unit Value Year women received right to vote year n a Number of female heads of state to date number 1 Seats held in upper house % total seats 56 60 Indicator Yes/No Value Election list quotas for women, national Yes Party membership quotas, voluntary Yes Indicator 0-1 (Equal rights) Value Access to justice Equal rights Freedom of movement Equal rights Family and care Indicator Unit Value Public spending on family benefits % GPD 2 34 Unmet family planning % women 15-49 n a Early marriage % 0 60 Mean age of women at birth of first child years n a Indicator 0-1 (Equal rights) Value Right to divorce Equal rights Indicator Days Female Male Value Length of parental leave 0 14 00 126 00 Education and skills Graduates Attainment % Female Male Parity STEM Graduates n a n a n a Agri , Forestry, Fisheries & Veterinary n a n a n a Arts & Humanities 63 30 36 70 1 72 Business, Admin & Law 52 77 47 23 1 12 Education 79 45 20 55 3 87 Engineering, Manuf & Construction 23 23 76 77 0 30 Health & Welfare n a n a n a Information & Comm Technologies n a n a n a Natural Sci , Mathematics & Statistics 51 28 48 72 1 05 Social Sci , Jour nalism & Information 66 94 33 06 2 02 Vocational training 13 99 17 12 0 82 PhD graduates 1 38 1 78 1 58 Graduates % Female Male Value Graduates from tertiary education 79 19 55 44 67 13 Health Indicator Unit Value Prevalence of gender violence in lifetime % women 16 90 Births attended by skilled personnel % live births 98 80 Mater nal mortality deaths per 100,000 live births 6 00 Total fertility rate births per woman 1 58 Indicator 0-1 (Equal rights) Value Reproductive autonomy Equal rights *Scores are on a 0 to 1 scale, where 1 represents the optimal situation or “parity” Please see Appendix A and B for detailed methodology, definitions, sources and periods. **For all indicators, except the two health indicators, parity is benchmarked at 1 In the case of sex ratio at birth the gender parity benchmark is set at 0 944 (see Klasen and Wink 2003) In the case of healthy life expectancy the gender parity benchmark is set at 1 06, given women's longer life expectancy
Global Gender Gap Index Indicators
Global Gender Gap Report 2023 95 Global Gender Gap Index 2023 Edition Austria score average score 0.692 Economy 0 996 E d u c a t i o n 0.970 Health 0 303 P o i t i c s Overview Index and Subindex 2023 Score Rank 2022 Score Rank Global Gender Gap Index 0 740 47th 0 781 21st Economic Participation and Opportunity 0.692 74th 0 673 81st Educational Attainment 0 996 55th 0 994 61st Health and Survival 0 970 77th 0 970 82nd Political Empowerment 0 303 48th 0 487 16th
2023 Indicator Rank Score* Difference F-M Min Max Economic Participation and Opportunity 74th 0 692 -Labour-force participation rate % 44th 0 844 -10 34 0-100 Wage equality for similar work 1-7 (best) 79th 0 616Estimated ear ned income int'l $ 1,000 92nd 0 605 -26 77 0-150 Legislators, senior officials and managers % 67th 0 549 -29 10 0-100 Professional and technical workers % 73rd 0 971 -1 49 0-100 Educational Attainment 55th 0.996 -Literacy rate % 1st 1 000Enrolment in primary education % 1st 1 000 0 14 0-100 Enrolment in secondary education % 100th 0 982 -1 87 0-200 Enrolment in tertiary education % 1st 1 000 18 78 0-200 Health and Survival 77th 0 970 -Sex ratio at birth** % 1st 0 944Healthy life expectancy** years 90th 1 028Political Empowerment 48th 0 303 -Women in parliament % 25th 0 678 -19 20 0-100 Women in ministerial positions % 56th 0 333 -50 00 0-100 Years with female/male head of state (last 50) 62nd 0 024 -47 69 0-50 Economy Profile Austria Score (imparity = 0 parity = 1) 0.740 Rank (out of 146 countries) 47th Index Edition 2023 Compare with Global average 0 1 Female vs Male Min Max66 43 56 0967 71 40 94 64 55 35 45 50 74 49 2699 67 99 81 101 28 99 41 78 14 96 92-59 60 40 40 75 00 25 00 48 84 1 16
Complementary Targets and Contextual Indicators 2023
Global Gender Gap Report 2023 96 Economy Profile Austria Score 0.740 Rank 47th Page 2 of 2
General indicators Indicator Unit Value GDP US$ billions 480 37 GDP per capita constant '17 intl $ 1000 54 12 Population sex ratio female/male 1 03 Population growth rate % 0 44 Indicator Million people Female Male Value Total population 4 54 4 40 8 94 Work participation and leadership Indicator Unit Value Gender pay gap % (OECD countries only) 12 38 Share of women's membership in boards % (OECD countries only) 34 60 Firms with female majority ownership % firms 16 20 Firms with female top managers % firms 18 80 Share of workers in informal sector % workers 6 00 Indicator 1-7 (best) Value Advancement of women to leadership roles 5 07 Indicator Unit Female Male Value Unemployed adults % of labour force (15-64) 4 85 5 26 5 06 Workers employed part-time % of employed people 64 13 34 49 48 37 Proportion of time spent on unpaid domestic and care work % n a n a n a Indicator Million people Female Male Value Labour-force 1 95 2 20 4 15 Access to finance Indicator 0-1 (Equal rights) Value Access to financial services Equal rights Inheritance rights for widows and daughters Equal rights Access to land assets Equal rights Access to non-land assets Equal rights Civil and political freedom Indicator Unit Value Year women received right to vote year 1918 Number of female heads of state to date number 3 Seats held in upper house % total seats 41 00 Indicator Yes/No Value Election list quotas for women, national Yes Party membership quotas, voluntary Yes Indicator 0-1 (Equal rights) Value Access to justice Equal rights Freedom of movement Equal rights Family and care Indicator Unit Value Public spending on family benefits % GPD 2 51 Unmet family planning % women 15-49 n a Early marriage % 2 80 Mean age of women at birth of first child years 29 70 Indicator 0-1 (Equal rights) Value Right to divorce Equal rights Indicator Days Female Male Value Length of parental leave 112 00 30 00 365 00 Education and skills Graduates Attainment % Female Male Parity STEM Graduates 25 90 74 10 0 35 Agri , Forestry, Fisheries & Veterinary 46 92 53 08 0 88 Arts & Humanities n a n a n a Business, Admin & Law 57 02 42 98 1 33 Education 82 18 17 82 4 61 Engineering, Manuf & Construction 21 54 78 46 0 27 Health & Welfare 69 31 30 69 2 26 Information & Comm Technologies n a n a n a Natural Sci , Mathematics & Statistics n a n a n a Social Sci , Jour nalism & Information n a n a n a Vocational training 26 31 29 44 0 89 PhD graduates 0 81 1 25 1 02 Graduates % Female Male Value Graduates from tertiary education 46 12 30 31 37 93 Health Indicator Unit Value Prevalence of gender violence in lifetime % women 13 00 Births attended by skilled personnel % live births 98 10 Mater nal mortality deaths per 100,000 live births 5 00 Total fertility rate births per woman 1 44 Indicator 0-1 (Equal rights) Value Reproductive autonomy Equal rights *Scores
0
1 scale, where 1 represents the optimal situation or “parity” Please see Appendix A and B for detailed methodology, definitions, sources and periods. **For all indicators, except the two health indicators, parity is benchmarked at 1 In the case of sex ratio at birth the gender parity benchmark is set at 0 944 (see Klasen and Wink 2003) In the case of healthy life expectancy the gender parity benchmark is set at 1 06, given women's longer life expectancy
are on a
to
Global Gender Gap Index Indicators
Global Gender Gap Report 2023 97 Global Gender Gap Index 2023 Edition Azerbaijan score average score 0.766 Economy 0 996 E d u c a t i o n 0.936 Health 0 071 P o i t i c s Overview Index and Subindex 2023 Score Rank 2022 Score Rank Global Gender Gap Index 0 692 97th 0 687 101st Economic Participation and Opportunity 0.766 27th 0 744 36th Educational Attainment 0 996 54th 0 995 55th Health and Survival 0 936 146th 0 941 144th Political Empowerment 0 071 134th 0 069 135th
2023 Indicator Rank Score* Difference F-M Min Max Economic Participation and Opportunity 27th 0 766 -Labour-force participation rate % 8th 0 916 -5 90 0-100 Wage equality for similar work 1-7 (best) - - -Estimated ear ned income int'l $ 1,000 75th 0 637 -6 42 0-150 Legislators, senior officials and managers % 61st 0 567 -27 64 0-100 Professional and technical workers % 1st 1 000 15 93 0-100 Educational Attainment 54th 0.996 -Literacy rate % 60th 0 999Enrolment in primary education % 1st 1 000 0 47 0-100 Enrolment in secondary education % 98th 0 983 -1 56 0-200 Enrolment in tertiary education % 1st 1 000 6 83 0-200 Health and Survival 146th 0 936 -Sex ratio at birth** % 146th 0 885Healthy life expectancy** years 53rd 1 051Political Empowerment 134th 0 071 -Women in parliament % 106th 0 229 -62 80 0-100 Women in ministerial positions % 140th 0 000 -100 00 0-100 Years with female/male head of state (last 50) 80th 0 000 -50 00 0-50 Economy Profile Azerbaijan Score (imparity = 0 parity = 1) 0.692 Rank (out of 146 countries) 97th Index Edition 2023 Compare with Global average 0 1 Female vs Male Min Max70 10 64 2017 68 11 27 63 82 36 18 42 04 57 9688 55 89 02 94 40 92 85 35 02 41 86-81 40 18 60 100 00 0 50 00 0
Complementary Targets and Contextual Indicators 2023
Global Gender Gap Report 2023 98 Economy Profile Azerbaijan Score 0.692 Rank 97th Page 2 of 2
General indicators Indicator Unit Value GDP US$ billions 54 62 GDP per capita constant '17 intl $ 1000 14 43 Population sex ratio female/male 1 03 Population growth rate % 0 44 Indicator Million people Female Male Value Total population 5 25 5 11 10 36 Work participation and leadership Indicator Unit Value Gender pay gap % (OECD countries only) n a Share of women's membership in boards % (OECD countries only) n a Firms with female majority ownership % firms 10 50 Firms with female top managers % firms 16 50 Share of workers in informal sector % workers n a Indicator 1-7 (best) Value Advancement of women to leadership roles 4 97 Indicator Unit Female Male Value Unemployed adults % of labour force (15-64) 7 08 4 97 6 00 Workers employed part-time % of employed people 24 15 14 96 19 40 Proportion of time spent on unpaid domestic and care work % n a n a n a Indicator Million people Female Male Value Labour-force 2 30 2 38 4 68 Access to finance Indicator 0-1 (Equal rights) Value Access to financial services Near-equal rights Inheritance rights for widows and daughters Equal rights Access to land assets Equal rights Access to non-land assets Equal rights Civil and political freedom Indicator Unit Value Year women received right to vote year 1918 Number of female heads of state to date number 0 Seats held in upper house % total seats n a Indicator Yes/No Value Election list quotas for women, national n a Party membership quotas, voluntary n a Indicator 0-1 (Equal rights) Value Access to justice Near-equal rights Freedom of movement Equal rights Family and care Indicator Unit Value Public spending on family benefits % GPD n a Unmet family planning % women 15-49 n a Early marriage % 9 00 Mean age of women at birth of first child years 24 00 Indicator 0-1 (Equal rights) Value Right to divorce Near-equal rights Indicator Days Female Male Value Length of parental leave 126 00 0 1 04 Education and skills Graduates Attainment % Female Male Parity STEM Graduates 35 10 64 90 0 54 Agri , Forestry, Fisheries & Veterinary n a n a n a Arts & Humanities n a n a n a Business, Admin & Law 39 55 60 45 0 65 Education n a n a n a Engineering, Manuf & Construction n a n a n a Health & Welfare n a n a n a Information & Comm Technologies n a n a n a Natural Sci , Mathematics & Statistics 65 34 34 66 1 88 Social Sci , Jour nalism & Information 57 08 42 92 1 33 Vocational training 14 15 13 54 1 05 PhD graduates n a n a n a Graduates % Female Male Value Graduates from tertiary education 24 16 22 28 23 18 Health Indicator Unit Value Prevalence of gender violence in lifetime % women 13 50 Births attended by skilled personnel % live births 99 90 Mater nal mortality deaths per 100,000 live births 26 00 Total fertility rate births per woman 1 70 Indicator 0-1 (Equal rights) Value Reproductive autonomy Equal rights *Scores
optimal situation
parity
detailed methodology, definitions, sources
periods. **For
indicators,
two health indicators, parity is benchmarked at 1 In the case of sex ratio at birth the gender parity benchmark is set at 0 944 (see Klasen and Wink 2003) In the case of healthy life expectancy the gender parity benchmark is set at 1 06, given women's longer life expectancy
are on a 0 to 1 scale, where 1 represents the
or “
” Please see Appendix A and B for
and
all
except the
Global Gender Gap Index Indicators
Global Gender Gap Report 2023 99 Global Gender Gap Index 2023 Edition Bahrain score average score 0.564 Economy 0 995 E d u c a t i o n 0.959 Health 0 146 P o i t i c s Overview Index and Subindex 2023 Score Rank 2022 Score Rank Global Gender Gap Index 0 666 113th 0 632 131st Economic Participation and Opportunity 0.564 122nd 0 507 131st Educational Attainment 0 995 57th 0 995 54th Health and Survival 0 959 136th 0 959 134th Political Empowerment 0 146 99th 0 066 137th
2023 Indicator Rank Score* Difference F-M Min Max Economic Participation and Opportunity 122nd 0 564 -Labour-force participation rate % 128th 0 501 -43 40 0-100 Wage equality for similar work 1-7 (best) 23rd 0 728Estimated ear ned income int'l $ 1,000 82nd 0 628 -21 39 0-150 Legislators, senior officials and managers % 116th 0 275 -56 88 0-100 Professional and technical workers % 120th 0 483 -34 84 0-100 Educational Attainment 57th 0.995 -Literacy rate % 1st 1 000Enrolment in primary education % 86th 0 990 -0 97 0-100 Enrolment in secondary education % 1st 1 000 8 30 0-200 Enrolment in tertiary education % 1st 1 000 34 24 0-200 Health and Survival 136th 0 959 -Sex ratio at birth** % 1st 0 944Healthy life expectancy** years 142nd 0 993Political Empowerment 99th 0 146 -Women in parliament % 96th 0 250 -60 00 0-100 Women in ministerial positions % 66th 0 278 -56 52 0-100 Years with female/male head of state (last 50) 80th 0 000 -50 00 0-50 Economy Profile Bahrain Score (imparity = 0 parity = 1) 0.666 Rank (out of 146 countries) 113th Index Edition 2023 Compare with Global average 0 1 Female vs Male Min Max86 94 43 5457 53 36 13 78 44 21 56 67 42 32 5898 13 97 17 93 23 101 52 48 94 83 18-80 00 20 00 78 26 21 74 50 00 0
Complementary Targets and Contextual Indicators 2023
Access
Global Gender Gap Report 2023 100 Economy Profile Bahrain Score 0.666 Rank 113th Page 2 of 2
indicators Indicator Unit Value GDP US$ billions 38 87 GDP per capita constant '17 intl $ 1000 49 39 Population sex ratio female/male 0 61 Population growth rate % -0 97 Indicator Million people Female Male Value Total population 0 56 0 91 1 47 Work participation and leadership Indicator Unit Value Gender pay gap % (OECD countries only) n a Share of women's membership in boards % (OECD countries only) n a Firms with female majority ownership % firms n a Firms with female top managers % firms n a Share of workers in informal sector % workers n a Indicator 1-7 (best) Value Advancement of women to leadership roles 5 51 Indicator Unit Female Male Value
adults % of labour force (15-64) n a n a n a Workers employed part-time % of employed people n a n a n a Proportion of time spent on unpaid domestic and care work % n a n a n a Indicator Million people Female Male Value Labour-force 0 15 0 55 0 70 Access to finance Indicator 0-1 (Equal rights) Value
to financial services Near-equal rights
General
Unemployed
Access
Unequal rights
Inheritance rights for widows and daughters
to land assets Near-equal rights
Near-equal rights Civil and political freedom Indicator Unit Value Year women received right to vote year 1951, 1973, 2002 Number of female heads of state to date number 0 Seats held in upper house % total seats 25 00 Indicator Yes/No Value Election list quotas for women, national n a Party membership quotas, voluntary n a Indicator 0-1 (Equal rights) Value Access to justice Restricted rights Freedom of movement Restricted rights Family and care Indicator Unit Value Public spending on family benefits % GPD n a Unmet family planning % women 15-49 n a Early marriage % 5 50 Mean age of women at birth of first child years n a Indicator 0-1
rights) Value Right
Unequal rights Indicator Days Female Male Value Length of parental leave 60 00 1 00 0 Education and skills Graduates Attainment % Female Male Parity STEM Graduates 41 21 58 79 0 70
n a n a n a Arts & Humanities n a n a n a Business, Admin & Law 62 17 37 83 1 64 Education 82 44 17 56 4 69 Engineering, Manuf & Construction 30 57 69 43 0 44 Health & Welfare 73 18 26 82 2 73 Information & Comm Technologies 47 14 52 86 0 89 Natural Sci
Mathematics & Statistics n a n a n a Social Sci , Jour nalism & Information n a n a n a Vocational training 0 88 5 59 0 16 PhD graduates 0 22 0 29 0 26 Graduates % Female Male Value Graduates from tertiary education 49 88 20 50 32 28
Value Prevalence
lifetime % women n a Births
% live births 99 60 Mater
mortality deaths per 100,000 live births 14 00 Total fertility rate births per woman 1 83
Value Reproductive autonomy Equal rights *Scores
on a 0
1 scale,
1 represents the optimal situation or “parity” Please see Appendix A and B for detailed methodology, definitions, sources and periods.
Access to non-land assets
(Equal
to divorce
Agri , Forestry, Fisheries & Veterinary
,
Health Indicator Unit
of gender violence in
attended by skilled personnel
nal
Indicator 0-1 (Equal rights)
are
to
where
**For all indicators, except the two health indicators, parity is benchmarked at 1 In the case of sex ratio at birth the gender parity benchmark is set at 0 944 (see Klasen and Wink 2003) In the case of healthy life expectancy the gender parity benchmark is set at 1 06, given women's longer life expectancy
Global Gender Gap Index Indicators
Global Gender Gap Report 2023 101 Global Gender Gap Index 2023 Edition Bangladesh score average score 0.438 Economy 0 936 E d u c a t i o n 0.962 Health 0 552 P o i t i c s Overview Index and Subindex 2023 Score Rank 2022 Score Rank Global Gender Gap Index 0 722 59th 0 714 71st Economic Participation and Opportunity 0.438 139th 0 427 141st Educational Attainment 0 936 122nd 0 923 123rd Health and Survival 0 962 126th 0 962 129th Political Empowerment 0 552 7th 0 546 9th
2023 Indicator Rank Score* Difference F-M Min Max Economic Participation and Opportunity 139th 0 438 -Labour-force participation rate % 132nd 0 451 -44 32 0-100 Wage equality for similar work 1-7 (best) 102nd 0 588Estimated ear ned income int'l $ 1,000 129th 0 438 -4 64 0-150 Legislators, senior officials and managers % 136th 0 120 -78 52 0-100 Professional and technical workers % 125th 0 421 -40 70 0-100 Educational Attainment 122nd 0.936 -Literacy rate % 109th 0 925Enrolment in primary education % - - -Enrolment in secondary education % 1st 1 000 21 09 0-200 Enrolment in tertiary education % 116th 0 833 -4 56 0-200 Health and Survival 126th 0 962 -Sex ratio at birth** % 1st 0 944Healthy life expectancy** years 136th 1 002Political Empowerment 7th 0 552 -Women in parliament % 91st 0 264 -58 20 0-100 Women in ministerial positions % 123rd 0 111 -80 00 0-100 Years with female/male head of state (last 50) 1st 1 000 8 61 0-50 Economy Profile Ban ladesh Score (imparity = 0 parity = 1) 0.722 Rank (out of 146 countries) 59th Index Edition 2023 Compare with Global average 0 1 Female vs Male Min Max80 67 36 358 25 3 61 89 26 10 74 70 35 29 65-65 19 86 27 27 34 22 78-79 10 20 90 90 00 10 00 20 69 29 31
Complementary Targets and Contextual Indicators 2023
Global Gender Gap Report 2023 102 Economy Profile Bangladesh Score 0.722 Rank 59th Page 2 of 2
General indicators Indicator Unit Value GDP US$ billions 416 26 GDP per capita constant '17 intl $ 1000 5 91 Population sex ratio female/male 1 02 Population growth rate % 1 15 Indicator Million people Female Male Value Total population 86 33 84 86 171 19 Work participation and leadership Indicator Unit Value Gender pay gap % (OECD countries only) n a Share of women's membership in boards % (OECD countries only) n a Firms with female majority ownership % firms 2 50 Firms with female top managers % firms 4 80 Share of workers in informal sector % workers 94 70 Indicator 1-7 (best) Value Advancement of women to leadership roles 4 12 Indicator Unit Female Male Value Unemployed adults % of labour force (15-64) 6 78 3 49 4 55 Workers employed part-time % of employed people 40 69 10 06 19 45 Proportion of time spent on unpaid domestic and care work % n a n a n a Indicator Million people Female Male Value Labour-force 16 32 36 18 52 50 Access to finance Indicator 0-1 (Equal rights) Value Access to financial services Near-equal rights
rights for widows and daughters Unequal rights Access to land assets Uneven rights Access to non-land assets Uneven rights Civil and political freedom Indicator Unit Value Year women received right to vote year 1937, 1972 Number of female heads of state to date number 2 Seats held in upper house % total seats n a Indicator Yes/No Value Election list quotas for women, national Yes Party membership quotas, voluntary Yes Indicator 0-1 (Equal rights) Value Access to justice Restricted rights Freedom of movement Equal rights Family and care Indicator Unit Value Public spending on family benefits % GPD n a Unmet family planning % women 15-49 13 69 Early marriage % 45 20 Mean age of women at birth of first child years n a Indicator 0-1 (Equal rights) Value Right to divorce Unequal rights Indicator Days Female Male Value Length of parental leave 112 00 0 0 Education and skills Graduates Attainment % Female Male Parity STEM Graduates n a n a n a Agri , Forestry, Fisheries & Veterinary 21 19 78 81 0 27 Arts & Humanities 33 15 66 85 0 50 Business, Admin & Law 26 16 73 84 0 35 Education 22 03 77 97 0 28 Engineering, Manuf & Construction 46 05 53 95 0 85 Health & Welfare 25 26 74 74 0 34 Information & Comm Technologies 27 25 72 75 0 37 Natural Sci , Mathematics & Statistics 14 92 85 08 0 18 Social Sci , Jour nalism & Information 27 78 72 22 0 38 Vocational training 1 82 4 73 0 39 PhD graduates 0 17 0 32 0 25 Graduates % Female Male Value Graduates from tertiary education n a n a n a Health Indicator Unit Value Prevalence of gender violence in lifetime % women 53 30 Births attended by skilled personnel % live births 59 00 Mater nal mortality deaths per 100,000 live births 173 00 Total fertility rate births per woman 2 00 Indicator 0-1 (Equal rights) Value Reproductive autonomy Restricted rights *Scores
**For
two health indicators, parity is benchmarked at 1 In the case of sex ratio at birth the gender parity benchmark is set at 0 944 (see Klasen and Wink 2003) In the case of healthy life expectancy the gender parity benchmark is set at 1 06, given women's longer life expectancy
Inheritance
are on a 0 to 1 scale, where 1 represents the optimal situation or “parity” Please see Appendix A and B for detailed methodology, definitions, sources and periods.
all indicators, except the
Global Gender Gap Index Indicators
Global Gender Gap Report 2023 103 Global Gender Gap Index 2023 Edition Barbados score average score 0.860 Economy 0 994 E d u c a t i o n 0.968 Health 0 256 P o i t i c s Overview Index and Subindex 2023 Score Rank 2022 Score Rank Global Gender Gap Index 0 769 31st 0 765 30th Economic Participation and Opportunity 0.860 4th 0 832 3rd Educational Attainment 0 994 65th 0 993 67th Health and Survival 0 968 92nd 0 968 92nd Political Empowerment 0 256 58th 0 266 49th
2023 Indicator Rank Score* Difference F-M Min Max Economic Participation and Opportunity 4th 0 860 -Labour-force participation rate % 12th 0 896 -6 84 0-100 Wage equality for similar work 1-7 (best) 33rd 0 712Estimated ear ned income int'l $ 1,000 5th 0 881 -1 74 0-150 Legislators, senior officials and managers % 13th 0 971 -1 46 0-100 Professional and technical workers % 1st 1 000 15 33 0-100 Educational Attainment 65th 0.994 -Literacy rate % 1st 1 000Enrolment in primary education % 93rd 0 988 -1 15 0-100 Enrolment in secondary education % 1st 1 000 2 67 0-200 Enrolment in tertiary education % - - -Health and Survival 92nd 0 968 -Sex ratio at birth** % 1st 0 944Healthy life expectancy** years 102nd 1 022Political Empowerment 58th 0 256 -Women in parliament % 74th 0 364 -46 60 0-100 Women in ministerial positions % 56th 0 333 -50 00 0-100 Years with female/male head of state (last 50) 27th 0 137 -37 97 0-50 Economy Profile Barbados Score (imparity = 0 parity = 1) 0.769 Rank (out of 146 countries) 31st Index Edition 2023 Compare with Global average 0 1 Female vs Male Min Max65 87 59 0314 66 12 92 50 73 49 27 42 33 57 6696 28 95 13 104 17 106 84--73 30 26 70 75 00 25 00 43 98 6 02
Complementary Targets and Contextual Indicators 2023
Family
Indicator
Public
Unmet
Agri
Inheritance
Access
Graduates
Indicator
Global Gender Gap Report 2023 104 Economy Profile Barbados Score 0.769 Rank 31st Page 2 of 2
General indicators Indicator Unit Value GDP US$ billions 4 84 GDP per capita constant '17 intl $ 1000 13 75 Population sex ratio female/male 1 09 Population growth rate % 0 18 Indicator Million people Female Male Value Total population 0 15 0 14 0 28 Work participation and leadership Indicator Unit Value Gender pay gap % (OECD countries only) n a Share of women's membership in boards % (OECD countries only) n a Firms with female majority ownership % firms n a Firms with female top managers % firms n a Share of workers in informal sector % workers 62 00 Indicator 1-7 (best) Value Advancement of women to leadership roles 5 10 Indicator Unit Female Male Value Unemployed adults % of labour force (15-64) 7 48 9 93 8 71 Workers employed part-time % of employed people 11 69 9 52 10 60 Proportion of time spent on unpaid domestic and care work % n a n a n a Indicator Million people Female Male Value Labour-force 0 06 0 06 0 12 Access to finance Indicator 0-1 (Equal rights) Value Access to financial services Near-equal rights
rights for widows and daughters Equal rights
to land assets Equal rights
to non-land assets Equal rights Civil and political freedom Indicator Unit Value Year women received right to vote year 1950 Number of female heads of state to date number 3 Seats held in upper house % total seats 42 10 Indicator Yes/No Value Election list quotas for women, national n a Party membership quotas, voluntary n a Indicator 0-1 (Equal rights) Value Access to justice Equal rights Freedom of movement Restricted rights
Access
and care
Unit Value
spending on family benefits % GPD n a
family planning % women 15-49 n a
marriage % 0
age of women at birth of first child years n a
rights) Value
Equal rights
Days Female Male Value Length
leave 84 00 0 0
and skills
% Female Male Parity STEM Graduates n a n a n a
Early
Mean
Indicator 0-1 (Equal
Right to divorce
Indicator
of parental
Education
Graduates Attainment
n a n a n a
n a n a n a
, Forestry, Fisheries & Veterinary
Arts & Humanities
n a n a n a Education n a n a n a
n a n a n a Health & Welfare n a n a n a
Technologies n a n a n a
Business, Admin & Law
Engineering, Manuf & Construction
Information & Comm
n a n a n a
n a n a n a
n a n a n a PhD graduates n a n a n a Graduates % Female Male Value
Natural Sci , Mathematics & Statistics
Social Sci , Jour nalism & Information
Vocational training
from tertiary education n a n a n a Health
Unit Value
of gender violence in lifetime % women n a Births attended by skilled personnel % live births 98 40 Mater nal mortality deaths per 100,000 live births 27 00 Total fertility rate births per woman 1 63
0-1 (Equal rights) Value
autonomy Near-equal rights
optimal
de
**For
two health indicators, parity is benchmarked at 1
the case of sex ratio at birth the gender parity benchmark is set at 0 944 (see Klasen and Wink 2003) In the case of healthy life expectancy the gender parity benchmark is set at 1 06, given women's longer life expectancy
Prevalence
Indicator
Reproductive
*Scores are on a 0 to 1 scale, where 1 represents the
situation or “parity” Please see Appendix A and B for detailed methodology,
finitions, sources and periods.
all indicators, except the
In
Global Gender Gap Index Indicators
Global Gender Gap Report 2023 105 Global Gender Gap Index 2023 Edition Belarus score average score 0.819 Economy 0 991 E d u c a t i o n 0.980 Health 0 217 P o i t i c s Overview Index and Subindex 2023 Score Rank 2022 Score Rank Global Gender Gap Index 0 752 41st 0 750 36th Economic Participation and Opportunity 0.819 7th 0 818 4th Educational Attainment 0 991 75th 0 990 77th Health and Survival 0 980 1st 0 977 44th Political Empowerment 0 217 69th 0 216 69th
2023 Indicator Rank Score* Difference F-M Min Max Economic Participation and Opportunity 7th 0 819 -Labour-force participation rate % 24th 0 878 -9 14 0-100 Wage equality for similar work 1-7 (best) - - -Estimated ear ned income int'l $ 1,000 87th 0 618 -9 52 0-150 Legislators, senior officials and managers % 15th 0 893 -5 65 0-100 Professional and technical workers % 1st 1 000 40 31 0-100 Educational Attainment 75th 0.991 -Literacy rate % 1st 1 000Enrolment in primary education % 92nd 0 988 -1 09 0-100 Enrolment in secondary education % 96th 0 985 -1 59 0-200 Enrolment in tertiary education % 1st 1 000 11 32 0-200 Health and Survival 1st 0 980 -Sex ratio at birth** % 1st 0 944Healthy life expectancy** years 1st 1 060Political Empowerment 69th 0 217 -Women in parliament % 26th 0 667 -20 00 0-100 Women in ministerial positions % 138th 0 043 -91 67 0-100 Years with female/male head of state (last 50) 80th 0 000 -50 00 0-50 Economy Profile Belarus Score (imparity = 0 parity = 1) 0.752 Rank (out of 146 countries) 41st Index Edition 2023 Compare with Global average 0 1 Female vs Male Min Max74 91 65 7724 89 15 37 52 82 47 18 29 85 70 1594 13 93 04 105 42 103 83 76 74 88 06-60 00 40 00 95 83 4 17 50 00 0
Complementary Targets and Contextual Indicators 2023
Global Gender Gap Report 2023 106 Economy Profile Belarus Score 0.752 Rank 41st Page 2 of 2
General indicators Indicator Unit Value GDP US$ billions 68 21 GDP per capita constant '17 intl $ 1000 19 75 Population sex ratio female/male 1 17 Population growth rate % -0 42 Indicator Million people Female Male Value Total population 5 14 4 39 9 54 Work participation and leadership Indicator Unit Value Gender pay gap % (OECD countries only) n a Share of women's membership in boards % (OECD countries only) n a Firms with female majority ownership % firms 19 20 Firms with female top managers % firms 21 10 Share of workers in informal sector % workers n a Indicator 1-7 (best) Value Advancement of women to leadership roles n a Indicator Unit Female Male Value Unemployed adults % of labour force (15-64) 3 06 4 70 3 88 Workers employed part-time % of employed people 23 77 7 96 15 83 Proportion of time spent on unpaid domestic and care work % 19 17 9 51 n a Indicator Million people Female Male Value Labour-force 2 34 2 32 4 66 Access to finance Indicator 0-1 (Equal rights) Value Access to financial services Equal rights Inheritance rights for widows and daughters Equal rights Access to land assets Equal rights Access to non-land assets Equal rights Civil and political freedom Indicator Unit Value Year women received right to vote year 1991 Number of female heads of state to date number 0 Seats held in upper house % total seats 25 00 Indicator Yes/No Value Election list quotas for women, national n a Party membership quotas, voluntary n a Indicator 0-1 (Equal rights) Value Access to justice Near-equal rights Freedom of movement Equal rights Family and care Indicator Unit Value Public spending on family benefits % GPD n a Unmet family planning % women 15-49 17 50 Early marriage % 8 40 Mean age of women at birth of first child years 26 80 Indicator 0-1 (Equal rights) Value Right to divorce Equal rights Indicator Days Female Male Value Length of parental leave 126 00 0 1 10 Education and skills Graduates Attainment % Female Male Parity STEM Graduates n a n a n a Agri , Forestry, Fisheries & Veterinary 55 28 44 72 1 24 Arts & Humanities 76 06 23 94 3 18 Business, Admin & Law 71 05 28 95 2 45 Education 75 84 24 16 3 14 Engineering, Manuf & Construction 23 21 76 79 0 30 Health & Welfare n a n a n a Information & Comm Technologies 23 04 76 96 0 30 Natural Sci , Mathematics & Statistics n a n a n a Social Sci , Jour nalism & Information 78 94 21 06 3 75 Vocational training 16 50 20 05 0 82 PhD graduates 0 26 0 35 0 30 Graduates % Female Male Value Graduates from tertiary education 76 91 58 09 67 23 Health Indicator Unit Value Prevalence of gender violence in lifetime % women 25 00 Births attended by skilled personnel % live births 99 90 Mater nal mortality deaths per 100,000 live births 2 00 Total fertility rate births per woman 1 38 Indicator 0-1 (Equal rights) Value Reproductive autonomy Equal rights *Scores are on a 0 to 1 scale, where 1 represents the optimal situation or “parity” Please see Appendix A and B for detailed methodology, definitions, sources and periods. **For all indicators, except the two health indicators, parity is benchmarked at 1 In the case of sex ratio at birth the gender parity benchmark is set at 0 944 (see Klasen and Wink 2003) In the case of healthy life expectancy the gender parity benchmark is set at 1 06, given women's longer life expectancy
Global Gender Gap Index Indicators
Global Gender Gap Report 2023 107 Global Gender Gap Index 2023 Edition Belgium score average score 0.728 Economy 1 000 E d u c a t i o n 0.968 Health 0 486 P o i t i c s Overview Index and Subindex 2023 Score Rank 2022 Score Rank Global Gender Gap Index 0 796 10th 0 793 14th Economic Participation and Opportunity 0.728 44th 0 723 52nd Educational Attainment 1 000 1st 1 000 1st Health and Survival 0 968 91st 0 968 91st Political Empowerment 0 486 16th 0 480 18th
2023 Indicator Rank Score* Difference F-M Min Max Economic Participation and Opportunity 44th 0 728 -Labour-force participation rate % 42nd 0 847 -9 07 0-100 Wage equality for similar work 1-7 (best) 48th 0 677Estimated ear ned income int'l $ 1,000 63rd 0 665 -20 87 0-150 Legislators, senior officials and managers % 68th 0 548 -29 18 0-100 Professional and technical workers % 1st 1 000 4 13 0-100 Educational Attainment 1st 1.000 -Literacy rate % 1st 1 000Enrolment in primary education % 1st 1 000 1 21 0-100 Enrolment in secondary education % 1st 1 000 18 57 0-200 Enrolment in tertiary education % 1st 1 000 23 90 0-200 Health and Survival 91st 0 968 -Sex ratio at birth** % 1st 0 944Healthy life expectancy** years 101st 1 022Political Empowerment 16th 0 486 -Women in parliament % 18th 0 745 -14 60 0-100 Women in ministerial positions % 1st 1 000 14 29 0-100 Years with female/male head of state (last 50) 65th 0 019 -48 14 0-50 Economy Profile Belgium Score (imparity = 0 parity = 1) 0.796 Rank (out of 146 countries) 10th Index Edition 2023 Compare with Global average 0 1 Female vs Male Min Max59 11 50 0462 30 41 43 64 59 35 41 47 94 52 0798 27 99 48 142 54 161 11 69 26 93 16-57 30 42 70 42 86 57 14 49 07 0 93
Complementary Targets and Contextual Indicators 2023
Global Gender Gap Report 2023 108 Economy Profile Belgium Score 0.796 Rank 10th Page 2 of 2
General indicators Indicator Unit Value GDP US$ billions 594 1 GDP per capita constant '17 intl $ 1000 51 74 Population sex ratio female/male 1 02 Population growth rate % 0 47 Indicator Million people Female Male Value Total population 5 90 5 76 11 66 Work participation and leadership Indicator Unit Value Gender pay gap % (OECD countries only) 3 80 Share of women's membership in boards % (OECD countries only) 37 90 Firms with female majority ownership % firms 11 80 Firms with female top managers % firms 17 90 Share of workers in informal sector % workers 3 30 Indicator 1-7 (best) Value Advancement of women to leadership roles 5 00 Indicator Unit Female Male Value Unemployed adults % of labour force (15-64) 5 30 5 90 5 60 Workers employed part-time % of employed people 56 20 30 98 42 82 Proportion of time spent on unpaid domestic and care work % 15 90 10 07 n a Indicator Million people Female Male Value Labour-force 2 29 2 58 4 87 Access to finance Indicator 0-1 (Equal rights) Value Access to financial services Equal rights Inheritance rights for widows and daughters Equal rights Access to land assets Equal rights Access to non-land assets Equal rights Civil and political freedom Indicator Unit Value Year women received right to vote year 1919, 1948 Number of female heads of state to date number 1 Seats held in upper house % total seats 45 00 Indicator Yes/No Value Election list quotas for women, national Yes Party membership quotas, voluntary Yes Indicator 0-1 (Equal rights) Value Access to justice Equal rights Freedom of movement Equal rights Family and care Indicator Unit Value Public spending on family benefits % GPD 2 77 Unmet family planning % women 15-49 n a Early marriage % 2 20 Mean age of women at birth of first child years 29 20 Indicator 0-1 (Equal rights) Value Right to divorce Equal rights Indicator Days Female Male Value Length of parental leave 105 00 21 00 0 Education and skills Graduates Attainment % Female Male Parity STEM Graduates 25 83 74 17 0 35 Agri , Forestry, Fisheries & Veterinary 62 13 37 87 1 64 Arts & Humanities 62 55 37 45 1 67 Business, Admin & Law 54 12 45 88 1 18 Education 77 49 22 51 3 44 Engineering, Manuf & Construction 23 40 76 60 0 31 Health & Welfare 75 63 24 37 3 10 Information & Comm Technologies 9 88 90 12 0 11 Natural Sci , Mathematics & Statistics n a n a n a Social Sci , Jour nalism & Information 70 34 29 66 2 37 Vocational training 22 02 26 44 0 83 PhD graduates 0 43 0 79 0 60 Graduates % Female Male Value Graduates from tertiary education 69 00 43 33 55 81 Health Indicator Unit Value Prevalence of gender violence in lifetime % women 24 00 Births attended by skilled personnel % live births n a Mater nal mortality deaths per 100,000 live births 5 00 Total fertility rate births per woman 1 55 Indicator 0-1 (Equal rights) Value Reproductive autonomy Equal rights *Scores
benchmarked
sex ratio
birth
gender parity benchmark is set at 0 944 (see Klasen and Wink 2003)
the case of healthy life
gender parity benchmark
set at
longer life expectancy
are on a 0 to 1 scale, where 1 represents the optimal situation or “parity” Please see Appendix A and B for detailed methodology, definitions, sources and periods. **For all indicators, except the two health indicators, parity is
at 1 In the case of
at
the
In
expectancy the
is
1 06, given women's
Global Gender Gap Index Indicators
Global Gender Gap Report 2023 109 Global Gender Gap Index 2023 Edition Belize score average score 0.720 Economy 0 996 E d u c a t i o n 0.980 Health 0 090 P o i t i c s Overview Index and Subindex 2023 Score Rank 2022 Score Rank Global Gender Gap Index 0 696 89th 0 695 95th Economic Participation and Opportunity 0.720 49th 0 727 48th Educational Attainment 0 996 52nd 0 997 45th Health and Survival 0 980 1st 0 980 1st Political Empowerment 0 090 126th 0 075 133rd
2023 Indicator Rank Score* Difference F-M Min Max Economic Participation and Opportunity 49th 0 720 -Labour-force participation rate % 114th 0 642 -27 05 0-100 Wage equality for similar work 1-7 (best) - - -Estimated ear ned income int'l $ 1,000 54th 0 682 -3 31 0-150 Legislators, senior officials and managers % 41st 0 650 -21 19 0-100 Professional and technical workers % 1st 1 000 1 60 0-100 Educational Attainment 52nd 0.996 -Literacy rate % - - -Enrolment in primary education % 82nd 0 994 -0 58 0-100 Enrolment in secondary education % 1st 1 000 2 55 0-200 Enrolment in tertiary education % 1st 1 000 11 64 0-200 Health and Survival 1st 0 980 -Sex ratio at birth** % 1st 0 944Healthy life expectancy** years 1st 1 060Political Empowerment 126th 0 090 -Women in parliament % 116th 0 185 -68 80 0-100 Women in ministerial positions % 113th 0 133 -76 47 0-100 Years with female/male head of state (last 50) 80th 0 000 -50 00 0-50 Economy Profile Belize Score (imparity = 0 parity = 1) 0.696 Rank (out of 146 countries) 89th Index Edition 2023 Compare with Global average 0 1 Female vs Male Min Max75 61 48 5610 41 7 10 60 61 39 42 49 20 50 8091 93 91 35 86 97 89 52 17 42 29 06-84 40 15 60 88 24 11 77 50 00 0
Complementary Targets and Contextual Indicators 2023
Global Gender Gap Report 2023 110 Economy Profile Belize Score 0.696 Rank 89th Page 2 of 2
General indicators Indicator Unit Value GDP US$ billions 2 49 GDP per capita constant '17 intl $ 1000 8 76 Population sex ratio female/male 0 99 Population growth rate % 1 29 Indicator Million people Female Male Value Total population 0 20 0 20 0 41 Work participation and leadership Indicator Unit Value Gender pay gap % (OECD countries only) n a Share of women's membership in boards % (OECD countries only) n a Firms with female majority ownership % firms n a Firms with female top managers % firms n a Share of workers in informal sector % workers n a Indicator 1-7 (best) Value Advancement of women to leadership roles n a Indicator Unit Female Male Value Unemployed adults % of labour force (15-64) 15 44 7 03 10 43 Workers employed part-time % of employed people 44 38 34 75 38 39 Proportion of time spent on unpaid domestic and care work % n a n a n a Indicator Million people Female Male Value Labour-force 0 06 0 09 0 14 Access to finance Indicator 0-1 (Equal rights) Value Access to financial services Equal rights Inheritance rights for widows and daughters Equal rights Access to land assets Equal rights Access to non-land assets Equal rights Civil and political freedom Indicator Unit Value Year women received right to vote year 1954, 1981 Number of female heads of state to date number 0 Seats held in upper house % total seats 42 90 Indicator Yes/No Value Election list quotas for women, national n a Party membership quotas, voluntary n a Indicator 0-1 (Equal rights) Value Access to justice Equal rights Freedom of movement Restricted rights Family and care Indicator Unit Value Public spending on family benefits % GPD n a Unmet family planning % women 15-49 22 25 Early marriage % 17 50 Mean age of women at birth of first child years n a Indicator 0-1 (Equal rights) Value Right to divorce Equal rights Indicator Days Female Male Value Length of parental leave 98 00 0 0 Education and skills Graduates Attainment % Female Male Parity STEM Graduates 41 83 58 17 0 72 Agri , Forestry, Fisheries & Veterinary 35 29 64 71 0 55 Arts & Humanities 71 43 28 57 2 50 Business, Admin & Law 68 63 31 37 2 19 Education 83 27 16 73 4 98 Engineering, Manuf & Construction 9 09 90 91 0 10 Health & Welfare 69 86 30 14 2 32 Information & Comm Technologies 19 44 80 56 0 24 Natural Sci , Mathematics & Statistics 52 83 47 17 1 12 Social Sci , Jour nalism & Information 69 81 30 19 2 31 Vocational training 3 27 3 71 0 88 PhD graduates n a n a n a Graduates % Female Male Value Graduates from tertiary education 9 56 3 98 6 77 Health Indicator Unit Value Prevalence of gender violence in lifetime % women n a Births attended by skilled personnel % live births 94 60 Mater nal mortality deaths per 100,000 live births 36 00 Total fertility rate births per woman 2 00 Indicator 0-1 (Equal rights) Value Reproductive autonomy Restricted rights *Scores
0
1
1 represents the optimal situation
parity
Please see Appendix A
B for detailed methodology, definitions, sources and periods. **For all indicators, except the two health indicators, parity is benchmarked at 1 In the case of sex ratio at birth the gender parity benchmark is set at 0 944 (see Klasen and Wink 2003) In the case of healthy life expectancy the gender parity benchmark is set at 1 06, given women's longer life expectancy
are on a
to
scale, where
or “
”
and
Global Gender Gap Index Indicators
Global Gender Gap Report 2023 111 Global Gender Gap Index 2023 Edition Benin score average score 0.530 Economy 0 802 E d u c a t i o n 0.973 Health 0 159 P o i t i c s Overview Index and Subindex 2023 Score Rank 2022 Score Rank Global Gender Gap Index 0 616 138th 0 612 138th Economic Participation and Opportunity 0.530 129th 0 596 114th Educational Attainment 0 802 139th 0 790 138th Health and Survival 0 973 61st 0 973 65th Political Empowerment 0 159 92nd 0 090 126th
2023 Indicator Rank Score* Difference F-M Min Max Economic Participation and Opportunity 129th 0 530 -Labour-force participation rate % 63rd 0 812 -13 11 0-100 Wage equality for similar work 1-7 (best) 61st 0 651Estimated ear ned income int'l $ 1,000 115th 0 516 -2 12 0-150 Legislators, senior officials and managers % 129th 0 159 -72 51 0-100 Professional and technical workers % 138th 0 235 -61 97 0-100 Educational Attainment 139th 0.802 -Literacy rate % 140th 0 615Enrolment in primary education % 104th 0 940 -5 72 0-100 Enrolment in secondary education % 134th 0 832 -8 80 0-200 Enrolment in tertiary education % 131st 0 514 -7 09 0-200 Health and Survival 61st 0 973 -Sex ratio at birth** % 1st 0 944Healthy life expectancy** years 71st 1 039Political Empowerment 92nd 0 159 -Women in parliament % 79th 0 346 -48 60 0-100 Women in ministerial positions % 86th 0 211 -65 22 0-100 Years with female/male head of state (last 50) 80th 0 000 -50 00 0-50 Economy Profile Benin Score (imparity = 0 parity = 1) 0.616 Rank (out of 146 countries) 138th Index Edition 2023 Compare with Global average 0 1 Female vs Male Min Max69 73 56 624 38 2 26 86 25 13 75 80 98 19 0296 09 90 38 52 25 43 45 14 60 7 51-74 30 25 70 82 61 17 39 50 00 0
Complementary Targets and Contextual Indicators 2023
Global Gender Gap Report 2023 112 Economy Profile Benin Score 0.616 Rank 138th Page 2 of 2
General indicators Indicator Unit Value GDP US$ billions 17 14 GDP per capita constant '17 intl $ 1000 3 32 Population sex ratio female/male 1 00 Population growth rate % 2 76 Indicator Million people Female Male Value Total population 6 66 6 69 13 35 Work participation and leadership Indicator Unit Value Gender pay gap % (OECD countries only) n a Share of women's membership in boards % (OECD countries only) n a Firms with female majority ownership % firms 21 30 Firms with female top managers % firms 25 90 Share of workers in informal sector % workers 96 90 Indicator 1-7 (best) Value Advancement of women to leadership roles 4 79 Indicator Unit Female Male Value Unemployed adults % of labour force (15-64) 1 79 1 28 1 52 Workers employed part-time % of employed people n a n a n a Proportion of time spent on unpaid domestic and care work % n a n a n a Indicator Million people Female Male Value Labour-force 1 47 1 67 3 15 Access to finance Indicator 0-1 (Equal rights) Value Access to financial services Near-equal rights
rights for widows and daughters Uneven rights Access to land assets Near-equal rights Access to non-land assets Near-equal rights Civil and political freedom Indicator Unit Value Year women received right to vote year 1960 Number of female heads of state to date number 0 Seats held in upper house % total seats n a Indicator Yes/No Value Election list quotas for women, national Yes Party membership quotas, voluntary Yes Indicator 0-1 (Equal rights) Value Access to justice Near-equal rights Freedom of movement Restricted rights Family and care Indicator Unit Value Public spending on family benefits % GPD n a Unmet family planning % women 15-49 32 30 Early marriage % 16 60 Mean age of women at birth of first child years n a Indicator 0-1 (Equal rights) Value Right to divorce Near-equal rights Indicator Days Female Male Value Length of parental leave 98 00 3 00 0 Education and skills Graduates Attainment % Female Male Parity STEM Graduates 54 88 45 12 1 22 Agri , Forestry, Fisheries & Veterinary 60 51 39 49 1 53 Arts & Humanities 56 09 43 91 1 28 Business, Admin & Law 61 35 38 65 1 59 Education n a n a n a Engineering, Manuf & Construction 54 64 45 36 1 20 Health & Welfare 63 67 36 33 1 75 Information & Comm Technologies 55 07 44 93 1 23 Natural Sci , Mathematics & Statistics n a n a n a Social Sci , Jour nalism & Information 61 49 38 51 1 60 Vocational training 0 99 2 07 0 48 PhD graduates n a n a n a Graduates % Female Male Value Graduates from tertiary education n a n a n a Health Indicator Unit Value Prevalence of gender violence in lifetime % women 68 60 Births attended by skilled personnel % live births 78 10 Mater nal mortality deaths per 100,000 live births 397 00 Total fertility rate births per woman 5 05 Indicator 0-1 (Equal rights) Value Reproductive autonomy Uneven rights *Scores
methodology, de
periods. **For
indicators, except the two health indicators, parity is benchmarked at 1 In the case of sex ratio at birth the gender parity benchmark is set at 0 944 (see Klasen and Wink 2003) In the case of healthy life expectancy the gender parity benchmark is set at 1 06, given women's longer life expectancy
Inheritance
are on a 0 to 1 scale, where 1 represents the optimal situation or “parity” Please see Appendix A and B for detailed
finitions, sources and
all
Global Gender Gap Index Indicators
Global Gender Gap Report 2023 113 Global Gender Gap Index 2023 Edition Bhutan score average score 0.708 Economy 0 963 E d u c a t i o n 0.962 Health 0 093 P o i t i c s Overview Index and Subindex 2023 Score Rank 2022 Score Rank Global Gender Gap Index 0 682 103rd 0 637 126th Economic Participation and Opportunity 0.708 59th 0 537 126th Educational Attainment 0 963 109th 0 955 111th Health and Survival 0 962 122nd 0 962 125th Political Empowerment 0 093 125th 0 093 125th
2023 Indicator Rank Score* Difference F-M Min Max Economic Participation and Opportunity 59th 0 708 -Labour-force participation rate % 15th 0 893 -7 80 0-100 Wage equality for similar work 1-7 (best) - - -Estimated ear ned income int'l $ 1,000 48th 0 690 -3 96 0-150 Legislators, senior officials and managers % 38th 0 659 -20 58 0-100 Professional and technical workers % 119th 0 498 -33 51 0-100 Educational Attainment 109th 0.963 -Literacy rate % 125th 0 807Enrolment in primary education % 1st 1 000 2 85 0-100 Enrolment in secondary education % 1st 1 000 11 00 0-200 Enrolment in tertiary education % 1st 1 000 0 66 0-200 Health and Survival 122nd 0 962 -Sex ratio at birth** % 1st 0 944Healthy life expectancy** years 132nd 1 004Political Empowerment 125th 0 093 -Women in parliament % 110th 0 211 -65 20 0-100 Women in ministerial positions % 123rd 0 111 -80 00 0-100 Years with female/male head of state (last 50) 80th 0 000 -50 00 0-50 Economy Profile Bhutan Score (imparity = 0 parity = 1) 0.682 Rank (out of 146 countries) 103rd Index Edition 2023 Compare with Global average 0 1 Female vs Male Min Max73 10 65 3012 77 8 81 60 29 39 72 66 75 33 2594 94 97 80 84 71 95 71 22 96 23 62-82 60 17 40 90 00 10 00 50 00 0
Complementary Targets and Contextual Indicators 2023
Global Gender Gap Report 2023 114 Economy Profile Bhutan Score 0.682 Rank 103rd Page 2 of 2
General indicators Indicator Unit Value GDP US$ billions 2 54 GDP per capita constant '17 intl $ 1000 10 91 Population sex ratio female/male 0 89 Population growth rate % 0 64 Indicator Million people Female Male Value Total population 0 37 0 41 0 78 Work participation and leadership Indicator Unit Value Gender pay gap % (OECD countries only) n a Share of women's membership in boards % (OECD countries only) n a Firms with female majority ownership % firms 32 80 Firms with female top managers % firms 26 30 Share of workers in informal sector % workers n a Indicator 1-7 (best) Value Advancement of women to leadership roles 5 54 Indicator Unit Female Male Value Unemployed adults % of labour force (15-64) 6 43 3 94 5 17 Workers employed part-time % of employed people 9 91 4 14 6 90 Proportion of time spent on unpaid domestic and care work % 15 00 5 90 n a Indicator Million people Female Male Value Labour-force 0 15 0 16 0 31 Access to finance Indicator 0-1 (Equal rights) Value Access to financial services Equal rights Inheritance rights for widows and daughters Equal rights Access to land assets Near-equal rights Access to non-land assets Equal rights Civil and political freedom Indicator Unit Value Year women received right to vote year 1953, 2008 Number of female heads of state to date number 0 Seats held in upper house % total seats 16 00 Indicator Yes/No Value Election list quotas for women, national n a Party membership quotas, voluntary n a Indicator 0-1 (Equal rights) Value Access to justice Equal rights Freedom of movement Equal rights Family and care Indicator Unit Value Public spending on family benefits % GPD n a Unmet family planning % women 15-49 n a Early marriage % 16 30 Mean age of women at birth of first child years n a Indicator 0-1 (Equal rights) Value Right to divorce Restricted rights Indicator Days Female Male Value Length of parental leave 60 00 14 00 0 Education and skills Graduates Attainment % Female Male Parity STEM Graduates n a n a n a Agri , Forestry, Fisheries & Veterinary 15 48 84 52 0 18 Arts & Humanities 56 86 43 14 1 32 Business, Admin & Law n a n a n a Education n a n a n a Engineering, Manuf & Construction 24 91 75 09 0 33 Health & Welfare 52 63 47 37 1 11 Information & Comm Technologies n a n a n a Natural Sci , Mathematics & Statistics n a n a n a Social Sci , Jour nalism & Information n a n a n a Vocational training n a n a n a PhD graduates 0 11 0 27 0 20 Graduates % Female Male Value Graduates from tertiary education n a n a n a Health Indicator Unit Value Prevalence of gender violence in lifetime % women 26 50 Births attended by skilled personnel % live births 96 30 Mater nal mortality deaths per 100,000 live births 183 00 Total fertility rate births per woman 1 43 Indicator 0-1 (Equal rights) Value Reproductive autonomy Uneven rights *Scores
methodology, de
nitions,
periods. **For
indicators,
two health indicators, parity is benchmarked at 1 In the case of sex ratio at birth the gender parity benchmark is set at 0 944 (see Klasen and Wink 2003) In the case of healthy life expectancy the gender parity benchmark is set at 1 06, given women's longer life expectancy
are on a 0 to 1 scale, where 1 represents the optimal situation or “parity” Please see Appendix A and B for detailed
fi
sources and
all
except the
Global Gender Gap Index Indicators
Global Gender Gap Report 2023 115 Global Gender Gap Index 2023 Edition Bolivia score average score 0.658 Economy 0 984 E d u c a t i o n 0.962 Health 0 317 P o i t i c s Overview Index and Subindex 2023 Score Rank 2022 Score Rank Global Gender Gap Index 0 730 56th 0 734 51st Economic Participation and Opportunity 0.658 90th 0 642 97th Educational Attainment 0 984 92nd 0 980 91st Health and Survival 0 962 125th 0 962 128th Political Empowerment 0 317 42nd 0 352 36th
2023 Indicator Rank Score* Difference F-M Min Max Economic Participation and Opportunity 90th 0 658 -Labour-force participation rate % 50th 0 840 -13 53 0-100 Wage equality for similar work 1-7 (best) 114th 0 539Estimated ear ned income int'l $ 1,000 80th 0 628 -3 67 0-150 Legislators, senior officials and managers % 72nd 0 542 -29 68 0-100 Professional and technical workers % 89th 0 853 -7 91 0-100 Educational Attainment 92nd 0.984 -Literacy rate % 106th 0 929Enrolment in primary education % 1st 1 000 0 46 0-100 Enrolment in secondary education % 82nd 0 996 -0 33 0-200 Enrolment in tertiary education % - - -Health and Survival 125th 0 962 -Sex ratio at birth** % 1st 0 944Healthy life expectancy** years 135th 1 002Political Empowerment 42nd 0 317 -Women in parliament % 10th 0 859 -7 60 0-100 Women in ministerial positions % 109th 0 143 -75 00 0-100 Years with female/male head of state (last 50) 59th 0 034 -46 68 0-50 Economy Profile Bolivia Score (imparity = 0 parity = 1) 0.730 Rank (out of 146 countries) 56th Index Edition 2023 Compare with Global average 0 1 Female vs Male Min Max84 74 71 219 88 6 21 64 84 35 16 53 96 46 0495 59 96 05 92 17 91 84--53 80 46 20 87 50 12 50 48 34 1 66
Complementary Targets and Contextual Indicators 2023
Access
Access
Global Gender Gap Report 2023 116 Economy Profile Bolivia Score 0.730 Rank 56th Page 2 of 2
General indicators Indicator Unit Value GDP US$ billions 40 41 GDP per capita constant '17 intl $ 1000 8 05 Population sex ratio female/male 0 99 Population growth rate % 1 19 Indicator Million people Female Male Value Total population 6 10 6 13 12 22 Work participation and leadership Indicator Unit Value Gender pay gap % (OECD countries only) n a Share of women's membership in boards % (OECD countries only) n a Firms with female majority ownership % firms 41 60 Firms with female top managers % firms 26 30 Share of workers in informal sector % workers 81 50 Indicator 1-7 (best) Value Advancement of women to leadership roles 3 63 Indicator Unit Female Male Value Unemployed adults % of labour force (15-64) 6 12 4 86 5 45 Workers employed part-time % of employed people n a n a n a Proportion of time spent on unpaid domestic and care work % n a n a n a Indicator Million people Female Male Value Labour-force 2 43 2 73 5 16 Access to finance Indicator 0-1 (Equal rights) Value Access to financial services Equal rights
rights for widows
daughters Near-equal rights
Inheritance
and
to land assets Near-equal rights
to non-land assets Near-equal rights Civil and political freedom Indicator Unit Value Year women received right to vote year 1938, 1952 Number of female heads of state to date number 2 Seats held in upper house % total seats 55 60 Indicator Yes/No Value Election list quotas for women, national Yes Party membership quotas, voluntary Yes Indicator 0-1 (Equal rights) Value Access to justice Near-equal rights Freedom of movement Equal rights Family and care Indicator Unit Value Public spending on family benefits % GPD n a Unmet family planning % women 15-49 23 20 Early marriage % 12 00 Mean age of women at birth of first child years n a Indicator 0-1 (Equal rights) Value Right to divorce Equal rights Indicator Days Female Male Value Length of parental leave 90 00 3 00 0 Education and skills Graduates Attainment % Female Male Parity STEM Graduates n a n a n a Agri , Forestry, Fisheries & Veterinary n a n a n a Arts & Humanities n a n a n a Business, Admin & Law n a n a n a Education n a n a n a Engineering, Manuf & Construction n a n a n a Health & Welfare n a n a n a Information & Comm Technologies n a n a n a Natural Sci , Mathematics & Statistics n a n a n a Social Sci
Jour nalism & Information n a n a n a Vocational training 28 21 29 04 0 97 PhD graduates 0 07 0 17 0 12 Graduates % Female Male Value Graduates from tertiary education n a n a n a Health Indicator Unit Value Prevalence of gender violence in lifetime % women 64 10 Births attended by skilled personnel % live births 81 10 Mater nal mortality deaths per 100,000 live births 155 00 Total fertility rate births per woman 2 65 Indicator 0-1 (Equal rights) Value Reproductive autonomy Near-equal rights *Scores
**For
two health indicators, parity is benchmarked at 1 In the case of sex ratio at birth the gender parity benchmark is set at 0 944 (see Klasen and Wink 2003) In the case of healthy life expectancy the gender parity benchmark is set at 1 06, given women's longer life expectancy
,
are on a 0 to 1 scale, where 1 represents the optimal situation or “parity” Please see Appendix A and B for detailed methodology, definitions, sources and periods.
all indicators, except the
Global Gender Gap Index Indicators
Global Gender Gap Report 2023 117 Global Gender Gap Index 2023 Edition Bosnia and Herzegovina score average score 0.601 Economy 0 980 E d u c a t i o n 0.970 Health 0 240 P o i t i c s Overview Index and Subindex 2023 Score Rank 2022 Score Rank Global Gender Gap Index 0 698 86th 0 710 73rd Economic Participation and Opportunity 0.601 112th 0 589 116th Educational Attainment 0 980 98th 0 974 100th Health and Survival 0 970 74th 0 975 53rd Political Empowerment 0 240 65th 0 302 44th
2023 Indicator Rank Score* Difference F-M Min Max Economic Participation and Opportunity 112th 0 601 -Labour-force participation rate % 106th 0 659 -21 03 0-100 Wage equality for similar work 1-7 (best) 109th 0 556Estimated ear ned income int'l $ 1,000 98th 0 581 -8 34 0-150 Legislators, senior officials and managers % 111th 0 319 -51 64 0-100 Professional and technical workers % 1st 1 000 1 57 0-100 Educational Attainment 98th 0.980 -Literacy rate % 88th 0 974Enrolment in primary education % - - -Enrolment in secondary education % 106th 0 974 -0 01 0-200 Enrolment in tertiary education % 1st 1 000 17 32 0-200 Health and Survival 74th 0 970 -Sex ratio at birth** % 131st 0 936Healthy life expectancy** years 59th 1 046Political Empowerment 65th 0 240 -Women in parliament % 102nd 0 236 -61 80 0-100 Women in ministerial positions % 114th 0 125 -77 78 0-100 Years with female/male head of state (last 50) 13th 0 308 -26 48 0-50 Economy Profile
Score (imparity = 0 parity = 1) 0.698 Rank (out of 146 countries) 86th Index Edition 2023 Compare with Global average 0 1 Female vs Male Min Max61 67 40 6419 90 11 56 75 82 24 18 49 22 50 78-0 51 0 49 30 84 48 16-80 90 19 10 88 89 11 11 38 24 11 76
Bosnia and Her egovina
Complementary Targets and Contextual Indicators 2023
Global Gender Gap Report 2023 118 Economy Profile Bosnia and Herzegovina Score 0.698 Rank 86th Page 2 of 2
General indicators Indicator Unit Value GDP US$ billions 23 37 GDP per capita constant '17 intl $ 1000 15 66 Population sex ratio female/male 1 03 Population growth rate % -1 44 Indicator Million people Female Male Value Total population 1 64 1 59 3 23 Work participation and leadership Indicator Unit Value Gender pay gap % (OECD countries only) n a Share of women's membership in boards % (OECD countries only) n a Firms with female majority ownership % firms 13 00 Firms with female top managers % firms 16 60 Share of workers in informal sector % workers 20 70 Indicator 1-7 (best) Value Advancement of women to leadership roles 3 81 Indicator Unit Female Male Value Unemployed adults % of labour force (15-64) 16 13 10 98 13 08 Workers employed part-time % of employed people 20 82 9 93 14 22 Proportion of time spent on unpaid domestic and care work % n a n a n a Indicator Million people Female Male Value Labour-force 0 57 0 80 1 37 Access to finance Indicator 0-1 (Equal rights) Value Access to financial services Equal rights Inheritance rights for widows and daughters Near-equal rights Access to land assets Near-equal rights Access to non-land assets Near-equal rights Civil and political freedom Indicator Unit Value Year women received right to vote year 1949 Number of female heads of state to date number 4 Seats held in upper house % total seats 20 00 Indicator Yes/No Value Election list quotas for women, national Yes Party membership quotas, voluntary Yes Indicator 0-1 (Equal rights) Value Access to justice Near-equal rights Freedom of movement Equal rights Family and care Indicator Unit Value Public spending on family benefits % GPD n a Unmet family planning % women 15-49 n a Early marriage % 0 70 Mean age of women at birth of first child years 27 70 Indicator 0-1 (Equal rights) Value Right to divorce Equal rights Indicator Days Female Male Value Length of parental leave 365 00 9 00 0 Education and skills Graduates Attainment % Female Male Parity STEM Graduates 44 50 55 50 0 80 Agri , Forestry, Fisheries & Veterinary 57 02 42 98 1 33 Arts & Humanities 68 76 31 24 2 20 Business, Admin & Law 57 17 42 83 1 33 Education n a n a n a Engineering, Manuf & Construction 39 37 60 63 0 65 Health & Welfare 73 35 26 65 2 75 Information & Comm Technologies n a n a n a Natural Sci , Mathematics & Statistics 71 91 28 09 2 56 Social Sci , Jour nalism & Information n a n a n a Vocational training 21 07 23 40 0 90 PhD graduates 0 13 0 24 0 18 Graduates % Female Male Value Graduates from tertiary education 34 58 22 09 28 14 Health Indicator Unit Value Prevalence of gender violence in lifetime % women 13 10 Births attended by skilled personnel % live births 99 90 Mater nal mortality deaths per 100,000 live births 10 00 Total fertility rate births per woman 1 36 Indicator 0-1 (Equal rights) Value Reproductive autonomy Equal rights *Scores
0
1
represents the optimal situation
parity
see Appendix A and B for detailed methodology, definitions, sources and periods. **For all indicators, except the two health indicators, parity is benchmarked at 1 In the case of sex ratio at birth the gender parity benchmark is set at 0 944 (see Klasen and Wink 2003) In the case of healthy life expectancy the gender parity benchmark is set at 1 06, given women's longer life expectancy
are on a
to
scale, where 1
or “
” Please
Global Gender Gap Index Indicators
Global Gender Gap Report 2023 119 Global Gender Gap Index 2023 Edition Botswana score average score 0.807 Economy 1 000 E d u c a t i o n 0.980 Health 0 088 P o i t i c s Overview Index and Subindex 2023 Score Rank 2022 Score Rank Global Gender Gap Index 0 719 64th 0 719 66th Economic Participation and Opportunity 0.807 9th 0 810 7th Educational Attainment 1 000 1st 1 000 22nd Health and Survival 0 980 1st 0 980 1st Political Empowerment 0 088 127th 0 085 129th
2023 Indicator Rank Score* Difference F-M Min Max Economic Participation and Opportunity 9th 0 807 -Labour-force participation rate % 34th 0 862 -9 65 0-100 Wage equality for similar work 1-7 (best) 83rd 0 614Estimated ear ned income int'l $ 1,000 17th 0 793 -3 44 0-150 Legislators, senior officials and managers % 1st 1 000 16 96 0-100 Professional and technical workers % 1st 1 000 7 40 0-100 Educational Attainment 1st 1.000 -Literacy rate % 1st 1 000Enrolment in primary education % 1st 1 000 1 71 0-100 Enrolment in secondary education % 1st 1 000 7 88 0-200 Enrolment in tertiary education % 1st 1 000 11 11 0-200 Health and Survival 1st 0 980 -Sex ratio at birth** % 1st 0 944Healthy life expectancy** years 1st 1 060Political Empowerment 127th 0 088 -Women in parliament % 128th 0 125 -77 80 0-100 Women in ministerial positions % 88th 0 200 -66 67 0-100 Years with female/male head of state (last 50) 80th 0 000 -50 00 0-50 Economy Profile Botswana Score (imparity = 0 parity = 1) 0.719 Rank (out of 146 countries) 64th Index Edition 2023 Compare with Global average 0 1 Female vs Male Min Max69 71 60 0616 58 13 14 41 52 58 48 46 30 53 7090 21 91 92 69 70 77 58 19 23 30 35-88 90 11 10 83 33 16 67 50 00 0
Complementary Targets and Contextual Indicators 2023
where
Global Gender Gap Report 2023 120 Economy Profile Botswana Score 0.719 Rank 64th Page 2 of 2
General indicators Indicator Unit Value GDP US$ billions 17 61 GDP per capita constant '17 intl $ 1000 14 84 Population sex ratio female/male 1 03 Population growth rate % 1 64 Indicator Million people Female Male Value Total population 1 33 1 30 2 63 Work participation and leadership Indicator Unit Value Gender pay gap % (OECD countries only) n a Share of women's membership in boards % (OECD countries only) n a Firms with female majority ownership % firms n a Firms with female top managers % firms n a Share of workers in informal sector % workers 75 00 Indicator 1-7 (best) Value Advancement of women to leadership roles 4 42 Indicator Unit Female Male Value Unemployed adults % of labour force (15-64) 26 63 22 06 24 32 Workers employed part-time % of employed people n a n a n a Proportion of time spent on unpaid domestic and care work % n a n a n a Indicator Million people Female Male Value Labour-force 0 44 0 45 0 89 Access to finance Indicator 0-1 (Equal rights) Value Access to financial services Near-equal rights
rights for widows and daughters Near-equal rights
to land assets Uneven rights Access to non-land assets Uneven rights Civil and political freedom Indicator Unit Value Year women received right to vote year 1965 Number of female heads of state to date number 0 Seats held in upper house % total seats n a Indicator Yes/No Value Election list quotas for women, national Yes Party membership quotas, voluntary Yes Indicator 0-1 (Equal rights) Value Access to justice Restricted rights Freedom of movement Restricted rights Family and care Indicator Unit Value Public spending on family benefits % GPD n a Unmet family planning % women 15-49 n a Early marriage % 7 10 Mean age of women at birth of first child years n a Indicator 0-1 (Equal rights) Value Right to divorce Uneven rights Indicator Days Female Male Value Length of parental leave 84 00 0 0 Education and skills Graduates Attainment % Female Male Parity STEM Graduates n a n a n a Agri , Forestry, Fisheries & Veterinary 57 96 42 04 1 38 Arts & Humanities 56 00 44 00 1 27 Business, Admin & Law n a n a n a Education 70 59 29 41 2 40 Engineering, Manuf & Construction n a n a n a Health & Welfare 70 04 29 96 2 34 Information
Comm Technologies n a n a n a Natural
n a n a n a
n a n a n a Vocational
n a n a n a PhD graduates n a n a n a Graduates % Female Male Value Graduates from tertiary education n a n a n a Health
Unit Value Prevalence of gender violence in lifetime % women n a Births attended by skilled personnel % live births 99 80 Mater nal mortality deaths per 100,000 live births 144 00 Total fertility rate births per woman 2 84 Indicator 0-1 (Equal rights) Value Reproductive autonomy Near-equal rights
health indicators, parity is benchmarked
1
the case of sex ratio at birth the gender parity benchmark is set at 0 944 (see Klasen and Wink 2003) In the case of healthy life expectancy
gender parity benchmark is set at 1 06, given women's longer life expectancy
Inheritance
Access
&
Sci , Mathematics & Statistics
Social Sci , Jour nalism & Information
training
Indicator
*Scores are on a 0 to 1 scale,
1 represents the optimal situation or “parity” Please see Appendix A and B for detailed methodology, definitions, sources and periods. **For all indicators, except the two
at
In
the
Global Gender Gap Index Indicators
Global Gender Gap Report 2023 121 Global Gender Gap Index 2023 Edition Brazil score average score 0.670 Economy 0 992 E d u c a t i o n 0.980 Health 0 263 P o i t i c s Overview Index and Subindex 2023 Score Rank 2022 Score Rank Global Gender Gap Index 0 726 57th 0 696 94th Economic Participation and Opportunity 0.670 86th 0 669 85th Educational Attainment 0 992 73rd 1 000 1st Health and Survival 0 980 1st 0 980 1st Political Empowerment 0 263 56th 0 136 104th
2023 Indicator Rank Score* Difference F-M Min Max Economic Participation and Opportunity 86th 0 670 -Labour-force participation rate % 89th 0 719 -20 50 0-100 Wage equality for similar work 1-7 (best) 110th 0 556Estimated ear ned income int'l $ 1,000 81st 0 628 -6 69 0-150 Legislators, senior officials and managers % 45th 0 634 -22 43 0-100 Professional and technical workers % 1st 1 000 4 32 0-100 Educational Attainment 73rd 0.992 -Literacy rate % 1st 1 000Enrolment in primary education % 98th 0 983 -1 67 0-100 Enrolment in secondary education % 1st 1 000 4 67 0-200 Enrolment in tertiary education % 1st 1 000 19 50 0-200 Health and Survival 1st 0 980 -Sex ratio at birth** % 1st 0 944Healthy life expectancy** years 1st 1 060Political Empowerment 56th 0 263 -Women in parliament % 109th 0 215 -64 60 0-100 Women in ministerial positions % 33rd 0 579 -26 67 0-100 Years with female/male head of state (last 50) 33rd 0 120 -39 28 0-50 Economy Profile Bra il Score (imparity = 0 parity = 1) 0.726 Rank (out of 146 countries) 57th Index Edition 2023 Compare with Global average 0 1 Female vs Male Min Max72 87 52 3718 00 11 31 61 22 38 78 47 84 52 1696 30 94 63 101 85 106 52 45 06 64 55-82 30 17 70 63 33 36 67 44 64 5 36
Complementary Targets and Contextual Indicators 2023
Global Gender Gap Report 2023 122 Economy Profile Brazil Score 0.726 Rank 57th Page 2 of 2
General indicators Indicator Unit Value GDP US$ billions 1,608 98 GDP per capita constant '17 intl $ 1000 14 59 Population sex ratio female/male 1 04 Population growth rate % 0 53 Indicator Million people Female Male Value Total population 109 58 105 73 215 31 Work participation and leadership Indicator Unit Value Gender pay gap % (OECD countries only) 9 09 Share of women's membership in boards % (OECD countries only) 16 90 Firms with female majority ownership % firms n a Firms with female top managers % firms n a Share of workers in informal sector % workers 39 20 Indicator 1-7 (best) Value Advancement of women to leadership roles 4 41 Indicator Unit Female Male Value Unemployed adults % of labour force (15-64) 11 69 7 64 9 43 Workers employed part-time % of employed people 34 29 19 53 25 71 Proportion of time spent on unpaid domestic and care work % 11 61 5 13 n a Indicator Million people Female Male Value Labour-force 39 47 50 41 89 88 Access to finance Indicator 0-1 (Equal rights) Value Access to financial services Equal rights Inheritance rights for widows and daughters Equal rights Access to land assets Near-equal rights Access to non-land assets Near-equal rights Civil and political freedom Indicator Unit Value Year women received right to vote year 1932 Number of female heads of state to date number 1 Seats held in upper house % total seats 14 80 Indicator Yes/No Value Election list quotas for women, national Yes Party membership quotas, voluntary Yes Indicator 0-1 (Equal rights) Value Access to justice Equal rights Freedom of movement Equal rights Family and care Indicator Unit Value Public spending on family benefits % GPD n a Unmet family planning % women 15-49 n a Early marriage % 15 40 Mean age of women at birth of first child years n a Indicator 0-1 (Equal rights) Value Right to divorce Equal rights Indicator Days Female Male Value Length of parental leave 120 00 7 00 0 Education and skills Graduates Attainment % Female Male Parity STEM Graduates 36 64 63 36 0 58 Agri , Forestry, Fisheries & Veterinary 49 48 50 52 0 98 Arts & Humanities 55 15 44 85 1 23 Business, Admin & Law 58 00 42 00 1 38 Education n a n a n a Engineering, Manuf & Construction 36 66 63 34 0 58 Health & Welfare 75 69 24 31 3 11 Information & Comm Technologies n a n a n a Natural Sci , Mathematics & Statistics n a n a n a Social Sci , Jour nalism & Information 70 91 29 09 2 44 Vocational training 4 39 3 47 1 26 PhD graduates 0 21 0 31 0 26 Graduates % Female Male Value Graduates from tertiary education n a n a n a Health Indicator Unit Value Prevalence of gender violence in lifetime % women 33 50 Births attended by skilled personnel % live births 99 10 Mater nal mortality deaths per 100,000 live births 60 00 Total fertility rate births per woman 1 65 Indicator 0-1 (Equal rights) Value Reproductive autonomy Uneven rights *Scores are on a 0 to 1 scale, where 1 represents the optimal situation or “parity” Please see Appendix A and B for detailed methodology, definitions, sources and periods. **For all indicators, except the two health indicators, parity is benchmarked at 1 In the case of sex ratio at birth the gender parity benchmark is set at 0 944 (see Klasen and Wink 2003) In the case of healthy life expectancy the gender parity benchmark is set at 1 06, given women's longer life expectancy
Global Gender Gap Index Indicators
Global Gender Gap Report 2023 123 Global Gender Gap Index 2023 Edition Brunei Darussalam score average score 0.760 Economy 0 997 E d u c a t i o n 0.953 Health 0 061 P o i t i c s Overview Index and Subindex 2023 Score Rank 2022 Score Rank Global Gender Gap Index 0 693 96th 0 680 104th Economic Participation and Opportunity 0.760 29th 0 726 49th Educational Attainment 0 997 44th 0 997 48th Health and Survival 0 953 140th 0 966 104th Political Empowerment 0 061 136th 0 031 144th
2023 Indicator Rank Score* Difference F-M Min Max Economic Participation and Opportunity 29th 0 760 -Labour-force participation rate % 76th 0 766 -16 76 0-100 Wage equality for similar work 1-7 (best) - - -Estimated ear ned income int'l $ 1,000 51st 0 687 -22 15 0-150 Legislators, senior officials and managers % 28th 0 742 -14 79 0-100 Professional and technical workers % 81st 0 905 -4 96 0-100 Educational Attainment 44th 0.997 -Literacy rate % 80th 0 986Enrolment in primary education % 1st 1 000 0 31 0-100 Enrolment in secondary education % 1st 1 000 3 01 0-200 Enrolment in tertiary education % 1st 1 000 14 02 0-200 Health and Survival 140th 0 953 -Sex ratio at birth** % 142nd 0 926Healthy life expectancy** years 115th 1 014Political Empowerment 136th 0 061 -Women in parliament % 132nd 0 096 -82 40 0-100 Women in ministerial positions % 114th 0 125 -77 78 0-100 Years with female/male head of state (last 50) 80th 0 000 -50 00 0-50 Economy Profile
Score (imparity = 0 parity = 1) 0.693 Rank (out of 146 countries) 96th Index Edition 2023 Compare with Global average 0 1 Female vs Male Min Max71 65 54 8970 82 48 67 57 40 42 61 52 48 47 5298 17 98 48 89 90 92 91 25 35 39 37-91 20 8 80 88 89 11 11 50 00 0
Brunei Darussalam
Complementary Targets and Contextual Indicators 2023
Global Gender Gap Report 2023 124 Economy Profile Brunei Darussalam Score 0.693 Rank 96th Page 2 of 2
General indicators Indicator Unit Value GDP US$ billions 14 01 GDP per capita constant '17 intl $ 1000 60 13 Population sex ratio female/male 0 93 Population growth rate % 0 82 Indicator Million people Female Male Value Total population 0 22 0 23 0 45 Work participation and leadership Indicator Unit Value Gender pay gap % (OECD countries only) n a Share of women's membership in boards % (OECD countries only) n a Firms with female majority ownership % firms n a Firms with female top managers % firms n a Share of workers in informal sector % workers 31 00 Indicator 1-7 (best) Value Advancement of women to leadership roles 4 91 Indicator Unit Female Male Value Unemployed adults % of labour force (15-64) 6 50 3 90 4 95 Workers employed part-time % of employed people 15 24 8 26 11 05 Proportion of time spent on unpaid domestic and care work % n a n a n a Indicator Million people Female Male Value Labour-force 0 08 0 12 0 20 Access to finance Indicator 0-1 (Equal rights) Value Access to financial services Equal rights Inheritance rights for widows and daughters Unequal rights Access to land assets Equal rights Access to non-land assets Equal rights Civil and political freedom Indicator Unit Value Year women received right to vote year n a Number of female heads of state to date number 0 Seats held in upper house % total seats n a Indicator Yes/No Value Election list quotas for women, national n a Party membership quotas, voluntary n a Indicator 0-1 (Equal rights) Value Access to justice Restricted rights Freedom of movement Restricted rights Family and care Indicator Unit Value Public spending on family benefits % GPD n a Unmet family planning % women 15-49 n a Early marriage % 3 20 Mean age of women at birth of first child years n a Indicator 0-1 (Equal rights) Value Right to divorce Unequal rights Indicator Days Female Male Value Length of parental leave 91 00 0 0 Education and skills Graduates Attainment % Female Male Parity STEM Graduates 54 34 45 66 1 19 Agri , Forestry, Fisheries & Veterinary n a n a n a Arts & Humanities 61 32 38 68 1 59 Business, Admin & Law 68 31 31 69 2 16 Education 72 97 27 03 2 70 Engineering, Manuf & Construction 52 26 47 74 1 09 Health & Welfare n a n a n a Information & Comm Technologies n a n a n a Natural Sci , Mathematics & Statistics 73 37 26 63 2 76 Social Sci , Jour nalism & Information 74 09 25 91 2 86 Vocational training 7 61 7 62 1 00 PhD graduates n a n a n a Graduates % Female Male Value Graduates from tertiary education 30 07 16 52 22 95 Health Indicator Unit Value Prevalence of gender violence in lifetime % women n a Births attended by skilled personnel % live births 99 80 Mater nal mortality deaths per 100,000 live births 31 00 Total fertility rate births per woman 1 80 Indicator 0-1 (Equal rights) Value Reproductive autonomy Restricted rights *Scores
optimal situation
Appendix A
B for detailed methodology, definitions, sources
periods. **For all indicators, except the two health indicators, parity is benchmarked at 1 In the case of sex ratio at birth the gender parity benchmark is set at 0 944 (see Klasen and Wink 2003) In the case of healthy life expectancy the gender parity benchmark is set at 1 06, given women's longer life expectancy
are on a 0 to 1 scale, where 1 represents the
or “parity” Please see
and
and
Global Gender Gap Index Indicators
Global Gender Gap Report 2023 125 Global Gender Gap Index 2023 Edition Bulgaria score average score 0.738 Economy 0 994 E d u c a t i o n 0.979 Health 0 148 P o i t i c s Overview Index and Subindex 2023 Score Rank 2022 Score Rank Global Gender Gap Index 0 715 65th 0 740 42nd Economic Participation and Opportunity 0.738 39th 0 737 42nd Educational Attainment 0 994 63rd 0 995 58th Health and Survival 0 979 28th 0 979 30th Political Empowerment 0 148 98th 0 250 56th
2023 Indicator Rank Score* Difference F-M Min Max Economic Participation and Opportunity 39th 0 738 -Labour-force participation rate % 68th 0 791 -12 97 0-100 Wage equality for similar work 1-7 (best) 51st 0 666Estimated ear ned income int'l $ 1,000 37th 0 726 -7 77 0-150 Legislators, senior officials and managers % 47th 0 620 -23 42 0-100 Professional and technical workers % 1st 1 000 17 30 0-100 Educational Attainment 63rd 0.994 -Literacy rate % 70th 0 995Enrolment in primary education % 1st 1 000 0 03 0-100 Enrolment in secondary education % 103rd 0 978 -1 95 0-200 Enrolment in tertiary education % 1st 1 000 17 17 0-200 Health and Survival 28th 0 979 -Sex ratio at birth** % 112th 0 943Healthy life expectancy** years 1st 1 060Political Empowerment 98th 0 148 -Women in parliament % 82nd 0 319 -51 60 0-100 Women in ministerial positions % 95th 0 188 -68 42 0-100 Years with female/male head of state (last 50) 73rd 0 006 -49 45 0-50 Economy Profile Bulgaria Score (imparity = 0 parity = 1) 0.715 Rank (out of 146 countries) 65th Index Edition 2023 Compare with Global average 0 1 Female vs Male Min Max62 02 49 0528 40 20 63 61 71 38 29 41 35 58 6584 54 84 57 88 91 86 97 67 11 84 28-75 80 24 20 84 21 15 79 49 73 0 27
Complementary Targets and Contextual Indicators 2023
Global Gender Gap Report 2023 126 Economy Profile Bulgaria Score 0.715 Rank 65th Page 2 of 2
General indicators Indicator Unit Value GDP US$ billions 84 06 GDP per capita constant '17 intl $ 1000 24 39 Population sex ratio female/male 1 06 Population growth rate % -0 81 Indicator Million people Female Male Value Total population 3 49 3 29 6 78 Work participation and leadership Indicator Unit Value Gender pay gap % (OECD countries only) 2 55 Share of women's membership in boards % (OECD countries only) n a Firms with female majority ownership % firms 16 20 Firms with female top managers % firms 28 80 Share of workers in informal sector % workers 6 80 Indicator 1-7 (best) Value Advancement of women to leadership roles 4 94 Indicator Unit Female Male Value Unemployed adults % of labour force (15-64) 4 10 4 50 4 30 Workers employed part-time % of employed people 13 78 9 05 11 36 Proportion of time spent on unpaid domestic and care work % n a n a n a Indicator Million people Female Male Value Labour-force 1 48 1 67 3 15 Access to finance Indicator 0-1 (Equal rights) Value Access to financial services Near-equal rights Inheritance rights for widows and daughters Equal rights Access to land assets Near-equal rights Access to non-land assets Near-equal rights Civil and political freedom Indicator Unit Value Year women received right to vote year n a Number of female heads of state to date number 1 Seats held in upper house % total seats n a Indicator Yes/No Value Election list quotas for women, national n a Party membership quotas, voluntary n a Indicator 0-1 (Equal rights) Value Access to justice Equal rights Freedom of movement Equal rights Family and care Indicator Unit Value Public spending on family benefits % GPD n a Unmet family planning % women 15-49 n a Early marriage % 1 50 Mean age of women at birth of first child years 26 40 Indicator 0-1 (Equal rights) Value Right to divorce Near-equal rights Indicator Days Female Male Value Length of parental leave 410 00 15 00 365 00 Education and skills Graduates Attainment % Female Male Parity STEM Graduates n a n a n a Agri , Forestry, Fisheries & Veterinary 46 21 53 79 0 86 Arts & Humanities 67 81 32 19 2 11 Business, Admin & Law 67 67 32 33 2 09 Education 83 08 16 92 4 91 Engineering, Manuf & Construction 28 67 71 33 0 40 Health & Welfare 70 34 29 66 2 37 Information & Comm Technologies 38 74 61 26 0 63 Natural Sci , Mathematics & Statistics 68 08 31 92 2 13 Social Sci , Jour nalism & Information 66 71 33 29 2 00 Vocational training 13 19 19 18 0 69 PhD graduates n a n a n a Graduates % Female Male Value Graduates from tertiary education 58 25 38 57 48 07 Health Indicator Unit Value Prevalence of gender violence in lifetime % women 23 00 Births attended by skilled personnel % live births 99 80 Mater nal mortality deaths per 100,000 live births 10 00 Total fertility rate births per woman 1 56 Indicator 0-1 (Equal rights) Value Reproductive autonomy Equal rights *Scores
0
1
represents the optimal situation
parity
see Appendix A and B for detailed methodology, definitions, sources and periods. **For all indicators, except the two health indicators, parity is benchmarked at 1 In the case of sex ratio at birth the gender parity benchmark is set at 0 944 (see Klasen and Wink 2003) In the case of healthy life expectancy the gender parity benchmark is set at 1 06, given women's longer life expectancy
are on a
to
scale, where 1
or “
” Please
Global Gender Gap Index Indicators
Global Gender Gap Report 2023 127 Global Gender Gap Index 2023 Edition Burkina Faso score average score 0.708 Economy 0 893 E d u c a t i o n 0.978 Health 0 125 P o i t i c s Overview Index and Subindex 2023 Score Rank 2022 Score Rank Global Gender Gap Index 0 676 109th 0 659 115th Economic Participation and Opportunity 0.708 60th 0 718 57th Educational Attainment 0 893 133rd 0 876 131st Health and Survival 0 978 39th 0 978 43rd Political Empowerment 0 125 109th 0 066 138th
2023 Indicator Rank Score* Difference F-M Min Max Economic Participation and Opportunity 60th 0 708 -Labour-force participation rate % 90th 0 716 -15 03 0-100 Wage equality for similar work 1-7 (best) - - -Estimated ear ned income int'l $ 1,000 99th 0 578 -1 17 0-150 Legislators, senior officials and managers % 1st 1 000 16 22 0-100 Professional and technical workers % 110th 0 573 -27 15 0-100 Educational Attainment 133rd 0.893 -Literacy rate % 135th 0 694Enrolment in primary education % 1st 1 000 0 50 0-100 Enrolment in secondary education % 1st 1 000 4 48 0-200 Enrolment in tertiary education % 128th 0 597 -4 80 0-200 Health and Survival 39th 0 978 -Sex ratio at birth** % 1st 0 944Healthy life expectancy** years 51st 1 054Political Empowerment 109th 0 125 -Women in parliament % 113th 0 203 -66 20 0-100 Women in ministerial positions % 74th 0 250 -60 00 0-100 Years with female/male head of state (last 50) 80th 0 000 -50 00 0-50 Economy Profile Burkina
Score (imparity = 0 parity = 1) 0.676 Rank (out of 146 countries) 109th Index Edition 2023 Compare with Global average 0 1 Female vs Male Min Max52 98 37 952 77 1 60 41 89 58 11 63 58 36 4274 89 75 39 37 35 41 82 11 90 7 10-83 10 16 90 80 00 20 00 50 00 0
Faso
Complementary Targets and Contextual Indicators 2023
Global Gender Gap Report 2023 128 Economy Profile Burkina Faso Score 0.676 Rank 109th Page 2 of 2
General indicators Indicator Unit Value GDP US$ billions 19 74 GDP per capita constant '17 intl $ 1000 2 18 Population sex ratio female/male 1 01 Population growth rate % 2 65 Indicator Million people Female Male Value Total population 11 38 11 30 22 67 Work participation and leadership Indicator Unit Value Gender pay gap % (OECD countries only) n a Share of women's membership in boards % (OECD countries only) n a Firms with female majority ownership % firms n a Firms with female top managers % firms n a Share of workers in informal sector % workers 95 70 Indicator 1-7 (best) Value Advancement of women to leadership roles 3 45 Indicator Unit Female Male Value Unemployed adults % of labour force (15-64) 4 76 4 87 4 82 Workers employed part-time % of employed people n a n a n a Proportion of time spent on unpaid domestic and care work % n a n a n a Indicator Million people Female Male Value Labour-force 1 65 2 10 3 75 Access to finance Indicator 0-1 (Equal rights) Value Access to financial services Near-equal rights Inheritance rights for widows and daughters Near-equal rights Access to land assets Near-equal rights Access to non-land assets Near-equal rights Civil and political freedom Indicator Unit Value Year women received right to vote year 1958 Number of female heads of state to date number 0 Seats held in upper house % total seats n a Indicator Yes/No Value Election list quotas for women, national Yes Party membership quotas, voluntary Yes Indicator 0-1 (Equal rights) Value Access to justice Equal rights Freedom of movement Equal rights Family and care Indicator Unit Value Public spending on family benefits % GPD n a Unmet family planning % women 15-49 22 33 Early marriage % 32 40 Mean age of women at birth of first child years n a Indicator 0-1 (Equal rights) Value Right to divorce Near-equal rights Indicator Days Female Male Value Length of parental leave 98 00 3 00 0 Education and skills Graduates Attainment % Female Male Parity STEM Graduates 20 59 79 41 0 26 Agri , Forestry, Fisheries & Veterinary 33 80 66 20 0 51 Arts & Humanities 17 51 82 49 0 21 Business, Admin & Law 48 66 51 34 0 95 Education n a n a n a Engineering, Manuf & Construction 21 58 78 42 0 28 Health & Welfare n a n a n a Information & Comm Technologies n a n a n a Natural Sci , Mathematics & Statistics 18 74 81 26 0 23 Social Sci , Jour nalism & Information 45 35 54 65 0 83 Vocational training 0 74 1 21 0 61 PhD graduates 0 01 0 12 0 06 Graduates % Female Male Value Graduates from tertiary education 2 10 3 66 2 89 Health Indicator Unit Value Prevalence of gender violence in lifetime % women 11 50 Births attended by skilled personnel % live births 79 80 Mater nal mortality deaths per 100,000 live births 320 00 Total fertility rate births per woman 4 87 Indicator 0-1 (Equal rights) Value Reproductive autonomy Uneven rights *Scores
0
optimal situation
parity
Appendix A
B for detailed methodology, definitions, sources and periods. **For all indicators, except the two health indicators, parity is benchmarked at 1 In the case of sex ratio at birth the gender parity benchmark is set at 0 944 (see Klasen and Wink 2003) In the case of healthy life expectancy the gender parity benchmark is set at 1 06, given women's longer life expectancy
are on a
to 1 scale, where 1 represents the
or “
” Please see
and
Global Gender Gap Index Indicators
Global Gender Gap Report 2023 129 Global Gender Gap Index 2023 Edition Burundi score average score 0.810 Economy 0 942 E d u c a t i o n 0.979 Health 0 320 P o i t i c s Overview Index and Subindex 2023 Score Rank 2022 Score Rank Global Gender Gap Index 0 763 35th 0 777 24th Economic Participation and Opportunity 0.810 8th 0 855 2nd Educational Attainment 0 942 120th 0 927 121st Health and Survival 0 979 27th 0 979 29th Political Empowerment 0 320 41st 0 345 37th
2023 Indicator Rank Score* Difference F-M Min Max Economic Participation and Opportunity 8th 0 810 -Labour-force participation rate % 1st 0 991 -0 69 0-100 Wage equality for similar work 1-7 (best) 2nd 0 841Estimated ear ned income int'l $ 1,000 4th 0 883 -0 09 0-150 Legislators, senior officials and managers % 78th 0 510 -32 42 0-100 Professional and technical workers % 101st 0 673 -19 57 0-100 Educational Attainment 120th 0.942 -Literacy rate % 124th 0 841Enrolment in primary education % 1st 1 000 3 35 0-100 Enrolment in secondary education % 1st 1 000 9 24 0-200 Enrolment in tertiary education % 121st 0 772 -1 53 0-200 Health and Survival 27th 0 979 -Sex ratio at birth** % 1st 0 944Healthy life expectancy** years 39th 1 060Political Empowerment 41st 0 320 -Women in parliament % 32nd 0 618 -23 60 0-100 Women in ministerial positions % 37th 0 500 -33 33 0-100 Years with female/male head of state (last 50) 69th 0 012 -48 84 0-50 Economy Profile Burundi Score (imparity = 0 parity = 1) 0.763 Rank (out of 146 countries) 35th Index Edition 2023 Compare with Global average 0 1 Female vs Male Min Max78 94 78 250 75 0 66 66 20 33 79 59 78 40 2288 23 91 57 43 01 52 25 6 72 5 19-61 80 38 20 66 67 33 33 49 42 0 58
Complementary Targets and Contextual Indicators 2023
Global Gender Gap Report 2023 130 Economy Profile Burundi Score 0.763 Rank 35th Page 2 of 2
General indicators Indicator Unit Value GDP US$ billions 2 78 GDP per capita constant '17 intl $ 1000 0 71 Population sex ratio female/male 1 01 Population growth rate % 2 67 Indicator Million people Female Male Value Total population 6 49 6 40 12 89 Work participation and leadership Indicator Unit Value Gender pay gap % (OECD countries only) n a Share of women's membership in boards % (OECD countries only) n a Firms with female majority ownership % firms 9 30 Firms with female top managers % firms 16 30 Share of workers in informal sector % workers 98 30 Indicator 1-7 (best) Value Advancement of women to leadership roles 4 73 Indicator Unit Female Male Value Unemployed adults % of labour force (15-64) 1 03 1 15 1 08 Workers employed part-time % of employed people 25 92 23 66 24 91 Proportion of time spent on unpaid domestic and care work % n a n a n a Indicator Million people Female Male Value Labour-force 2 08 1 73 3 81 Access to finance Indicator 0-1 (Equal rights) Value Access to financial services Near-equal rights Inheritance rights for widows and daughters n a Access to land assets Near-equal rights Access to non-land assets Near-equal rights Civil and political freedom Indicator Unit Value Year women received right to vote year 1962 Number of female heads of state to date number 1 Seats held in upper house % total seats 41 00 Indicator Yes/No Value Election list quotas for women, national Yes Party membership quotas, voluntary Yes Indicator 0-1 (Equal rights) Value Access to justice Near-equal rights Freedom of movement Equal rights Family and care Indicator Unit Value Public spending on family benefits % GPD n a Unmet family planning % women 15-49 29 70 Early marriage % 9 90 Mean age of women at birth of first child years n a Indicator 0-1 (Equal rights) Value Right to divorce Near-equal rights Indicator Days Female Male Value Length of parental leave 84 00 4 00 0 Education and skills Graduates Attainment % Female Male Parity STEM Graduates n a n a n a Agri , Forestry, Fisheries & Veterinary 65 07 34 93 1 86 Arts & Humanities n a n a n a Business, Admin & Law 35 92 64 08 0 56 Education n a n a n a Engineering, Manuf & Construction n a n a n a Health & Welfare n a n a n a Information & Comm Technologies n a n a n a Natural Sci , Mathematics & Statistics n a n a n a Social Sci , Jour nalism & Information n a n a n a Vocational training 2 62 2 65 0 99 PhD graduates n a n a n a Graduates % Female Male Value Graduates from tertiary education 2 52 5 86 4 18 Health Indicator Unit Value Prevalence of gender violence in lifetime % women 46 70 Births attended by skilled personnel % live births 85 10 Mater nal mortality deaths per 100,000 live births 548 00 Total fertility rate births per woman 5 18 Indicator 0-1 (Equal rights) Value Reproductive autonomy Restricted rights *Scores
0
optimal situation
Appendix A and B for detailed methodology, definitions, sources and periods. **For all indicators, except the two health indicators, parity is benchmarked at 1 In the case of sex ratio at birth the gender parity benchmark is set at 0 944 (see Klasen and Wink 2003) In the case of healthy life expectancy the gender parity benchmark is set at 1 06, given women's longer life expectancy
are on a
to 1 scale, where 1 represents the
or “parity” Please see
Global Gender Gap Index Indicators
Global Gender Gap Report 2023 131 Global Gender Gap Index 2023 Edition Cabo Verde score average score 0.747 Economy 0 981 E d u c a t i o n 0.980 Health 0 334 P o i t i c s Overview Index and Subindex 2023 Score Rank 2022 Score Rank Global Gender Gap Index 0 761 37th 0 736 45th Economic Participation and Opportunity 0.747 32nd 0 752 30th Educational Attainment 0 981 95th 0 975 99th Health and Survival 0 980 1st 0 980 1st Political Empowerment 0 334 40th 0 238 62nd
2023 Indicator Rank Score* Difference F-M Min Max Economic Participation and Opportunity 32nd 0 747 -Labour-force participation rate % 72nd 0 784 -13 93 0-100 Wage equality for similar work 1-7 (best) 97th 0 597Estimated ear ned income int'l $ 1,000 29th 0 749 -1 76 0-150 Legislators, senior officials and managers % 16th 0 853 -7 94 0-100 Professional and technical workers % 75th 0 938 -3 20 0-100 Educational Attainment 95th 0.981 -Literacy rate % 107th 0 928Enrolment in primary education % 89th 0 989 -0 99 0-100 Enrolment in secondary education % 1st 1 000 7 36 0-200 Enrolment in tertiary education % 1st 1 000 9 30 0-200 Health and Survival 1st 0 980 -Sex ratio at birth** % 1st 0 944Healthy life expectancy** years 1st 1 060Political Empowerment 40th 0 334 -Women in parliament % 21st 0 715 -16 60 0-100 Women in ministerial positions % 48th 0 455 -37 50 0-100 Years with female/male head of state (last 50) 80th 0 000 -50 00 0-50 Economy Profile
Score (imparity = 0 parity = 1) 0.761 Rank (out of 146 countries) 37th Index Edition 2023 Compare with Global average 0 1 Female vs Male Min Max64 46 50 537 00 5 24 53 98 46 04 51 60 48 4092 77 91 78 85 32 92 69 19 05 28 35-58 30 41 70 68 75 31 25 50 00 0
Cabo Verde
Complementary Targets and Contextual Indicators 2023
Global Gender Gap Report 2023 132 Economy Profile Cabo Verde Score 0.761 Rank 37th Page 2 of 2
General indicators Indicator Unit Value GDP US$ billions 1 94 GDP per capita constant '17 intl $ 1000 6 11 Population sex ratio female/male 1 01 Population growth rate % 0 90 Indicator Million people Female Male Value Total population 0 30 0 29 0 59 Work participation and leadership Indicator Unit Value Gender pay gap % (OECD countries only) n a Share of women's membership in boards % (OECD countries only) n a Firms with female majority ownership % firms n a Firms with female top managers % firms n a Share of workers in informal sector % workers 63 80 Indicator 1-7 (best) Value Advancement of women to leadership roles 4 23 Indicator Unit Female Male Value Unemployed adults % of labour force (15-64) 12 21 10 77 11 41 Workers employed part-time % of employed people 28 23 20 05 23 68 Proportion of time spent on unpaid domestic and care work % n a n a n a Indicator Million people Female Male Value Labour-force 0 09 0 11 0 20 Access to finance Indicator 0-1 (Equal rights) Value Access to financial services Near-equal rights
rights for widows and daughters Equal rights Access to land assets Equal rights Access to non-land assets Equal rights Civil and political freedom Indicator Unit Value Year women received right to vote year 1975, 1989 Number of female heads of state to date number 0 Seats held in upper house % total seats n a Indicator Yes/No Value Election list quotas for women, national Yes Party membership quotas, voluntary Yes Indicator 0-1 (Equal rights) Value Access to justice Near-equal rights Freedom of movement Equal rights Family and care Indicator Unit Value Public spending on family benefits % GPD n a Unmet family planning % women 15-49 n a Early marriage % 10 60 Mean age of women at birth of first child years n a Indicator 0-1 (Equal rights) Value Right to divorce Restricted rights Indicator Days Female Male Value Length of parental leave 60 00 2 00 0 Education and skills Graduates Attainment % Female Male Parity STEM Graduates n a n a n a Agri , Forestry, Fisheries & Veterinary 100 00 0 n a Arts & Humanities 71 43 28 57 2 50 Business, Admin & Law n a n a n a Education n a n a n a Engineering, Manuf & Construction n a n a n a Health & Welfare 77 44 22 56 3 43 Information & Comm Technologies n a n a n a Natural Sci , Mathematics & Statistics 66 67 33 33 2 00 Social Sci , Jour nalism & Information 68 88 31 12 2 21 Vocational training 0 98 1 42 0 69 PhD graduates n a n a n a Graduates % Female Male Value Graduates from tertiary education 18 35 9 30 13 74
Unit Value Prevalence of gender violence in lifetime % women 12 60 Births attended by skilled personnel % live births 97 30 Mater nal mortality deaths per 100,000 live births 58 00 Total fertility rate births per woman 1 91 Indicator 0-1 (Equal rights) Value Reproductive autonomy Equal rights
parity
benchmarked
case
sex ratio
birth the gender parity benchmark is set at 0 944 (see Klasen and Wink 2003) In the case of healthy life expectancy
gender parity benchmark
set at 1 06, given women's longer life expectancy
Inheritance
Health Indicator
*Scores are on a 0 to 1 scale, where 1 represents the optimal situation or “parity” Please see Appendix A and B for detailed methodology, definitions, sources and periods. **For all indicators, except the two health indicators,
is
at 1 In the
of
at
the
is
Global Gender Gap Index Indicators
Global Gender Gap Report 2023 133 Global Gender Gap Index 2023 Edition Cambodia score average score 0.710 Economy 0 981 E d u c a t i o n 0.978 Health 0 112 P o i t i c s Overview Index and Subindex 2023 Score Rank 2022 Score Rank Global Gender Gap Index 0 695 92nd 0 690 98th Economic Participation and Opportunity 0.710 58th 0 710 61st Educational Attainment 0 981 96th 0 966 105th Health and Survival 0 978 38th 0 978 42nd Political Empowerment 0 112 115th 0 107 121st
2023 Indicator Rank Score* Difference F-M Min Max Economic Participation and Opportunity 58th 0 710 -Labour-force participation rate % 47th 0 843 -13 00 0-100 Wage equality for similar work 1-7 (best) 25th 0 724Estimated ear ned income int'l $ 1,000 23rd 0 765 -1 16 0-150 Legislators, senior officials and managers % 90th 0 449 -38 02 0-100 Professional and technical workers % 102nd 0 672 -19 58 0-100 Educational Attainment 96th 0.981 -Literacy rate % 115th 0 902Enrolment in primary education % 1st 1 000 0 47 0-100 Enrolment in secondary education % 1st 1 000 9 24 0-200 Enrolment in tertiary education % 1st 1 000 0 41 0-200 Health and Survival 38th 0 978 -Sex ratio at birth** % 1st 0 944Healthy life expectancy** years 49th 1 054Political Empowerment 115th 0 112 -Women in parliament % 92nd 0 263 -58 40 0-100 Women in ministerial positions % 114th 0 125 -77 78 0-100 Years with female/male head of state (last 50) 80th 0 000 -50 00 0-50 Economy Profile Cambodia Score (imparity = 0 parity = 1) 0.695 Rank (out of 146 countries) 92nd Index Edition 2023 Compare with Global average 0 1 Female vs Male Min Max82 94 69 944 94 3 78 69 01 30 99 59 79 40 2186 31 86 78 53 04 62 27 12 78 13 19-79 20 20 80 88 89 11 11 50 00 0
Complementary Targets and Contextual Indicators 2023
Global Gender Gap Report 2023 134 Economy Profile Cambodia Score 0.695 Rank 92nd Page 2 of 2
General indicators Indicator Unit Value GDP US$ billions 26 96 GDP per capita constant '17 intl $ 1000 4 35 Population sex ratio female/male 1 02 Population growth rate % 1 17 Indicator Million people Female Male Value Total population 8 47 8 30 16 77 Work participation and leadership Indicator Unit Value Gender pay gap % (OECD countries only) n a Share of women's membership in boards % (OECD countries only) n a Firms with female majority ownership % firms 43 70 Firms with female top managers % firms 57 30 Share of workers in informal sector % workers 89 40 Indicator 1-7 (best) Value Advancement of women to leadership roles 5 12 Indicator Unit Female Male Value Unemployed adults % of labour force (15-64) 0 44 0 40 0 41 Workers employed part-time % of employed people 21 93 17 82 19 83 Proportion of time spent on unpaid domestic and care work % n a n a n a Indicator Million people Female Male Value Labour-force 3 63 3 85 7 48 Access to finance Indicator 0-1 (Equal rights) Value Access to financial services Near-equal rights
rights for widows and daughters Near-equal rights
to land assets Near-equal rights
to non-land assets Near-equal rights Civil and political freedom Indicator Unit Value Year women received right to vote year n a Number of female heads of state to date number 0 Seats held in upper house % total seats 16 10 Indicator Yes/No Value Election list quotas for women, national n a Party membership quotas, voluntary n a Indicator 0-1 (Equal rights) Value Access to justice Restricted rights Freedom of movement Near-equal rights Family and care Indicator Unit Value Public spending on family benefits % GPD n a Unmet family planning % women 15-49 12 50 Early marriage % 16 60 Mean age of women at birth of first child years n a Indicator 0-1 (Equal rights) Value Right to divorce Near-equal rights Indicator Days Female Male Value Length of parental leave 90 00 0 0 Education and skills Graduates Attainment % Female Male Parity STEM Graduates 16 68 83 32 0 20 Agri , Forestry, Fisheries & Veterinary 31 27 68 73 0 45 Arts & Humanities n a n a n a Business, Admin & Law 49 44 50 56 0 98 Education 43 58 56 42 0 77 Engineering, Manuf & Construction n a n a n a Health & Welfare n a n a n a Information & Comm Technologies 8 44 91 56 0 09 Natural Sci , Mathematics & Statistics 34 08 65 92 0 52 Social Sci , Jour nalism & Information 22 95 77 05 0 30 Vocational training n a n a n a PhD graduates n a n a n a Graduates % Female Male Value Graduates from tertiary education n a n a n a Health Indicator Unit Value Prevalence of gender violence in lifetime % women 20 90 Births attended by skilled personnel % live births 89 00 Mater nal mortality deaths per 100,000 live births 160 00 Total fertility rate births per woman 2 38 Indicator 0-1 (Equal rights) Value Reproductive autonomy Equal rights *Scores
0
1 scale,
1 represents the optimal situation
parity
Please see Appendix A and B for detailed methodology, definitions, sources and periods. **For all indicators, except the two health indicators, parity is benchmarked at 1 In the case of sex ratio at birth the gender parity benchmark is set at 0 944 (see Klasen and Wink 2003) In the case of healthy life expectancy the gender parity benchmark is set at 1 06, given women's longer life expectancy
Inheritance
Access
Access
are on a
to
where
or “
”
Global Gender Gap Index Indicators
Global Gender Gap Report 2023 135 Global Gender Gap Index 2023 Edition Cameroon score average score 0.694 Economy 0 895 E d u c a t i o n 0.973 Health 0 210 P o i t i c s Overview Index and Subindex 2023 Score Rank 2022 Score Rank Global Gender Gap Index 0 693 94th 0 692 97th Economic Participation and Opportunity 0.694 70th 0 704 66th Educational Attainment 0 895 132nd 0 887 129th Health and Survival 0 973 57th 0 973 60th Political Empowerment 0 210 74th 0 202 76th
2023 Indicator Rank Score* Difference F-M Min Max Economic Participation and Opportunity 70th 0 694 -Labour-force participation rate % 29th 0 867 -10 31 0-100 Wage equality for similar work 1-7 (best) 67th 0 640Estimated ear ned income int'l $ 1,000 118th 0 500 -2 47 0-150 Legislators, senior officials and managers % 14th 0 971 -1 47 0-100 Professional and technical workers % 111th 0 563 -27 94 0-100 Educational Attainment 132nd 0.895 -Literacy rate % 119th 0 877Enrolment in primary education % 107th 0 909 -8 72 0-100 Enrolment in secondary education % 129th 0 887 -5 38 0-200 Enrolment in tertiary education % 113th 0 886 -1 72 0-200 Health and Survival 57th 0 973 -Sex ratio at birth** % 1st 0 944Healthy life expectancy** years 67th 1 040Political Empowerment 74th 0 210 -Women in parliament % 44th 0 513 -32 20 0-100 Women in ministerial positions % 87th 0 207 -65 71 0-100 Years with female/male head of state (last 50) 80th 0 000 -50 00 0-50 Economy Profile Cameroon Score (imparity = 0 parity = 1) 0.693 Rank (out of 146 countries) 94th Index Edition 2023 Compare with Global average 0 1 Female vs Male Min Max77 50 67 194 94 2 47 50 74 49 26 63 97 36 0396 00 87 28 47 69 42 32 15 13 13 40-66 10 33 90 82 86 17 14 50 00 0
Complementary Targets and Contextual Indicators 2023
Global Gender Gap Report 2023 136 Economy Profile Cameroon Score 0.693 Rank 94th Page 2 of 2
General indicators Indicator Unit Value GDP US$ billions 45 34 GDP per capita constant '17 intl $ 1000 3 70 Population sex ratio female/male 1 01 Population growth rate % 2 64 Indicator Million people Female Male Value Total population 13 99 13 92 27 91 Work participation and leadership Indicator Unit Value Gender pay gap % (OECD countries only) n a Share of women's membership in boards % (OECD countries only) n a Firms with female majority ownership % firms 31 00 Firms with female top managers % firms 22 90 Share of workers in informal sector % workers 87 10 Indicator 1-7 (best) Value Advancement of women to leadership roles 4 22 Indicator Unit Female Male Value Unemployed adults % of labour force (15-64) 4 27 3 23 3 73 Workers employed part-time % of employed people n a n a n a Proportion of time spent on unpaid domestic and care work % 15 82 4 57 n a Indicator Million people Female Male Value Labour-force 3 35 3 46 6 80 Access to finance Indicator 0-1 (Equal rights) Value Access to financial services Near-equal rights
rights for widows and daughters Near-equal rights Access to land assets Unequal rights Access to non-land assets Unequal rights Civil and political freedom Indicator Unit Value Year women received right to vote year 1946 Number of female heads of state to date number 0 Seats held in upper house % total seats 26 00 Indicator Yes/No Value Election list quotas for women, national Yes Party membership quotas, voluntary Yes Indicator 0-1 (Equal rights) Value Access to justice Near-equal rights Freedom of movement Restricted rights Family and care Indicator Unit Value Public spending on family benefits % GPD n a Unmet family planning % women 15-49 23 00 Early marriage % 22 30 Mean age of women at birth of first child years n a Indicator 0-1 (Equal rights) Value Right to divorce Near-equal rights Indicator Days Female Male Value Length of parental leave 98 00 3 00 0 Education and skills Graduates Attainment % Female Male Parity STEM Graduates 32 28 67 72 0 48 Agri , Forestry, Fisheries & Veterinary 29 08 70 92 0 41 Arts & Humanities 63 43 36 57 1 73 Business, Admin & Law 54 37 45 63 1 19 Education 44 16 55 84 0 79 Engineering, Manuf & Construction 25 19 74 81 0 34 Health & Welfare n a n a n a Information & Comm Technologies n a n a n a Natural Sci , Mathematics & Statistics 36 26 63 74 0 57 Social Sci , Jour nalism & Information n a n a n a Vocational training 3 30 6 08 0 54 PhD graduates n a n a n a Graduates % Female Male Value Graduates from tertiary education n a n a n a Health Indicator Unit Value Prevalence of gender violence in lifetime % women 51 10 Births attended by skilled personnel % live births 69 00 Mater nal mortality deaths per 100,000 live births 529 00 Total fertility rate births per woman 4 54 Indicator 0-1 (Equal rights) Value Reproductive autonomy Uneven rights *Scores are on a 0 to 1 scale,
1 represents the optimal situation or
parity” Please see Appendix A and B for detailed methodology, definitions, sources and periods. **For all indicators, except the two health indicators, parity is benchmarked at 1 In the case of sex ratio at birth the gender parity benchmark is set at 0 944 (see Klasen and Wink 2003) In the case of healthy life expectancy the gender parity benchmark is set at 1 06, given women's longer life expectancy
Inheritance
where
“
Global Gender Gap Index Indicators
Global Gender Gap Report 2023 137 Global Gender Gap Index 2023 Edition Canada score average score 0.740 Economy 1 000 E d u c a t i o n 0.968 Health 0 374 P o i t i c s Overview Index and Subindex 2023 Score Rank 2022 Score Rank Global Gender Gap Index 0 770 30th 0 772 25th Economic Participation and Opportunity 0.740 36th 0 736 43rd Educational Attainment 1 000 1st 1 000 1st Health and Survival 0 968 93rd 0 968 94th Political Empowerment 0 374 33rd 0 386 31st
2023 Indicator Rank Score* Difference F-M Min Max Economic Participation and Opportunity 36th 0 740 -Labour-force participation rate % 21st 0 881 -8 20 0-100 Wage equality for similar work 1-7 (best) 52nd 0 665Estimated ear ned income int'l $ 1,000 44th 0 703 -16 73 0-150 Legislators, senior officials and managers % 65th 0 551 -28 96 0-100 Professional and technical workers % 1st 1 000 15 17 0-100 Educational Attainment 1st 1.000 -Literacy rate % 1st 1 000Enrolment in primary education % - - -Enrolment in secondary education % 1st 1 000 1 26 0-200 Enrolment in tertiary education % 1st 1 000 22 38 0-200 Health and Survival 93rd 0 968 -Sex ratio at birth** % 1st 0 944Healthy life expectancy** years 103rd 1 021Political Empowerment 33rd 0 374 -Women in parliament % 50th 0 443 -38 60 0-100 Women in ministerial positions % 12th 0 944 -2 86 0-100 Years with female/male head of state (last 50) 71st 0 007 -49 28 0-50 Economy Profile Canada Score (imparity = 0 parity = 1) 0.770 Rank (out of 146 countries) 30th Index Edition 2023 Compare with Global average 0 1 Female vs Male Min Max69 15 60 9556 31 39 58 64 48 35 52 42 41 57 59-114 25 115 51 68 60 90 98-69 30 30 70 51 43 48 57 49 64 0 36
Complementary Targets and Contextual Indicators 2023
Global Gender Gap Report 2023 138 Economy Profile Canada Score 0.770 Rank 30th Page 2 of 2
General indicators Indicator Unit Value GDP US$ billions 1,988 34 GDP per capita constant '17 intl $ 1000 47 89 Population sex ratio female/male 1 01 Population growth rate % 0 55 Indicator Million people Female Male Value Total population 19 34 19 11 38 45 Work participation and leadership Indicator Unit Value Gender pay gap % (OECD countries only) 16 67 Share of women's membership in boards % (OECD countries only) 32 90 Firms with female majority ownership % firms n a Firms with female top managers % firms n a Share of workers in informal sector % workers n a Indicator 1-7 (best) Value Advancement of women to leadership roles 4 97 Indicator Unit Female Male Value Unemployed adults % of labour force (15-64) 5 14 5 41 5 28 Workers employed part-time % of employed people 49 17 32 80 40 58 Proportion of time spent on unpaid domestic and care work % 14 58 9 58 n a Indicator Million people Female Male Value Labour-force 8 39 9 38 17 77 Access to finance Indicator 0-1 (Equal rights) Value Access to financial services Equal rights Inheritance rights for widows and daughters Equal rights Access to land assets Uneven rights Access to non-land assets Equal rights Civil and political freedom Indicator Unit Value Year women received right to vote year 1917, 1918, 1950, 1960 Number of female heads of state to date number 1 Seats held in upper house % total seats 51 60 Indicator Yes/No Value Election list quotas for women, national Yes Party membership quotas, voluntary Yes Indicator 0-1 (Equal rights) Value Access to justice Equal rights Freedom of movement Equal rights Family and care Indicator Unit Value Public spending on family benefits % GPD 1 76 Unmet family planning % women 15-49 n a Early marriage % 1 70 Mean age of women at birth of first child years 29 40 Indicator 0-1 (Equal rights) Value Right to divorce Equal rights Indicator Days Female Male Value Length of parental leave 105 00 0 210 00 Education and skills Graduates Attainment % Female Male Parity STEM Graduates 31 43 68 57 0 46 Agri , Forestry, Fisheries & Veterinary 54 19 45 81 1 18 Arts & Humanities 62 93 37 07 1 70 Business, Admin & Law n a n a n a Education n a n a n a Engineering, Manuf & Construction n a n a n a Health & Welfare n a n a n a Information & Comm Technologies n a n a n a Natural Sci , Mathematics & Statistics 53 76 46 24 1 16 Social Sci , Jour nalism & Information 70 24 29 76 2 36 Vocational training 7 64 8 13 0 94 PhD graduates 0 69 1 22 0 95 Graduates % Female Male Value Graduates from tertiary education 52 60 34 44 43 31 Health Indicator Unit Value Prevalence of gender violence in lifetime % women 1 90 Births attended by skilled personnel % live births 98 00 Mater nal mortality deaths per 100,000 live births 10 00 Total fertility rate births per woman 1 40 Indicator 0-1 (Equal rights) Value Reproductive autonomy Equal rights *Scores
**For
health indicators, parity is benchmarked at 1
the case of sex ratio at birth the gender parity benchmark is set at 0 944 (see Klasen and Wink 2003) In the case of healthy life expectancy
gender parity benchmark is set at 1 06, given women's longer life expectancy
are on a 0 to 1 scale, where 1 represents the optimal situation or “parity” Please see Appendix A and B for detailed methodology, definitions, sources and periods.
all indicators, except the two
In
the
Global Gender Gap Index Indicators
Global Gender Gap Report 2023 139 Global Gender Gap Index 2023 Edition Chad score average score 0.538 Economy 0 637 E d u c a t i o n 0.970 Health 0 137 P o i t i c s Overview Index and Subindex 2023 Score Rank 2022 Score Rank Global Gender Gap Index 0 570 145th 0 579 142nd Economic Participation and Opportunity 0.538 126th 0 539 124th Educational Attainment 0 637 145th 0 603 145th Health and Survival 0 970 72nd 0 970 79th Political Empowerment 0 137 105th 0 202 74th
2023 Indicator Rank Score* Difference F-M Min Max Economic Participation and Opportunity 126th 0 538 -Labour-force participation rate % 99th 0 677 -23 48 0-100 Wage equality for similar work 1-7 (best) 107th 0 559Estimated ear ned income int'l $ 1,000 104th 0 561 -0 80 0-150 Legislators, senior officials and managers % - - -Professional and technical workers % 139th 0 217 -64 30 0-100 Educational Attainment 145th 0.637 -Literacy rate % 143rd 0 515Enrolment in primary education % 110th 0 804 -16 85 0-100 Enrolment in secondary education % 140th 0 583 -12 57 0-200 Enrolment in tertiary education % 136th 0 290 -3 57 0-200 Health and Survival 72nd 0 970 -Sex ratio at birth** % 1st 0 944Healthy life expectancy** years 86th 1 029Political Empowerment 105th 0 137 -Women in parliament % 78th 0 350 -48 20 0-100 Women in ministerial positions % 122nd 0 115 -79 31 0-100 Years with female/male head of state (last 50) 80th 0 000 -50 00 0-50 Economy Profile Chad Score (imparity = 0 parity = 1) 0.570 Rank (out of 146 countries) 145th Index Edition 2023 Compare with Global average 0 1 Female vs Male Min Max72 77 49 291 82 1 0282 15 17 8586 14 69 29 30 14 17 58 5 03 1 46-74 10 25 90 89 66 10 35 50 00 0
Complementary Targets and Contextual Indicators 2023
Access
Global Gender Gap Report 2023 140 Economy Profile Chad Score 0.570 Rank 145th Page 2 of 2
General indicators Indicator Unit Value GDP US$ billions 11 78 GDP per capita constant '17 intl $ 1000 1 43 Population sex ratio female/male 0 99 Population growth rate % 3 16 Indicator Million people Female Male Value Total population 8 83 8 90 17 72 Work participation and leadership Indicator Unit Value Gender pay gap % (OECD countries only) n a Share of women's membership in boards % (OECD countries only) n a Firms with female majority ownership % firms 9 00 Firms with female top managers % firms 12 00 Share of workers in informal sector % workers 96 90 Indicator 1-7 (best) Value Advancement of women to leadership roles 3 71 Indicator Unit Female Male Value Unemployed adults % of labour force (15-64) 0 81 1 51 1 20 Workers employed part-time % of employed people n a n a n a Proportion of time spent on unpaid domestic and care work % n a n a n a Indicator Million people Female Male Value Labour-force 1 45 1 95 3 40 Access to finance Indicator 0-1 (Equal rights) Value Access to financial services Unequal rights
rights for widows
daughters
rights
Inheritance
and
Uneven
to land assets Uneven rights
to non-land assets Uneven rights Civil and political freedom Indicator Unit Value Year women received right to vote year 1958 Number of female heads of state to date number 0 Seats held in upper house % total seats n a Indicator Yes/No Value Election list quotas for women, national n a Party membership quotas, voluntary n a Indicator 0-1 (Equal rights) Value Access to justice Restricted rights Freedom of movement Equal rights
and care
Unit Value
spending on family benefits % GPD n a Unmet family planning % women 15-49 30 20 Early marriage % 40 50 Mean age of women at birth of first child years n a Indicator 0-1
rights) Value Right to divorce Uneven rights Indicator Days Female Male Value
of parental leave 98 00 1 00 0 Education and skills
Attainment % Female Male Parity STEM Graduates n a n a n a
Access
Family
Indicator
Public
(Equal
Length
Graduates
n a n a n a Arts &
n a n a n a
Admin & Law n a n a n a Education n a n a n a Engineering, Manuf & Construction n a n a n a Health & Welfare n a n a n a
Technologies n a n a n a
n a n a n a
n a n a n a
n a n a n a PhD graduates n a n a n a Graduates % Female Male Value Graduates from tertiary education n a n a n a Health
Unit Value Prevalence of gender violence in lifetime % women 28 60 Births attended by skilled personnel % live births 38 80 Mater nal mortality deaths per 100,000 live births 1 14 Total fertility rate births per woman 6 35 Indicator 0-1 (Equal rights) Value Reproductive autonomy Near-equal rights
methodology, de
**For
except the two health indicators, parity is benchmarked at 1 In the case of sex ratio at birth the gender parity benchmark is set at 0 944 (see Klasen and Wink 2003) In the case of healthy life expectancy the gender parity benchmark is set at 1 06, given women's longer life expectancy
Agri , Forestry, Fisheries & Veterinary
Humanities
Business,
Information & Comm
Natural Sci , Mathematics & Statistics
Social Sci , Jour nalism & Information
Vocational training
Indicator
*Scores are on a 0 to 1 scale, where 1 represents the optimal situation or “parity” Please see Appendix A and B for detailed
finitions, sources and periods.
all indicators,
Global Gender Gap Index Indicators
Global Gender Gap Report 2023 141 Global Gender Gap Index 2023 Edition Chile score average score 0.642 Economy 0 994 E d u c a t i o n 0.970 Health 0 502 P o i t i c s Overview Index and Subindex 2023 Score Rank 2022 Score Rank Global Gender Gap Index 0 777 27th 0 736 47th Economic Participation and Opportunity 0.642 96th 0 616 105th Educational Attainment 0 994 64th 0 994 62nd Health and Survival 0 970 69th 0 970 76th Political Empowerment 0 502 12th 0 363 34th
2023 Indicator Rank Score* Difference F-M Min Max Economic Participation and Opportunity 96th 0 642 -Labour-force participation rate % 98th 0 677 -22 23 0-100 Wage equality for similar work 1-7 (best) 72nd 0 624Estimated ear ned income int'l $ 1,000 101st 0 576 -13 73 0-150 Legislators, senior officials and managers % 92nd 0 436 -39 26 0-100 Professional and technical workers % 1st 1 000 4 94 0-100 Educational Attainment 64th 0.994 -Literacy rate % 59th 0 999Enrolment in primary education % 84th 0 992 -0 82 0-100 Enrolment in secondary education % 89th 0 991 -0 95 0-200 Enrolment in tertiary education % 1st 1 000 15 38 0-200 Health and Survival 69th 0 970 -Sex ratio at birth** % 1st 0 944Healthy life expectancy** years 83rd 1 030Political Empowerment 12th 0 502 -Women in parliament % 38th 0 550 -29 00 0-100 Women in ministerial positions % 1st 1 000 16 67 0-100 Years with female/male head of state (last 50) 18th 0 191 -33 99 0-50 Economy Profile Chile Score (imparity = 0 parity = 1) 0.777 Rank (out of 146 countries) 27th Index Edition 2023 Compare with Global average 0 1 Female vs Male Min Max68 90 46 6732 36 18 64 69 63 30 37 47 53 52 4799 94 99 12 104 11 103 16 84 10 99 48-64 50 35 50 41 67 58 33 42 00 8 01
Complementary Targets and Contextual Indicators 2023
Global Gender Gap Report 2023 142 Economy Profile Chile Score 0.777 Rank 27th Page 2 of 2
General indicators Indicator Unit Value GDP US$ billions 317 06 GDP per capita constant '17 intl $ 1000 25 45 Population sex ratio female/male 1 01 Population growth rate % 0 99 Indicator Million people Female Male Value Total population 9 87 9 73 19 60 Work participation and leadership Indicator Unit Value Gender pay gap % (OECD countries only) 8 60 Share of women's membership in boards % (OECD countries only) 15 20 Firms with female majority ownership % firms n a Firms with female top managers % firms n a Share of workers in informal sector % workers 27 40 Indicator 1-7 (best) Value Advancement of women to leadership roles 4 83 Indicator Unit Female Male Value Unemployed adults % of labour force (15-64) 9 02 8 09 8 49 Workers employed part-time % of employed people 38 20 23 53 29 58 Proportion of time spent on unpaid domestic and care work % 22 10 9 85 n a Indicator Million people Female Male Value Labour-force 3 78 5 12 8 90 Access to finance Indicator 0-1 (Equal rights) Value Access to financial services Equal rights Inheritance rights for widows and daughters Equal rights Access to land assets Restricted rights Access to non-land assets Unequal rights Civil and political freedom Indicator Unit Value Year women received right to vote year 1931, 1949 Number of female heads of state to date number 1 Seats held in upper house % total seats 24 00 Indicator Yes/No Value Election list quotas for women, national Yes Party membership quotas, voluntary Yes Indicator 0-1 (Equal rights) Value Access to justice Equal rights Freedom of movement Equal rights Family and care Indicator Unit Value Public spending on family benefits % GPD 8 15 Unmet family planning % women 15-49 n a Early marriage % 5 90 Mean age of women at birth of first child years n a Indicator 0-1 (Equal rights) Value Right to divorce Near-equal rights Indicator Days Female Male Value Length of parental leave 126 00 7 00 42 00 Education and skills Graduates Attainment % Female Male Parity STEM Graduates 18 83 81 17 0 23 Agri , Forestry, Fisheries & Veterinary n a n a n a Arts & Humanities 56 49 43 51 1 30 Business, Admin & Law 56 33 43 67 1 29 Education n a n a n a Engineering, Manuf & Construction 17 74 82 26 0 22 Health & Welfare 78 01 21 99 3 55 Information & Comm Technologies 12 74 87 26 0 15 Natural Sci , Mathematics & Statistics n a n a n a Social Sci , Jour nalism & Information 66 69 33 31 2 00 Vocational training 13 55 12 80 1 06 PhD graduates n a n a n a Graduates % Female Male Value Graduates from tertiary education 11 57 12 57 12 07 Health Indicator Unit Value Prevalence of gender violence in lifetime % women 6 70 Births attended by skilled personnel % live births 99 80 Mater nal mortality deaths per 100,000 live births 13 00 Total fertility rate births per woman 1 54 Indicator 0-1 (Equal rights) Value Reproductive autonomy Uneven rights *Scores
0 to 1 scale, where 1 represents the optimal situation
“parity” Please see Appendix A and B for detailed methodology, definitions, sources and periods. **For all indicators, except the two health indicators, parity is benchmarked at 1 In the case of sex ratio at birth the gender parity benchmark is set at 0 944 (see Klasen and Wink 2003) In the case of healthy life expectancy the gender parity benchmark is set at 1 06, given women's longer life expectancy
are on a
or
Global Gender Gap Index Indicators
Global Gender Gap Report 2023 143 Global Gender Gap Index 2023 Edition China score average score 0.727 Economy 0 935 E d u c a t i o n 0.937 Health 0 114 P o i t i c s Overview Index and Subindex 2023 Score Rank 2022 Score Rank Global Gender Gap Index 0 678 107th 0 682 102nd Economic Participation and Opportunity 0.727 45th 0 741 37th Educational Attainment 0 935 123rd 0 936 120th Health and Survival 0 937 145th 0 940 145th Political Empowerment 0 114 114th 0 113 120th
2023 Indicator Rank Score* Difference F-M Min Max Economic Participation and Opportunity 45th 0 727 -Labour-force participation rate % 62nd 0 815 -14 43 0-100 Wage equality for similar work 1-7 (best) 22nd 0 729Estimated ear ned income int'l $ 1,000 70th 0 644 -7 59 0-150 Legislators, senior officials and managers % - - -Professional and technical workers % - - -Educational Attainment 123rd 0.935 -Literacy rate % 93rd 0 969Enrolment in primary education % - - -Enrolment in secondary education % 131st 0 873 -0 07 0-200 Enrolment in tertiary education % 1st 1 000 10 12 0-200 Health and Survival 145th 0 937 -Sex ratio at birth** % 145th 0 890Healthy life expectancy** years 65th 1 042Political Empowerment 114th 0 114 -Women in parliament % 80th 0 332 -50 20 0-100 Women in ministerial positions % 138th 0 043 -91 67 0-100 Years with female/male head of state (last 50) 75th 0 001 -49 93 0-50 Economy Profile China Score (imparity = 0 parity = 1) 0.678 Rank (out of 146 countries) 107th Index Edition 2023 Compare with Global average 0 1 Female vs Male Min Max78 16 63 7321 32 13 73--0 53 0 47 58 87 68 99-75 10 24 90 95 83 4 17 49 97 0 03
Complementary Targets and Contextual Indicators 2023
Agri
Natural Sci , Mathematics & Statistics
Social Sci , Jour nalism & Information
Indicator Unit
*Scores are on a 0 to 1 scale, where 1 represents the optimal situation or “parity” Please see Appendix A and B for detailed methodology, definitions, sources and periods. **For all indicators, except the two health indicators, parity is benchmarked at 1 In the case of sex ratio at
Global Gender Gap Report 2023 144 Economy Profile China Score 0.678 Rank 107th Page 2 of 2
General indicators Indicator Unit Value GDP US$ billions 17,734 06 GDP per capita constant '17 intl $ 1000 17 60 Population sex ratio female/male 0 96 Population growth rate % 0 09 Indicator Million people Female Male Value Total population 698 24 727 64 1425 89 Work participation and leadership Indicator Unit Value Gender pay gap % (OECD countries only) n a Share of women's membership in boards % (OECD countries only) 13 80 Firms with female majority ownership % firms n a Firms with female top managers % firms n a Share of workers in informal sector % workers n a Indicator 1-7 (best) Value Advancement of women to leadership roles 5 09 Indicator Unit Female Male Value Unemployed adults % of labour force (15-64) n a n a n a Workers employed part-time % of employed people n a n a n a Proportion of time spent on unpaid domestic and care work % 15 35 5 90 n a Indicator Million people Female Male Value Labour-force n a n a n a Access to finance Indicator 0-1 (Equal rights) Value Access to financial services Equal rights Inheritance rights for widows and daughters Equal rights Access to land assets Equal rights Access to non-land assets Equal rights Civil and political freedom Indicator Unit Value Year women received right to vote year 1946, 1949 Number of female heads of state to date number 1 Seats held in upper house % total seats n a Indicator Yes/No Value Election list quotas for women, national Yes Party membership quotas, voluntary Yes Indicator 0-1 (Equal rights) Value Access to justice Equal rights Freedom of movement Equal rights
and care
Unit Value
spending on family benefits % GPD n a
family planning % women 15-49 n a Early marriage % 3 20 Mean
birth
first child years n a
Value
Equal rights Indicator
Female Male Value
158 00 14 00 0 Education and skills Graduates Attainment % Female Male Parity STEM Graduates n a n a n a
Family
Indicator
Public
Unmet
age of women at
of
Indicator 0-1 (Equal rights)
Right to divorce
Days
Length of parental leave
n a n a n a
n a n a n a
, Forestry, Fisheries & Veterinary
Arts & Humanities
n a n a n a Education n a n a n a
n a n a n a Health
Welfare n a n a n a
n a n a n a
Business, Admin & Law
Engineering, Manuf & Construction
&
Information & Comm Technologies
n a n a n a
n a n a n a Vocational training 8 47 7 61 1 11 PhD graduates n a n a n a Graduates % Female Male Value Graduates
tertiary education 45 87 32 46 38 74
from
Health
Value
% women n a Births attended by skilled personnel % live births 99 90 Mater nal mortality deaths per 100,000 live births 29 00 Total fertility rate births per woman 1 28
rights) Value
Equal rights
gender parity benchmark
set
0 944
Klasen
2003)
case of
parity
life expectancy
Prevalence of gender violence in lifetime
Indicator 0-1 (Equal
Reproductive autonomy
birth the
is
at
(see
and Wink
In the
healthy life expectancy the gender
benchmark is set at 1 06, given women's longer
Global Gender Gap Index Indicators
Global Gender Gap Report 2023 145 Global Gender Gap Index 2023 Edition Colombia score average score 0.657 Economy 1 000 E d u c a t i o n 0.975 Health 0 373 P o i t i c s Overview Index and Subindex 2023 Score Rank 2022 Score Rank Global Gender Gap Index 0 751 42nd 0 710 75th Economic Participation and Opportunity 0.657 92nd 0 649 93rd Educational Attainment 1 000 1st 1 000 1st Health and Survival 0 975 51st 0 975 56th Political Empowerment 0 373 34th 0 215 70th
2023 Indicator Rank Score* Difference F-M Min Max Economic Participation and Opportunity 92nd 0 657 -Labour-force participation rate % 104th 0 667 -25 90 0-100 Wage equality for similar work 1-7 (best) 100th 0 591Estimated ear ned income int'l $ 1,000 52nd 0 683 -5 53 0-150 Legislators, senior officials and managers % 70th 0 546 -29 38 0-100 Professional and technical workers % 84th 0 896 -5 48 0-100 Educational Attainment 1st 1.000 -Literacy rate % 1st 1 000Enrolment in primary education % 1st 1 000 1 04 0-100 Enrolment in secondary education % 1st 1 000 4 63 0-200 Enrolment in tertiary education % 1st 1 000 9 97 0-200 Health and Survival 51st 0 975 -Sex ratio at birth** % 1st 0 944Healthy life expectancy** years 62nd 1 045Political Empowerment 34th 0 373 -Women in parliament % 58th 0 406 -42 20 0-100 Women in ministerial positions % 1st 1 000 0 0-100 Years with female/male head of state (last 50) 80th 0 000 -50 00 0-50 Economy Profile Colombia Score (imparity = 0 parity = 1) 0.751 Rank (out of 146 countries) 42nd Index Edition 2023 Compare with Global average 0 1 Female vs Male Min Max77 68 51 7817 45 11 92 64 69 35 31 52 74 47 2698 35 99 38 102 81 107 44 52 22 62 19-71 10 28 90 50 00 50 00 50 00 0
Complementary Targets and Contextual Indicators 2023
Global Gender Gap Report 2023 146 Economy Profile Colombia Score 0.751 Rank 42nd Page 2 of 2
General indicators Indicator Unit Value GDP US$ billions 314 46 GDP per capita constant '17 intl $ 1000 14 65 Population sex ratio female/male 1 03 Population growth rate % 1 14 Indicator Million people Female Male Value Total population 26 30 25 58 51 87 Work participation and leadership Indicator Unit Value Gender pay gap % (OECD countries only) 4 00 Share of women's membership in boards % (OECD countries only) 12 90 Firms with female majority ownership % firms 17 30 Firms with female top managers % firms 18 90 Share of workers in informal sector % workers 63 20 Indicator 1-7 (best) Value Advancement of women to leadership roles 4 61 Indicator Unit Female Male Value Unemployed adults % of labour force (15-64) 13 57 8 78 10 82 Workers employed part-time % of employed people 35 26 18 49 25 10 Proportion of time spent on unpaid domestic and care work % 5 02 2 93 n a Indicator Million people Female Male Value Labour-force 8 86 12 16 21 02 Access to finance Indicator 0-1 (Equal rights) Value Access to financial services Equal rights Inheritance rights for widows and daughters Equal rights Access to land assets Equal rights Access to non-land assets Equal rights Civil and political freedom Indicator Unit Value Year women received right to vote year 1954 Number of female heads of state to date number 0 Seats held in upper house % total seats 30 20 Indicator Yes/No Value Election list quotas for women, national Yes Party membership quotas, voluntary Yes Indicator 0-1 (Equal rights) Value Access to justice Equal rights Freedom of movement Equal rights Family and care Indicator Unit Value Public spending on family benefits % GPD 2 27 Unmet family planning % women 15-49 7 04 Early marriage % 14 50 Mean age of women at birth of first child years n a Indicator 0-1 (Equal rights) Value Right to divorce Equal rights Indicator Days Female Male Value Length of parental leave 84 00 14 00 42 00 Education and skills Graduates Attainment % Female Male Parity STEM Graduates 33 41 66 59 0 50 Agri , Forestry, Fisheries & Veterinary 44 68 55 32 0 81 Arts & Humanities 50 62 49 38 1 02 Business, Admin & Law 62 69 37 31 1 68 Education 68 62 31 38 2 19 Engineering, Manuf & Construction n a n a n a Health & Welfare 72 06 27 94 2 58 Information & Comm Technologies 23 31 76 69 0 30 Natural Sci , Mathematics & Statistics 54 17 45 83 1 18 Social Sci , Jour nalism & Information 70 63 29 37 2 41 Vocational training 9 86 8 76 1 13 PhD graduates n a n a n a Graduates % Female Male Value Graduates from tertiary education 35 64 24 08 29 77 Health Indicator Unit Value Prevalence of gender violence in lifetime % women 37 40 Births attended by skilled personnel % live births 98 80 Mater nal mortality deaths per 100,000 live births 83 00 Total fertility rate births per woman 1 74 Indicator 0-1 (Equal rights) Value Reproductive autonomy Uneven rights *Scores
0 to 1 scale, where 1 represents the optimal situation or “parity” Please see Appendix A and B for detailed methodology, definitions, sources and periods. **For all indicators, except the two health indicators, parity is benchmarked at 1 In the case of sex ratio at birth the gender parity benchmark is set at 0 944 (see Klasen and Wink 2003) In the case of healthy life expectancy the gender parity benchmark is set at 1 06, given women's longer life expectancy
are on a
Global Gender Gap Index Indicators
Global Gender Gap Report 2023 147 Global Gender Gap Index 2023 Edition Comoros score average score 0.657 Economy 0 949 E d u c a t i o n 0.968 Health 0 083 P o i t i c s Overview Index and Subindex 2023 Score Rank 2022 Score Rank Global Gender Gap Index 0 664 114th 0 631 134th Economic Participation and Opportunity 0.657 91st 0 523 129th Educational Attainment 0 949 118th 0 943 116th Health and Survival 0 968 84th 0 968 87th Political Empowerment 0 083 129th 0 090 127th
2023 Indicator Rank Score* Difference F-M Min Max Economic Participation and Opportunity 91st 0 657 -Labour-force participation rate % 94th 0 693 -18 22 0-100 Wage equality for similar work 1-7 (best) - - -Estimated ear ned income int'l $ 1,000 127th 0 456 -2 41 0-150 Legislators, senior officials and managers % 1st 1 000 2 25 0-100 Professional and technical workers % 113th 0 543 -29 64 0-100 Educational Attainment 118th 0.949 -Literacy rate % 123rd 0 850Enrolment in primary education % 66th 1 000 -0 03 0-100 Enrolment in secondary education % 1st 1 000 3 83 0-200 Enrolment in tertiary education % 117th 0 812 -1 86 0-200 Health and Survival 84th 0 968 -Sex ratio at birth** % 1st 0 944Healthy life expectancy** years 95th 1 023Political Empowerment 129th 0 083 -Women in parliament % 114th 0 200 -66 60 0-100 Women in ministerial positions % 129th 0 083 -84 62 0-100 Years with female/male head of state (last 50) 80th 0 000 -50 00 0-50 Economy Profile Comoros Score (imparity = 0 parity = 1) 0.664 Rank (out of 146 countries) 114th Index Edition 2023 Compare with Global average 0 1 Female vs Male Min Max59 35 41 134 43 2 02 48 84 51 09 64 82 35 1881 86 81 83 57 59 61 42 9 91 8 05-83 30 16 70 92 31 7 69 50 00 0
Complementary Targets and Contextual Indicators 2023
Inheritance
Access
Agri , Forestry, Fisheries & Veterinary
& Comm Technologies
Natural Sci , Mathematics & Statistics
Social Sci , Jour nalism & Information
Vocational training
Indicator Unit
*Scores are on a 0 to 1 scale, where 1 represents the optimal situation or “parity” Please see Appendix A and B for detailed methodology, definitions, sources and periods. **For all indicators, except the two
Global Gender Gap Report 2023 148 Economy Profile Comoros Score 0.664 Rank 114th Page 2 of 2
General indicators Indicator Unit Value GDP US$ billions 1 3 GDP per capita constant '17 intl $ 1000 3 23 Population sex ratio female/male 0 99 Population growth rate % 1 90 Indicator Million people Female Male Value Total population 0 42 0 42 0 84 Work participation and leadership Indicator Unit Value Gender pay gap % (OECD countries only) n a Share of women's membership in boards % (OECD countries only) n a Firms with female majority ownership % firms n a Firms with female top managers % firms n a Share of workers in informal sector % workers 87 50 Indicator 1-7 (best) Value Advancement of women to leadership roles n a Indicator Unit Female Male Value Unemployed adults % of labour force (15-64) 6 76 5 56 6 06 Workers employed part-time % of employed people 25 97 22 19 23 77 Proportion of time spent on unpaid domestic and care work % n a n a n a Indicator Million people Female Male Value Labour-force 0 09 0 12 0 21 Access to finance Indicator 0-1 (Equal rights) Value
to financial services Near-equal rights
Access
rights for widows
Unequal rights
and daughters
to land assets Uneven rights
to non-land assets Uneven rights Civil and political freedom Indicator Unit Value Year women received right to vote year 1975 Number of female heads of state to date number 0 Seats held in upper house % total seats n a Indicator Yes/No Value Election list quotas for women, national n a Party membership quotas, voluntary n a Indicator 0-1 (Equal rights) Value Access to justice Near-equal rights Freedom of movement Equal rights Family and care Indicator Unit Value
spending on family benefits % GPD n a
family planning % women 15-49 n a Early marriage % 19 60 Mean age of women at birth of first child years n a Indicator 0-1
rights) Value Right to divorce Restricted rights Indicator Days Female Male Value Length of parental leave 98 00 0 0 Education and skills Graduates Attainment % Female Male Parity STEM Graduates n a n a n a
Access
Public
Unmet
(Equal
n a n a n a Arts &
n a n a n a Business,
Law n a n a n a Education 45 00 55 00 0 82 Engineering, Manuf & Construction n a n a n a Health & Welfare 44 44 55 56 0 80 Information
n a n a n a
Humanities
Admin &
n a n a n a
n a n a n a
n a n a n a PhD
n a n a n a Graduates % Female Male Value
n a n a n a
graduates
Graduates from tertiary education
Health
Value
lifetime % women 6 40
% live births n a Mater
mortality deaths per 100,000 live births 273 00 Total fertility rate births per woman 4 05
Value
Restricted rights
sex ratio
birth the gender parity benchmark is set at 0 944
Klasen
2003) In the case of healthy life expectancy
gender parity benchmark
set
1 06, given women's longer life expectancy
Prevalence of gender violence in
Births attended by skilled personnel
nal
Indicator 0-1 (Equal rights)
Reproductive autonomy
health indicators, parity is benchmarked at 1 In the case of
at
(see
and Wink
the
is
at
Congo,
Global Gender Gap Index Indicators
Global Gender Gap Report 2023 149 Global Gender Gap Index 2023 Edition Congo, Democratic Republic of the score average score 0.676 Economy 0 683 E d u c a t i o n 0.976 Health 0 111 P o i t i c s Overview Index and Subindex 2023 Score Rank 2022 Score Rank Global Gender Gap Index 0 612 140th 0 575 144th Economic Participation and Opportunity 0.676 83rd 0 565 120th Educational Attainment 0 683 144th 0 661 144th Health and Survival 0 976 43rd 0 976 49th Political Empowerment 0 111 116th 0 099 124th
2023 Indicator Rank Score* Difference F-M Min Max Economic Participation and Opportunity 83rd 0 676 -Labour-force participation rate % 10th 0 903 -6 46 0-100 Wage equality for similar work 1-7 (best) 101st 0 590Estimated ear ned income int'l $ 1,000 47th 0 693 -0 39 0-150 Legislators, senior officials and managers % 29th 0 722 -16 11 0-100 Professional and technical workers % 124th 0 433 -39 58 0-100 Educational Attainment 144th 0.683 -Literacy rate % 127th 0 791Enrolment in primary education % - - -Enrolment in secondary education % 139th 0 640 -20 28 0-200 Enrolment in tertiary education % 127th 0 597 -3 53 0-200 Health and Survival 43rd 0 976 -Sex ratio at birth** % 1st 0 944Healthy life expectancy** years 55th 1 050Political Empowerment 116th 0 111 -Women in parliament % 126th 0 147 -74 40 0-100 Women in ministerial positions % 71st 0 265 -58 14 0-100 Years with female/male head of state (last 50) 80th 0 000 -50 00 0-50 Economy Profile
Score (imparity = 0 parity = 1) 0.612 Rank (out of 146 countries) 140th Index Edition 2023 Compare with Global average 0 1 Female vs Male Min Max66 75 60 291 27 0 88 58 06 41 94 69 79 30 21-56 26 35 98 8 76 5 23-87 20 12 80 79 07 20 93 50 00 0
Democratic Republic of the
Complementary Targets and Contextual Indicators 2023
Global Gender Gap Report 2023 150 Economy Profile Congo, Democratic Republic of the Score 0.612 Rank 140th Page 2 of 2
General indicators Indicator Unit Value GDP US$ billions 55 35 GDP per capita constant '17 intl $ 1000 1 07 Population sex ratio female/male 1 02 Population growth rate % 3 22 Indicator Million people Female Male Value Total population 49 89 49 12 99 01 Work participation and leadership Indicator Unit Value Gender pay gap % (OECD countries only) n a Share of women's membership in boards % (OECD countries only) n a Firms with female majority ownership % firms 8 00 Firms with female top managers % firms 10 80 Share of workers in informal sector % workers n a Indicator 1-7 (best) Value Advancement of women to leadership roles 3 66 Indicator Unit Female Male Value Unemployed adults % of labour force (15-64) 1 13 1 87 1 51 Workers employed part-time % of employed people n a n a n a Proportion of time spent on unpaid domestic and care work % n a n a n a Indicator Million people Female Male Value Labour-force 11 37 12 63 24 00 Access to finance Indicator 0-1 (Equal rights) Value Access to financial services Near-equal rights
rights for widows and daughters Near-equal rights Access to land assets Uneven rights Access to non-land assets Uneven rights Civil and political freedom Indicator Unit Value Year women received right to vote year 1967 Number of female heads of state to date number 0 Seats held in upper house % total seats 23 90 Indicator Yes/No Value Election list quotas for women, national n a Party membership quotas, voluntary n a Indicator 0-1 (Equal rights) Value Access to justice Near-equal rights Freedom of movement Equal rights Family and care Indicator Unit Value Public spending on family benefits % GPD n a Unmet family planning % women 15-49 28 75 Early marriage % 23 90 Mean age of women at birth of first child years n a Indicator 0-1 (Equal rights) Value Right to divorce Restricted rights Indicator Days Female Male Value Length of parental leave 98 00 2 00 0 Education and skills Graduates Attainment % Female Male Parity STEM Graduates 25 10 74 90 0 34 Agri , Forestry, Fisheries & Veterinary 25 85 74 15 0 35 Arts & Humanities 53 45 46 55 1 15 Business, Admin & Law 38 34 61 66 0 62 Education 24 54 75 46 0 33 Engineering, Manuf & Construction 9 80 90 20 0 11 Health & Welfare n a n a n a Information & Comm Technologies 36 65 63 35 0 58 Natural Sci , Mathematics & Statistics 32 61 67 39 0 48 Social Sci , Jour nalism & Information 35 35 64 65 0 55 Vocational training n a n a n a PhD graduates 0 01 0 03 0 02 Graduates % Female Male Value Graduates from tertiary education 3 90 6 40 5 15 Health Indicator Unit Value Prevalence of gender violence in lifetime % women 50 70 Births attended by skilled personnel % live births 85 20 Mater nal mortality deaths per 100,000 live births 473 00 Total fertility rate births per woman 6 21 Indicator 0-1 (Equal rights) Value Reproductive autonomy Restricted rights *Scores are on a 0 to 1 scale, where 1 represents the optimal situation or “parity” Please see Appendix A and B for detailed methodology, definitions, sources and periods. **For all indicators, except the two health indicators, parity is benchmarked at 1 In the case of sex ratio at birth the gender parity benchmark is set at 0 944 (see Klasen and Wink 2003) In the case of healthy life expectancy the gender parity benchmark is set at 1 06, given women's longer life expectancy
Inheritance
Global Gender Gap Index Indicators
Global Gender Gap Report 2023 151 Global Gender Gap Index 2023 Edition Costa Rica score average score 0.676 Economy 0 999 E d u c a t i o n 0.973 Health 0 524 P o i t i c s Overview Index and Subindex 2023 Score Rank 2022 Score Rank Global Gender Gap Index 0 793 14th 0 796 12th Economic Participation and Opportunity 0.676 84th 0 645 94th Educational Attainment 0 999 31st 0 999 31st Health and Survival 0 973 60th 0 973 64th Political Empowerment 0 524 10th 0 565 6th
2023 Indicator Rank Score* Difference F-M Min Max Economic Participation and Opportunity 84th 0 676 -Labour-force participation rate % 97th 0 682 -23 38 0-100 Wage equality for similar work 1-7 (best) 94th 0 601Estimated ear ned income int'l $ 1,000 57th 0 676 -8 18 0-150 Legislators, senior officials and managers % 35th 0 673 -19 52 0-100 Professional and technical workers % 87th 0 857 -7 70 0-100 Educational Attainment 31st 0.999 -Literacy rate % 1st 1 000Enrolment in primary education % 71st 0 999 -0 13 0-100 Enrolment in secondary education % 1st 1 000 11 76 0-200 Enrolment in tertiary education % 1st 1 000 11 64 0-200 Health and Survival 60th 0 973 -Sex ratio at birth** % 1st 0 944Healthy life expectancy** years 70th 1 039Political Empowerment 10th 0 524 -Women in parliament % 7th 0 901 -5 20 0-100 Women in ministerial positions % 17th 0 833 -9 09 0-100 Years with female/male head of state (last 50) 40th 0 087 -41 99 0-50 Economy Profile Costa Rica Score (imparity = 0 parity = 1) 0.793 Rank (out of 146 countries) 14th Index Edition 2023 Compare with Global average 0 1 Female vs Male Min Max73 42 50 0425 29 17 11 59 76 40 24 53 85 46 1596 81 96 69 136 27 148 03 51 98 63 62-52 60 47 40 54 55 45 46 46 00 4 00
Complementary Targets and Contextual Indicators 2023
Global Gender Gap Report 2023 152 Economy Profile Costa Rica Score 0.793 Rank 14th Page 2 of 2
General indicators Indicator Unit Value GDP US$ billions 64 28 GDP per capita constant '17 intl $ 1000 21 20 Population sex ratio female/male 1 00 Population growth rate % 0 60 Indicator Million people Female Male Value Total population 2 59 2 59 5 18 Work participation and leadership Indicator Unit Value Gender pay gap % (OECD countries only) 4 73 Share of women's membership in boards % (OECD countries only) n a Firms with female majority ownership % firms n a Firms with female top managers % firms n a Share of workers in informal sector % workers 40 80 Indicator 1-7 (best) Value Advancement of women to leadership roles 4 82 Indicator Unit Female Male Value Unemployed adults % of labour force (15-64) 15 67 9 04 11 78 Workers employed part-time % of employed people 35 79 20 05 26 03 Proportion of time spent on unpaid domestic and care work % 22 15 8 38 n a Indicator Million people Female Male Value Labour-force 0 89 1 29 2 18 Access to finance Indicator 0-1 (Equal rights) Value Access to financial services Restricted rights Inheritance rights for widows and daughters Uneven rights Access to land assets Equal rights Access to non-land assets Equal rights Civil and political freedom Indicator Unit Value Year women received right to vote year 1949 Number of female heads of state to date number 1 Seats held in upper house % total seats n a Indicator Yes/No Value Election list quotas for women, national Yes Party membership quotas, voluntary Yes Indicator 0-1 (Equal rights) Value Access to justice Equal rights Freedom of movement Equal rights Family and care Indicator Unit Value Public spending on family benefits % GPD 0 96 Unmet family planning % women 15-49 13 70 Early marriage % 8 40 Mean age of women at birth of first child years n a Indicator 0-1 (Equal rights) Value Right to divorce Uneven rights Indicator Days Female Male Value Length of parental leave 120 00 8 00 0 Education and skills Graduates Attainment % Female Male Parity STEM Graduates 32 20 67 80 0 47 Agri , Forestry, Fisheries & Veterinary 42 69 57 31 0 74 Arts & Humanities 59 34 40 66 1 46 Business, Admin & Law n a n a n a Education 71 87 28 13 2 56 Engineering, Manuf & Construction 35 37 64 63 0 55 Health & Welfare n a n a n a Information & Comm Technologies 20 29 79 71 0 25 Natural Sci , Mathematics & Statistics 51 72 48 28 1 07 Social Sci , Jour nalism & Information 69 02 30 98 2 23 Vocational training 9 72 8 92 1 09 PhD graduates 0 13 0 33 0 22 Graduates % Female Male Value Graduates from tertiary education n a n a n a Health Indicator Unit Value Prevalence of gender violence in lifetime % women 36 00 Births attended by skilled personnel % live births 99 00 Mater nal mortality deaths per 100,000 live births 27 00 Total fertility rate births per woman 1 55 Indicator 0-1 (Equal rights) Value Reproductive autonomy Restricted rights *Scores
on a 0 to 1 scale, where 1 represents the optimal situation or “parity” Please see Appendix A and B for detailed methodology, definitions, sources and periods. **For all indicators, except the two health indicators, parity is benchmarked at 1 In the case of sex ratio at birth the gender parity benchmark is set at 0 944 (see Klasen and Wink 2003) In the case of healthy life expectancy the gender parity benchmark is set at 1 06, given women's longer life expectancy
are
Global Gender Gap Index Indicators
Global Gender Gap Report 2023 153 Global Gender Gap Index 2023 Edition Côte d'Ivoire score average score 0.601 Economy 0 902 E d u c a t i o n 0.978 Health 0 118 P o i t i c s Overview Index and Subindex 2023 Score Rank 2022 Score Rank Global Gender Gap Index 0 650 122nd 0 632 133rd Economic Participation and Opportunity 0.601 111th 0 570 119th Educational Attainment 0 902 128th 0 890 128th Health and Survival 0 978 33rd 0 978 35th Political Empowerment 0 118 112th 0 087 128th
2023 Indicator Rank Score* Difference F-M Min Max Economic Participation and Opportunity 111th 0 601 -Labour-force participation rate % 74th 0 772 -16 60 0-100 Wage equality for similar work 1-7 (best) 44th 0 690Estimated ear ned income int'l $ 1,000 97th 0 591 -2 73 0-150 Legislators, senior officials and managers % 91st 0 443 -38 57 0-100 Professional and technical workers % 133rd 0 305 -53 28 0-100 Educational Attainment 128th 0.902 -Literacy rate % 105th 0 931Enrolment in primary education % 103rd 0 943 -5 67 0-100 Enrolment in secondary education % 133rd 0 859 -9 19 0-200 Enrolment in tertiary education % 120th 0 783 -2 41 0-200 Health and Survival 33rd 0 978 -Sex ratio at birth** % 1st 0 944Healthy life expectancy** years 44th 1 056Political Empowerment 112th 0 118 -Women in parliament % 122nd 0 159 -72 60 0-100 Women in ministerial positions % 65th 0 280 -56 25 0-100 Years with female/male head of state (last 50) 80th 0 000 -50 00 0-50 Economy Profile Côte d'Ivoire Score (imparity = 0 parity = 1) 0.650 Rank (out of 146 countries) 122nd Index Edition 2023 Compare with Global average 0 1 Female vs Male Min Max72 84 56 246 68 3 95 69 28 30 72 76 64 23 3699 60 93 93 65 20 56 02 11 12 8 71-86 30 13 70 78 13 21 88 50 00 0
Complementary Targets and Contextual Indicators 2023
Inheritance
Health
Indicator Unit
Global Gender Gap Report 2023 154 Economy Profile Côte d'Ivoire Score 0.650 Rank 122nd Page 2 of 2
General indicators Indicator Unit Value GDP US$ billions 70 04 GDP per capita constant '17 intl $ 1000 5 33 Population sex ratio female/male 0 98 Population growth rate % 2 46 Indicator Million people Female Male Value Total population 13 95 14 22 28 16 Work participation and leadership Indicator Unit Value Gender pay gap % (OECD countries only) n a Share of women's membership in boards % (OECD countries only) n a Firms with female majority ownership % firms 13 00 Firms with female top managers % firms 14 30 Share of workers in informal sector % workers 91 70 Indicator 1-7 (best) Value Advancement of women to leadership roles 4 32 Indicator Unit Female Male Value Unemployed adults % of labour force (15-64) 3 05 1 97 2 44 Workers employed part-time % of employed people 37 95 24 19 30 03 Proportion of time spent on unpaid domestic and care work % n a n a n a Indicator Million people Female Male Value Labour-force 3 09 4 34 7 43 Access to finance Indicator 0-1 (Equal rights) Value Access to financial services Near-equal rights
rights for widows and daughters Near-equal rights
to land assets Unequal rights Access to non-land assets Unequal rights Civil and political freedom Indicator Unit Value Year women received right to vote year 1960 Number of female heads of state to date number 0 Seats held in upper house % total seats 21 40 Indicator Yes/No Value Election list quotas for women, national Yes Party membership quotas, voluntary Yes Indicator 0-1 (Equal rights) Value Access to justice Near-equal rights Freedom of movement Equal rights Family and care Indicator Unit Value Public spending on family benefits % GPD n a Unmet family planning % women 15-49 26 29 Early marriage % 22 60 Mean age of women at birth of first child years n a Indicator 0-1 (Equal rights) Value Right to divorce Equal rights Indicator Days Female Male Value Length of parental leave 98 00 2 00 0 Education and skills Graduates Attainment % Female Male Parity STEM Graduates n a n a n a
&
n a n a n a Arts & Humanities n a n a n a Business, Admin & Law n a n a n a Education n a n a n a Engineering, Manuf & Construction n a n a n a Health & Welfare n a n a n a Information & Comm Technologies n a n a n a Natural Sci
Statistics n a n a n a Social Sci
nalism & Information n a n a n a Vocational training 1 82 2 18 0 84 PhD graduates n a n a n a Graduates % Female Male Value Graduates
n a n a n a
Access
Agri , Forestry, Fisheries
Veterinary
, Mathematics &
, Jour
from tertiary education
Value
% women 25 90
live births 73 60
births 617 00
4 47
Prevalence of gender violence in lifetime
Births attended by skilled personnel %
Mater nal mortality deaths per 100,000 live
Total fertility rate births per woman
Value
Indicator 0-1 (Equal rights)
Restricted rights
optimal situation
parity”
Appendix A
B
detailed methodology, definitions, sources
periods.
Reproductive autonomy
*Scores are on a 0 to 1 scale, where 1 represents the
or “
Please see
and
for
and
**For all indicators, except the two health indicators, parity is benchmarked at 1 In the case of sex ratio at birth the gender parity benchmark is set at 0 944 (see Klasen and Wink 2003) In the case of healthy life expectancy the gender parity benchmark is set at 1 06, given women's longer life expectancy
Global Gender Gap Index Indicators
Global Gender Gap Report 2023 155 Global Gender Gap Index 2023 Edition Croatia score average score 0.639 Economy 0 998 E d u c a t i o n 0.978 Health 0 305 P o i t i c s Overview Index and Subindex 2023 Score Rank Global Gender Gap Index 0 730 55th Economic Participation and Opportunity 0.639 99th Educational Attainment 0 998 38th Health and Survival 0 978 35th Political Empowerment 0 305 47th
2023 Indicator Rank Score* Difference F-M Min Max Economic Participation and Opportunity 99th 0 639 -Labour-force participation rate % 71st 0 785 -12 52 0-100 Wage equality for similar work 1-7 (best) 118th 0 497Estimated ear ned income int'l $ 1,000 64th 0 663 -12 88 0-150 Legislators, senior officials and managers % 98th 0 406 -42 21 0-100 Professional and technical workers % 1st 1 000 11 02 0-100 Educational Attainment 38th 0.998 -Literacy rate % 68th 0 995Enrolment in primary education % - - -Enrolment in secondary education % 1st 1 000 5 61 0-200 Enrolment in tertiary education % 1st 1 000 23 16 0-200 Health and Survival 35th 0 978 -Sex ratio at birth** % 112th 0 943Healthy life expectancy** years 43rd 1 056Political Empowerment 47th 0 305 -Women in parliament % 49th 0 466 -36 40 0-100 Women in ministerial positions % 56th 0 333 -50 00 0-100 Years with female/male head of state (last 50) 21st 0 176 -35 07 0-50 Economy Profile Croatia Score (imparity = 0 parity = 1) 0.730 Rank (out of 146 countries) 55th Index Edition 2023 Compare with Global average 0 1 Female vs Male Min Max58 31 45 7938 24 25 35 71 11 28 89 44 49 55 51-97 67 103 28 56 81 79 97-68 20 31 80 75 00 25 00 42 53 7 47
Complementary Targets and Contextual Indicators 2023
Global Gender Gap Report 2023 156 Economy Profile Croatia Score 0.730 Rank 55th Page 2 of 2
General indicators Indicator Unit Value GDP US$ billions 68 96 GDP per capita constant '17 intl $ 1000 31 63 Population sex ratio female/male 1 05 Population growth rate % -3 74 Indicator Million people Female Male Value Total population 2 07 1 96 4 03 Work participation and leadership Indicator Unit Value Gender pay gap % (OECD countries only) 7 57 Share of women's membership in boards % (OECD countries only) n a Firms with female majority ownership % firms 16 80 Firms with female top managers % firms 27 00 Share of workers in informal sector % workers 3 40 Indicator 1-7 (best) Value Advancement of women to leadership roles 3 61 Indicator Unit Female Male Value Unemployed adults % of labour force (15-64) 7 90 6 30 7 10 Workers employed part-time % of employed people 30 24 24 52 27 15 Proportion of time spent on unpaid domestic and care work % n a n a n a Indicator Million people Female Male Value Labour-force 0 80 0 89 1 69 Access to finance Indicator 0-1 (Equal rights) Value Access to financial services Equal rights Inheritance rights for widows and daughters Equal rights
to land assets Near-equal rights Access to non-land assets Near-equal rights Civil and political freedom Indicator Unit Value Year women received right to vote year 1945 Number of female heads of state to date number 2 Seats held in upper house % total seats n a Indicator Yes/No Value Election list quotas for women, national Yes Party membership quotas, voluntary Yes Indicator 0-1 (Equal rights) Value Access to justice Near-equal rights Freedom of movement Equal rights
and care Indicator Unit Value Public spending on family benefits % GPD n a Unmet family planning % women 15-49 n a Early marriage % 2 00 Mean age of women at birth of first child years 29 00 Indicator 0-1 (Equal rights) Value Right to divorce Equal rights Indicator Days Female Male Value Length of parental leave 208 00 14 00 0 Education and skills Graduates Attainment % Female Male Parity STEM Graduates n a n a n a
, Forestry, Fisheries & Veterinary n a n a n a Arts & Humanities n a n a n a Business, Admin & Law n a n a n a Education n a n a n a Engineering, Manuf & Construction n a n a n a Health & Welfare n a n a n a Information & Comm Technologies n a n a n a Natural Sci , Mathematics & Statistics n a n a n a Social Sci , Jour nalism & Information n a n a n a Vocational training 19 33 23 43 0 83 PhD graduates n a n a n a Graduates % Female Male Value Graduates from tertiary education 54 15 33 68 43 65 Health Indicator Unit Value Prevalence of gender violence in lifetime % women 13 00 Births attended by skilled personnel % live births 99 96 Mater nal mortality deaths per 100,000 live births 8 00 Total fertility rate births per woman 1 48 Indicator 0-1 (Equal rights) Value Reproductive autonomy Equal rights *Scores
0
1 scale, where 1 represents the optimal situation or “parity” Please see Appendix A and B for detailed methodology, definitions, sources and periods. **For all indicators, except the two health indicators, parity is benchmarked at 1 In the case of sex ratio at birth the gender parity benchmark is set at 0 944 (see Klasen and Wink 2003) In the case of healthy life expectancy the gender parity benchmark is set at 1 06, given women's longer life expectancy
Access
Family
Agri
are on a
to
Global Gender Gap Index Indicators
Global Gender Gap Report 2023 157 Global Gender Gap Index 2023 Edition Cyprus score average score 0.652 Economy 0 990 E d u c a t i o n 0.963 Health 0 109 P o i t i c s Overview Index and Subindex 2023 Score Rank 2022 Score Rank Global Gender Gap Index 0 678 106th 0 696 93rd Economic Participation and Opportunity 0.652 93rd 0 690 76th Educational Attainment 0 990 80th 0 991 74th Health and Survival 0 963 120th 0 960 132nd Political Empowerment 0 109 117th 0 144 101st
2023 Indicator Rank Score* Difference F-M Min Max Economic Participation and Opportunity 93rd 0 652 -Labour-force participation rate % 57th 0 824 -12 36 0-100 Wage equality for similar work 1-7 (best) 70th 0 626Estimated ear ned income int'l $ 1,000 93rd 0 604 -20 57 0-150 Legislators, senior officials and managers % 118th 0 266 -57 96 0-100 Professional and technical workers % 1st 1 000 1 73 0-100 Educational Attainment 80th 0.990 -Literacy rate % 67th 0 996Enrolment in primary education % 81st 0 995 -0 48 0-100 Enrolment in secondary education % 108th 0 969 -3 14 0-200 Enrolment in tertiary education % 1st 1 000 10 64 0-200 Health and Survival 120th 0 963 -Sex ratio at birth** % 123rd 0 939Healthy life expectancy** years 110th 1 016Political Empowerment 117th 0 109 -Women in parliament % 121st 0 167 -71 40 0-100 Women in ministerial positions % 77th 0 231 -62 50 0-100 Years with female/male head of state (last 50) 80th 0 000 -50 00 0-50 Economy Profile Cyprus Score (imparity = 0 parity = 1) 0.678 Rank (out of 146 countries) 106th Index Edition 2023 Compare with Global average 0 1 Female vs Male Min Max70 25 57 8951 96 31 39 78 98 21 02 49 14 50 8799 66 99 18 102 98 99 84 87 48 98 12-85 70 14 30 81 25 18 75 50 00 0
Complementary Targets and Contextual Indicators 2023
Global Gender Gap Report 2023 158 Economy Profile Cyprus Score 0.678 Rank 106th Page 2 of 2
General indicators Indicator Unit Value GDP US$ billions 28 41 GDP per capita constant '17 intl $ 1000 41 69 Population sex ratio female/male 1 00 Population growth rate % 0 54 Indicator Million people Female Male Value Total population 0 63 0 63 1 25 Work participation and leadership Indicator Unit Value Gender pay gap % (OECD countries only) 16 58 Share of women's membership in boards % (OECD countries only) n a Firms with female majority ownership % firms 7 70 Firms with female top managers % firms 8 20 Share of workers in informal sector % workers 4 80 Indicator 1-7 (best) Value Advancement of women to leadership roles 4 66 Indicator Unit Female Male Value Unemployed adults % of labour force (15-64) 7 80 6 10 6 90 Workers employed part-time % of employed people 37 69 31 66 34 49 Proportion of time spent on unpaid domestic and care work % n a n a n a Indicator Million people Female Male Value Labour-force 0 21 0 23 0 44 Access to finance Indicator 0-1 (Equal rights) Value Access to financial services Equal rights Inheritance rights for widows and daughters Equal rights Access to land assets Equal rights Access to non-land assets Equal rights Civil and political freedom Indicator Unit Value Year women received right to vote year 1960 Number of female heads of state to date number 0 Seats held in upper house % total seats n a Indicator Yes/No Value Election list quotas for women, national Yes Party membership quotas, voluntary Yes Indicator 0-1 (Equal rights) Value Access to justice Equal rights Freedom of movement Restricted rights Family and care Indicator Unit Value Public spending on family benefits % GPD n a Unmet family planning % women 15-49 n a Early marriage % 3 20 Mean age of women at birth of first child years 30 00 Indicator 0-1 (Equal rights) Value Right to divorce Uneven rights Indicator Days Female Male Value Length of parental leave 126 00 14 00 0 Education and skills Graduates Attainment % Female Male Parity STEM Graduates n a n a n a Agri , Forestry, Fisheries & Veterinary 34 48 65 52 0 53 Arts & Humanities n a n a n a Business, Admin & Law 55 47 44 53 1 25 Education 86 89 13 11 6 63 Engineering, Manuf & Construction 32 85 67 15 0 49 Health & Welfare 76 42 23 58 3 24 Information & Comm Technologies 28 46 71 54 0 40 Natural Sci , Mathematics & Statistics 69 49 30 51 2 28 Social Sci , Jour nalism & Information 74 43 25 57 2 91 Vocational training 3 96 10 37 0 38 PhD graduates 0 85 1 26 1 05 Graduates % Female Male Value Graduates from tertiary education 30 91 26 04 28 53 Health Indicator Unit Value Prevalence of gender violence in lifetime % women 15 00 Births attended by skilled personnel % live births 99 30 Mater nal mortality deaths per 100,000 live births 6 00 Total fertility rate births per woman 1 33 Indicator 0-1 (Equal rights) Value Reproductive autonomy Near-equal rights *Scores
optimal situation
methodology, de
periods. **For
two health indicators, parity is benchmarked at 1
the case of sex ratio at birth the gender parity benchmark is set at 0 944 (see Klasen and Wink 2003) In the case of healthy life expectancy
gender parity benchmark is set at 1 06, given women's longer life expectancy
are on a 0 to 1 scale, where 1 represents the
or “parity” Please see Appendix A and B for detailed
finitions, sources and
all indicators, except the
In
the
Global Gender Gap Index Indicators
Global Gender Gap Report 2023 159 Global Gender Gap Index 2023 Edition Czech Republic score average score 0.636 Economy 1 000 E d u c a t i o n 0.978 Health 0 128 P o i t i c s Overview Index and Subindex 2023 Score Rank 2022 Score Rank Global Gender Gap Index 0 685 101st 0 710 76th Economic Participation and Opportunity 0.636 101st 0 645 95th Educational Attainment 1 000 1st 1 000 1st Health and Survival 0 978 37th 0 978 41st Political Empowerment 0 128 108th 0 216 67th
2023 Indicator Rank Score* Difference F-M Min Max Economic Participation and Opportunity 101st 0 636 -Labour-force participation rate % 78th 0 764 -16 09 0-100 Wage equality for similar work 1-7 (best) 104th 0 587Estimated ear ned income int'l $ 1,000 95th 0 599 -20 54 0-150 Legislators, senior officials and managers % 101st 0 396 -43 27 0-100 Professional and technical workers % 77th 0 917 -4 32 0-100 Educational Attainment 1st 1.000 -Literacy rate % 1st 1 000Enrolment in primary education % 1st 1 000 0 75 0-100 Enrolment in secondary education % 1st 1 000 0 98 0-200 Enrolment in tertiary education % 1st 1 000 22 20 0-200 Health and Survival 37th 0 978 -Sex ratio at birth** % 1st 0 944Healthy life expectancy** years 48th 1 054Political Empowerment 108th 0 128 -Women in parliament % 77th 0 351 -48 00 0-100 Women in ministerial positions % 130th 0 077 -85 71 0-100 Years with female/male head of state (last 50) 80th 0 000 -50 00 0-50 Economy Profile
Score (imparity = 0 parity = 1) 0.685 Rank (out of 146 countries) 101st Index Edition 2023 Compare with Global average 0 1 Female vs Male Min Max68 05 51 9651 16 30 62 71 63 28 37 52 16 47 8498 32 99 06 100 46 101 44 57 23 79 43-74 00 26 00 92 86 7 14 50 00 0
Czech Republic
Complementary Targets and Contextual Indicators 2023
Global Gender Gap Report 2023 160 Economy Profile Czech Republic Score 0.685 Rank 101st Page 2 of 2
General indicators Indicator Unit Value GDP US$ billions 281 78 GDP per capita constant '17 intl $ 1000 40 74 Population sex ratio female/male 1 03 Population growth rate % -1 81 Indicator Million people Female Male Value Total population 5 33 5 17 10 49 Work participation and leadership Indicator Unit Value Gender pay gap % (OECD countries only) 11 52 Share of women's membership in boards % (OECD countries only) 23 00 Firms with female majority ownership % firms 16 00 Firms with female top managers % firms 16 10 Share of workers in informal sector % workers 16 80 Indicator 1-7 (best) Value Advancement of women to leadership roles 5 43 Indicator Unit Female Male Value Unemployed adults % of labour force (15-64) 2 80 1 80 2 30 Workers employed part-time % of employed people 34 46 23 16 28 14 Proportion of time spent on unpaid domestic and care work % n a n a n a Indicator Million people Female Male Value Labour-force 2 24 2 78 5 02 Access to finance Indicator 0-1 (Equal rights) Value Access to financial services Near-equal rights Inheritance rights for widows and daughters Equal rights Access to land assets Equal rights Access to non-land assets Equal rights Civil and political freedom Indicator Unit Value Year women received right to vote year 1993 Number of female heads of state to date number 0 Seats held in upper house % total seats 18 50 Indicator Yes/No Value Election list quotas for women, national n a Party membership quotas, voluntary n a Indicator 0-1 (Equal rights) Value Access to justice Near-equal rights Freedom of movement Equal rights Family and care Indicator Unit Value Public spending on family benefits % GPD 2 10 Unmet family planning % women 15-49 n a Early marriage % 0 20 Mean age of women at birth of first child years 28 50 Indicator 0-1 (Equal rights) Value Right to divorce Near-equal rights Indicator Days Female Male Value Length of parental leave 196 00 14 00 720 00 Education and skills Graduates Attainment % Female Male Parity STEM Graduates 35 57 64 43 0 55 Agri , Forestry, Fisheries & Veterinary 63 18 36 82 1 72 Arts & Humanities 68 76 31 24 2 20 Business, Admin & Law 64 67 35 33 1 83 Education 83 23 16 77 4 96 Engineering, Manuf & Construction n a n a n a Health & Welfare n a n a n a Information & Comm Technologies 15 57 84 43 0 18 Natural Sci , Mathematics & Statistics 59 87 40 13 1 49 Social Sci , Jour nalism & Information 68 64 31 36 2 19 Vocational training 25 44 29 98 0 85 PhD graduates 0 45 0 92 0 68 Graduates % Female Male Value Graduates from tertiary education 57 15 33 17 44 87 Health Indicator Unit Value Prevalence of gender violence in lifetime % women 21 00 Births attended by skilled personnel % live births 99 80 Mater nal mortality deaths per 100,000 live births 3 00 Total fertility rate births per woman 1 71 Indicator 0-1 (Equal rights) Value Reproductive autonomy Equal rights *Scores are on a 0 to 1 scale, where 1 represents the optimal situation or “parity” Please see Appendix A and B for detailed methodology, definitions, sources and periods. **For all indicators, except the two health indicators, parity is benchmarked at 1 In the case of sex ratio at birth the gender parity benchmark is set at 0 944 (see Klasen and Wink 2003) In the case of healthy life expectancy the gender parity benchmark is set at 1 06, given women's longer life expectancy
Global Gender Gap Index Indicators
Global Gender Gap Report 2023 161 Global Gender Gap Index 2023 Edition Denmark score average score 0.727 Economy 0 998 E d u c a t i o n 0.964 Health 0 432 P o i t i c s Overview Index and Subindex 2023 Score Rank 2022 Score Rank Global Gender Gap Index 0 780 23rd 0 764 32nd Economic Participation and Opportunity 0.727 46th 0 722 54th Educational Attainment 0 998 40th 0 998 40th Health and Survival 0 964 112th 0 964 114th Political Empowerment 0 432 24th 0 370 32nd
2023 Indicator Rank Score* Difference F-M Min Max Economic Participation and Opportunity 46th 0 727 -Labour-force participation rate % 31st 0 865 -9 04 0-100 Wage equality for similar work 1-7 (best) 50th 0 667Estimated ear ned income int'l $ 1,000 25th 0 760 -15 85 0-150 Legislators, senior officials and managers % 102nd 0 393 -43 55 0-100 Professional and technical workers % 1st 1 000 1 13 0-100 Educational Attainment 40th 0.998 -Literacy rate % 1st 1 000Enrolment in primary education % 1st 1 000 0 65 0-100 Enrolment in secondary education % 87th 0 993 -0 96 0-200 Enrolment in tertiary education % 1st 1 000 27 28 0-200 Health and Survival 112th 0 964 -Sex ratio at birth** % 1st 0 944Healthy life expectancy** years 121st 1 010Political Empowerment 24th 0 432 -Women in parliament % 16th 0 773 -12 80 0-100 Women in ministerial positions % 45th 0 467 -36 36 0-100 Years with female/male head of state (last 50) 22nd 0 174 -35 17 0-50 Economy Profile Denmark Score (imparity = 0 parity = 1) 0.780 Rank (out of 146 countries) 23rd Index Edition 2023 Compare with Global average 0 1 Female vs Male Min Max67 11 58 0765 93 50 08 71 78 28 22 49 44 50 5799 00 99 65 131 33 130 37 69 56 96 85-56 40 43 60 68 18 31 82 42 58 7 42
Complementary Targets and Contextual Indicators 2023
Global Gender Gap Report 2023 162 Economy Profile Denmark Score 0.780 Rank 23rd Page 2 of 2
General indicators Indicator Unit Value GDP US$ billions 398 3 GDP per capita constant '17 intl $ 1000 57 96 Population sex ratio female/male 1 01 Population growth rate % 0 43 Indicator Million people Female Male Value Total population 2 96 2 93 5 88 Work participation and leadership Indicator Unit Value Gender pay gap % (OECD countries only) 4 99 Share of women's membership in boards % (OECD countries only) 34 90 Firms with female majority ownership % firms 9 20 Firms with female top managers % firms 8 30 Share of workers in informal sector % workers 7 60 Indicator 1-7 (best) Value Advancement of women to leadership roles 5 93 Indicator Unit Female Male Value Unemployed adults % of labour force (15-64) 4 50 4 50 4 50 Workers employed part-time % of employed people 53 25 34 08 43 08 Proportion of time spent on unpaid domestic and care work % n a n a n a Indicator Million people Female Male Value Labour-force 1 27 1 42 2 69 Access to finance Indicator 0-1 (Equal rights) Value Access to financial services Equal rights Inheritance rights for widows and daughters Equal rights Access to land assets Equal rights Access to non-land assets Equal rights Civil and political freedom Indicator Unit Value Year women received right to vote year 1908, 1908, 1915 Number of female heads of state to date number 2 Seats held in upper house % total seats n a Indicator Yes/No Value Election list quotas for women, national n a Party membership quotas, voluntary n a Indicator 0-1 (Equal rights) Value Access to justice Equal rights Freedom of movement Equal rights Family and care Indicator Unit Value Public spending on family benefits % GPD 3 31 Unmet family planning % women 15-49 n a Early marriage % 0 10 Mean age of women at birth of first child years 29 80 Indicator 0-1 (Equal rights) Value Right to divorce Equal rights Indicator Days Female Male Value Length of parental leave 42 00 14 00 182 00 Education and skills Graduates Attainment % Female Male Parity STEM Graduates n a n a n a Agri , Forestry, Fisheries & Veterinary 64 31 35 69 1 80 Arts & Humanities 65 21 34 79 1 87 Business, Admin & Law n a n a n a Education 70 49 29 51 2 39 Engineering, Manuf & Construction 29 04 70 96 0 41 Health & Welfare 75 58 24 42 3 10 Information & Comm Technologies 24 00 76 00 0 32 Natural Sci , Mathematics & Statistics n a n a n a Social Sci , Jour nalism & Information 60 53 39 47 1 53 Vocational training 8 69 14 93 0 58 PhD graduates 0 93 1 32 1 13 Graduates % Female Male Value Graduates from tertiary education 71 66 47 34 59 18 Health Indicator Unit Value Prevalence of gender violence in lifetime % women 32 00 Births attended by skilled personnel % live births 95 30 Mater nal mortality deaths per 100,000 live births 4 00 Total fertility rate births per woman 1 67 Indicator 0-1 (Equal rights) Value Reproductive autonomy Equal rights *Scores
health indicators, parity
benchmarked
1
case
sex ratio at birth the gender parity benchmark is set at 0 944 (see Klasen and Wink 2003) In the case of healthy life expectancy
gender parity benchmark
set at 1 06, given women's longer life expectancy
are on a 0 to 1 scale, where 1 represents the optimal situation or “parity” Please see Appendix A and B for detailed methodology, definitions, sources and periods. **For all indicators, except the two
is
at
In the
of
the
is
Global Gender Gap Index Indicators
Global Gender Gap Report 2023 163 Global Gender Gap Index 2023 Edition Dominican Republic score average score 0.699 Economy 1 000 E d u c a t i o n 0.980 Health 0 138 P o i t i c s Overview Index and Subindex 2023 Score Rank 2022 Score Rank Global Gender Gap Index 0 704 81st 0 703 84th Economic Participation and Opportunity 0.699 65th 0 662 87th Educational Attainment 1 000 1st 1 000 23rd Health and Survival 0 980 1st 0 980 1st Political Empowerment 0 138 104th 0 172 86th
2023 Indicator Rank Score* Difference F-M Min Max Economic Participation and Opportunity 65th 0 699 -Labour-force participation rate % 100th 0 675 -24 71 0-100 Wage equality for similar work 1-7 (best) 73rd 0 623Estimated ear ned income int'l $ 1,000 79th 0 629 -8 48 0-150 Legislators, senior officials and managers % 27th 0 749 -14 35 0-100 Professional and technical workers % 1st 1 000 18 28 0-100 Educational Attainment 1st 1.000 -Literacy rate % 1st 1 000Enrolment in primary education % 1st 1 000 1 52 0-100 Enrolment in secondary education % 1st 1 000 6 94 0-200 Enrolment in tertiary education % 1st 1 000 34 03 0-200 Health and Survival 1st 0 980 -Sex ratio at birth** % 1st 0 944Healthy life expectancy** years 1st 1 060Political Empowerment 104th 0 138 -Women in parliament % 65th 0 387 -44 20 0-100 Women in ministerial positions % 132nd 0 071 -86 67 0-100 Years with female/male head of state (last 50) 80th 0 000 -50 00 0-50 Economy Profile
Score (imparity = 0 parity = 1) 0.704 Rank (out of 146 countries) 81st Index Edition 2023 Compare with Global average 0 1 Female vs Male Min Max76 04 51 3322 85 14 37 57 18 42 82 40 86 59 1488 73 90 25 72 03 78 97 42 98 77 01-72 10 27 90 93 33 6 67 50 00 0
Dominican Republic
Complementary Targets and Contextual Indicators 2023
Global Gender Gap Report 2023 164 Economy Profile Dominican Republic Score 0.704 Rank 81st Page 2 of 2
General indicators Indicator Unit Value GDP US$ billions 94 24 GDP per capita constant '17 intl $ 1000 18 63 Population sex ratio female/male 0 99 Population growth rate % 1 07 Indicator Million people Female Male Value Total population 5 59 5 63 11 23 Work participation and leadership Indicator Unit Value Gender pay gap % (OECD countries only) n a Share of women's membership in boards % (OECD countries only) n a Firms with female majority ownership % firms 13 40 Firms with female top managers % firms 21 20 Share of workers in informal sector % workers 57 30 Indicator 1-7 (best) Value Advancement of women to leadership roles 4 93 Indicator Unit Female Male Value Unemployed adults % of labour force (15-64) 12 83 4 61 8 14 Workers employed part-time % of employed people 37 50 24 08 29 48 Proportion of time spent on unpaid domestic and care work % 16 71 3 79 n a Indicator Million people Female Male Value Labour-force 1 77 2 34 4 11 Access to finance Indicator 0-1 (Equal rights) Value Access to financial services Equal rights Inheritance rights for widows and daughters Equal rights Access to land assets Equal rights Access to non-land assets Equal rights Civil and political freedom Indicator Unit Value Year women received right to vote year n a Number of female heads of state to date number 0 Seats held in upper house % total seats 12 50 Indicator Yes/No Value Election list quotas for women, national Yes Party membership quotas, voluntary Yes Indicator 0-1 (Equal rights) Value Access to justice Equal rights Freedom of movement Equal rights Family and care Indicator Unit Value Public spending on family benefits % GPD n a Unmet family planning % women 15-49 15 34 Early marriage % 27 40 Mean age of women at birth of first child years n a Indicator 0-1 (Equal rights) Value Right to divorce Near-equal rights Indicator Days Female Male Value Length of parental leave 98 00 2 00 0 Education and skills Graduates Attainment % Female Male Parity STEM Graduates n a n a n a Agri , Forestry, Fisheries & Veterinary n a n a n a Arts & Humanities 73 75 26 25 2 81 Business, Admin & Law 60 69 39 31 1 54 Education 79 13 20 87 3 79 Engineering, Manuf & Construction 38 40 61 60 0 62 Health & Welfare n a n a n a Information & Comm Technologies 39 41 60 59 0 65 Natural Sci , Mathematics & Statistics 54 07 45 93 1 18 Social Sci , Jour nalism & Information 56 97 43 03 1 32 Vocational training 6 76 4 69 1 44 PhD graduates 0 0 0 Graduates % Female Male Value Graduates from tertiary education 41 71 21 05 31 36 Health Indicator Unit Value Prevalence of gender violence in lifetime % women 20 40 Births attended by skilled personnel % live births 99 20 Mater nal mortality deaths per 100,000 live births 95 00 Total fertility rate births per woman 2 30 Indicator 0-1 (Equal rights) Value Reproductive autonomy Restricted rights *Scores are on a 0 to 1 scale, where 1 represents the optimal situation or “parity” Please see Appendix A and B for detailed methodology, definitions, sources and periods. **For all indicators, except the two health indicators, parity is benchmarked at 1 In the case of sex ratio at birth the gender parity benchmark is set at 0 944 (see Klasen and Wink 2003) In the case of healthy life expectancy the gender parity benchmark is set at 1 06, given women's longer life expectancy
Global Gender Gap Index Indicators
Global Gender Gap Report 2023 165 Global Gender Gap Index 2023 Edition Ecuador score average score 0.705 Economy 0 998 E d u c a t i o n 0.968 Health 0 278 P o i t i c s Overview Index and Subindex 2023 Score Rank 2022 Score Rank Global Gender Gap Index 0 737 50th 0 743 41st Economic Participation and Opportunity 0.705 61st 0 699 71st Educational Attainment 0 998 42nd 0 991 71st Health and Survival 0 968 85th 0 968 88th Political Empowerment 0 278 53rd 0 312 41st
2023 Indicator Rank Score* Difference F-M Min Max Economic Participation and Opportunity 61st 0 705 -Labour-force participation rate % 95th 0 688 -24 41 0-100 Wage equality for similar work 1-7 (best) 92nd 0 602Estimated ear ned income int'l $ 1,000 22nd 0 767 -2 81 0-150 Legislators, senior officials and managers % 53rd 0 607 -24 46 0-100 Professional and technical workers % 1st 1 000 6 41 0-100 Educational Attainment 42nd 0.998 -Literacy rate % 78th 0 991Enrolment in primary education % 1st 1 000 2 57 0-100 Enrolment in secondary education % 1st 1 000 2 14 0-200 Enrolment in tertiary education % 1st 1 000 9 32 0-200 Health and Survival 85th 0 968 -Sex ratio at birth** % 1st 0 944Healthy life expectancy** years 96th 1 023Political Empowerment 53rd 0 278 -Women in parliament % 29th 0 631 -22 60 0-100 Women in ministerial positions % 56th 0 333 -50 00 0-100 Years with female/male head of state (last 50) 77th 0 000 -49 99 0-50 Economy Profile Ecuador Score (imparity = 0 parity = 1) 0.737 Rank (out of 146 countries) 50th Index Edition 2023 Compare with Global average 0 1 Female vs Male Min Max78 26 53 8512 08 9 26 62 23 37 77 46 80 53 2094 97 97 53 99 81 101 95 48 01 57 33-61 30 38 70 75 00 25 00 50 00 0 01
Complementary Targets and Contextual Indicators 2023
Global Gender Gap Report 2023 166 Economy Profile Ecuador Score 0.737 Rank 50th Page 2 of 2
General indicators Indicator Unit Value GDP US$ billions 106 17 GDP per capita constant '17 intl $ 1000 10 67 Population sex ratio female/male 1 00 Population growth rate % 1 18 Indicator Million people Female Male Value Total population 9 02 8 98 18 00 Work participation and leadership Indicator Unit Value Gender pay gap % (OECD countries only) n a Share of women's membership in boards % (OECD countries only) n a Firms with female majority ownership % firms 17 70 Firms with female top managers % firms 22 90 Share of workers in informal sector % workers 68 60 Indicator 1-7 (best) Value Advancement of women to leadership roles 4 53 Indicator Unit Female Male Value Unemployed adults % of labour force (15-64) 4 70 3 42 3 97 Workers employed part-time % of employed people 52 10 35 40 42 30 Proportion of time spent on unpaid domestic and care work % n a n a n a Indicator Million people Female Male Value Labour-force 3 04 3 98 7 02 Access to finance Indicator 0-1 (Equal rights) Value Access to financial services Equal rights Inheritance rights for widows and daughters Near-equal rights Access to land assets Near-equal rights Access to non-land assets Restricted rights Civil and political freedom Indicator Unit Value Year women received right to vote year 1929, 1967 Number of female heads of state to date number 1 Seats held in upper house % total seats n a Indicator Yes/No Value Election list quotas for women, national Yes Party membership quotas, voluntary Yes Indicator 0-1 (Equal rights) Value Access to justice Equal rights Freedom of movement Equal rights Family and care Indicator Unit Value Public spending on family benefits % GPD n a Unmet family planning % women 15-49 7 14 Early marriage % 21 90 Mean age of women at birth of first child years n a Indicator 0-1 (Equal rights) Value Right to divorce Near-equal rights Indicator Days Female Male Value Length of parental leave 84 00 14 00 0 Education and skills Graduates Attainment % Female Male Parity STEM Graduates 29 23 70 77 0 41 Agri , Forestry, Fisheries & Veterinary n a n a n a Arts & Humanities 48 78 51 22 0 95 Business, Admin & Law 59 75 40 25 1 48 Education 72 91 27 09 2 69 Engineering, Manuf & Construction 20 66 79 34 0 26 Health & Welfare 71 30 28 70 2 48 Information & Comm Technologies 36 82 63 18 0 58 Natural Sci , Mathematics & Statistics 47 86 52 14 0 92 Social Sci , Jour nalism & Information 64 50 35 50 1 82 Vocational training 6 64 8 29 0 80 PhD graduates n a n a n a Graduates % Female Male Value Graduates from tertiary education 41 87 29 99 35 85
Indicator Unit Value Prevalence of gender violence in lifetime % women 37 50 Births attended by skilled personnel % live births 97 15 Mater nal mortality deaths per 100,000 live births 59 00 Total fertility rate births per woman 2 05 Indicator 0-1 (Equal rights) Value Reproductive autonomy Uneven rights *Scores
two health indicators, parity is benchmarked at 1 In the case of sex ratio at birth the gender parity benchmark is set at 0 944 (see Klasen and Wink 2003) In the case of healthy life expectancy
gender parity benchmark is set at 1 06, given women's longer life expectancy
Health
are on a 0 to 1 scale, where 1 represents the optimal situation or “parity” Please see Appendix A and B for detailed methodology, definitions, sources and periods. **For all indicators, except the
the
Global Gender Gap Index Indicators
Global Gender Gap Report 2023 167 Global Gender Gap Index 2023 Edition Egypt score average score 0.420 Economy 0.943 Education 0.968 Health 0.175 Politics Overview Index and Subindex 2023 Score Rank 2022 Score Rank Global Gender Gap Index 0.626 134th 0.635 129th Economic Participation and Opportunity 0.420 140th 0.403 142nd Educational Attainment 0.943 119th 0.971 103rd Health and Survival 0.968 90th 0.968 93rd Political Empowerment 0.175 85th 0.198 78th
2023 Indicator Rank Score* Difference F-M Min Max Economic Participation and Opportunity 140th 0.420 -Labour-force participation rate % 145th 0.222 -53.76 0-100 Wage equality for similar work 1-7 (best) 3rd 0.794Estimated earned income int'l $ 1,000 143rd 0.197 -15.39 0-150 Legislators, senior officials and managers % 134th 0.141 -75.27 0-100 Professional and technical workers % 114th 0.540 -29.86 0-100 Educational Attainment 119th 0.943 -Literacy rate % 122nd 0.855Enrolment in primary education % - - -Enrolment in secondary education % 90th 0.990 -0.86 0-200 Enrolment in tertiary education % 103rd 0.990 -0.45 0-200 Health and Survival 90th 0.968 -Sex ratio at birth** % 1st 0.944 -Healthy life expectancy** years 99th 1.022 -Political Empowerment 85th 0.175 -Women in parliament % 68th 0.379 -45.00 0-100 Women in ministerial positions % 77th 0.231 -62.50 0-100 Years with female/male head of state (last 50) 80th 0.000 -50.00 0-50 Economy Profile Egypt Score (imparity = 0, parity = 1) 0.626 Rank (out of 146 countries) 134th Index Edition 2023 Compare with Global average 0 1 Female vs Male Min Max69.10 15.3419.17 3.78 87.63 12.37 64.93 35.07-89.90 89.04 42.94 42.49-72.50 27.50 81.25 18.75 50.00 0
Complementary Targets and Contextual Indicators 2023
Inheritance rights for widows and daughters
Access to land assets
Access to non-land assets
*Scores are on a 0 to 1 scale, where 1 represents the optimal situation or “parity”. Please see Appendix A and B for detailed methodology, definitions, sources and periods. **For all indicators, except the two health indicators, parity is benchmarked at 1. In the case of sex ratio at birth, the gender parity benchmark is set at 0.944 (see Klasen and Wink, 2003). In the case of healthy life expectancy the gender parity benchmark is set at 1.06, given women's longer life expectancy
Global Gender Gap Report 2023 168 Economy Profile Egypt Score 0.626 Rank 134th Page 2 of 2
General indicators Indicator Unit Value GDP US$ billions 404.14 GDP per capita constant '17, intl. $ 1000 11.57 Population sex ratio female/male 0.98 Population growth rate % 1.66 Indicator Million people Female Male Value Total population 54.87 56.13 110.99 Work participation and leadership Indicator Unit Value Gender pay gap % (OECD countries only) n. a. Share of women's membership in boards % (OECD countries only) n. a. Firms with female majority ownership % firms n. a. Firms with female top managers % firms 6.30 Share of workers in informal sector % workers 67.00 Indicator 1-7 (best) Value Advancement of women to leadership roles 5.63 Indicator Unit Female Male Value Unemployed adults % of labour force (15-64) 16.22 5.72 7.56 Workers employed part-time % of employed people 32.26 17.18 19.55 Proportion of time spent on unpaid domestic and care work % 22.36 2.43 n. a. Indicator Million people Female Male Value Labour-force 4.32 20.23 24.55
Access to finance
Value
Indicator 0-1 (Equal rights)
Near-equal rights
Access to financial services
Unequal rights
Restricted rights
Civil
Indicator Unit Value Year women received right to vote year 1956, 1979 Number of female heads of state to date number 0 Seats held in upper house % total seats 13.70 Indicator Yes/No Value Election list quotas for women, national Yes Party membership quotas, voluntary Yes Indicator 0-1 (Equal rights) Value Access to justice Restricted rights Freedom of movement Restricted rights Family and care Indicator Unit Value Public spending on family benefits % GPD n. a. Unmet family planning % women 15-49 12.60 Early marriage % 14.80 Mean age of women at birth of first child years n. a. Indicator 0-1 (Equal rights) Value Right to divorce Unequal rights Indicator Days Female Male Value Length of parental leave 90.00 0 0 Education and skills Graduates Attainment % Female Male Parity STEM Graduates 36.90 63.10 0.58 Agri., Forestry, Fisheries & Veterinary 49.37 50.63 0.98 Arts & Humanities n. a. n. a. n. a. Business, Admin. & Law 35.85 64.15 0.56 Education 69.15 30.85 2.24 Engineering, Manuf. & Construction 20.93 79.07 0.26 Health & Welfare 55.95 44.05 1.27 Information & Comm. Technologies n. a. n. a. n. a. Natural Sci., Mathematics & Statistics 64.16 35.84 1.79 Social Sci., Journalism & Information 41.34 58.66 0.70 Vocational training 9.96 13.19 0.76 PhD graduates 0.24 0.36 0.31 Graduates % Female Male Value Graduates from tertiary education 18.64 16.88 17.74 Health Indicator Unit Value Prevalence of gender violence in lifetime % women n. a. Births attended by skilled personnel % live births 91.50 Maternal mortality deaths per 100,000 live births 37.00 Total fertility rate births per woman 2.96 Indicator
rights) Value Reproductive autonomy Restricted rights
Restricted rights
and political freedom
0-1 (Equal
Global Gender Gap Index Indicators
Global Gender Gap Report 2023 169 Global Gender Gap Index 2023 Edition El Salvador score average score 0.619 Economy 0 993 E d u c a t i o n 0.980 Health 0 265 P o i t i c s Overview Index and Subindex 2023 Score Rank 2022 Score Rank Global Gender Gap Index 0 714 68th 0 727 59th Economic Participation and Opportunity 0.619 103rd 0 628 103rd Educational Attainment 0 993 69th 0 993 64th Health and Survival 0 980 1st 0 980 1st Political Empowerment 0 265 55th 0 309 43rd
2023 Indicator Rank Score* Difference F-M Min Max Economic Participation and Opportunity 103rd 0 619 -Labour-force participation rate % 120th 0 591 -31 39 0-100 Wage equality for similar work 1-7 (best) 115th 0 528Estimated ear ned income int'l $ 1,000 89th 0 613 -4 41 0-150 Legislators, senior officials and managers % 32nd 0 697 -17 88 0-100 Professional and technical workers % 93rd 0 810 -10 49 0-100 Educational Attainment 69th 0.993 -Literacy rate % 95th 0 965Enrolment in primary education % 1st 1 000 0 40 0-100 Enrolment in secondary education % 1st 1 000 0 48 0-200 Enrolment in tertiary education % 1st 1 000 3 98 0-200 Health and Survival 1st 0 980 -Sex ratio at birth** % 1st 0 944Healthy life expectancy** years 1st 1 060Political Empowerment 55th 0 265 -Women in parliament % 69th 0 377 -45 20 0-100 Women in ministerial positions % 30th 0 600 -25 00 0-100 Years with female/male head of state (last 50) 80th 0 000 -50 00 0-50 Economy Profile
Score (imparity = 0 parity = 1) 0.714 Rank (out of 146 countries) 68th Index Edition 2023 Compare with Global average 0 1 Female vs Male Min Max76 79 45 4011 40 6 99 58 94 41 06 55 25 44 7592 97 93 36 76 66 77 14 27 91 31 89-72 60 27 40 62 50 37 50 50 00 0
El Salvador
Complementary Targets and Contextual Indicators 2023
Global Gender Gap Report 2023 170 Economy Profile El Salvador Score 0.714 Rank 68th Page 2 of 2
General indicators Indicator Unit Value GDP US$ billions 28 74 GDP per capita constant '17 intl $ 1000 9 09 Population sex ratio female/male 1 10 Population growth rate % 0 34 Indicator Million people Female Male Value Total population 3 32 3 02 6 34 Work participation and leadership Indicator Unit Value Gender pay gap % (OECD countries only) n a Share of women's membership in boards % (OECD countries only) n a Firms with female majority ownership % firms 24 20 Firms with female top managers % firms 28 00 Share of workers in informal sector % workers 69 00 Indicator 1-7 (best) Value Advancement of women to leadership roles 3 99 Indicator Unit Female Male Value Unemployed adults % of labour force (15-64) 3 47 2 96 3 17 Workers employed part-time % of employed people 23 91 16 37 19 52 Proportion of time spent on unpaid domestic and care work % 20 21 7 03 n a Indicator Million people Female Male Value Labour-force 1 06 1 38 2 44 Access to finance Indicator 0-1 (Equal rights) Value Access to financial services Equal rights Inheritance rights for widows and daughters Near-equal rights
to land assets Near-equal rights Access to non-land assets Near-equal rights Civil and political freedom Indicator Unit Value Year women received right to vote year 1939 Number of female heads of state to date number 0 Seats held in upper house % total seats n a Indicator Yes/No Value Election list quotas for women, national Yes Party membership quotas, voluntary Yes Indicator 0-1 (Equal rights) Value Access to justice Near-equal rights Freedom of movement Equal rights Family and care Indicator Unit Value Public spending on family benefits % GPD n a Unmet family planning % women 15-49 11 09 Early marriage % 21 00 Mean age of women at birth of first child years n a Indicator 0-1 (Equal rights) Value Right to divorce Equal rights Indicator Days Female Male Value Length of parental leave 112 00 3 00 0 Education and skills Graduates Attainment % Female Male Parity STEM Graduates 23 14 76 86 0 30 Agri , Forestry, Fisheries & Veterinary n a n a n a Arts & Humanities 56 68 43 32 1 31 Business, Admin & Law 58 82 41 18 1 43 Education 70 93 29 07 2 44 Engineering, Manuf & Construction 18 66 81 34 0 23 Health & Welfare 74 40 25 60 2 91 Information & Comm Technologies 26 16 73 84 0 35 Natural Sci , Mathematics & Statistics 50 24 49 76 1 01 Social Sci , Jour nalism & Information 69 13 30 87 2 24 Vocational training 8 71 8 49 1 03 PhD graduates 0 04 0 04 0 04 Graduates % Female Male Value Graduates from tertiary education 15 49 11 47 13 53 Health Indicator Unit Value Prevalence of gender violence in lifetime % women 26 30 Births attended by skilled personnel % live births 99 90 Mater nal mortality deaths per 100,000 live births 46 00 Total fertility rate births per woman 1 82 Indicator 0-1 (Equal rights) Value Reproductive autonomy Unequal rights *Scores
0 to 1 scale, where 1 represents the optimal situation
parity
see Appendix A and B for detailed methodology, definitions, sources and periods. **For all indicators, except the two health indicators, parity is benchmarked at 1 In the case of sex ratio at birth the gender parity benchmark is set at 0 944 (see Klasen and Wink 2003) In the case of healthy life expectancy the gender parity benchmark is set at 1 06, given women's longer life expectancy
Access
are on a
or “
” Please
Global Gender Gap Index Indicators
Global Gender Gap Report 2023 171 Global Gender Gap Index 2023 Edition Estonia score average score 0.771 Economy 1 000 E d u c a t i o n 0.979 Health 0 377 P o i t i c s Overview Index and Subindex 2023 Score Rank 2022 Score Rank Global Gender Gap Index 0 782 22nd 0 733 52nd Economic Participation and Opportunity 0.771 25th 0 747 34th Educational Attainment 1 000 1st 1 000 1st Health and Survival 0 979 32nd 0 977 47th Political Empowerment 0 377 31st 0 210 73rd
2023 Indicator Rank Score* Difference F-M Min Max Economic Participation and Opportunity 25th 0 771 -Labour-force participation rate % 55th 0 834 -11 61 0-100 Wage equality for similar work 1-7 (best) 30th 0 714Estimated ear ned income int'l $ 1,000 39th 0 718 -12 81 0-150 Legislators, senior officials and managers % 30th 0 700 -17 64 0-100 Professional and technical workers % 1st 1 000 19 20 0-100 Educational Attainment 1st 1.000 -Literacy rate % 1st 1 000Enrolment in primary education % 1st 1 000 0 42 0-100 Enrolment in secondary education % 1st 1 000 5 26 0-200 Enrolment in tertiary education % 1st 1 000 28 93 0-200 Health and Survival 32nd 0 979 -Sex ratio at birth** % 115th 0 943Healthy life expectancy** years 1st 1 060Political Empowerment 31st 0 377 -Women in parliament % 67th 0 383 -44 60 0-100 Women in ministerial positions % 20th 0 750 -14 29 0-100 Years with female/male head of state (last 50) 24th 0 165 -35 80 0-50 Economy Profile Estonia Score (imparity = 0 parity = 1) 0.782 Rank (out of 146 countries) 22nd Index Edition 2023 Compare with Global average 0 1 Female vs Male Min Max69 90 58 2945 45 32 64 58 82 41 18 40 40 59 6097 36 97 79 112 40 117 66 55 06 83 99-72 30 27 70 57 14 42 86 42 90 7 10
Complementary Targets and Contextual Indicators 2023
Global Gender Gap Report 2023 172 Economy Profile Estonia Score 0.782 Rank 22nd Page 2 of 2
General indicators Indicator Unit Value GDP US$ billions 37 19 GDP per capita constant '17 intl $ 1000 38 72 Population sex ratio female/male 1 11 Population growth rate % 0 11 Indicator Million people Female Male Value Total population 0 70 0 63 1 33 Work participation and leadership Indicator Unit Value Gender pay gap % (OECD countries only) 19 60 Share of women's membership in boards % (OECD countries only) 9 10 Firms with female majority ownership % firms 16 20 Firms with female top managers % firms 22 50 Share of workers in informal sector % workers 9 10 Indicator 1-7 (best) Value Advancement of women to leadership roles 5 87 Indicator Unit Female Male Value Unemployed adults % of labour force (15-64) 5 40 6 30 5 90 Workers employed part-time % of employed people 38 62 26 23 32 34 Proportion of time spent on unpaid domestic and care work % n a n a n a Indicator Million people Female Male Value Labour-force 0 33 0 34 0 66 Access to finance Indicator 0-1 (Equal rights) Value Access to financial services Equal rights Inheritance rights for widows and daughters Equal rights Access to land assets Equal rights Access to non-land assets Equal rights Civil and political freedom Indicator Unit Value Year women received right to vote year 1918 Number of female heads of state to date number 2 Seats held in upper house % total seats n a Indicator Yes/No Value Election list quotas for women, national n a Party membership quotas, voluntary n a Indicator 0-1 (Equal rights) Value Access to justice Equal rights Freedom of movement Equal rights Family and care Indicator Unit Value Public spending on family benefits % GPD 3 21 Unmet family planning % women 15-49 9 30 Early marriage % 0 50 Mean age of women at birth of first child years 28 20 Indicator 0-1 (Equal rights) Value Right to divorce Equal rights Indicator Days Female Male Value Length of parental leave 100 00 0 475 00 Education and skills Graduates Attainment % Female Male Parity STEM Graduates 38 38 61 62 0 62 Agri , Forestry, Fisheries & Veterinary 57 89 42 11 1 37 Arts & Humanities 70 45 29 55 2 38 Business, Admin & Law 68 65 31 35 2 19 Education n a n a n a Engineering, Manuf & Construction n a n a n a Health & Welfare n a n a n a Information & Comm Technologies 28 89 71 11 0 41 Natural Sci , Mathematics & Statistics 63 86 36 14 1 77 Social Sci , Jour nalism & Information 74 38 25 62 2 90 Vocational training 8 71 13 57 0 64 PhD graduates 0 85 1 03 0 93 Graduates % Female Male Value Graduates from tertiary education 6 05 2 32 4 16 Health Indicator Unit Value Prevalence of gender violence in lifetime % women 20 00 Births attended by skilled personnel % live births 99 60 Mater nal mortality deaths per 100,000 live births 9 00 Total fertility rate births per woman 1 58 Indicator 0-1 (Equal rights) Value Reproductive autonomy Equal rights *Scores
0 to 1 scale, where 1 represents the optimal situation or “parity” Please see Appendix A and B for detailed methodology, definitions, sources and periods. **For all indicators, except the two health indicators, parity is benchmarked at 1 In the case of sex ratio at birth the gender parity benchmark is set at 0 944 (see Klasen and Wink 2003) In the case of healthy life expectancy the gender parity benchmark is set at 1 06, given women's longer life expectancy
are on a
Global Gender Gap Index Indicators
Global Gender Gap Report 2023 173 Global Gender Gap Index 2023 Edition Eswatini score average score 0.838 Economy 0 985 E d u c a t i o n 0.980 Health 0 178 P o i t i c s Overview Index and Subindex 2023 Score Rank 2022 Score Rank Global Gender Gap Index 0 745 46th 0 728 58th Economic Participation and Opportunity 0.838 6th 0 789 19th Educational Attainment 0 985 88th 0 985 86th Health and Survival 0 980 1st 0 980 1st Political Empowerment 0 178 84th 0 157 94th
2023 Indicator Rank Score* Difference F-M Min Max Economic Participation and Opportunity 6th 0 838 -Labour-force participation rate % 45th 0 844 -8 72 0-100 Wage equality for similar work 1-7 (best) - - -Estimated ear ned income int'l $ 1,000 19th 0 790 -2 08 0-150 Legislators, senior officials and managers % 21st 0 767 -13 16 0-100 Professional and technical workers % 1st 1 000 1 66 0-100 Educational Attainment 88th 0.985 -Literacy rate % 1st 1 000Enrolment in primary education % 97th 0 984 -1 33 0-100 Enrolment in secondary education % 84th 0 995 -0 44 0-200 Enrolment in tertiary education % 109th 0 944 -0 39 0-200 Health and Survival 1st 0 980 -Sex ratio at birth** % 1st 0 944Healthy life expectancy** years 1st 1 060Political Empowerment 84th 0 178 -Women in parliament % 119th 0 175 -70 20 0-100 Women in ministerial positions % 37th 0 500 -33 33 0-100 Years with female/male head of state (last 50) 80th 0 000 -50 00 0-50 Economy Profile Eswatini Score (imparity = 0 parity = 1) 0.745 Rank (out of 146 countries) 46th Index Edition 2023 Compare with Global average 0 1 Female vs Male Min Max55 85 47 139 90 7 83 56 58 43 42 49 17 50 8385 43 84 10 82 63 82 19 6 95 6 56-85 10 14 90 66 67 33 33 50 00 0
Complementary Targets and Contextual Indicators 2023
Inheritance
Agri , Forestry, Fisheries & Veterinary
Information & Comm Technologies
Natural Sci , Mathematics & Statistics
Social Sci , Jour nalism & Information
Vocational training
Indicator Unit
Reproductive autonomy
are on
Global Gender Gap Report 2023 174 Economy Profile Eswatini Score 0.745 Rank 46th Page 2 of 2
General indicators Indicator Unit Value GDP US$ billions 4 74 GDP per capita constant '17 intl $ 1000 8 86 Population sex ratio female/male 1 01 Population growth rate % 0 98 Indicator Million people Female Male Value Total population 0 61 0 60 1 20 Work participation and leadership Indicator Unit Value Gender pay gap % (OECD countries only) n a Share of women's membership in boards % (OECD countries only) n a Firms with female majority ownership % firms 16 90 Firms with female top managers % firms 27 40 Share of workers in informal sector % workers 58 80 Indicator 1-7 (best) Value Advancement of women to leadership roles 4 08 Indicator Unit Female Male Value Unemployed adults % of labour force (15-64) 34 20 33 04 33 64 Workers employed part-time % of employed people 21 64 15 25 18 37 Proportion of time spent on unpaid domestic and care work % n a n a n a Indicator Million people Female Male Value Labour-force 0 16 0 14 0 30 Access to finance Indicator 0-1 (Equal rights) Value Access to financial services Near-equal rights
rights for widows and daughters Restricted rights
to land assets Unequal rights Access to non-land assets Restricted rights Civil and political freedom Indicator Unit Value Year women received right to vote year 1968 Number of female heads of state to date number 0 Seats held in upper house % total seats 40 00 Indicator Yes/No Value Election list quotas for women, national n a Party membership quotas, voluntary Yes Indicator 0-1 (Equal rights) Value Access to justice Restricted rights Freedom of movement Near-equal rights Family and care Indicator Unit Value Public spending on family benefits % GPD n a Unmet family planning % women 15-49 15 23 Early marriage % 4 00 Mean age of women at birth of first child years n a Indicator 0-1
rights) Value Right to divorce Restricted rights Indicator Days Female Male Value Length of parental leave 14 00 0 0 Education and skills
Attainment % Female Male Parity STEM Graduates n a n a n a
Access
(Equal
Graduates
n a n a n a Arts
n a n a n a
n a n a n a Education 0 100 00 0
n a n a n a Health
n a n a n a
& Humanities
Business, Admin & Law
Engineering, Manuf & Construction
& Welfare
n a n a n a
n a n a n a
n a n a n a
n a n a n a
n a n a n a
% Female Male Value
PhD graduates
Graduates
n a n a n a Health
Graduates from tertiary education
Value
% women n a
% live births 88 30 Mater
mortality deaths per 100,000 live births 437 00 Total fertility rate births per woman 2 89
Prevalence of gender violence in lifetime
Births attended by skilled personnel
nal
Value
Indicator 0-1 (Equal rights)
Restricted rights
gender parity benchmark
set
0 944
Klasen
2003)
case of healthy life
gender parity benchmark
set
06,
longer life expectancy
*Scores
a 0 to 1 scale, where 1 represents the optimal situation or “parity” Please see Appendix A and B for detailed methodology, definitions, sources and periods. **For all indicators, except the two health indicators, parity is benchmarked at 1 In the case of sex ratio at birth the
is
at
(see
and Wink
In the
expectancy the
is
at 1
given women's
Global Gender Gap Index Indicators
Global Gender Gap Report 2023 175 Global Gender Gap Index 2023 Edition Ethiopia score average score 0.587 Economy 0 854 E d u c a t i o n 0.971 Health 0 431 P o i t i c s Overview Index and Subindex 2023 Score Rank 2022 Score Rank Global Gender Gap Index 0 711 75th 0 710 74th Economic Participation and Opportunity 0.587 116th 0 600 112th Educational Attainment 0 854 135th 0 854 133rd Health and Survival 0 971 67th 0 971 74th Political Empowerment 0 431 25th 0 416 26th
2023 Indicator Rank Score* Difference F-M Min Max Economic Participation and Opportunity 116th 0 587 -Labour-force participation rate % 88th 0 727 -21 60 0-100 Wage equality for similar work 1-7 (best) - - -Estimated ear ned income int'l $ 1,000 65th 0 661 -0 94 0-150 Legislators, senior officials and managers % 108th 0 341 -49 14 0-100 Professional and technical workers % 117th 0 521 -31 50 0-100 Educational Attainment 135th 0.854 -Literacy rate % 131st 0 750Enrolment in primary education % 105th 0 912 -7 16 0-100 Enrolment in secondary education % 113th 0 962 -1 36 0-200 Enrolment in tertiary education % 129th 0 596 -5 27 0-200 Health and Survival 67th 0 971 -Sex ratio at birth** % 1st 0 944Healthy life expectancy** years 81st 1 031Political Empowerment 25th 0 431 -Women in parliament % 23rd 0 704 -17 40 0-100 Women in ministerial positions % 27th 0 692 -18 18 0-100 Years with female/male head of state (last 50) 39th 0 095 -41 30 0-50 Economy Profile Ethiopia Score (imparity = 0 parity = 1) 0.711 Rank (out of 146 countries) 75th Index Edition 2023 Compare with Global average 0 1 Female vs Male Min Max79 20 57 602 79 1 84 74 57 25 43 65 75 34 2581 24 74 08 35 61 34 25 13 03 7 76-58 70 41 30 59 09 40 91 45 65 4 35
Complementary Targets and Contextual Indicators 2023
Access
Agri , Forestry, Fisheries & Veterinary
Global Gender Gap Report 2023 176 Economy Profile Ethiopia Score 0.711 Rank 75th Page 2 of 2
General indicators Indicator Unit Value GDP US$ billions 111 27 GDP per capita constant '17 intl $ 1000 2 32 Population sex ratio female/male 0 99 Population growth rate % 2 60 Indicator Million people Female Male Value Total population 61 40 61 98 123 38 Work participation and leadership Indicator Unit Value Gender pay gap % (OECD countries only) n a Share of women's membership in boards % (OECD countries only) n a Firms with female majority ownership % firms 16 50 Firms with female top managers % firms 4 50 Share of workers in informal sector % workers 85 20 Indicator 1-7 (best) Value Advancement of women to leadership roles 3 27 Indicator Unit Female Male Value Unemployed adults % of labour force (15-64) 5 43 3 07 4 10 Workers employed part-time % of employed people 66 47 42 91 53 77 Proportion of time spent on unpaid domestic and care work % 19 31 6 60 n a Indicator Million people Female Male Value Labour-force 11 91 16 81 28 72 Access to finance Indicator 0-1 (Equal rights) Value Access to financial services Near-equal rights
rights for widows
Near-equal rights
Inheritance
and daughters
to land assets Near-equal rights
to non-land assets Near-equal rights Civil and political freedom Indicator Unit Value Year women received right to vote year 1955 Number of female heads of state to date number 1 Seats held in upper house % total seats 30 60 Indicator Yes/No Value Election list quotas for women, national Yes Party membership quotas, voluntary Yes Indicator 0-1 (Equal rights) Value Access to justice Near-equal rights Freedom of movement Equal rights Family and care Indicator Unit Value Public spending on family benefits % GPD n a Unmet family planning % women 15-49 19 20 Early marriage % 22 50 Mean age of women at birth of first child years n a Indicator 0-1 (Equal rights) Value Right to divorce Near-equal rights Indicator Days Female Male Value Length of parental leave 120 00 3 00 0 Education and skills Graduates Attainment % Female Male Parity STEM Graduates n a n a n a
n a n a n a Arts &
n a n a n a Business, Admin & Law n a n a n a Education n a n a n a Engineering, Manuf & Construction n a n a n a Health & Welfare n a n a n a Information & Comm Technologies n a n a n a
Sci
Statistics n a n a n a Social
& Information n a n a n a Vocational training 1 78 1 59 1 12 PhD graduates n a n a n a Graduates % Female Male Value Graduates from tertiary education n a n a n a Health
Unit Value Prevalence of gender violence in lifetime % women 28 00 Births attended by skilled personnel % live births 49 80 Mater nal mortality deaths per 100,000 live births 401 00 Total fertility rate births per woman 4 24 Indicator 0-1 (Equal rights) Value Reproductive autonomy Near-equal rights *Scores
methodology, de
**For
indicators, except the two health indicators, parity is benchmarked at 1 In the case of sex ratio at birth the gender parity benchmark is set at 0 944 (see Klasen and Wink 2003) In the case of healthy life expectancy the gender parity benchmark is set at 1 06, given women's longer life expectancy
Access
Humanities
Natural
, Mathematics &
Sci , Jour nalism
Indicator
are on a 0 to 1 scale, where 1 represents the optimal situation or “parity” Please see Appendix A and B for detailed
finitions, sources and periods.
all
Global Gender Gap Index Indicators
Global Gender Gap Report 2023 177 Global Gender Gap Index 2023 Edition Fiji score average score 0.588 Economy 0 997 E d u c a t i o n 0.965 Health 0 052 P o i t i c s Overview Index and Subindex 2023 Score Rank 2022 Score Rank Global Gender Gap Index 0 650 121st 0 676 107th Economic Participation and Opportunity 0.588 115th 0 586 118th Educational Attainment 0 997 46th 0 997 44th Health and Survival 0 965 107th 0 972 69th Political Empowerment 0 052 139th 0 150 97th
2023 Indicator Rank Score* Difference F-M Min Max Economic Participation and Opportunity 115th 0 588 -Labour-force participation rate % 129th 0 501 -38 44 0-100 Wage equality for similar work 1-7 (best) - - -Estimated ear ned income int'l $ 1,000 120th 0 492 -7 05 0-150 Legislators, senior officials and managers % 44th 0 636 -22 23 0-100 Professional and technical workers % 91st 0 846 -8 33 0-100 Educational Attainment 46th 0.997 -Literacy rate % 1st 1 000Enrolment in primary education % 83rd 0 994 -0 63 0-100 Enrolment in secondary education % 1st 1 000 7 30 0-200 Enrolment in tertiary education % 1st 1 000 20 70 0-200 Health and Survival 107th 0 965 -Sex ratio at birth** % 136th 0 933Healthy life expectancy** years 74th 1 038Political Empowerment 139th 0 052 -Women in parliament % 130th 0 122 -78 20 0-100 Women in ministerial positions % 135th 0 056 -89 47 0-100 Years with female/male head of state (last 50) 80th 0 000 -50 00 0-50 Economy Profile Fiji Score (imparity = 0 parity = 1) 0.650 Rank (out of 146 countries) 121st Index Edition 2023 Compare with Global average 0 1 Female vs Male Min Max76 99 38 5513 87 6 83 61 12 38 89 54 16 45 8499 42 98 79 92 88 100 18 43 36 64 06-89 10 10 90 94 74 5 26 50 00 0
Complementary Targets and Contextual Indicators 2023
Access
Global Gender Gap Report 2023 178 Economy Profile Fiji Score 0.650 Rank 121st Page 2 of 2
General indicators Indicator Unit Value GDP US$ billions 4 3 GDP per capita constant '17 intl $ 1000 10 36 Population sex ratio female/male 0 99 Population growth rate % 0 45 Indicator Million people Female Male Value Total population 0 46 0 47 0 93 Work participation and leadership Indicator Unit Value Gender pay gap % (OECD countries only) n a Share of women's membership in boards % (OECD countries only) n a Firms with female majority ownership % firms n a Firms with female top managers % firms n a Share of workers in informal sector % workers 43 60 Indicator 1-7 (best) Value Advancement of women to leadership roles n a Indicator Unit Female Male Value Unemployed adults % of labour force (15-64) 5 71 3 83 4 47 Workers employed part-time % of employed people n a n a n a Proportion of time spent on unpaid domestic and care work % 15 16 5 19 n a Indicator Million people Female Male Value Labour-force 0 10 0 19 0 29 Access to finance Indicator 0-1 (Equal rights) Value
to financial services Near-equal rights
Access
Near-equal rights
Inheritance rights for widows and daughters
Near-equal rights
to land assets
Equal rights Civil and political freedom Indicator Unit Value Year women received right to vote year 1970 Number of female heads of state to date number 0 Seats held in upper house % total seats n a Indicator Yes/No Value Election list quotas for women, national n a Party membership quotas, voluntary n a Indicator 0-1 (Equal rights) Value
to justice Near-equal rights Freedom of movement Restricted rights
and care
Unit Value
spending on family benefits % GPD n a
family planning % women 15-49 n a Early marriage % 8 50 Mean age of women at birth of first child years n a Indicator 0-1 (Equal rights) Value Right to divorce Equal rights Indicator Days Female Male Value Length of parental leave 98 00 1 00 0 Education and skills Graduates Attainment % Female Male Parity STEM Graduates n a n a n a
n a n a n a Arts &
n a n a n a Business, Admin & Law n a n a n a Education n a n a n a Engineering, Manuf & Construction n a n a n a Health & Welfare n a n a n a Information & Comm Technologies n a n a n a Natural Sci , Mathematics & Statistics n a n a n a Social Sci , Jour nalism & Information n a n a n a Vocational training 0 46 0 85 0 54 PhD graduates 0 05 0 10 0 07 Graduates % Female Male Value Graduates from tertiary education n a n a n a Health
Unit Value Prevalence of gender violence in lifetime % women 64 10 Births attended by skilled personnel % live births 99 80 Mater nal mortality deaths per 100,000 live births 34 00 Total fertility rate births per woman 2 50 Indicator 0-1 (Equal rights) Value Reproductive autonomy Near-equal rights *Scores
A
B for detailed methodology, definitions, sources
periods. **For
indicators, except the two health indicators, parity is benchmarked at 1 In the case of sex ratio at birth the gender parity benchmark is set at 0 944 (see Klasen and Wink 2003) In the case of healthy life expectancy the gender parity benchmark is set at 1 06, given women's longer life expectancy
Access to non-land assets
Access
Family
Indicator
Public
Unmet
Agri , Forestry, Fisheries & Veterinary
Humanities
Indicator
are on a 0 to 1 scale, where 1 represents the optimal situation or “parity” Please see Appendix
and
and
all
Global Gender Gap Index Indicators
Global Gender Gap Report 2023 179 Global Gender Gap Index 2023 Edition Finland score average score 0.783 Economy 1 000 E d u c a t i o n 0.970 Health 0 700 P o i t i c s Overview Index and Subindex 2023 Score Rank 2022 Score Rank Global Gender Gap Index 0 863 3rd 0 860 2nd Economic Participation and Opportunity 0.783 20th 0 789 18th Educational Attainment 1 000 1st 1 000 1st Health and Survival 0 970 71st 0 970 78th Political Empowerment 0 700 4th 0 682 2nd
2023 Indicator Rank Score* Difference F-M Min Max Economic Participation and Opportunity 20th 0 783 -Labour-force participation rate % 19th 0 882 -7 57 0-100 Wage equality for similar work 1-7 (best) 10th 0 763Estimated ear ned income int'l $ 1,000 31st 0 743 -14 37 0-150 Legislators, senior officials and managers % 60th 0 576 -26 91 0-100 Professional and technical workers % 1st 1 000 3 70 0-100 Educational Attainment 1st 1.000 -Literacy rate % 1st 1 000Enrolment in primary education % 1st 1 000 0 58 0-100 Enrolment in secondary education % 1st 1 000 13 82 0-200 Enrolment in tertiary education % 1st 1 000 19 57 0-200 Health and Survival 71st 0 970 -Sex ratio at birth** % 1st 0 944Healthy life expectancy** years 85th 1 030Political Empowerment 4th 0 700 -Women in parliament % 13th 0 835 -9 00 0-100 Women in ministerial positions % 1st 1 000 28 57 0-100 Years with female/male head of state (last 50) 8th 0 438 -19 53 0-50 Economy Profile Finland Score (imparity = 0 parity = 1) 0.863 Rank (out of 146 countries) 3rd Index Edition 2023 Compare with Global average 0 1 Female vs Male Min Max64 25 56 6856 02 41 65 63 46 36 54 48 15 51 8598 02 98 60 137 48 151 30 85 51 105 08-54 50 45 50 35 71 64 29 34 77 15 23
Complementary Targets and Contextual Indicators 2023
Global Gender Gap Report 2023 180 Economy Profile Finland Score 0.863 Rank 3rd Page 2 of 2
General indicators Indicator Unit Value GDP US$ billions 297 3 GDP per capita constant '17 intl $ 1000 48 75 Population sex ratio female/male 1 02 Population growth rate % 0 21 Indicator Million people Female Male Value Total population 2 80 2 74 5 54 Work participation and leadership Indicator Unit Value Gender pay gap % (OECD countries only) 15 98 Share of women's membership in boards % (OECD countries only) 35 20 Firms with female majority ownership % firms 9 50 Firms with female top managers % firms 12 90 Share of workers in informal sector % workers 6 40 Indicator 1-7 (best) Value Advancement of women to leadership roles 6 16 Indicator Unit Female Male Value Unemployed adults % of labour force (15-64) 6 50 7 30 6 90 Workers employed part-time % of employed people 51 12 38 42 44 51 Proportion of time spent on unpaid domestic and care work % n a n a n a Indicator Million people Female Male Value Labour-force 1 21 1 31 2 51 Access to finance Indicator 0-1 (Equal rights) Value Access to financial services Equal rights Inheritance rights for widows and daughters Equal rights Access to land assets Equal rights Access to non-land assets Equal rights Civil and political freedom Indicator Unit Value Year women received right to vote year n a Number of female heads of state to date number 4 Seats held in upper house % total seats n a Indicator Yes/No Value Election list quotas for women, national n a Party membership quotas, voluntary n a Indicator 0-1 (Equal rights) Value Access to justice Equal rights Freedom of movement Equal rights Family and care Indicator Unit Value Public spending on family benefits % GPD 2 89 Unmet family planning % women 15-49 n a Early marriage % 0 30 Mean age of women at birth of first child years 29 50 Indicator 0-1 (Equal rights) Value Right to divorce Equal rights Indicator Days Female Male Value Length of parental leave 56 00 0 148 00 Education and skills Graduates Attainment % Female Male Parity STEM Graduates 27 40 72 60 0 38 Agri , Forestry, Fisheries & Veterinary 61 11 38 89 1 57 Arts & Humanities n a n a n a Business, Admin & Law n a n a n a Education n a n a n a Engineering, Manuf & Construction 22 16 77 84 0 28 Health & Welfare 84 98 15 02 5 66 Information & Comm Technologies n a n a n a Natural Sci , Mathematics & Statistics 53 83 46 17 1 17 Social Sci , Jour nalism & Information 71 31 28 69 2 48 Vocational training 16 46 21 44 0 77 PhD graduates 1 07 1 39 1 23 Graduates % Female Male Value Graduates from tertiary education 78 39 51 89 64 79 Health Indicator Unit Value Prevalence of gender violence in lifetime % women 30 00 Births attended by skilled personnel % live births 99 60 Mater nal mortality deaths per 100,000 live births 3 00 Total fertility rate births per woman 1 37 Indicator 0-1 (Equal rights) Value Reproductive autonomy Near-equal rights *Scores
0
1 scale,
1 represents the optimal situation or
parity” Please see Appendix A and B for detailed methodology, definitions, sources and periods. **For all indicators, except the two health indicators, parity is benchmarked at 1 In the case of sex ratio at birth the gender parity benchmark is set at 0 944 (see Klasen and Wink 2003) In the case of healthy life expectancy the gender parity benchmark is set at 1 06, given women's longer life expectancy
are on a
to
where
“
Global Gender Gap Index Indicators
Global Gender Gap Report 2023 181 Global Gender Gap Index 2023 Edition France score average score 0.717 Economy 1 000 E d u c a t i o n 0.970 Health 0 338 P o i t i c s Overview Index and Subindex 2023 Score Rank 2022 Score Rank Global Gender Gap Index 0 756 40th 0 791 15th Economic Participation and Opportunity 0.717 51st 0 737 40th Educational Attainment 1 000 1st 1 000 1st Health and Survival 0 970 76th 0 970 81st Political Empowerment 0 338 39th 0 457 20th
2023 Indicator Rank Score* Difference F-M Min Max Economic Participation and Opportunity 51st 0 717 -Labour-force participation rate % 27th 0 872 -7 64 0-100 Wage equality for similar work 1-7 (best) 82nd 0 614Estimated ear ned income int'l $ 1,000 74th 0 639 -19 95 0-150 Legislators, senior officials and managers % 52nd 0 608 -24 41 0-100 Professional and technical workers % 1st 1 000 6 71 0-100 Educational Attainment 1st 1.000 -Literacy rate % 1st 1 000Enrolment in primary education % 1st 1 000 0 28 0-100 Enrolment in secondary education % 1st 1 000 0 03 0-200 Enrolment in tertiary education % 1st 1 000 16 99 0-200 Health and Survival 76th 0 970 -Sex ratio at birth** % 1st 0 944Healthy life expectancy** years 89th 1 028Political Empowerment 39th 0 338 -Women in parliament % 33rd 0 608 -24 40 0-100 Women in ministerial positions % 35th 0 545 -29 41 0-100 Years with female/male head of state (last 50) 58th 0 035 -46 65 0-50 Economy Profile France Score (imparity = 0 parity = 1) 0.756 Rank (out of 146 countries) 40th Index Edition 2023 Compare with Global average 0 1 Female vs Male Min Max59 84 52 2055 30 35 35 62 21 37 79 46 65 53 3699 70 99 97 104 62 104 65 61 06 78 05-62 20 37 80 64 71 35 29 48 32 1 68
Complementary Targets and Contextual Indicators 2023
Global Gender Gap Report 2023 182 Economy Profile France Score 0.756 Rank 40th Page 2 of 2
General indicators Indicator Unit Value GDP US$ billions 2,957 88 GDP per capita constant '17 intl $ 1000 44 99 Population sex ratio female/male 1 07 Population growth rate % 0 26 Indicator Million people Female Male Value Total population 33 40 31 23 64 63 Work participation and leadership Indicator Unit Value Gender pay gap % (OECD countries only) 11 82 Share of women's membership in boards % (OECD countries only) 45 30 Firms with female majority ownership % firms 15 50 Firms with female top managers % firms 19 90 Share of workers in informal sector % workers 4 40 Indicator 1-7 (best) Value Advancement of women to leadership roles 4 91 Indicator Unit Female Male Value Unemployed adults % of labour force (15-64) 7 20 7 60 7 40 Workers employed part-time % of employed people 47 91 30 96 39 26 Proportion of time spent on unpaid domestic and care work % n a n a n a Indicator Million people Female Male Value Labour-force 13 39 13 87 27 26 Access to finance Indicator 0-1 (Equal rights) Value Access to financial services Equal rights Inheritance rights for widows and daughters Near-equal rights Access to land assets Equal rights Access to non-land assets Equal rights Civil and political freedom Indicator Unit Value Year women received right to vote year 1944 Number of female heads of state to date number 2 Seats held in upper house % total seats 35 10 Indicator Yes/No Value Election list quotas for women, national Yes Party membership quotas, voluntary Yes Indicator 0-1 (Equal rights) Value Access to justice Equal rights Freedom of movement Equal rights Family and care Indicator Unit Value Public spending on family benefits % GPD 2 93 Unmet family planning % women 15-49 n a Early marriage % 2 80 Mean age of women at birth of first child years 28 90 Indicator 0-1 (Equal rights) Value Right to divorce Equal rights Indicator Days Female Male Value Length of parental leave 112 00 25 00 0 Education and skills Graduates Attainment % Female Male Parity STEM Graduates 31 81 68 19 0 47 Agri , Forestry, Fisheries & Veterinary 43 19 56 81 0 76 Arts & Humanities 69 23 30 77 2 25 Business, Admin & Law n a n a n a Education n a n a n a Engineering, Manuf & Construction 26 11 73 89 0 35 Health & Welfare 73 99 26 01 2 84 Information & Comm Technologies 16 46 83 54 0 20 Natural Sci , Mathematics & Statistics n a n a n a Social Sci , Jour nalism & Information n a n a n a Vocational training 16 76 21 94 0 76 PhD graduates 0 65 1 07 0 85 Graduates % Female Male Value Graduates from tertiary education 57 94 42 36 49 95 Health Indicator Unit Value Prevalence of gender violence in lifetime % women 26 00 Births attended by skilled personnel % live births 97 60 Mater nal mortality deaths per 100,000 live births 8 00 Total fertility rate births per woman 1 83 Indicator 0-1 (Equal rights) Value Reproductive autonomy Equal rights *Scores are on a 0 to 1 scale, where 1 represents the optimal situation or “parity” Please see Appendix A and B for detailed methodology, definitions, sources and periods. **For all indicators, except the two health indicators, parity is benchmarked at 1 In the case of sex ratio at birth the gender parity benchmark is set at 0 944 (see Klasen and Wink 2003) In the case of healthy life expectancy the gender parity benchmark is set at 1 06, given women's longer life expectancy
Global Gender Gap Index Indicators
Global Gender Gap Report 2023 183 Global Gender Gap Index 2023 Edition Gambia score average score 0.609 Economy 0 954 E d u c a t i o n 0.968 Health 0 073 P o i t i c s Overview Index and Subindex 2023 Score Rank 2022 Score Rank Global Gender Gap Index 0 651 119th 0 641 121st Economic Participation and Opportunity 0.609 106th 0 604 109th Educational Attainment 0 954 114th 0 873 132nd Health and Survival 0 968 83rd 0 968 86th Political Empowerment 0 073 132nd 0 118 115th
2023 Indicator Rank Score* Difference F-M Min Max Economic Participation and Opportunity 106th 0 609 -Labour-force participation rate % 40th 0 850 -9 90 0-100 Wage equality for similar work 1-7 (best) - - -Estimated ear ned income int'l $ 1,000 13th 0 814 -0 43 0-150 Legislators, senior officials and managers % 120th 0 243 -60 85 0-100 Professional and technical workers % 134th 0 289 -55 11 0-100 Educational Attainment 114th 0.954 -Literacy rate % 128th 0 785Enrolment in primary education % 1st 1 000 11 56 0-100 Enrolment in secondary education % 1st 1 000 18 81 0-200 Enrolment in tertiary education % - - -Health and Survival 83rd 0 968 -Sex ratio at birth** % 1st 0 944Healthy life expectancy** years 94th 1 023Political Empowerment 132nd 0 073 -Women in parliament % 133rd 0 094 -82 80 0-100 Women in ministerial positions % 99th 0 176 -70 00 0-100 Years with female/male head of state (last 50) 80th 0 000 -50 00 0-50 Economy Profile Gambia Score (imparity = 0 parity = 1) 0.651 Rank (out of 146 countries) 119th Index Edition 2023 Compare with Global average 0 1 Female vs Male Min Max66 09 56 192 29 1 86 80 43 19 57 77 56 22 4480 23 91 79 105 35 124 16--91 40 8 60 85 00 15 00 50 00 0
Complementary Targets and Contextual Indicators 2023
Agri , Forestry, Fisheries & Veterinary
Business, Admin & Law
Information & Comm Technologies
Natural Sci , Mathematics & Statistics
Social Sci , Jour nalism & Information
Vocational training
Indicator Unit
Global Gender Gap Report 2023 184 Economy Profile Gambia Score 0.651 Rank 119th Page 2 of 2
General indicators Indicator Unit Value GDP US$ billions 2 04 GDP per capita constant '17 intl $ 1000 2 08 Population sex ratio female/male 1 01 Population growth rate % 2 53 Indicator Million people Female Male Value Total population 1 36 1 35 2 71 Work participation and leadership Indicator Unit Value Gender pay gap % (OECD countries only) n a Share of women's membership in boards % (OECD countries only) n a Firms with female majority ownership % firms 12 30 Firms with female top managers % firms 9 60 Share of workers in informal sector % workers 79 50 Indicator 1-7 (best) Value Advancement of women to leadership roles 5 01 Indicator Unit Female Male Value Unemployed adults % of labour force (15-64) 3 25 5 24 4 27 Workers employed part-time % of employed people 12 32 7 88 10 05 Proportion of time spent on unpaid domestic and care work % n a n a n a Indicator Million people Female Male Value Labour-force 0 28 0 32 0 61 Access to finance Indicator 0-1 (Equal rights) Value Access to financial services Equal rights
rights for widows and daughters Unequal rights
to land assets Uneven rights Access to non-land assets Uneven rights Civil and political freedom Indicator Unit Value Year women received right to vote year 1960 Number of female heads of state to date number 0 Seats held in upper house % total seats n a Indicator Yes/No Value Election list quotas for women, national n a Party membership quotas, voluntary n a Indicator 0-1 (Equal rights) Value Access to justice Restricted rights Freedom of movement Restricted rights
and care
Unit Value
spending on family benefits % GPD n a
family planning % women 15-49 24 20 Early marriage % 25 50 Mean age of women at birth of first child years n a Indicator 0-1
rights) Value Right to divorce Unequal rights Indicator Days Female Male Value
of parental leave 180 00 14 00 0
skills
Inheritance
Access
Family
Indicator
Public
Unmet
(Equal
Length
Education and
% Female Male Parity STEM Graduates n a n a n a
Graduates Attainment
n a n a n a
n a n a n a
Arts & Humanities
n a n a n a Education n a n a n a
n a n a n a Health
Welfare n a n a n a
Engineering, Manuf & Construction
&
n a n a n a
n a n a n a
n a n a n a
n a n a n a PhD
n a n a n a Graduates % Female Male Value
n a n a n a Health
graduates
Graduates from tertiary education
Value Prevalence
violence in lifetime % women 20 10 Births attended by skilled personnel % live births 83 80 Mater nal mortality deaths per 100,000 live births 597 00 Total fertility rate births per woman 4 78
rights) Value
Restricted rights
health
parity
benchmarked
1
case
sex ratio at birth the gender parity benchmark is set at 0 944
Klasen
2003) In the case of healthy life expectancy
gender parity benchmark is set at 1 06, given women's longer life expectancy
of gender
Indicator 0-1 (Equal
Reproductive autonomy
*Scores are on a 0 to 1 scale, where 1 represents the optimal situation or “parity” Please see Appendix A and B for detailed methodology, definitions, sources and periods. **For all indicators, except the two
indicators,
is
at
In the
of
(see
and Wink
the
Global Gender Gap Index Indicators
Global Gender Gap Report 2023 185 Global Gender Gap Index 2023 Edition Georgia score average score 0.697 Economy 1 000 E d u c a t i o n 0.974 Health 0 163 P o i t i c s Overview Index and Subindex 2023 Score Rank 2022 Score Rank Global Gender Gap Index 0 708 76th 0 731 55th Economic Participation and Opportunity 0.697 68th 0 697 72nd Educational Attainment 1 000 28th 1 000 29th Health and Survival 0 974 56th 0 978 37th Political Empowerment 0 163 91st 0 248 57th
2023 Indicator Rank Score* Difference F-M Min Max Economic Participation and Opportunity 68th 0 697 -Labour-force participation rate % 83rd 0 753 -18 05 0-100 Wage equality for similar work 1-7 (best) 19th 0 740Estimated ear ned income int'l $ 1,000 116th 0 509 -10 28 0-150 Legislators, senior officials and managers % 62nd 0 566 -27 75 0-100 Professional and technical workers % 1st 1 000 23 39 0-100 Educational Attainment 28th 1.000 -Literacy rate % 61st 0 999Enrolment in primary education % 1st 1 000 1 00 0-100 Enrolment in secondary education % 1st 1 000 0 40 0-200 Enrolment in tertiary education % 1st 1 000 11 85 0-200 Health and Survival 56th 0 974 -Sex ratio at birth** % 132nd 0 935Healthy life expectancy** years 1st 1 060Political Empowerment 91st 0 163 -Women in parliament % 108th 0 225 -63 20 0-100 Women in ministerial positions % 88th 0 200 -66 67 0-100 Years with female/male head of state (last 50) 38th 0 100 -40 93 0-50 Economy Profile Georgia Score (imparity = 0 parity = 1) 0.708 Rank (out of 146 countries) 76th Index Edition 2023 Compare with Global average 0 1 Female vs Male Min Max73 05 55 0020 93 10 66 63 88 36 13 38 30 61 7098 18 99 18 101 15 101 55 66 98 78 83-81 60 18 40 83 33 16 67 45 47 4 53
Complementary Targets and Contextual Indicators 2023
Global Gender Gap Report 2023 186 Economy Profile Georgia Score 0.708 Rank 76th Page 2 of 2
General indicators Indicator Unit Value GDP US$ billions 18 63 GDP per capita constant '17 intl $ 1000 15 49 Population sex ratio female/male 1 13 Population growth rate % -0 38 Indicator Million people Female Male Value Total population 1 98 1 76 3 74 Work participation and leadership Indicator Unit Value Gender pay gap % (OECD countries only) n a Share of women's membership in boards % (OECD countries only) n a Firms with female majority ownership % firms 11 50 Firms with female top managers % firms 16 50 Share of workers in informal sector % workers 55 60 Indicator 1-7 (best) Value Advancement of women to leadership roles 5 35 Indicator Unit Female Male Value Unemployed adults % of labour force (15-64) 11 84 14 29 13 18 Workers employed part-time % of employed people 17 95 16 20 17 02 Proportion of time spent on unpaid domestic and care work % n a n a n a Indicator Million people Female Male Value Labour-force 0 83 0 93 1 76 Access to finance Indicator 0-1 (Equal rights) Value Access to financial services Near-equal rights Inheritance rights for widows and daughters Near-equal rights
to land assets Near-equal rights Access to non-land assets Near-equal rights Civil and political freedom Indicator Unit Value Year women received right to vote year 1918, 1921 Number of female heads of state to date number 2 Seats held in upper house % total seats n a Indicator Yes/No Value Election list quotas for women, national Yes Party membership quotas, voluntary Yes Indicator 0-1 (Equal rights) Value Access to justice Equal rights Freedom of movement Equal rights Family and care Indicator Unit Value Public spending on family benefits % GPD n a Unmet family planning % women 15-49 23 70 Early marriage % 14 40 Mean age of women at birth of first child years 25 90 Indicator 0-1 (Equal rights) Value Right to divorce Near-equal rights Indicator Days Female Male Value Length of parental leave 126 00 0 57 00 Education and skills Graduates Attainment % Female Male Parity STEM Graduates 38 68 61 32 0 63
n a n a n a Arts & Humanities n a n a n a Business, Admin & Law 58 53 41 47 1 41 Education 95 79 4 21 22 74 Engineering, Manuf & Construction 15 73 84 27 0 19 Health & Welfare 70 99 29 01 2 45 Information & Comm Technologies 20 58 79 42 0 26 Natural Sci , Mathematics & Statistics 68 13 31 87 2 14 Social Sci , Jour nalism & Information 64 61 35 39 1 83 Vocational training 3 26 2 76 1 18 PhD graduates 0 46 0 58 0 51 Graduates % Female Male Value Graduates from tertiary education 44 26 30 68 37 04
Unit Value Prevalence of gender violence in lifetime % women 6 10 Births attended by skilled personnel % live births 99 80 Mater nal mortality deaths per 100,000 live births 25 00 Total fertility rate births per woman 1 97 Indicator 0-1 (Equal rights) Value Reproductive autonomy Equal rights
health indicators, parity is benchmarked at 1
the case of sex ratio at birth the gender parity benchmark is set at 0 944 (see Klasen and Wink 2003) In the case of healthy life expectancy
gender parity benchmark is set at 1 06, given women's longer life expectancy
Access
Agri , Forestry, Fisheries & Veterinary
Health Indicator
*Scores are on a 0 to 1 scale, where 1 represents the optimal situation or “parity” Please see Appendix A and B for detailed methodology, definitions, sources and periods. **For all indicators, except the two
In
the
Global Gender Gap Index Indicators
Global Gender Gap Report 2023 187 Global Gender Gap Index 2023 Edition Germany score average score 0.665 Economy 0 989 E d u c a t i o n 0.972 Health 0 634 P o i t i c s Overview Index and Subindex 2023 Score Rank 2022 Score Rank Global Gender Gap Index 0 815 6th 0 801 10th Economic Participation and Opportunity 0.665 88th 0 695 75th Educational Attainment 0 989 82nd 0 988 81st Health and Survival 0 972 64th 0 972 70th Political Empowerment 0 634 5th 0 550 8th
2023 Indicator Rank Score* Difference F-M Min Max Economic Participation and Opportunity 88th 0 665 -Labour-force participation rate % 49th 0 843 -10 36 0-100 Wage equality for similar work 1-7 (best) 89th 0 606Estimated ear ned income int'l $ 1,000 102nd 0 572 -29 08 0-150 Legislators, senior officials and managers % 95th 0 413 -41 58 0-100 Professional and technical workers % 1st 1 000 3 16 0-100 Educational Attainment 82nd 0.989 -Literacy rate % 1st 1 000Enrolment in primary education % 1st 1 000 1 35 0-100 Enrolment in secondary education % 117th 0 954 -4 59 0-200 Enrolment in tertiary education % 1st 1 000 4 02 0-200 Health and Survival 64th 0 972 -Sex ratio at birth** % 1st 0 944Healthy life expectancy** years 77th 1 035Political Empowerment 5th 0 634 -Women in parliament % 40th 0 541 -29 80 0-100 Women in ministerial positions % 1st 1 000 0 0-100 Years with female/male head of state (last 50) 5th 0 495 -16 90 0-50 Economy Profile Germany Score (imparity = 0 parity = 1) 0.815 Rank (out of 146 countries) 6th Index Edition 2023 Compare with Global average 0 1 Female vs Male Min Max65 82 55 4667 91 38 83 70 79 29 21 48 42 51 5897 29 98 64 99 31 94 73 71 07 75 08-64 90 35 10 50 00 50 00 33 45 16 55
Complementary Targets and Contextual Indicators 2023
Global Gender Gap Report 2023 188 Economy Profile Germany Score 0.815 Rank 6th Page 2 of 2
General indicators Indicator Unit Value GDP US$ billions 4,259 93 GDP per capita constant '17 intl $ 1000 53 18 Population sex ratio female/male 1 03 Population growth rate % 0 04 Indicator Million people Female Male Value Total population 42 23 41 14 83 37 Work participation and leadership Indicator Unit Value Gender pay gap % (OECD countries only) 14 20 Share of women's membership in boards % (OECD countries only) 36 00 Firms with female majority ownership % firms 12 90 Firms with female top managers % firms 14 20 Share of workers in informal sector % workers 3 80 Indicator 1-7 (best) Value Advancement of women to leadership roles 4 79 Indicator Unit Female Male Value Unemployed adults % of labour force (15-64) 3 00 3 40 3 20 Workers employed part-time % of employed people 59 02 28 25 42 63 Proportion of time spent on unpaid domestic and care work % 16 40 10 40 n a Indicator Million people Female Male Value Labour-force 18 44 20 99 39 44 Access to finance Indicator 0-1 (Equal rights) Value Access to financial services Equal rights Inheritance rights for widows and daughters Equal rights Access to land assets Equal rights Access to non-land assets Equal rights Civil and political freedom Indicator Unit Value Year women received right to vote year 1918 Number of female heads of state to date number 2 Seats held in upper house % total seats 40 60 Indicator Yes/No Value Election list quotas for women, national Yes Party membership quotas, voluntary Yes Indicator 0-1 (Equal rights) Value Access to justice Equal rights Freedom of movement Equal rights Family and care Indicator Unit Value Public spending on family benefits % GPD 2 42 Unmet family planning % women 15-49 n a Early marriage % 0 40 Mean age of women at birth of first child years 29 90 Indicator 0-1 (Equal rights) Value Right to divorce Equal rights Indicator Days Female Male Value Length of parental leave 98 00 0 300 00 Education and skills Graduates Attainment % Female Male Parity STEM Graduates 27 56 72 44 0 38 Agri , Forestry, Fisheries & Veterinary 42 32 57 68 0 73 Arts & Humanities 69 76 30 24 2 31 Business, Admin & Law n a n a n a Education n a n a n a Engineering, Manuf & Construction 21 12 78 88 0 27 Health & Welfare 70 58 29 42 2 40 Information & Comm Technologies 19 41 80 59 0 24 Natural Sci , Mathematics & Statistics 46 76 53 24 0 88 Social Sci , Jour nalism & Information 65 70 34 30 1 92 Vocational training 17 83 22 63 0 79 PhD graduates 1 03 2 01 1 51 Graduates % Female Male Value Graduates from tertiary education 47 56 41 92 44 61 Health Indicator Unit Value Prevalence of gender violence in lifetime % women 22 00 Births attended by skilled personnel % live births 96 20 Mater nal mortality deaths per 100,000 live births 7 00 Total fertility rate births per woman 1 53 Indicator 0-1 (Equal rights) Value Reproductive autonomy Equal rights *Scores are on a 0 to 1 scale, where 1 represents the optimal situation or “parity” Please see Appendix A and B for detailed methodology, definitions, sources and periods. **For all indicators, except the two health indicators, parity is benchmarked at 1 In the case of sex ratio at birth the gender parity benchmark is set at 0 944 (see Klasen and Wink 2003) In the case of healthy life expectancy the gender parity benchmark is set at 1 06, given women's longer life expectancy
Global Gender Gap Index Indicators
Global Gender Gap Report 2023 189 Global Gender Gap Index 2023 Edition Ghana score average score 0.682 Economy 0 974 E d u c a t i o n 0.978 Health 0 119 P o i t i c s Overview Index and Subindex 2023 Score Rank 2022 Score Rank Global Gender Gap Index 0 688 100th 0 672 108th Economic Participation and Opportunity 0.682 80th 0 608 108th Educational Attainment 0 974 105th 0 968 104th Health and Survival 0 978 36th 0 978 40th Political Empowerment 0 119 111th 0 135 105th
2023 Indicator Rank Score* Difference F-M Min Max Economic Participation and Opportunity 80th 0 682 -Labour-force participation rate % 4th 0 946 -3 96 0-100 Wage equality for similar work 1-7 (best) 45th 0 690Estimated ear ned income int'l $ 1,000 96th 0 597 -2 74 0-150 Legislators, senior officials and managers % 80th 0 509 -32 55 0-100 Professional and technical workers % 108th 0 592 -25 64 0-100 Educational Attainment 105th 0.974 -Literacy rate % 116th 0 902Enrolment in primary education % 1st 1 000 1 79 0-100 Enrolment in secondary education % 1st 1 000 0 75 0-200 Enrolment in tertiary education % 110th 0 937 -1 27 0-200 Health and Survival 36th 0 978 -Sex ratio at birth** % 1st 0 944Healthy life expectancy** years 47th 1 054Political Empowerment 111th 0 119 -Women in parliament % 120th 0 171 -70 80 0-100 Women in ministerial positions % 68th 0 267 -57 89 0-100 Years with female/male head of state (last 50) 80th 0 000 -50 00 0-50 Economy Profile Ghana Score (imparity = 0 parity = 1) 0.688 Rank (out of 146 countries) 100th Index Edition 2023 Compare with Global average 0 1 Female vs Male Min Max73 45 69 496 81 4 07 66 28 33 73 62 82 37 1893 14 94 93 79 58 80 33 20 16 18 89-85 40 14 60 78 95 21 05 50 00 0
Complementary Targets and Contextual Indicators 2023
Global Gender Gap Report 2023 190 Economy Profile Ghana Score 0.688 Rank 100th Page 2 of 2
General indicators Indicator Unit Value GDP US$ billions 77 59 GDP per capita constant '17 intl $ 1000 5 44 Population sex ratio female/male 1 01 Population growth rate % 2 01 Indicator Million people Female Male Value Total population 16 78 16 70 33 48 Work participation and leadership Indicator Unit Value Gender pay gap % (OECD countries only) n a Share of women's membership in boards % (OECD countries only) n a Firms with female majority ownership % firms 14 70 Firms with female top managers % firms 14 90 Share of workers in informal sector % workers 78 10 Indicator 1-7 (best) Value Advancement of women to leadership roles 4 78 Indicator Unit Female Male Value Unemployed adults % of labour force (15-64) 3 67 3 42 3 55 Workers employed part-time % of employed people 35 64 29 83 32 84 Proportion of time spent on unpaid domestic and care work % n a n a n a Indicator Million people Female Male Value Labour-force 5 22 4 77 9 98 Access to finance Indicator 0-1 (Equal rights) Value Access to financial services Equal rights Inheritance rights for widows and daughters Restricted rights Access to land assets Near-equal rights Access to non-land assets Uneven rights Civil and political freedom Indicator Unit Value Year women received right to vote year 1954 Number of female heads of state to date number 0 Seats held in upper house % total seats n a Indicator Yes/No Value Election list quotas for women, national n a Party membership quotas, voluntary n a Indicator 0-1 (Equal rights) Value Access to justice Near-equal rights Freedom of movement Equal rights Family and care Indicator Unit Value Public spending on family benefits % GPD n a Unmet family planning % women 15-49 33 60 Early marriage % 8 00 Mean age of women at birth of first child years n a Indicator 0-1 (Equal rights) Value Right to divorce Restricted rights Indicator Days Female Male Value Length of parental leave 84 00 0 0 Education and skills Graduates Attainment % Female Male Parity STEM Graduates 19 76 80 24 0 25 Agri , Forestry, Fisheries & Veterinary 26 78 73 22 0 37 Arts & Humanities 46 23 53 77 0 86 Business, Admin & Law n a n a n a Education 42 11 57 89 0 73 Engineering, Manuf & Construction 16 41 83 59 0 20 Health & Welfare 60 85 39 15 1 55 Information & Comm Technologies 19 87 80 13 0 25 Natural Sci , Mathematics & Statistics 26 76 73 24 0 37 Social Sci , Jour nalism & Information n a n a n a Vocational training 0 79 2 17 0 36 PhD graduates n a n a n a Graduates % Female Male Value Graduates from tertiary education 8 55 10 50 9 55 Health Indicator Unit Value Prevalence of gender violence in lifetime % women 24 40 Births attended by skilled personnel % live births 78 90 Mater nal mortality deaths per 100,000 live births 308 00 Total fertility rate births per woman 3 62 Indicator 0-1 (Equal rights) Value Reproductive autonomy Near-equal rights *Scores
0
1
where
optimal situation
parity
Appendix A and B for detailed methodology, definitions, sources and periods. **For all indicators, except the two health indicators, parity is benchmarked at 1 In the case of sex ratio at birth the gender parity benchmark is set at 0 944 (see Klasen and Wink 2003) In the case of healthy life expectancy the gender parity benchmark is set at 1 06, given women's longer life expectancy
are on a
to
scale,
1 represents the
or “
” Please see
Global Gender Gap Index Indicators
Global Gender Gap Report 2023 191 Global Gender Gap Index 2023 Edition Greece score average score 0.676 Economy 0 990 E d u c a t i o n 0.967 Health 0 140 P o i t i c s Overview Index and Subindex 2023 Score Rank 2022 Score Rank Global Gender Gap Index 0 693 93rd 0 689 100th Economic Participation and Opportunity 0.676 82nd 0 672 83rd Educational Attainment 0 990 81st 0 986 84th Health and Survival 0 967 96th 0 966 98th Political Empowerment 0 140 102nd 0 130 108th
2023 Indicator Rank Score* Difference F-M Min Max Economic Participation and Opportunity 82nd 0 676 -Labour-force participation rate % 86th 0 743 -15 02 0-100 Wage equality for similar work 1-7 (best) 65th 0 641Estimated ear ned income int'l $ 1,000 67th 0 658 -12 25 0-150 Legislators, senior officials and managers % 94th 0 420 -40 80 0-100 Professional and technical workers % 1st 1 000 4 31 0-100 Educational Attainment 81st 0.990 -Literacy rate % 1st 1 000Enrolment in primary education % 1st 1 000 0 53 0-100 Enrolment in secondary education % 116th 0 955 -4 87 0-200 Enrolment in tertiary education % 1st 1 000 3 00 0-200 Health and Survival 96th 0 967 -Sex ratio at birth** % 121st 0 940Healthy life expectancy** years 87th 1 029Political Empowerment 102nd 0 140 -Women in parliament % 90th 0 266 -58 00 0-100 Women in ministerial positions % 120th 0 118 -78 95 0-100 Years with female/male head of state (last 50) 45th 0 065 -43 93 0-50 Economy Profile Greece Score (imparity = 0 parity = 1) 0.693 Rank (out of 146 countries) 93rd Index Edition 2023 Compare with Global average 0 1 Female vs Male Min Max58 55 43 5335 80 23 55 70 40 29 60 47 84 52 1698 85 99 38 107 92 103 05 149 41 152 40-79 00 21 00 89 47 10 53 46 96 3 04
Complementary Targets and Contextual Indicators 2023
Global Gender Gap Report 2023 192 Economy Profile Greece Score 0.693 Rank 93rd Page 2 of 2
General indicators Indicator Unit Value GDP US$ billions 214 87 GDP per capita constant '17 intl $ 1000 29 55 Population sex ratio female/male 1 04 Population growth rate % -0 54 Indicator Million people Female Male Value Total population 5 30 5 08 10 38 Work participation and leadership Indicator Unit Value Gender pay gap % (OECD countries only) 5 91 Share of women's membership in boards % (OECD countries only) 19 60 Firms with female majority ownership % firms 16 50 Firms with female top managers % firms 17 20 Share of workers in informal sector % workers 6 30 Indicator 1-7 (best) Value Advancement of women to leadership roles 4 66 Indicator Unit Female Male Value Unemployed adults % of labour force (15-64) 16 60 9 30 12 60 Workers employed part-time % of employed people 34 55 18 85 25 48 Proportion of time spent on unpaid domestic and care work % 18 12 7 01 n a Indicator Million people Female Male Value Labour-force 1 98 2 50 4 48 Access to finance Indicator 0-1 (Equal rights) Value Access to financial services Equal rights Inheritance rights for widows and daughters Uneven rights Access to land assets Uneven rights Access to non-land assets Uneven rights Civil and political freedom Indicator Unit Value Year women received right to vote year 1949, 1952 Number of female heads of state to date number 2 Seats held in upper house % total seats n a Indicator Yes/No Value Election list quotas for women, national Yes Party membership quotas, voluntary Yes Indicator 0-1 (Equal rights) Value Access to justice Equal rights Freedom of movement Equal rights Family and care Indicator Unit Value Public spending on family benefits % GPD 1 77 Unmet family planning % women 15-49 n a Early marriage % 1 90 Mean age of women at birth of first child years 30 70 Indicator 0-1 (Equal rights) Value Right to divorce Uneven rights Indicator Days Female Male Value Length of parental leave 119 00 18 00 0 Education and skills Graduates Attainment % Female Male Parity STEM Graduates 40 09 59 91 0 67 Agri , Forestry, Fisheries & Veterinary 47 79 52 21 0 92 Arts & Humanities 73 94 26 06 2 84 Business, Admin & Law 58 56 41 44 1 41 Education 85 19 14 81 5 75 Engineering, Manuf & Construction n a n a n a Health & Welfare 70 59 29 41 2 40 Information & Comm Technologies 35 69 64 31 0 55 Natural Sci , Mathematics & Statistics 52 37 47 63 1 10 Social Sci , Jour nalism & Information 63 75 36 25 1 76 Vocational training 10 79 15 40 0 70 PhD graduates 0 45 1 00 0 72 Graduates % Female Male Value Graduates from tertiary education 52 15 36 11 43 99
Unit Value Prevalence of gender violence in lifetime % women 19 00 Births attended by skilled personnel % live births 99 90 Mater nal mortality deaths per 100,000 live births 3 00 Total fertility rate births per woman 1 34 Indicator 0-1 (Equal rights) Value Reproductive autonomy Equal rights
parity is benchmarked
case of sex ratio at birth the gender parity benchmark is set at 0 944 (see Klasen and Wink 2003) In the case of healthy life expectancy
gender parity benchmark is set at 1 06, given women's longer life expectancy
Health Indicator
*Scores are on a 0 to 1 scale, where 1 represents the optimal situation or “parity” Please see Appendix A and B for detailed methodology, definitions, sources and periods. **For all indicators, except the two health indicators,
at 1 In the
the
Global Gender Gap Index Indicators
Global Gender Gap Report 2023 193 Global Gender Gap Index 2023 Edition Guatemala score average score 0.580 Economy 0 982 E d u c a t i o n 0.980 Health 0 094 P o i t i c s Overview Index and Subindex 2023 Score Rank 2022 Score Rank Global Gender Gap Index 0 659 117th 0 664 113th Economic Participation and Opportunity 0.580 117th 0 589 117th Educational Attainment 0 982 94th 0 976 98th Health and Survival 0 980 1st 0 980 1st Political Empowerment 0 094 123rd 0 113 119th
2023 Indicator Rank Score* Difference F-M Min Max Economic Participation and Opportunity 117th 0 580 -Labour-force participation rate % 131st 0 452 -45 82 0-100 Wage equality for similar work 1-7 (best) 98th 0 595Estimated ear ned income int'l $ 1,000 126th 0 458 -6 66 0-150 Legislators, senior officials and managers % 58th 0 581 -26 49 0-100 Professional and technical workers % 72nd 0 971 -1 48 0-100 Educational Attainment 94th 0.982 -Literacy rate % 114th 0 903Enrolment in primary education % 1st 1 000 1 26 0-100 Enrolment in secondary education % 1st 1 000 0 80 0-200 Enrolment in tertiary education % 1st 1 000 3 28 0-200 Health and Survival 1st 0 980 -Sex ratio at birth** % 1st 0 944Healthy life expectancy** years 1st 1 060Political Empowerment 123rd 0 094 -Women in parliament % 101st 0 241 -61 20 0-100 Women in ministerial positions % 130th 0 077 -85 71 0-100 Years with female/male head of state (last 50) 80th 0 000 -50 00 0-50 Economy Profile Guatemala Score (imparity = 0 parity = 1) 0.659 Rank (out of 146 countries) 117th Index Edition 2023 Compare with Global average 0 1 Female vs Male Min Max83 66 37 8412 29 5 63 63 25 36 75 50 74 49 2689 96 91 21 46 73 47 53 20 52 23 81-80 60 19 40 92 86 7 14 50 00 0
Complementary Targets and Contextual Indicators 2023
Access
Global Gender Gap Report 2023 194 Economy Profile Guatemala Score 0.659 Rank 117th Page 2 of 2
General indicators Indicator Unit Value GDP US$ billions 85 99 GDP per capita constant '17 intl $ 1000 8 93 Population sex ratio female/male 1 02 Population growth rate % 1 48 Indicator Million people Female Male Value Total population 9 01 8 83 17 84 Work participation and leadership Indicator Unit Value Gender pay gap % (OECD countries only) n a Share of women's membership in boards % (OECD countries only) n a Firms with female majority ownership % firms 18 40 Firms with female top managers % firms 18 50 Share of workers in informal sector % workers 79 00 Indicator 1-7 (best) Value Advancement of women to leadership roles 4 66 Indicator Unit Female Male Value Unemployed adults % of labour force (15-64) 4 77 2 28 3 23 Workers employed part-time % of employed people 42 62 22 75 29 36 Proportion of time spent on unpaid domestic and care work % 19 48 2 61 n a Indicator Million people Female Male Value Labour-force 2 12 3 40 5 52 Access to finance Indicator 0-1 (Equal rights) Value Access to financial services Near-equal rights
rights for widows and daughters Near-equal rights
to land assets Near-equal rights
to non-land assets Near-equal rights Civil and political freedom Indicator Unit Value Year women received right to vote year 1946, 1985 Number of female heads of state to date number 0 Seats held in upper house % total seats n a Indicator Yes/No Value Election list quotas for women, national Yes Party membership quotas, voluntary Yes Indicator 0-1 (Equal rights) Value Access to justice Equal rights Freedom of movement Equal rights Family and care Indicator Unit Value Public spending on family benefits % GPD n a Unmet family planning % women 15-49 13 90 Early marriage % 21 60 Mean age of women at birth of first child years n a Indicator 0-1 (Equal rights) Value Right to divorce Equal rights Indicator Days Female Male Value Length of parental leave 84 00 2 00 0 Education and skills Graduates Attainment % Female Male Parity STEM Graduates n a n a n a Agri , Forestry, Fisheries & Veterinary 30 86 69 14 0 45 Arts & Humanities 55 97 44 03 1 27 Business, Admin & Law 54 93 45 07 1 22 Education 71 41 28 59 2 50 Engineering, Manuf & Construction 34 98 65 02 0 54 Health & Welfare 70 51 29 49 2 39 Information & Comm Technologies n a n a n a Natural Sci , Mathematics & Statistics 45 21 54 79 0 83 Social Sci , Jour nalism & Information 64 34 35 66 1 80 Vocational training 8 73 7 75 1 13 PhD graduates n a n a n a Graduates % Female Male Value Graduates from tertiary education 5 12 3 92 4 52 Health Indicator Unit Value Prevalence of gender violence in lifetime % women 18 00 Births attended by skilled personnel % live births 69 60 Mater nal mortality deaths per 100,000 live births 95 00 Total fertility rate births per woman 2 48 Indicator 0-1 (Equal rights) Value Reproductive autonomy Restricted rights
parity is benchmarked
case of sex ratio at birth the gender parity benchmark is set at 0 944 (see Klasen and Wink 2003) In the case of healthy life expectancy
gender parity benchmark is set at 1 06, given women's longer life expectancy
Inheritance
Access
*Scores are on a 0 to 1 scale, where 1 represents the optimal situation or “parity” Please see Appendix A and B for detailed methodology, definitions, sources and periods. **For all indicators, except the two health indicators,
at 1 In the
the
Global Gender Gap Index Indicators
Global Gender Gap Report 2023 195 Global Gender Gap Index 2023 Edition Guinea score average score 0.576 Economy 0 710 E d u c a t i o n 0.966 Health 0 217 P o i t i c s Overview Index and Subindex 2023 Score Rank 2022 Score Rank Global Gender Gap Index 0 617 137th 0 647 118th Economic Participation and Opportunity 0.576 119th 0 712 60th Educational Attainment 0 710 143rd 0 687 143rd Health and Survival 0 966 102nd 0 966 101st Political Empowerment 0 217 70th 0 225 65th
2023 Indicator Rank Score* Difference F-M Min Max Economic Participation and Opportunity 119th 0 576 -Labour-force participation rate % 107th 0 658 -22 32 0-100 Wage equality for similar work 1-7 (best) 20th 0 736Estimated ear ned income int'l $ 1,000 108th 0 550 -1 54 0-150 Legislators, senior officials and managers % 112th 0 305 -53 24 0-100 Professional and technical workers % 128th 0 414 -41 42 0-100 Educational Attainment 143rd 0.710 -Literacy rate % 144th 0 511Enrolment in primary education % 109th 0 852 -13 66 0-100 Enrolment in secondary education % 137th 0 722 -11 61 0-200 Enrolment in tertiary education % 134th 0 459 -4 97 0-200 Health and Survival 102nd 0 966 -Sex ratio at birth** % 1st 0 944Healthy life expectancy** years 111th 1 016Political Empowerment 70th 0 217 -Women in parliament % 54th 0 420 -40 80 0-100 Women in ministerial positions % 55th 0 350 -48 15 0-100 Years with female/male head of state (last 50) 80th 0 000 -50 00 0-50 Economy Profile Guinea Score (imparity = 0 parity = 1) 0.617 Rank (out of 146 countries) 137th Index Edition 2023 Compare with Global average 0 1 Female vs Male Min Max65 19 42 873 42 1 88 76 62 23 38 70 71 29 2992 32 78 66 41 82 30 22 9 18 4 21-70 40 29 60 74 07 25 93 50 00 0
Complementary Targets and Contextual Indicators 2023
Global Gender Gap Report 2023 196 Economy Profile Guinea Score 0.617 Rank 137th Page 2 of 2
General indicators Indicator Unit Value GDP US$ billions 16 09 GDP per capita constant '17 intl $ 1000 2 64 Population sex ratio female/male 1 02 Population growth rate % 2 44 Indicator Million people Female Male Value Total population 7 00 6 85 13 86 Work participation and leadership Indicator Unit Value Gender pay gap % (OECD countries only) n a Share of women's membership in boards % (OECD countries only) n a Firms with female majority ownership % firms 5 30 Firms with female top managers % firms 5 80 Share of workers in informal sector % workers n a Indicator 1-7 (best) Value Advancement of women to leadership roles 4 48 Indicator Unit Female Male Value Unemployed adults % of labour force (15-64) 5 19 5 13 5 16 Workers employed part-time % of employed people n a n a n a Proportion of time spent on unpaid domestic and care work % n a n a n a Indicator Million people Female Male Value Labour-force 1 23 1 66 2 89 Access to finance Indicator 0-1 (Equal rights) Value Access to financial services Near-equal rights
rights for widows and daughters Restricted rights
to land assets Near-equal rights Access to non-land assets Equal rights Civil and political freedom Indicator Unit Value Year women received right to vote year 1958 Number of female heads of state to date number 0 Seats held in upper house % total seats n a Indicator Yes/No Value Election list quotas for women, national Yes Party membership quotas, voluntary Yes Indicator 0-1 (Equal rights) Value Access to justice Near-equal rights Freedom of movement Equal rights Family and care Indicator Unit Value Public spending on family benefits % GPD n a Unmet family planning % women 15-49 22 10 Early marriage % 34 30 Mean age of women at birth of first child years n a Indicator 0-1 (Equal rights) Value Right to divorce Unequal rights Indicator Days Female Male Value Length of parental leave 98 00 0 0 Education and skills Graduates Attainment % Female Male Parity STEM Graduates n a n a n a Agri , Forestry, Fisheries & Veterinary n a n a n a Arts & Humanities n a n a n a Business, Admin & Law n a n a n a Education n a n a n a Engineering, Manuf & Construction n a n a n a Health & Welfare n a n a n a Information & Comm Technologies n a n a n a
Sci
Mathematics
Statistics n a n a n a Social Sci
Information n a n a n a Vocational training 0 79 0 83 0 95 PhD graduates 0 03 0 16 0 09 Graduates % Female Male Value Graduates from tertiary education 3 19 8 08 5 64 Health
Unit Value Prevalence of gender violence in lifetime % women 80 00 Births attended by skilled personnel % live births 55 30 Mater nal mortality deaths per 100,000 live births 576 00 Total fertility rate births per woman 4 49 Indicator 0-1 (Equal rights) Value Reproductive autonomy Uneven rights
two health indicators, parity is benchmarked at 1
the case of sex ratio at birth the gender parity benchmark is set at 0 944 (see Klasen and Wink 2003) In the case of healthy life expectancy
gender parity benchmark is set at 1 06, given women's longer life expectancy
Inheritance
Access
Natural
,
&
, Jour nalism &
Indicator
*Scores are on a 0 to 1 scale, where 1 represents the optimal situation or “parity” Please see Appendix A and B for detailed methodology, definitions, sources and periods. **For all indicators, except the
In
the
Global Gender Gap Index Indicators
Global Gender Gap Report 2023 197 Global Gender Gap Index 2023 Edition Honduras score average score 0.699 Economy 1 000 E d u c a t i o n 0.964 Health 0 278 P o i t i c s Overview Index and Subindex 2023 Score Rank 2022 Score Rank Global Gender Gap Index 0 735 53rd 0 705 82nd Economic Participation and Opportunity 0.699 66th 0 643 96th Educational Attainment 1 000 1st 1 000 1st Health and Survival 0 964 110th 0 964 112th Political Empowerment 0 278 52nd 0 213 71st
2023 Indicator Rank Score* Difference F-M Min Max Economic Participation and Opportunity 66th 0 699 -Labour-force participation rate % 110th 0 651 -25 92 0-100 Wage equality for similar work 1-7 (best) 96th 0 598Estimated ear ned income int'l $ 1,000 20th 0 789 -1 31 0-150 Legislators, senior officials and managers % 36th 0 669 -19 82 0-100 Professional and technical workers % 80th 0 910 -4 72 0-100 Educational Attainment 1st 1.000 -Literacy rate % 1st 1 000Enrolment in primary education % 1st 1 000 2 51 0-100 Enrolment in secondary education % 1st 1 000 0 08 0-200 Enrolment in tertiary education % 1st 1 000 8 33 0-200 Health and Survival 110th 0 964 -Sex ratio at birth** % 1st 0 944Healthy life expectancy** years 119th 1 010Political Empowerment 52nd 0 278 -Women in parliament % 71st 0 376 -45 40 0-100 Women in ministerial positions % 29th 0 615 -23 81 0-100 Years with female/male head of state (last 50) 63rd 0 022 -47 82 0-50 Economy Profile Honduras Score (imparity = 0 parity = 1) 0.735 Rank (out of 146 countries) 53rd Index Edition 2023 Compare with Global average 0 1 Female vs Male Min Max74 32 48 406 22 4 91 59 91 40 09 52 36 47 6480 08 82 60 0 46 0 54 21 37 29 70-72 70 27 30 61 91 38 10 48 91 1 09
Complementary Targets and Contextual Indicators 2023
Global Gender Gap Report 2023 198 Economy Profile Honduras Score 0.735 Rank 53rd Page 2 of 2
General indicators Indicator Unit Value GDP US$ billions 28 49 GDP per capita constant '17 intl $ 1000 5 57 Population sex ratio female/male 0 98 Population growth rate % 1 54 Indicator Million people Female Male Value Total population 5 17 5 27 10 43 Work participation and leadership Indicator Unit Value Gender pay gap % (OECD countries only) n a Share of women's membership in boards % (OECD countries only) n a Firms with female majority ownership % firms 26 50 Firms with female top managers % firms 28 00 Share of workers in informal sector % workers 82 60 Indicator 1-7 (best) Value Advancement of women to leadership roles 4 50 Indicator Unit Female Male Value Unemployed adults % of labour force (15-64) 14 46 8 47 11 11 Workers employed part-time % of employed people 40 29 24 48 30 62 Proportion of time spent on unpaid domestic and care work % n a n a n a Indicator Million people Female Male Value Labour-force 1 43 1 79 3 23 Access to finance Indicator 0-1 (Equal rights) Value Access to financial services Near-equal rights Inheritance rights for widows and daughters Equal rights Access to land assets Near-equal rights Access to non-land assets Equal rights Civil and political freedom Indicator Unit Value Year women received right to vote year 1955 Number of female heads of state to date number 0 Seats held in upper house % total seats n a Indicator Yes/No Value Election list quotas for women, national Yes Party membership quotas, voluntary Yes Indicator 0-1 (Equal rights) Value Access to justice Equal rights Freedom of movement Equal rights Family and care Indicator Unit Value Public spending on family benefits % GPD n a Unmet family planning % women 15-49 12 87 Early marriage % 27 30 Mean age of women at birth of first child years n a Indicator 0-1 (Equal rights) Value Right to divorce Equal rights Indicator Days Female Male Value Length of parental leave 84 00 0 0 Education and skills Graduates Attainment % Female Male Parity STEM Graduates 37 79 62 21 0 61 Agri , Forestry, Fisheries & Veterinary 24 73 75 27 0 33 Arts & Humanities n a n a n a Business, Admin & Law 62 38 37 62 1 66 Education 75 47 24 53 3 08 Engineering, Manuf & Construction 38 50 61 50 0 63 Health & Welfare 73 47 26 53 2 77 Information & Comm Technologies 27 14 72 86 0 37 Natural Sci , Mathematics & Statistics n a n a n a Social Sci , Jour nalism & Information n a n a n a Vocational training n a n a n a PhD graduates n a n a n a Graduates % Female Male Value Graduates from tertiary education 13 51 8 11 10 76 Health Indicator Unit Value Prevalence of gender violence in lifetime % women 21 60 Births attended by skilled personnel % live births 94 10 Mater nal mortality deaths per 100,000 live births 65 00 Total fertility rate births per woman 2 39 Indicator 0-1 (Equal rights) Value Reproductive autonomy Unequal rights *Scores
0
1
represents the optimal situation
parity” Please see Appendix A
B for detailed methodology, definitions, sources and periods. **For all indicators, except the two health indicators, parity is benchmarked at 1 In the case of sex ratio at birth the gender parity benchmark is set at 0 944 (see Klasen and Wink 2003) In the case of healthy life expectancy the gender parity benchmark is set at 1 06, given women's longer life expectancy
are on a
to
scale, where 1
or “
and
Global Gender Gap Index Indicators
Global Gender Gap Report 2023 199 Global Gender Gap Index 2023 Edition Hungary score average score 0.701 Economy 0 995 E d u c a t i o n 0.980 Health 0 079 P o i t i c s Overview Index and Subindex 2023 Score Rank 2022 Score Rank Global Gender Gap Index 0 689 99th 0 699 88th Economic Participation and Opportunity 0.701 62nd 0 703 67th Educational Attainment 0 995 58th 0 998 42nd Health and Survival 0 980 1st 0 980 1st Political Empowerment 0 079 130th 0 114 117th
2023 Indicator Rank Score* Difference F-M Min Max Economic Participation and Opportunity 62nd 0 701 -Labour-force participation rate % 69th 0 788 -14 23 0-100 Wage equality for similar work 1-7 (best) 85th 0 614Estimated ear ned income int'l $ 1,000 61st 0 666 -13 56 0-150 Legislators, senior officials and managers % 59th 0 577 -26 81 0-100 Professional and technical workers % 1st 1 000 13 76 0-100 Educational Attainment 58th 0.995 -Literacy rate % 1st 1 000Enrolment in primary education % 85th 0 992 -0 79 0-100 Enrolment in secondary education % 83rd 0 995 -0 53 0-200 Enrolment in tertiary education % 1st 1 000 11 63 0-200 Health and Survival 1st 0 980 -Sex ratio at birth** % 1st 0 944Healthy life expectancy** years 1st 1 060Political Empowerment 130th 0 079 -Women in parliament % 124th 0 151 -73 80 0-100 Women in ministerial positions % 127th 0 100 -81 82 0-100 Years with female/male head of state (last 50) 67th 0 016 -48 38 0-50 Economy Profile Hungary Score (imparity = 0 parity = 1) 0.689 Rank (out of 146 countries) 99th Index Edition 2023 Compare with Global average 0 1 Female vs Male Min Max67 04 52 8140 64 27 08 63 40 36 60 43 12 56 8894 88 94 09 103 30 102 78 49 49 61 12-86 90 13 10 90 91 9 09 49 19 0 81
Complementary Targets and Contextual Indicators 2023
are on a 0 to 1 scale, where 1 represents the optimal situation or “parity” Please see Appendix A and B for detailed
Global Gender Gap Report 2023 200 Economy Profile Hungary Score 0.689 Rank 99th Page 2 of 2
General indicators Indicator Unit Value GDP US$ billions 181 85 GDP per capita constant '17 intl $ 1000 33 59 Population sex ratio female/male 1 09 Population growth rate % -0 41 Indicator Million people Female Male Value Total population 5 18 4 79 9 97 Work participation and leadership Indicator Unit Value Gender pay gap % (OECD countries only) 12 35 Share of women's membership in boards % (OECD countries only) 9 40 Firms with female majority ownership % firms 15 30 Firms with female top managers % firms 22 10 Share of workers in informal sector % workers 10 20 Indicator 1-7 (best) Value Advancement of women to leadership roles 4 67 Indicator Unit Female Male Value Unemployed adults % of labour force (15-64) 3 50 3 80 3 70 Workers employed part-time % of employed people 33 32 21 75 27 15 Proportion of time spent on unpaid domestic and care work % n a n a n a Indicator Million people Female Male Value Labour-force 2 16 2 43 4 58 Access to finance Indicator 0-1 (Equal rights) Value Access to financial services Equal rights Inheritance rights for widows and daughters Uneven rights Access to land assets Near-equal rights Access to non-land assets Near-equal rights Civil and political freedom Indicator Unit Value Year women received right to vote year 1918, 1945, 1953 Number of female heads of state to date number 0 Seats held in upper house % total seats n a Indicator Yes/No Value Election list quotas for women, national Yes Party membership quotas, voluntary Yes Indicator 0-1 (Equal rights) Value Access to justice Equal rights Freedom of movement Equal rights Family and care Indicator Unit Value Public spending on family benefits % GPD 2 39 Unmet family planning % women 15-49 n a Early marriage % 0 70 Mean age of women at birth of first child years 28 40 Indicator 0-1 (Equal rights) Value Right to divorce Equal rights Indicator Days Female Male Value Length of parental leave 168 00 7 00 225 00 Education and skills Graduates Attainment % Female Male Parity STEM Graduates 31 68 68 32 0 46 Agri , Forestry, Fisheries & Veterinary 48 35 51 65 0 94 Arts & Humanities n a n a n a Business, Admin & Law 65 24 34 76 1 88 Education 84 76 15 24 5 56 Engineering, Manuf & Construction 29 85 70 15 0 43 Health & Welfare 73 65 26 35 2 79 Information & Comm Technologies 16 70 83 30 0 20 Natural Sci , Mathematics & Statistics 52 23 47 77 1 09 Social Sci , Jour nalism & Information 68 59 31 41 2 18 Vocational training 20 28 23 98 0 85 PhD graduates 0 55 0 85 0 69 Graduates % Female Male Value Graduates from tertiary education 174 74 104 18 138 56
Indicator Unit Value Prevalence of gender violence in lifetime % women 21 00 Births attended by skilled personnel % live births 99 70 Mater nal mortality deaths per 100,000 live births 12 00 Total fertility rate births per woman 1 56 Indicator 0-1 (Equal rights) Value Reproductive autonomy Near-equal rights
**For
two health indicators, parity is benchmarked at 1 In the case of sex ratio at birth the gender parity benchmark is set at 0 944 (see Klasen and Wink 2003) In the case of healthy life expectancy the gender parity benchmark is set at 1 06, given women's longer life expectancy
Health
*Scores
methodology, definitions, sources and periods.
all indicators, except the
Global Gender Gap Index Indicators
Global Gender Gap Report 2023 201 Global Gender Gap Index 2023 Edition Iceland score average score 0.796 Economy 0 991 E d u c a t i o n 0.961 Health 0 901 P o i t i c s Overview Index and Subindex 2023 Score Rank 2022 Score Rank Global Gender Gap Index 0 912 1st 0 908 1st Economic Participation and Opportunity 0.796 14th 0 803 11th Educational Attainment 0 991 79th 0 993 68th Health and Survival 0 961 128th 0 964 121st Political Empowerment 0 901 1st 0 874 1st
2023 Indicator Rank Score* Difference F-M Min Max Economic Participation and Opportunity 14th 0 796 -Labour-force participation rate % 14th 0 894 -8 25 0-100 Wage equality for similar work 1-7 (best) 5th 0 784Estimated ear ned income int'l $ 1,000 33rd 0 742 -15 80 0-150 Legislators, senior officials and managers % 54th 0 602 -24 86 0-100 Professional and technical workers % 1st 1 000 9 99 0-100 Educational Attainment 79th 0.991 -Literacy rate % 1st 1 000Enrolment in primary education % 74th 0 998 -0 17 0-100 Enrolment in secondary education % 111th 0 962 -4 39 0-200 Enrolment in tertiary education % 1st 1 000 55 01 0-200 Health and Survival 128th 0 961 -Sex ratio at birth** % 117th 0 941Healthy life expectancy** years 128th 1 008Political Empowerment 1st 0 901 -Women in parliament % 6th 0 908 -4 80 0-100 Women in ministerial positions % 25th 0 714 -16 67 0-100 Years with female/male head of state (last 50) 1st 1 000 1 14 0-50 Economy Profile Iceland Score (imparity = 0 parity = 1) 0.912 Rank (out of 146 countries) 1st Index Edition 2023 Compare with Global average 0 1 Female vs Male Min Max77 52 69 2761 29 45 49 62 43 37 57 45 01 55 0099 63 99 46 116 52 112 13 57 41 112 42-52 40 47 60 58 33 41 67 24 43 25 57
Complementary Targets and Contextual Indicators 2023
Global Gender Gap Report 2023 202 Economy Profile Iceland Score 0.912 Rank 1st Page 2 of 2
General indicators Indicator Unit Value GDP US$ billions 25 6 GDP per capita constant '17 intl $ 1000 53 59 Population sex ratio female/male 0 95 Population growth rate % 1 64 Indicator Million people Female Male Value Total population 0 18 0 19 0 37 Work participation and leadership Indicator Unit Value Gender pay gap % (OECD countries only) 12 90 Share of women's membership in boards % (OECD countries only) 47 10 Firms with female majority ownership % firms n a Firms with female top managers % firms n a Share of workers in informal sector % workers 1 40 Indicator 1-7 (best) Value Advancement of women to leadership roles 6 07 Indicator Unit Female Male Value Unemployed adults % of labour force (15-64) 3 50 4 30 3 90 Workers employed part-time % of employed people 59 80 38 10 48 03 Proportion of time spent on unpaid domestic and care work % n a n a n a Indicator Million people Female Male Value Labour-force 0 08 0 10 0 19 Access to finance Indicator 0-1 (Equal rights) Value Access to financial services Equal rights Inheritance rights for widows and daughters Equal rights Access to land assets Equal rights Access to non-land assets Equal rights Civil and political freedom Indicator Unit Value Year women received right to vote year 1882, 1908, 1915, 1920 Number of female heads of state to date number 3 Seats held in upper house % total seats n a Indicator Yes/No Value Election list quotas for women, national Yes Party membership quotas, voluntary Yes Indicator 0-1 (Equal rights) Value Access to justice Equal rights Freedom of movement Equal rights Family and care Indicator Unit Value Public spending on family benefits % GPD 3 34 Unmet family planning % women 15-49 n a Early marriage % 0 50 Mean age of women at birth of first child years 28 70 Indicator 0-1 (Equal rights) Value Right to divorce Equal rights Indicator Days Female Male Value Length of parental leave 180 00 180 00 0 Education and skills Graduates Attainment % Female Male Parity STEM Graduates n a n a n a Agri , Forestry, Fisheries & Veterinary n a n a n a Arts & Humanities n a n a n a Business, Admin & Law n a n a n a Education n a n a n a Engineering, Manuf & Construction n a n a n a Health & Welfare n a n a n a Information & Comm Technologies n a n a n a Natural Sci
Mathematics
Statistics n a n a n a Social Sci
Jour nalism & Information n a n a n a Vocational training 5 53 12 72 0 44 PhD graduates 0 95 1 85 1 42 Graduates % Female Male Value Graduates from tertiary education 69 36 39 99 54 34 Health Indicator Unit Value Prevalence of gender violence in lifetime % women 22 40 Births attended by skilled personnel % live births 97 40 Mater nal mortality deaths per 100,000 live births 4 00 Total fertility rate births per woman 1 72 Indicator 0-1 (Equal rights) Value Reproductive autonomy Near-equal rights
parity
benchmarked
case
sex ratio
birth
gender parity benchmark is set at 0 944 (see Klasen and Wink 2003)
the case of healthy life expectancy
gender parity benchmark
set at 1 06, given women's longer life expectancy
,
&
,
*Scores are on a 0 to 1 scale, where 1 represents the optimal situation or “parity” Please see Appendix A and B for detailed methodology, definitions, sources and periods. **For all indicators, except the two health indicators,
is
at 1 In the
of
at
the
In
the
is
Global Gender Gap Index Indicators
Global Gender Gap Report 2023 203 Global Gender Gap Index 2023 Edition India score average score 0.367 Economy 1 000 E d u c a t i o n 0.950 Health 0 253 P o i t i c s Overview Index and Subindex 2023 Score Rank 2022 Score Rank Global Gender Gap Index 0 643 127th 0 629 135th Economic Participation and Opportunity 0.367 142nd 0 350 143rd Educational Attainment 1 000 26th 0 961 107th Health and Survival 0 950 142nd 0 937 146th Political Empowerment 0 253 59th 0 267 48th
2023 Indicator Rank Score* Difference F-M Min Max Economic Participation and Opportunity 142nd 0 367 -Labour-force participation rate % 139th 0 371 -47 88 0-100 Wage equality for similar work 1-7 (best) 116th 0 511Estimated ear ned income int'l $ 1,000 141st 0 228 -8 12 0-150 Legislators, senior officials and managers % 124th 0 190 -68 13 0-100 Professional and technical workers % 121st 0 465 -36 51 0-100 Educational Attainment 26th 1.000 -Literacy rate % 1st 1 000Enrolment in primary education % 1st 1 000 1 91 0-100 Enrolment in secondary education % 80th 1 000 -0 03 0-200 Enrolment in tertiary education % 1st 1 000 2 60 0-200 Health and Survival 142nd 0 950 -Sex ratio at birth** % 140th 0 927Healthy life expectancy** years 137th 1 002Political Empowerment 59th 0 253 -Women in parliament % 117th 0 178 -69 80 0-100 Women in ministerial positions % 132nd 0 071 -86 67 0-100 Years with female/male head of state (last 50) 10th 0 407 -21 06 0-50 Economy Profile India Score (imparity = 0 parity = 1) 0.643 Rank (out of 146 countries) 127th Index Edition 2023 Compare with Global average 0 1 Female vs Male Min Max76 14 28 2610 52 2 40 84 07 15 94 68 25 31 7496 53 98 44 78 78 78 75 30 85 33 45-84 90 15 10 93 33 6 67 35 53 14 47
Complementary Targets and Contextual Indicators 2023
Global Gender Gap Report 2023 204 Economy Profile India Score 0.643 Rank 127th Page 2 of 2
General indicators Indicator Unit Value GDP US$ billions 3,176 3 GDP per capita constant '17 intl $ 1000 6 59 Population sex ratio female/male 0 94 Population growth rate % 0 80 Indicator Million people Female Male Value Total population 685 99 731 18 1417 17 Work participation and leadership Indicator Unit Value Gender pay gap % (OECD countries only) n a Share of women's membership in boards % (OECD countries only) 17 10 Firms with female majority ownership % firms 1 80 Firms with female top managers % firms 8 90 Share of workers in informal sector % workers 89 10 Indicator 1-7 (best) Value Advancement of women to leadership roles 3 74 Indicator Unit Female Male Value Unemployed adults % of labour force (15-64) 4 66 5 06 4 95 Workers employed part-time % of employed people n a n a n a Proportion of time spent on unpaid domestic and care work % n a n a n a Indicator Million people Female Male Value Labour-force 112 08 293 57 405 66 Labour-force n a n a n a Access to finance Indicator 0-1 (Equal rights) Value
to financial services Near-equal rights
rights for widows and daughters Uneven rights Access to land assets Near-equal rights
to non-land assets Near-equal rights Civil and political freedom Indicator Unit Value Year women received right to vote year 1937, 1950 Number of female heads of state to date number 3 Seats held in upper house % total seats 13 80 Indicator Yes/No Value Election list quotas for women, national Yes Party membership quotas, voluntary Yes Indicator 0-1 (Equal rights) Value Access to justice Near-equal rights Freedom of movement Equal rights Family and care Indicator Unit Value Public spending on family benefits % GPD n a Unmet family planning % women 15-49 9 40 Early marriage % 21 50 Mean age of women at birth of first child years n a Indicator 0-1 (Equal rights) Value Right to divorce Uneven rights Indicator Days Female Male Value Length of parental leave 182 00 0 0 Education and skills Graduates Attainment % Female Male Parity STEM Graduates n a n a n a Agri , Forestry, Fisheries & Veterinary 27 50 72 50 0 38 Arts & Humanities n a n a n a Business, Admin & Law 46 80 53 20 0 88 Education 61 07 38 93 1 57 Engineering, Manuf & Construction 30 83 69 17 0 45 Health & Welfare 61 55 38 45 1 60 Information & Comm Technologies n a n a n a Natural Sci , Mathematics & Statistics 51 37 48 63 1 06 Social Sci , Jour nalism & Information 55 11 44 89 1 23 Vocational training 1 51 3 16 0 48 PhD graduates n a n a n a Graduates % Female Male Value Graduates from tertiary education 34 30 28 23 31 09 Health Indicator Unit Value Prevalence of gender violence in lifetime % women 28 70 Births attended by skilled personnel % live births 89 40 Mater nal mortality deaths per 100,000 live births 145 00 Total fertility rate births per woman 2 05 Indicator 0-1 (Equal rights) Value Reproductive autonomy Near-equal rights *Scores are on a 0 to 1 scale, where 1 represents the optimal situation or “parity” Please see Appendix A and B for detailed methodology, definitions, sources and periods. **For all indicators, except the two health indicators, parity is benchmarked at 1 In the case of sex ratio at birth the gender parity benchmark is set at 0 944 (see Klasen and Wink 2003) In the case of healthy life expectancy the gender parity benchmark is set at 1 06, given women's longer life expectancy
Access
Inheritance
Access
Global Gender Gap Index Indicators
Global Gender Gap Report 2023 205 Global Gender Gap Index 2023 Edition Indonesia score average score 0.666 Economy 0 972 E d u c a t i o n 0.970 Health 0 181 P o i t i c s Overview Index and Subindex 2023 Score Rank 2022 Score Rank Global Gender Gap Index 0 697 87th 0 697 92nd Economic Participation and Opportunity 0.666 87th 0 674 80th Educational Attainment 0 972 106th 0 972 102nd Health and Survival 0 970 73rd 0 970 77th Political Empowerment 0 181 81st 0 169 90th
2023 Indicator Rank Score* Difference F-M Min Max Economic Participation and Opportunity 87th 0 666 -Labour-force participation rate % 112th 0 645 -28 95 0-100 Wage equality for similar work 1-7 (best) 12th 0 750Estimated ear ned income int'l $ 1,000 114th 0 519 -7 49 0-150 Legislators, senior officials and managers % 87th 0 463 -36 67 0-100 Professional and technical workers % 1st 1 000 1 00 0-100 Educational Attainment 106th 0.972 -Literacy rate % 92nd 0 970Enrolment in primary education % 102nd 0 952 -4 59 0-100 Enrolment in secondary education % 1st 1 000 2 20 0-200 Enrolment in tertiary education % 1st 1 000 5 24 0-200 Health and Survival 73rd 0 970 -Sex ratio at birth** % 112th 0 943Healthy life expectancy** years 84th 1 030Political Empowerment 81st 0 181 -Women in parliament % 89th 0 276 -56 80 0-100 Women in ministerial positions % 72nd 0 261 -58 62 0-100 Years with female/male head of state (last 50) 43rd 0 069 -43 51 0-50 Economy Profile Indonesia Score (imparity = 0 parity = 1) 0.697 Rank (out of 146 countries) 87th Index Edition 2023 Compare with Global average 0 1 Female vs Male Min Max81 45 52 5015 58 8 09 68 33 31 67 49 50 50 5096 61 92 02 87 84 90 04 33 75 38 99-78 40 21 60 79 31 20 69 46 75 3 25
Complementary Targets and Contextual Indicators 2023
Global Gender Gap Report 2023 206 Economy Profile Indonesia Score 0.697 Rank 87th Page 2 of 2
General indicators Indicator Unit Value GDP US$ billions 1,186 09 GDP per capita constant '17 intl $ 1000 11 86 Population sex ratio female/male 0 99 Population growth rate % 0 69 Indicator Million people Female Male Value Total population 136 80 138 70 275 50 Work participation and leadership Indicator Unit Value Gender pay gap % (OECD countries only) n a Share of women's membership in boards % (OECD countries only) 12 20 Firms with female majority ownership % firms 18 20 Firms with female top managers % firms 22 10 Share of workers in informal sector % workers 80 20 Indicator 1-7 (best) Value Advancement of women to leadership roles 5 02 Indicator Unit Female Male Value Unemployed adults % of labour force (15-64) 3 36 3 90 3 69 Workers employed part-time % of employed people 44 82 28 97 35 18 Proportion of time spent on unpaid domestic and care work % n a n a n a Indicator Million people Female Male Value Labour-force 46 45 73 51 119 95 Access to finance Indicator 0-1 (Equal rights) Value Access to financial services Near-equal rights
rights for widows and daughters Unequal rights Access to land assets Uneven rights Access to non-land assets Near-equal rights Civil and political freedom Indicator Unit Value Year women received right to vote year 1945, 2003 Number of female heads of state to date number 1 Seats held in upper house % total seats n a Indicator Yes/No Value Election list quotas for women, national Yes Party membership quotas, voluntary Yes Indicator 0-1 (Equal rights) Value Access to justice Unequal rights Freedom of movement Near-equal rights Family and care Indicator Unit Value Public spending on family benefits % GPD n a Unmet family planning % women 15-49 10 60 Early marriage % 13 80 Mean age of women at birth of first child years n a Indicator 0-1 (Equal rights) Value Right to divorce Near-equal rights Indicator Days Female Male Value Length of parental leave 90 00 2 00 0 Education and skills Graduates Attainment % Female Male Parity STEM Graduates n a n a n a Agri , Forestry, Fisheries & Veterinary n a n a n a Arts & Humanities 58 86 41 14 1 43 Business, Admin & Law 57 93 42 07 1 38 Education 69 58 30 42 2 29 Engineering, Manuf & Construction 24 92 75 08 0 33 Health & Welfare n a n a n a Information & Comm Technologies 34 67 65 33 0 53 Natural Sci , Mathematics & Statistics n a n a n a Social Sci , Jour nalism & Information 50 56 49 44 1 02 Vocational training 11 89 13 67 0 87 PhD graduates 0 03 0 06 0 04 Graduates % Female Male Value Graduates from tertiary education 25 27 17 31 21 20
Indicator Unit Value Prevalence of gender violence in lifetime % women 18 30 Births attended by skilled personnel % live births 94 70 Mater nal mortality deaths per 100,000 live births 177 00 Total fertility rate births per woman 2 19 Indicator
rights) Value Reproductive autonomy Uneven rights *Scores are on a 0 to 1 scale, where 1 represents the optimal situation or “parity” Please see Appendix A and B for detailed methodology, definitions, sources and periods. **For
ratio
birth
gender parity
life expectancy
Inheritance
Health
0-1 (Equal
all indicators, except the two health indicators, parity is benchmarked at 1 In the case of sex
at
the
benchmark is set at 0 944 (see Klasen and Wink 2003) In the case of healthy life expectancy the gender parity benchmark is set at 1 06, given women's longer
Global Gender Gap Index Indicators
Global Gender Gap Report 2023 207 Global Gender Gap Index 2023 Edition Iran (Islamic Republic of) score average score 0.344 Economy 0 960 E d u c a t i o n 0.964 Health 0 031 P o i t i c s Overview Index and Subindex 2023 Score Rank 2022 Score Rank Global Gender Gap Index 0 575 143rd 0 576 143rd Economic Participation and Opportunity 0.344 144th 0 343 144th Educational Attainment 0 960 112th 0 963 106th Health and Survival 0 964 116th 0 964 118th Political Empowerment 0 031 143rd 0 036 142nd
2023 Indicator Rank Score* Difference F-M Min Max Economic Participation and Opportunity 144th 0 344 -Labour-force participation rate % 146th 0 204 -54 17 0-100 Wage equality for similar work 1-7 (best) 113th 0 542Estimated ear ned income int'l $ 1,000 145th 0 171 -21 08 0-150 Legislators, senior officials and managers % 122nd 0 219 -64 04 0-100 Professional and technical workers % 116th 0 534 -30 37 0-100 Educational Attainment 112th 0.960 -Literacy rate % 110th 0 920Enrolment in primary education % - - -Enrolment in secondary education % 91st 0 990 -0 94 0-200 Enrolment in tertiary education % 108th 0 965 -2 06 0-200 Health and Survival 116th 0 964 -Sex ratio at birth** % 1st 0 944Healthy life expectancy** years 125th 1 008Political Empowerment 143rd 0 031 -Women in parliament % 137th 0 059 -88 80 0-100 Women in ministerial positions % 137th 0 053 -90 00 0-100 Years with female/male head of state (last 50) 80th 0 000 -50 00 0-50 Economy Profile Iran (Islamic
Score (imparity = 0 parity = 1) 0.575 Rank (out of 146 countries) 143rd Index Edition 2023 Compare with Global average 0 1 Female vs Male Min Max68 05 13 8825 44 4 36 82 02 17 98 65 19 34 81-89 83 88 89 59 24 57 18-94 40 5 60 95 00 5 00 50 00 0
Republic of)
Complementary Targets and Contextual Indicators 2023
Global Gender Gap Report 2023 208 Economy Profile Iran (Islamic Republic of) Score 0.575 Rank 143rd Page 2 of 2
General indicators Indicator Unit Value GDP US$ billions 359 71 GDP per capita constant '17 intl $ 1000 15 00 Population sex ratio female/male 0 98 Population growth rate % 0 72 Indicator Million people Female Male Value Total population 43 84 44 72 88 55 Work participation and leadership Indicator Unit Value Gender pay gap % (OECD countries only) n a Share of women's membership in boards % (OECD countries only) n a Firms with female majority ownership % firms n a Firms with female top managers % firms n a Share of workers in informal sector % workers n a Indicator 1-7 (best) Value Advancement of women to leadership roles 3 18 Indicator Unit Female Male Value Unemployed adults % of labour force (15-64) 16 18 8 12 9 45 Workers employed part-time % of employed people 55 69 26 91 32 16 Proportion of time spent on unpaid domestic and care work % n a n a n a Indicator Million people Female Male Value Labour-force 3 77 19 46 23 23 Access to finance Indicator 0-1 (Equal rights) Value Access to financial services Equal rights Inheritance rights for widows and daughters Unequal rights Access to land assets Equal rights Access to non-land assets Equal rights Civil and political freedom Indicator Unit Value Year women received right to vote year 1963 Number of female heads of state to date number 0 Seats held in upper house % total seats n a Indicator Yes/No Value Election list quotas for women, national n a Party membership quotas, voluntary n a Indicator 0-1 (Equal rights) Value Access to justice Restricted rights Freedom of movement Unequal rights Family and care Indicator Unit Value Public spending on family benefits % GPD n a Unmet family planning % women 15-49 n a Early marriage % 21 40 Mean age of women at birth of first child years n a Indicator 0-1 (Equal rights) Value Right to divorce Unequal rights Indicator Days Female Male Value Length of parental leave 180 00 14 00 0 Education and skills Graduates Attainment % Female Male Parity STEM Graduates 31 16 68 84 0 45 Agri , Forestry, Fisheries & Veterinary 47 53 52 47 0 91 Arts & Humanities 64 14 35 86 1 79 Business, Admin & Law n a n a n a Education n a n a n a Engineering, Manuf & Construction 22 66 77 34 0 29 Health & Welfare n a n a n a Information & Comm Technologies 39 11 60 89 0 64 Natural Sci , Mathematics & Statistics 68 02 31 98 2 13 Social Sci , Jour nalism & Information 55 46 44 54 1 25 Vocational training 6 47 10 53 0 61 PhD graduates 0 30 0 43 0 37 Graduates % Female Male Value Graduates from tertiary education 26 06 25 72 25 89 Health Indicator Unit Value Prevalence of gender violence in lifetime % women 66 00 Births attended by skilled personnel % live births 99 00 Mater nal mortality deaths per 100,000 live births 16 00 Total fertility rate births per woman 1 71 Indicator 0-1 (Equal rights) Value Reproductive autonomy Restricted rights *Scores
0
optimal situation
Appendix A
B for detailed methodology, definitions, sources and periods. **For all indicators, except the two health indicators, parity is benchmarked at 1 In the case of sex ratio at birth the gender parity benchmark is set at 0 944 (see Klasen and Wink 2003) In the case of healthy life expectancy the gender parity benchmark is set at 1 06, given women's longer life expectancy
are on a
to 1 scale, where 1 represents the
or “parity” Please see
and
Global Gender Gap Index Indicators
Global Gender Gap Report 2023 209 Global Gender Gap Index 2023 Edition Ireland score average score 0.732 Economy 1 000 E d u c a t i o n 0.964 Health 0 482 P o i t i c s Overview Index and Subindex 2023 Score Rank 2022 Score Rank Global Gender Gap Index 0 795 11th 0 804 9th Economic Participation and Opportunity 0.732 41st 0 746 35th Educational Attainment 1 000 1st 1 000 1st Health and Survival 0 964 111th 0 964 113th Political Empowerment 0 482 17th 0 507 11th
2023 Indicator Rank Score* Difference F-M Min Max Economic Participation and Opportunity 41st 0 732 -Labour-force participation rate % 51st 0 839 -11 09 0-100 Wage equality for similar work 1-7 (best) 46th 0 687Estimated ear ned income int'l $ 1,000 78th 0 632 -46 34 0-150 Legislators, senior officials and managers % 49th 0 613 -23 98 0-100 Professional and technical workers % 1st 1 000 2 99 0-100 Educational Attainment 1st 1.000 -Literacy rate % 1st 1 000Enrolment in primary education % - - -Enrolment in secondary education % 1st 1 000 13 20 0-200 Enrolment in tertiary education % 1st 1 000 11 97 0-200 Health and Survival 111th 0 964 -Sex ratio at birth** % 1st 0 944Healthy life expectancy** years 120th 1 010Political Empowerment 17th 0 482 -Women in parliament % 85th 0 300 -53 80 0-100 Women in ministerial positions % 62nd 0 300 -53 85 0-100 Years with female/male head of state (last 50) 3rd 0 712 -8 43 0-50 Economy Profile Ireland Score (imparity = 0 parity = 1) 0.795 Rank (out of 146 countries) 11th Index Edition 2023 Compare with Global average 0 1 Female vs Male Min Max68 95 57 86125 87 79 53 61 99 38 01 48 51 51 49-128 77 141 98 68 78 80 76-76 90 23 10 76 92 23 08 29 21 20 79
Complementary Targets and Contextual Indicators 2023
Global Gender Gap Report 2023 210 Economy Profile Ireland Score 0.795 Rank 11th Page 2 of 2
General indicators Indicator Unit Value GDP US$ billions 504 18 GDP per capita constant '17 intl $ 1000 102 50 Population sex ratio female/male 1 02 Population growth rate % 0 95 Indicator Million people Female Male Value Total population 2 53 2 49 5 02 Work participation and leadership Indicator Unit Value Gender pay gap % (OECD countries only) 8 28 Share of women's membership in boards % (OECD countries only) 30 20 Firms with female majority ownership % firms 6 10 Firms with female top managers % firms 15 10 Share of workers in informal sector % workers 2 10 Indicator 1-7 (best) Value Advancement of women to leadership roles 5 44 Indicator Unit Female Male Value Unemployed adults % of labour force (15-64) 4 70 4 50 4 60 Workers employed part-time % of employed people 38 80 20 73 29 14 Proportion of time spent on unpaid domestic and care work % n a n a n a Indicator Million people Female Male Value Labour-force 1 08 1 24 2 32 Access to finance Indicator 0-1 (Equal rights) Value Access to financial services Equal rights Inheritance rights for widows and daughters Equal rights Access to land assets Equal rights Access to non-land assets Equal rights Civil and political freedom Indicator Unit Value Year women received right to vote year 1918, 1922 Number of female heads of state to date number 2 Seats held in upper house % total seats 39 00 Indicator Yes/No Value Election list quotas for women, national Yes Party membership quotas, voluntary Yes Indicator 0-1 (Equal rights) Value Access to justice Equal rights Freedom of movement Equal rights Family and care Indicator Unit Value Public spending on family benefits % GPD 1 64 Unmet family planning % women 15-49 n a Early marriage % 0 30 Mean age of women at birth of first child years 30 90 Indicator 0-1 (Equal rights) Value Right to divorce Equal rights Indicator Days Female Male Value Length of parental leave 182 00 14 00 0 Education and skills Graduates Attainment % Female Male Parity STEM Graduates n a n a n a Agri , Forestry, Fisheries & Veterinary 39 55 60 45 0 65 Arts & Humanities 59 10 40 90 1 44 Business, Admin & Law 49 52 50 48 0 98 Education 71 31 28 69 2 48 Engineering, Manuf & Construction 17 56 82 44 0 21 Health & Welfare 76 42 23 58 3 24 Information & Comm Technologies n a n a n a Natural Sci , Mathematics & Statistics n a n a n a Social Sci , Jour nalism & Information 61 53 38 47 1 60 Vocational training 5 62 7 71 0 73 PhD graduates 0 85 1 13 0 99 Graduates % Female Male Value Graduates from tertiary education n a n a n a Health Indicator Unit Value Prevalence of gender violence in lifetime % women 15 00 Births attended by skilled personnel % live births 99 70 Mater nal mortality deaths per 100,000 live births 5 00 Total fertility rate births per woman 1 63 Indicator 0-1 (Equal rights) Value Reproductive autonomy Restricted rights *Scores
**For
health indicators, parity
benchmarked
1
case of sex ratio at birth the gender parity benchmark is set at 0 944 (see Klasen and Wink 2003) In the case of healthy life expectancy
gender parity benchmark is set at 1 06, given women's longer life expectancy
are on a 0 to 1 scale, where 1 represents the optimal situation or “parity” Please see Appendix A and B for detailed methodology, definitions, sources and periods.
all indicators, except the two
is
at
In the
the
Global Gender Gap Index Indicators
Global Gender Gap Report 2023 211 Global Gender Gap Index 2023 Edition Israel score average score 0.688 Economy 1 000 E d u c a t i o n 0.964 Health 0 150 P o i t i c s Overview Index and Subindex 2023 Score Rank 2022 Score Rank Global Gender Gap Index 0 701 83rd 0 727 60th Economic Participation and Opportunity 0.688 75th 0 701 69th Educational Attainment 1 000 1st 1 000 1st Health and Survival 0 964 109th 0 964 111th Political Empowerment 0 150 96th 0 241 61st
2023 Indicator Rank Score* Difference F-M Min Max Economic Participation and Opportunity 75th 0 688 -Labour-force participation rate % 16th 0 890 -7 38 0-100 Wage equality for similar work 1-7 (best) 81st 0 615Estimated ear ned income int'l $ 1,000 84th 0 626 -19 36 0-150 Legislators, senior officials and managers % 96th 0 409 -41 91 0-100 Professional and technical workers % 1st 1 000 11 89 0-100 Educational Attainment 1st 1.000 -Literacy rate % 1st 1 000Enrolment in primary education % - - -Enrolment in secondary education % 1st 1 000 1 58 0-200 Enrolment in tertiary education % 1st 1 000 23 14 0-200 Health and Survival 109th 0 964 -Sex ratio at birth** % 1st 0 944Healthy life expectancy** years 118th 1 011Political Empowerment 96th 0 150 -Women in parliament % 82nd 0 319 -51 60 0-100 Women in ministerial positions % 109th 0 143 -75 00 0-100 Years with female/male head of state (last 50) 55th 0 036 -46 55 0-50 Economy Profile Israel Score (imparity = 0 parity = 1) 0.701 Rank (out of 146 countries) 83rd Index Edition 2023 Compare with Global average 0 1 Female vs Male Min Max67 11 59 7351 76 32 41 70 95 29 05 44 06 55 95-104 17 105 75 49 81 72 95-75 80 24 20 87 50 12 50 48 27 1 73
Complementary Targets and Contextual Indicators 2023
Global Gender Gap Report 2023 212 Economy Profile Israel Score 0.701 Rank 83rd Page 2 of 2
General indicators Indicator Unit Value GDP US$ billions 488 53 GDP per capita constant '17 intl $ 1000 42 06 Population sex ratio female/male 1 01 Population growth rate % 1 60 Indicator Million people Female Male Value Total population 4 53 4 51 9 04 Work participation and leadership Indicator Unit Value Gender pay gap % (OECD countries only) 24 32 Share of women's membership in boards % (OECD countries only) 26 70 Firms with female majority ownership % firms 3 10 Firms with female top managers % firms 10 10 Share of workers in informal sector % workers n a Indicator 1-7 (best) Value Advancement of women to leadership roles 5 16 Indicator Unit Female Male Value Unemployed adults % of labour force (15-64) 4 82 5 06 4 94 Workers employed part-time % of employed people 46 19 27 27 36 38 Proportion of time spent on unpaid domestic and care work % n a n a n a Indicator Million people Female Male Value Labour-force 1 71 1 84 3 54 Access to finance Indicator 0-1 (Equal rights) Value Access to financial services Equal rights Inheritance rights for widows and daughters Near-equal rights Access to land assets Near-equal rights Access to non-land assets Near-equal rights Civil and political freedom Indicator Unit Value Year women received right to vote year 1948 Number of female heads of state to date number 2 Seats held in upper house % total seats n a Indicator Yes/No Value Election list quotas for women, national Yes Party membership quotas, voluntary Yes Indicator 0-1 (Equal rights) Value Access to justice Restricted rights Freedom of movement Equal rights Family and care Indicator Unit Value Public spending on family benefits % GPD 1 89 Unmet family planning % women 15-49 n a Early marriage % 2 50 Mean age of women at birth of first child years 27 70 Indicator 0-1 (Equal rights) Value Right to divorce Restricted rights Indicator Days Female Male Value Length of parental leave 105 00 0 0 Education and skills Graduates Attainment % Female Male Parity STEM Graduates n a n a n a Agri , Forestry, Fisheries & Veterinary 48 21 51 79 0 93 Arts & Humanities n a n a n a Business, Admin & Law n a n a n a Education n a n a n a Engineering, Manuf & Construction n a n a n a Health & Welfare n a n a n a Information & Comm Technologies n a n a n a Natural Sci , Mathematics & Statistics n a n a n a Social Sci , Jour nalism & Information n a n a n a Vocational training 18 20 15 13 1 20 PhD graduates 1 15 1 75 1 44 Graduates % Female Male Value Graduates from tertiary education 50 58 30 32 40 19 Health
Unit Value Prevalence of gender violence in lifetime % women n a Births attended by skilled personnel % live births n a Mater nal mortality deaths per 100,000 live births 3 00 Total fertility rate births per woman 2 90 Indicator 0-1 (Equal rights) Value Reproductive autonomy Near-equal rights *Scores
optimal
detailed methodology, de
nitions, sources
periods. **For
indicators,
two health indicators, parity is benchmarked at 1 In the case of sex ratio at birth the gender parity benchmark is set at 0 944 (see Klasen and Wink 2003) In the case of healthy life expectancy the gender parity benchmark is set at 1 06, given women's longer life expectancy
Indicator
are on a 0 to 1 scale, where 1 represents the
situation or “parity” Please see Appendix A and B for
fi
and
all
except the
Global Gender Gap Index Indicators
Global Gender Gap Report 2023 213 Global Gender Gap Index 2023 Edition Italy score average score 0.618 Economy 0 995 E d u c a t i o n 0.967 Health 0 241 P o i t i c s Overview Index and Subindex 2023 Score Rank 2022 Score Rank Global Gender Gap Index 0 705 79th 0 720 63rd Economic Participation and Opportunity 0.618 104th 0 603 110th Educational Attainment 0 995 60th 0 995 59th Health and Survival 0 967 95th 0 965 108th Political Empowerment 0 241 64th 0 319 40th
2023 Indicator Rank Score* Difference F-M Min Max Economic Participation and Opportunity 104th 0 618 -Labour-force participation rate % 93rd 0 696 -17 53 0-100 Wage equality for similar work 1-7 (best) 80th 0 616Estimated ear ned income int'l $ 1,000 107th 0 550 -24 49 0-150 Legislators, senior officials and managers % 100th 0 401 -42 78 0-100 Professional and technical workers % 86th 0 885 -6 08 0-100 Educational Attainment 60th 0.995 -Literacy rate % 65th 0 997Enrolment in primary education % 77th 0 997 -0 28 0-100 Enrolment in secondary education % 95th 0 985 -1 50 0-200 Enrolment in tertiary education % 1st 1 000 21 43 0-200 Health and Survival 95th 0 967 -Sex ratio at birth** % 1st 0 944Healthy life expectancy** years 105th 1 020Political Empowerment 64th 0 241 -Women in parliament % 48th 0 477 -35 40 0-100 Women in ministerial positions % 53rd 0 364 -46 67 0-100 Years with female/male head of state (last 50) 72nd 0 007 -49 29 0-50 Economy Profile Italy Score (imparity = 0 parity = 1) 0.705 Rank (out of 146 countries) 79th Index Edition 2023 Compare with Global average 0 1 Female vs Male Min Max57 64 40 1154 48 29 99 71 39 28 61 53 04 46 9695 94 95 65 101 64 100 14 59 16 80 59-67 70 32 30 73 33 26 67 49 64 0 36
Complementary Targets and Contextual Indicators 2023
Global Gender Gap Report 2023 214 Economy Profile Italy Score 0.705 Rank 79th Page 2 of 2
General indicators Indicator Unit Value GDP US$ billions 2,107 7 GDP per capita constant '17 intl $ 1000 41 93 Population sex ratio female/male 1 05 Population growth rate % -0 56 Indicator Million people Female Male Value Total population 30 25 28 79 59 04 Work participation and leadership Indicator Unit Value Gender pay gap % (OECD countries only) 7 64 Share of women's membership in boards % (OECD countries only) 38 80 Firms with female majority ownership % firms 11 50 Firms with female top managers % firms 15 30 Share of workers in informal sector % workers 11 20 Indicator 1-7 (best) Value Advancement of women to leadership roles 4 38 Indicator Unit Female Male Value Unemployed adults % of labour force (15-64) 9 50 7 30 8 20 Workers employed part-time % of employed people 50 67 24 67 35 64 Proportion of time spent on unpaid domestic and care work % 20 40 8 40 n a Indicator Million people Female Male Value Labour-force 10 15 13 47 23 63 Access to finance Indicator 0-1 (Equal rights) Value Access to financial services Near-equal rights Inheritance rights for widows and daughters Equal rights Access to land assets Equal rights Access to non-land assets Equal rights Civil and political freedom Indicator Unit Value Year women received right to vote year 1945 Number of female heads of state to date number 0 Seats held in upper house % total seats 34 50 Indicator Yes/No Value Election list quotas for women, national Yes Party membership quotas, voluntary Yes Indicator 0-1 (Equal rights) Value Access to justice Equal rights Freedom of movement Equal rights Family and care Indicator Unit Value Public spending on family benefits % GPD 1 42 Unmet family planning % women 15-49 n a Early marriage % 0 20 Mean age of women at birth of first child years 31 40 Indicator 0-1 (Equal rights) Value Right to divorce Equal rights Indicator Days Female Male Value Length of parental leave 150 00 14 00 0 Education and skills Graduates Attainment % Female Male Parity STEM Graduates n a n a n a Agri , Forestry, Fisheries & Veterinary 50 36 49 64 1 01 Arts & Humanities 71 17 28 83 2 47 Business, Admin & Law n a n a n a Education 93 34 6 66 14 01 Engineering, Manuf & Construction n a n a n a Health & Welfare n a n a n a Information & Comm Technologies n a n a n a Natural Sci , Mathematics & Statistics 57 95 42 05 1 38 Social Sci , Jour nalism & Information 71 43 28 57 2 50 Vocational training 15 67 25 59 0 61 PhD graduates 0 38 0 43 0 40 Graduates % Female Male Value Graduates from tertiary education 50 96 34 38 42 35 Health Indicator Unit Value Prevalence of gender violence in lifetime % women 19 00 Births attended by skilled personnel % live births 99 80 Mater nal mortality deaths per 100,000 live births 2 00 Total fertility rate births per woman 1 24 Indicator 0-1 (Equal rights) Value Reproductive autonomy Equal rights *Scores are on a 0 to 1 scale, where 1 represents the optimal situation or “parity” Please see Appendix A and B for detailed methodology, definitions, sources and periods. **For all indicators, except the two health indicators, parity is benchmarked at 1 In the case of sex ratio at birth the gender parity benchmark is set at 0 944 (see Klasen and Wink 2003) In the case of healthy life expectancy the gender parity benchmark is set at 1 06, given women's longer life expectancy
Global Gender Gap Index Indicators
Global Gender Gap Report 2023 215 Global Gender Gap Index 2023 Edition Jamaica score average score 0.894 Economy 0 993 E d u c a t i o n 0.967 Health 0 263 P o i t i c s Overview Index and Subindex 2023 Score Rank 2022 Score Rank Global Gender Gap Index 0 779 24th 0 749 38th Economic Participation and Opportunity 0.894 2nd 0 798 14th Educational Attainment 0 993 68th 1 000 1st Health and Survival 0 967 94th 0 967 95th Political Empowerment 0 263 57th 0 230 63rd
2023 Indicator Rank Score* Difference F-M Min Max Economic Participation and Opportunity 2nd 0 894 -Labour-force participation rate % 59th 0 818 -12 65 0-100 Wage equality for similar work 1-7 (best) - - -Estimated ear ned income int'l $ 1,000 9th 0 833 -1 75 0-150 Legislators, senior officials and managers % 1st 1 000 13 37 0-100 Professional and technical workers % 1st 1 000 15 78 0-100 Educational Attainment 68th 0.993 -Literacy rate % 1st 1 000Enrolment in primary education % - - -Enrolment in secondary education % 97th 0 985 -0 01 0-200 Enrolment in tertiary education % 1st 1 000 14 81 0-200 Health and Survival 94th 0 967 -Sex ratio at birth** % 1st 0 944Healthy life expectancy** years 104th 1 020Political Empowerment 57th 0 263 -Women in parliament % 59th 0 401 -42 80 0-100 Women in ministerial positions % 56th 0 333 -50 00 0-100 Years with female/male head of state (last 50) 30th 0 126 -38 77 0-50 Economy Profile Jamaica Score (imparity = 0 parity = 1) 0.779 Rank (out of 146 countries) 24th Index Edition 2023 Compare with Global average 0 1 Female vs Male Min Max69 66 57 0110 48 8 73 43 31 56 69 42 11 57 89-0 50 0 50 19 88 34 69-71 40 28 60 75 00 25 00 44 39 5 61
Complementary Targets and Contextual Indicators 2023
Family
Indicator
Public
Unmet
Access
Graduates Attainment
Agri , Forestry, Fisheries & Veterinary
Business, Admin & Law
Global Gender Gap Report 2023 216 Economy Profile Jamaica Score 0.779 Rank 24th Page 2 of 2
General indicators Indicator Unit Value GDP US$ billions 14 66 GDP per capita constant '17 intl $ 1000 9 60 Population sex ratio female/male 1 02 Population growth rate % 0 26 Indicator Million people Female Male Value Total population 1 43 1 40 2 83 Work participation and leadership Indicator Unit Value Gender pay gap % (OECD countries only) n a Share of women's membership in boards % (OECD countries only) n a Firms with female majority ownership % firms n a Firms with female top managers % firms n a Share of workers in informal sector % workers 58 00 Indicator 1-7 (best) Value Advancement of women to leadership roles 4 45 Indicator Unit Female Male Value Unemployed adults % of labour force (15-64) 6 57 4 45 5 43 Workers employed part-time % of employed people 12 98 9 53 11 06 Proportion of time spent on unpaid domestic and care work % n a n a n a Indicator Million people Female Male Value Labour-force 0 50 0 59 1 10 Access to finance Indicator 0-1 (Equal rights) Value Access to financial services Near-equal rights Inheritance rights for widows and daughters Equal rights
to land assets Near-equal rights
to non-land assets Equal rights Civil and political freedom Indicator Unit Value Year women received right to vote year 1962 Number of female heads of state to date number 1 Seats held in upper house % total seats 38 10 Indicator Yes/No Value Election list quotas for women, national n a Party membership quotas, voluntary n a Indicator 0-1 (Equal rights) Value
to justice Equal rights Freedom of movement Equal rights
Access
Access
and care
Unit Value
spending on family benefits % GPD n a
family planning % women 15-49 n a Early marriage % 3 80
age of women at birth of first child years n a
rights) Value
Near-equal rights
Female Male Value
leave 56 00 0 0
Mean
Indicator 0-1 (Equal
Right to divorce
Indicator Days
Length of parental
Education and skills
% Female Male Parity STEM Graduates n a n a n a
n a n a n a
n a n a n a
Arts & Humanities
n a n a n a
n a n a n a Engineering, Manuf & Construction n a n a n a Health & Welfare n a n a n a Information & Comm Technologies n a n a n a
Statistics n a n a n a
n a n a n a
training n a n a n a PhD graduates n a n a n a Graduates % Female Male Value
from tertiary education n a n a n a Health
Unit Value Prevalence of gender violence in lifetime % women 19 70 Births attended by skilled personnel % live births 99 70 Mater nal mortality deaths per 100,000 live births 80 00 Total fertility rate births per woman 1 36 Indicator 0-1 (Equal rights) Value
autonomy Restricted rights
optimal situation
parity
B
detailed methodology, defi
sources
periods. **For
indicators,
two health indicators, parity is benchmarked at 1 In the case of sex ratio at birth the gender parity benchmark is set at 0 944 (see Klasen and Wink 2003) In the case of healthy life expectancy the gender parity benchmark is set at 1 06, given women's longer life expectancy
Education
Natural Sci , Mathematics &
Social Sci , Jour nalism & Information
Vocational
Graduates
Indicator
Reproductive
*Scores are on a 0 to 1 scale, where 1 represents the
or “
” Please see Appendix A and
for
nitions,
and
all
except the
Global Gender Gap Index Indicators
Global Gender Gap Report 2023 217 Global Gender Gap Index 2023 Edition Japan score average score 0.561 Economy 0 997 E d u c a t i o n 0.973 Health 0 057 P o i t i c s Overview Index and Subindex 2023 Score Rank 2022 Score Rank Global Gender Gap Index 0 647 125th 0 650 116th Economic Participation and Opportunity 0.561 123rd 0 564 121st Educational Attainment 0 997 47th 1 000 1st Health and Survival 0 973 59th 0 973 63rd Political Empowerment 0 057 138th 0 061 139th
2023 Indicator Rank Score* Difference F-M Min Max Economic Participation and Opportunity 123rd 0 561 -Labour-force participation rate % 81st 0 759 -17 20 0-100 Wage equality for similar work 1-7 (best) 75th 0 621Estimated ear ned income int'l $ 1,000 100th 0 577 -22 05 0-150 Legislators, senior officials and managers % 133rd 0 148 -74 19 0-100 Professional and technical workers % - - -Educational Attainment 47th 0.997 -Literacy rate % 1st 1 000Enrolment in primary education % 1st 1 000 0 24 0-100 Enrolment in secondary education % 1st 1 000 0 40 0-200 Enrolment in tertiary education % 105th 0 976 -1 60 0-200 Health and Survival 59th 0 973 -Sex ratio at birth** % 1st 0 944Healthy life expectancy** years 69th 1 039Political Empowerment 138th 0 057 -Women in parliament % 131st 0 111 -80 00 0-100 Women in ministerial positions % 128th 0 091 -83 33 0-100 Years with female/male head of state (last 50) 80th 0 000 -50 00 0-50 Economy Profile Japan Score (imparity = 0 parity = 1) 0.647 Rank (out of 146 countries) 125th Index Edition 2023 Compare with Global average 0 1 Female vs Male Min Max71 40 54 2052 12 30 07 87 10 12 90-97 33 97 57 99 95 100 35 66 07 64 47-90 00 10 00 91 67 8 33 50 00 0
Complementary Targets and Contextual Indicators 2023
Global Gender Gap Report 2023 218 Economy Profile Japan Score 0.647 Rank 125th Page 2 of 2
General indicators Indicator Unit Value GDP US$ billions 4,940 88 GDP per capita constant '17 intl $ 1000 40 78 Population sex ratio female/male 1 06 Population growth rate % -0 46 Indicator Million people Female Male Value Total population 63 71 60 24 123 95 Work participation and leadership Indicator Unit Value Gender pay gap % (OECD countries only) 22 11 Share of women's membership in boards % (OECD countries only) 12 60 Firms with female majority ownership % firms n a Firms with female top managers % firms n a Share of workers in informal sector % workers n a Indicator 1-7 (best) Value Advancement of women to leadership roles 4 13 Indicator Unit Female Male Value Unemployed adults % of labour force (15-64) 2 50 2 90 2 70 Workers employed part-time % of employed people 52 89 25 39 37 62 Proportion of time spent on unpaid domestic and care work % 15 14 3 12 n a Indicator Million people Female Male Value Labour-force 28 12 35 19 63 30 Access to finance Indicator 0-1 (Equal rights) Value Access to financial services Near-equal rights Inheritance rights for widows and daughters Equal rights Access to land assets Near-equal rights Access to non-land assets Equal rights Civil and political freedom Indicator Unit Value Year women received right to vote year 1945, 1947 Number of female heads of state to date number 0 Seats held in upper house % total seats 25 80 Indicator Yes/No Value Election list quotas for women, national n a Party membership quotas, voluntary n a Indicator 0-1 (Equal rights) Value Access to justice Equal rights Freedom of movement Equal rights Family and care Indicator Unit Value Public spending on family benefits % GPD 2 00 Unmet family planning % women 15-49 n a Early marriage % 0 60 Mean age of women at birth of first child years n a Indicator 0-1 (Equal rights) Value Right to divorce Near-equal rights Indicator Days Female Male Value Length of parental leave 98 00 28 00 0 Education and skills Graduates Attainment % Female Male Parity STEM Graduates n a n a n a Agri , Forestry, Fisheries & Veterinary 41 75 58 25 0 72 Arts & Humanities 68 35 31 65 2 16 Business, Admin & Law n a n a n a Education 71 17 28 83 2 47 Engineering, Manuf & Construction 14 01 85 99 0 16 Health & Welfare 64 22 35 78 1 79 Information & Comm Technologies n a n a n a Natural Sci , Mathematics & Statistics n a n a n a Social Sci , Jour nalism & Information 48 57 51 43 0 94 Vocational training n a n a n a PhD graduates n a n a n a Graduates % Female Male Value Graduates from tertiary education 46 61 50 81 48 76 Health Indicator Unit Value Prevalence of gender violence in lifetime % women 15 40 Births attended by skilled personnel % live births 99 90 Mater nal mortality deaths per 100,000 live births 5 00 Total fertility rate births per woman 1 34 Indicator 0-1 (Equal rights) Value Reproductive autonomy Uneven rights *Scores
0
1 scale,
1 represents the optimal situation
parity” Please see Appendix A and B for detailed methodology, definitions, sources and periods. **For all indicators, except the two health indicators, parity is benchmarked at 1 In the case of sex ratio at birth the gender parity benchmark is set at 0 944 (see Klasen and Wink 2003) In the case of healthy life expectancy the gender parity benchmark is set at 1 06, given women's longer life expectancy
are on a
to
where
or “
Global Gender Gap Index Indicators
Global Gender Gap Report 2023 219 Global Gender Gap Index 2023 Edition Jordan score average score 0.542 Economy 0 994 E d u c a t i o n 0.957 Health 0 093 P o i t i c s Overview Index and Subindex 2023 Score Rank 2022 Score Rank Global Gender Gap Index 0 646 126th 0 639 122nd Economic Participation and Opportunity 0.542 125th 0 537 125th Educational Attainment 0 994 66th 0 993 66th Health and Survival 0 957 138th 0 957 136th Political Empowerment 0 093 124th 0 069 136th
2023 Indicator Rank Score* Difference F-M Min Max Economic Participation and Opportunity 125th 0 542 -Labour-force participation rate % 144th 0 227 -46 90 0-100 Wage equality for similar work 1-7 (best) 32nd 0 713Estimated ear ned income int'l $ 1,000 138th 0 242 -11 02 0-150 Legislators, senior officials and managers % 1st 1 000 14 49 0-100 Professional and technical workers % 106th 0 610 -24 20 0-100 Educational Attainment 66th 0.994 -Literacy rate % 71st 0 994Enrolment in primary education % 91st 0 988 -0 92 0-100 Enrolment in secondary education % 1st 1 000 1 44 0-200 Enrolment in tertiary education % 1st 1 000 8 80 0-200 Health and Survival 138th 0 957 -Sex ratio at birth** % 1st 0 944Healthy life expectancy** years 144th 0 987Political Empowerment 124th 0 093 -Women in parliament % 127th 0 140 -75 40 0-100 Women in ministerial positions % 88th 0 200 -66 67 0-100 Years with female/male head of state (last 50) 80th 0 000 -50 00 0-50 Economy Profile Jordan Score (imparity = 0 parity = 1) 0.646 Rank (out of 146 countries) 126th Index Edition 2023 Compare with Global average 0 1 Female vs Male Min Max60 71 13 8114 53 3 52 42 76 57 24 62 10 37 9079 99 79 07 71 25 72 69 29 75 38 54-87 70 12 30 83 33 16 67 50 00 0
Complementary Targets and Contextual Indicators 2023
Inheritance
Global Gender Gap Report 2023 220 Economy Profile Jordan Score 0.646 Rank 126th Page 2 of 2
General indicators Indicator Unit Value GDP US$ billions 45 74 GDP per capita constant '17 intl $ 1000 9 22 Population sex ratio female/male 0 93 Population growth rate % 1 99 Indicator Million people Female Male Value Total population 5 44 5 85 11 29 Work participation and leadership Indicator Unit Value Gender pay gap % (OECD countries only) n a Share of women's membership in boards % (OECD countries only) n a Firms with female majority ownership % firms 8 10 Firms with female top managers % firms 3 10 Share of workers in informal sector % workers 51 60 Indicator 1-7 (best) Value Advancement of women to leadership roles 5 19 Indicator Unit Female Male Value Unemployed adults % of labour force (15-64) 26 28 18 71 19 99 Workers employed part-time % of employed people 15 21 9 75 10 59 Proportion of time spent on unpaid domestic and care work % n a n a n a Indicator Million people Female Male Value Labour-force 0 41 2 02 2 43 Access to finance Indicator 0-1 (Equal rights) Value
to financial services Near-equal rights
Access
rights for widows and daughters Unequal rights
to land assets Near-equal rights Access to non-land assets Near-equal rights Civil and political freedom Indicator Unit Value Year women received right to vote year 1974, 1982 Number of female heads of state to date number 0 Seats held in upper house % total seats 15 40 Indicator Yes/No Value Election list quotas for women, national Yes Party membership quotas, voluntary Yes Indicator 0-1 (Equal rights) Value Access to justice Restricted rights Freedom of movement Unequal rights Family and care Indicator Unit Value Public spending on family benefits % GPD n a Unmet family planning % women 15-49 14 20 Early marriage % 11 30 Mean age of women at birth of first child years n a Indicator 0-1 (Equal rights) Value Right to divorce Unequal rights Indicator Days Female Male Value Length of parental leave 70 00 3 00 0 Education and skills Graduates Attainment % Female Male Parity STEM Graduates n a n a n a Agri , Forestry, Fisheries & Veterinary 37 58 62 42 0 60 Arts & Humanities 70 21 29 79 2 36 Business, Admin & Law 46 88 53 12 0 88 Education 70 76 29 24 2 42 Engineering, Manuf & Construction 34 79 65 21 0 53 Health & Welfare 64 39 35 61 1 81 Information & Comm Technologies n a n a n a Natural Sci , Mathematics & Statistics n a n a n a Social Sci , Jour nalism & Information 66 22 33 78 1 96 Vocational training 1 24 1 52 0 82 PhD graduates 0 33 1 13 0 72 Graduates % Female Male Value Graduates from tertiary education n a n a n a Health Indicator Unit Value Prevalence of gender violence in lifetime % women 23 60 Births attended by skilled personnel % live births 99 70 Mater nal mortality deaths per 100,000 live births 46 00 Total fertility rate births per woman 2 87 Indicator 0-1 (Equal rights) Value Reproductive autonomy Restricted rights *Scores
methodology,
**For
except the two health indicators, parity is benchmarked at 1 In the case of sex ratio at birth the gender parity benchmark is set at 0 944 (see Klasen and Wink 2003) In the case of healthy life expectancy the gender parity benchmark is set at 1 06, given women's longer life expectancy
Access
are on a 0 to 1 scale, where 1 represents the optimal situation or “parity” Please see Appendix A and B for detailed
definitions, sources and periods.
all indicators,
Global Gender Gap Index Indicators
Global Gender Gap Report 2023 221 Global Gender Gap Index 2023 Edition Kazakhstan score average score 0.765 Economy 1 000 E d u c a t i o n 0.975 Health 0 146 P o i t i c s Overview Index and Subindex 2023 Score Rank 2022 Score Rank Global Gender Gap Index 0 721 62nd 0 719 65th Economic Participation and Opportunity 0.765 28th 0 756 29th Educational Attainment 1 000 27th 1 000 27th Health and Survival 0 975 47th 0 977 44th Political Empowerment 0 146 100th 0 143 103rd
2023 Indicator Rank Score* Difference F-M Min Max Economic Participation and Opportunity 28th 0 765 -Labour-force participation rate % 46th 0 844 -11 80 0-100 Wage equality for similar work 1-7 (best) 34th 0 708Estimated ear ned income int'l $ 1,000 50th 0 688 -9 74 0-150 Legislators, senior officials and managers % 31st 0 698 -17 78 0-100 Professional and technical workers % 1st 1 000 24 00 0-100 Educational Attainment 27th 1.000 -Literacy rate % 58th 0 999Enrolment in primary education % 1st 1 000 0 60 0-100 Enrolment in secondary education % 1st 1 000 0 14 0-200 Enrolment in tertiary education % 1st 1 000 13 44 0-200 Health and Survival 47th 0 975 -Sex ratio at birth** % 125th 0 938Healthy life expectancy** years 1st 1 060Political Empowerment 100th 0 146 -Women in parliament % 69th 0 377 -45 20 0-100 Women in ministerial positions % 120th 0 118 -78 95 0-100 Years with female/male head of state (last 50) 80th 0 000 -50 00 0-50 Economy Profile Ka akhstan Score (imparity = 0 parity = 1) 0.721 Rank (out of 146 countries) 62nd Index Edition 2023 Compare with Global average 0 1 Female vs Male Min Max75 50 63 7031 16 21 42 58 89 41 11 38 00 62 0090 09 90 70 103 69 103 82 64 14 77 58-72 60 27 40 89 47 10 53 50 00 0
Complementary Targets and Contextual Indicators 2023
Global Gender Gap Report 2023 222 Economy Profile Kazakhstan Score 0.721 Rank 62nd Page 2 of 2
General indicators Indicator Unit Value GDP US$ billions 197 11 GDP per capita constant '17 intl $ 1000 26 11 Population sex ratio female/male 1 08 Population growth rate % 1 30 Indicator Million people Female Male Value Total population 10 06 9 34 19 40 Work participation and leadership Indicator Unit Value Gender pay gap % (OECD countries only) n a Share of women's membership in boards % (OECD countries only) n a Firms with female majority ownership % firms 23 80 Firms with female top managers % firms 26 00 Share of workers in informal sector % workers n a Indicator 1-7 (best) Value Advancement of women to leadership roles 4 94 Indicator Unit Female Male Value Unemployed adults % of labour force (15-64) 5 41 4 46 4 92 Workers employed part-time % of employed people 11 90 6 54 9 13 Proportion of time spent on unpaid domestic and care work % 18 96 6 25 n a Indicator Million people Female Male Value Labour-force 3 93 4 15 8 09 Access to finance Indicator 0-1 (Equal rights) Value Access to financial services Near-equal rights Inheritance rights for widows and daughters Equal rights Access to land assets Near-equal rights Access to non-land assets Near-equal rights Civil and political freedom Indicator Unit Value Year women received right to vote year 1924, 1991 Number of female heads of state to date number 0 Seats held in upper house % total seats 22 00 Indicator Yes/No Value Election list quotas for women, national Yes Party membership quotas, voluntary n a Indicator 0-1 (Equal rights) Value Access to justice Near-equal rights Freedom of movement Equal rights Family and care Indicator Unit Value Public spending on family benefits % GPD n a Unmet family planning % women 15-49 15 47 Early marriage % 6 50 Mean age of women at birth of first child years 28 90 Indicator 0-1 (Equal rights) Value Right to divorce Equal rights Indicator Days Female Male Value Length of parental leave 126 00 0 309 00 Education and skills Graduates Attainment % Female Male Parity STEM Graduates n a n a n a Agri , Forestry, Fisheries & Veterinary 37 52 62 48 0 60 Arts & Humanities 66 55 33 45 1 99 Business, Admin & Law 50 68 49 32 1 03 Education 76 08 23 92 3 18 Engineering, Manuf & Construction 28 45 71 55 0 40 Health & Welfare n a n a n a Information & Comm Technologies 30 40 69 60 0 44 Natural Sci , Mathematics & Statistics 66 97 33 03 2 03 Social Sci , Jour nalism & Information n a n a n a Vocational training 17 34 19 82 0 88 PhD graduates n a n a n a Graduates % Female Male Value Graduates from tertiary education 78 64 59 21 68 65 Health Indicator Unit Value Prevalence of gender violence in lifetime % women 16 50 Births attended by skilled personnel % live births 99 90 Mater nal mortality deaths per 100,000 live births 10 00 Total fertility rate births per woman 3 13 Indicator 0-1 (Equal rights) Value Reproductive autonomy Equal rights *Scores
0
optimal situation
parity
Appendix A
B for detailed methodology, definitions, sources
periods. **For all indicators, except the two health indicators, parity is benchmarked at 1 In the case of sex ratio at birth the gender parity benchmark is set at 0 944 (see Klasen and Wink 2003) In the case of healthy life expectancy the gender parity benchmark is set at 1 06, given women's longer life expectancy
are on a
to 1 scale, where 1 represents the
or “
” Please see
and
and
Global Gender Gap Index Indicators
Global Gender Gap Report 2023 223 Global Gender Gap Index 2023 Edition Kenya score average score 0.791 Economy 0 858 E d u c a t i o n 0.975 Health 0 209 P o i t i c s Overview Index and Subindex 2023 Score Rank 2022 Score Rank Global Gender Gap Index 0 708 77th 0 729 57th Economic Participation and Opportunity 0.791 16th 0 811 6th Educational Attainment 0 858 134th 0 939 118th Health and Survival 0 975 53rd 0 975 57th Political Empowerment 0 209 75th 0 192 81st
2023 Indicator Rank Score* Difference F-M Min Max Economic Participation and Opportunity 16th 0 791 -Labour-force participation rate % 33rd 0 862 -10 10 0-100 Wage equality for similar work 1-7 (best) 55th 0 661Estimated ear ned income int'l $ 1,000 8th 0 839 -0 83 0-150 Legislators, senior officials and managers % 11th 0 985 -0 75 0-100 Professional and technical workers % 100th 0 677 -19 27 0-100 Educational Attainment 134th 0.858 -Literacy rate % 102nd 0 934Enrolment in primary education % - - -Enrolment in secondary education % - - -Enrolment in tertiary education % 124th 0 737 -3 47 0-200 Health and Survival 53rd 0 975 -Sex ratio at birth** % 1st 0 944Healthy life expectancy** years 63rd 1 045Political Empowerment 75th 0 209 -Women in parliament % 84th 0 304 -53 40 0-100 Women in ministerial positions % 45th 0 467 -36 36 0-100 Years with female/male head of state (last 50) 80th 0 000 -50 00 0-50 Economy Profile Kenya Score (imparity = 0 parity = 1) 0.708 Rank (out of 146 countries) 77th Index Edition 2023 Compare with Global average 0 1 Female vs Male Min Max73 00 62 905 16 4 33 50 38 49 62 59 63 40 37-13 20 9 73-76 70 23 30 68 18 31 82 50 00 0
Complementary Targets and Contextual Indicators 2023
Global Gender Gap Report 2023 224 Economy Profile Kenya Score 0.708 Rank 77th Page 2 of 2
General indicators Indicator Unit Value GDP US$ billions 110 35 GDP per capita constant '17 intl $ 1000 4 74 Population sex ratio female/male 1 02 Population growth rate % 1 94 Indicator Million people Female Male Value Total population 27 25 26 78 54 03 Work participation and leadership Indicator Unit Value Gender pay gap % (OECD countries only) n a Share of women's membership in boards % (OECD countries only) n a Firms with female majority ownership % firms 13 20 Firms with female top managers % firms 18 10 Share of workers in informal sector % workers 86 50 Indicator 1-7 (best) Value Advancement of women to leadership roles 4 43 Indicator Unit Female Male Value Unemployed adults % of labour force (15-64) 5 63 5 08 5 34 Workers employed part-time % of employed people 31 50 20 70 25 85 Proportion of time spent on unpaid domestic and care work % n a n a n a Indicator Million people Female Male Value Labour-force 7 79 8 46 16 25 Access to finance Indicator 0-1 (Equal rights) Value Access to financial services Near-equal rights Inheritance rights for widows and daughters Restricted rights Access to land assets Uneven rights Access to non-land assets Uneven rights Civil and political freedom Indicator Unit Value Year women received right to vote year n a Number of female heads of state to date number 0 Seats held in upper house % total seats 31 80 Indicator Yes/No Value Election list quotas for women, national Yes Party membership quotas, voluntary Yes Indicator 0-1 (Equal rights) Value Access to justice Near-equal rights Freedom of movement Equal rights Family and care Indicator Unit Value Public spending on family benefits % GPD n a Unmet family planning % women 15-49 12 71 Early marriage % 13 20 Mean age of women at birth of first child years n a Indicator 0-1 (Equal rights) Value Right to divorce Uneven rights Indicator Days Female Male Value Length of parental leave 90 00 14 00 0 Education and skills Graduates Attainment % Female Male Parity STEM Graduates 30 73 69 27 0 44 Agri , Forestry, Fisheries & Veterinary 37 28 62 72 0 59 Arts & Humanities 47 74 52 26 0 91 Business, Admin & Law 46 98 53 02 0 89 Education 49 15 50 85 0 97 Engineering, Manuf & Construction 19 46 80 54 0 24 Health & Welfare 49 06 50 94 0 96 Information & Comm Technologies 30 10 69 90 0 43 Natural Sci , Mathematics & Statistics 37 99 62 01 0 61 Social Sci , Jour nalism & Information 56 16 43 84 1 28 Vocational training n a n a n a PhD graduates n a n a n a Graduates % Female Male Value Graduates from tertiary education n a n a n a Health Indicator Unit Value Prevalence of gender violence in lifetime % women 39 40 Births attended by skilled personnel % live births 70 20 Mater nal mortality deaths per 100,000 live births 342 00 Total fertility rate births per woman 3 40 Indicator 0-1 (Equal rights) Value Reproductive autonomy Restricted rights *Scores are on a 0 to 1 scale, where 1 represents the optimal situation or “parity” Please see Appendix A and B for detailed methodology, definitions, sources and periods. **For all indicators, except the two health indicators, parity is benchmarked at 1 In the case of sex ratio at birth the gender parity benchmark is set at 0 944 (see Klasen and Wink 2003) In the case of healthy life expectancy the gender parity benchmark is set at 1 06, given women's longer life expectancy
Global Gender Gap Index Indicators
Global Gender Gap Report 2023 225 Global Gender Gap Index 2023 Edition Korea, Republic of score average score 0.597 Economy 0 977 E d u c a t i o n 0.976 Health 0 169 P o i t i c s Overview Index and Subindex 2023 Score Rank 2022 Score Rank Global Gender Gap Index 0 680 105th 0 689 99th Economic Participation and Opportunity 0.597 114th 0 592 115th Educational Attainment 0 977 104th 0 976 97th Health and Survival 0 976 46th 0 976 52nd Political Empowerment 0 169 88th 0 212 72nd
2023 Indicator Rank Score* Difference F-M Min Max Economic Participation and Opportunity 114th 0 597 -Labour-force participation rate % 85th 0 747 -18 62 0-100 Wage equality for similar work 1-7 (best) 76th 0 620Estimated ear ned income int'l $ 1,000 119th 0 495 -29 90 0-150 Legislators, senior officials and managers % 128th 0 171 -70 80 0-100 Professional and technical workers % 1st 1 000 0 78 0-100 Educational Attainment 104th 0.977 -Literacy rate % 74th 0 992Enrolment in primary education % 69th 0 999 -0 08 0-100 Enrolment in secondary education % 85th 0 994 -0 54 0-200 Enrolment in tertiary education % 115th 0 833 -18 56 0-200 Health and Survival 46th 0 976 -Sex ratio at birth** % 1st 0 944Healthy life expectancy** years 57th 1 047Political Empowerment 88th 0 169 -Women in parliament % 102nd 0 236 -61 80 0-100 Women in ministerial positions % 88th 0 200 -66 67 0-100 Years with female/male head of state (last 50) 36th 0 104 -40 55 0-50 Economy Profile
Score (imparity = 0 parity = 1) 0.680 Rank (out of 146 countries) 105th Index Edition 2023 Compare with Global average 0 1 Female vs Male Min Max73 66 55 0459 21 29 30 85 40 14 60 49 61 50 3998 64 98 55 96 30 95 76 111 35 92 79-80 90 19 10 83 33 16 67 45 27 4 73
Korea Republic of
Complementary Targets and Contextual Indicators 2023
Global Gender Gap Report 2023 226 Economy Profile Korea, Republic of Score 0.680 Rank 105th Page 2 of 2
General indicators Indicator Unit Value GDP US$ billions 1,810 96 GDP per capita constant '17 intl $ 1000 44 23 Population sex ratio female/male 1 00 Population growth rate % -0 18 Indicator Million people Female Male Value Total population 25 95 25 87 51 82 Work participation and leadership Indicator Unit Value Gender pay gap % (OECD countries only) 31 06 Share of women's membership in boards % (OECD countries only) 8 70 Firms with female majority ownership % firms n a Firms with female top managers % firms n a Share of workers in informal sector % workers 26 60 Indicator 1-7 (best) Value Advancement of women to leadership roles 4 56 Indicator Unit Female Male Value Unemployed adults % of labour force (15-64) 3 00 2 74 2 85 Workers employed part-time % of employed people 38 21 22 77 29 48 Proportion of time spent on unpaid domestic and care work % 14 10 4 38 n a Indicator Million people Female Male Value Labour-force 11 86 15 86 27 72 Access to finance Indicator 0-1 (Equal rights) Value Access to financial services Equal rights Inheritance rights for widows and daughters Equal rights Access to land assets Near-equal rights Access to non-land assets Near-equal rights Civil and political freedom Indicator Unit Value Year women received right to vote year 1948 Number of female heads of state to date number 3 Seats held in upper house % total seats n a Indicator Yes/No Value Election list quotas for women, national Yes Party membership quotas, voluntary Yes Indicator 0-1 (Equal rights) Value Access to justice Equal rights Freedom of movement Equal rights Family and care Indicator Unit Value Public spending on family benefits % GPD 1 55 Unmet family planning % women 15-49 n a Early marriage % 0 20 Mean age of women at birth of first child years n a Indicator 0-1 (Equal rights) Value Right to divorce Equal rights Indicator Days Female Male Value Length of parental leave 90 00 10 00 0 Education and skills Graduates Attainment % Female Male Parity STEM Graduates 25 22 74 78 0 34 Agri , Forestry, Fisheries & Veterinary 44 83 55 17 0 81 Arts & Humanities 66 04 33 96 1 94 Business, Admin & Law 49 02 50 98 0 96 Education 77 27 22 73 3 40 Engineering, Manuf & Construction 20 05 79 95 0 25 Health & Welfare 71 48 28 52 2 51 Information & Comm Technologies n a n a n a Natural Sci , Mathematics & Statistics 49 20 50 80 0 97 Social Sci , Jour nalism & Information 60 17 39 83 1 51 Vocational training 11 70 15 62 0 75 PhD graduates 0 39 1 17 0 77 Graduates % Female Male Value Graduates from tertiary education 57 22 50 32 53 62 Health Indicator Unit Value Prevalence of gender violence in lifetime % women 16 50 Births attended by skilled personnel % live births 100 00 Mater nal mortality deaths per 100,000 live births 11 00 Total fertility rate births per woman 0 84 Indicator 0-1 (Equal rights) Value Reproductive autonomy Uneven rights *Scores
0 to 1 scale, where 1 represents the optimal situation
parity” Please see Appendix A and B for detailed methodology, definitions, sources and periods. **For all indicators, except the two health indicators, parity is benchmarked at 1 In the case of sex ratio at birth the gender parity benchmark is set at 0 944 (see Klasen and Wink 2003) In the case of healthy life expectancy the gender parity benchmark is set at 1 06, given women's longer life expectancy
are on a
or “
Global Gender Gap Index Indicators
Global Gender Gap Report 2023 227 Global Gender Gap Index 2023 Edition Kuwait score average score 0.579 Economy 0 997 E d u c a t i o n 0.968 Health 0 059 P o i t i c s Overview Index and Subindex 2023 Score Rank 2022 Score Rank Global Gender Gap Index 0 651 120th 0 632 130th Economic Participation and Opportunity 0.579 118th 0 542 123rd Educational Attainment 0 997 51st 0 997 47th Health and Survival 0 968 87th 0 968 89th Political Empowerment 0 059 137th 0 023 145th
2023 Indicator Rank Score* Difference F-M Min Max Economic Participation and Opportunity 118th 0 579 -Labour-force participation rate % 126th 0 568 -37 96 0-100 Wage equality for similar work 1-7 (best) 62nd 0 651Estimated ear ned income int'l $ 1,000 - - -Legislators, senior officials and managers % 130th 0 158 -72 77 0-100 Professional and technical workers % 76th 0 932 -3 50 0-100 Educational Attainment 51st 0.997 -Literacy rate % 84th 0 982Enrolment in primary education % 1st 1 000 11 53 0-100 Enrolment in secondary education % 1st 1 000 6 03 0-200 Enrolment in tertiary education % 1st 1 000 29 55 0-200 Health and Survival 87th 0 968 -Sex ratio at birth** % 1st 0 944Healthy life expectancy** years 97th 1 023Political Empowerment 137th 0 059 -Women in parliament % 135th 0 067 -87 40 0-100 Women in ministerial positions % 106th 0 154 -73 33 0-100 Years with female/male head of state (last 50) 80th 0 000 -50 00 0-50 Economy Profile Kuwait Score (imparity = 0 parity = 1) 0.651 Rank (out of 146 countries) 120th Index Edition 2023 Compare with Global average 0 1 Female vs Male Min Max87 85 49 8986 39 13 61 51 75 48 2575 50 87 03 94 92 100 96 45 21 74 76-93 70 6 30 86 67 13 33 50 00 0
Complementary Targets and Contextual Indicators 2023
Family
Indicator
Public
Unmet
Agri , Forestry, Fisheries & Veterinary
Engineering, Manuf & Construction
Information & Comm Technologies
Natural Sci , Mathematics & Statistics
Social Sci , Jour nalism & Information
Vocational training
Indicator Unit
Prevalence of gender violence in lifetime
Indicator 0-1 (Equal rights)
Reproductive autonomy
*Scores are on a 0 to 1 scale, where 1 represents the optimal situation or “parity” Please see Appendix A and B for detailed methodology, definitions, sources and periods. **For all indicators, except the two
Global Gender Gap Report 2023 228 Economy Profile Kuwait Score 0.651 Rank 120th Page 2 of 2
General indicators Indicator Unit Value GDP US$ billions 105 96 GDP per capita constant '17 intl $ 1000 43 92 Population sex ratio female/male 0 64 Population growth rate % -2 56 Indicator Million people Female Male Value Total population 1 67 2 60 4 27 Work participation and leadership Indicator Unit Value Gender pay gap % (OECD countries only) n a Share of women's membership in boards % (OECD countries only) n a Firms with female majority ownership % firms n a Firms with female top managers % firms n a Share of workers in informal sector % workers n a Indicator 1-7 (best) Value Advancement of women to leadership roles 4 42 Indicator Unit Female Male Value Unemployed adults % of labour force (15-64) 5 84 0 96 2 19 Workers employed part-time % of employed people n a n a n a Proportion of time spent on unpaid domestic and care work % n a n a n a Indicator Million people Female Male Value Labour-force 0 64 1 91 2 55 Access to finance Indicator 0-1 (Equal rights) Value Access to financial services Uneven rights
rights for
rights
Inheritance
widows and daughters Unequal
land assets Unequal rights
to non-land assets Unequal rights Civil and political freedom Indicator Unit Value Year women received right to vote year 2005 Number of female heads of state to date number 0 Seats held in upper house % total seats n a Indicator Yes/No Value Election list quotas for women, national n a Party membership quotas, voluntary n a Indicator 0-1 (Equal rights) Value Access to justice Restricted rights Freedom of movement Uneven rights
Access to
Access
and care
Unit Value
spending on family benefits % GPD n a
family planning % women 15-49 n a Early marriage % 5 60 Mean age
women at birth of first child years n a
Value
Restricted rights
Female Male Value
of parental leave 70 00 0 0 Education
skills
Attainment % Female Male Parity STEM Graduates n a n a n a
of
Indicator 0-1 (Equal rights)
Right to divorce
Indicator Days
Length
and
Graduates
n a n a n a Arts
n a n a n a
& Humanities
n a n a n a Education n a n a n a
Business, Admin & Law
n a n a n a
n a n a n a
Health & Welfare
n a n a n a
n a n a n a
n a n a n a
n a n a n a
n a n a n a
Female Male Value
57 31 20 59 37 61
PhD graduates
Graduates %
Graduates from tertiary education
Health
Value
%
n a
% live births 99 90 Mater
mortality deaths per 100,000 live births 12 00 Total fertility rate births per woman 2 14
women
Births attended by skilled personnel
nal
Value
Restricted
birth
gender parity benchmark
0 944
Klasen
2003)
case of
life expectancy
gender parity benchmark
set
06, given women's longer life expectancy
rights
health indicators, parity is benchmarked at 1 In the case of sex ratio at
the
is set at
(see
and Wink
In the
healthy
the
is
at 1
Global Gender Gap Index Indicators
Global Gender Gap Report 2023 229 Global Gender Gap Index 2023 Edition Kyrgy stan score average score 0.694 Economy 1 000 E d u c a t i o n 0.980 Health 0 128 P o i t i c s Overview Index and Subindex 2023 Score Rank 2022 Score Rank Global Gender Gap Index 0 700 84th 0 700 86th Economic Participation and Opportunity 0.694 71st 0 702 68th Educational Attainment 1 000 29th 0 996 50th Health and Survival 0 980 1st 0 980 1st Political Empowerment 0 128 107th 0 124 111th
2023 Indicator Rank Score* Difference F-M Min Max Economic Participation and Opportunity 71st 0 694 -Labour-force participation rate % 103rd 0 673 -25 52 0-100 Wage equality for similar work 1-7 (best) 29th 0 714Estimated ear ned income int'l $ 1,000 122nd 0 478 -3 43 0-150 Legislators, senior officials and managers % 26th 0 750 -14 31 0-100 Professional and technical workers % 1st 1 000 20 19 0-100 Educational Attainment 29th 1.000 -Literacy rate % 62nd 0 998Enrolment in primary education % 1st 1 000 0 18 0-100 Enrolment in secondary education % 1st 1 000 0 50 0-200 Enrolment in tertiary education % 1st 1 000 11 68 0-200 Health and Survival 1st 0 980 -Sex ratio at birth** % 1st 0 944Healthy life expectancy** years 1st 1 060Political Empowerment 107th 0 128 -Women in parliament % 96th 0 250 -60 00 0-100 Women in ministerial positions % 109th 0 143 -75 00 0-100 Years with female/male head of state (last 50) 60th 0 034 -46 70 0-50 Economy Profile Kyrgyzstan Score (imparity = 0 parity = 1) 0.700 Rank (out of 146 countries) 84th Index Edition 2023 Compare with Global average 0 1 Female vs Male Min Max78 01 52 496 56 3 13 57 15 42 85 39 91 60 0998 37 98 55 100 08 100 58 47 73 59 41-80 00 20 00 87 50 12 50 48 35 1 65
Complementary Targets and Contextual Indicators 2023
Global Gender Gap Report 2023 230 Economy Profile Kyrgyzstan Score 0.700 Rank 84th Page 2 of 2
General indicators Indicator Unit Value GDP US$ billions 8 54 GDP per capita constant '17 intl $ 1000 4 81 Population sex ratio female/male 1 04 Population growth rate % 1 69 Indicator Million people Female Male Value Total population 3 38 3 26 6 63 Work participation and leadership Indicator Unit Value Gender pay gap % (OECD countries only) n a Share of women's membership in boards % (OECD countries only) n a Firms with female majority ownership % firms 26 90 Firms with female top managers % firms 32 90 Share of workers in informal sector % workers 63 20 Indicator 1-7 (best) Value Advancement of women to leadership roles 4 93 Indicator Unit Female Male Value Unemployed adults % of labour force (15-64) 4 42 4 04 4 19 Workers employed part-time % of employed people 41 93 17 03 27 30 Proportion of time spent on unpaid domestic and care work % 16 81 9 51 n a Indicator Million people Female Male Value Labour-force 1 03 1 40 2 43 Access to finance Indicator 0-1 (Equal rights) Value Access to financial services Equal rights Inheritance rights for widows and daughters Near-equal rights Access to land assets Near-equal rights Access to non-land assets Near-equal rights Civil and political freedom Indicator Unit Value Year women received right to vote year 1991 Number of female heads of state to date number 1 Seats held in upper house % total seats n a Indicator Yes/No Value Election list quotas for women, national Yes Party membership quotas, voluntary Yes Indicator 0-1 (Equal rights) Value Access to justice Equal rights Freedom of movement Equal rights Family and care Indicator Unit Value Public spending on family benefits % GPD n a Unmet family planning % women 15-49 19 73 Early marriage % 13 90 Mean age of women at birth of first child years 22 60 Indicator 0-1 (Equal rights) Value Right to divorce Equal rights Indicator Days Female Male Value Length of parental leave 126 00 0 0 Education and skills Graduates Attainment % Female Male Parity STEM Graduates n a n a n a Agri , Forestry, Fisheries & Veterinary 25 89 74 11 0 35 Arts & Humanities 73 63 26 37 2 79 Business, Admin & Law n a n a n a Education n a n a n a Engineering, Manuf & Construction 18 38 81 62 0 23 Health & Welfare 73 96 26 04 2 84 Information & Comm Technologies 47 43 52 57 0 90 Natural Sci , Mathematics & Statistics 72 94 27 06 2 70 Social Sci , Jour nalism & Information n a n a n a Vocational training 5 65 8 06 0 70 PhD graduates n a n a n a Graduates % Female Male Value Graduates from tertiary education 36 49 26 87 31 59 Health Indicator Unit Value Prevalence of gender violence in lifetime % women 25 40 Births attended by skilled personnel % live births 99 80 Mater nal mortality deaths per 100,000 live births 60 00 Total fertility rate births per woman 3 00 Indicator 0-1 (Equal rights) Value Reproductive autonomy Equal rights *Scores
0
1
where 1 represents the optimal situation
parity” Please see Appendix A
B for detailed methodology, definitions, sources and periods. **For all indicators, except the two health indicators, parity is benchmarked at 1 In the case of sex ratio at birth the gender parity benchmark is set at 0 944 (see Klasen and Wink 2003) In the case of healthy life expectancy the gender parity benchmark is set at 1 06, given women's longer life expectancy
are on a
to
scale,
or “
and
Global Gender Gap Index Indicators
Global Gender Gap Report 2023 231 Global Gender Gap Index 2023 Edition Lao PDR score average score 0.851 Economy 0 964 E d u c a t i o n 0.975 Health 0 140 P o i t i c s Overview Index and Subindex 2023 Score Rank 2022 Score Rank Global Gender Gap Index 0 733 54th 0 733 53rd Economic Participation and Opportunity 0.851 5th 0 883 1st Educational Attainment 0 964 107th 0 958 109th Health and Survival 0 975 50th 0 975 55th Political Empowerment 0 140 101st 0 116 116th
2023 Indicator Rank Score* Difference F-M Min Max Economic Participation and Opportunity 5th 0 851 -Labour-force participation rate % 20th 0 882 -7 53 0-100 Wage equality for similar work 1-7 (best) 14th 0 746Estimated ear ned income int'l $ 1,000 18th 0 791 -1 83 0-150 Legislators, senior officials and managers % 1st 1 000 18 08 0-100 Professional and technical workers % 1st 1 000 0 84 0-100 Educational Attainment 107th 0.964 -Literacy rate % 113th 0 905Enrolment in primary education % 96th 0 985 -1 38 0-100 Enrolment in secondary education % 118th 0 953 -2 87 0-200 Enrolment in tertiary education % 1st 1 000 1 76 0-200 Health and Survival 50th 0 975 -Sex ratio at birth** % 1st 0 944Healthy life expectancy** years 61st 1 045Political Empowerment 101st 0 140 -Women in parliament % 87th 0 282 -56 00 0-100 Women in ministerial positions % 81st 0 214 -64 71 0-100 Years with female/male head of state (last 50) 80th 0 000 -50 00 0-50 Economy Profile Lao PDR Score (imparity = 0 parity = 1) 0.733 Rank (out of 146 countries) 54th Index Edition 2023 Compare with Global average 0 1 Female vs Male Min Max63 63 56 108 76 6 92 40 96 59 04 49 58 50 4293 03 91 64 61 21 58 34 12 11 13 87-78 00 22 00 82 35 17 65 50 00 0
Complementary Targets and Contextual Indicators 2023
Global Gender Gap Report 2023 232 Economy Profile Lao PDR Score 0.733 Rank 54th Page 2 of 2
General indicators Indicator Unit Value GDP US$ billions 18 83 GDP per capita constant '17 intl $ 1000 7 85 Population sex ratio female/male 0 98 Population growth rate % 1 43 Indicator Million people Female Male Value Total population 3 73 3 79 7 53 Work participation and leadership Indicator Unit Value Gender pay gap % (OECD countries only) n a Share of women's membership in boards % (OECD countries only) n a Firms with female majority ownership % firms 35 50 Firms with female top managers % firms 43 10 Share of workers in informal sector % workers 88 80 Indicator 1-7 (best) Value Advancement of women to leadership roles 4 59 Indicator Unit Female Male Value Unemployed adults % of labour force (15-64) 0 92 1 57 1 26 Workers employed part-time % of employed people 55 64 49 82 52 62 Proportion of time spent on unpaid domestic and care work % 13 60 10 06 n a Indicator Million people Female Male Value Labour-force 1 34 1 49 2 83 Access to finance Indicator 0-1 (Equal rights) Value Access to financial services Near-equal rights Inheritance rights for widows and daughters Near-equal rights Access to land assets Equal rights Access to non-land assets Equal rights Civil and political freedom Indicator Unit Value Year women received right to vote year 1958 Number of female heads of state to date number 0 Seats held in upper house % total seats n a Indicator Yes/No Value Election list quotas for women, national n a Party membership quotas, voluntary n a Indicator 0-1 (Equal rights) Value Access to justice Restricted rights Freedom of movement Equal rights Family and care Indicator Unit Value Public spending on family benefits % GPD n a Unmet family planning % women 15-49 13 30 Early marriage % 19 80 Mean age of women at birth of first child years n a Indicator 0-1 (Equal rights) Value Right to divorce Near-equal rights Indicator Days Female Male Value Length of parental leave 105 00 3 00 0 Education and skills Graduates Attainment % Female Male Parity STEM Graduates 28 95 71 05 0 41 Agri , Forestry, Fisheries & Veterinary 44 74 55 26 0 81 Arts & Humanities 56 56 43 44 1 30 Business, Admin & Law n a n a n a Education 60 71 39 29 1 55 Engineering, Manuf & Construction 17 95 82 05 0 22 Health & Welfare 67 14 32 86 2 04 Information & Comm Technologies 40 82 59 18 0 69 Natural Sci , Mathematics & Statistics 55 00 45 00 1 22 Social Sci , Jour nalism & Information n a n a n a Vocational training 2 90 3 17 0 92 PhD graduates n a n a n a Graduates % Female Male Value Graduates from tertiary education 8 75 8 83 8 79 Health Indicator Unit Value Prevalence of gender violence in lifetime % women 15 30 Births attended by skilled personnel % live births 64 40 Mater nal mortality deaths per 100,000 live births 185 00 Total fertility rate births per woman 2 54 Indicator 0-1 (Equal rights) Value Reproductive autonomy Restricted rights *Scores
on a 0 to 1 scale, where 1 represents the optimal situation
parity
Please see Appendix A and B for detailed methodology, definitions, sources and periods. **For all indicators, except the two health indicators, parity is benchmarked at 1 In the case of sex ratio at birth the gender parity benchmark is set at 0 944 (see Klasen and Wink 2003) In the case of healthy life expectancy the gender parity benchmark is set at 1 06, given women's longer life expectancy
are
or “
”
Global Gender Gap Index Indicators
Global Gender Gap Report 2023 233 Global Gender Gap Index 2023 Edition Latvia score average score 0.775 Economy 1 000 E d u c a t i o n 0.975 Health 0 424 P o i t i c s Overview Index and Subindex 2023 Score Rank 2022 Score Rank Global Gender Gap Index 0 794 13th 0 771 26th Economic Participation and Opportunity 0.775 22nd 0 803 9th Educational Attainment 1 000 1st 1 000 25th Health and Survival 0 975 52nd 0 979 34th Political Empowerment 0 424 27th 0 301 45th
2023 Indicator Rank Score* Difference F-M Min Max Economic Participation and Opportunity 22nd 0 775 -Labour-force participation rate % 64th 0 807 -13 00 0-100 Wage equality for similar work 1-7 (best) 39th 0 701Estimated ear ned income int'l $ 1,000 56th 0 679 -12 45 0-150 Legislators, senior officials and managers % 17th 0 848 -8 22 0-100 Professional and technical workers % 1st 1 000 26 52 0-100 Educational Attainment 1st 1.000 -Literacy rate % 1st 1 000Enrolment in primary education % 1st 1 000 0 67 0-100 Enrolment in secondary education % 1st 1 000 0 48 0-200 Enrolment in tertiary education % 1st 1 000 28 79 0-200 Health and Survival 52nd 0 975 -Sex ratio at birth** % 129th 0 937Healthy life expectancy** years 1st 1 060Political Empowerment 27th 0 424 -Women in parliament % 57th 0 408 -42 00 0-100 Women in ministerial positions % 20th 0 750 -14 29 0-100 Years with female/male head of state (last 50) 15th 0 254 -29 77 0-50 Economy Profile Latvia Score (imparity = 0 parity = 1) 0.794 Rank (out of 146 countries) 13th Index Edition 2023 Compare with Global average 0 1 Female vs Male Min Max67 32 54 3238 75 26 31 54 11 45 89 36 74 63 2698 37 99 04 105 73 106 20 80 65 109 44-71 00 29 00 57 14 42 86 39 89 10 12
Complementary Targets and Contextual Indicators 2023
Global Gender Gap Report 2023 234 Economy Profile Latvia Score 0.794 Rank 13th Page 2 of 2
General indicators Indicator Unit Value GDP US$ billions 39 85 GDP per capita constant '17 intl $ 1000 32 08 Population sex ratio female/male 1 16 Population growth rate % -0 84 Indicator Million people Female Male Value Total population 0 99 0 86 1 85 Work participation and leadership Indicator Unit Value Gender pay gap % (OECD countries only) 19 76 Share of women's membership in boards % (OECD countries only) 22 20 Firms with female majority ownership % firms 20 70 Firms with female top managers % firms 32 60 Share of workers in informal sector % workers 8 40 Indicator 1-7 (best) Value Advancement of women to leadership roles 5 37 Indicator Unit Female Male Value Unemployed adults % of labour force (15-64) 5 80 8 40 7 10 Workers employed part-time % of employed people 26 54 16 50 21 53 Proportion of time spent on unpaid domestic and care work % n a n a n a Indicator Million people Female Male Value Labour-force 0 45 0 44 0 89 Access to finance Indicator 0-1 (Equal rights) Value Access to financial services Near-equal rights Inheritance rights for widows and daughters Equal rights Access to land assets Equal rights Access to non-land assets Equal rights Civil and political freedom Indicator Unit Value Year women received right to vote year 1918 Number of female heads of state to date number 2 Seats held in upper house % total seats n a Indicator Yes/No Value Election list quotas for women, national n a Party membership quotas, voluntary n a Indicator 0-1 (Equal rights) Value Access to justice Equal rights Freedom of movement Equal rights Family and care Indicator Unit Value Public spending on family benefits % GPD 2 25 Unmet family planning % women 15-49 n a Early marriage % 0 70 Mean age of women at birth of first child years 27 30 Indicator 0-1 (Equal rights) Value Right to divorce Equal rights Indicator Days Female Male Value Length of parental leave 112 00 10 00 309 00 Education and skills Graduates Attainment % Female Male Parity STEM Graduates n a n a n a Agri , Forestry, Fisheries & Veterinary 46 50 53 50 0 87 Arts & Humanities 76 17 23 83 3 20 Business, Admin & Law 68 24 31 76 2 15 Education n a n a n a Engineering, Manuf & Construction 26 60 73 40 0 36 Health & Welfare 83 94 16 06 5 22 Information & Comm Technologies 22 68 77 32 0 29 Natural Sci , Mathematics & Statistics 63 02 36 98 1 70 Social Sci , Jour nalism & Information 75 04 24 96 3 01 Vocational training 16 09 17 76 0 91 PhD graduates 0 95 1 29 1 11 Graduates % Female Male Value Graduates from tertiary education 62 18 32 63 46 88 Health Indicator Unit Value Prevalence of gender violence in lifetime % women 32 00 Births attended by skilled personnel % live births 99 90 Mater nal mortality deaths per 100,000 live births 19 00 Total fertility rate births per woman 1 55 Indicator 0-1 (Equal rights) Value Reproductive autonomy Equal rights *Scores are on a 0 to 1 scale, where 1 represents the optimal situation or “parity” Please see Appendix A and B for detailed methodology, definitions, sources and periods. **For all indicators, except the two health indicators, parity is benchmarked at 1 In the case of sex ratio at birth the gender parity benchmark is set at 0 944 (see Klasen and Wink 2003) In the case of healthy life expectancy the gender parity benchmark is set at 1 06, given women's longer life expectancy
Global Gender Gap Index Indicators
Global Gender Gap Report 2023 235 Global Gender Gap Index 2023 Edition Lebanon score average score 0.538 Economy 0 984 E d u c a t i o n 0.971 Health 0 021 P o i t i c s Overview Index and Subindex 2023 Score Rank 2022 Score Rank Global Gender Gap Index 0 628 132nd 0 644 119th Economic Participation and Opportunity 0.538 127th 0 492 135th Educational Attainment 0 984 90th 0 983 90th Health and Survival 0 971 68th 0 971 75th Political Empowerment 0 021 144th 0 129 110th
2023 Indicator Rank Score* Difference F-M Min Max Economic Participation and Opportunity 127th 0 538 -Labour-force participation rate % 136th 0 416 -41 21 0-100 Wage equality for similar work 1-7 (best) 84th 0 614Estimated ear ned income int'l $ 1,000 125th 0 469 -9 49 0-150 Legislators, senior officials and managers % 117th 0 269 -57 59 0-100 Professional and technical workers % 1st 1 000 8 00 0-100 Educational Attainment 90th 0.984 -Literacy rate % 96th 0 965Enrolment in primary education % - - -Enrolment in secondary education % 1st 1 000 0 01 0-200 Enrolment in tertiary education % - - -Health and Survival 68th 0 971 -Sex ratio at birth** % 1st 0 944Healthy life expectancy** years 82nd 1 030Political Empowerment 144th 0 021 -Women in parliament % 135th 0 067 -87 40 0-100 Women in ministerial positions % 140th 0 000 -100 00 0-100 Years with female/male head of state (last 50) 80th 0 000 -50 00 0-50 Economy Profile Lebanon Score (imparity = 0 parity = 1) 0.628 Rank (out of 146 countries) 132nd Index Edition 2023 Compare with Global average 0 1 Female vs Male Min Max70 56 29 3517 87 8 37 78 79 21 21 46 00 54 00-0 50 0 51--93 70 6 30 100 00 0 50 00 0
Complementary Targets and Contextual Indicators 2023
Public
Inheritance
Access
Access
Graduates Attainment
Agri , Forestry, Fisheries & Veterinary
Business, Admin & Law
Engineering, Manuf & Construction
Information & Comm Technologies
Natural Sci , Mathematics & Statistics
Social Sci , Jour nalism & Information
Vocational training
PhD graduates
Graduates from tertiary education
Health
Indicator Unit
Indicator 0-1 (Equal rights)
Reproductive
*Scores are on a 0 to 1 scale, where 1 represents the optimal situation or “parity” Please see Appendix A and B for detailed methodology, definitions, sources and periods. **For all indicators, except the two health indicators, parity is benchmarked at 1 In the case of sex ratio at birth the
Global Gender Gap Report 2023 236 Economy Profile Lebanon Score 0.628 Rank 132nd Page 2 of 2
indicators Indicator Unit Value GDP US$ billions 23 13 GDP per capita constant '17 intl $ 1000 12 98 Population sex ratio female/male 1 06 Population growth rate % -1 25 Indicator Million people Female Male Value Total population 2 83 2 66 5 49 Work participation and leadership Indicator Unit Value Gender pay gap % (OECD countries only) n a Share of women's membership in boards % (OECD countries only) n a Firms with female majority ownership % firms 4 70 Firms with female top managers % firms 5 90 Share of workers in informal sector % workers 55 40 Indicator 1-7 (best) Value Advancement of women to leadership roles 4 17 Indicator Unit Female Male Value Unemployed adults % of labour force (15-64) 14 60 10 30 11 69 Workers employed part-time % of employed people 24 54 17 20 19 44 Proportion of time spent on unpaid domestic and care work % n a n a n a Indicator Million people Female Male Value Labour-force 0 44 1 02 1 47 Access to finance Indicator 0-1 (Equal rights) Value
to financial services Near-equal rights
General
Access
rights for widows
Restricted rights
and daughters
to land assets Uneven rights
to non-land assets Near-equal rights Civil and political freedom Indicator Unit Value Year women received right to vote year 1926, 1952 Number of female heads of state to date number 0 Seats held in upper house % total seats n a Indicator Yes/No Value Election list quotas for women, national n a Party membership quotas, voluntary n a Indicator 0-1 (Equal rights) Value
to justice Restricted rights Freedom of movement Equal rights
and care
Unit Value
Access
Family
Indicator
spending on family benefits % GPD n a
family planning % women 15-49 n a Early marriage % 3 40 Mean age of women at birth of first child years n a
Value
Unequal rights
Female Male Value
Unmet
Indicator 0-1 (Equal rights)
Right to divorce
Indicator Days
70 00 0 0
Length of parental leave
Education and skills
% Female Male Parity STEM Graduates n a n a n a
n a n a n a
n a n a n a
Arts & Humanities
n a n a n a Education n a n a n a
n a n a n a
n a n a n a
Health & Welfare
n a n a n a
n a n a n a
n a n a n a
n a n a n a
n a n a n a
Female Male Value
Graduates %
n a n a n a
Value
%
10 40
live
n a
births 29 00 Total
births
2 10
Prevalence of gender violence in lifetime
women
Births attended by skilled personnel %
births
Mater nal mortality deaths per 100,000 live
fertility rate
per woman
Value
autonomy Restricted rights
expectancy
gender parity benchmark is set at 0 944 (see Klasen and Wink 2003) In the case of healthy life expectancy the gender parity benchmark is set at 1 06, given women's longer life
Global Gender Gap Index Indicators
Global Gender Gap Report 2023 237 Global Gender Gap Index 2023 Edition Lesotho score average score 0.648 Economy 1 000 E d u c a t i o n 0.980 Health 0 179 P o i t i c s Overview Index and Subindex 2023 Score Rank 2022 Score Rank Global Gender Gap Index 0 702 82nd 0 700 87th Economic Participation and Opportunity 0.648 94th 0 650 91st Educational Attainment 1 000 1st 1 000 1st Health and Survival 0 980 1st 0 980 1st Political Empowerment 0 179 83rd 0 171 88th
2023 Indicator Rank Score* Difference F-M Min Max Economic Participation and Opportunity 94th 0 648 -Labour-force participation rate % 87th 0 729 -18 20 0-100 Wage equality for similar work 1-7 (best) 119th 0 494Estimated ear ned income int'l $ 1,000 49th 0 688 -0 85 0-150 Legislators, senior officials and managers % 79th 0 510 -32 43 0-100 Professional and technical workers % 1st 1 000 21 49 0-100 Educational Attainment 1st 1.000 -Literacy rate % 1st 1 000Enrolment in primary education % 1st 1 000 1 08 0-100 Enrolment in secondary education % 1st 1 000 17 19 0-200 Enrolment in tertiary education % 1st 1 000 4 38 0-200 Health and Survival 1st 0 980 -Sex ratio at birth** % 1st 0 944Healthy life expectancy** years 1st 1 060Political Empowerment 83rd 0 179 -Women in parliament % 75th 0 361 -47 00 0-100 Women in ministerial positions % 67th 0 273 -57 14 0-100 Years with female/male head of state (last 50) 80th 0 000 -50 00 0-50 Economy Profile Lesotho Score (imparity = 0 parity = 1) 0.702 Rank (out of 146 countries) 82nd Index Edition 2023 Compare with Global average 0 1 Female vs Male Min Max67 13 48 932 73 1 88 66 22 33 78 39 26 60 7491 10 92 18 55 47 72 66 8 02 12 40-73 50 26 50 78 57 21 43 50 00 0
Complementary Targets and Contextual Indicators 2023
Global Gender Gap Report 2023 238 Economy Profile Lesotho Score 0.702 Rank 82nd Page 2 of 2
General indicators Indicator Unit Value GDP US$ billions 2 5 GDP per capita constant '17 intl $ 1000 2 30 Population sex ratio female/male 1 03 Population growth rate % 1 21 Indicator Million people Female Male Value Total population 1 17 1 14 2 31 Work participation and leadership Indicator Unit Value Gender pay gap % (OECD countries only) n a Share of women's membership in boards % (OECD countries only) n a Firms with female majority ownership % firms 25 40 Firms with female top managers % firms 36 20 Share of workers in informal sector % workers 80 90 Indicator 1-7 (best) Value Advancement of women to leadership roles 3 35 Indicator Unit Female Male Value Unemployed adults % of labour force (15-64) 19 75 15 69 17 49 Workers employed part-time % of employed people 10 59 7 01 8 55 Proportion of time spent on unpaid domestic and care work % n a n a n a Indicator Million people Female Male Value Labour-force 0 29 0 35 0 64 Access to finance Indicator 0-1 (Equal rights) Value Access to financial services Uneven rights
rights for widows and daughters Uneven rights Access to land assets Near-equal rights Access to non-land assets Uneven rights Civil and political freedom Indicator Unit Value Year women received right to vote year 1966 Number of female heads of state to date number 0 Seats held in upper house % total seats 24 20 Indicator Yes/No Value Election list quotas for women, national Yes Party membership quotas, voluntary Yes Indicator 0-1 (Equal rights) Value Access to justice Equal rights Freedom of movement Equal rights Family and care Indicator Unit Value Public spending on family benefits % GPD n a Unmet family planning % women 15-49 16 01 Early marriage % 18 30 Mean age of women at birth of first child years n a Indicator 0-1 (Equal rights) Value Right to divorce Uneven rights Indicator Days Female Male Value Length of parental leave 84 00 0 0 Education and skills Graduates Attainment % Female Male Parity STEM Graduates 24 82 75 18 0 33 Agri , Forestry, Fisheries & Veterinary n a n a n a Arts & Humanities 56 68 43 32 1 31 Business, Admin & Law n a n a n a Education n a n a n a Engineering, Manuf & Construction 18 44 81 56 0 23 Health & Welfare 72 78 27 22 2 67 Information & Comm Technologies 31 25 68 75 0 45 Natural Sci , Mathematics & Statistics 45 16 54 84 0 82 Social Sci , Jour nalism & Information 77 50 22 50 3 44 Vocational training n a n a n a PhD graduates n a n a n a Graduates % Female Male Value Graduates from tertiary education 5 21 3 14 4 17 Health Indicator Unit Value Prevalence of gender violence in lifetime % women 62 00 Births attended by skilled personnel % live births 86 60 Mater nal mortality deaths per 100,000 live births 544 00 Total fertility rate births per woman 3 05 Indicator 0-1 (Equal rights) Value Reproductive autonomy Uneven rights *Scores
0 to 1 scale,
1 represents the optimal situation
parity” Please see Appendix A and B for detailed methodology, definitions, sources and periods. **For all indicators, except the two health indicators, parity is benchmarked at 1 In the case of sex ratio at birth the gender parity benchmark is set at 0 944 (see Klasen and Wink 2003) In the case of healthy life expectancy the gender parity benchmark is set at 1 06, given women's longer life expectancy
Inheritance
are on a
where
or “
Global Gender Gap Index Indicators
Global Gender Gap Report 2023 239 Global Gender Gap Index 2023 Edition Liberia score average score 0.895 Economy 0 896 E d u c a t i o n 0.962 Health 0 287 P o i t i c s Overview Index and Subindex 2023 Score Rank 2022 Score Rank Global Gender Gap Index 0 760 39th 0 709 78th Economic Participation and Opportunity 0.895 1st 0 804 8th Educational Attainment 0 896 131st 0 815 137th Health and Survival 0 962 123rd 0 962 126th Political Empowerment 0 287 50th 0 255 52nd
2023 Indicator Rank Score* Difference F-M Min Max Economic Participation and Opportunity 1st 0 895 -Labour-force participation rate % 28th 0 869 -6 54 0-100 Wage equality for similar work 1-7 (best) - - -Estimated ear ned income int'l $ 1,000 1st 1 000 0 09 0-150 Legislators, senior officials and managers % 1st 1 000 4 90 0-100 Professional and technical workers % 105th 0 619 -23 53 0-100 Educational Attainment 131st 0.896 -Literacy rate % 142nd 0 544Enrolment in primary education % 1st 1 000 4 71 0-100 Enrolment in secondary education % 104th 0 977 -0 94 0-200 Enrolment in tertiary education % - - -Health and Survival 123rd 0 962 -Sex ratio at birth** % 1st 0 944Healthy life expectancy** years 133rd 1 002Political Empowerment 50th 0 287 -Women in parliament % 129th 0 124 -78 00 0-100 Women in ministerial positions % 51st 0 417 -41 18 0-100 Years with female/male head of state (last 50) 12th 0 329 -25 25 0-50 Economy Profile Liberia Score (imparity = 0 parity = 1) 0.760 Rank (out of 146 countries) 39th Index Edition 2023 Compare with Global average 0 1 Female vs Male Min Max50 05 43 511 38 1 47 47 55 52 45 61 76 38 2470 84 75 55 40 16 39 22--89 00 11 00 70 59 29 41 37 63 12 37
Complementary Targets and Contextual Indicators 2023
Access
Global Gender Gap Report 2023 240 Economy Profile Liberia Score 0.760 Rank 39th Page 2 of 2
General indicators Indicator Unit Value GDP US$ billions 3 51 GDP per capita constant '17 intl $ 1000 1 42 Population sex ratio female/male 1 01 Population growth rate % 2 06 Indicator Million people Female Male Value Total population 2 66 2 64 5 30 Work participation and leadership Indicator Unit Value Gender pay gap % (OECD countries only) n a Share of women's membership in boards % (OECD countries only) n a Firms with female majority ownership % firms 15 60 Firms with female top managers % firms 20 40 Share of workers in informal sector % workers 89 60 Indicator 1-7 (best) Value Advancement of women to leadership roles 4 97 Indicator Unit Female Male Value Unemployed adults % of labour force (15-64) 5 88 6 38 6 14 Workers employed part-time % of employed people 15 72 11 69 13 69 Proportion of time spent on unpaid domestic and care work % n a n a n a Indicator Million people Female Male Value Labour-force 0 44 0 48 0 92 Access to finance Indicator 0-1 (Equal rights) Value Access to financial services Near-equal rights Inheritance rights for widows
Uneven rights
and daughters
to land assets Uneven rights
to non-land assets Uneven rights Civil and political freedom Indicator Unit Value Year women received right to vote year 1946 Number of female heads of state to date number 2 Seats held in upper house % total seats 6 70 Indicator Yes/No Value Election list quotas for women, national Yes Party membership quotas, voluntary Yes Indicator 0-1 (Equal rights) Value Access to justice Restricted rights Freedom of movement Equal rights Family and care Indicator Unit Value
spending on family benefits % GPD n a Unmet family planning % women 15-49 33 40 Early marriage % 15 70 Mean age of women at birth of first child years n a Indicator 0-1 (Equal rights) Value Right to divorce Restricted rights Indicator Days Female Male Value Length of
leave 98 00 0 0 Education and skills
Attainment % Female Male Parity STEM Graduates n a n a n a
Access
Public
parental
Graduates
&
n a n a n a Arts &
n a n a n a
Admin & Law n a n a n a Education n a n a n a Engineering, Manuf & Construction n a n a n a Health & Welfare n a n a n a Information & Comm Technologies n a n a n a
Sci
Mathematics & Statistics n a n a n a
Sci
Information n a n a n a Vocational training n a n a n a PhD graduates n a n a n a Graduates % Female Male Value Graduates from tertiary education n a n a n a Health
Unit Value Prevalence of gender violence in lifetime % women 38 50 Births attended by skilled personnel % live births 84 40 Mater nal mortality deaths per 100,000 live births 661 00 Total fertility rate births per woman 4 17 Indicator 0-1 (Equal rights) Value Reproductive autonomy Near-equal rights *Scores
0
optimal situation
parity
Appendix A
B for detailed methodology, definitions, sources
periods. **For all indicators, except the two health indicators, parity is benchmarked at 1 In the case of sex ratio at birth the gender parity benchmark is set at 0 944 (see Klasen and Wink 2003) In the case of healthy life expectancy the gender parity benchmark is set at 1 06, given women's longer life expectancy
Agri , Forestry, Fisheries
Veterinary
Humanities
Business,
Natural
,
Social
, Jour nalism &
Indicator
are on a
to 1 scale, where 1 represents the
or “
” Please see
and
and
Global Gender Gap Index Indicators
Global Gender Gap Report 2023 241 Global Gender Gap Index 2023 Edition Lithuania score average score 0.767 Economy 0 989 E d u c a t i o n 0.980 Health 0 466 P o i t i c s Overview Index and Subindex 2023 Score Rank 2022 Score Rank Global Gender Gap Index 0 800 9th 0 799 11th Economic Participation and Opportunity 0.767 26th 0 781 21st Educational Attainment 0 989 83rd 0 986 85th Health and Survival 0 980 1st 0 980 1st Political Empowerment 0 466 20th 0 450 22nd
2023 Indicator Rank Score* Difference F-M Min Max Economic Participation and Opportunity 26th 0 767 -Labour-force participation rate % 48th 0 843 -10 70 0-100 Wage equality for similar work 1-7 (best) 16th 0 741Estimated ear ned income int'l $ 1,000 36th 0 729 -12 42 0-150 Legislators, senior officials and managers % 56th 0 587 -26 05 0-100 Professional and technical workers % 1st 1 000 25 26 0-100 Educational Attainment 83rd 0.989 -Literacy rate % 1st 1 000Enrolment in primary education % - - -Enrolment in secondary education % 105th 0 975 -2 79 0-200 Enrolment in tertiary education % 1st 1 000 25 59 0-200 Health and Survival 1st 0 980 -Sex ratio at birth** % 1st 0 944Healthy life expectancy** years 1st 1 060Political Empowerment 20th 0 466 -Women in parliament % 62nd 0 397 -43 20 0-100 Women in ministerial positions % 20th 0 750 -14 29 0-100 Years with female/male head of state (last 50) 11th 0 355 -23 80 0-50 Economy Profile Lithuania Score (imparity = 0 parity = 1) 0.800 Rank (out of 146 countries) 9th Index Edition 2023 Compare with Global average 0 1 Female vs Male Min Max68 04 57 3445 89 33 47 63 03 36 98 37 37 62 63-110 09 107 30 58 44 84 03-71 60 28 40 57 14 42 86 36 90 13 10
Complementary Targets and Contextual Indicators 2023
Global Gender Gap Report 2023 242 Economy Profile Lithuania Score 0.800 Rank 9th Page 2 of 2
General indicators Indicator Unit Value GDP US$ billions 66 45 GDP per capita constant '17 intl $ 1000 39 31 Population sex ratio female/male 1 13 Population growth rate % 0 21 Indicator Million people Female Male Value Total population 1 46 1 29 2 75 Work participation and leadership Indicator Unit Value Gender pay gap % (OECD countries only) 9 33 Share of women's membership in boards % (OECD countries only) 22 30 Firms with female majority ownership % firms 18 40 Firms with female top managers % firms 30 70 Share of workers in informal sector % workers 5 10 Indicator 1-7 (best) Value Advancement of women to leadership roles 6 09 Indicator Unit Female Male Value Unemployed adults % of labour force (15-64) 5 70 6 70 6 20 Workers employed part-time % of employed people 28 27 17 50 22 86 Proportion of time spent on unpaid domestic and care work % n a n a n a Indicator Million people Female Male Value Labour-force 0 72 0 69 1 41 Access to finance Indicator 0-1 (Equal rights) Value Access to financial services Equal rights Inheritance rights for widows and daughters Equal rights Access to land assets Equal rights Access to non-land assets Equal rights Civil and political freedom Indicator Unit Value Year women received right to vote year 1919 Number of female heads of state to date number 4 Seats held in upper house % total seats n a Indicator Yes/No Value Election list quotas for women, national Yes Party membership quotas, voluntary Yes Indicator 0-1 (Equal rights) Value Access to justice Equal rights Freedom of movement Equal rights Family and care Indicator Unit Value Public spending on family benefits % GPD 2 46 Unmet family planning % women 15-49 n a Early marriage % 0 Mean age of women at birth of first child years 28 20 Indicator 0-1 (Equal rights) Value Right to divorce Near-equal rights Indicator Days Female Male Value Length of parental leave 126 00 30 00 309 00 Education and skills Graduates Attainment % Female Male Parity STEM Graduates 29 59 70 41 0 42 Agri , Forestry, Fisheries & Veterinary n a n a n a Arts & Humanities 74 37 25 63 2 90 Business, Admin & Law 68 52 31 48 2 18 Education n a n a n a Engineering, Manuf & Construction 25 48 74 52 0 34 Health & Welfare 82 95 17 05 4 87 Information & Comm Technologies n a n a n a Natural Sci , Mathematics & Statistics 57 75 42 25 1 37 Social Sci , Jour nalism & Information n a n a n a Vocational training 5 72 8 85 0 65 PhD graduates 0 82 0 89 0 85 Graduates % Female Male Value Graduates from tertiary education 73 65 44 84 58 64 Health Indicator Unit Value Prevalence of gender violence in lifetime % women 24 00 Births attended by skilled personnel % live births 100 00 Mater nal mortality deaths per 100,000 live births 8 00 Total fertility rate births per woman 1 48 Indicator 0-1 (Equal rights) Value Reproductive autonomy Equal rights *Scores
optimal situation
parity
A
B for detailed methodology, de
periods. **For
indicators,
health indicators, parity is benchmarked at 1 In the case of sex ratio at birth the gender parity benchmark is set at 0 944 (see Klasen and Wink 2003) In the case of healthy life expectancy
gender parity benchmark is set at 1 06, given women's longer life expectancy
are on a 0 to 1 scale, where 1 represents the
or “
” Please see Appendix
and
finitions, sources and
all
except the two
the
Global Gender Gap Index Indicators
Global Gender Gap Report 2023 243 Global Gender Gap Index 2023 Edition Luxembourg score average score 0.710 Economy 1 000 E d u c a t i o n 0.965 Health 0 315 P o i t i c s Overview Index and Subindex 2023 Score Rank 2022 Score Rank Global Gender Gap Index 0 747 44th 0 736 46th Economic Participation and Opportunity 0.710 57th 0 724 51st Educational Attainment 1 000 30th 0 999 32nd Health and Survival 0 965 108th 0 965 110th Political Empowerment 0 315 43rd 0 258 51st
2023 Indicator Rank Score* Difference F-M Min Max Economic Participation and Opportunity 57th 0 710 -Labour-force participation rate % 17th 0 885 -7 52 0-100 Wage equality for similar work 1-7 (best) 36th 0 704Estimated ear ned income int'l $ 1,000 45th 0 697 -41 20 0-150 Legislators, senior officials and managers % 114th 0 281 -56 11 0-100 Professional and technical workers % 70th 0 983 -0 86 0-100 Educational Attainment 30th 1.000 -Literacy rate % 1st 1 000Enrolment in primary education % 1st 1 000 0 13 0-100 Enrolment in secondary education % 81st 0 998 -0 22 0-200 Enrolment in tertiary education % 1st 1 000 3 42 0-200 Health and Survival 108th 0 965 -Sex ratio at birth** % 1st 0 944Healthy life expectancy** years 117th 1 012Political Empowerment 43rd 0 315 -Women in parliament % 41st 0 538 -30 00 0-100 Women in ministerial positions % 30th 0 600 -25 00 0-100 Years with female/male head of state (last 50) 80th 0 000 -50 00 0-50 Economy Profile Luxembourg Score (imparity = 0 parity = 1) 0.747 Rank (out of 146 countries) 44th Index Edition 2023 Compare with Global average 0 1 Female vs Male Min Max65 66 58 14136 14 94 95 78 05 21 95 50 43 49 5798 88 99 01 107 29 107 07 17 54 20 97-65 00 35 00 62 50 37 50 50 00 0
Complementary Targets and Contextual Indicators 2023
Global Gender Gap Report 2023 244 Economy Profile Luxembourg Score 0.747 Rank 44th Page 2 of 2
General indicators Indicator Unit Value GDP US$ billions 85 51 GDP per capita constant '17 intl $ 1000 115 68 Population sex ratio female/male 0 99 Population growth rate % 1 52 Indicator Million people Female Male Value Total population 0 32 0 33 0 65 Work participation and leadership Indicator Unit Value Gender pay gap % (OECD countries only) n a Share of women's membership in boards % (OECD countries only) 22 40 Firms with female majority ownership % firms 8 30 Firms with female top managers % firms 7 40 Share of workers in informal sector % workers 10 30 Indicator 1-7 (best) Value Advancement of women to leadership roles 5 40 Indicator Unit Female Male Value Unemployed adults % of labour force (15-64) 4 70 4 40 4 60 Workers employed part-time % of employed people 52 18 30 64 40 65 Proportion of time spent on unpaid domestic and care work % 14 44 7 08 n a Indicator Million people Female Male Value Labour-force 0 14 0 16 0 30 Access to finance Indicator 0-1 (Equal rights) Value Access to financial services Equal rights Inheritance rights for widows and daughters Equal rights Access to land assets Equal rights Access to non-land assets Equal rights Civil and political freedom Indicator Unit Value Year women received right to vote year 1919 Number of female heads of state to date number 0 Seats held in upper house % total seats n a Indicator Yes/No Value Election list quotas for women, national Yes Party membership quotas, voluntary Yes Indicator 0-1 (Equal rights) Value Access to justice Equal rights Freedom of movement Equal rights Family and care Indicator Unit Value Public spending on family benefits % GPD 3 36 Unmet family planning % women 15-49 n a Early marriage % 1 10 Mean age of women at birth of first child years 31 00 Indicator 0-1 (Equal rights) Value Right to divorce Equal rights Indicator Days Female Male Value Length of parental leave 112 00 14 00 0 Education and skills Graduates Attainment % Female Male Parity STEM Graduates n a n a n a Agri , Forestry, Fisheries & Veterinary 22 86 77 14 0 30 Arts & Humanities 61 98 38 02 1 63 Business, Admin & Law n a n a n a Education 68 92 31 08 2 22 Engineering, Manuf & Construction 19 82 80 18 0 25 Health & Welfare 70 37 29 63 2 38 Information & Comm Technologies 19 59 80 41 0 24 Natural Sci , Mathematics & Statistics 45 16 54 84 0 82 Social Sci , Jour nalism & Information 67 69 32 31 2 10 Vocational training 21 29 22 25 0 96 PhD graduates n a n a n a Graduates % Female Male Value Graduates from tertiary education 10 10 6 60 8 29 Health Indicator Unit Value Prevalence of gender violence in lifetime % women 22 00 Births attended by skilled personnel % live births n a Mater nal mortality deaths per 100,000 live births 5 00 Total fertility rate births per woman 1 37 Indicator 0-1 (Equal rights) Value Reproductive autonomy Equal rights *Scores
parity
**For
parity
benchmarked
1
sex ratio at birth the gender parity benchmark is set at 0 944 (see Klasen and Wink 2003)
the case of healthy life expectancy
gender parity benchmark
set at 1 06, given women's longer life expectancy
are on a 0 to 1 scale, where 1 represents the optimal situation or “
” Please see Appendix A and B for detailed methodology, definitions, sources and periods.
all indicators, except the two health indicators,
is
at
In the case of
In
the
is
Global Gender Gap Index Indicators
Global Gender Gap Report 2023 245 Global Gender Gap Index 2023 Edition Madagascar score average score 0.800 Economy 0 979 E d u c a t i o n 0.966 Health 0 201 P o i t i c s Overview Index and Subindex 2023 Score Rank 2022 Score Rank Global Gender Gap Index 0 737 51st 0 735 48th Economic Participation and Opportunity 0.800 12th 0 793 17th Educational Attainment 0 979 100th 0 978 94th Health and Survival 0 966 103rd 0 966 102nd Political Empowerment 0 201 76th 0 202 75th
2023 Indicator Rank Score* Difference F-M Min Max Economic Participation and Opportunity 12th 0 800 -Labour-force participation rate % 6th 0 937 -5 62 0-100 Wage equality for similar work 1-7 (best) - - -Estimated ear ned income int'l $ 1,000 7th 0 845 -0 25 0-150 Legislators, senior officials and managers % 86th 0 466 -36 47 0-100 Professional and technical workers % 83rd 0 904 -5 03 0-100 Educational Attainment 100th 0.979 -Literacy rate % 98th 0 961Enrolment in primary education % - - -Enrolment in secondary education % 1st 1 000 1 29 0-200 Enrolment in tertiary education % 107th 0 966 -0 19 0-200 Health and Survival 103rd 0 966 -Sex ratio at birth** % 1st 0 944Healthy life expectancy** years 112th 1 015Political Empowerment 76th 0 201 -Women in parliament % 107th 0 227 -63 00 0-100 Women in ministerial positions % 36th 0 529 -30 77 0-100 Years with female/male head of state (last 50) 77th 0 000 -49 99 0-50 Economy Profile Mada ascar Score (imparity = 0 parity = 1) 0.737 Rank (out of 146 countries) 51st Index Edition 2023 Compare with Global average 0 1 Female vs Male Min Max89 21 83 591 59 1 34 68 23 31 77 52 51 47 49-33 95 35 24 5 62 5 43-81 50 18 50 65 39 34 62 50 00 0 01
Complementary Targets and Contextual Indicators 2023
Global Gender Gap Report 2023 246 Economy Profile Madagascar Score 0.737 Rank 51st Page 2 of 2
General indicators Indicator Unit Value GDP US$ billions 14 47 GDP per capita constant '17 intl $ 1000 1 46 Population sex ratio female/male 1 00 Population growth rate % 2 42 Indicator Million people Female Male Value Total population 14 78 14 84 29 61 Work participation and leadership Indicator Unit Value Gender pay gap % (OECD countries only) n a Share of women's membership in boards % (OECD countries only) n a Firms with female majority ownership % firms 21 60 Firms with female top managers % firms 28 20 Share of workers in informal sector % workers 95 20 Indicator 1-7 (best) Value Advancement of women to leadership roles 4 42 Indicator Unit Female Male Value Unemployed adults % of labour force (15-64) 3 55 2 98 3 25 Workers employed part-time % of employed people 39 74 25 91 32 64 Proportion of time spent on unpaid domestic and care work % n a n a n a Indicator Million people Female Male Value Labour-force 4 15 4 58 8 73 Access to finance Indicator 0-1 (Equal rights) Value Access to financial services Near-equal rights
rights for widows and daughters Near-equal rights
to land assets Near-equal rights Access to non-land assets Uneven rights Civil and political freedom Indicator Unit Value Year women received right to vote year 1959 Number of female heads of state to date number 1 Seats held in upper house % total seats 11 10 Indicator Yes/No Value Election list quotas for women, national n a Party membership quotas, voluntary n a Indicator 0-1 (Equal rights) Value Access to justice Restricted rights Freedom of movement Restricted rights Family and care Indicator Unit Value Public spending on family benefits % GPD n a Unmet family planning % women 15-49 14 60 Early marriage % 39 90 Mean age of women at birth of first child years n a Indicator 0-1 (Equal rights) Value Right to divorce Restricted rights Indicator Days Female Male Value Length of parental leave 98 00 0 0 Education and skills Graduates Attainment % Female Male Parity STEM Graduates 31 02 68 98 0 45 Agri , Forestry, Fisheries & Veterinary 41 19 58 81 0 70 Arts & Humanities 50 90 49 10 1 04 Business, Admin & Law 53 79 46 21 1 16 Education 50 95 49 05 1 04 Engineering, Manuf & Construction n a n a n a Health & Welfare 67 86 32 14 2 11 Information & Comm Technologies 33 64 66 36 0 51 Natural Sci , Mathematics & Statistics n a n a n a Social Sci , Jour nalism & Information 46 04 53 96 0 85 Vocational training 0 37 0 79 0 47 PhD graduates 0 23 0 42 0 33 Graduates % Female Male Value Graduates from tertiary education 3 78 3 45 3 62 Health Indicator Unit Value Prevalence of gender violence in lifetime % women 30 00 Births attended by skilled personnel % live births 45 80 Mater nal mortality deaths per 100,000 live births 335 00 Total fertility rate births per woman 3 92 Indicator 0-1 (Equal rights) Value Reproductive autonomy Unequal rights *Scores
0
1 scale,
1 represents the optimal situation
parity
Please see Appendix A and B for detailed methodology, definitions, sources and periods. **For all indicators, except the two health indicators, parity is benchmarked at 1 In the case of sex ratio at birth the gender parity benchmark is set at 0 944 (see Klasen and Wink 2003) In the case of healthy life expectancy the gender parity benchmark is set at 1 06, given women's longer life expectancy
Inheritance
Access
are on a
to
where
or “
”
Global Gender Gap Index Indicators
Global Gender Gap Report 2023 247 Global Gender Gap Index 2023 Edition Malawi score average score 0.602 Economy 0 897 E d u c a t i o n 0.980 Health 0 224 P o i t i c s Overview Index and Subindex 2023 Score Rank 2022 Score Rank Global Gender Gap Index 0 676 110th 0 632 132nd Economic Participation and Opportunity 0.602 109th 0 620 104th Educational Attainment 0 897 129th 0 764 139th Health and Survival 0 980 1st 0 980 1st Political Empowerment 0 224 67th 0 164 92nd
2023 Indicator Rank Score* Difference F-M Min Max Economic Participation and Opportunity 109th 0 602 -Labour-force participation rate % 38th 0 855 -10 76 0-100 Wage equality for similar work 1-7 (best) 63rd 0 651Estimated ear ned income int'l $ 1,000 88th 0 616 -0 71 0-150 Legislators, senior officials and managers % 125th 0 185 -68 75 0-100 Professional and technical workers % 112th 0 545 -29 43 0-100 Educational Attainment 129th 0.897 -Literacy rate % 117th 0 895Enrolment in primary education % - - -Enrolment in secondary education % 1st 1 000 1 54 0-200 Enrolment in tertiary education % 126th 0 705 -0 97 0-200 Health and Survival 1st 0 980 -Sex ratio at birth** % 1st 0 944Healthy life expectancy** years 1st 1 060Political Empowerment 67th 0 224 -Women in parliament % 93rd 0 261 -58 60 0-100 Women in ministerial positions % 37th 0 500 -33 33 0-100 Years with female/male head of state (last 50) 52nd 0 045 -45 70 0-50 Economy Profile Malawi Score (imparity = 0 parity = 1) 0.676 Rank (out of 146 countries) 110th Index Edition 2023 Compare with Global average 0 1 Female vs Male Min Max73 99 63 231 86 1 14 84 38 15 63 64 72 35 28-35 54 37 08 3 28 2 31-79 30 20 70 66 67 33 33 47 85 2 15
Complementary Targets and Contextual Indicators 2023
Agri , Forestry, Fisheries & Veterinary
Information & Comm Technologies
Natural Sci , Mathematics & Statistics
Social Sci , Jour nalism & Information
Inheritance
Access
*Scores are on a 0 to 1 scale, where 1 represents the optimal situation or “parity” Please see Appendix A and B for detailed methodology, definitions, sources and periods.
Global Gender Gap Report 2023 248 Economy Profile Malawi Score 0.676 Rank 110th Page 2 of 2
General indicators Indicator Unit Value GDP US$ billions 12 63 GDP per capita constant '17 intl $ 1000 1 49 Population sex ratio female/male 1 06 Population growth rate % 2 61 Indicator Million people Female Male Value Total population 10 48 9 93 20 41 Work participation and leadership Indicator Unit Value Gender pay gap % (OECD countries only) n a Share of women's membership in boards % (OECD countries only) n a Firms with female majority ownership % firms 11 40 Firms with female top managers % firms 14 20 Share of workers in informal sector % workers 87 10 Indicator 1-7 (best) Value Advancement of women to leadership roles 4 38 Indicator Unit Female Male Value Unemployed adults % of labour force (15-64) 1 13 0 81 0 97 Workers employed part-time % of employed people 59 08 45 01 52 07 Proportion of time spent on unpaid domestic and care work % n a n a n a Indicator Million people Female Male Value Labour-force 2 39 2 40 4 79 Access to finance Indicator 0-1 (Equal rights) Value Access to financial services Near-equal rights
rights for widows and daughters Uneven rights
to land assets Near-equal rights
to non-land assets Near-equal rights Civil and political freedom Indicator Unit Value Year women received right to vote year 1964 Number of female heads of state to date number 1 Seats held in upper house % total seats n a Indicator Yes/No Value Election list quotas for women, national Yes Party membership quotas, voluntary Yes Indicator 0-1 (Equal rights) Value Access to justice Near-equal rights Freedom of movement Restricted rights
and care Indicator Unit Value
spending on family benefits % GPD n a Unmet family planning % women 15-49 15 43 Early marriage % 26 90 Mean age of women at birth of first child years n a Indicator 0-1 (Equal rights) Value Right to divorce Near-equal rights Indicator Days Female Male Value Length of parental leave 56 00 14 00 0 Education and skills Graduates Attainment % Female Male Parity STEM Graduates n a n a n a
Access
Family
Public
n a n a n a Arts
n a n a n a
n a n a n a Education n a n a n a Engineering, Manuf & Construction n a n a n a Health
Welfare n a n a n a
& Humanities
Business, Admin & Law
&
n a n a n a
n a n a n a
n a n a n a
n a n a n a PhD
n a n a n a Graduates % Female Male Value
n a n a n a
Vocational training
graduates
Graduates from tertiary education
Health
Value Prevalence of gender violence in lifetime % women 37 50 Births attended by skilled personnel % live births 96 40 Mater nal mortality deaths per 100,000 live births 349 00 Total fertility rate births per woman 4 00 Indicator 0-1
rights) Value
autonomy Restricted rights
health indicators, parity is benchmarked
1
case of sex ratio at birth the gender parity benchmark is set at 0 944 (see Klasen and Wink 2003) In the case of healthy life expectancy
gender parity benchmark is set at 1 06, given women's longer life expectancy
Indicator Unit
(Equal
Reproductive
**For all indicators, except the two
at
In the
the
Global Gender Gap Index Indicators
Global Gender Gap Report 2023 249 Global Gender Gap Index 2023 Edition Malaysia score average score 0.664 Economy 1 000 E d u c a t i o n 0.969 Health 0 098 P o i t i c s Overview Index and Subindex 2023 Score Rank 2022 Score Rank Global Gender Gap Index 0 682 102nd 0 681 103rd Economic Participation and Opportunity 0.664 89th 0 656 88th Educational Attainment 1 000 1st 0 995 56th Health and Survival 0 969 80th 0 972 68th Political Empowerment 0 098 122nd 0 102 123rd
2023 Indicator Rank Score* Difference F-M Min Max Economic Participation and Opportunity 89th 0 664 -Labour-force participation rate % 96th 0 686 -25 30 0-100 Wage equality for similar work 1-7 (best) 18th 0 740Estimated ear ned income int'l $ 1,000 68th 0 657 -10 85 0-150 Legislators, senior officials and managers % 109th 0 331 -50 30 0-100 Professional and technical workers % 90th 0 851 -8 06 0-100 Educational Attainment 1st 1.000 -Literacy rate % 1st 1 000Enrolment in primary education % 1st 1 000 1 01 0-100 Enrolment in secondary education % 1st 1 000 4 87 0-200 Enrolment in tertiary education % 1st 1 000 11 45 0-200 Health and Survival 80th 0 969 -Sex ratio at birth** % 125th 0 938Healthy life expectancy** years 73rd 1 038Political Empowerment 122nd 0 098 -Women in parliament % 123rd 0 156 -73 00 0-100 Women in ministerial positions % 88th 0 200 -66 67 0-100 Years with female/male head of state (last 50) 80th 0 000 -50 00 0-50 Economy Profile Malaysia Score (imparity = 0 parity = 1) 0.682 Rank (out of 146 countries) 102nd Index Edition 2023 Compare with Global average 0 1 Female vs Male Min Max80 65 55 3531 64 20 79 75 15 24 85 54 03 45 9797 29 98 30 82 04 86 91 35 84 47 29-86 50 13 50 83 33 16 67 50 00 0
Complementary Targets and Contextual Indicators 2023
Global Gender Gap Report 2023 250 Economy Profile Malaysia Score 0.682 Rank 102nd Page 2 of 2
General indicators Indicator Unit Value GDP US$ billions 372 98 GDP per capita constant '17 intl $ 1000 26 33 Population sex ratio female/male 0 96 Population growth rate % 1 12 Indicator Million people Female Male Value Total population 16 60 17 34 33 94 Work participation and leadership Indicator Unit Value Gender pay gap % (OECD countries only) n a Share of women's membership in boards % (OECD countries only) n a Firms with female majority ownership % firms 19 40 Firms with female top managers % firms 33 20 Share of workers in informal sector % workers n a Indicator 1-7 (best) Value Advancement of women to leadership roles 5 31 Indicator Unit Female Male Value Unemployed adults % of labour force (15-64) 4 68 4 45 4 54 Workers employed part-time % of employed people 11 03 9 31 10 98 Proportion of time spent on unpaid domestic and care work % n a n a n a Indicator Million people Female Male Value Labour-force 5 10 7 96 13 06 Access to finance Indicator 0-1 (Equal rights) Value Access to financial services Equal rights Inheritance rights for widows and daughters Uneven rights Access to land assets Uneven rights Access to non-land assets Uneven rights Civil and political freedom Indicator Unit Value Year women received right to vote year 1957 Number of female heads of state to date number 0 Seats held in upper house % total seats 19 60 Indicator Yes/No Value Election list quotas for women, national n a Party membership quotas, voluntary Yes Indicator 0-1 (Equal rights) Value Access to justice Restricted rights Freedom of movement Equal rights Family and care Indicator Unit Value Public spending on family benefits % GPD n a Unmet family planning % women 15-49 n a Early marriage % 6 10 Mean age of women at birth of first child years n a Indicator 0-1 (Equal rights) Value Right to divorce Unequal rights Indicator Days Female Male Value Length of parental leave 60 00 0 0 Education and skills Graduates Attainment % Female Male Parity STEM Graduates n a n a n a Agri , Forestry, Fisheries & Veterinary 47 67 52 33 0 91 Arts & Humanities 63 42 36 58 1 73 Business, Admin & Law n a n a n a Education 69 73 30 27 2 30 Engineering, Manuf & Construction 27 05 72 95 0 37 Health & Welfare 72 41 27 59 2 62 Information & Comm Technologies 46 00 54 00 0 85 Natural Sci , Mathematics & Statistics 70 73 29 27 2 42 Social Sci , Jour nalism & Information n a n a n a Vocational training 3 71 5 70 0 65 PhD graduates 0 26 0 27 0 26 Graduates % Female Male Value Graduates from tertiary education 22 14 10 77 16 28 Health Indicator Unit Value Prevalence of gender violence in lifetime % women n a Births attended by skilled personnel % live births 99 60 Mater nal mortality deaths per 100,000 live births 29 00 Total fertility rate births per woman 1 82 Indicator 0-1 (Equal rights) Value Reproductive autonomy Restricted rights *Scores are on a 0 to 1 scale, where 1 represents the optimal situation or “parity” Please see Appendix A and B for detailed methodology, definitions, sources and periods. **For all indicators, except the two health indicators, parity is benchmarked at 1 In the case of sex ratio at birth the gender parity benchmark is set at 0 944 (see Klasen and Wink 2003) In the case of healthy life expectancy the gender parity benchmark is set at 1 06, given women's longer life expectancy
Global Gender Gap Index Indicators
Global Gender Gap Report 2023 251 Global Gender Gap Index 2023 Edition Maldives score average score 0.512 Economy 0 984 E d u c a t i o n 0.962 Health 0 139 P o i t i c s Overview Index and Subindex 2023 Score Rank 2022 Score Rank Global Gender Gap Index 0 649 124th 0 648 117th Economic Participation and Opportunity 0.512 131st 0 531 127th Educational Attainment 0 984 91st 0 984 89th Health and Survival 0 962 121st 0 956 138th Political Empowerment 0 139 103rd 0 121 114th
2023 Indicator Rank Score* Difference F-M Min Max Economic Participation and Opportunity 131st 0 512 -Labour-force participation rate % 113th 0 644 -27 99 0-100 Wage equality for similar work 1-7 (best) - - -Estimated ear ned income int'l $ 1,000 131st 0 396 -15 26 0-150 Legislators, senior officials and managers % 121st 0 229 -62 69 0-100 Professional and technical workers % 88th 0 855 -7 80 0-100 Educational Attainment 91st 0.984 -Literacy rate % 1st 1 000Enrolment in primary education % 1st 1 000 2 44 0-100 Enrolment in secondary education % 124th 0 930 -5 86 0-200 Enrolment in tertiary education % 1st 1 000 48 82 0-200 Health and Survival 121st 0 962 -Sex ratio at birth** % 1st 0 944Healthy life expectancy** years 131st 1 004Political Empowerment 103rd 0 139 -Women in parliament % 139th 0 048 -90 80 0-100 Women in ministerial positions % 37th 0 500 -33 33 0-100 Years with female/male head of state (last 50) 80th 0 000 -50 00 0-50 Economy Profile Maldives Score (imparity = 0 parity = 1) 0.649 Rank (out of 146 countries) 124th Index Edition 2023 Compare with Global average 0 1 Female vs Male Min Max78 60 50 6125 25 9 99 81 34 18 66 53 90 46 1096 83 99 28 84 27 78 41 17 69 66 51-95 40 4 60 66 67 33 33 50 00 0
Complementary Targets and Contextual Indicators 2023
Global Gender Gap Report 2023 252 Economy Profile Maldives Score 0.649 Rank 124th Page 2 of 2
General indicators Indicator Unit Value GDP US$ billions 5 41 GDP per capita constant '17 intl $ 1000 18 77 Population sex ratio female/male 0 73 Population growth rate % 1 36 Indicator Million people Female Male Value Total population 0 22 0 30 0 52 Work participation and leadership Indicator Unit Value Gender pay gap % (OECD countries only) n a Share of women's membership in boards % (OECD countries only) n a Firms with female majority ownership % firms n a Firms with female top managers % firms n a Share of workers in informal sector % workers 48 10 Indicator 1-7 (best) Value Advancement of women to leadership roles n a Indicator Unit Female Male Value Unemployed adults % of labour force (15-64) 4 03 5 10 4 64 Workers employed part-time % of employed people 31 46 10 72 18 95 Proportion of time spent on unpaid domestic and care work % n a n a n a Indicator Million people Female Male Value Labour-force 0 07 0 10 0 17 Access to finance Indicator 0-1 (Equal rights) Value Access to financial services Equal rights Inheritance rights for widows and daughters Unequal rights Access to land assets Near-equal rights Access to non-land assets Near-equal rights Civil and political freedom Indicator Unit Value Year women received right to vote year 1965 Number of female heads of state to date number 0 Seats held in upper house % total seats n a Indicator Yes/No Value Election list quotas for women, national n a Party membership quotas, voluntary n a Indicator 0-1 (Equal rights) Value Access to justice Restricted rights Freedom of movement Equal rights Family and care Indicator Unit Value Public spending on family benefits % GPD n a Unmet family planning % women 15-49 31 40 Early marriage % 5 40 Mean age of women at birth of first child years n a Indicator 0-1 (Equal rights) Value Right to divorce Unequal rights Indicator Days Female Male Value Length of parental leave 60 00 3 00 0 Education and skills Graduates Attainment % Female Male Parity STEM Graduates 10 56 89 44 0 12 Agri , Forestry, Fisheries & Veterinary n a n a n a Arts & Humanities 74 31 25 69 2 89 Business, Admin & Law 59 74 40 26 1 48 Education 81 81 18 19 4 50 Engineering, Manuf & Construction n a n a n a Health & Welfare 95 00 5 00 19 00 Information & Comm Technologies 9 68 90 32 0 11 Natural Sci , Mathematics & Statistics 100 00 0 n a Social Sci , Jour nalism & Information 69 70 30 30 2 30 Vocational training n a n a n a PhD graduates n a n a n a Graduates % Female Male Value Graduates from tertiary education n a n a n a Health Indicator Unit Value Prevalence of gender violence in lifetime % women 19 50 Births attended by skilled personnel % live births 99 50 Mater nal mortality deaths per 100,000 live births 53 00 Total fertility rate births per woman 1 71 Indicator 0-1 (Equal rights) Value Reproductive autonomy Uneven rights *Scores
optimal situation
Appendix A
B for detailed methodology, definitions, sources
periods. **For all indicators, except the two health indicators, parity is benchmarked at 1 In the case of sex ratio at birth the gender parity benchmark is set at 0 944 (see Klasen and Wink 2003) In the case of healthy life expectancy the gender parity benchmark is set at 1 06, given women's longer life expectancy
are on a 0 to 1 scale, where 1 represents the
or “parity” Please see
and
and
Global Gender Gap Index Indicators
Global Gender Gap Report 2023 253 Global Gender Gap Index 2023 Edition Mali score average score 0.489 Economy 0 779 E d u c a t i o n 0.959 Health 0 192 P o i t i c s Overview Index and Subindex 2023 Score Rank 2022 Score Rank Global Gender Gap Index 0 605 141st 0 601 141st Economic Participation and Opportunity 0.489 134th 0 521 130th Educational Attainment 0 779 140th 0 757 140th Health and Survival 0 959 135th 0 959 133rd Political Empowerment 0 192 78th 0 168 91st
2023 Indicator Rank Score* Difference F-M Min Max Economic Participation and Opportunity 134th 0 489 -Labour-force participation rate % 117th 0 625 -30 87 0-100 Wage equality for similar work 1-7 (best) 69th 0 631Estimated ear ned income int'l $ 1,000 121st 0 479 -1 49 0-150 Legislators, senior officials and managers % 123rd 0 211 -65 11 0-100 Professional and technical workers % 136th 0 258 -59 00 0-100 Educational Attainment 140th 0.779 -Literacy rate % 141st 0 546Enrolment in primary education % 108th 0 899 -6 26 0-100 Enrolment in secondary education % 130th 0 876 -4 92 0-200 Enrolment in tertiary education % 132nd 0 502 -3 24 0-200 Health and Survival 135th 0 959 -Sex ratio at birth** % 1st 0 944Healthy life expectancy** years 141st 0 993Political Empowerment 78th 0 192 -Women in parliament % 59th 0 401 -42 80 0-100 Women in ministerial positions % 76th 0 238 -61 54 0-100 Years with female/male head of state (last 50) 64th 0 020 -48 06 0-50 Economy Profile Mali Score (imparity = 0 parity = 1) 0.605 Rank (out of 146 countries) 141st Index Edition 2023 Compare with Global average 0 1 Female vs Male Min Max82 41 51 542 86 1 37 82 55 17 44 79 50 20 5062 09 55 83 39 72 34 80 6 51 3 27-71 40 28 60 80 77 19 23 49 03 0 97
Complementary Targets and Contextual Indicators 2023
Access
Global Gender Gap Report 2023 254 Economy Profile Mali Score 0.605 Rank 141st Page 2 of 2
General indicators Indicator Unit Value GDP US$ billions 19 14 GDP per capita constant '17 intl $ 1000 2 12 Population sex ratio female/male 0 98 Population growth rate % 3 16 Indicator Million people Female Male Value Total population 11 19 11 41 22 59 Work participation and leadership Indicator Unit Value Gender pay gap % (OECD countries only) n a Share of women's membership in boards % (OECD countries only) n a Firms with female majority ownership % firms 9 10 Firms with female top managers % firms 11 60 Share of workers in informal sector % workers 94 00 Indicator 1-7 (best) Value Advancement of women to leadership roles 4 16 Indicator Unit Female Male Value Unemployed adults % of labour force (15-64) 3 65 3 70 3 68 Workers employed part-time % of employed people 25 80 8 84 16 11 Proportion of time spent on unpaid domestic and care work % n a n a n a Indicator Million people Female Male Value Labour-force 2 08 3 05 5 13 Access to finance Indicator 0-1 (Equal rights) Value Access to financial services Near-equal rights
rights for widows and daughters Uneven rights
Inheritance
to land assets Near-equal rights
to non-land assets Near-equal rights Civil and political freedom Indicator Unit Value Year women received right to vote year 1960 Number of female heads of state to date number 1 Seats held in upper house % total seats n a Indicator Yes/No Value Election list quotas for women, national Yes Party membership quotas, voluntary Yes Indicator 0-1 (Equal rights) Value Access to justice Restricted rights Freedom of movement Equal rights Family and care Indicator Unit Value Public spending on family benefits % GPD n a Unmet family planning % women 15-49 23 90 Early marriage % 44 00 Mean age of women at birth of first child years n a Indicator 0-1 (Equal rights) Value Right to divorce Uneven rights Indicator Days Female Male Value Length of parental leave 98 00 3 00 0 Education and skills Graduates Attainment % Female Male Parity STEM Graduates n a n a n a
&
n a n a n a Arts & Humanities n a n a n a Business, Admin & Law n a n a n a Education n a n a n a Engineering, Manuf & Construction n a n a n a Health & Welfare n a n a n a
n a n a n a
n a n a n a Social
n a n a n a Vocational training 2 92 4 16 0 70 PhD graduates 0 01 0 09 0 05 Graduates % Female Male Value Graduates from tertiary education n a n a n a Health
Unit Value Prevalence of gender violence in lifetime % women 34 60 Births attended by skilled personnel % live births 67 30 Mater nal mortality deaths per 100,000 live births 562 00 Total fertility rate births per woman 6 04 Indicator 0-1 (Equal rights) Value Reproductive autonomy Uneven rights
health indicators, parity is benchmarked
1
the case of sex ratio at birth the gender parity benchmark is set at 0 944 (see Klasen and Wink 2003) In the case of healthy life expectancy
gender parity benchmark is set at 1 06, given women's longer life expectancy
Access
Agri , Forestry, Fisheries
Veterinary
Information & Comm Technologies
Natural Sci , Mathematics & Statistics
Sci , Jour nalism & Information
Indicator
*Scores are on a 0 to 1 scale, where 1 represents the optimal situation or “parity” Please see Appendix A and B for detailed methodology, definitions, sources and periods. **For all indicators, except the two
at
In
the
Global Gender Gap Index Indicators
Global Gender Gap Report 2023 255 Global Gender Gap Index 2023 Edition Malta score average score 0.641 Economy 1 000 E d u c a t i o n 0.961 Health 0 251 P o i t i c s Overview Index and Subindex 2023 Score Rank 2022 Score Rank Global Gender Gap Index 0 713 70th 0 703 85th Economic Participation and Opportunity 0.641 97th 0 655 89th Educational Attainment 1 000 1st 1 000 1st Health and Survival 0 961 131st 0 965 106th Political Empowerment 0 251 62nd 0 192 82nd
2023 Indicator Rank Score* Difference F-M Min Max Economic Participation and Opportunity 97th 0 641 -Labour-force participation rate % 84th 0 753 -17 59 0-100 Wage equality for similar work 1-7 (best) 74th 0 623Estimated ear ned income int'l $ 1,000 85th 0 622 -20 62 0-150 Legislators, senior officials and managers % 97th 0 407 -42 11 0-100 Professional and technical workers % 92nd 0 824 -9 62 0-100 Educational Attainment 1st 1.000 -Literacy rate % 1st 1 000Enrolment in primary education % - - -Enrolment in secondary education % 1st 1 000 1 26 0-200 Enrolment in tertiary education % 1st 1 000 24 24 0-200 Health and Survival 131st 0 961 -Sex ratio at birth** % 129th 0 937Healthy life expectancy** years 114th 1 015Political Empowerment 62nd 0 251 -Women in parliament % 65th 0 387 -44 20 0-100 Women in ministerial positions % 114th 0 125 -77 78 0-100 Years with female/male head of state (last 50) 17th 0 227 -31 51 0-50 Economy Profile Malta Score (imparity = 0 parity = 1) 0.713 Rank (out of 146 countries) 70th Index Edition 2023 Compare with Global average 0 1 Female vs Male Min Max71 10 53 5154 52 33 90 70 99 28 88 54 64 45 02-109 07 110 32 59 73 83 97-72 10 27 90 88 89 11 11 40 76 9 24
Complementary Targets and Contextual Indicators 2023
Global Gender Gap Report 2023 256 Economy Profile Malta Score 0.713 Rank 70th Page 2 of 2
General indicators Indicator Unit Value GDP US$ billions 17 36 GDP per capita constant '17 intl $ 1000 44 65 Population sex ratio female/male 0 92 Population growth rate % 0 62 Indicator Million people Female Male Value Total population 0 26 0 28 0 53 Work participation and leadership Indicator Unit Value Gender pay gap % (OECD countries only) 11 09 Share of women's membership in boards % (OECD countries only) n a Firms with female majority ownership % firms 5 80 Firms with female top managers % firms 11 30 Share of workers in informal sector % workers n a Indicator 1-7 (best) Value Advancement of women to leadership roles 4 71 Indicator Unit Female Male Value Unemployed adults % of labour force (15-64) 2 60 3 20 3 00 Workers employed part-time % of employed people 10 19 7 81 8 87 Proportion of time spent on unpaid domestic and care work % n a n a n a Indicator Million people Female Male Value Labour-force n a n a n a Labour-force 0 11 0 15 0 26 Access to finance Indicator 0-1 (Equal rights) Value Access to financial services Equal rights Inheritance rights for widows and daughters Equal rights Access to land assets Equal rights Access to non-land assets Equal rights Civil and political freedom Indicator Unit Value Year women received right to vote year 1947 Number of female heads of state to date number 2 Seats held in upper house % total seats n a Indicator Yes/No Value Election list quotas for women, national Yes Party membership quotas, voluntary Yes Indicator 0-1 (Equal rights) Value Access to justice Equal rights Freedom of movement Equal rights Family and care Indicator Unit Value Public spending on family benefits % GPD n a Unmet family planning % women 15-49 n a Early marriage % 0 50 Mean age of women at birth of first child years 29 30 Indicator 0-1 (Equal rights) Value Right to divorce Near-equal rights Indicator Days Female Male Value Length of parental leave 126 00 14 00 0 Education and skills Graduates Attainment % Female Male Parity STEM Graduates 27 85 72 15 0 39 Agri , Forestry, Fisheries & Veterinary 50 00 50 00 1 00 Arts & Humanities n a n a n a Business, Admin & Law n a n a n a Education n a n a n a Engineering, Manuf & Construction 28 18 71 82 0 39 Health & Welfare 71 91 28 09 2 56 Information & Comm Technologies 15 98 84 02 0 19 Natural Sci , Mathematics & Statistics 53 01 46 99 1 13 Social Sci , Jour nalism & Information 62 76 37 24 1 69 Vocational training 9 76 11 30 0 86 PhD graduates 0 37 1 02 0 71 Graduates % Female Male Value Graduates from tertiary education 58 81 44 89 51 66 Health Indicator Unit Value Prevalence of gender violence in lifetime % women 15 00 Births attended by skilled personnel % live births 99 89 Mater nal mortality deaths per 100,000 live births 6 00 Total fertility rate births per woman 1 13 Indicator 0-1 (Equal rights) Value Reproductive autonomy Unequal rights *Scores are on a 0 to 1 scale, where 1 represents the optimal situation or “parity” Please see Appendix A and B for detailed methodology, definitions, sources and periods. **For all indicators, except the two health indicators, parity is benchmarked at 1 In the case of sex ratio at birth the gender parity benchmark is set at 0 944 (see Klasen and Wink 2003) In the case of healthy life expectancy the gender parity benchmark is set at 1 06, given women's longer life expectancy
Global Gender Gap Index Indicators
Global Gender Gap Report 2023 257 Global Gender Gap Index 2023 Edition Mauritius score average score 0.637 Economy 0 993 E d u c a t i o n 0.980 Health 0 148 P o i t i c s Overview Index and Subindex 2023 Score Rank 2022 Score Rank Global Gender Gap Index 0 689 98th 0 679 105th Economic Participation and Opportunity 0.637 100th 0 601 111th Educational Attainment 0 993 71st 0 991 72nd Health and Survival 0 980 1st 0 980 1st Political Empowerment 0 148 97th 0 144 102nd
2023 Indicator Rank Score* Difference F-M Min Max Economic Participation and Opportunity 100th 0 637 -Labour-force participation rate % 116th 0 633 -22 17 0-100 Wage equality for similar work 1-7 (best) 87th 0 610Estimated ear ned income int'l $ 1,000 113th 0 519 -13 33 0-150 Legislators, senior officials and managers % 40th 0 651 -21 17 0-100 Professional and technical workers % 79th 0 911 -4 64 0-100 Educational Attainment 71st 0.993 -Literacy rate % 97th 0 963Enrolment in primary education % 1st 1 000 2 00 0-100 Enrolment in secondary education % 1st 1 000 4 45 0-200 Enrolment in tertiary education % 1st 1 000 17 87 0-200 Health and Survival 1st 0 980 -Sex ratio at birth** % 1st 0 944Healthy life expectancy** years 1st 1 060Political Empowerment 97th 0 148 -Women in parliament % 96th 0 250 -60 00 0-100 Women in ministerial positions % 101st 0 167 -71 43 0-100 Years with female/male head of state (last 50) 44th 0 066 -43 79 0-50 Economy Profile Mauritius Score (imparity = 0 parity = 1) 0.689 Rank (out of 146 countries) 98th Index Edition 2023 Compare with Global average 0 1 Female vs Male Min Max60 34 38 1727 73 14 39 60 59 39 42 52 32 47 6895 75 97 75 91 55 95 99 36 47 54 33-80 00 20 00 85 71 14 29 46 89 3 11
Complementary Targets and Contextual Indicators 2023
Global Gender Gap Report 2023 258 Economy Profile Mauritius Score 0.689 Rank 98th Page 2 of 2
General indicators Indicator Unit Value GDP US$ billions 11 53 GDP per capita constant '17 intl $ 1000 20 97 Population sex ratio female/male 1 03 Population growth rate % 0 03 Indicator Million people Female Male Value Total population 0 66 0 64 1 30 Work participation and leadership Indicator Unit Value Gender pay gap % (OECD countries only) n a Share of women's membership in boards % (OECD countries only) n a Firms with female majority ownership % firms n a Firms with female top managers % firms n a Share of workers in informal sector % workers 30 10 Indicator 1-7 (best) Value Advancement of women to leadership roles 4 49 Indicator Unit Female Male Value Unemployed adults % of labour force (15-64) 9 23 7 67 8 30 Workers employed part-time % of employed people 22 59 17 28 19 40 Proportion of time spent on unpaid domestic and care work % n a n a n a Indicator Million people Female Male Value Labour-force 0 17 0 27 0 44 Access to finance Indicator 0-1 (Equal rights) Value Access to financial services Equal rights Inheritance rights for widows and daughters Uneven rights Access to land assets Near-equal rights Access to non-land assets Near-equal rights Civil and political freedom Indicator Unit Value Year women received right to vote year 1968 Number of female heads of state to date number 2 Seats held in upper house % total seats n a Indicator Yes/No Value Election list quotas for women, national n a Party membership quotas, voluntary Yes Indicator 0-1 (Equal rights) Value Access to justice Restricted rights Freedom of movement Restricted rights Family and care Indicator Unit Value Public spending on family benefits % GPD n a Unmet family planning % women 15-49 12 50 Early marriage % 7 30 Mean age of women at birth of first child years n a Indicator 0-1 (Equal rights) Value Right to divorce Restricted rights Indicator Days Female Male Value Length of parental leave 98 00 7 00 0 Education and skills Graduates Attainment % Female Male Parity STEM Graduates 36 03 63 97 0 56 Agri , Forestry, Fisheries & Veterinary 29 06 70 94 0 41 Arts & Humanities 77 14 22 86 3 37 Business, Admin & Law 59 21 40 79 1 45 Education n a n a n a Engineering, Manuf & Construction 25 25 74 75 0 34 Health & Welfare 64 63 35 37 1 83 Information & Comm Technologies 31 59 68 41 0 46 Natural Sci , Mathematics & Statistics 66 13 33 87 1 95 Social Sci , Jour nalism & Information 73 54 26 46 2 78 Vocational training 0 42 2 24 0 19 PhD graduates n a n a n a Graduates % Female Male Value Graduates from tertiary education 34 21 24 44 29 28 Health Indicator Unit Value Prevalence of gender violence in lifetime % women n a Births attended by skilled personnel % live births 99 80 Mater nal mortality deaths per 100,000 live births 61 00 Total fertility rate births per woman 1 44 Indicator 0-1 (Equal rights) Value Reproductive autonomy Near-equal rights *Scores
0
1
optimal situation
parity
Appendix A
B for detailed methodology, definitions, sources and periods. **For all indicators, except the two health indicators, parity is benchmarked at 1 In the case of sex ratio at birth the gender parity benchmark is set at 0 944 (see Klasen and Wink 2003) In the case of healthy life expectancy the gender parity benchmark is set at 1 06, given women's longer life expectancy
are on a
to
scale, where 1 represents the
or “
” Please see
and
Global Gender Gap Index Indicators
Global Gender Gap Report 2023 259 Global Gender Gap Index 2023 Edition Mexico score average score 0.601 Economy 0 994 E d u c a t i o n 0.975 Health 0 490 P o i t i c s Overview Index and Subindex 2023 Score Rank 2022 Score Rank Global Gender Gap Index 0 765 33rd 0 764 31st Economic Participation and Opportunity 0.601 110th 0 597 113th Educational Attainment 0 994 62nd 0 994 60th Health and Survival 0 975 49th 0 975 54th Political Empowerment 0 490 15th 0 490 15th
2023 Indicator Rank Score* Difference F-M Min Max Economic Participation and Opportunity 110th 0 601 -Labour-force participation rate % 125th 0 576 -32 07 0-100 Wage equality for similar work 1-7 (best) 117th 0 511Estimated ear ned income int'l $ 1,000 112th 0 523 -12 05 0-150 Legislators, senior officials and managers % 46th 0 625 -23 06 0-100 Professional and technical workers % 69th 0 988 -0 58 0-100 Educational Attainment 62nd 0.994 -Literacy rate % 82nd 0 984Enrolment in primary education % - - -Enrolment in secondary education % 1st 1 000 9 85 0-200 Enrolment in tertiary education % 1st 1 000 3 55 0-200 Health and Survival 49th 0 975 -Sex ratio at birth** % 1st 0 944Healthy life expectancy** years 60th 1 046Political Empowerment 15th 0 490 -Women in parliament % 1st 1 000 0 0-100 Women in ministerial positions % 24th 0 727 -15 79 0-100 Years with female/male head of state (last 50) 80th 0 000 -50 00 0-50 Economy Profile Mexico Score (imparity = 0 parity = 1) 0.765 Rank (out of 146 countries) 33rd Index Edition 2023 Compare with Global average 0 1 Female vs Male Min Max75 69 43 6225 26 13 21 61 53 38 47 50 29 49 71-97 00 106 85 43 05 46 60-50 00 50 00 57 90 42 11 50 00 0
Complementary Targets and Contextual Indicators 2023
Global Gender Gap Report 2023 260 Economy Profile Mexico Score 0.765 Rank 33rd Page 2 of 2
General indicators Indicator Unit Value GDP US$ billions 1,272 84 GDP per capita constant '17 intl $ 1000 19 09 Population sex ratio female/male 1 05 Population growth rate % 0 56 Indicator Million people Female Male Value Total population 65 31 62 20 127 50 Work participation and leadership Indicator Unit Value Gender pay gap % (OECD countries only) 12 50 Share of women's membership in boards % (OECD countries only) 10 60 Firms with female majority ownership % firms n a Firms with female top managers % firms n a Share of workers in informal sector % workers 57 10 Indicator 1-7 (best) Value Advancement of women to leadership roles 3 85 Indicator Unit Female Male Value Unemployed adults % of labour force (15-64) 3 42 3 35 3 38 Workers employed part-time % of employed people 36 70 21 03 27 15 Proportion of time spent on unpaid domestic and care work % 27 77 11 11 n a Indicator Million people Female Male Value Labour-force 20 06 29 48 49 54 Access to finance Indicator 0-1 (Equal rights) Value Access to financial services Equal rights Inheritance rights for widows and daughters Near-equal rights Access to land assets Near-equal rights Access to non-land assets Near-equal rights Civil and political freedom Indicator Unit Value Year women received right to vote year 1947 Number of female heads of state to date number 0 Seats held in upper house % total seats 50 40 Indicator Yes/No Value Election list quotas for women, national Yes Party membership quotas, voluntary Yes Indicator 0-1 (Equal rights) Value Access to justice Near-equal rights Freedom of movement Equal rights Family and care Indicator Unit Value Public spending on family benefits % GPD 0 63 Unmet family planning % women 15-49 10 80 Early marriage % 19 00 Mean age of women at birth of first child years n a Indicator 0-1 (Equal rights) Value Right to divorce Unequal rights Indicator Days Female Male Value Length of parental leave 84 00 7 00 0 Education and skills Graduates Attainment % Female Male Parity STEM Graduates n a n a n a Agri , Forestry, Fisheries & Veterinary 36 78 63 22 0 58 Arts & Humanities 57 99 42 01 1 38 Business, Admin & Law 55 14 44 86 1 23 Education n a n a n a Engineering, Manuf & Construction 28 47 71 53 0 40 Health & Welfare n a n a n a Information & Comm Technologies n a n a n a Natural Sci , Mathematics & Statistics 51 14 48 86 1 05 Social Sci , Jour nalism & Information n a n a n a Vocational training 11 92 12 00 0 99 PhD graduates 0 26 0 38 0 31 Graduates % Female Male Value Graduates from tertiary education 29 81 25 21 27 50 Health Indicator Unit Value Prevalence of gender violence in lifetime % women 14 10 Births attended by skilled personnel % live births 96 60 Mater nal mortality deaths per 100,000 live births 33 00 Total fertility rate births per woman 1 91 Indicator 0-1 (Equal rights) Value Reproductive autonomy Uneven rights *Scores are on a 0 to 1 scale, where 1 represents the optimal situation or
parity” Please see Appendix A and B for detailed methodology, definitions, sources and periods. **For all indicators, except the two health indicators, parity is benchmarked at 1 In the case of sex ratio at birth the gender parity benchmark is set at 0 944 (see Klasen and Wink 2003) In the case of healthy life expectancy the gender parity benchmark is set at 1 06, given women's longer life expectancy
“
Moldova Republic of
Global Gender Gap Index Indicators
Global Gender Gap Report 2023 261 Global Gender Gap Index 2023 Edition Moldova, Republic of score average score 0.863 Economy 0 996 E d u c a t i o n 0.977 Health 0 314 P o i t i c s Overview Index and Subindex 2023 Score Rank 2022 Score Rank Global Gender Gap Index 0 788 19th 0 788 16th Economic Participation and Opportunity 0.863 3rd 0 766 25th Educational Attainment 0 996 53rd 0 996 52nd Health and Survival 0 977 40th 0 980 1st Political Empowerment 0 314 44th 0 412 29th
2023 Indicator Rank Score* Difference F-M Min Max Economic Participation and Opportunity 3rd 0 863 -Labour-force participation rate % 5th 0 945 -4 11 0-100 Wage equality for similar work 1-7 (best) - - -Estimated ear ned income int'l $ 1,000 28th 0 753 -3 98 0-150 Legislators, senior officials and managers % 19th 0 805 -10 82 0-100 Professional and technical workers % 1st 1 000 31 03 0-100 Educational Attainment 53rd 0.996 -Literacy rate % 62nd 0 998Enrolment in primary education % - - -Enrolment in secondary education % 86th 0 993 -0 68 0-200 Enrolment in tertiary education % 1st 1 000 21 04 0-200 Health and Survival 40th 0 977 -Sex ratio at birth** % 117th 0 941Healthy life expectancy** years 1st 1 060Political Empowerment 44th 0 314 -Women in parliament % 30th 0 629 -22 80 0-100 Women in ministerial positions % 74th 0 250 -60 00 0-100 Years with female/male head of state (last 50) 29th 0 129 -38 58 0-50 Economy Profile
Score (imparity = 0 parity = 1) 0.788 Rank (out of 146 countries) 19th Index Edition 2023 Compare with Global average 0 1 Female vs Male Min Max74 70 70 5916 10 12 11 55 41 44 59 34 49 65 51-97 60 96 92 52 43 73 47-61 40 38 60 80 00 20 00 44 29 5 71
Complementary Targets and Contextual Indicators 2023
Global Gender Gap Report 2023 262 Economy Profile Moldova, Republic of Score 0.788 Rank 19th Page 2 of 2
General indicators Indicator Unit Value GDP US$ billions 13 68 GDP per capita constant '17 intl $ 1000 14 01 Population sex ratio female/male 1 11 Population growth rate % -0 76 Indicator Million people Female Male Value Total population 1 72 1 56 3 27 Work participation and leadership Indicator Unit Value Gender pay gap % (OECD countries only) n a Share of women's membership in boards % (OECD countries only) n a Firms with female majority ownership % firms 17 60 Firms with female top managers % firms 18 60 Share of workers in informal sector % workers 55 90 Indicator 1-7 (best) Value Advancement of women to leadership roles 5 67 Indicator Unit Female Male Value Unemployed adults % of labour force (15-64) 0 84 1 35 1 08 Workers employed part-time % of employed people 9 18 7 66 8 46 Proportion of time spent on unpaid domestic and care work % n a n a n a Indicator Million people Female Male Value Labour-force 0 77 0 68 1 45 Access to finance Indicator 0-1 (Equal rights) Value Access to financial services Equal rights Inheritance rights for widows and daughters Equal rights Access to land assets Equal rights Access to non-land assets Restricted rights Civil and political freedom Indicator Unit Value Year women received right to vote year 1978, 1991 Number of female heads of state to date number 4 Seats held in upper house % total seats n a Indicator Yes/No Value Election list quotas for women, national Yes Party membership quotas, voluntary Yes Indicator 0-1 (Equal rights) Value Access to justice Equal rights Freedom of movement Equal rights Family and care Indicator Unit Value Public spending on family benefits % GPD n a Unmet family planning % women 15-49 21 20 Early marriage % 11 50 Mean age of women at birth of first child years 25 20 Indicator 0-1 (Equal rights) Value Right to divorce Equal rights Indicator Days Female Male Value Length of parental leave 126 00 14 00 1 04 Education and skills Graduates Attainment % Female Male Parity STEM Graduates 30 52 69 48 0 44 Agri , Forestry, Fisheries & Veterinary 22 80 77 20 0 30 Arts & Humanities 73 06 26 94 2 71 Business, Admin & Law 60 73 39 27 1 55 Education 87 98 12 02 7 32 Engineering, Manuf & Construction 29 73 70 27 0 42 Health & Welfare 68 80 31 20 2 20 Information & Comm Technologies n a n a n a Natural Sci , Mathematics & Statistics 54 80 45 20 1 21 Social Sci , Jour nalism & Information 76 31 23 69 3 22 Vocational training 14 84 17 09 0 87 PhD graduates 0 16 0 17 0 17 Graduates % Female Male Value Graduates from tertiary education 59 32 39 52 49 33 Health Indicator Unit Value Prevalence of gender violence in lifetime % women 45 50 Births attended by skilled personnel % live births 99 60 Mater nal mortality deaths per 100,000 live births 19 00 Total fertility rate births per woman 1 77 Indicator 0-1 (Equal rights) Value Reproductive autonomy Equal rights *Scores
optimal situation
parity
for detailed methodology, definitions, sources
periods. **For
indicators,
two health indicators, parity is benchmarked at 1 In the case of sex ratio at birth the gender parity benchmark is set at 0 944 (see Klasen and Wink 2003) In the case of healthy life expectancy the gender parity benchmark is set at 1 06, given women's longer life expectancy
are on a 0 to 1 scale, where 1 represents the
or “
” Please see Appendix A and B
and
all
except the
Global Gender Gap Index Indicators
Global Gender Gap Report 2023 263 Global Gender Gap Index 2023 Edition Mongolia score average score 0.745 Economy 0 994 E d u c a t i o n 0.980 Health 0 099 P o i t i c s Overview Index and Subindex 2023 Score Rank 2022 Score Rank Global Gender Gap Index 0 704 80th 0 715 70th Economic Participation and Opportunity 0.745 33rd 0 765 26th Educational Attainment 0 994 67th 0 994 63rd Health and Survival 0 980 1st 0 980 1st Political Empowerment 0 099 121st 0 121 113th
2023 Indicator Rank Score* Difference F-M Min Max Economic Participation and Opportunity 33rd 0 745 -Labour-force participation rate % 75th 0 768 -15 53 0-100 Wage equality for similar work 1-7 (best) 68th 0 637Estimated ear ned income int'l $ 1,000 59th 0 673 -4 58 0-150 Legislators, senior officials and managers % 18th 0 840 -8 68 0-100 Professional and technical workers % 1st 1 000 30 04 0-100 Educational Attainment 67th 0.994 -Literacy rate % 1st 1 000Enrolment in primary education % 95th 0 986 -1 37 0-100 Enrolment in secondary education % 1st 1 000 1 91 0-200 Enrolment in tertiary education % 1st 1 000 31 87 0-200 Health and Survival 1st 0 980 -Sex ratio at birth** % 1st 0 944Healthy life expectancy** years 1st 1 060Political Empowerment 121st 0 099 -Women in parliament % 112th 0 206 -65 80 0-100 Women in ministerial positions % 109th 0 143 -75 00 0-100 Years with female/male head of state (last 50) 76th 0 000 -49 96 0-50 Economy Profile Mongolia Score (imparity = 0 parity = 1) 0.704 Rank (out of 146 countries) 80th Index Edition 2023 Compare with Global average 0 1 Female vs Male Min Max67 02 51 4913 98 9 40 54 34 45 66 34 98 65 0298 12 96 75 102 32 104 23 53 60 85 46-82 90 17 10 87 50 12 50 49 98 0 02
Complementary Targets and Contextual Indicators 2023
Global Gender Gap Report 2023 264 Economy Profile Mongolia Score 0.704 Rank 80th Page 2 of 2
General indicators Indicator Unit Value GDP US$ billions 15 29 GDP per capita constant '17 intl $ 1000 11 67 Population sex ratio female/male 1 01 Population growth rate % 1 61 Indicator Million people Female Male Value Total population 1 71 1 69 3 40 Work participation and leadership Indicator Unit Value Gender pay gap % (OECD countries only) n a Share of women's membership in boards % (OECD countries only) n a Firms with female majority ownership % firms 32 70 Firms with female top managers % firms 38 90 Share of workers in informal sector % workers 43 20 Indicator 1-7 (best) Value Advancement of women to leadership roles 4 68 Indicator Unit Female Male Value Unemployed adults % of labour force (15-64) 7 43 8 26 7 87 Workers employed part-time % of employed people 13 00 10 87 11 88 Proportion of time spent on unpaid domestic and care work % 19 29 7 60 n a Indicator Million people Female Male Value Labour-force 0 55 0 60 1 15 Access to finance Indicator 0-1 (Equal rights) Value Access to financial services Near-equal rights Inheritance rights for widows and daughters Equal rights Access to land assets Near-equal rights Access to non-land assets Near-equal rights Civil and political freedom Indicator Unit Value Year women received right to vote year 1924 Number of female heads of state to date number 1 Seats held in upper house % total seats n a Indicator Yes/No Value Election list quotas for women, national Yes Party membership quotas, voluntary n a Indicator 0-1 (Equal rights) Value Access to justice Near-equal rights Freedom of movement Equal rights Family and care Indicator Unit Value Public spending on family benefits % GPD n a Unmet family planning % women 15-49 22 57 Early marriage % 5 30 Mean age of women at birth of first child years n a Indicator 0-1 (Equal rights) Value Right to divorce Near-equal rights Indicator Days Female Male Value Length of parental leave 120 00 14 00 1 10 Education and skills Graduates Attainment % Female Male Parity STEM Graduates 34 08 65 92 0 52 Agri , Forestry, Fisheries & Veterinary 51 89 48 11 1 08 Arts & Humanities 63 45 36 55 1 74 Business, Admin & Law 64 80 35 20 1 84 Education n a n a n a Engineering, Manuf & Construction 30 75 69 25 0 44 Health & Welfare 82 54 17 46 4 73 Information & Comm Technologies 37 68 62 32 0 60 Natural Sci , Mathematics & Statistics n a n a n a Social Sci , Jour nalism & Information 69 13 30 87 2 24 Vocational training 4 66 7 31 0 64 PhD graduates 0 20 0 21 0 20 Graduates % Female Male Value Graduates from tertiary education 74 79 44 50 59 55 Health Indicator Unit Value Prevalence of gender violence in lifetime % women 31 20 Births attended by skilled personnel % live births 99 30 Mater nal mortality deaths per 100,000 live births 45 00 Total fertility rate births per woman 2 90 Indicator 0-1 (Equal rights) Value Reproductive autonomy Equal rights *Scores
0
1
where 1 represents
optimal situation
parity
see Appendix A and B for detailed methodology, definitions, sources and periods. **For all indicators, except the two health indicators, parity is benchmarked at 1 In the case of sex ratio at birth the gender parity benchmark is set at 0 944 (see Klasen and Wink 2003) In the case of healthy life expectancy the gender parity benchmark is set at 1 06, given women's longer life expectancy
are on a
to
scale,
the
or “
” Please
Global Gender Gap Index Indicators
Global Gender Gap Report 2023 265 Global Gender Gap Index 2023 Edition Montenegro score average score 0.710 Economy 0 998 E d u c a t i o n 0.968 Health 0 180 P o i t i c s Overview Index and Subindex 2023 Score Rank 2022 Score Rank Global Gender Gap Index 0 714 69th 0 732 54th Economic Participation and Opportunity 0.710 56th 0 733 45th Educational Attainment 0 998 41st 0 998 43rd Health and Survival 0 968 88th 0 972 72nd Political Empowerment 0 180 82nd 0 226 64th
2023 Indicator Rank Score* Difference F-M Min Max Economic Participation and Opportunity 56th 0 710 -Labour-force participation rate % 77th 0 766 -14 19 0-100 Wage equality for similar work 1-7 (best) 54th 0 663Estimated ear ned income int'l $ 1,000 38th 0 726 -6 57 0-150 Legislators, senior officials and managers % 85th 0 473 -35 76 0-100 Professional and technical workers % 1st 1 000 13 81 0-100 Educational Attainment 41st 0.998 -Literacy rate % 77th 0 991Enrolment in primary education % 1st 1 000 0 16 0-100 Enrolment in secondary education % 1st 1 000 1 70 0-200 Enrolment in tertiary education % 1st 1 000 17 77 0-200 Health and Survival 88th 0 968 -Sex ratio at birth** % 137th 0 930Healthy life expectancy** years 50th 1 054Political Empowerment 82nd 0 180 -Women in parliament % 62nd 0 397 -43 20 0-100 Women in ministerial positions % 77th 0 231 -62 50 0-100 Years with female/male head of state (last 50) 80th 0 000 -50 00 0-50 Economy Profile Montene ro Score (imparity = 0 parity = 1) 0.714 Rank (out of 146 countries) 69th Index Edition 2023 Compare with Global average 0 1 Female vs Male Min Max60 59 46 4023 97 17 40 67 88 32 12 43 09 56 9197 15 97 30 90 24 91 94 47 12 64 90-71 60 28 40 81 25 18 75 50 00 0
Complementary Targets and Contextual Indicators 2023
Global Gender Gap Report 2023 266 Economy Profile Montenegro Score 0.714 Rank 69th Page 2 of 2
General indicators Indicator Unit Value GDP US$ billions 5 86 GDP per capita constant '17 intl $ 1000 20 60 Population sex ratio female/male 1 05 Population growth rate % -0 34 Indicator Million people Female Male Value Total population 0 32 0 30 0 63 Work participation and leadership Indicator Unit Value Gender pay gap % (OECD countries only) n a Share of women's membership in boards % (OECD countries only) n a Firms with female majority ownership % firms 14 80 Firms with female top managers % firms 15 00 Share of workers in informal sector % workers n a Indicator 1-7 (best) Value Advancement of women to leadership roles 4 48 Indicator Unit Female Male Value Unemployed adults % of labour force (15-64) 18 83 17 84 18 28 Workers employed part-time % of employed people 8 51 8 75 8 64 Proportion of time spent on unpaid domestic and care work % n a n a n a Indicator Million people Female Male Value Labour-force 0 11 0 13 0 24 Access to finance Indicator 0-1 (Equal rights) Value Access to financial services Equal rights Inheritance rights for widows and daughters Near-equal rights
to land assets Near-equal rights
to non-land assets Near-equal rights Civil and political freedom Indicator Unit Value Year women received right to vote year 2006 Number of female heads of state to date number 0 Seats held in upper house % total seats n a Indicator Yes/No Value Election list quotas for women, national Yes Party membership quotas, voluntary Yes Indicator 0-1 (Equal rights) Value Access to justice Equal rights Freedom of movement Equal rights
and care Indicator Unit Value Public spending on family benefits % GPD n a Unmet family planning % women 15-49 21 00 Early marriage % 2 40 Mean age of women at birth of first child years n a Indicator 0-1 (Equal rights) Value Right to divorce Equal rights Indicator Days Female Male Value Length of parental leave 98 00 0 295 00 Education and skills Graduates Attainment % Female Male Parity STEM Graduates n a n a n a
, Forestry, Fisheries & Veterinary n a n a n a Arts & Humanities n a n a n a
Admin & Law n a n a n a Education n a n a n a Engineering, Manuf & Construction n a n a n a Health & Welfare n a n a n a Information
Comm Technologies n a n a n a
Statistics n a n a n a
n a n a n a Vocational training 21 84 24 31 0 90 PhD graduates n a n a n a Graduates % Female Male Value Graduates from tertiary education 41 83 26 57 33 89 Health
Unit Value Prevalence of gender violence in lifetime % women n a Births attended by skilled personnel % live births 98 80 Mater nal mortality deaths per 100,000 live births 6 00 Total fertility rate births per woman 1 75
0-1 (Equal rights) Value Reproductive autonomy Equal rights *Scores
de
**For
two health indicators, parity is benchmarked at 1
the case of sex ratio at birth the gender parity benchmark is set at 0 944 (see Klasen and Wink 2003) In the case of healthy life expectancy the gender parity benchmark is set at 1 06, given women's longer life expectancy
Access
Access
Family
Agri
Business,
&
Natural Sci , Mathematics &
Social Sci , Jour nalism & Information
Indicator
Indicator
are on a 0 to 1 scale, where 1 represents the optimal situation or “parity” Please see Appendix A and B for detailed methodology,
finitions, sources and periods.
all indicators, except the
In
Global Gender Gap Index Indicators
Global Gender Gap Report 2023 267 Global Gender Gap Index 2023 Edition Morocco score average score 0.404 Economy 0 953 E d u c a t i o n 0.961 Health 0 165 P o i t i c s Overview Index and Subindex 2023 Score Rank 2022 Score Rank Global Gender Gap Index 0 621 136th 0 624 136th Economic Participation and Opportunity 0.404 141st 0 447 139th Educational Attainment 0 953 115th 0 945 114th Health and Survival 0 961 130th 0 961 131st Political Empowerment 0 165 90th 0 145 99th
2023 Indicator Rank Score* Difference F-M Min Max Economic Participation and Opportunity 141st 0 404 -Labour-force participation rate % 142nd 0 297 -49 50 0-100 Wage equality for similar work 1-7 (best) 99th 0 595Estimated ear ned income int'l $ 1,000 140th 0 234 -9 97 0-150 Legislators, senior officials and managers % - - -Professional and technical workers % - - -Educational Attainment 115th 0.953 -Literacy rate % 126th 0 794Enrolment in primary education % 78th 0 997 -0 30 0-100 Enrolment in secondary education % 109th 0 969 -2 61 0-200 Enrolment in tertiary education % 1st 1 000 4 63 0-200 Health and Survival 130th 0 961 -Sex ratio at birth** % 1st 0 944Healthy life expectancy** years 139th 1 000Political Empowerment 90th 0 165 -Women in parliament % 81st 0 321 -51 40 0-100 Women in ministerial positions % 68th 0 267 -57 89 0-100 Years with female/male head of state (last 50) 80th 0 000 -50 00 0-50 Economy Profile Morocco Score (imparity = 0 parity = 1) 0.621 Rank (out of 146 countries) 136th Index Edition 2023 Compare with Global average 0 1 Female vs Male Min Max70 40 20 9013 01 3 04-97 75 97 44 85 00 82 39 41 18 45 81-75 70 24 30 78 95 21 05 50 00 0
Complementary Targets and Contextual Indicators 2023
Global Gender Gap Report 2023 268 Economy Profile Morocco Score 0.621 Rank 136th Page 2 of 2
General indicators Indicator Unit Value GDP US$ billions 142 87 GDP per capita constant '17 intl $ 1000 8 06 Population sex ratio female/male 0 99 Population growth rate % 1 05 Indicator Million people Female Male Value Total population 18 61 18 85 37 46 Work participation and leadership Indicator Unit Value Gender pay gap % (OECD countries only) n a Share of women's membership in boards % (OECD countries only) n a Firms with female majority ownership % firms 2 60 Firms with female top managers % firms 5 40 Share of workers in informal sector % workers n a Indicator 1-7 (best) Value Advancement of women to leadership roles 4 38 Indicator Unit Female Male Value Unemployed adults % of labour force (15-64) 17 43 11 34 12 77 Workers employed part-time % of employed people 46 31 14 06 21 24 Proportion of time spent on unpaid domestic and care work % n a n a n a Indicator Million people Female Male Value Labour-force 2 53 8 34 10 87 Access to finance Indicator 0-1 (Equal rights) Value Access to financial services Near-equal rights
rights for widows and daughters Unequal rights Access to land assets Near-equal rights Access to non-land assets Near-equal rights Civil and political freedom Indicator Unit Value Year women received right to vote year 1959 Number of female heads of state to date number 0 Seats held in upper house % total seats 11 70 Indicator Yes/No Value Election list quotas for women, national Yes Party membership quotas, voluntary Yes Indicator 0-1 (Equal rights) Value Access to justice Restricted rights Freedom of movement Near-equal rights Family and care Indicator Unit Value Public spending on family benefits % GPD n a Unmet family planning % women 15-49 11 30 Early marriage % 11 30 Mean age of women at birth of first child years n a Indicator 0-1 (Equal rights) Value Right to divorce Restricted rights Indicator Days Female Male Value Length of parental leave 98 00 3 00 0 Education and skills Graduates Attainment % Female Male Parity STEM Graduates 45 32 54 68 0 83 Agri , Forestry, Fisheries & Veterinary n a n a n a Arts & Humanities 49 55 50 45 0 98 Business, Admin & Law n a n a n a Education 34 76 65 24 0 53 Engineering, Manuf & Construction 42 20 57 80 0 73 Health & Welfare 72 28 27 72 2 61 Information & Comm Technologies n a n a n a Natural Sci , Mathematics & Statistics 48 66 51 34 0 95 Social Sci , Jour nalism & Information n a n a n a Vocational training 5 04 6 55 0 77 PhD graduates n a n a n a Graduates % Female Male Value Graduates from tertiary education 20 78 17 23 18 96 Health Indicator Unit Value Prevalence of gender violence in lifetime % women 30 00 Births attended by skilled personnel % live births 86 60 Mater nal mortality deaths per 100,000 live births 70 00 Total fertility rate births per woman 2 35 Indicator 0-1 (Equal rights) Value Reproductive autonomy Restricted rights *Scores
0
1
optimal situation
see Appendix A and B for detailed methodology, definitions, sources and periods. **For all indicators, except the two health indicators, parity is benchmarked at 1 In the case of sex ratio at birth the gender parity benchmark is set at 0 944 (see Klasen and Wink 2003) In the case of healthy life expectancy the gender parity benchmark is set at 1 06, given women's longer life expectancy
Inheritance
are on a
to
scale, where 1 represents the
or “parity” Please
Global Gender Gap Index Indicators
Global Gender Gap Report 2023 269 Global Gender Gap Index 2023 Edition Mozambique score average score 0.692 Economy 0 896 E d u c a t i o n 0.980 Health 0 542 P o i t i c s Overview Index and Subindex 2023 Score Rank 2022 Score Rank Global Gender Gap Index 0 778 25th 0 752 34th Economic Participation and Opportunity 0.692 73rd 0 654 90th Educational Attainment 0 896 130th 0 882 130th Health and Survival 0 980 1st 0 980 1st Political Empowerment 0 542 8th 0 493 14th
2023 Indicator Rank Score* Difference F-M Min Max Economic Participation and Opportunity 73rd 0 692 -Labour-force participation rate % 2nd 0 976 -1 95 0-100 Wage equality for similar work 1-7 (best) - - -Estimated ear ned income int'l $ 1,000 21st 0 771 -0 32 0-150 Legislators, senior officials and managers % 110th 0 322 -51 34 0-100 Professional and technical workers % 115th 0 539 -29 99 0-100 Educational Attainment 130th 0.896 -Literacy rate % 133rd 0 726Enrolment in primary education % 101st 0 973 -2 64 0-100 Enrolment in secondary education % 125th 0 930 -2 85 0-200 Enrolment in tertiary education % 118th 0 806 -1 57 0-200 Health and Survival 1st 0 980 -Sex ratio at birth** % 1st 0 944Healthy life expectancy** years 1st 1 060Political Empowerment 8th 0 542 -Women in parliament % 17th 0 761 -13 60 0-100 Women in ministerial positions % 1st 1 000 10 00 0-100 Years with female/male head of state (last 50) 28th 0 134 -38 16 0-50 Economy Profile Mozambique Score (imparity = 0 parity = 1) 0.778 Rank (out of 146 countries) 25th Index Edition 2023 Compare with Global average 0 1 Female vs Male Min Max80 09 78 141 39 1 07 75 67 24 33 65 00 35 0098 91 96 28 40 45 37 60 8 11 6 53-56 80 43 20 45 00 55 00 44 08 5 92
Complementary Targets and Contextual Indicators 2023
Global Gender Gap Report 2023 270 Economy Profile Mozambique Score 0.778 Rank 25th Page 2 of 2
General indicators Indicator Unit Value GDP US$ billions 15 78 GDP per capita constant '17 intl $ 1000 1 23 Population sex ratio female/male 1 04 Population growth rate % 2 84 Indicator Million people Female Male Value Total population 16 79 16 18 32 97 Work participation and leadership Indicator Unit Value Gender pay gap % (OECD countries only) n a Share of women's membership in boards % (OECD countries only) n a Firms with female majority ownership % firms 17 40 Firms with female top managers % firms 15 60 Share of workers in informal sector % workers 95 70 Indicator 1-7 (best) Value Advancement of women to leadership roles 3 84 Indicator Unit Female Male Value Unemployed adults % of labour force (15-64) 3 89 3 31 3 62 Workers employed part-time % of employed people 58 14 43 79 51 40 Proportion of time spent on unpaid domestic and care work % n a n a n a Indicator Million people Female Male Value Labour-force 3 92 3 50 7 42 Access to finance Indicator 0-1 (Equal rights) Value Access to financial services Equal rights Inheritance rights for widows and daughters Near-equal rights Access to land assets Near-equal rights Access to non-land assets Equal rights Civil and political freedom Indicator Unit Value Year women received right to vote year 1975 Number of female heads of state to date number 1 Seats held in upper house % total seats n a Indicator Yes/No Value Election list quotas for women, national Yes Party membership quotas, voluntary Yes Indicator 0-1 (Equal rights) Value Access to justice Equal rights Freedom of movement Equal rights Family and care Indicator Unit Value Public spending on family benefits % GPD n a Unmet family planning % women 15-49 23 10 Early marriage % 41 00 Mean age of women at birth of first child years n a Indicator 0-1 (Equal rights) Value Right to divorce Equal rights Indicator Days Female Male Value Length of parental leave 60 00 1 00 0 Education and skills Graduates Attainment % Female Male Parity STEM Graduates 29 26 70 74 0 41 Agri , Forestry, Fisheries & Veterinary 35 39 64 61 0 55 Arts & Humanities 51 01 48 99 1 04 Business, Admin & Law 55 14 44 86 1 23 Education 42 52 57 48 0 74 Engineering, Manuf & Construction n a n a n a Health & Welfare 75 17 24 83 3 03 Information & Comm Technologies n a n a n a Natural Sci , Mathematics & Statistics 45 30 54 70 0 83 Social Sci , Jour nalism & Information n a n a n a Vocational training 0 46 0 91 0 51 PhD graduates 0 02 0 06 0 04 Graduates % Female Male Value Graduates from tertiary education 4 05 4 00 4 03 Health Indicator Unit Value Prevalence of gender violence in lifetime % women 21 70 Births attended by skilled personnel % live births 73 00 Mater nal mortality deaths per 100,000 live births 289 00 Total fertility rate births per woman 4 71 Indicator 0-1 (Equal rights) Value Reproductive autonomy Equal rights *Scores
0
1 scale,
1 represents the optimal situation
parity” Please see Appendix A
B for detailed methodology, definitions, sources and periods. **For all indicators, except the two health indicators, parity is benchmarked at 1 In the case of sex ratio at birth the gender parity benchmark is set at 0 944 (see Klasen and Wink 2003) In the case of healthy life expectancy the gender parity benchmark is set at 1 06, given women's longer life expectancy
are on a
to
where
or “
and
Global Gender Gap Index Indicators
Global Gender Gap Report 2023 271 Global Gender Gap Index 2023 Edition Myanmar score average score 0.600 Economy 0 977 E d u c a t i o n 0.975 Health 0 047 P o i t i c s Overview Index and Subindex 2023 Score Rank 2022 Score Rank Global Gender Gap Index 0 650 123rd 0 677 106th Economic Participation and Opportunity 0.600 113th 0 637 101st Educational Attainment 0 977 103rd 0 977 96th Health and Survival 0 975 47th 0 980 1st Political Empowerment 0 047 141st 0 114 118th
2023 Indicator Rank Score* Difference F-M Min Max Economic Participation and Opportunity 113th 0 600 -Labour-force participation rate % 121st 0 589 -31 87 0-100 Wage equality for similar work 1-7 (best) - - -Estimated ear ned income int'l $ 1,000 110th 0 535 -2 45 0-150 Legislators, senior officials and managers % 104th 0 385 -44 37 0-100 Professional and technical workers % 1st 1 000 20 10 0-100 Educational Attainment 103rd 0.977 -Literacy rate % 103rd 0 934Enrolment in primary education % - - -Enrolment in secondary education % 1st 1 000 5 70 0-200 Enrolment in tertiary education % 1st 1 000 6 35 0-200 Health and Survival 47th 0 975 -Sex ratio at birth** % 125th 0 938Healthy life expectancy** years 1st 1 060Political Empowerment 141st 0 047 -Women in parliament % 144th 0 000 -100 00 0-100 Women in ministerial positions % 140th 0 000 -100 00 0-100 Years with female/male head of state (last 50) 35th 0 107 -40 35 0-50 Economy Profile Myanmar Score (imparity = 0 parity = 1) 0.650 Rank (out of 146 countries) 123rd Index Edition 2023 Compare with Global average 0 1 Female vs Male Min Max77 50 45 635 26 2 82 72 19 27 81 39 95 60 05-65 60 71 30 15 63 21 98-100 00 0 100 00 0 45 17 4 83
Complementary Targets and Contextual Indicators 2023
Global Gender Gap Report 2023 272 Economy Profile Myanmar Score 0.650 Rank 123rd Page 2 of 2
General indicators Indicator Unit Value GDP US$ billions 65 09 GDP per capita constant '17 intl $ 1000 4 03 Population sex ratio female/male 1 01 Population growth rate % 0 70 Indicator Million people Female Male Value Total population 27 22 26 96 54 18 Work participation and leadership Indicator Unit Value Gender pay gap % (OECD countries only) n a Share of women's membership in boards % (OECD countries only) n a Firms with female majority ownership % firms 33 50 Firms with female top managers % firms 41 10 Share of workers in informal sector % workers 81 00 Indicator 1-7 (best) Value Advancement of women to leadership roles 4 45 Indicator Unit Female Male Value Unemployed adults % of labour force (15-64) 2 15 1 05 1 51 Workers employed part-time % of employed people 17 40 12 93 14 77 Proportion of time spent on unpaid domestic and care work % n a n a n a Indicator Million people Female Male Value Labour-force 7 54 11 07 18 61 Access to finance Indicator 0-1 (Equal rights) Value Access to financial services Equal rights
rights for widows and daughters Near-equal rights
to land assets Uneven rights Access to non-land assets Near-equal rights Civil and political freedom Indicator Unit Value Year women received right to vote year 1948 (Suspended) Number of female heads of state to date number 1 Seats held in upper house % total seats n a Indicator Yes/No Value Election list quotas for women, national n a Party membership quotas, voluntary n a Indicator 0-1 (Equal rights) Value Access to justice Restricted rights Freedom of movement Restricted rights Family and care Indicator Unit Value Public spending on family benefits % GPD n a Unmet family planning % women 15-49 16 20 Early marriage % 12 90 Mean age of women at birth of first child years n a Indicator 0-1 (Equal rights) Value Right to divorce Restricted rights Indicator Days Female Male Value Length of parental leave 98 00 21 00 0 Education and skills Graduates Attainment % Female Male Parity STEM Graduates 60 76 39 24 1 55 Agri , Forestry, Fisheries & Veterinary n a n a n a Arts & Humanities 68 95 31 05 2 22 Business, Admin & Law 70 80 29 20 2 42 Education 75 78 24 22 3 13 Engineering, Manuf & Construction 42 34 57 66 0 73 Health & Welfare 57 17 42 83 1 33 Information & Comm Technologies n a n a n a Natural Sci , Mathematics & Statistics 66 38 33 62 1 97 Social Sci , Jour nalism & Information 50 98 49 02 1 04 Vocational training 0 26 0 39 0 67 PhD graduates 0 05 0 04 0 05 Graduates % Female Male Value Graduates from tertiary education n a n a n a Health Indicator Unit Value Prevalence of gender violence in lifetime % women 33 00 Births attended by skilled personnel % live births 60 20 Mater nal mortality deaths per 100,000 live births 250 00 Total fertility rate births per woman 2 17 Indicator 0-1 (Equal rights) Value Reproductive autonomy Restricted rights *Scores
**For
two health indicators, parity is benchmarked at 1 In the case of sex ratio at birth the gender parity benchmark is set at 0 944 (see Klasen and Wink 2003) In the case of healthy life expectancy the gender parity benchmark is set at 1 06, given women's longer life expectancy
Inheritance
Access
are on a 0 to 1 scale, where 1 represents the optimal situation or “parity” Please see Appendix A and B for detailed methodology, definitions, sources and periods.
all indicators, except the
Global Gender Gap Index Indicators
Global Gender Gap Report 2023 273 Global Gender Gap Index 2023 Edition Namibia score average score 0.784 Economy 1 000 E d u c a t i o n 0.980 Health 0 443 P o i t i c s Overview Index and Subindex 2023 Score Rank 2022 Score Rank Global Gender Gap Index 0 802 8th 0 807 8th Economic Participation and Opportunity 0.784 19th 0 785 20th Educational Attainment 1 000 1st 0 999 30th Health and Survival 0 980 1st 0 980 1st Political Empowerment 0 443 23rd 0 463 19th
2023 Indicator Rank Score* Difference F-M Min Max Economic Participation and Opportunity 19th 0 784 -Labour-force participation rate % 18th 0 884 -7 28 0-100 Wage equality for similar work 1-7 (best) 88th 0 610Estimated ear ned income int'l $ 1,000 11th 0 830 -1 71 0-150 Legislators, senior officials and managers % 20th 0 772 -12 87 0-100 Professional and technical workers % 1st 1 000 11 98 0-100 Educational Attainment 1st 1.000 -Literacy rate % 1st 1 000Enrolment in primary education % - - -Enrolment in secondary education % - - -Enrolment in tertiary education % 1st 1 000 16 77 0-200 Health and Survival 1st 0 980 -Sex ratio at birth** % 1st 0 944Healthy life expectancy** years 1st 1 060Political Empowerment 23rd 0 443 -Women in parliament % 15th 0 792 -11 60 0-100 Women in ministerial positions % 47th 0 462 -36 84 0-100 Years with female/male head of state (last 50) 20th 0 189 -34 10 0-50 Economy Profile Namibia Score (imparity = 0 parity = 1) 0.802 Rank (out of 146 countries) 8th Index Edition 2023 Compare with Global average 0 1 Female vs Male Min Max62 70 55 4210 02 8 31 56 43 43 57 44 01 55 99-18 78 35 56-55 80 44 20 68 42 31 58 42 05 7 95
Complementary Targets and Contextual Indicators 2023
Global Gender Gap Report 2023 274 Economy Profile Namibia Score 0.802 Rank 8th Page 2 of 2
General indicators Indicator Unit Value GDP US$ billions 12 31 GDP per capita constant '17 intl $ 1000 9 14 Population sex ratio female/male 1 07 Population growth rate % 1 64 Indicator Million people Female Male Value Total population 1 33 1 24 2 57 Work participation and leadership Indicator Unit Value Gender pay gap % (OECD countries only) n a Share of women's membership in boards % (OECD countries only) n a Firms with female majority ownership % firms 25 60 Firms with female top managers % firms 27 40 Share of workers in informal sector % workers 55 80 Indicator 1-7 (best) Value Advancement of women to leadership roles 4 60 Indicator Unit Female Male Value Unemployed adults % of labour force (15-64) 19 56 21 97 20 79 Workers employed part-time % of employed people 30 91 20 28 25 61 Proportion of time spent on unpaid domestic and care work % n a n a n a Indicator Million people Female Male Value Labour-force 0 38 0 38 0 76 Access to finance Indicator 0-1 (Equal rights) Value Access to financial services Near-equal rights
rights for widows and daughters Near-equal rights
to land assets Near-equal rights Access to non-land assets Near-equal rights Civil and political freedom Indicator Unit Value Year women received right to vote year 1989 Number of female heads of state to date number 1 Seats held in upper house % total seats 14 30 Indicator Yes/No Value Election list quotas for women, national Yes Party membership quotas, voluntary Yes Indicator 0-1 (Equal rights) Value Access to justice Near-equal rights Freedom of movement Restricted rights Family and care Indicator Unit Value Public spending on family benefits % GPD n a Unmet family planning % women 15-49 17 50 Early marriage % 5 90 Mean age of women at birth of first child years n a Indicator 0-1 (Equal rights) Value Right to divorce Near-equal rights Indicator Days Female Male Value Length of parental leave 84 00 0 0 Education and skills Graduates Attainment % Female Male Parity STEM Graduates 42 50 57 50 0 74 Agri , Forestry, Fisheries & Veterinary 53 07 46 93 1 13 Arts & Humanities 62 31 37 69 1 65 Business, Admin & Law 66 01 33 99 1 94 Education n a n a n a Engineering, Manuf & Construction 33 92 66 08 0 51 Health & Welfare 79 51 20 49 3 88 Information & Comm Technologies 38 16 61 84 0 62 Natural Sci , Mathematics & Statistics n a n a n a Social Sci , Jour nalism & Information 71 37 28 63 2 49 Vocational training n a n a n a PhD graduates n a n a n a Graduates % Female Male Value Graduates from tertiary education 23 92 10 19 17 15 Health Indicator Unit Value Prevalence of gender violence in lifetime % women 25 00 Births attended by skilled personnel % live births 88 20 Mater nal mortality deaths per 100,000 live births 195 00 Total fertility rate births per woman 3 35 Indicator 0-1 (Equal rights) Value Reproductive autonomy Near-equal rights *Scores
0
1
1 represents the optimal situation
parity
Please see Appendix A and B for detailed methodology, definitions, sources and periods. **For all indicators, except the two health indicators, parity is benchmarked at 1 In the case of sex ratio at birth the gender parity benchmark is set at 0 944 (see Klasen and Wink 2003) In the case of healthy life expectancy the gender parity benchmark is set at 1 06, given women's longer life expectancy
Inheritance
Access
are on a
to
scale, where
or “
”
Global Gender Gap Index Indicators
Global Gender Gap Report 2023 275 Global Gender Gap Index 2023 Edition Nepal score average score 0.476 Economy 0 918 E d u c a t i o n 0.969 Health 0 276 P o i t i c s Overview Index and Subindex 2023 Score Rank 2022 Score Rank Global Gender Gap Index 0 659 116th 0 692 96th Economic Participation and Opportunity 0.476 136th 0 641 98th Educational Attainment 0 918 127th 0 916 125th Health and Survival 0 969 82nd 0 965 109th Political Empowerment 0 276 54th 0 247 58th
2023 Indicator Rank Score* Difference F-M Min Max Economic Participation and Opportunity 136th 0 476 -Labour-force participation rate % 127th 0 508 -27 04 0-100 Wage equality for similar work 1-7 (best) 78th 0 618Estimated ear ned income int'l $ 1,000 130th 0 396 -3 37 0-150 Legislators, senior officials and managers % 132nd 0 152 -73 67 0-100 Professional and technical workers % 107th 0 599 -25 08 0-100 Educational Attainment 127th 0.918 -Literacy rate % 129th 0 782Enrolment in primary education % - - -Enrolment in secondary education % 93rd 0 987 -1 10 0-200 Enrolment in tertiary education % 1st 1 000 1 88 0-200 Health and Survival 82nd 0 969 -Sex ratio at birth** % 1st 0 944Healthy life expectancy** years 93rd 1 024Political Empowerment 54th 0 276 -Women in parliament % 47th 0 495 -33 80 0-100 Women in ministerial positions % 95th 0 188 -68 42 0-100 Years with female/male head of state (last 50) 23rd 0 172 -35 32 0-50 Economy Profile Nepal Score (imparity = 0 parity = 1) 0.659 Rank (out of 146 countries) 116th Index Edition 2023 Compare with Global average 0 1 Female vs Male Min Max54 95 27 915 59 2 22 86 83 13 17 62 54 37 46-86 09 84 98 16 42 18 30-66 90 33 10 84 21 15 79 42 66 7 34
Complementary Targets and Contextual Indicators 2023
Global Gender Gap Report 2023 276 Economy Profile Nepal Score 0.659 Rank 116th Page 2 of 2
General indicators Indicator Unit Value GDP US$ billions 36 29 GDP per capita constant '17 intl $ 1000 3 83 Population sex ratio female/male 1 09 Population growth rate % 2 31 Indicator Million people Female Male Value Total population 15 90 14 65 30 55 Work participation and leadership Indicator Unit Value Gender pay gap % (OECD countries only) n a Share of women's membership in boards % (OECD countries only) n a Firms with female majority ownership % firms 11 70 Firms with female top managers % firms 17 20 Share of workers in informal sector % workers 81 60 Indicator 1-7 (best) Value Advancement of women to leadership roles 4 11 Indicator Unit Female Male Value Unemployed adults % of labour force (15-64) 12 34 10 12 10 99 Workers employed part-time % of employed people 40 26 23 46 29 89 Proportion of time spent on unpaid domestic and care work % n a n a n a Indicator Million people Female Male Value Labour-force 2 55 4 06 6 61 Access to finance Indicator 0-1 (Equal rights) Value Access to financial services Near-equal rights
rights for widows and daughters Near-equal rights
to land assets Near-equal rights Access to non-land assets Near-equal rights Civil and political freedom Indicator Unit Value Year women received right to vote year 1951 Number of female heads of state to date number 1 Seats held in upper house % total seats 37 90 Indicator Yes/No Value Election list quotas for women, national Yes Party membership quotas, voluntary Yes Indicator 0-1 (Equal rights) Value Access to justice Near-equal rights Freedom of movement Equal rights Family and care Indicator Unit Value Public spending on family benefits % GPD n a Unmet family planning % women 15-49 24 72 Early marriage % 24 50 Mean age of women at birth of first child years n a Indicator 0-1 (Equal rights) Value Right to divorce Unequal rights Indicator Days Female Male Value Length of parental leave 98 00 21 00 0 Education and skills Graduates Attainment % Female Male Parity STEM Graduates n a n a n a Agri , Forestry, Fisheries & Veterinary 33 33 66 67 0 50 Arts & Humanities 46 33 53 67 0 86 Business, Admin & Law n a n a n a Education n a n a n a Engineering, Manuf & Construction 13 95 86 05 0 16 Health & Welfare 56 98 43 02 1 32 Information & Comm Technologies n a n a n a Natural Sci , Mathematics & Statistics n a n a n a Social Sci , Jour nalism & Information n a n a n a Vocational training n a n a n a PhD graduates n a n a n a Graduates % Female Male Value Graduates from tertiary education n a n a n a Health Indicator Unit Value Prevalence of gender violence in lifetime % women 25 00 Births attended by skilled personnel % live births 77 20 Mater nal mortality deaths per 100,000 live births 186 00 Total fertility rate births per woman 2 06 Indicator 0-1 (Equal rights) Value Reproductive autonomy Equal rights *Scores
0 to 1 scale, where 1 represents the optimal situation
parity
Please see Appendix A and B for detailed methodology, definitions, sources and periods. **For all indicators, except the two health indicators, parity is benchmarked at 1 In the case of sex ratio at birth the gender parity benchmark is set at 0 944 (see Klasen and Wink 2003) In the case of healthy life expectancy the gender parity benchmark is set at 1 06, given women's longer life expectancy
Inheritance
Access
are on a
or “
”
Global Gender Gap Index Indicators
Global Gender Gap Report 2023 277 Global Gender Gap Index 2023 Edition Netherlands score average score 0.684 Economy 1 000 E d u c a t i o n 0.962 Health 0 460 P o i t i c s Overview Index and Subindex 2023 Score Rank 2022 Score Rank Global Gender Gap Index 0 777 28th 0 767 28th Economic Participation and Opportunity 0.684 77th 0 675 79th Educational Attainment 1 000 1st 1 000 1st Health and Survival 0 962 124th 0 962 127th Political Empowerment 0 460 21st 0 432 23rd
2023 Indicator Rank Score* Difference F-M Min Max Economic Participation and Opportunity 77th 0 684 -Labour-force participation rate % 22nd 0 881 -8 45 0-100 Wage equality for similar work 1-7 (best) 58th 0 654Estimated ear ned income int'l $ 1,000 90th 0 611 -27 34 0-150 Legislators, senior officials and managers % 106th 0 350 -48 10 0-100 Professional and technical workers % 71st 0 981 -0 97 0-100 Educational Attainment 1st 1.000 -Literacy rate % 1st 1 000Enrolment in primary education % 1st 1 000 0 86 0-100 Enrolment in secondary education % 1st 1 000 1 80 0-200 Enrolment in tertiary education % 1st 1 000 13 90 0-200 Health and Survival 124th 0 962 -Sex ratio at birth** % 1st 0 944Healthy life expectancy** years 134th 1 002Political Empowerment 21st 0 460 -Women in parliament % 24th 0 686 -18 60 0-100 Women in ministerial positions % 1st 1 000 0 0-100 Years with female/male head of state (last 50) 80th 0 000 -50 00 0-50 Economy Profile Netherlands Score (imparity = 0 parity = 1) 0.777 Rank (out of 146 countries) 28th Index Edition 2023 Compare with Global average 0 1 Female vs Male Min Max71 23 62 7870 37 43 03 74 05 25 95 50 48 49 5298 61 99 47 114 29 116 09 85 23 99 13-59 30 40 70 50 00 50 00 50 00 0
Complementary Targets and Contextual Indicators 2023
Global Gender Gap Report 2023 278 Economy Profile Netherlands Score 0.777 Rank 28th Page 2 of 2
General indicators Indicator Unit Value GDP US$ billions 1,012 85 GDP per capita constant '17 intl $ 1000 56 62 Population sex ratio female/male 1 01 Population growth rate % 0 52 Indicator Million people Female Male Value Total population 8 83 8 73 17 56 Work participation and leadership Indicator Unit Value Gender pay gap % (OECD countries only) 13 33 Share of women's membership in boards % (OECD countries only) 38 10 Firms with female majority ownership % firms 5 00 Firms with female top managers % firms 13 70 Share of workers in informal sector % workers 11 80 Indicator 1-7 (best) Value Advancement of women to leadership roles 5 25 Indicator Unit Female Male Value Unemployed adults % of labour force (15-64) 3 80 3 20 3 50 Workers employed part-time % of employed people 77 68 45 61 60 71 Proportion of time spent on unpaid domestic and care work % n a n a n a Indicator Million people Female Male Value Labour-force 3 83 4 36 8 18 Access to finance Indicator 0-1 (Equal rights) Value Access to financial services Equal rights Inheritance rights for widows and daughters Equal rights Access to land assets Equal rights Access to non-land assets Equal rights Civil and political freedom Indicator Unit Value Year women received right to vote year 1919 Number of female heads of state to date number 0 Seats held in upper house % total seats 32 00 Indicator Yes/No Value Election list quotas for women, national Yes Party membership quotas, voluntary Yes Indicator 0-1 (Equal rights) Value Access to justice Equal rights Freedom of movement Equal rights Family and care Indicator Unit Value Public spending on family benefits % GPD 1 57 Unmet family planning % women 15-49 n a Early marriage % 0 10 Mean age of women at birth of first child years 30 20 Indicator 0-1 (Equal rights) Value Right to divorce Near-equal rights Indicator Days Female Male Value Length of parental leave 112 00 42 00 0 Education and skills Graduates Attainment % Female Male Parity STEM Graduates n a n a n a Agri , Forestry, Fisheries & Veterinary n a n a n a Arts & Humanities 54 42 45 58 1 19 Business, Admin & Law 47 34 52 66 0 90 Education n a n a n a Engineering, Manuf & Construction 23 06 76 94 0 30 Health & Welfare n a n a n a Information & Comm Technologies n a n a n a Natural Sci , Mathematics & Statistics 43 75 56 25 0 78 Social Sci , Jour nalism & Information 68 17 31 83 2 14 Vocational training 22 65 24 22 0 94 PhD graduates 0 56 0 86 0 71 Graduates % Female Male Value Graduates from tertiary education 59 74 44 74 52 06 Health Indicator Unit Value Prevalence of gender violence in lifetime % women 25 00 Births attended by skilled personnel % live births n a Mater nal mortality deaths per 100,000 live births 5 00 Total fertility rate births per woman 1 55 Indicator 0-1 (Equal rights) Value Reproductive autonomy Equal rights *Scores are on a 0 to 1 scale, where 1 represents the optimal situation or “parity” Please see Appendix A and B for detailed methodology, definitions, sources and periods. **For all indicators, except the two health indicators, parity is benchmarked at 1 In the case of sex ratio at birth the gender parity benchmark is set at 0 944 (see Klasen and Wink 2003) In the case of healthy life expectancy the gender parity benchmark is set at 1 06, given women's longer life expectancy
Global Gender Gap Index Indicators
Global Gender Gap Report 2023 279 Global Gender Gap Index 2023 Edition New Zealand score average score 0.732 Economy 1 000 E d u c a t i o n 0.966 Health 0 725 P o i t i c s Overview Index and Subindex 2023 Score Rank 2022 Score Rank Global Gender Gap Index 0 856 4th 0 841 4th Economic Participation and Opportunity 0.732 42nd 0 738 39th Educational Attainment 1 000 1st 1 000 1st Health and Survival 0 966 101st 0 966 100th Political Empowerment 0 725 3rd 0 660 4th
2023 Indicator Rank Score* Difference F-M Min Max Economic Participation and Opportunity 42nd 0 732 -Labour-force participation rate % 25th 0 875 -9 48 0-100 Wage equality for similar work 1-7 (best) 37th 0 704Estimated ear ned income int'l $ 1,000 73rd 0 642 -18 75 0-150 Legislators, senior officials and managers % - - -Professional and technical workers % - - -Educational Attainment 1st 1.000 -Literacy rate % 1st 1 000Enrolment in primary education % 1st 1 000 0 75 0-100 Enrolment in secondary education % 1st 1 000 5 87 0-200 Enrolment in tertiary education % 1st 1 000 34 04 0-200 Health and Survival 101st 0 966 -Sex ratio at birth** % 1st 0 944Healthy life expectancy** years 109th 1 017Political Empowerment 3rd 0 725 -Women in parliament % 1st 1 000 0 0-100 Women in ministerial positions % 18th 0 818 -10 00 0-100 Years with female/male head of state (last 50) 6th 0 480 -17 58 0-50 Economy Profile New Zealand Score (imparity = 0 parity = 1) 0.856 Rank (out of 146 countries) 4th Index Edition 2023 Compare with Global average 0 1 Female vs Male Min Max75 59 66 1152 37 33 62-98 68 99 43 117 52 123 39 63 26 97 29-50 00 50 00 55 00 45 00 33 79 16 21
Complementary Targets and Contextual Indicators 2023
Global Gender Gap Report 2023 280 Economy Profile New Zealand Score 0.856 Rank 4th Page 2 of 2
General indicators Indicator Unit Value GDP US$ billions 249 89 GDP per capita constant '17 intl $ 1000 42 92 Population sex ratio female/male 1 02 Population growth rate % 0 63 Indicator Million people Female Male Value Total population 2 62 2 57 5 18 Work participation and leadership Indicator Unit Value Gender pay gap % (OECD countries only) 6 67 Share of women's membership in boards % (OECD countries only) 43 50 Firms with female majority ownership % firms n a Firms with female top managers % firms n a Share of workers in informal sector % workers n a Indicator 1-7 (best) Value Advancement of women to leadership roles 5 62 Indicator Unit Female Male Value Unemployed adults % of labour force (15-64) 3 69 3 25 3 46 Workers employed part-time % of employed people 51 43 27 82 39 10 Proportion of time spent on unpaid domestic and care work % n a n a n a Indicator Million people Female Male Value Labour-force 1 19 1 32 2 50 Access to finance Indicator 0-1 (Equal rights) Value Access to financial services Equal rights Inheritance rights for widows and daughters Equal rights Access to land assets Equal rights Access to non-land assets Equal rights Civil and political freedom Indicator Unit Value Year women received right to vote year 1886, 1893 Number of female heads of state to date number 3 Seats held in upper house % total seats n a Indicator Yes/No Value Election list quotas for women, national n a Party membership quotas, voluntary Yes Indicator 0-1 (Equal rights) Value Access to justice Equal rights Freedom of movement Equal rights Family and care Indicator Unit Value Public spending on family benefits % GPD 2 78 Unmet family planning % women 15-49 n a Early marriage % 0 80 Mean age of women at birth of first child years n a Indicator 0-1 (Equal rights) Value Right to divorce Equal rights Indicator Days Female Male Value Length of parental leave 0 0 182 00 Education and skills Graduates Attainment % Female Male Parity STEM Graduates 34 96 65 04 0 54 Agri , Forestry, Fisheries & Veterinary n a n a n a Arts & Humanities 60 24 39 76 1 51 Business, Admin & Law 54 12 45 88 1 18 Education n a n a n a Engineering, Manuf & Construction n a n a n a Health & Welfare 79 92 20 08 3 98 Information & Comm Technologies n a n a n a Natural Sci , Mathematics & Statistics 55 67 44 33 1 26 Social Sci , Jour nalism & Information n a n a n a Vocational training 10 30 17 95 0 57 PhD graduates 0 96 1 30 1 12 Graduates % Female Male Value Graduates from tertiary education 54 97 31 75 43 09 Health Indicator Unit Value Prevalence of gender violence in lifetime % women 35 00 Births attended by skilled personnel % live births 96 40 Mater nal mortality deaths per 100,000 live births 9 00 Total fertility rate births per woman 1 61 Indicator 0-1 (Equal rights) Value Reproductive autonomy Near-equal rights
benchmarked
sex ratio
birth
gender parity benchmark is set at 0 944 (see Klasen and Wink 2003) In the case of
life expectancy
gender parity benchmark
set
06,
women's longer life expectancy
*Scores are on a 0 to 1 scale, where 1 represents the optimal situation or “parity” Please see Appendix A and B for detailed methodology, definitions, sources and periods. **For all indicators, except the two health indicators, parity is
at 1 In the case of
at
the
healthy
the
is
at 1
given
Global Gender Gap Index Indicators
Global Gender Gap Report 2023 281 Global Gender Gap Index 2023 Edition Nicaragua score average score 0.640 Economy 1 000 E d u c a t i o n 0.978 Health 0 626 P o i t i c s Overview Index and Subindex 2023 Score Rank 2022 Score Rank Global Gender Gap Index 0 811 7th 0 810 7th Economic Participation and Opportunity 0.640 98th 0 637 100th Educational Attainment 1 000 1st 1 000 1st Health and Survival 0 978 34th 0 978 36th Political Empowerment 0 626 6th 0 626 5th
2023 Indicator Rank Score* Difference F-M Min Max Economic Participation and Opportunity 98th 0 640 -Labour-force participation rate % 124th 0 577 -35 29 0-100 Wage equality for similar work 1-7 (best) 112th 0 547Estimated ear ned income int'l $ 1,000 46th 0 694 -2 04 0-150 Legislators, senior officials and managers % 71st 0 543 -29 59 0-100 Professional and technical workers % 1st 1 000 9 12 0-100 Educational Attainment 1st 1.000 -Literacy rate % 1st 1 000Enrolment in primary education % - - -Enrolment in secondary education % - - -Enrolment in tertiary education % 1st 1 000 6 07 0-200 Health and Survival 34th 0 978 -Sex ratio at birth** % 1st 0 944Healthy life expectancy** years 45th 1 056Political Empowerment 6th 0 626 -Women in parliament % 1st 1 000 3 40 0-100 Women in ministerial positions % 1st 1 000 25 00 0-100 Years with female/male head of state (last 50) 26th 0 155 -36 56 0-50 Economy Profile Nicara ua Score (imparity = 0 parity = 1) 0.811 Rank (out of 146 countries) 7th Index Edition 2023 Compare with Global average 0 1 Female vs Male Min Max83 34 48 056 68 4 63 64 79 35 21 45 44 54 56-16 12 22 19-48 30 51 70 37 50 62 50 43 28 6 72
Complementary Targets and Contextual Indicators 2023
Family
Indicator
Public
Unmet
Graduates Attainment
Agri
Business, Admin & Law
Information & Comm Technologies
Natural Sci , Mathematics & Statistics
Social Sci , Jour nalism & Information
Vocational training
Indicator Unit
*Scores are on a 0 to 1 scale, where 1 represents the optimal situation or “parity” Please see Appendix A and B for detailed methodology, definitions, sources and periods. **For all indicators, except the two health indicators, parity is benchmarked at 1 In the case of
Global Gender Gap Report 2023 282 Economy Profile Nicaragua Score 0.811 Rank 7th Page 2 of 2
General indicators Indicator Unit Value GDP US$ billions 14 01 GDP per capita constant '17 intl $ 1000 5 64 Population sex ratio female/male 1 03 Population growth rate % 1 39 Indicator Million people Female Male Value Total population 3 52 3 42 6 95 Work participation and leadership Indicator Unit Value Gender pay gap % (OECD countries only) n a Share of women's membership in boards % (OECD countries only) n a Firms with female majority ownership % firms 26 80 Firms with female top managers % firms 27 00 Share of workers in informal sector % workers n a Indicator 1-7 (best) Value Advancement of women to leadership roles 4 16 Indicator Unit Female Male Value Unemployed adults % of labour force (15-64) 5 76 4 05 4 72 Workers employed part-time % of employed people n a n a n a Proportion of time spent on unpaid domestic and care work % n a n a n a Indicator Million people Female Male Value Labour-force 0 86 1 26 2 12 Access to finance Indicator 0-1 (Equal rights) Value Access to financial services Near-equal rights Inheritance rights for widows and daughters Equal rights
to land assets Near-equal rights
to non-land assets Equal rights Civil and political freedom Indicator Unit Value Year women received right to vote year n a Number of female heads of state to date number 1 Seats held in upper house % total seats n a Indicator Yes/No Value Election list quotas for women, national Yes Party membership quotas, voluntary Yes Indicator 0-1 (Equal rights) Value
to justice Equal rights Freedom of movement Equal rights
Access
Access
Access
and care
Unit Value
spending on family benefits % GPD n a
% women 15-49 n a
marriage % 30 40
first child years n a
Value
Equal rights
Female Male Value
84 00 7 00 0
family planning
Early
Mean age of women at birth of
Indicator 0-1 (Equal rights)
Right to divorce
Indicator Days
Length of parental leave
Education and skills
% Female Male Parity STEM Graduates n a n a n a
n a n a n a
n a n a n a
, Forestry, Fisheries & Veterinary
Arts & Humanities
n a n a n a Education n a n a n a
n a n a n a Health
n a n a n a
n a n a n a
Engineering, Manuf & Construction
& Welfare
n a n a n a
n a n a n a
n a n a n a
n a n a n a
Female Male Value
PhD graduates
Graduates %
n a n a n a
Graduates from tertiary education
Health
Value
in lifetime % women 22 50 Births attended by skilled personnel % live births 94 10 Mater nal mortality deaths per 100,000 live births 98 00 Total fertility rate births per woman 2 35
Value
Unequal rights
gender parity benchmark
set
0 944
2003)
case of
gender parity
life expectancy
Prevalence of gender violence
Indicator 0-1 (Equal rights)
Reproductive autonomy
sex ratio at birth the
is
at
(see Klasen and Wink
In the
healthy life expectancy the
benchmark is set at 1 06, given women's longer
Global Gender Gap Index Indicators
Global Gender Gap Report 2023 283 Global Gender Gap Index 2023 Edition Niger score average score 0.570 Economy 0 769 E d u c a t i o n 0.964 Health 0 185 P o i t i c s Overview Index and Subindex 2023 Score Rank 2022 Score Rank Global Gender Gap Index 0 622 135th 0 635 128th Economic Participation and Opportunity 0.570 121st 0 672 82nd Educational Attainment 0 769 141st 0 750 141st Health and Survival 0 964 113th 0 964 115th Political Empowerment 0 185 79th 0 155 96th
2023 Indicator Rank Score* Difference F-M Min Max Economic Participation and Opportunity 121st 0 570 -Labour-force participation rate % 138th 0 381 -24 50 0-100 Wage equality for similar work 1-7 (best) - - -Estimated ear ned income int'l $ 1,000 105th 0 558 -0 67 0-150 Legislators, senior officials and managers % 12th 0 973 -1 38 0-100 Professional and technical workers % 129th 0 406 -42 27 0-100 Educational Attainment 141st 0.769 -Literacy rate % 139th 0 632Enrolment in primary education % 106th 0 912 -5 32 0-100 Enrolment in secondary education % 136th 0 748 -6 98 0-200 Enrolment in tertiary education % 133rd 0 481 -3 04 0-200 Health and Survival 113th 0 964 -Sex ratio at birth** % 1st 0 944Healthy life expectancy** years 122nd 1 010Political Empowerment 79th 0 185 -Women in parliament % 50th 0 443 -38 60 0-100 Women in ministerial positions % 93rd 0 192 -67 74 0-100 Years with female/male head of state (last 50) 80th 0 000 -50 00 0-50 Economy Profile Niger Score (imparity = 0 parity = 1) 0.622 Rank (out of 146 countries) 135th Index Edition 2023 Compare with Global average 0 1 Female vs Male Min Max39 56 15 061 52 0 85 50 69 49 31 71 13 28 8760 36 55 04 27 68 20 70 5 87 2 82-69 30 30 70 83 87 16 13 50 00 0
Complementary Targets and Contextual Indicators 2023
Global Gender Gap Report 2023 284 Economy Profile Niger Score 0.622 Rank 135th Page 2 of 2
General indicators Indicator Unit Value GDP US$ billions 14 91 GDP per capita constant '17 intl $ 1000 1 19 Population sex ratio female/male 0 97 Population growth rate % 3 71 Indicator Million people Female Male Value Total population 12 91 13 29 26 21 Work participation and leadership Indicator Unit Value Gender pay gap % (OECD countries only) n a Share of women's membership in boards % (OECD countries only) n a Firms with female majority ownership % firms 8 90 Firms with female top managers % firms 10 60 Share of workers in informal sector % workers 73 60 Indicator 1-7 (best) Value Advancement of women to leadership roles n a Indicator Unit Female Male Value Unemployed adults % of labour force (15-64) 8 08 8 13 8 12 Workers employed part-time % of employed people 45 26 27 93 33 19 Proportion of time spent on unpaid domestic and care work % n a n a n a Indicator Million people Female Male Value Labour-force 0 57 1 38 1 95 Access to finance Indicator 0-1 (Equal rights) Value Access to financial services Unequal rights Inheritance rights for widows and daughters Unequal rights Access to land assets Near-equal rights Access to non-land assets Restricted rights Civil and political freedom Indicator Unit Value Year women received right to vote year 1960 Number of female heads of state to date number 0 Seats held in upper house % total seats n a Indicator Yes/No Value Election list quotas for women, national Yes Party membership quotas, voluntary Yes Indicator 0-1 (Equal rights) Value Access to justice Restricted rights Freedom of movement Equal rights Family and care Indicator Unit Value Public spending on family benefits % GPD n a Unmet family planning % women 15-49 19 70 Early marriage % 61 90 Mean age of women at birth of first child years n a Indicator 0-1 (Equal rights) Value Right to divorce Unequal rights Indicator Days Female Male Value Length of parental leave 98 00 1 00 0 Education and skills Graduates Attainment % Female Male Parity STEM Graduates 18 03 81 97 0 22 Agri , Forestry, Fisheries & Veterinary 18 72 81 28 0 23 Arts & Humanities 52 66 47 34 1 11 Business, Admin & Law n a n a n a Education 51 99 48 01 1 08 Engineering, Manuf & Construction 7 45 92 55 0 08 Health & Welfare 31 35 68 65 0 46 Information & Comm Technologies 22 80 77 20 0 30 Natural Sci , Mathematics & Statistics 20 68 79 32 0 26 Social Sci , Jour nalism & Information n a n a n a Vocational training 0 92 1 00 0 92 PhD graduates n a n a n a Graduates % Female Male Value Graduates from tertiary education 2 54 5 84 4 22 Health Indicator Unit Value Prevalence of gender violence in lifetime % women n a Births attended by skilled personnel % live births 43 60 Mater nal mortality deaths per 100,000 live births 509 00 Total fertility rate births per woman 6 89 Indicator 0-1 (Equal rights) Value Reproductive autonomy Restricted rights *Scores
0
optimal situation
parity
Appendix A
B for detailed methodology, definitions, sources
periods. **For all indicators, except the two health indicators, parity is benchmarked at 1 In the case of sex ratio at birth the gender parity benchmark is set at 0 944 (see Klasen and Wink 2003) In the case of healthy life expectancy the gender parity benchmark is set at 1 06, given women's longer life expectancy
are on a
to 1 scale, where 1 represents the
or “
” Please see
and
and
Global Gender Gap Index Indicators
Global Gender Gap Report 2023 285 Global Gender Gap Index 2023 Edition Nigeria score average score 0.715 Economy 0 826 E d u c a t i o n 0.967 Health 0 041 P o i t i c s Overview Index and Subindex 2023 Score Rank 2022 Score Rank Global Gender Gap Index 0 637 130th 0 639 123rd Economic Participation and Opportunity 0.715 54th 0 724 50th Educational Attainment 0 826 137th 0 826 134th Health and Survival 0 967 99th 0 967 97th Political Empowerment 0 041 142nd 0 040 141st
2023 Indicator Rank Score* Difference F-M Min Max Economic Participation and Opportunity 54th 0 715 -Labour-force participation rate % 67th 0 793 -13 58 0-100 Wage equality for similar work 1-7 (best) 31st 0 714Estimated ear ned income int'l $ 1,000 117th 0 503 -3 24 0-150 Legislators, senior officials and managers % 1st 1 000 28 85 0-100 Professional and technical workers % 104th 0 628 -22 89 0-100 Educational Attainment 137th 0.826 -Literacy rate % 132nd 0 739Enrolment in primary education % - - -Enrolment in secondary education % 119th 0 952 -2 16 0-200 Enrolment in tertiary education % 125th 0 724 -3 87 0-200 Health and Survival 99th 0 967 -Sex ratio at birth** % 1st 0 944Healthy life expectancy** years 107th 1 018Political Empowerment 142nd 0 041 -Women in parliament % 141st 0 037 -92 80 0-100 Women in ministerial positions % 119th 0 120 -78 57 0-100 Years with female/male head of state (last 50) 80th 0 000 -50 00 0-50 Economy Profile Nigeria Score (imparity = 0 parity = 1) 0.637 Rank (out of 146 countries) 130th Index Edition 2023 Compare with Global average 0 1 Female vs Male Min Max65 72 52 146 53 3 28 35 57 64 43 61 44 38 56-44 57 42 41 14 01 10 14-96 40 3 60 89 29 10 71 50 00 0
Complementary Targets and Contextual Indicators 2023
Inheritance
Agri , Forestry, Fisheries & Veterinary
Global Gender Gap Report 2023 286 Economy Profile Nigeria Score 0.637 Rank 130th Page 2 of 2
General indicators Indicator Unit Value GDP US$ billions 440 83 GDP per capita constant '17 intl $ 1000 4 92 Population sex ratio female/male 0 98 Population growth rate % 2 41 Indicator Million people Female Male Value Total population 108 09 110 45 218 54 Work participation and leadership Indicator Unit Value Gender pay gap % (OECD countries only) n a Share of women's membership in boards % (OECD countries only) n a Firms with female majority ownership % firms 13 20 Firms with female top managers % firms 13 90 Share of workers in informal sector % workers n a Indicator 1-7 (best) Value Advancement of women to leadership roles 4 35 Indicator Unit Female Male Value Unemployed adults % of labour force (15-64) 13 28 9 93 11 44 Workers employed part-time % of employed people 36 83 28 04 31 89 Proportion of time spent on unpaid domestic and care work % n a n a n a Indicator Million people Female Male Value Labour-force 28 66 35 77 64 43 Access to finance Indicator 0-1 (Equal rights) Value
to financial services Near-equal rights
Access
rights for widows and daughters Restricted rights
to land assets Near-equal rights
to non-land assets Uneven rights Civil and political freedom Indicator Unit Value Year women received right to vote year 1960 Number of female heads of state to date number 0 Seats held in upper house % total seats 7 30 Indicator Yes/No Value Election list quotas for women, national n a Party membership quotas, voluntary n a Indicator 0-1 (Equal rights) Value Access to justice Near-equal rights Freedom of movement Restricted rights
and care
Unit Value
spending on family benefits % GPD n a Unmet family planning % women 15-49 18 90 Early marriage % 30 40 Mean age of women at birth of first child years n a Indicator 0-1 (Equal rights) Value Right to divorce Uneven rights Indicator Days Female Male Value Length of parental leave 84 00 0 0 Education and skills
Attainment % Female Male Parity STEM Graduates n a n a n a
Access
Access
Family
Indicator
Public
Graduates
n a n a n a Arts
n a n a n a
n a n a n a Education n a n a n a Engineering, Manuf & Construction n a n a n a Health & Welfare n a n a n a
n a n a n a
n a n a n a
n a n a n a
n a n a n a PhD graduates n a n a n a Graduates % Female Male Value
from tertiary education n a n a n a Health
Unit Value Prevalence of gender violence in lifetime % women 16 20 Births attended by skilled personnel % live births 43 30 Mater nal mortality deaths per 100,000 live births 917 00 Total fertility rate births per woman 5 31 Indicator 0-1 (Equal rights) Value Reproductive autonomy Restricted rights
de
**For
except the two health indicators, parity is benchmarked at 1 In the case of sex ratio at birth the gender parity benchmark is set at 0 944 (see Klasen and Wink 2003) In the case of healthy life expectancy the gender parity benchmark is set at 1 06, given women's longer life expectancy
& Humanities
Business, Admin & Law
Information & Comm Technologies
Natural Sci , Mathematics & Statistics
Social Sci , Jour nalism & Information
Vocational training
Graduates
Indicator
*Scores are on a 0 to 1 scale, where 1 represents the optimal situation or “parity” Please see Appendix A and B for detailed methodology,
finitions, sources and periods.
all indicators,
North Macedonia
Global Gender Gap Index Indicators
Global Gender Gap Report 2023 287 Global Gender Gap Index 2023 Edition North Macedonia score average score 0.605 Economy 0 997 E d u c a t i o n 0.960 Health 0 283 P o i t i c s Overview Index and Subindex 2023 Score Rank 2022 Score Rank Global Gender Gap Index 0 711 73rd 0 716 69th Economic Participation and Opportunity 0.605 108th 0 613 106th Educational Attainment 0 997 48th 0 990 76th Health and Survival 0 960 134th 0 972 73rd Political Empowerment 0 283 51st 0 289 47th
2023 Indicator Rank Score* Difference F-M Min Max Economic Participation and Opportunity 108th 0 605 -Labour-force participation rate % 109th 0 655 -22 60 0-100 Wage equality for similar work 1-7 (best) 105th 0 573Estimated ear ned income int'l $ 1,000 91st 0 608 -8 03 0-150 Legislators, senior officials and managers % 115th 0 275 -56 86 0-100 Professional and technical workers % 1st 1 000 5 78 0-100 Educational Attainment 48th 0.997 -Literacy rate % 1st 1 000Enrolment in primary education % 1st 1 000 0 02 0-100 Enrolment in secondary education % 92nd 0 987 -1 02 0-200 Enrolment in tertiary education % 1st 1 000 14 66 0-200 Health and Survival 134th 0 960 -Sex ratio at birth** % 140th 0 927Healthy life expectancy** years 78th 1 034Political Empowerment 51st 0 283 -Women in parliament % 19th 0 739 -15 00 0-100 Women in ministerial positions % 81st 0 214 -64 71 0-100 Years with female/male head of state (last 50) 74th 0 003 -49 73 0-50 Economy Profile
Score (imparity = 0 parity = 1) 0.711 Rank (out of 146 countries) 73rd Index Edition 2023 Compare with Global average 0 1 Female vs Male Min Max65 48 42 8820 49 12 46 78 43 21 57 47 11 52 8995 17 95 19 80 09 79 07 35 90 50 56-57 50 42 50 82 35 17 65 49 86 0 14
Complementary Targets and Contextual Indicators 2023
Global Gender Gap Report 2023 288 Economy Profile North Macedonia Score 0.711 Rank 73rd Page 2 of 2
General indicators Indicator Unit Value GDP US$ billions 13 83 GDP per capita constant '17 intl $ 1000 16 46 Population sex ratio female/male 1 01 Population growth rate % -0 36 Indicator Million people Female Male Value Total population 1 05 1 04 2 09 Work participation and leadership Indicator Unit Value Gender pay gap % (OECD countries only) n a Share of women's membership in boards % (OECD countries only) n a Firms with female majority ownership % firms 19 60 Firms with female top managers % firms 21 30 Share of workers in informal sector % workers 10 10 Indicator 1-7 (best) Value Advancement of women to leadership roles 3 76 Indicator Unit Female Male Value Unemployed adults % of labour force (15-64) 12 63 15 96 14 60 Workers employed part-time % of employed people 18 60 13 42 15 51 Proportion of time spent on unpaid domestic and care work % 15 42 5 42 n a Indicator Million people Female Male Value Labour-force 0 31 0 44 0 75 Access to finance Indicator 0-1 (Equal rights) Value Access to financial services Equal rights Inheritance rights for widows and daughters Near-equal rights Access to land assets Near-equal rights Access to non-land assets Equal rights Civil and political freedom Indicator Unit Value Year women received right to vote year n a Number of female heads of state to date number 1 Seats held in upper house % total seats n a Indicator Yes/No Value Election list quotas for women, national n a Party membership quotas, voluntary n a Indicator 0-1 (Equal rights) Value Access to justice Near-equal rights Freedom of movement Equal rights Family and care Indicator Unit Value Public spending on family benefits % GPD n a Unmet family planning % women 15-49 10 28 Early marriage % 4 30 Mean age of women at birth of first child years 26 90 Indicator 0-1 (Equal rights) Value Right to divorce Equal rights Indicator Days Female Male Value Length of parental leave 270 00 2 00 0 Education and skills Graduates Attainment % Female Male Parity STEM Graduates n a n a n a Agri , Forestry, Fisheries & Veterinary 39 49 60 51 0 65 Arts & Humanities n a n a n a Business, Admin & Law n a n a n a Education 78 09 21 91 3 56 Engineering, Manuf & Construction n a n a n a Health & Welfare 74 13 25 87 2 87 Information & Comm Technologies 35 09 64 91 0 54 Natural Sci , Mathematics & Statistics n a n a n a Social Sci , Jour nalism & Information 61 44 38 56 1 59 Vocational training n a n a n a PhD graduates 0 22 0 29 0 25 Graduates % Female Male Value Graduates from tertiary education 30 61 20 10 25 20 Health Indicator Unit Value Prevalence of gender violence in lifetime % women 27 70 Births attended by skilled personnel % live births 100 00 Mater nal mortality deaths per 100,000 live births 7 00 Total fertility rate births per woman 1 30 Indicator 0-1 (Equal rights) Value Reproductive autonomy Equal rights *Scores
0
1
optimal situation
parity
see Appendix A and B for detailed methodology, definitions, sources and periods. **For all indicators, except the two health indicators, parity is benchmarked at 1 In the case of sex ratio at birth the gender parity benchmark is set at 0 944 (see Klasen and Wink 2003) In the case of healthy life expectancy the gender parity benchmark is set at 1 06, given women's longer life expectancy
are on a
to
scale, where 1 represents the
or “
” Please
Global Gender Gap Index Indicators
Global Gender Gap Report 2023 289 Global Gender Gap Index 2023 Edition Norway score average score 0.800 Economy 0 989 E d u c a t i o n 0.961 Health 0 765 P o i t i c s Overview Index and Subindex 2023 Score Rank 2022 Score Rank Global Gender Gap Index 0 879 2nd 0 845 3rd Economic Participation and Opportunity 0.800 11th 0 765 27th Educational Attainment 0 989 84th 0 989 79th Health and Survival 0 961 127th 0 964 119th Political Empowerment 0 765 2nd 0 662 3rd
2023 Indicator Rank Score* Difference F-M Min Max Economic Participation and Opportunity 11th 0 800 -Labour-force participation rate % 43rd 0 845 -11 21 0-100 Wage equality for similar work 1-7 (best) - - -Estimated ear ned income int'l $ 1,000 6th 0 851 -10 59 0-150 Legislators, senior officials and managers % 81st 0 503 -33 06 0-100 Professional and technical workers % 1st 1 000 5 11 0-100 Educational Attainment 84th 0.989 -Literacy rate % 1st 1 000Enrolment in primary education % 67th 0 999 -0 07 0-100 Enrolment in secondary education % 120th 0 951 -5 91 0-200 Enrolment in tertiary education % 1st 1 000 33 57 0-200 Health and Survival 127th 0 961 -Sex ratio at birth** % 117th 0 941Healthy life expectancy** years 126th 1 008Political Empowerment 2nd 0 765 -Women in parliament % 10th 0 859 -7 60 0-100 Women in ministerial positions % 1st 1 000 0 0-100 Years with female/male head of state (last 50) 4th 0 567 -13 80 0-50 Economy Profile Norway Score (imparity = 0 parity = 1) 0.879 Rank (out of 146 countries) 2nd Index Edition 2023 Compare with Global average 0 1 Female vs Male Min Max72 24 61 0370 91 60 32 66 53 33 47 47 44 52 5699 95 99 88 121 86 115 95 68 20 101 77-53 80 46 20 50 00 50 00 31 90 18 10
Complementary Targets and Contextual Indicators 2023
Global Gender Gap Report 2023 290 Economy Profile Norway Score 0.879 Rank 2nd Page 2 of 2
General indicators Indicator Unit Value GDP US$ billions 482 17 GDP per capita constant '17 intl $ 1000 65 66 Population sex ratio female/male 0 98 Population growth rate % 0 53 Indicator Million people Female Male Value Total population 2 69 2 74 5 43 Work participation and leadership Indicator Unit Value Gender pay gap % (OECD countries only) 4 60 Share of women's membership in boards % (OECD countries only) 41 50 Firms with female majority ownership % firms n a Firms with female top managers % firms n a Share of workers in informal sector % workers 4 90 Indicator 1-7 (best) Value Advancement of women to leadership roles 5 69 Indicator Unit Female Male Value Unemployed adults % of labour force (15-64) 3 20 3 50 3 30 Workers employed part-time % of employed people 57 76 41 09 48 94 Proportion of time spent on unpaid domestic and care work % n a n a n a Indicator Million people Female Male Value Labour-force 1 18 1 36 2 54 Access to finance Indicator 0-1 (Equal rights) Value Access to financial services Equal rights Inheritance rights for widows and daughters Equal rights Access to land assets Equal rights Access to non-land assets Equal rights Civil and political freedom Indicator Unit Value Year women received right to vote year n a Number of female heads of state to date number 3 Seats held in upper house % total seats n a Indicator Yes/No Value Election list quotas for women, national Yes Party membership quotas, voluntary Yes Indicator 0-1 (Equal rights) Value Access to justice Equal rights Freedom of movement Equal rights Family and care Indicator Unit Value Public spending on family benefits % GPD 3 19 Unmet family planning % women 15-49 n a Early marriage % 0 10 Mean age of women at birth of first child years 29 80 Indicator 0-1 (Equal rights) Value Right to divorce Near-equal rights Indicator Days Female Male Value Length of parental leave 0 0 112 00 Education and skills Graduates Attainment % Female Male Parity STEM Graduates 28 46 71 54 0 40 Agri , Forestry, Fisheries & Veterinary 55 61 44 39 1 25 Arts & Humanities 58 59 41 41 1 42 Business, Admin & Law n a n a n a Education n a n a n a Engineering, Manuf & Construction 23 89 76 11 0 31 Health & Welfare 82 75 17 25 4 80 Information & Comm Technologies 15 16 84 84 0 18 Natural Sci , Mathematics & Statistics 51 48 48 52 1 06 Social Sci , Jour nalism & Information n a n a n a Vocational training 13 33 22 10 0 60 PhD graduates 0 92 1 26 1 09 Graduates % Female Male Value Graduates from tertiary education 71 71 42 81 56 77 Health Indicator Unit Value Prevalence of gender violence in lifetime % women 27 00 Births attended by skilled personnel % live births 99 20 Mater nal mortality deaths per 100,000 live births 2 00 Total fertility rate births per woman 1 48 Indicator 0-1 (Equal rights) Value Reproductive autonomy Equal rights *Scores
on a 0 to 1 scale, where 1 represents the optimal situation or “parity” Please see Appendix A and B for detailed methodology, definitions, sources and periods. **For all indicators, except the two health indicators, parity is benchmarked at 1 In the case of sex ratio at birth the gender parity benchmark is set at 0 944 (see Klasen and Wink 2003) In the case of healthy life expectancy the gender parity benchmark is set at 1 06, given women's longer life expectancy
are
Global Gender Gap Index Indicators
Global Gender Gap Report 2023 291 Global Gender Gap Index 2023 Edition Oman score average score 0.488 Economy 0 957 E d u c a t i o n 0.961 Health 0 051 P o i t i c s Overview Index and Subindex 2023 Score Rank 2022 Score Rank Global Gender Gap Index 0 614 139th 0 609 139th Economic Participation and Opportunity 0.488 135th 0 482 137th Educational Attainment 0 957 113th 0 950 113th Health and Survival 0 961 129th 0 961 130th Political Empowerment 0 051 140th 0 041 140th
2023 Indicator Rank Score* Difference F-M Min Max Economic Participation and Opportunity 135th 0 488 -Labour-force participation rate % 135th 0 417 -48 87 0-100 Wage equality for similar work 1-7 (best) 4th 0 792Estimated ear ned income int'l $ 1,000 139th 0 237 -37 32 0-150 Legislators, senior officials and managers % 99th 0 403 -42 55 0-100 Professional and technical workers % 131st 0 386 -44 31 0-100 Educational Attainment 113th 0.957 -Literacy rate % 99th 0 956Enrolment in primary education % - - -Enrolment in secondary education % 123rd 0 937 -6 95 0-200 Enrolment in tertiary education % 1st 1 000 11 78 0-200 Health and Survival 129th 0 961 -Sex ratio at birth** % 1st 0 944Healthy life expectancy** years 138th 1 000Political Empowerment 140th 0 051 -Women in parliament % 142nd 0 024 -95 40 0-100 Women in ministerial positions % 99th 0 176 -70 00 0-100 Years with female/male head of state (last 50) 80th 0 000 -50 00 0-50 Economy Profile Oman Score (imparity = 0 parity = 1) 0.614 Rank (out of 146 countries) 139th Index Edition 2023 Compare with Global average 0 1 Female vs Male Min Max83 84 34 9748 90 11 58 71 28 28 72 72 15 27 85-109 53 102 58 41 52 53 30-97 70 2 30 85 00 15 00 50 00 0
Complementary Targets and Contextual Indicators 2023
Global Gender Gap Report 2023 292 Economy Profile Oman Score 0.614 Rank 139th Page 2 of 2
General indicators Indicator Unit Value GDP US$ billions 88 19 GDP per capita constant '17 intl $ 1000 34 29 Population sex ratio female/male 0 64 Population growth rate % -0 51 Indicator Million people Female Male Value Total population 1 79 2 79 4 58 Work participation and leadership Indicator Unit Value Gender pay gap % (OECD countries only) n a Share of women's membership in boards % (OECD countries only) n a Firms with female majority ownership % firms n a Firms with female top managers % firms n a Share of workers in informal sector % workers n a Indicator 1-7 (best) Value Advancement of women to leadership roles 5 25 Indicator Unit Female Male Value Unemployed adults % of labour force (15-64) 9 79 1 38 2 98 Workers employed part-time % of employed people n a n a n a Proportion of time spent on unpaid domestic and care work % n a n a n a Indicator Million people Female Male Value Labour-force 0 39 1 68 2 07 Access to finance Indicator 0-1 (Equal rights) Value Access to financial services Near-equal rights
rights for widows and daughters Unequal rights
to land assets Near-equal rights Access to non-land assets Near-equal rights Civil and political freedom Indicator Unit Value Year women received right to vote year n a Number of female heads of state to date number 0 Seats held in upper house % total seats 17 70 Indicator Yes/No Value Election list quotas for women, national n a Party membership quotas, voluntary n a Indicator 0-1 (Equal rights) Value Access to justice Restricted rights Freedom of movement Restricted rights Family and care Indicator Unit Value Public spending on family benefits % GPD n a Unmet family planning % women 15-49 17 80 Early marriage % 4 20 Mean age of women at birth of first child years n a Indicator 0-1 (Equal rights) Value Right to divorce Unequal rights Indicator Days Female Male Value Length of parental leave 50 00 0 0 Education and skills Graduates Attainment % Female Male Parity STEM Graduates 55 73 44 27 1 26 Agri , Forestry, Fisheries & Veterinary 81 54 18 46 4 42 Arts & Humanities 87 77 12 23 7 18 Business, Admin & Law 60 58 39 42 1 54 Education n a n a n a Engineering, Manuf & Construction 43 16 56 84 0 76 Health & Welfare 84 23 15 77 5 34 Information & Comm Technologies 75 56 24 44 3 09 Natural Sci , Mathematics & Statistics 75 45 24 55 3 07 Social Sci , Jour nalism & Information n a n a n a Vocational training 0 50 0 54 0 93 PhD graduates 0 24 0 32 0 29 Graduates % Female Male Value Graduates from tertiary education 45 21 14 17 27 30 Health Indicator Unit Value Prevalence of gender violence in lifetime % women n a Births attended by skilled personnel % live births 99 90 Mater nal mortality deaths per 100,000 live births 19 00 Total fertility rate births per woman 2 69 Indicator 0-1 (Equal rights) Value Reproductive autonomy Restricted rights *Scores
0
represents
optimal situation
parity
Appendix A
B for detailed methodology, definitions, sources and periods. **For all indicators, except the two health indicators, parity is benchmarked at 1 In the case of sex ratio at birth the gender parity benchmark is set at 0 944 (see Klasen and Wink 2003) In the case of healthy life expectancy the gender parity benchmark is set at 1 06, given women's longer life expectancy
Inheritance
Access
are on a
to 1 scale, where 1
the
or “
” Please see
and
Global Gender Gap Index Indicators
Global Gender Gap Report 2023 293 Global Gender Gap Index 2023 Edition Pakistan score average score 0.362 Economy 0 825 E d u c a t i o n 0.961 Health 0 152 P o i t i c s Overview Index and Subindex 2023 Score Rank 2022 Score Rank Global Gender Gap Index 0 575 142nd 0 564 145th Economic Participation and Opportunity 0.362 143rd 0 331 145th Educational Attainment 0 825 138th 0 825 135th Health and Survival 0 961 132nd 0 944 143rd Political Empowerment 0 152 95th 0 156 95th
2023 Indicator Rank Score* Difference F-M Min Max Economic Participation and Opportunity 143rd 0 362 -Labour-force participation rate % 140th 0 304 -56 14 0-100 Wage equality for similar work 1-7 (best) 71st 0 625Estimated ear ned income int'l $ 1,000 137th 0 251 -6 23 0-150 Legislators, senior officials and managers % 139th 0 061 -88 59 0-100 Professional and technical workers % 132nd 0 358 -47 23 0-100 Educational Attainment 138th 0.825 -Literacy rate % 137th 0 671Enrolment in primary education % - - -Enrolment in secondary education % 132nd 0 868 -6 30 0-200 Enrolment in tertiary education % 104th 0 984 -0 20 0-200 Health and Survival 132nd 0 961 -Sex ratio at birth** % 1st 0 944Healthy life expectancy** years 140th 0 999Political Empowerment 95th 0 152 -Women in parliament % 94th 0 258 -59 00 0-100 Women in ministerial positions % 126th 0 103 -81 25 0-100 Years with female/male head of state (last 50) 36th 0 104 -40 55 0-50 Economy Profile Pakistan Score (imparity = 0 parity = 1) 0.575 Rank (out of 146 countries) 142nd Index Edition 2023 Compare with Global average 0 1 Female vs Male Min Max80 67 24 538 32 2 09 94 29 5 71 73 61 26 39-47 90 41 59 12 32 12 12-79 50 20 50 90 63 9 38 45 27 4 73
Complementary Targets and Contextual Indicators 2023
Engineering, Manuf & Construction
Information & Comm Technologies
Natural Sci , Mathematics & Statistics
Social Sci , Jour nalism & Information
Vocational training
Access
Indicator Unit
*Scores are on a 0 to 1 scale, where 1 represents the optimal situation or “parity” Please see Appendix A and B for detailed methodology, definitions, sources and periods. **For all indicators, except the two health indicators, parity is benchmarked at 1 In the case of sex
Global Gender Gap Report 2023 294 Economy Profile Pakistan Score 0.575 Rank 142nd Page 2 of 2
General indicators Indicator Unit Value GDP US$ billions 348 26 GDP per capita constant '17 intl $ 1000 5 23 Population sex ratio female/male 0 98 Population growth rate % 1 83 Indicator Million people Female Male Value Total population 116 86 118 96 235 82 Work participation and leadership Indicator Unit Value Gender pay gap % (OECD countries only) n a Share of women's membership in boards % (OECD countries only) n a Firms with female majority ownership % firms 8 00 Firms with female top managers % firms 6 00 Share of workers in informal sector % workers 84 30 Indicator 1-7 (best) Value Advancement of women to leadership roles 4 47 Indicator Unit Female Male Value Unemployed adults % of labour force (15-64) 9 24 5 61 6 46 Workers employed part-time % of employed people 42 62 6 39 14 52 Proportion of time spent on unpaid domestic and care work % n a n a n a Indicator Million people Female Male Value Labour-force 11 04 37 70 48 74 Access to finance Indicator 0-1 (Equal rights) Value Access to financial services Near-equal rights
rights for widows
Unequal rights
Inheritance
and daughters
to land assets Uneven rights
to non-land assets Uneven rights Civil and political freedom Indicator Unit Value Year women received right to vote year 1937, 1947, 1956 Number of female heads of state to date number 1 Seats held in upper house % total seats 19 00 Indicator Yes/No Value Election list quotas for women, national Yes Party membership quotas, voluntary Yes Indicator 0-1 (Equal rights) Value Access to justice Restricted rights Freedom of movement Restricted rights Family and care Indicator Unit Value Public spending on family benefits % GPD n a Unmet family planning % women 15-49 17 30 Early marriage % 13 40 Mean age of women at birth of first child years n a Indicator 0-1
rights) Value Right
Restricted rights
Days Female Male Value Length of parental leave 112 00 0 0 Education and skills Graduates Attainment % Female Male Parity STEM Graduates n a n a n a
Access
(Equal
to divorce
Indicator
n a n a n a Arts &
n a n a n a Business, Admin & Law n a n a n a Education n a n a n a
Agri , Forestry, Fisheries & Veterinary
Humanities
n a n a n a
n a n a n a
Health & Welfare
n a n a n a
n a n a n a
n a n a n a
n a n a n a PhD
0 01 0 03 0 02 Graduates
Female Male Value
graduates
%
n a n a n a
Graduates from tertiary education
Health
Value
in lifetime % women 85 00 Births attended by skilled personnel % live births 68 00 Mater nal mortality deaths per 100,000 live births 140 00 Total fertility rate births per woman 3 56
Value
Prevalence of gender violence
Indicator 0-1 (Equal rights)
rights
gender parity benchmark
set
0 944
2003)
case of
gender parity
longer life expectancy
Reproductive autonomy Restricted
ratio at birth the
is
at
(see Klasen and Wink
In the
healthy life expectancy the
benchmark is set at 1 06, given women's
Global Gender Gap Index Indicators
Global Gender Gap Report 2023 295 Global Gender Gap Index 2023 Edition Panama score average score 0.674 Economy 0 997 E d u c a t i o n 0.973 Health 0 252 P o i t i c s Overview Index and Subindex 2023 Score Rank 2022 Score Rank Global Gender Gap Index 0 724 58th 0 743 40th Economic Participation and Opportunity 0.674 85th 0 750 32nd Educational Attainment 0 997 49th 0 998 35th Health and Survival 0 973 58th 0 973 62nd Political Empowerment 0 252 61st 0 252 54th
2023 Indicator Rank Score* Difference F-M Min Max Economic Participation and Opportunity 85th 0 674 -Labour-force participation rate % 111th 0 646 -27 27 0-100 Wage equality for similar work 1-7 (best) 90th 0 604Estimated ear ned income int'l $ 1,000 15th 0 807 -6 22 0-150 Legislators, senior officials and managers % 42nd 0 646 -21 49 0-100 Professional and technical workers % 99th 0 692 -18 21 0-100 Educational Attainment 49th 0.997 -Literacy rate % 75th 0 992Enrolment in primary education % 79th 0 997 -0 32 0-100 Enrolment in secondary education % 1st 1 000 3 28 0-200 Enrolment in tertiary education % 1st 1 000 19 08 0-200 Health and Survival 58th 0 973 -Sex ratio at birth** % 1st 0 944Healthy life expectancy** years 68th 1 039Political Empowerment 61st 0 252 -Women in parliament % 86th 0 290 -55 00 0-100 Women in ministerial positions % 48th 0 455 -37 50 0-100 Years with female/male head of state (last 50) 34th 0 111 -39 99 0-50 Economy Profile Panama Score (imparity = 0 parity = 1) 0.724 Rank (out of 146 countries) 58th Index Edition 2023 Compare with Global average 0 1 Female vs Male Min Max76 98 49 7132 15 25 93 60 75 39 25 59 10 40 9096 30 95 97 80 63 83 91 34 98 54 06-77 50 22 50 68 75 31 25 45 00 5 01
Complementary Targets and Contextual Indicators 2023
*Scores are on a 0 to 1 scale, where 1 represents the optimal situation or “parity” Please see Appendix A and B for detailed methodology, definitions, sources and periods. **For all indicators, except the two health indicators, parity is benchmarked at 1 In the case of sex ratio at
Global Gender Gap Report 2023 296 Economy Profile Panama Score 0.724 Rank 58th Page 2 of 2
General indicators Indicator Unit Value GDP US$ billions 63 61 GDP per capita constant '17 intl $ 1000 29 04 Population sex ratio female/male 1 00 Population growth rate % 1 32 Indicator Million people Female Male Value Total population 2 20 2 20 4 41 Work participation and leadership Indicator Unit Value Gender pay gap % (OECD countries only) n a Share of women's membership in boards % (OECD countries only) n a Firms with female majority ownership % firms n a Firms with female top managers % firms n a Share of workers in informal sector % workers 55 70 Indicator 1-7 (best) Value Advancement of women to leadership roles 4 66 Indicator Unit Female Male Value Unemployed adults % of labour force (15-64) 10 36 7 86 8 90 Workers employed part-time % of employed people 39 41 32 97 35 54 Proportion of time spent on unpaid domestic and care work % n a n a n a Indicator Million people Female Male Value Labour-force 0 75 1 05 1 79 Access to finance Indicator 0-1 (Equal rights) Value Access to financial services Equal rights Inheritance rights for widows and daughters Equal rights Access to land assets Equal rights Access to non-land assets Equal rights Civil and political freedom Indicator Unit Value Year women received right to vote year 1941, 1946 Number of female heads of state to date number 1 Seats held in upper house % total seats n a Indicator Yes/No Value Election list quotas for women, national Yes Party membership quotas, voluntary Yes Indicator 0-1 (Equal rights) Value Access to justice Equal rights Freedom of movement Equal rights Family and care Indicator Unit Value Public spending on family benefits % GPD n a Unmet family planning % women 15-49 24 20 Early marriage % 3 90 Mean age of women at birth of first child years n a Indicator 0-1 (Equal rights) Value Right to divorce Equal rights Indicator Days Female Male Value Length of parental leave 98 00 3 00 0 Education and skills Graduates Attainment % Female Male Parity STEM Graduates 43 22 56 78 0 76 Agri , Forestry, Fisheries & Veterinary 42 86 57 14 0 75 Arts & Humanities 64 66 35 34 1 83 Business, Admin & Law n a n a n a Education n a n a n a Engineering, Manuf & Construction 40 01 59 99 0 67 Health & Welfare 76 68 23 32 3 29 Information & Comm Technologies 43 91 56 09 0 78 Natural Sci , Mathematics & Statistics 59 91 40 09 1 49 Social Sci , Jour nalism & Information 68 81 31 19 2 21 Vocational training 6 85 7 63 0 90 PhD graduates 0 19 0 28 0 23 Graduates % Female Male Value Graduates from tertiary education 18 77 9 45 14 06 Health
Unit Value Prevalence of gender violence in lifetime % women n a Births attended by skilled personnel % live births 95 00 Mater nal mortality deaths per 100,000 live births 52 00 Total fertility rate births per woman 2 34 Indicator 0-1 (Equal rights) Value Reproductive autonomy Uneven rights
gender parity benchmark is set at 0 944
Klasen and Wink 2003)
the case of
expectancy
Indicator
birth the
(see
In
healthy life expectancy the gender parity benchmark is set at 1 06, given women's longer life
Global Gender Gap Index Indicators
Global Gender Gap Report 2023 297 Global Gender Gap Index 2023 Edition Paraguay score average score 0.685 Economy 0 997 E d u c a t i o n 0.975 Health 0 125 P o i t i c s Overview Index and Subindex 2023 Score Rank 2022 Score Rank Global Gender Gap Index 0 695 91st 0 707 80th Economic Participation and Opportunity 0.685 76th 0 682 78th Educational Attainment 0 997 45th 0 998 38th Health and Survival 0 975 54th 0 975 58th Political Empowerment 0 125 110th 0 174 84th
2023 Indicator Rank Score* Difference F-M Min Max Economic Participation and Opportunity 76th 0 685 -Labour-force participation rate % 91st 0 712 -24 27 0-100 Wage equality for similar work 1-7 (best) 106th 0 573Estimated ear ned income int'l $ 1,000 66th 0 659 -5 62 0-150 Legislators, senior officials and managers % 37th 0 665 -20 09 0-100 Professional and technical workers % 1st 1 000 9 10 0-100 Educational Attainment 45th 0.997 -Literacy rate % 73rd 0 992Enrolment in primary education % - - -Enrolment in secondary education % 1st 1 000 0 03 0-200 Enrolment in tertiary education % 1st 1 000 0 87 0-200 Health and Survival 54th 0 975 -Sex ratio at birth** % 1st 0 944Healthy life expectancy** years 64th 1 045Political Empowerment 110th 0 125 -Women in parliament % 105th 0 232 -62 40 0-100 Women in ministerial positions % 81st 0 214 -64 71 0-100 Years with female/male head of state (last 50) 80th 0 000 -50 00 0-50 Economy Profile Para uay Score (imparity = 0 parity = 1) 0.695 Rank (out of 146 countries) 91st Index Edition 2023 Compare with Global average 0 1 Female vs Male Min Max84 22 59 9516 49 10 87 60 05 39 96 45 45 54 55-0 48 0 52 0 99 1 86-81 20 18 80 82 35 17 65 50 00 0
Complementary Targets and Contextual Indicators 2023
Global Gender Gap Report 2023 298 Economy Profile Paraguay Score 0.695 Rank 91st Page 2 of 2
General indicators Indicator Unit Value GDP US$ billions 39 5 GDP per capita constant '17 intl $ 1000 13 69 Population sex ratio female/male 0 99 Population growth rate % 1 28 Indicator Million people Female Male Value Total population 3 38 3 40 6 78 Work participation and leadership Indicator Unit Value Gender pay gap % (OECD countries only) n a Share of women's membership in boards % (OECD countries only) n a Firms with female majority ownership % firms 18 50 Firms with female top managers % firms 19 60 Share of workers in informal sector % workers 69 30 Indicator 1-7 (best) Value Advancement of women to leadership roles 4 11 Indicator Unit Female Male Value Unemployed adults % of labour force (15-64) 8 57 5 84 7 01 Workers employed part-time % of employed people 43 22 26 98 33 68 Proportion of time spent on unpaid domestic and care work % 14 53 4 27 n a Indicator Million people Female Male Value Labour-force 1 28 1 71 2 99 Access to finance Indicator 0-1 (Equal rights) Value Access to financial services Equal rights Inheritance rights for widows and daughters Uneven rights Access to land assets Uneven rights Access to non-land assets Uneven rights Civil and political freedom Indicator Unit Value Year women received right to vote year 1961 Number of female heads of state to date number 0 Seats held in upper house % total seats 13 30 Indicator Yes/No Value Election list quotas for women, national Yes Party membership quotas, voluntary Yes Indicator 0-1 (Equal rights) Value Access to justice Equal rights Freedom of movement Equal rights Family and care Indicator Unit Value Public spending on family benefits % GPD n a Unmet family planning % women 15-49 12 13 Early marriage % 13 20 Mean age of women at birth of first child years n a Indicator 0-1 (Equal rights) Value Right to divorce Uneven rights Indicator Days Female Male Value Length of parental leave 126 00 14 00 0 Education and skills Graduates Attainment % Female Male Parity STEM Graduates n a n a n a Agri , Forestry, Fisheries & Veterinary n a n a n a Arts & Humanities n a n a n a Business, Admin & Law n a n a n a Education n a n a n a Engineering, Manuf & Construction n a n a n a Health & Welfare n a n a n a Information & Comm Technologies n a n a n a Natural Sci , Mathematics & Statistics n a n a n a Social Sci , Jour nalism & Information n a n a n a Vocational training 5 09 4 64 1 10 PhD graduates 0 01 0 18 0 09 Graduates % Female Male Value Graduates from tertiary education n a n a n a Health Indicator Unit Value Prevalence of gender violence in lifetime % women 17 90 Births attended by skilled personnel % live births 97 70 Mater nal mortality deaths per 100,000 live births 129 00 Total fertility rate births per woman 2 50 Indicator 0-1 (Equal rights) Value Reproductive autonomy Restricted rights *Scores
0
1
where 1 represents
optimal situation
parity
see Appendix A
B for detailed methodology, definitions, sources and periods. **For all indicators, except the two health indicators, parity is benchmarked at 1 In the case of sex ratio at birth the gender parity benchmark is set at 0 944 (see Klasen and Wink 2003) In the case of healthy life expectancy the gender parity benchmark is set at 1 06, given women's longer life expectancy
are on a
to
scale,
the
or “
” Please
and
Global Gender Gap Index Indicators
Global Gender Gap Report 2023 299 Global Gender Gap Index 2023 Edition Peru score average score 0.683 Economy 0 960 E d u c a t i o n 0.964 Health 0 450 P o i t i c s Overview Index and Subindex 2023 Score Rank 2022 Score Rank Global Gender Gap Index 0 764 34th 0 749 37th Economic Participation and Opportunity 0.683 79th 0 663 86th Educational Attainment 0 960 111th 0 954 112th Health and Survival 0 964 117th 0 964 120th Political Empowerment 0 450 22nd 0 415 27th
2023 Indicator Rank Score* Difference F-M Min Max Economic Participation and Opportunity 79th 0 683 -Labour-force participation rate % 58th 0 819 -14 33 0-100 Wage equality for similar work 1-7 (best) 103rd 0 588Estimated ear ned income int'l $ 1,000 34th 0 741 -3 73 0-150 Legislators, senior officials and managers % 69th 0 547 -29 27 0-100 Professional and technical workers % 96th 0 763 -13 44 0-100 Educational Attainment 111th 0.960 -Literacy rate % 101st 0 949Enrolment in primary education % - - -Enrolment in secondary education % 121st 0 949 -5 78 0-200 Enrolment in tertiary education % 1st 1 000 3 94 0-200 Health and Survival 117th 0 964 -Sex ratio at birth** % 1st 0 944Healthy life expectancy** years 127th 1 008Political Empowerment 22nd 0 450 -Women in parliament % 28th 0 634 -22 40 0-100 Women in ministerial positions % 16th 0 900 -5 26 0-100 Years with female/male head of state (last 50) 42nd 0 071 -43 40 0-50 Economy Profile Peru Score (imparity = 0 parity = 1) 0.764 Rank (out of 146 countries) 34th Index Edition 2023 Compare with Global average 0 1 Female vs Male Min Max79 10 64 7714 40 10 67 64 63 35 37 56 72 43 28-113 50 107 72 68 73 72 67-61 20 38 80 52 63 47 37 46 70 3 30
Complementary Targets and Contextual Indicators 2023
Global Gender Gap Report 2023 300 Economy Profile Peru Score 0.764 Rank 34th Page 2 of 2
General indicators Indicator Unit Value GDP US$ billions 223 25 GDP per capita constant '17 intl $ 1000 12 51 Population sex ratio female/male 1 02 Population growth rate % 1 23 Indicator Million people Female Male Value Total population 17 19 16 86 34 05 Work participation and leadership Indicator Unit Value Gender pay gap % (OECD countries only) n a Share of women's membership in boards % (OECD countries only) n a Firms with female majority ownership % firms 19 40 Firms with female top managers % firms 19 90 Share of workers in informal sector % workers 68 40 Indicator 1-7 (best) Value Advancement of women to leadership roles 4 42 Indicator Unit Female Male Value Unemployed adults % of labour force (15-64) 4 62 3 38 3 95 Workers employed part-time % of employed people 44 81 27 79 35 43 Proportion of time spent on unpaid domestic and care work % n a n a n a Indicator Million people Female Male Value Labour-force 7 25 8 67 15 92 Access to finance Indicator 0-1 (Equal rights) Value Access to financial services Equal rights Inheritance rights for widows and daughters Near-equal rights Access to land assets Equal rights Access to non-land assets Equal rights Civil and political freedom Indicator Unit Value Year women received right to vote year 1955 Number of female heads of state to date number 7 Seats held in upper house % total seats n a Indicator Yes/No Value Election list quotas for women, national Yes Party membership quotas, voluntary Yes Indicator 0-1 (Equal rights) Value Access to justice Equal rights Freedom of movement Equal rights Family and care Indicator Unit Value Public spending on family benefits % GPD n a Unmet family planning % women 15-49 6 10 Early marriage % 12 90 Mean age of women at birth of first child years n a Indicator 0-1 (Equal rights) Value Right to divorce Restricted rights Indicator Days Female Male Value Length of parental leave 98 00 10 00 0 Education and skills Graduates Attainment % Female Male Parity STEM Graduates n a n a n a Agri , Forestry, Fisheries & Veterinary 40 60 59 40 0 68 Arts & Humanities n a n a n a Business, Admin & Law 58 02 41 98 1 38 Education 69 65 30 35 2 29 Engineering, Manuf & Construction n a n a n a Health & Welfare n a n a n a Information & Comm Technologies 49 56 50 44 0 98 Natural Sci , Mathematics & Statistics 45 97 54 03 0 85 Social Sci , Jour nalism & Information 51 46 48 54 1 06 Vocational training 0 73 0 62 1 18 PhD graduates n a n a n a Graduates % Female Male Value Graduates from tertiary education n a n a n a Health Indicator Unit Value Prevalence of gender violence in lifetime % women 33 20 Births attended by skilled personnel % live births 95 70 Mater nal mortality deaths per 100,000 live births 88 00 Total fertility rate births per woman 2 22 Indicator 0-1 (Equal rights) Value Reproductive autonomy Restricted rights *Scores
on a 0 to 1 scale, where 1 represents the optimal situation or “parity” Please see Appendix A and B for detailed methodology, definitions, sources and periods. **For all indicators, except the two health indicators, parity is benchmarked at 1 In the case of sex ratio at birth the gender parity benchmark is set at 0 944 (see Klasen and Wink 2003) In the case of healthy life expectancy the gender parity benchmark is set at 1 06, given women's longer life expectancy
are
Global Gender Gap Index Indicators
Global Gender Gap Report 2023 301 Global Gender Gap Index 2023 Edition Philippines score average score 0.789 Economy 0 999 E d u c a t i o n 0.968 Health 0 409 P o i t i c s Overview Index and Subindex 2023 Score Rank 2022 Score Rank Global Gender Gap Index 0 791 16th 0 783 19th Economic Participation and Opportunity 0.789 17th 0 794 16th Educational Attainment 0 999 32nd 0 997 46th Health and Survival 0 968 86th 0 979 30th Political Empowerment 0 409 30th 0 360 35th
2023 Indicator Rank Score* Difference F-M Min Max Economic Participation and Opportunity 17th 0 789 -Labour-force participation rate % 115th 0 641 -24 72 0-100 Wage equality for similar work 1-7 (best) 11th 0 752Estimated ear ned income int'l $ 1,000 41st 0 716 -2 68 0-150 Legislators, senior officials and managers % 1st 1 000 6 75 0-100 Professional and technical workers % 1st 1 000 15 67 0-100 Educational Attainment 32nd 0.999 -Literacy rate % 1st 1 000Enrolment in primary education % 72nd 0 999 -0 12 0-100 Enrolment in secondary education % 1st 1 000 7 26 0-200 Enrolment in tertiary education % 1st 1 000 11 05 0-200 Health and Survival 86th 0 968 -Sex ratio at birth** % 138th 0 928Healthy life expectancy** years 1st 1 060Political Empowerment 30th 0 409 -Women in parliament % 71st 0 376 -45 40 0-100 Women in ministerial positions % 54th 0 357 -47 37 0-100 Years with female/male head of state (last 50) 7th 0 462 -18 41 0-50 Economy Profile Philippines Score (imparity = 0 parity = 1) 0.791 Rank (out of 146 countries) 16th Index Edition 2023 Compare with Global average 0 1 Female vs Male Min Max68 77 44 059 41 6 73 46 63 53 38 42 17 57 8391 31 91 18 86 91 94 18 30 18 41 22-72 70 27 30 73 68 26 32 34 21 15 80
Complementary Targets and Contextual Indicators 2023
Global Gender Gap Report 2023 302 Economy Profile Philippines Score 0.791 Rank 16th Page 2 of 2
General indicators Indicator Unit Value GDP US$ billions 394 09 GDP per capita constant '17 intl $ 1000 8 09 Population sex ratio female/male 0 97 Population growth rate % 1 49 Indicator Million people Female Male Value Total population 56 88 58 68 115 56 Work participation and leadership Indicator Unit Value Gender pay gap % (OECD countries only) n a Share of women's membership in boards % (OECD countries only) n a Firms with female majority ownership % firms 31 50 Firms with female top managers % firms 29 90 Share of workers in informal sector % workers n a Indicator 1-7 (best) Value Advancement of women to leadership roles 5 61 Indicator Unit Female Male Value Unemployed adults % of labour force (15-64) 4 01 3 24 3 54 Workers employed part-time % of employed people 32 47 30 42 31 21 Proportion of time spent on unpaid domestic and care work % n a n a n a Indicator Million people Female Male Value Labour-force 14 18 22 06 36 24 Access to finance Indicator 0-1 (Equal rights) Value Access to financial services Near-equal rights Inheritance rights for widows and daughters Uneven rights Access to land assets Unequal rights Access to non-land assets Unequal rights Civil and political freedom Indicator Unit Value Year women received right to vote year 1937 Number of female heads of state to date number 2 Seats held in upper house % total seats 29 20 Indicator Yes/No Value Election list quotas for women, national Yes Party membership quotas, voluntary Yes Indicator 0-1 (Equal rights) Value Access to justice Near-equal rights Freedom of movement Restricted rights Family and care Indicator Unit Value Public spending on family benefits % GPD n a Unmet family planning % women 15-49 16 70 Early marriage % 4 80 Mean age of women at birth of first child years n a Indicator 0-1 (Equal rights) Value Right to divorce Unequal rights Indicator Days Female Male Value Length of parental leave 105 00 9 00 0 Education and skills Graduates Attainment % Female Male Parity STEM Graduates n a n a n a Agri , Forestry, Fisheries & Veterinary 53 37 46 63 1 14 Arts & Humanities 57 02 42 98 1 33 Business, Admin & Law n a n a n a Education 76 68 23 32 3 29 Engineering, Manuf & Construction 24 48 75 52 0 32 Health & Welfare 71 87 28 13 2 55 Information & Comm Technologies 48 13 51 87 0 93 Natural Sci , Mathematics & Statistics 61 97 38 03 1 63 Social Sci , Jour nalism & Information 69 98 30 02 2 33 Vocational training 2 86 3 30 0 87 PhD graduates 0 13 0 10 0 11 Graduates % Female Male Value Graduates from tertiary education n a n a n a Health Indicator Unit Value Prevalence of gender violence in lifetime % women 16 90 Births attended by skilled personnel % live births 84 40 Mater nal mortality deaths per 100,000 live births 121 00 Total fertility rate births per woman 2 78 Indicator 0-1 (Equal rights) Value Reproductive autonomy Restricted rights *Scores
0
1 scale,
1 represents the optimal situation
parity” Please see Appendix A and B for detailed methodology, definitions, sources and periods. **For all indicators, except the two health indicators, parity is benchmarked at 1 In the case of sex ratio at birth the gender parity benchmark is set at 0 944 (see Klasen and Wink 2003) In the case of healthy life expectancy the gender parity benchmark is set at 1 06, given women's longer life expectancy
are on a
to
where
or “
Global Gender Gap Index Indicators
Global Gender Gap Report 2023 303 Global Gender Gap Index 2023 Edition Poland score average score 0.699 Economy 0 997 E d u c a t i o n 0.980 Health 0 211 P o i t i c s Overview Index and Subindex 2023 Score Rank 2022 Score Rank Global Gender Gap Index 0 722 60th 0 709 77th Economic Participation and Opportunity 0.699 64th 0 695 74th Educational Attainment 0 997 50th 0 992 70th Health and Survival 0 980 1st 0 980 1st Political Empowerment 0 211 73rd 0 171 87th
2023 Indicator Rank Score* Difference F-M Min Max Economic Participation and Opportunity 64th 0 699 -Labour-force participation rate % 82nd 0 754 -16 15 0-100 Wage equality for similar work 1-7 (best) 108th 0 558Estimated ear ned income int'l $ 1,000 69th 0 647 -15 08 0-150 Legislators, senior officials and managers % 25th 0 754 -14 05 0-100 Professional and technical workers % 1st 1 000 14 91 0-100 Educational Attainment 50th 0.997 -Literacy rate % 1st 1 000Enrolment in primary education % 1st 1 000 0 38 0-100 Enrolment in secondary education % 94th 0 986 -1 57 0-200 Enrolment in tertiary education % 1st 1 000 27 36 0-200 Health and Survival 1st 0 980 -Sex ratio at birth** % 1st 0 944Healthy life expectancy** years 1st 1 060Political Empowerment 73rd 0 211 -Women in parliament % 64th 0 395 -43 40 0-100 Women in ministerial positions % 81st 0 214 -64 71 0-100 Years with female/male head of state (last 50) 41st 0 082 -42 43 0-50 Economy Profile Poland Score (imparity = 0 parity = 1) 0.722 Rank (out of 146 countries) 60th Index Edition 2023 Compare with Global average 0 1 Female vs Male Min Max65 67 49 5242 69 27 62 57 02 42 98 42 55 57 4598 67 99 05 116 02 114 44 56 99 84 36-71 70 28 30 82 35 17 65 46 22 3 78
Complementary Targets and Contextual Indicators 2023
Global Gender Gap Report 2023 304 Economy Profile Poland Score 0.722 Rank 60th Page 2 of 2
General indicators Indicator Unit Value GDP US$ billions 679 44 GDP per capita constant '17 intl $ 1000 34 92 Population sex ratio female/male 1 07 Population growth rate % -0 40 Indicator Million people Female Male Value Total population 20 56 19 30 39 86 Work participation and leadership Indicator Unit Value Gender pay gap % (OECD countries only) 8 69 Share of women's membership in boards % (OECD countries only) 24 70 Firms with female majority ownership % firms 21 20 Firms with female top managers % firms 27 80 Share of workers in informal sector % workers 15 90 Indicator 1-7 (best) Value Advancement of women to leadership roles 4 43 Indicator Unit Female Male Value Unemployed adults % of labour force (15-64) 3 00 2 90 2 90 Workers employed part-time % of employed people 25 70 14 63 19 64 Proportion of time spent on unpaid domestic and care work % 18 26 9 93 n a Indicator Million people Female Male Value Labour-force 7 43 8 76 16 19 Access to finance Indicator 0-1 (Equal rights) Value Access to financial services Equal rights Inheritance rights for widows and daughters Equal rights Access to land assets Equal rights Access to non-land assets Equal rights Civil and political freedom Indicator Unit Value Year women received right to vote year 1918 Number of female heads of state to date number 3 Seats held in upper house % total seats 24 00 Indicator Yes/No Value Election list quotas for women, national Yes Party membership quotas, voluntary Yes Indicator 0-1 (Equal rights) Value Access to justice Equal rights Freedom of movement Equal rights Family and care Indicator Unit Value Public spending on family benefits % GPD 3 02 Unmet family planning % women 15-49 n a Early marriage % 1 20 Mean age of women at birth of first child years 27 90 Indicator 0-1 (Equal rights) Value Right to divorce Equal rights Indicator Days Female Male Value Length of parental leave 140 00 14 00 224 00 Education and skills Graduates Attainment % Female Male Parity STEM Graduates n a n a n a Agri , Forestry, Fisheries & Veterinary 56 79 43 21 1 31 Arts & Humanities 75 21 24 79 3 03 Business, Admin & Law 68 27 31 73 2 15 Education 86 45 13 55 6 38 Engineering, Manuf & Construction 42 07 57 93 0 73 Health & Welfare 72 17 27 83 2 59 Information & Comm Technologies n a n a n a Natural Sci , Mathematics & Statistics n a n a n a Social Sci , Jour nalism & Information 72 11 27 89 2 59 Vocational training 19 97 28 13 0 71 PhD graduates 0 58 0 73 0 65 Graduates % Female Male Value Graduates from tertiary education 57 11 35 51 46 19 Health Indicator Unit Value Prevalence of gender violence in lifetime % women 13 00 Births attended by skilled personnel % live births 99 70 Mater nal mortality deaths per 100,000 live births 2 00 Total fertility rate births per woman 1 38 Indicator 0-1 (Equal rights) Value Reproductive autonomy Uneven rights *Scores are on a 0 to 1 scale, where 1 represents the optimal situation or “parity” Please see Appendix A and B for detailed methodology, definitions, sources and periods. **For all indicators, except the two health indicators, parity is benchmarked at 1 In the case of sex ratio at birth the gender parity benchmark is set at 0 944 (see Klasen and Wink 2003) In the case of healthy life expectancy the gender parity benchmark is set at 1 06, given women's longer life expectancy
Global Gender Gap Index Indicators
Global Gender Gap Report 2023 305 Global Gender Gap Index 2023 Edition Portugal score average score 0.745 Economy 0 991 E d u c a t i o n 0.973 Health 0 352 P o i t i c s Overview Index and Subindex 2023 Score Rank 2022 Score Rank Global Gender Gap Index 0 765 32nd 0 766 29th Economic Participation and Opportunity 0.745 34th 0 737 41st Educational Attainment 0 991 76th 0 990 75th Health and Survival 0 973 62nd 0 973 67th Political Empowerment 0 352 38th 0 364 33rd
2023 Indicator Rank Score* Difference F-M Min Max Economic Participation and Opportunity 34th 0 745 -Labour-force participation rate % 32nd 0 863 -8 55 0-100 Wage equality for similar work 1-7 (best) 77th 0 619Estimated ear ned income int'l $ 1,000 24th 0 763 -9 11 0-150 Legislators, senior officials and managers % 51st 0 612 -24 09 0-100 Professional and technical workers % 1st 1 000 8 06 0-100 Educational Attainment 76th 0.991 -Literacy rate % 86th 0 981Enrolment in primary education % 90th 0 989 -1 14 0-100 Enrolment in secondary education % 1st 1 000 0 55 0-200 Enrolment in tertiary education % 1st 1 000 11 31 0-200 Health and Survival 62nd 0 973 -Sex ratio at birth** % 1st 0 944Healthy life expectancy** years 72nd 1 038Political Empowerment 38th 0 352 -Women in parliament % 36th 0 565 -27 80 0-100 Women in ministerial positions % 26th 0 700 -17 65 0-100 Years with female/male head of state (last 50) 70th 0 009 -49 15 0-50 Economy Profile Portugal Score (imparity = 0 parity = 1) 0.765 Rank (out of 146 countries) 32nd Index Edition 2023 Compare with Global average 0 1 Female vs Male Min Max62 37 53 8238 49 29 38 62 05 37 95 45 97 54 0399 94 98 80 119 47 120 02 64 75 76 06-63 90 36 10 58 82 41 18 49 58 0 43
Complementary Targets and Contextual Indicators 2023
are
a
Global Gender Gap Report 2023 306 Economy Profile Portugal Score 0.765 Rank 32nd Page 2 of 2
General indicators Indicator Unit Value GDP US$ billions 253 66 GDP per capita constant '17 intl $ 1000 33 67 Population sex ratio female/male 1 12 Population growth rate % 0 27 Indicator Million people Female Male Value Total population 5 42 4 85 10 27 Work participation and leadership Indicator Unit Value Gender pay gap % (OECD countries only) 11 72 Share of women's membership in boards % (OECD countries only) 31 00 Firms with female majority ownership % firms 8 00 Firms with female top managers % firms 14 00 Share of workers in informal sector % workers 9 70 Indicator 1-7 (best) Value Advancement of women to leadership roles 4 98 Indicator Unit Female Male Value Unemployed adults % of labour force (15-64) 6 60 5 70 6 20 Workers employed part-time % of employed people 36 60 27 39 31 95 Proportion of time spent on unpaid domestic and care work % 17 81 10 24 n a Indicator Million people Female Male Value Labour-force 2 45 2 43 4 89 Access to finance Indicator 0-1 (Equal rights) Value Access to financial services Equal rights Inheritance rights for widows and daughters Equal rights Access to land assets Equal rights Access to non-land assets Equal rights Civil and political freedom Indicator Unit Value Year women received right to vote year 1931, 1934, 1976 Number of female heads of state to date number 1 Seats held in upper house % total seats n a Indicator Yes/No Value Election list quotas for women, national Yes Party membership quotas, voluntary Yes Indicator 0-1 (Equal rights) Value Access to justice Equal rights Freedom of movement Equal rights Family and care Indicator Unit Value Public spending on family benefits % GPD 1 21 Unmet family planning % women 15-49 n a Early marriage % 0 70 Mean age of women at birth of first child years 30 20 Indicator 0-1 (Equal rights) Value Right to divorce Equal rights Indicator Days Female Male Value Length of parental leave 0 35 00 78 00 Education and skills Graduates Attainment % Female Male Parity STEM Graduates n a n a n a Agri , Forestry, Fisheries & Veterinary 58 09 41 91 1 39 Arts & Humanities 61 86 38 14 1 62 Business, Admin & Law 60 15 39 85 1 51 Education 80 01 19 99 4 00 Engineering, Manuf & Construction n a n a n a Health & Welfare 77 86 22 14 3 52 Information & Comm Technologies 17 44 82 56 0 21 Natural Sci , Mathematics & Statistics n a n a n a Social Sci , Jour nalism & Information n a n a n a Vocational training 13 14 19 10 0 69 PhD graduates 0 68 0 86 0 76 Graduates % Female Male Value Graduates from tertiary education 66 26 46 31 56 24 Health Indicator Unit Value Prevalence of gender violence in lifetime % women 19 00 Births attended by skilled personnel % live births 98 60 Mater nal mortality deaths per 100,000 live births 8 00 Total fertility rate births per woman 1 40 Indicator 0-1 (Equal rights) Value Reproductive autonomy Equal rights
birth
gender parity benchmark is set at 0 944 (see Klasen and Wink 2003)
the case of
life
gender parity benchmark
set
longer life expectancy
*Scores
on
0 to 1 scale, where 1 represents the optimal situation or “parity” Please see Appendix A and B for detailed methodology, definitions, sources and periods. **For all indicators, except the two health indicators, parity is benchmarked at 1 In the case of sex ratio at
the
In
healthy
expectancy the
is
at 1 06, given women's
Global Gender Gap Index Indicators
Global Gender Gap Report 2023 307 Global Gender Gap Index 2023 Edition Qatar score average score 0.508 Economy 0 982 E d u c a t i o n 0.947 Health 0 071 P o i t i c s Overview Index and Subindex 2023 Score Rank 2022 Score Rank Global Gender Gap Index 0 627 133rd 0 617 137th Economic Participation and Opportunity 0.508 132nd 0 499 133rd Educational Attainment 0 982 93rd 0 987 83rd Health and Survival 0 947 143rd 0 947 142nd Political Empowerment 0 071 133rd 0 033 143rd
2023 Indicator Rank Score* Difference F-M Min Max Economic Participation and Opportunity 132nd 0 508 -Labour-force participation rate % 118th 0 625 -35 81 0-100 Wage equality for similar work 1-7 (best) 13th 0 746Estimated ear ned income int'l $ 1,000 123rd 0 473 -57 29 0-150 Legislators, senior officials and managers % 135th 0 120 -78 50 0-100 Professional and technical workers % 137th 0 246 -60 56 0-100 Educational Attainment 93rd 0.982 -Literacy rate % 64th 0 998Enrolment in primary education % 1st 1 000 3 04 0-100 Enrolment in secondary education % 126th 0 925 -0 04 0-200 Enrolment in tertiary education % 1st 1 000 52 11 0-200 Health and Survival 143rd 0 947 -Sex ratio at birth** % 1st 0 944Healthy life expectancy** years 146th 0 955Political Empowerment 133rd 0 071 -Women in parliament % 140th 0 046 -91 20 0-100 Women in ministerial positions % 77th 0 231 -62 50 0-100 Years with female/male head of state (last 50) 80th 0 000 -50 00 0-50 Economy Profile Qatar Score (imparity = 0 parity = 1) 0.627 Rank (out of 146 countries) 133rd Index Edition 2023 Compare with Global average 0 1 Female vs Male Min Max95 41 59 60108 61 51 32 89 25 10 75 80 28 19 7296 61 99 65 0 52 0 48 10 67 62 78-95 60 4 40 81 25 18 75 50 00 0
Complementary Targets and Contextual Indicators 2023
Global Gender Gap Report 2023 308 Economy Profile Qatar Score 0.627 Rank 133rd Page 2 of 2
General indicators Indicator Unit Value GDP US$ billions 179 68 GDP per capita constant '17 intl $ 1000 92 86 Population sex ratio female/male 0 38 Population growth rate % -2 65 Indicator Million people Female Male Value Total population 0 74 1 95 2 69 Work participation and leadership Indicator Unit Value Gender pay gap % (OECD countries only) n a Share of women's membership in boards % (OECD countries only) n a Firms with female majority ownership % firms n a Firms with female top managers % firms n a Share of workers in informal sector % workers n a Indicator 1-7 (best) Value Advancement of women to leadership roles 5 26 Indicator Unit Female Male Value Unemployed adults % of labour force (15-64) 0 46 0 08 0 14 Workers employed part-time % of employed people 3 38 1 26 1 55 Proportion of time spent on unpaid domestic and care work % 8 19 2 22 n a Indicator Million people Female Male Value Labour-force 0 27 1 60 1 87 Access to finance Indicator 0-1 (Equal rights) Value Access to financial services Equal rights Inheritance rights for widows and daughters Unequal rights Access to land assets Equal rights Access to non-land assets Equal rights Civil and political freedom Indicator Unit Value Year women received right to vote year 1998, 2003 Number of female heads of state to date number 0 Seats held in upper house % total seats n a Indicator Yes/No Value Election list quotas for women, national n a Party membership quotas, voluntary n a Indicator 0-1 (Equal rights) Value Access to justice Restricted rights Freedom of movement Unequal rights Family and care Indicator Unit Value Public spending on family benefits % GPD n a Unmet family planning % women 15-49 n a Early marriage % 3 60 Mean age of women at birth of first child years n a Indicator 0-1 (Equal rights) Value Right to divorce Unequal rights Indicator Days Female Male Value Length of parental leave 50 00 0 0 Education and skills Graduates Attainment % Female Male Parity STEM Graduates n a n a n a Agri , Forestry, Fisheries & Veterinary n a n a n a Arts & Humanities 71 77 28 23 2 54 Business, Admin & Law 65 84 34 16 1 93 Education 94 34 5 66 16 67 Engineering, Manuf & Construction 37 21 62 79 0 59 Health & Welfare 88 08 11 92 7 39 Information & Comm Technologies n a n a n a Natural Sci , Mathematics & Statistics n a n a n a Social Sci , Jour nalism & Information 77 54 22 46 3 45 Vocational training 1 79 1 16 1 54 PhD graduates 0 52 0 42 0 44 Graduates % Female Male Value Graduates from tertiary education 32 47 2 86 9 28 Health Indicator Unit Value Prevalence of gender violence in lifetime % women n a Births attended by skilled personnel % live births 100 00 Mater nal mortality deaths per 100,000 live births 9 00 Total fertility rate births per woman 1 82 Indicator 0-1 (Equal rights) Value Reproductive autonomy Restricted rights *Scores
methodology,
**For
two health indicators, parity is benchmarked at 1 In the case of sex ratio at birth the gender parity benchmark is set at 0 944 (see Klasen and Wink 2003) In the case of healthy life expectancy
gender parity benchmark is set at 1 06, given women's longer life expectancy
are on a 0 to 1 scale, where 1 represents the optimal situation or “parity” Please see Appendix A and B for detailed
definitions, sources and periods.
all indicators, except the
the
Global Gender Gap Index Indicators
Global Gender Gap Report 2023 309 Global Gender Gap Index 2023 Edition Romania score average score 0.693 Economy 0 999 E d u c a t i o n 0.980 Health 0 117 P o i t i c s Overview Index and Subindex 2023 Score Rank 2022 Score Rank Global Gender Gap Index 0 697 88th 0 698 90th Economic Participation and Opportunity 0.693 72nd 0 710 63rd Educational Attainment 0 999 36th 0 998 39th Health and Survival 0 980 1st 0 980 1st Political Empowerment 0 117 113th 0 102 122nd
2023 Indicator Rank Score* Difference F-M Min Max Economic Participation and Opportunity 72nd 0 693 -Labour-force participation rate % 105th 0 664 -20 78 0-100 Wage equality for similar work 1-7 (best) 40th 0 698Estimated ear ned income int'l $ 1,000 76th 0 636 -13 81 0-150 Legislators, senior officials and managers % 64th 0 558 -28 33 0-100 Professional and technical workers % 1st 1 000 13 68 0-100 Educational Attainment 36th 0.999 -Literacy rate % 66th 0 996Enrolment in primary education % 73rd 0 999 -0 12 0-100 Enrolment in secondary education % 1st 1 000 0 43 0-200 Enrolment in tertiary education % 1st 1 000 13 44 0-200 Health and Survival 1st 0 980 -Sex ratio at birth** % 1st 0 944Healthy life expectancy** years 1st 1 060Political Empowerment 113th 0 117 -Women in parliament % 102nd 0 236 -61 80 0-100 Women in ministerial positions % 123rd 0 111 -80 00 0-100 Years with female/male head of state (last 50) 54th 0 037 -46 47 0-50 Economy Profile Romania Score (imparity = 0 parity = 1) 0.697 Rank (out of 146 countries) 88th Index Edition 2023 Compare with Global average 0 1 Female vs Male Min Max61 80 41 0237 90 24 09 64 17 35 84 43 16 56 8487 69 87 56 86 89 87 33 46 74 60 18-80 90 19 10 90 00 10 00 48 24 1 76
Complementary Targets and Contextual Indicators 2023
Global Gender Gap Report 2023 310 Economy Profile Romania Score 0.697 Rank 88th Page 2 of 2
General indicators Indicator Unit Value GDP US$ billions 284 09 GDP per capita constant '17 intl $ 1000 30 77 Population sex ratio female/male 1 07 Population growth rate % -0 76 Indicator Million people Female Male Value Total population 10 15 9 51 19 66 Work participation and leadership Indicator Unit Value Gender pay gap % (OECD countries only) 3 30 Share of women's membership in boards % (OECD countries only) n a Firms with female majority ownership % firms 11 70 Firms with female top managers % firms 17 20 Share of workers in informal sector % workers n a Indicator 1-7 (best) Value Advancement of women to leadership roles 5 03 Indicator Unit Female Male Value Unemployed adults % of labour force (15-64) 5 10 6 10 5 60 Workers employed part-time % of employed people 11 12 8 28 9 47 Proportion of time spent on unpaid domestic and care work % n a n a n a Indicator Million people Female Male Value Labour-force 3 30 4 45 7 75 Access to finance Indicator 0-1 (Equal rights) Value Access to financial services Equal rights Inheritance rights for widows and daughters Equal rights Access to land assets Equal rights Access to non-land assets Equal rights Civil and political freedom Indicator Unit Value Year women received right to vote year 1929, 1946 Number of female heads of state to date number 1 Seats held in upper house % total seats 18 40 Indicator Yes/No Value Election list quotas for women, national Yes Party membership quotas, voluntary Yes Indicator 0-1 (Equal rights) Value Access to justice Equal rights Freedom of movement Equal rights Family and care Indicator Unit Value Public spending on family benefits % GPD n a Unmet family planning % women 15-49 n a Early marriage % 6 80 Mean age of women at birth of first child years 27 10 Indicator 0-1 (Equal rights) Value Right to divorce Near-equal rights Indicator Days Female Male Value Length of parental leave 126 00 21 00 607 00 Education and skills Graduates Attainment % Female Male Parity STEM Graduates 41 22 58 78 0 70 Agri , Forestry, Fisheries & Veterinary 40 65 59 35 0 69 Arts & Humanities n a n a n a Business, Admin & Law 67 01 32 99 2 03 Education 90 75 9 25 9 81 Engineering, Manuf & Construction n a n a n a Health & Welfare 71 79 28 21 2 55 Information & Comm Technologies 33 19 66 81 0 50 Natural Sci , Mathematics & Statistics 66 86 33 14 2 02 Social Sci , Jour nalism & Information n a n a n a Vocational training 17 60 19 75 0 89 PhD graduates 0 08 0 08 0 08 Graduates % Female Male Value Graduates from tertiary education 50 56 34 43 42 22
Indicator Unit Value Prevalence of gender violence in lifetime % women 24 00 Births attended by skilled personnel % live births 93 10 Mater nal mortality deaths per 100,000 live births 19 00 Total fertility rate births per woman 1 60 Indicator 0-1 (Equal rights) Value Reproductive autonomy Equal rights *Scores
methodology,
**For
health indicators, parity is benchmarked at 1
the case of sex ratio at birth the gender parity benchmark is set at 0 944 (see Klasen and Wink 2003) In the case of healthy life expectancy
gender parity benchmark is set at 1 06, given women's longer life expectancy
Health
are on a 0 to 1 scale, where 1 represents the optimal situation or “parity” Please see Appendix A and B for detailed
definitions, sources and periods.
all indicators, except the two
In
the
Global Gender Gap Index Indicators
Global Gender Gap Report 2023 311 Global Gender Gap Index 2023 Edition Rwanda score average score 0.699 Economy 0 963 E d u c a t i o n 0.974 Health 0 541 P o i t i c s Overview Index and Subindex 2023 Score Rank 2022 Score Rank Global Gender Gap Index 0 794 12th 0 811 6th Economic Participation and Opportunity 0.699 67th 0 747 33rd Educational Attainment 0 963 110th 0 960 108th Health and Survival 0 974 55th 0 974 59th Political Empowerment 0 541 9th 0 563 7th
2023 Indicator Rank Score* Difference F-M Min Max Economic Participation and Opportunity 67th 0 699 -Labour-force participation rate % 60th 0 817 -11 78 0-100 Wage equality for similar work 1-7 (best) 7th 0 781Estimated ear ned income int'l $ 1,000 109th 0 541 -1 34 0-150 Legislators, senior officials and managers % 74th 0 538 -30 01 0-100 Professional and technical workers % 94th 0 781 -12 30 0-100 Educational Attainment 110th 0.963 -Literacy rate % 104th 0 931Enrolment in primary education % 1st 1 000 0 86 0-100 Enrolment in secondary education % 1st 1 000 6 23 0-200 Enrolment in tertiary education % 119th 0 802 -1 60 0-200 Health and Survival 55th 0 974 -Sex ratio at birth** % 1st 0 944Healthy life expectancy** years 66th 1 042Political Empowerment 9th 0 541 -Women in parliament % 1st 1 000 22 60 0-100 Women in ministerial positions % 15th 0 909 -4 76 0-100 Years with female/male head of state (last 50) 68th 0 015 -48 56 0-50 Economy Profile Rwanda Score (imparity = 0 parity = 1) 0.794 Rank (out of 146 countries) 12th Index Edition 2023 Compare with Global average 0 1 Female vs Male Min Max64 37 52 592 93 1 58 65 01 34 99 56 15 43 8592 84 93 71 42 96 49 19 8 07 6 47-38 70 61 30 52 38 47 62 49 28 0 72
Complementary Targets and Contextual Indicators 2023
Global Gender Gap Report 2023 312 Economy Profile Rwanda Score 0.794 Rank 12th Page 2 of 2
General indicators Indicator Unit Value GDP US$ billions 11 07 GDP per capita constant '17 intl $ 1000 2 24 Population sex ratio female/male 1 05 Population growth rate % 2 37 Indicator Million people Female Male Value Total population 7 04 6 74 13 78 Work participation and leadership Indicator Unit Value Gender pay gap % (OECD countries only) n a Share of women's membership in boards % (OECD countries only) n a Firms with female majority ownership % firms 13 90 Firms with female top managers % firms 21 80 Share of workers in informal sector % workers 87 10 Indicator 1-7 (best) Value Advancement of women to leadership roles 5 64 Indicator Unit Female Male Value Unemployed adults % of labour force (15-64) 17 80 14 53 16 10 Workers employed part-time % of employed people 53 70 51 04 52 29 Proportion of time spent on unpaid domestic and care work % n a n a n a Indicator Million people Female Male Value Labour-force 1 74 1 89 3 63 Access to finance Indicator 0-1 (Equal rights) Value Access to financial services Near-equal rights Inheritance rights for widows and daughters Near-equal rights
to land assets Near-equal rights Access to non-land assets Near-equal rights Civil and political freedom Indicator Unit Value Year women received right to vote year 1961 Number of female heads of state to date number 1 Seats held in upper house % total seats 34 60 Indicator Yes/No Value Election list quotas for women, national Yes Party membership quotas, voluntary Yes Indicator 0-1 (Equal rights) Value Access to justice Restricted rights Freedom of movement Equal rights Family and care Indicator Unit Value Public spending on family benefits % GPD n a Unmet family planning % women 15-49 13 60 Early marriage % 4 00 Mean age of women at birth of first child years n a Indicator 0-1 (Equal rights) Value Right to divorce Restricted rights Indicator Days Female Male Value Length of parental leave 84 00 4 00 0 Education and skills Graduates Attainment % Female Male Parity STEM Graduates 35 36 64 64 0 55 Agri , Forestry, Fisheries & Veterinary 37 47 62 53 0 60 Arts & Humanities n a n a n a Business, Admin & Law 55 38 44 62 1 24 Education n a n a n a Engineering, Manuf & Construction n a n a n a Health & Welfare 58 31 41 69 1 40 Information & Comm Technologies n a n a n a Natural Sci , Mathematics & Statistics n a n a n a Social Sci , Jour nalism & Information n a n a n a Vocational training 3 60 3 90 0 92 PhD graduates n a n a n a Graduates % Female Male Value Graduates from tertiary education 2 25 2 12 2 18 Health Indicator Unit Value Prevalence of gender violence in lifetime % women 34 40 Births attended by skilled personnel % live births 94 20 Mater nal mortality deaths per 100,000 live births 248 00 Total fertility rate births per woman 3 87 Indicator 0-1 (Equal rights) Value Reproductive autonomy Uneven rights *Scores are on a 0 to 1 scale, where 1 represents the optimal situation or “parity” Please see Appendix A and B for detailed methodology, definitions, sources and periods. **For all indicators, except the two health indicators, parity is benchmarked at 1 In the case of sex ratio at birth the gender parity benchmark is set at 0 944 (see Klasen and Wink 2003) In the case of healthy life expectancy the gender parity benchmark is set at 1 06, given women's longer life expectancy
Access
Global Gender Gap Index Indicators
Global Gender Gap Report 2023 313 Global Gender Gap Index 2023 Edition Saudi Arabia score average score 0.521 Economy 0 986 E d u c a t i o n 0.964 Health 0 077 P o i t i c s Overview Index and Subindex 2023 Score Rank 2022 Score Rank Global Gender Gap Index 0 637 131st 0 636 127th Economic Participation and Opportunity 0.521 130th 0 524 128th Educational Attainment 0 986 87th 0 979 93rd Health and Survival 0 964 114th 0 964 116th Political Empowerment 0 077 131st 0 077 132nd
2023 Indicator Rank Score* Difference F-M Min Max Economic Participation and Opportunity 130th 0 521 -Labour-force participation rate % 134th 0 436 -44 62 0-100 Wage equality for similar work 1-7 (best) 15th 0 741Estimated ear ned income int'l $ 1,000 136th 0 288 -45 17 0-150 Legislators, senior officials and managers % - - -Professional and technical workers % - - -Educational Attainment 87th 0.986 -Literacy rate % 89th 0 974Enrolment in primary education % 1st 1 000 0 21 0-100 Enrolment in secondary education % 114th 0 961 -4 41 0-200 Enrolment in tertiary education % 102nd 0 995 -0 36 0-200 Health and Survival 114th 0 964 -Sex ratio at birth** % 1st 0 944Healthy life expectancy** years 123rd 1 009Political Empowerment 131st 0 077 -Women in parliament % 99th 0 248 -60 20 0-100 Women in ministerial positions % 140th 0 000 -100 00 0-100 Years with female/male head of state (last 50) 80th 0 000 -50 00 0-50 Economy Profile Saudi Arabia Score (imparity = 0 parity = 1) 0.637 Rank (out of 146 countries) 131st Index Edition 2023 Compare with Global average 0 1 Female vs Male Min Max79 17 34 5563 48 18 31-99 29 99 50 113 31 108 90 71 58 71 22-80 10 19 90 100 00 0 50 00 0
Complementary Targets and Contextual Indicators 2023
Inheritance
Agri , Forestry, Fisheries & Veterinary
Global Gender Gap Report 2023 314 Economy Profile Saudi Arabia Score 0.637 Rank 131st Page 2 of 2
General indicators Indicator Unit Value GDP US$ billions 833 54 GDP per capita constant '17 intl $ 1000 44 34 Population sex ratio female/male 0 73 Population growth rate % -0 13 Indicator Million people Female Male Value Total population 15 43 20 98 36 41 Work participation and leadership Indicator Unit Value Gender pay gap % (OECD countries only) n a Share of women's membership in boards % (OECD countries only) n a Firms with female majority ownership % firms n a Firms with female top managers % firms n a Share of workers in informal sector % workers n a Indicator 1-7 (best) Value Advancement of women to leadership roles 5 41 Indicator Unit Female Male Value Unemployed adults % of labour force (15-64) 15 50 2 69 5 69 Workers employed part-time % of employed people n a n a n a Proportion of time spent on unpaid domestic and care work % n a n a n a Indicator Million people Female Male Value Labour-force n a n a n a Access to finance Indicator 0-1 (Equal rights) Value Access to financial services Near-equal rights
rights
Unequal rights
for widows and daughters
assets
to non-land assets Near-equal rights Civil and political freedom Indicator Unit Value Year women received right to vote year n a Number of female heads of state to date number 0 Seats held in upper house % total seats n a Indicator Yes/No Value Election list quotas for women, national n a Party membership quotas, voluntary n a Indicator 0-1 (Equal rights) Value Access to justice Restricted rights Freedom of movement Unequal rights Family and care Indicator Unit Value Public spending on family benefits % GPD n a
family planning % women 15-49 n a Early marriage % 5 80 Mean age of women at birth of first child years n a Indicator 0-1 (Equal rights) Value Right to divorce Unequal rights Indicator Days Female Male Value Length of parental leave 70 00 3 00 0 Education and skills Graduates Attainment % Female Male Parity STEM Graduates 36 82 63 18 0 58
Access to land
Near-equal rights Access
Unmet
n a n a n a Arts & Humanities n a n a n a Business, Admin & Law n a n a n a Education n a n a n a Engineering, Manuf & Construction 2 68 97 32 0 03 Health & Welfare 60 43 39 57 1 53 Information & Comm Technologies 46 02 53 98 0 85 Natural Sci , Mathematics & Statistics n a n a n a Social Sci , Jour nalism & Information n a n a n a Vocational training 1 70 7 33 0 23 PhD graduates 0 66 1 46 1 15 Graduates % Female Male Value Graduates from tertiary education 63 40 40 83 51 39
Unit Value Prevalence
in lifetime % women n a Births attended by skilled personnel % live births 98 70 Mater nal mortality deaths per 100,000 live births 17 00 Total fertility rate births per woman 2 46
rights) Value
autonomy Restricted rights *Scores are on a 0 to 1 scale, where 1 represents the optimal situation or “parity” Please see Appendix A and B for detailed methodology, definitions, sources and periods. **For
health
parity
benchmarked
1
sex ratio
birth
gender parity benchmark
set
0 944
case of healthy life expectancy
gender parity
06,
women's longer life expectancy
Health Indicator
of gender violence
Indicator 0-1 (Equal
Reproductive
all indicators, except the two
indicators,
is
at
In the case of
at
the
is
at
(see Klasen and Wink 2003) In the
the
benchmark is set at 1
given
Global Gender Gap Index Indicators
Global Gender Gap Report 2023 315 Global Gender Gap Index 2023 Edition Senegal score average score 0.475 Economy 0 926 E d u c a t i o n 0.967 Health 0 353 P o i t i c s Overview Index and Subindex 2023 Score Rank 2022 Score Rank Global Gender Gap Index 0 680 104th 0 668 112th Economic Participation and Opportunity 0.475 137th 0 483 136th Educational Attainment 0 926 125th 0 901 127th Health and Survival 0 967 97th 0 967 96th Political Empowerment 0 353 37th 0 324 39th
2023 Indicator Rank Score* Difference F-M Min Max Economic Participation and Opportunity 137th 0 475 -Labour-force participation rate % 123rd 0 581 -27 05 0-100 Wage equality for similar work 1-7 (best) 57th 0 655Estimated ear ned income int'l $ 1,000 134th 0 366 -3 27 0-150 Legislators, senior officials and managers % 127th 0 180 -69 56 0-100 Professional and technical workers % 130th 0 405 -42 38 0-100 Educational Attainment 125th 0.926 -Literacy rate % 138th 0 664Enrolment in primary education % 1st 1 000 10 66 0-100 Enrolment in secondary education % 1st 1 000 8 55 0-200 Enrolment in tertiary education % 111th 0 915 -1 38 0-200 Health and Survival 97th 0 967 -Sex ratio at birth** % 1st 0 944Healthy life expectancy** years 106th 1 019Political Empowerment 37th 0 353 -Women in parliament % 12th 0 855 -7 80 0-100 Women in ministerial positions % 73rd 0 259 -58 82 0-100 Years with female/male head of state (last 50) 50th 0 053 -44 95 0-50 Economy Profile Sene al Score (imparity = 0 parity = 1) 0.680 Rank (out of 146 countries) 104th Index Edition 2023 Compare with Global average 0 1 Female vs Male Min Max64 53 37 485 16 1 89 84 78 15 22 71 19 28 8167 33 77 99 42 66 51 21 16 32 14 93-53 90 46 10 79 41 20 59 47 48 2 52
Complementary Targets and Contextual Indicators 2023
Global Gender Gap Report 2023 316 Economy Profile Senegal Score 0.680 Rank 104th Page 2 of 2
General indicators Indicator Unit Value GDP US$ billions 27 63 GDP per capita constant '17 intl $ 1000 3 50 Population sex ratio female/male 1 03 Population growth rate % 2 65 Indicator Million people Female Male Value Total population 8 80 8 52 17 32 Work participation and leadership Indicator Unit Value Gender pay gap % (OECD countries only) n a Share of women's membership in boards % (OECD countries only) n a Firms with female majority ownership % firms 11 80 Firms with female top managers % firms 14 10 Share of workers in informal sector % workers 90 20 Indicator 1-7 (best) Value Advancement of women to leadership roles 4 31 Indicator Unit Female Male Value Unemployed adults % of labour force (15-64) 3 16 2 82 2 95 Workers employed part-time % of employed people 75 32 56 92 63 85 Proportion of time spent on unpaid domestic and care work % n a n a n a Indicator Million people Female Male Value Labour-force 1 50 2 30 3 80 Access to finance Indicator 0-1 (Equal rights) Value Access to financial services Equal rights Inheritance rights for widows and daughters Uneven rights
to land assets Near-equal rights Access to non-land assets Equal rights Civil and political freedom Indicator Unit Value Year women received right to vote year 1960 Number of female heads of state to date number 2 Seats held in upper house % total seats n a Indicator Yes/No Value Election list quotas for women, national Yes Party membership quotas, voluntary Yes Indicator 0-1 (Equal rights) Value Access to justice Equal rights Freedom of movement Equal rights
and care
Unit Value
spending on family benefits % GPD n a Unmet family planning % women 15-49 21 70 Early marriage % 25 00 Mean age of women at birth of first child years n a
0-1
rights) Value Right to divorce Near-equal rights
Days Female Male Value Length of parental leave 98 00 1 00 0 Education and skills Graduates Attainment % Female Male Parity STEM Graduates n a n a n a
, Forestry, Fisheries & Veterinary n a n a n a Arts & Humanities n a n a n a
Law n a n a n a Education n a n a n a
n a n a n a Health & Welfare n a n a n a
Technologies n a n a n a
Access
Family
Indicator
Public
Indicator
(Equal
Indicator
Agri
Business, Admin &
Engineering, Manuf & Construction
Information & Comm
n a n a n a
n a n a n a Vocational training n a n a n a PhD graduates 0 04 0 10 0 07 Graduates % Female Male Value Graduates from tertiary education 0 0 0 Health
Unit Value Prevalence of gender violence in lifetime % women 78 00 Births attended by skilled personnel % live births 74 50 Mater nal mortality deaths per 100,000 live births 315 00 Total fertility rate births per woman 4 45
0-1
rights) Value
autonomy Unequal rights
benchmarked
1
case
sex ratio
birth the gender parity benchmark is set at 0 944
Klasen
Wink 2003)
the case of healthy life expectancy
gender parity benchmark
set at 1 06, given women's longer life expectancy
Natural Sci , Mathematics & Statistics
Social Sci , Jour nalism & Information
Indicator
Indicator
(Equal
Reproductive
*Scores are on a 0 to 1 scale, where 1 represents the optimal situation or “parity” Please see Appendix A and B for detailed methodology, definitions, sources and periods. **For all indicators, except the two health indicators, parity is
at
In the
of
at
(see
and
In
the
is
Global Gender Gap Index Indicators
Global Gender Gap Report 2023 317 Global Gender Gap Index 2023 Edition Serbia score average score 0.697 Economy 0 999 E d u c a t i o n 0.969 Health 0 376 P o i t i c s Overview Index and Subindex 2023 Score Rank 2022 Score Rank Global Gender Gap Index 0 760 38th 0 779 23rd Economic Participation and Opportunity 0.697 69th 0 689 77th Educational Attainment 0 999 37th 0 998 37th Health and Survival 0 969 79th 0 972 71st Political Empowerment 0 376 32nd 0 456 21st
2023 Indicator Rank Score* Difference F-M Min Max Economic Participation and Opportunity 69th 0 697 -Labour-force participation rate % 79th 0 761 -15 63 0-100 Wage equality for similar work 1-7 (best) 56th 0 657Estimated ear ned income int'l $ 1,000 62nd 0 665 -8 04 0-150 Legislators, senior officials and managers % 83rd 0 493 -33 96 0-100 Professional and technical workers % 1st 1 000 10 09 0-100 Educational Attainment 37th 0.999 -Literacy rate % 72nd 0 992Enrolment in primary education % 1st 1 000 0 37 0-100 Enrolment in secondary education % 1st 1 000 1 60 0-200 Enrolment in tertiary education % 1st 1 000 24 53 0-200 Health and Survival 79th 0 969 -Sex ratio at birth** % 132nd 0 935Healthy life expectancy** years 58th 1 046Political Empowerment 32nd 0 376 -Women in parliament % 42nd 0 534 -30 40 0-100 Women in ministerial positions % 34th 0 563 -28 00 0-100 Years with female/male head of state (last 50) 25th 0 161 -36 15 0-50 Economy Profile Serbia Score (imparity = 0 parity = 1) 0.760 Rank (out of 146 countries) 38th Index Edition 2023 Compare with Global average 0 1 Female vs Male Min Max65 38 49 7524 02 15 97 66 98 33 02 44 96 55 0496 07 96 44 91 60 93 21 57 25 81 78-65 20 34 80 64 00 36 00 43 07 6 93
Complementary Targets and Contextual Indicators 2023
Global Gender Gap Report 2023 318 Economy Profile Serbia Score 0.760 Rank 38th Page 2 of 2
General indicators Indicator Unit Value GDP US$ billions 63 08 GDP per capita constant '17 intl $ 1000 19 83 Population sex ratio female/male 1 09 Population growth rate % -0 94 Indicator Million people Female Male Value Total population 3 76 3 46 7 22 Work participation and leadership Indicator Unit Value Gender pay gap % (OECD countries only) n a Share of women's membership in boards % (OECD countries only) n a Firms with female majority ownership % firms 13 70 Firms with female top managers % firms 18 20 Share of workers in informal sector % workers 18 30 Indicator 1-7 (best) Value Advancement of women to leadership roles 4 91 Indicator Unit Female Male Value Unemployed adults % of labour force (15-64) 11 63 9 92 10 69 Workers employed part-time % of employed people 18 66 13 02 15 53 Proportion of time spent on unpaid domestic and care work % 19 17 8 69 n a Indicator Million people Female Male Value Labour-force 1 42 1 70 3 12 Access to finance Indicator 0-1 (Equal rights) Value Access to financial services Near-equal rights
rights for widows and daughters Near-equal rights Access to land assets Near-equal rights Access to non-land assets Near-equal rights Civil and political freedom Indicator Unit Value Year women received right to vote year 1946 Number of female heads of state to date number 3 Seats held in upper house % total seats n a Indicator Yes/No Value Election list quotas for women, national Yes Party membership quotas, voluntary Yes Indicator 0-1 (Equal rights) Value Access to justice Near-equal rights Freedom of movement Equal rights Family and care Indicator Unit Value Public spending on family benefits % GPD n a Unmet family planning % women 15-49 8 81 Early marriage % 3 50 Mean age of women at birth of first child years 28 20 Indicator 0-1 (Equal rights) Value Right to divorce Near-equal rights Indicator Days Female Male Value Length of parental leave 135 00 7 00 230 00 Education and skills Graduates Attainment % Female Male Parity STEM Graduates n a n a n a Agri , Forestry, Fisheries & Veterinary n a n a n a Arts & Humanities 69 18 30 82 2 25 Business, Admin & Law 60 00 40 00 1 50 Education 84 12 15 88 5 30 Engineering, Manuf & Construction 38 53 61 47 0 63 Health & Welfare 74 91 25 09 2 99 Information & Comm Technologies 28 55 71 45 0 40 Natural Sci , Mathematics & Statistics 71 16 28 84 2 47 Social Sci , Jour nalism & Information n a n a n a Vocational training 23 32 25 95 0 90 PhD graduates 0 36 0 14 0 26 Graduates % Female Male Value Graduates from tertiary education n a n a n a Health Indicator Unit Value Prevalence of gender violence in lifetime % women 23 70 Births attended by skilled personnel % live births 99 90 Mater nal mortality deaths per 100,000 live births 12 00 Total fertility rate births per woman 1 48 Indicator 0-1 (Equal rights) Value Reproductive autonomy Equal rights *Scores
on a 0 to 1 scale, where 1 represents the optimal situation or
parity” Please see Appendix A and B for detailed methodology, definitions, sources and periods. **For all indicators, except the two health indicators, parity is benchmarked at 1 In the case of sex ratio at birth the gender parity benchmark is set at 0 944 (see Klasen and Wink 2003) In the case of healthy life expectancy the gender parity benchmark is set at 1 06, given women's longer life expectancy
Inheritance
are
“
Global Gender Gap Index Indicators
Global Gender Gap Report 2023 319 Global Gender Gap Index 2023 Edition Sierra Leone score average score 0.684 Economy 0 932 E d u c a t i o n 0.966 Health 0 087 P o i t i c s Overview Index and Subindex 2023 Score Rank 2022 Score Rank Global Gender Gap Index 0 667 112th 0 672 109th Economic Participation and Opportunity 0.684 78th 0 718 56th Educational Attainment 0 932 124th 0 921 124th Health and Survival 0 966 104th 0 966 103rd Political Empowerment 0 087 128th 0 083 131st
2023 Indicator Rank Score* Difference F-M Min Max Economic Participation and Opportunity 78th 0 684 -Labour-force participation rate % 9th 0 911 -5 07 0-100 Wage equality for similar work 1-7 (best) 60th 0 653Estimated ear ned income int'l $ 1,000 32nd 0 743 -0 48 0-150 Legislators, senior officials and managers % 63rd 0 560 -28 17 0-100 Professional and technical workers % 123rd 0 435 -39 36 0-100 Educational Attainment 124th 0.932 -Literacy rate % 134th 0 725Enrolment in primary education % 1st 1 000 0 20 0-100 Enrolment in secondary education % 110th 0 966 -1 47 0-200 Enrolment in tertiary education % - - -Health and Survival 104th 0 966 -Sex ratio at birth** % 1st 0 944Healthy life expectancy** years 113th 1 015Political Empowerment 128th 0 087 -Women in parliament % 125th 0 149 -74 00 0-100 Women in ministerial positions % 101st 0 167 -71 43 0-100 Years with female/male head of state (last 50) 80th 0 000 -50 00 0-50 Economy Profile Sierra Leone Score (imparity = 0 parity = 1) 0.667 Rank (out of 146 countries) 112th Index Edition 2023 Compare with Global average 0 1 Female vs Male Min Max56 65 51 581 85 1 38 64 08 35 91 69 68 30 3298 26 98 46 42 53 41 06--87 00 13 00 85 71 14 29 50 00 0
Complementary Targets and Contextual Indicators 2023
Graduates
Agri , Forestry, Fisheries & Veterinary
Information & Comm Technologies
Natural Sci , Mathematics & Statistics
Social Sci , Jour nalism & Information
*Scores are on a 0 to 1 scale, where 1 represents the optimal situation or “parity” Please see Appendix A and B for detailed methodology, definitions, sources and periods.
Global Gender Gap Report 2023 320 Economy Profile Sierra Leone Score 0.667 Rank 112th Page 2 of 2
General indicators Indicator Unit Value GDP US$ billions 4 04 GDP per capita constant '17 intl $ 1000 1 61 Population sex ratio female/male 1 00 Population growth rate % 2 24 Indicator Million people Female Male Value Total population 4 29 4 31 8 61 Work participation and leadership Indicator Unit Value Gender pay gap % (OECD countries only) n a Share of women's membership in boards % (OECD countries only) n a Firms with female majority ownership % firms 16 90 Firms with female top managers % firms 15 90 Share of workers in informal sector % workers 93 10 Indicator 1-7 (best) Value Advancement of women to leadership roles 3 47 Indicator Unit Female Male Value Unemployed adults % of labour force (15-64) 2 25 4 37 3 27 Workers employed part-time % of employed people 28 42 21 61 25 16 Proportion of time spent on unpaid domestic and care work % n a n a n a Indicator Million people Female Male Value Labour-force 1 08 1 06 2 14 Access to finance Indicator 0-1 (Equal rights) Value Access to financial services Near-equal rights
rights for widows and daughters Uneven rights
to land assets Uneven rights
to non-land assets Uneven rights Civil and political freedom Indicator Unit Value Year women received right to vote year 1961 Number of female heads of state to date number 0 Seats held in upper house % total seats n a Indicator Yes/No Value Election list quotas for women, national Yes Party membership quotas, voluntary Yes Indicator 0-1 (Equal rights) Value Access to justice Near-equal rights Freedom of movement Equal rights
and care Indicator Unit Value
spending on family benefits % GPD n a
family planning % women 15-49 24 80 Early marriage % 19 00 Mean age of women at birth of first child years n a Indicator 0-1 (Equal rights) Value Right to divorce Restricted rights Indicator Days Female Male Value Length of parental leave 84 00 0 0
and skills
Inheritance
Access
Access
Family
Public
Unmet
Education
Attainment % Female Male Parity STEM Graduates n a n a n a
n a n a n a
n a n a n a
Arts & Humanities
n a n a n a Education n a n a n a Engineering,
Construction n a n a n a Health
Welfare n a n a n a
Business, Admin & Law
Manuf &
&
n a n a n a
n a n a n a
n a n a n a
n a n a n a PhD
n a n a n a Graduates % Female Male Value
n a n a n a Health
Vocational training
graduates
Graduates from tertiary education
Value Prevalence of gender violence in lifetime % women 45 30 Births attended by skilled personnel % live births 86 90 Mater nal mortality deaths per 100,000 live births 1 12 Total fertility rate births per woman 4 08
rights) Value
Restricted rights
parity
benchmarked
case
sex ratio
birth the gender parity benchmark is set at 0 944 (see Klasen
Wink 2003) In the case of healthy life expectancy
gender parity benchmark is set at 1 06, given women's longer life expectancy
Indicator Unit
Indicator 0-1 (Equal
Reproductive autonomy
**For all indicators, except the two health indicators,
is
at 1 In the
of
at
and
the
Global Gender Gap Index Indicators
Global Gender Gap Report 2023 321 Global Gender Gap Index 2023 Edition Singapore score average score 0.774 Economy 0 993 E d u c a t i o n 0.971 Health 0 220 P o i t i c s Overview Index and Subindex 2023 Score Rank 2022 Score Rank Global Gender Gap Index 0 739 49th 0 734 49th Economic Participation and Opportunity 0.774 23rd 0 765 28th Educational Attainment 0 993 72nd 0 993 65th Health and Survival 0 971 66th 0 963 123rd Political Empowerment 0 220 68th 0 217 66th
2023 Indicator Rank Score* Difference F-M Min Max Economic Participation and Opportunity 23rd 0 774 -Labour-force participation rate % 54th 0 835 -12 65 0-100 Wage equality for similar work 1-7 (best) 6th 0 783Estimated ear ned income int'l $ 1,000 30th 0 747 -30 53 0-150 Legislators, senior officials and managers % 48th 0 616 -23 72 0-100 Professional and technical workers % 85th 0 893 -5 65 0-100 Educational Attainment 72nd 0.993 -Literacy rate % 90th 0 972Enrolment in primary education % 1st 1 000 0 14 0-100 Enrolment in secondary education % 88th 0 991 -0 94 0-200 Enrolment in tertiary education % 1st 1 000 9 89 0-200 Health and Survival 66th 0 971 -Sex ratio at birth** % 1st 0 944Healthy life expectancy** years 80th 1 032Political Empowerment 68th 0 220 -Women in parliament % 56th 0 410 -41 80 0-100 Women in ministerial positions % 106th 0 154 -73 33 0-100 Years with female/male head of state (last 50) 31st 0 123 -39 07 0-50 Economy Profile Singapore Score (imparity = 0 parity = 1) 0.739 Rank (out of 146 countries) 49th Index Edition 2023 Compare with Global average 0 1 Female vs Male Min Max76 50 63 85120 60 90 07 61 86 38 14 52 83 47 1799 73 99 87 103 66 102 72 88 38 98 27-70 90 29 10 86 67 13 33 44 54 5 46
Complementary Targets and Contextual Indicators 2023
Global Gender Gap Report 2023 322 Economy Profile Singapore Score 0.739 Rank 49th Page 2 of 2
General indicators Indicator Unit Value GDP US$ billions 396 99 GDP per capita constant '17 intl $ 1000 106 03 Population sex ratio female/male 0 91 Population growth rate % -4 17 Indicator Million people Female Male Value Total population 2 85 3 13 5 98 Work participation and leadership Indicator Unit Value Gender pay gap % (OECD countries only) n a Share of women's membership in boards % (OECD countries only) n a Firms with female majority ownership % firms n a Firms with female top managers % firms n a Share of workers in informal sector % workers n a Indicator 1-7 (best) Value Advancement of women to leadership roles 5 74 Indicator Unit Female Male Value Unemployed adults % of labour force (15-64) 5 14 4 33 4 71 Workers employed part-time % of employed people 14 11 7 68 10 71 Proportion of time spent on unpaid domestic and care work % n a n a n a Indicator Million people Female Male Value Labour-force 1 04 1 19 2 23 Access to finance Indicator 0-1 (Equal rights) Value Access to financial services Equal rights Inheritance rights for widows and daughters Near-equal rights Access to land assets Equal rights Access to non-land assets Equal rights Civil and political freedom Indicator Unit Value Year women received right to vote year 1965 Number of female heads of state to date number 1 Seats held in upper house % total seats n a Indicator Yes/No Value Election list quotas for women, national n a Party membership quotas, voluntary n a Indicator 0-1 (Equal rights) Value Access to justice Equal rights Freedom of movement Equal rights Family and care Indicator Unit Value Public spending on family benefits % GPD n a Unmet family planning % women 15-49 n a Early marriage % 0 40 Mean age of women at birth of first child years n a Indicator 0-1 (Equal rights) Value Right to divorce Equal rights Indicator Days Female Male Value Length of parental leave 84 00 14 00 28 00 Education and skills Graduates Attainment % Female Male Parity STEM Graduates n a n a n a Agri , Forestry, Fisheries & Veterinary 64 96 35 04 1 85 Arts & Humanities 65 91 34 09 1 93 Business, Admin & Law 58 27 41 73 1 40 Education 83 21 16 79 4 95 Engineering, Manuf & Construction n a n a n a Health & Welfare n a n a n a Information & Comm Technologies 32 22 67 78 0 48 Natural Sci , Mathematics & Statistics 61 72 38 28 1 61 Social Sci , Jour nalism & Information 65 76 34 24 1 92 Vocational training 22 55 24 46 0 92 PhD graduates n a n a n a Graduates % Female Male Value Graduates from tertiary education 72 57 57 63 64 69 Health Indicator Unit Value Prevalence of gender violence in lifetime % women 6 10 Births attended by skilled personnel % live births 99 60 Mater nal mortality deaths per 100,000 live births 8 00 Total fertility rate births per woman 1 10 Indicator 0-1 (Equal rights) Value Reproductive autonomy Equal rights *Scores are on a 0 to 1 scale, where 1 represents the optimal situation or “parity” Please see Appendix A and B for detailed methodology, definitions, sources and periods. **For all indicators, except the two health indicators, parity is benchmarked at 1 In the case of sex ratio at birth the gender parity benchmark is set at 0 944 (see Klasen and Wink 2003) In the case of healthy life expectancy the gender parity benchmark is set at 1 06, given women's longer life expectancy
Global Gender Gap Index Indicators
Global Gender Gap Report 2023 323 Global Gender Gap Index 2023 Edition Slovakia score average score 0.718 Economy 1 000 E d u c a t i o n 0.980 Health 0 183 P o i t i c s Overview Index and Subindex 2023 Score Rank 2022 Score Rank Global Gender Gap Index 0 720 63rd 0 717 67th Economic Participation and Opportunity 0.718 50th 0 699 70th Educational Attainment 1 000 1st 1 000 24th Health and Survival 0 980 1st 0 980 1st Political Empowerment 0 183 80th 0 189 83rd
2023 Indicator Rank Score* Difference F-M Min Max Economic Participation and Opportunity 50th 0 718 -Labour-force participation rate % 56th 0 830 -11 25 0-100 Wage equality for similar work 1-7 (best) 86th 0 611Estimated ear ned income int'l $ 1,000 55th 0 680 -12 17 0-150 Legislators, senior officials and managers % 50th 0 613 -24 01 0-100 Professional and technical workers % 1st 1 000 12 52 0-100 Educational Attainment 1st 1.000 -Literacy rate % 1st 1 000Enrolment in primary education % 1st 1 000 0 23 0-100 Enrolment in secondary education % 1st 1 000 1 05 0-200 Enrolment in tertiary education % 1st 1 000 18 71 0-200 Health and Survival 1st 0 980 -Sex ratio at birth** % 1st 0 944Healthy life expectancy** years 1st 1 060Political Empowerment 80th 0 183 -Women in parliament % 87th 0 282 -56 00 0-100 Women in ministerial positions % 101st 0 167 -71 43 0-100 Years with female/male head of state (last 50) 32nd 0 122 -39 09 0-50 Economy Profile Slovakia Score (imparity = 0 parity = 1) 0.720 Rank (out of 146 countries) 63rd Index Edition 2023 Compare with Global average 0 1 Female vs Male Min Max66 33 55 0838 09 25 92 62 01 37 99 43 74 56 2696 99 97 22 90 08 91 14 38 51 57 22-78 00 22 00 85 71 14 29 44 55 5 46
Complementary Targets and Contextual Indicators 2023
Global Gender Gap Report 2023 324 Economy Profile Slovakia Score 0.720 Rank 63rd Page 2 of 2
General indicators Indicator Unit Value GDP US$ billions 116 53 GDP per capita constant '17 intl $ 1000 31 87 Population sex ratio female/male 1 05 Population growth rate % -0 21 Indicator Million people Female Male Value Total population 2 89 2 76 5 64 Work participation and leadership Indicator Unit Value Gender pay gap % (OECD countries only) 11 70 Share of women's membership in boards % (OECD countries only) 27 70 Firms with female majority ownership % firms 11 80 Firms with female top managers % firms 22 90 Share of workers in informal sector % workers 16 30 Indicator 1-7 (best) Value Advancement of women to leadership roles 4 69 Indicator Unit Female Male Value Unemployed adults % of labour force (15-64) 6 50 6 00 6 20 Workers employed part-time % of employed people 36 04 21 87 28 51 Proportion of time spent on unpaid domestic and care work % n a n a n a Indicator Million people Female Male Value Labour-force 1 25 1 38 2 63 Access to finance Indicator 0-1 (Equal rights) Value Access to financial services Equal rights Inheritance rights for widows and daughters Equal rights Access to land assets Equal rights Access to non-land assets Equal rights Civil and political freedom Indicator Unit Value Year women received right to vote year 1993 Number of female heads of state to date number 2 Seats held in upper house % total seats n a Indicator Yes/No Value Election list quotas for women, national Yes Party membership quotas, voluntary Yes Indicator 0-1 (Equal rights) Value Access to justice Near-equal rights Freedom of movement Equal rights Family and care Indicator Unit Value Public spending on family benefits % GPD 1 79 Unmet family planning % women 15-49 n a Early marriage % 1 10 Mean age of women at birth of first child years 27 20 Indicator 0-1 (Equal rights) Value Right to divorce Equal rights Indicator Days Female Male Value Length of parental leave 238 00 0 899 00 Education and skills Graduates Attainment % Female Male Parity STEM Graduates 35 22 64 78 0 54 Agri , Forestry, Fisheries & Veterinary 59 28 40 72 1 46 Arts & Humanities 68 39 31 61 2 16 Business, Admin & Law n a n a n a Education 81 80 18 20 4 50 Engineering, Manuf & Construction 28 16 71 84 0 39 Health & Welfare 77 00 23 00 3 35 Information & Comm Technologies n a n a n a Natural Sci , Mathematics & Statistics 63 71 36 29 1 76 Social Sci , Jour nalism & Information 70 79 29 21 2 42 Vocational training 21 27 24 50 0 87 PhD graduates 0 76 0 92 0 84 Graduates % Female Male Value Graduates from tertiary education 42 10 24 71 33 18 Health Indicator Unit Value Prevalence of gender violence in lifetime % women 23 00 Births attended by skilled personnel % live births 98 20 Mater nal mortality deaths per 100,000 live births 5 00 Total fertility rate births per woman 1 57 Indicator 0-1 (Equal rights) Value Reproductive autonomy Equal rights *Scores
optimal situation
parity
methodology, de
periods. **For
two health indicators, parity is benchmarked at 1 In the case of sex ratio at birth the gender parity benchmark is set at 0 944 (see Klasen and Wink 2003) In the case of healthy life expectancy
gender parity benchmark is set at 1 06, given women's longer life expectancy
are on a 0 to 1 scale, where 1 represents the
or “
” Please see Appendix A and B for detailed
finitions, sources and
all indicators, except the
the
Global Gender Gap Index Indicators
Global Gender Gap Report 2023 325 Global Gender Gap Index 2023 Edition Slovenia score average score 0.760 Economy 1 000 E d u c a t i o n 0.972 Health 0 358 P o i t i c s Overview Index and Subindex 2023 Score Rank 2022 Score Rank Global Gender Gap Index 0 773 29th 0 744 39th Economic Participation and Opportunity 0.760 30th 0 802 12th Educational Attainment 1 000 1st 1 000 26th Health and Survival 0 972 63rd 0 977 48th Political Empowerment 0 358 36th 0 197 79th
2023 Indicator Rank Score* Difference F-M Min Max Economic Participation and Opportunity 30th 0 760 -Labour-force participation rate % 35th 0 860 -8 81 0-100 Wage equality for similar work 1-7 (best) 21st 0 735Estimated ear ned income int'l $ 1,000 35th 0 737 -12 10 0-150 Legislators, senior officials and managers % 76th 0 515 -32 02 0-100 Professional and technical workers % 1st 1 000 8 55 0-100 Educational Attainment 1st 1.000 -Literacy rate % 1st 1 000Enrolment in primary education % 1st 1 000 0 81 0-100 Enrolment in secondary education % 1st 1 000 1 74 0-200 Enrolment in tertiary education % 1st 1 000 29 13 0-200 Health and Survival 63rd 0 972 -Sex ratio at birth** % 125th 0 938Healthy life expectancy** years 54th 1 050Political Empowerment 36th 0 358 -Women in parliament % 33rd 0 608 -24 40 0-100 Women in ministerial positions % 28th 0 625 -23 08 0-100 Years with female/male head of state (last 50) 57th 0 035 -46 62 0-50 Economy Profile Slovenia Score (imparity = 0 parity = 1) 0.773 Rank (out of 146 countries) 29th Index Edition 2023 Compare with Global average 0 1 Female vs Male Min Max62 86 54 0546 05 33 95 66 01 33 99 45 72 54 2898 81 99 62 111 13 112 87 65 88 95 01-62 20 37 80 61 54 38 46 48 31 1 69
Complementary Targets and Contextual Indicators 2023
Global Gender Gap Report 2023 326 Economy Profile Slovenia Score 0.773 Rank 29th Page 2 of 2
General indicators Indicator Unit Value GDP US$ billions 61 75 GDP per capita constant '17 intl $ 1000 40 04 Population sex ratio female/male 0 99 Population growth rate % 0 27 Indicator Million people Female Male Value Total population 1 05 1 07 2 12 Work participation and leadership Indicator Unit Value Gender pay gap % (OECD countries only) 8 19 Share of women's membership in boards % (OECD countries only) 19 40 Firms with female majority ownership % firms 11 10 Firms with female top managers % firms 18 80 Share of workers in informal sector % workers 7 70 Indicator 1-7 (best) Value Advancement of women to leadership roles 5 47 Indicator Unit Female Male Value Unemployed adults % of labour force (15-64) 4 30 3 80 4 00 Workers employed part-time % of employed people 33 42 23 31 27 93 Proportion of time spent on unpaid domestic and care work % n a n a n a Indicator Million people Female Male Value Labour-force 0 44 0 52 0 95 Access to finance Indicator 0-1 (Equal rights) Value Access to financial services Equal rights Inheritance rights for widows and daughters Equal rights Access to land assets Near-equal rights Access to non-land assets Equal rights Civil and political freedom Indicator Unit Value Year women received right to vote year 1946 Number of female heads of state to date number 2 Seats held in upper house % total seats 17 50 Indicator Yes/No Value Election list quotas for women, national Yes Party membership quotas, voluntary Yes Indicator 0-1 (Equal rights) Value Access to justice Equal rights Freedom of movement Equal rights Family and care Indicator Unit Value Public spending on family benefits % GPD 1 81 Unmet family planning % women 15-49 n a Early marriage % 0 20 Mean age of women at birth of first child years 29 00 Indicator 0-1 (Equal rights) Value Right to divorce Equal rights Indicator Days Female Male Value Length of parental leave 105 00 30 00 0 Education and skills Graduates Attainment % Female Male Parity STEM Graduates 33 32 66 68 0 50 Agri , Forestry, Fisheries & Veterinary 58 62 41 38 1 42 Arts & Humanities 68 02 31 98 2 13 Business, Admin & Law 65 74 34 26 1 92 Education n a n a n a Engineering, Manuf & Construction 26 73 73 27 0 36 Health & Welfare 77 69 22 31 3 48 Information & Comm Technologies 14 08 85 92 0 16 Natural Sci , Mathematics & Statistics 61 44 38 56 1 59 Social Sci , Jour nalism & Information 70 44 29 56 2 38 Vocational training 31 00 39 03 0 79 PhD graduates 3 89 3 27 3 58 Graduates % Female Male Value Graduates from tertiary education 59 96 34 01 46 49 Health Indicator Unit Value Prevalence of gender violence in lifetime % women 13 00 Births attended by skilled personnel % live births n a Mater nal mortality deaths per 100,000 live births 7 00 Total fertility rate births per woman 1 60 Indicator 0-1 (Equal rights) Value Reproductive autonomy Equal rights *Scores are on a 0 to 1 scale, where 1 represents the optimal situation or “parity” Please see Appendix A and B for detailed methodology, definitions, sources and periods. **For all indicators, except the two health indicators, parity is benchmarked at 1 In the case of sex ratio at birth the gender parity benchmark is set at 0 944 (see Klasen and Wink 2003) In the case of healthy life expectancy the gender parity benchmark is set at 1 06, given women's longer life expectancy
Global Gender Gap Index Indicators
Global Gender Gap Report 2023 327 Global Gender Gap Index 2023 Edition South Africa score average score 0.676 Economy 0 998 E d u c a t i o n 0.979 Health 0 497 P o i t i c s Overview Index and Subindex 2023 Score Rank 2022 Score Rank Global Gender Gap Index 0 787 20th 0 782 20th Economic Participation and Opportunity 0.676 81st 0 649 92nd Educational Attainment 0 998 43rd 0 998 41st Health and Survival 0 979 29th 0 979 32nd Political Empowerment 0 497 13th 0 502 12th
2023 Indicator Rank Score* Difference F-M Min Max Economic Participation and Opportunity 81st 0 676 -Labour-force participation rate % 66th 0 795 -12 80 0-100 Wage equality for similar work 1-7 (best) 111th 0 549Estimated ear ned income int'l $ 1,000 42nd 0 714 -4 45 0-150 Legislators, senior officials and managers % 88th 0 462 -36 76 0-100 Professional and technical workers % 1st 1 000 5 07 0-100 Educational Attainment 43rd 0.998 -Literacy rate % 79th 0 989Enrolment in primary education % 1st 1 000 2 14 0-100 Enrolment in secondary education % 1st 1 000 8 71 0-200 Enrolment in tertiary education % 1st 1 000 10 67 0-200 Health and Survival 29th 0 979 -Sex ratio at birth** % 1st 0 944Healthy life expectancy** years 40th 1 057Political Empowerment 13th 0 497 -Women in parliament % 9th 0 862 -7 40 0-100 Women in ministerial positions % 13th 0 929 -3 70 0-100 Years with female/male head of state (last 50) 79th 0 000 -49 99 0-50 Economy Profile
Score (imparity = 0 parity = 1) 0.787 Rank (out of 146 countries) 20th Index Edition 2023 Compare with Global average 0 1 Female vs Male Min Max62 36 49 5615 60 11 14 68 38 31 62 47 46 52 5487 26 89 41 97 78 106 49 18 93 29 60-53 70 46 30 51 85 48 15 50 00 0 00
South Africa
Complementary Targets and Contextual Indicators 2023
Global Gender Gap Report 2023 328 Economy Profile South Africa Score 0.787 Rank 20th Page 2 of 2
General indicators Indicator Unit Value GDP US$ billions 419 02 GDP per capita constant '17 intl $ 1000 13 31 Population sex ratio female/male 1 06 Population growth rate % 1 00 Indicator Million people Female Male Value Total population 30 73 29 17 59 89 Work participation and leadership Indicator Unit Value Gender pay gap % (OECD countries only) n a Share of women's membership in boards % (OECD countries only) 34 00 Firms with female majority ownership % firms 8 70 Firms with female top managers % firms 38 50 Share of workers in informal sector % workers 41 60 Indicator 1-7 (best) Value Advancement of women to leadership roles 4 55 Indicator Unit Female Male Value Unemployed adults % of labour force (15-64) 31 27 27 90 29 44 Workers employed part-time % of employed people 18 28 11 20 14 38 Proportion of time spent on unpaid domestic and care work % n a n a n a Indicator Million people Female Male Value Labour-force 10 19 11 86 22 05 Access to finance Indicator 0-1 (Equal rights) Value Access to financial services Equal rights Inheritance rights for widows and daughters Near-equal rights Access to land assets Near-equal rights Access to non-land assets Near-equal rights Civil and political freedom Indicator Unit Value Year women received right to vote year 1930, 1984, 1994 Number of female heads of state to date number 1 Seats held in upper house % total seats 44 40 Indicator Yes/No Value Election list quotas for women, national Yes Party membership quotas, voluntary Yes Indicator 0-1 (Equal rights) Value Access to justice Equal rights Freedom of movement Equal rights Family and care Indicator Unit Value Public spending on family benefits % GPD n a Unmet family planning % women 15-49 14 90 Early marriage % 6 30 Mean age of women at birth of first child years n a Indicator 0-1 (Equal rights) Value Right to divorce Near-equal rights Indicator Days Female Male Value Length of parental leave 120 00 10 00 0 Education and skills Graduates Attainment % Female Male Parity STEM Graduates 42 76 57 24 0 75 Agri , Forestry, Fisheries & Veterinary 52 22 47 78 1 09 Arts & Humanities 61 96 38 04 1 63 Business, Admin & Law 57 28 42 72 1 34 Education 76 12 23 88 3 19 Engineering, Manuf & Construction 32 24 67 76 0 48 Health & Welfare 74 89 25 11 2 98 Information & Comm Technologies 38 43 61 57 0 62 Natural Sci , Mathematics & Statistics 56 35 43 65 1 29 Social Sci , Jour nalism & Information 68 30 31 70 2 15 Vocational training 2 31 2 00 1 16 PhD graduates 0 18 0 92 0 69 Graduates % Female Male Value Graduates from tertiary education 15 77 9 32 12 52 Health Indicator Unit Value Prevalence of gender violence in lifetime % women 20 60 Births attended by skilled personnel % live births 96 70 Mater nal mortality deaths per 100,000 live births 119 00 Total fertility rate births per woman 2 40 Indicator 0-1 (Equal rights) Value Reproductive autonomy Equal rights *Scores
detailed methodology, de
sources
periods. **For
indicators, except the two health indicators, parity is benchmarked at 1 In the case of sex ratio at birth the gender parity benchmark is set at 0 944 (see Klasen and Wink 2003) In the case of healthy life expectancy the gender parity benchmark is set at 1 06, given women's longer life expectancy
are on a 0 to 1 scale, where 1 represents the optimal situation or “parity” Please see Appendix A and B for
finitions,
and
all
Global Gender Gap Index Indicators
Global Gender Gap Report 2023 329 Global Gender Gap Index 2023 Edition Spain score average score 0.722 Economy 0 998 E d u c a t i o n 0.967 Health 0 475 P o i t i c s Overview Index and Subindex 2023 Score Rank 2022 Score Rank Global Gender Gap Index 0 791 18th 0 788 17th Economic Participation and Opportunity 0.722 48th 0 709 64th Educational Attainment 0 998 39th 0 998 36th Health and Survival 0 967 98th 0 965 107th Political Empowerment 0 475 18th 0 481 17th
2023 Indicator Rank Score* Difference F-M Min Max Economic Participation and Opportunity 48th 0 722 -Labour-force participation rate % 41st 0 847 -9 60 0-100 Wage equality for similar work 1-7 (best) 64th 0 650Estimated ear ned income int'l $ 1,000 43rd 0 709 -12 96 0-150 Legislators, senior officials and managers % 82nd 0 500 -33 35 0-100 Professional and technical workers % 1st 1 000 2 19 0-100 Educational Attainment 39th 0.998 -Literacy rate % 76th 0 992Enrolment in primary education % 1st 1 000 0 38 0-100 Enrolment in secondary education % 1st 1 000 3 61 0-200 Enrolment in tertiary education % 1st 1 000 20 34 0-200 Health and Survival 98th 0 967 -Sex ratio at birth** % 115th 0 943Healthy life expectancy** years 100th 1 022Political Empowerment 18th 0 475 -Women in parliament % 20th 0 736 -15 20 0-100 Women in ministerial positions % 1st 1 000 27 27 0-100 Years with female/male head of state (last 50) 80th 0 000 -50 00 0-50 Economy Profile Spain Score (imparity = 0 parity = 1) 0.791 Rank (out of 146 countries) 18th Index Edition 2023 Compare with Global average 0 1 Female vs Male Min Max62 70 53 1044 52 31 56 66 68 33 33 48 91 51 1097 96 98 34 123 08 126 70 86 04 106 39-57 60 42 40 36 36 63 64 50 00 0
Complementary Targets and Contextual Indicators 2023
Global Gender Gap Report 2023 330 Economy Profile Spain Score 0.791 Rank 18th Page 2 of 2
General indicators Indicator Unit Value GDP US$ billions 1,427 38 GDP per capita constant '17 intl $ 1000 37 91 Population sex ratio female/male 1 04 Population growth rate % 0 11 Indicator Million people Female Male Value Total population 24 25 23 31 47 56 Work participation and leadership Indicator Unit Value Gender pay gap % (OECD countries only) 8 09 Share of women's membership in boards % (OECD countries only) 32 60 Firms with female majority ownership % firms 10 10 Firms with female top managers % firms 17 60 Share of workers in informal sector % workers 6 20 Indicator 1-7 (best) Value Advancement of women to leadership roles 4 92 Indicator Unit Female Male Value Unemployed adults % of labour force (15-64) 14 90 11 40 13 00 Workers employed part-time % of employed people 45 58 27 87 36 04 Proportion of time spent on unpaid domestic and care work % n a n a n a Indicator Million people Female Male Value Labour-force 10 32 11 48 21 79 Access to finance Indicator 0-1 (Equal rights) Value Access to financial services Equal rights Inheritance rights for widows and daughters Near-equal rights Access to land assets Near-equal rights Access to non-land assets Equal rights Civil and political freedom Indicator Unit Value Year women received right to vote year 1931 Number of female heads of state to date number 0 Seats held in upper house % total seats 39 30 Indicator Yes/No Value Election list quotas for women, national Yes Party membership quotas, voluntary Yes Indicator 0-1 (Equal rights) Value Access to justice Equal rights Freedom of movement Equal rights Family and care Indicator Unit Value Public spending on family benefits % GPD 1 27 Unmet family planning % women 15-49 n a Early marriage % 4 00 Mean age of women at birth of first child years 31 20 Indicator 0-1 (Equal rights) Value Right to divorce Equal rights Indicator Days Female Male Value Length of parental leave 112 00 112 00 0 Education and skills Graduates Attainment % Female Male Parity STEM Graduates 29 56 70 44 0 42 Agri , Forestry, Fisheries & Veterinary n a n a n a Arts & Humanities 59 05 40 95 1 44 Business, Admin & Law 55 87 44 13 1 27 Education 76 10 23 90 3 18 Engineering, Manuf & Construction 26 61 73 39 0 36 Health & Welfare 72 59 27 41 2 65 Information & Comm Technologies 12 97 87 03 0 15 Natural Sci , Mathematics & Statistics 49 94 50 06 1 00 Social Sci , Jour nalism & Information 63 97 36 03 1 78 Vocational training 14 72 19 07 0 77 PhD graduates 0 75 1 03 0 88 Graduates % Female Male Value Graduates from tertiary education 57 81 37 02 47 17 Health Indicator Unit Value Prevalence of gender violence in lifetime % women 13 00 Births attended by skilled personnel % live births 99 90 Mater nal mortality deaths per 100,000 live births 4 00 Total fertility rate births per woman 1 23 Indicator 0-1 (Equal rights) Value Reproductive autonomy Equal rights *Scores are on a 0 to 1 scale, where 1 represents the optimal situation or “parity” Please see Appendix A and B for detailed methodology, definitions, sources and periods. **For all indicators, except the two health indicators, parity is benchmarked at 1 In the case of sex ratio at birth the gender parity benchmark is set at 0 944 (see Klasen and Wink 2003) In the case of healthy life expectancy the gender parity benchmark is set at 1 06, given women's longer life expectancy
Global Gender Gap Index Indicators
Global Gender Gap Report 2023 331 Global Gender Gap Index 2023 Edition Sri Lanka score average score 0.555 Economy 0 988 E d u c a t i o n 0.980 Health 0 130 P o i t i c s Overview Index and Subindex 2023 Score Rank 2022 Score Rank Global Gender Gap Index 0 663 115th 0 670 110th Economic Participation and Opportunity 0.555 124th 0 556 122nd Educational Attainment 0 988 85th 0 988 80th Health and Survival 0 980 1st 0 980 1st Political Empowerment 0 130 106th 0 157 93rd
2023 Indicator Rank Score* Difference F-M Min Max Economic Participation and Opportunity 124th 0 555 -Labour-force participation rate % 133rd 0 445 -39 84 0-100 Wage equality for similar work 1-7 (best) 42nd 0 695Estimated ear ned income int'l $ 1,000 132nd 0 389 -11 98 0-150 Legislators, senior officials and managers % 105th 0 370 -45 97 0-100 Professional and technical workers % 82nd 0 905 -5 00 0-100 Educational Attainment 85th 0.988 -Literacy rate % 85th 0 982Enrolment in primary education % 99th 0 982 -1 77 0-100 Enrolment in secondary education % 1st 1 000 4 59 0-200 Enrolment in tertiary education % 1st 1 000 9 71 0-200 Health and Survival 1st 0 980 -Sex ratio at birth** % 1st 0 944Healthy life expectancy** years 1st 1 060Political Empowerment 106th 0 130 -Women in parliament % 138th 0 056 -89 40 0-100 Women in ministerial positions % 140th 0 000 -100 00 0-100 Years with female/male head of state (last 50) 14th 0 255 -29 71 0-50 Economy Profile Sri Lanka Score (imparity = 0 parity = 1) 0.663 Rank (out of 146 countries) 115th Index Edition 2023 Compare with Global average 0 1 Female vs Male Min Max71 80 31 9619 59 7 62 72 99 27 01 52 50 47 5098 30 96 53 98 04 102 63 17 29 27 00-94 70 5 30 100 00 0 39 85 10 15
Complementary Targets and Contextual Indicators 2023
Global Gender Gap Report 2023 332 Economy Profile Sri Lanka Score 0.663 Rank 115th Page 2 of 2
General indicators Indicator Unit Value GDP US$ billions 88 93 GDP per capita constant '17 intl $ 1000 13 39 Population sex ratio female/male 1 08 Population growth rate % 1 08 Indicator Million people Female Male Value Total population 11 32 10 52 21 83 Work participation and leadership Indicator Unit Value Gender pay gap % (OECD countries only) n a Share of women's membership in boards % (OECD countries only) n a Firms with female majority ownership % firms n a Firms with female top managers % firms n a Share of workers in informal sector % workers 67 20 Indicator 1-7 (best) Value Advancement of women to leadership roles 4 71 Indicator Unit Female Male Value Unemployed adults % of labour force (15-64) 8 64 4 22 5 74 Workers employed part-time % of employed people 42 33 30 53 34 41 Proportion of time spent on unpaid domestic and care work % n a n a n a Indicator Million people Female Male Value Labour-force 2 54 4 99 7 53 Access to finance Indicator 0-1 (Equal rights) Value Access to financial services Equal rights Inheritance rights for widows and daughters Unequal rights Access to land assets Restricted rights Access to non-land assets Near-equal rights Civil and political freedom Indicator Unit Value Year women received right to vote year 1948 Number of female heads of state to date number 2 Seats held in upper house % total seats n a Indicator Yes/No Value Election list quotas for women, national Yes Party membership quotas, voluntary Yes Indicator 0-1 (Equal rights) Value Access to justice Near-equal rights Freedom of movement Equal rights Family and care Indicator Unit Value Public spending on family benefits % GPD n a Unmet family planning % women 15-49 7 50 Early marriage % 10 60 Mean age of women at birth of first child years n a Indicator 0-1 (Equal rights) Value Right to divorce Restricted rights Indicator Days Female Male Value Length of parental leave 84 00 0 0 Education and skills Graduates Attainment % Female Male Parity STEM Graduates 40 57 59 43 0 68 Agri , Forestry, Fisheries & Veterinary n a n a n a Arts & Humanities n a n a n a Business, Admin & Law n a n a n a Education 72 85 27 15 2 68 Engineering, Manuf & Construction 28 44 71 56 0 40 Health & Welfare n a n a n a Information & Comm Technologies 37 64 62 36 0 60 Natural Sci , Mathematics & Statistics 56 87 43 13 1 32 Social Sci , Jour nalism & Information n a n a n a Vocational training 3 42 4 33 0 79 PhD graduates n a n a n a Graduates % Female Male Value Graduates from tertiary education 15 60 8 67 12 16 Health Indicator Unit Value Prevalence of gender violence in lifetime % women 16 60 Births attended by skilled personnel % live births 99 50 Mater nal mortality deaths per 100,000 live births 36 00 Total fertility rate births per woman 2 00 Indicator 0-1 (Equal rights) Value Reproductive autonomy Restricted rights *Scores
0 to 1 scale, where 1 represents the optimal situation
parity” Please see Appendix A and B for detailed methodology, definitions, sources and periods. **For all indicators, except the two health indicators, parity is benchmarked at 1 In the case of sex ratio at birth the gender parity benchmark is set at 0 944 (see Klasen and Wink 2003) In the case of healthy life expectancy the gender parity benchmark is set at 1 06, given women's longer life expectancy
are on a
or “
Global Gender Gap Index Indicators
Global Gender Gap Report 2023 333 Global Gender Gap Index 2023 Edition Suriname score average score 0.740 Economy 0 993 E d u c a t i o n 0.979 Health 0 232 P o i t i c s Overview Index and Subindex 2023 Score Rank 2022 Score Rank Global Gender Gap Index 0 736 52nd 0 737 44th Economic Participation and Opportunity 0.740 37th 0 731 46th Educational Attainment 0 993 70th 0 992 69th Health and Survival 0 979 31st 0 973 61st Political Empowerment 0 232 66th 0 253 53rd
2023 Indicator Rank Score* Difference F-M Min Max Economic Participation and Opportunity 37th 0 740 -Labour-force participation rate % 102nd 0 673 -22 00 0-100 Wage equality for similar work 1-7 (best) - - -Estimated ear ned income int'l $ 1,000 72nd 0 642 -6 44 0-150 Legislators, senior officials and managers % 23rd 0 762 -13 51 0-100 Professional and technical workers % 1st 1 000 13 65 0-100 Educational Attainment 70th 0.993 -Literacy rate % 94th 0 968Enrolment in primary education % 1st 1 000 2 81 0-100 Enrolment in secondary education % 1st 1 000 13 91 0-200 Enrolment in tertiary education % - - -Health and Survival 31st 0 979 -Sex ratio at birth** % 1st 0 944Healthy life expectancy** years 42nd 1 057Political Empowerment 66th 0 232 -Women in parliament % 55th 0 416 -41 20 0-100 Women in ministerial positions % 51st 0 417 -41 18 0-100 Years with female/male head of state (last 50) 80th 0 000 -50 00 0-50 Economy Profile Suriname Score (imparity = 0 parity = 1) 0.736 Rank (out of 146 countries) 52nd Index Edition 2023 Compare with Global average 0 1 Female vs Male Min Max67 34 45 3418 00 11 56 56 75 43 25 43 17 56 8381 37 84 19 63 96 77 87--70 60 29 40 70 59 29 41 50 00 0
Complementary Targets and Contextual Indicators 2023
Reproductive
Global Gender Gap Report 2023 334 Economy Profile Suriname Score 0.736 Rank 52nd Page 2 of 2
General indicators Indicator Unit Value GDP US$ billions 2 98 GDP per capita constant '17 intl $ 1000 14 77 Population sex ratio female/male 1 01 Population growth rate % 0 97 Indicator Million people Female Male Value Total population 0 31 0 31 0 62 Work participation and leadership Indicator Unit Value Gender pay gap % (OECD countries only) n a Share of women's membership in boards % (OECD countries only) n a Firms with female majority ownership % firms 15 30 Firms with female top managers % firms 11 90 Share of workers in informal sector % workers 52 10 Indicator 1-7 (best) Value Advancement of women to leadership roles 3 79 Indicator Unit Female Male Value Unemployed adults % of labour force (15-64) 11 32 5 65 8 00 Workers employed part-time % of employed people 44 83 27 49 34 39 Proportion of time spent on unpaid domestic and care work % n a n a n a Indicator Million people Female Male Value Labour-force 0 07 0 10 0 18 Access to finance Indicator 0-1 (Equal rights) Value Access to financial services n a Inheritance rights for widows and daughters n a Access to land assets n a Access to non-land assets n a Civil and political freedom Indicator Unit Value Year women received right to vote year 1975 Number of female heads of state to date number 0 Seats held in upper house % total seats n a Indicator Yes/No Value Election list quotas for women, national n a Party membership quotas, voluntary n a Indicator 0-1 (Equal rights) Value Access to justice n a Freedom of movement n a Family and care Indicator Unit Value Public spending on family benefits % GPD n a Unmet family planning % women 15-49 28 43 Early marriage % n a Mean age of women at birth of first child years n a Indicator 0-1 (Equal rights) Value Right to divorce n a Indicator Days Female Male Value Length of parental leave 112 00 8 00 0 Education and skills Graduates Attainment % Female Male Parity STEM Graduates n a n a n a
, Forestry, Fisheries & Veterinary n a n a n a Arts & Humanities n a n a n a
Admin & Law n a n a n a Education n a n a n a
Agri
Business,
n a n a n a Health
Welfare n a n a n a
n a n a n a
n a n a n a
n a n a n a Vocational training 17 10 19 73 0 87 PhD graduates n a n a n a Graduates % Female Male Value
education n a n a n a Health
Engineering, Manuf & Construction
&
Information & Comm Technologies
Natural Sci , Mathematics & Statistics
Social Sci , Jour nalism & Information
Graduates from tertiary
Value
Indicator Unit
in lifetime % women n a
attended by skilled personnel % live births 98 40 Mater nal mortality deaths per 100,000 live births 120 00 Total fertility rate births per woman 2 37
0-1
rights) Value
Prevalence of gender violence
Births
Indicator
(Equal
autonomy n a
1
case
sex ratio
birth
gender parity benchmark is set at 0 944
Klasen
2003)
the case of healthy life expectancy
gender parity benchmark
set
1 06,
women's longer life expectancy
*Scores are on a 0 to 1 scale, where 1 represents the optimal situation or “parity” Please see Appendix A and B for detailed methodology, definitions, sources and periods. **For all indicators, except the two health indicators, parity is benchmarked at
In the
of
at
the
(see
and Wink
In
the
is
at
given
Global Gender Gap Index Indicators
Global Gender Gap Report 2023 335 Global Gender Gap Index 2023 Edition Sweden score average score 0.795 Economy 1 000 E d u c a t i o n 0.963 Health 0 503 P o i t i c s Overview Index and Subindex 2023 Score Rank 2022 Score Rank Global Gender Gap Index 0 815 5th 0 822 5th Economic Participation and Opportunity 0.795 15th 0 812 5th Educational Attainment 1 000 1st 1 000 1st Health and Survival 0 963 118th 0 963 124th Political Empowerment 0 503 11th 0 515 10th
2023 Indicator Rank Score* Difference F-M Min Max Economic Participation and Opportunity 15th 0 795 -Labour-force participation rate % 11th 0 903 -6 82 0-100 Wage equality for similar work 1-7 (best) 43rd 0 694Estimated ear ned income int'l $ 1,000 27th 0 753 -15 06 0-150 Legislators, senior officials and managers % 24th 0 754 -14 05 0-100 Professional and technical workers % 1st 1 000 3 80 0-100 Educational Attainment 1st 1.000 -Literacy rate % 1st 1 000Enrolment in primary education % - - -Enrolment in secondary education % 1st 1 000 11 87 0-200 Enrolment in tertiary education % 1st 1 000 39 69 0-200 Health and Survival 118th 0 963 -Sex ratio at birth** % 1st 0 944Healthy life expectancy** years 129th 1 006Political Empowerment 11th 0 503 -Women in parliament % 8th 0 866 -7 20 0-100 Women in ministerial positions % 14th 0 917 -4 35 0-100 Years with female/male head of state (last 50) 66th 0 018 -48 24 0-50 Economy Profile Sweden Score (imparity = 0 parity = 1) 0.815 Rank (out of 146 countries) 5th Index Edition 2023 Compare with Global average 0 1 Female vs Male Min Max70 07 63 2561 08 46 02 57 04 42 99 48 10 51 90-139 83 151 70 65 29 104 98-53 60 46 40 52 17 47 83 49 12 0 88
Complementary Targets and Contextual Indicators 2023
Global Gender Gap Report 2023 336 Economy Profile Sweden Score 0.815 Rank 5th Page 2 of 2
General indicators Indicator Unit Value GDP US$ billions 635 66 GDP per capita constant '17 intl $ 1000 53 61 Population sex ratio female/male 0 99 Population growth rate % 0 60 Indicator Million people Female Male Value Total population 5 23 5 32 10 55 Work participation and leadership Indicator Unit Value Gender pay gap % (OECD countries only) 7 42 Share of women's membership in boards % (OECD countries only) 37 90 Firms with female majority ownership % firms 8 60 Firms with female top managers % firms 14 00 Share of workers in informal sector % workers 3 20 Indicator 1-7 (best) Value Advancement of women to leadership roles 5 34 Indicator Unit Female Male Value Unemployed adults % of labour force (15-64) 8 10 7 10 7 60 Workers employed part-time % of employed people 53 77 41 08 47 04 Proportion of time spent on unpaid domestic and care work % n a n a n a Indicator Million people Female Male Value Labour-force 2 36 2 65 5 01 Access to finance Indicator 0-1 (Equal rights) Value Access to financial services Equal rights Inheritance rights for widows and daughters Equal rights Access to land assets Equal rights Access to non-land assets Equal rights Civil and political freedom Indicator Unit Value Year women received right to vote year n a Number of female heads of state to date number 0 Seats held in upper house % total seats n a Indicator Yes/No Value Election list quotas for women, national Yes Party membership quotas, voluntary Yes Indicator 0-1 (Equal rights) Value Access to justice Equal rights Freedom of movement Equal rights Family and care Indicator Unit Value Public spending on family benefits % GPD 3 42 Unmet family planning % women 15-49 8 50 Early marriage % 0 30 Mean age of women at birth of first child years 29 70 Indicator 0-1 (Equal rights) Value Right to divorce Equal rights Indicator Days Female Male Value Length of parental leave 0 14 00 300 00 Education and skills Graduates Attainment % Female Male Parity STEM Graduates 35 48 64 52 0 55 Agri , Forestry, Fisheries & Veterinary n a n a n a Arts & Humanities 62 80 37 20 1 69 Business, Admin & Law 64 36 35 64 1 81 Education 79 71 20 29 3 93 Engineering, Manuf & Construction 32 77 67 23 0 49 Health & Welfare 80 80 19 20 4 21 Information & Comm Technologies n a n a n a Natural Sci , Mathematics & Statistics n a n a n a Social Sci , Jour nalism & Information n a n a n a Vocational training 11 81 16 34 0 72 PhD graduates 1 03 1 56 1 29 Graduates % Female Male Value Graduates from tertiary education 68 18 33 98 50 52 Health Indicator Unit Value Prevalence of gender violence in lifetime % women 28 00 Births attended by skilled personnel % live births n a Mater nal mortality deaths per 100,000 live births 4 00 Total fertility rate births per woman 1 66 Indicator 0-1 (Equal rights) Value Reproductive autonomy Equal rights *Scores
optimal situation
parity
A
B for detailed methodology, de
sources
periods. **For
indicators,
two health indicators, parity is benchmarked at 1 In the case of sex ratio at birth the gender parity benchmark is set at 0 944 (see Klasen and Wink 2003) In the case of healthy life expectancy the gender parity benchmark is set at 1 06, given women's longer life expectancy
are on a 0 to 1 scale, where 1 represents the
or “
” Please see Appendix
and
finitions,
and
all
except the
Global Gender Gap Index Indicators
Global Gender Gap Report 2023 337 Global Gender Gap Index 2023 Edition Switzerland score average score 0.700 Economy 0 978 E d u c a t i o n 0.964 Health 0 491 P o i t i c s Overview Index and Subindex 2023 Score Rank 2022 Score Rank Global Gender Gap Index 0 783 21st 0 795 13th Economic Participation and Opportunity 0.700 63rd 0 729 47th Educational Attainment 0 978 102nd 0 988 82nd Health and Survival 0 964 115th 0 964 117th Political Empowerment 0 491 14th 0 499 13th
2023 Indicator Rank Score* Difference F-M Min Max Economic Participation and Opportunity 63rd 0 700 -Labour-force participation rate % 37th 0 856 -10 45 0-100 Wage equality for similar work 1-7 (best) 38th 0 703Estimated ear ned income int'l $ 1,000 103rd 0 571 -38 88 0-150 Legislators, senior officials and managers % 89th 0 460 -36 98 0-100 Professional and technical workers % 74th 0 966 -1 71 0-100 Educational Attainment 102nd 0.978 -Literacy rate % 1st 1 000Enrolment in primary education % - - -Enrolment in secondary education % 122nd 0 947 -5 53 0-200 Enrolment in tertiary education % 1st 1 000 3 70 0-200 Health and Survival 115th 0 964 -Sex ratio at birth** % 1st 0 944Healthy life expectancy** years 124th 1 009Political Empowerment 14th 0 491 -Women in parliament % 21st 0 715 -16 60 0-100 Women in ministerial positions % 20th 0 750 -14 29 0-100 Years with female/male head of state (last 50) 19th 0 190 -34 03 0-50 Economy Profile Switzerland Score (imparity = 0 parity = 1) 0.783 Rank (out of 146 countries) 21st Index Edition 2023 Compare with Global average 0 1 Female vs Male Min Max72 68 62 2390 60 51 73 68 49 31 51 50 85 49 15-105 26 99 73 63 52 67 22-58 30 41 70 57 14 42 86 42 02 7 98
Complementary Targets and Contextual Indicators 2023
Global Gender Gap Report 2023 338 Economy Profile Switzerland Score 0.783 Rank 21st Page 2 of 2
General indicators Indicator Unit Value GDP US$ billions 800 64 GDP per capita constant '17 intl $ 1000 71 03 Population sex ratio female/male 1 01 Population growth rate % 0 75 Indicator Million people Female Male Value Total population 4 40 4 34 8 74 Work participation and leadership Indicator Unit Value Gender pay gap % (OECD countries only) 13 80 Share of women's membership in boards % (OECD countries only) 30 00 Firms with female majority ownership % firms n a Firms with female top managers % firms n a Share of workers in informal sector % workers 1 90 Indicator 1-7 (best) Value Advancement of women to leadership roles 5 47 Indicator Unit Female Male Value Unemployed adults % of labour force (15-64) 4 68 4 20 4 43 Workers employed part-time % of employed people 49 66 21 40 34 61 Proportion of time spent on unpaid domestic and care work % 17 31 11 47 n a Indicator Million people Female Male Value Labour-force 2 03 2 32 4 35 Access to finance Indicator 0-1 (Equal rights) Value Access to financial services Equal rights Inheritance rights for widows and daughters Equal rights Access to land assets Equal rights Access to non-land assets Equal rights Civil and political freedom Indicator Unit Value Year women received right to vote year 1971 Number of female heads of state to date number 5 Seats held in upper house % total seats 28 90 Indicator Yes/No Value Election list quotas for women, national Yes Party membership quotas, voluntary Yes Indicator 0-1 (Equal rights) Value Access to justice Equal rights Freedom of movement Equal rights Family and care Indicator Unit Value Public spending on family benefits % GPD 1 73 Unmet family planning % women 15-49 n a Early marriage % 0 40 Mean age of women at birth of first child years 31 10 Indicator 0-1 (Equal rights) Value Right to divorce Equal rights Indicator Days Female Male Value Length of parental leave 98 00 14 00 0 Education and skills Graduates Attainment % Female Male Parity STEM Graduates 22 32 77 68 0 29 Agri , Forestry, Fisheries & Veterinary n a n a n a Arts & Humanities 61 06 38 94 1 57 Business, Admin & Law 44 59 55 41 0 80 Education n a n a n a Engineering, Manuf & Construction 15 99 84 01 0 19 Health & Welfare 73 83 26 17 2 82 Information & Comm Technologies 9 93 90 07 0 11 Natural Sci , Mathematics & Statistics 41 92 58 08 0 72 Social Sci , Jour nalism & Information 68 53 31 47 2 18 Vocational training 19 13 26 31 0 73 PhD graduates 2 14 3 83 2 96 Graduates % Female Male Value Graduates from tertiary education 57 34 54 36 55 82 Health Indicator Unit Value Prevalence of gender violence in lifetime % women 9 80 Births attended by skilled personnel % live births n a Mater nal mortality deaths per 100,000 live births 5 00 Total fertility rate births per woman 1 46 Indicator 0-1 (Equal rights) Value Reproductive autonomy Equal rights *Scores
on a 0 to 1 scale, where 1 represents the optimal situation or “parity” Please see Appendix A and B for detailed methodology, definitions, sources and periods. **For all indicators, except the two health indicators, parity is benchmarked at 1 In the case of sex ratio at birth the gender parity benchmark is set at 0 944 (see Klasen and Wink 2003) In the case of healthy life expectancy the gender parity benchmark is set at 1 06, given women's longer life expectancy
are
Global Gender Gap Index Indicators
Global Gender Gap Report 2023 339 Global Gender Gap Index 2023 Edition Tajikistan score average score 0.618 Economy 0 942 E d u c a t i o n 0.970 Health 0 156 P o i t i c s Overview Index and Subindex 2023 Score Rank 2022 Score Rank Global Gender Gap Index 0 672 111th 0 663 114th Economic Participation and Opportunity 0.618 105th 0 609 107th Educational Attainment 0 942 121st 0 942 117th Health and Survival 0 970 70th 0 969 84th Political Empowerment 0 156 93rd 0 130 109th
2023 Indicator Rank Score* Difference F-M Min Max Economic Participation and Opportunity 105th 0 618 -Labour-force participation rate % 119th 0 617 -20 23 0-100 Wage equality for similar work 1-7 (best) 26th 0 723Estimated ear ned income int'l $ 1,000 124th 0 469 -2 81 0-150 Legislators, senior officials and managers % - - -Professional and technical workers % - - -Educational Attainment 121st 0.942 -Literacy rate % 1st 1 000Enrolment in primary education % 94th 0 987 -1 24 0-100 Enrolment in secondary education % 128th 0 901 -9 17 0-200 Enrolment in tertiary education % 122nd 0 757 -8 62 0-200 Health and Survival 70th 0 970 -Sex ratio at birth** % 117th 0 941Healthy life expectancy** years 75th 1 038Political Empowerment 93rd 0 156 -Women in parliament % 73rd 0 370 -46 00 0-100 Women in ministerial positions % 101st 0 167 -71 43 0-100 Years with female/male head of state (last 50) 80th 0 000 -50 00 0-50 Economy Profile Ta ikistan Score (imparity = 0 parity = 1) 0.672 Rank (out of 146 countries) 111th Index Edition 2023 Compare with Global average 0 1 Female vs Male Min Max52 87 32 645 30 2 49-98 75 97 51 92 98 83 81 35 47 26 85-73 00 27 00 85 71 14 29 50 00 0
Complementary Targets and Contextual Indicators 2023
Global Gender Gap Report 2023 340 Economy Profile Tajikistan Score 0.672 Rank 111th Page 2 of 2
General indicators Indicator Unit Value GDP US$ billions 8 75 GDP per capita constant '17 intl $ 1000 3 90 Population sex ratio female/male 0 99 Population growth rate % 2 14 Indicator Million people Female Male Value Total population 4 94 5 01 9 95 Work participation and leadership Indicator Unit Value Gender pay gap % (OECD countries only) n a Share of women's membership in boards % (OECD countries only) n a Firms with female majority ownership % firms 6 20 Firms with female top managers % firms 6 60 Share of workers in informal sector % workers n a Indicator 1-7 (best) Value Advancement of women to leadership roles 4 99 Indicator Unit Female Male Value Unemployed adults % of labour force (15-64) n a n a n a Workers employed part-time % of employed people n a n a n a Proportion of time spent on unpaid domestic and care work % n a n a n a Indicator Million people Female Male Value Labour-force 0 73 1 12 1 84 Access to finance Indicator 0-1 (Equal rights) Value Access to financial services Equal rights
rights for widows and daughters Near-equal rights
to land assets Near-equal rights Access to non-land assets Near-equal rights Civil and political freedom Indicator Unit Value Year women received right to vote year 1991 Number of female heads of state to date number 0 Seats held in upper house % total seats 25 80 Indicator Yes/No Value Election list quotas for women, national n a Party membership quotas, voluntary n a Indicator 0-1 (Equal rights) Value Access to justice Near-equal rights Freedom of movement Equal rights Family and care Indicator Unit Value Public spending on family benefits % GPD n a Unmet family planning % women 15-49 22 70 Early marriage % 14 30 Mean age of women at birth of first child years 23 20 Indicator 0-1 (Equal rights) Value Right to divorce Restricted rights Indicator Days Female Male Value Length of parental leave 140 00 0 0 Education and skills Graduates Attainment % Female Male Parity STEM Graduates n a n a n a
n a n a n a Arts &
n a n a n a Business, Admin & Law n a n a n a Education n a n a n a Engineering, Manuf & Construction n a n a n a Health & Welfare n a n a n a Information & Comm Technologies n a n a n a Natural Sci , Mathematics & Statistics n a n a n a Social Sci , Jour nalism & Information n a n a n a Vocational training n a n a n a PhD graduates 3 19 7 79 5 47 Graduates % Female Male Value Graduates from tertiary education n a n a n a Health Indicator Unit Value Prevalence of gender violence in lifetime % women 20 30 Births attended by skilled personnel % live births 94 80 Mater nal mortality deaths per 100,000 live births 17 00 Total fertility rate births per woman 3 24 Indicator 0-1 (Equal rights) Value Reproductive autonomy Equal rights *Scores
0
1
optimal situation
parity
Appendix A and B for detailed methodology, definitions, sources and periods. **For all indicators, except the two health indicators, parity is benchmarked at 1 In the case of sex ratio at birth the gender parity benchmark is set at 0 944 (see Klasen and Wink 2003) In the case of healthy life expectancy the gender parity benchmark is set at 1 06, given women's longer life expectancy
Inheritance
Access
Agri , Forestry, Fisheries & Veterinary
Humanities
are on a
to
scale, where 1 represents the
or “
” Please see
Global Gender Gap Index Indicators
Global Gender Gap Report 2023 341 Global Gender Gap Index 2023 Edition Tanzania score average score 0.715 Economy 0 964 E d u c a t i o n 0.970 Health 0 309 P o i t i c s Overview Index and Subindex 2023 Score Rank 2022 Score Rank Global Gender Gap Index 0 740 48th 0 719 64th Economic Participation and Opportunity 0.715 53rd 0 705 65th Educational Attainment 0 964 108th 0 957 110th Health and Survival 0 970 75th 0 970 80th Political Empowerment 0 309 45th 0 245 60th
2023 Indicator Rank Score* Difference F-M Min Max Economic Participation and Opportunity 53rd 0 715 -Labour-force participation rate % 13th 0 896 -8 87 0-100 Wage equality for similar work 1-7 (best) 24th 0 725Estimated ear ned income int'l $ 1,000 3rd 0 903 -0 26 0-150 Legislators, senior officials and managers % 103rd 0 387 -44 17 0-100 Professional and technical workers % 122nd 0 456 -37 39 0-100 Educational Attainment 108th 0.964 -Literacy rate % 111th 0 915Enrolment in primary education % 1st 1 000 3 09 0-100 Enrolment in secondary education % 1st 1 000 2 27 0-200 Enrolment in tertiary education % 114th 0 836 -1 40 0-200 Health and Survival 75th 0 970 -Sex ratio at birth** % 1st 0 944Healthy life expectancy** years 88th 1 028Political Empowerment 45th 0 309 -Women in parliament % 35th 0 597 -25 20 0-100 Women in ministerial positions % 50th 0 429 -40 00 0-100 Years with female/male head of state (last 50) 53rd 0 040 -46 11 0-50 Economy Profile Tan ania Score (imparity = 0 parity = 1) 0.740 Rank (out of 146 countries) 48th Index Edition 2023 Compare with Global average 0 1 Female vs Male Min Max85 03 76 162 72 2 45 72 09 27 91 68 69 31 3182 39 85 49 27 54 29 81 8 53 7 13-62 60 37 40 70 00 30 00 48 06 1 95
Complementary Targets and Contextual Indicators 2023
Access
Global Gender Gap Report 2023 342 Economy Profile Tanzania Score 0.740 Rank 48th Page 2 of 2
General indicators Indicator Unit Value GDP US$ billions 67 84 GDP per capita constant '17 intl $ 1000 2 58 Population sex ratio female/male 1 02 Population growth rate % 3 01 Indicator Million people Female Male Value Total population 33 13 32 37 65 50 Work participation and leadership Indicator Unit Value Gender pay gap % (OECD countries only) n a Share of women's membership in boards % (OECD countries only) n a Firms with female majority ownership % firms 9 90 Firms with female top managers % firms 14 00 Share of workers in informal sector % workers 93 30 Indicator 1-7 (best) Value Advancement of women to leadership roles 4 84 Indicator Unit Female Male Value Unemployed adults % of labour force (15-64) 3 88 1 93 2 90 Workers employed part-time % of employed people 44 60 29 29 36 80 Proportion of time spent on unpaid domestic and care work % 16 46 4 24 n a Indicator Million people Female Male Value Labour-force 9 37 9 53 18 90 Access to finance Indicator 0-1 (Equal rights) Value Access to financial services Near-equal rights
rights for widows
Unequal rights
Inheritance
and daughters
to land assets Near-equal rights
to non-land assets Uneven rights Civil and political freedom Indicator Unit Value Year women received right to vote year 1961 Number of female heads of state to date number 0 Seats held in upper house % total seats n a Indicator Yes/No Value Election list quotas for women, national Yes Party membership quotas, voluntary Yes Indicator 0-1 (Equal rights) Value Access to justice Near-equal rights Freedom of movement Equal rights
and care Indicator Unit Value
spending on family benefits % GPD n a Unmet family planning % women 15-49 22 10 Early marriage % 25 30 Mean age of women at birth of first child years n a Indicator 0-1 (Equal rights) Value Right to divorce Restricted rights Indicator Days Female Male Value Length of parental leave 84 00 3 00 0 Education and skills Graduates Attainment % Female Male Parity STEM Graduates n a n a n a
Access
Family
Public
n a n a n a Arts
n a n a n a
& Law n a n a n a Education n a n a n a Engineering, Manuf & Construction n a n a n a Health & Welfare n a n a n a
n a n a n a
n a n a n a
n a n a n a Vocational training 0 04 0 08 0 50 PhD graduates n a n a n a Graduates % Female Male Value Graduates from tertiary education 2 74 3 82 3 28
Agri , Forestry, Fisheries & Veterinary
& Humanities
Business, Admin
Information & Comm Technologies
Natural Sci , Mathematics & Statistics
Social Sci , Jour nalism & Information
Health
Value Prevalence of gender violence in lifetime % women 41 70 Births attended by skilled personnel % live births 63 70 Mater nal mortality deaths per 100,000 live births 524 00 Total fertility rate births per woman 4 80
rights) Value
autonomy Uneven rights
health indicators, parity
benchmarked
1
case of sex ratio at birth the gender parity benchmark is set at 0 944 (see Klasen and Wink 2003) In the case of healthy life expectancy
gender parity benchmark is set at 1 06, given women's longer life expectancy
Indicator Unit
Indicator 0-1 (Equal
Reproductive
*Scores are on a 0 to 1 scale, where 1 represents the optimal situation or “parity” Please see Appendix A and B for detailed methodology, definitions, sources and periods. **For all indicators, except the two
is
at
In the
the
Global Gender Gap Index Indicators
Global Gender Gap Report 2023 343 Global Gender Gap Index 2023 Edition Thailand score average score 0.772 Economy 0 995 E d u c a t i o n 0.977 Health 0 101 P o i t i c s Overview Index and Subindex 2023 Score Rank 2022 Score Rank Global Gender Gap Index 0 711 74th 0 709 79th Economic Participation and Opportunity 0.772 24th 0 795 15th Educational Attainment 0 995 61st 0 979 92nd Health and Survival 0 977 42nd 0 978 37th Political Empowerment 0 101 120th 0 084 130th
2023 Indicator Rank Score* Difference F-M Min Max Economic Participation and Opportunity 24th 0 772 -Labour-force participation rate % 70th 0 787 -15 99 0-100 Wage equality for similar work 1-7 (best) 17th 0 740Estimated ear ned income int'l $ 1,000 12th 0 826 -3 27 0-150 Legislators, senior officials and managers % 66th 0 550 -29 01 0-100 Professional and technical workers % 1st 1 000 18 57 0-100 Educational Attainment 61st 0.995 -Literacy rate % 91st 0 972Enrolment in primary education % 1st 1 000 0 14 0-100 Enrolment in secondary education % 1st 1 000 6 09 0-200 Enrolment in tertiary education % 1st 1 000 13 64 0-200 Health and Survival 42nd 0 977 -Sex ratio at birth** % 121st 0 940Healthy life expectancy** years 1st 1 060Political Empowerment 120th 0 101 -Women in parliament % 115th 0 199 -66 80 0-100 Women in ministerial positions % 135th 0 056 -89 47 0-100 Years with female/male head of state (last 50) 48th 0 058 -44 49 0-50 Economy Profile Thailand Score (imparity = 0 parity = 1) 0.711 Rank (out of 146 countries) 74th Index Edition 2023 Compare with Global average 0 1 Female vs Male Min Max75 22 59 2318 76 15 49 64 50 35 50 40 72 59 2998 38 98 51 97 33 103 41 37 31 50 96-83 40 16 60 94 74 5 26 47 24 2 76
Complementary Targets and Contextual Indicators 2023
Global Gender Gap Report 2023 344 Economy Profile Thailand Score 0.711 Rank 74th Page 2 of 2
General indicators Indicator Unit Value GDP US$ billions 505 95 GDP per capita constant '17 intl $ 1000 17 08 Population sex ratio female/male 1 06 Population growth rate % 0 18 Indicator Million people Female Male Value Total population 36 89 34 81 71 70 Work participation and leadership Indicator Unit Value Gender pay gap % (OECD countries only) n a Share of women's membership in boards % (OECD countries only) n a Firms with female majority ownership % firms 33 40 Firms with female top managers % firms 64 80 Share of workers in informal sector % workers 65 00 Indicator 1-7 (best) Value Advancement of women to leadership roles 5 37 Indicator Unit Female Male Value Unemployed adults % of labour force (15-64) 1 12 0 89 1 00 Workers employed part-time % of employed people 21 76 21 03 21 36 Proportion of time spent on unpaid domestic and care work % 11 83 3 75 n a Indicator Million people Female Male Value Labour-force 16 81 19 10 35 91 Access to finance Indicator 0-1 (Equal rights) Value Access to financial services Equal rights Inheritance rights for widows and daughters Equal rights Access to land assets Near-equal rights Access to non-land assets Near-equal rights Civil and political freedom Indicator Unit Value Year women received right to vote year n a Number of female heads of state to date number 1 Seats held in upper house % total seats 10 40 Indicator Yes/No Value Election list quotas for women, national Yes Party membership quotas, voluntary Yes Indicator 0-1 (Equal rights) Value Access to justice Near-equal rights Freedom of movement Equal rights Family and care Indicator Unit Value Public spending on family benefits % GPD n a Unmet family planning % women 15-49 8 04 Early marriage % 17 10 Mean age of women at birth of first child years n a Indicator 0-1 (Equal rights) Value Right to divorce Near-equal rights Indicator Days Female Male Value Length of parental leave 90 00 0 0 Education and skills Graduates Attainment % Female Male Parity STEM Graduates 30 14 69 86 0 43 Agri , Forestry, Fisheries & Veterinary n a n a n a Arts & Humanities 65 19 34 81 1 87 Business, Admin & Law n a n a n a Education 71 68 28 32 2 53 Engineering, Manuf & Construction n a n a n a Health & Welfare n a n a n a Information & Comm Technologies 47 85 52 15 0 92 Natural Sci , Mathematics & Statistics 70 72 29 28 2 42 Social Sci , Jour nalism & Information 62 23 37 77 1 65 Vocational training 9 36 12 87 0 73 PhD graduates 0 05 0 13 0 09 Graduates % Female Male Value Graduates from tertiary education 31 29 19 45 25 32 Health Indicator Unit Value Prevalence of gender violence in lifetime % women 44 20 Births attended by skilled personnel % live births 99 10 Mater nal mortality deaths per 100,000 live births 37 00 Total fertility rate births per woman 1 34 Indicator 0-1 (Equal rights) Value Reproductive autonomy Uneven rights *Scores
0 to 1 scale, where 1 represents the optimal situation
parity
see Appendix A and B for detailed methodology, definitions, sources and periods. **For all indicators, except the two health indicators, parity is benchmarked at 1 In the case of sex ratio at birth the gender parity benchmark is set at 0 944 (see Klasen and Wink 2003) In the case of healthy life expectancy the gender parity benchmark is set at 1 06, given women's longer life expectancy
are on a
or “
” Please
Global Gender Gap Index Indicators
Global Gender Gap Report 2023 345 Global Gender Gap Index 2023 Edition Timor-Leste score average score 0.574 Economy 0 980 E d u c a t i o n 0.965 Health 0 253 P o i t i c s Overview Index and Subindex 2023 Score Rank 2022 Score Rank Global Gender Gap Index 0 693 95th 0 730 56th Economic Participation and Opportunity 0.574 120th 0 721 55th Educational Attainment 0 980 97th 0 977 95th Health and Survival 0 965 106th 0 973 66th Political Empowerment 0 253 60th 0 250 55th
2023 Indicator Rank Score* Difference F-M Min Max Economic Participation and Opportunity 120th 0 574 -Labour-force participation rate % 101st 0 674 -13 47 0-100 Wage equality for similar work 1-7 (best) - - -Estimated ear ned income int'l $ 1,000 16th 0 798 -1 13 0-150 Legislators, senior officials and managers % 131st 0 153 -73 45 0-100 Professional and technical workers % 118th 0 516 -31 95 0-100 Educational Attainment 97th 0.980 -Literacy rate % 112th 0 907Enrolment in primary education % 1st 1 000 3 49 0-100 Enrolment in secondary education % 1st 1 000 8 59 0-200 Enrolment in tertiary education % - - -Health and Survival 106th 0 965 -Sex ratio at birth** % 135th 0 934Healthy life expectancy** years 76th 1 037Political Empowerment 60th 0 253 -Women in parliament % 26th 0 667 -20 00 0-100 Women in ministerial positions % 95th 0 188 -68 42 0-100 Years with female/male head of state (last 50) 80th 0 000 -50 00 0-50 Economy Profile Timor-Leste Score (imparity = 0 parity = 1) 0.693 Rank (out of 146 countries) 95th Index Edition 2023 Compare with Global average 0 1 Female vs Male Min Max41 38 27 915 59 4 46 86 73 13 27 65 97 34 0393 23 96 71 82 54 91 13--60 00 40 00 84 21 15 79 50 00 0
Complementary Targets and Contextual Indicators 2023
Global Gender Gap Report 2023 346 Economy Profile Timor-Leste Score 0.693 Rank 95th Page 2 of 2
General indicators Indicator Unit Value GDP US$ billions 3 62 GDP per capita constant '17 intl $ 1000 5 03 Population sex ratio female/male 0 96 Population growth rate % 1 60 Indicator Million people Female Male Value Total population 0 66 0 68 1 34 Work participation and leadership Indicator Unit Value Gender pay gap % (OECD countries only) n a Share of women's membership in boards % (OECD countries only) n a Firms with female majority ownership % firms 23 40 Firms with female top managers % firms 32 20 Share of workers in informal sector % workers 80 60 Indicator 1-7 (best) Value Advancement of women to leadership roles 4 62 Indicator Unit Female Male Value Unemployed adults % of labour force (15-64) 3 13 1 99 2 44 Workers employed part-time % of employed people 38 22 32 45 34 76 Proportion of time spent on unpaid domestic and care work % n a n a n a Indicator Million people Female Male Value Labour-force 0 10 0 15 0 25 Access to finance Indicator 0-1 (Equal rights) Value Access to financial services Uneven rights
rights for widows and daughters Near-equal rights
to land assets Uneven rights Access to non-land assets Near-equal rights Civil and political freedom Indicator Unit Value Year women received right to vote year n a Number of female heads of state to date number 0 Seats held in upper house % total seats n a Indicator Yes/No Value Election list quotas for women, national Yes Party membership quotas, voluntary Yes Indicator 0-1 (Equal rights) Value Access to justice Restricted rights Freedom of movement Equal rights Family and care Indicator Unit Value Public spending on family benefits % GPD n a Unmet family planning % women 15-49 25 30 Early marriage % 8 00 Mean age of women at birth of first child years n a Indicator 0-1 (Equal rights) Value Right to divorce Near-equal rights Indicator Days Female Male Value Length of parental leave 84 00 7 00 0 Education and skills Graduates Attainment % Female Male Parity STEM Graduates n a n a n a
n a n a n a Arts & Humanities n a n a n a Business, Admin & Law n a n a n a Education n a n a n a Engineering, Manuf & Construction n a n a n a Health & Welfare n a n a n a Information
Technologies n a n a n a Natural
n a n a n a Social
Information n a n a n a Vocational training 4 46 5 55 0 80 PhD graduates n a n a n a Graduates % Female Male Value Graduates from tertiary education n a n a n a Health
Unit Value Prevalence of gender violence in lifetime % women 58 80 Births attended by skilled personnel % live births 56 70 Mater nal mortality deaths per 100,000 live births 142 00 Total fertility rate births per woman 3 25 Indicator 0-1 (Equal rights) Value Reproductive autonomy Restricted rights
health indicators, parity is benchmarked at 1
the case of sex ratio at birth the gender parity benchmark is set at 0 944 (see Klasen and Wink 2003) In the case of healthy life expectancy the gender parity benchmark is set at 1 06, given women's longer life expectancy
Inheritance
Access
Agri , Forestry, Fisheries & Veterinary
& Comm
Sci , Mathematics & Statistics
Sci , Jour nalism &
Indicator
*Scores are on a 0 to 1 scale, where 1 represents the optimal situation or “parity” Please see Appendix A and B for detailed methodology, definitions, sources and periods. **For all indicators, except the two
In
Global Gender Gap Index Indicators
Global Gender Gap Report 2023 347 Global Gender Gap Index 2023 Edition Togo score average score 0.796 Economy 0 837 E d u c a t i o n 0.979 Health 0 173 P o i t i c s Overview Index and Subindex 2023 Score Rank 2022 Score Rank Global Gender Gap Index 0 696 90th 0 697 91st Economic Participation and Opportunity 0.796 13th 0 798 13th Educational Attainment 0 837 136th 0 817 136th Health and Survival 0 979 30th 0 979 33rd Political Empowerment 0 173 86th 0 195 80th
2023 Indicator Rank Score* Difference F-M Min Max Economic Participation and Opportunity 13th 0 796 -Labour-force participation rate % 7th 0 923 -4 68 0-100 Wage equality for similar work 1-7 (best) - - -Estimated ear ned income int'l $ 1,000 10th 0 830 -0 39 0-150 Legislators, senior officials and managers % 1st 1 000 40 22 0-100 Professional and technical workers % 135th 0 276 -56 73 0-100 Educational Attainment 136th 0.837 -Literacy rate % 136th 0 688Enrolment in primary education % 100th 0 982 -1 78 0-100 Enrolment in secondary education % 135th 0 813 -13 22 0-200 Enrolment in tertiary education % 130th 0 561 -8 66 0-200 Health and Survival 30th 0 979 -Sex ratio at birth** % 1st 0 944Healthy life expectancy** years 41st 1 057Political Empowerment 86th 0 173 -Women in parliament % 100th 0 247 -60 40 0-100 Women in ministerial positions % 62nd 0 300 -53 85 0-100 Years with female/male head of state (last 50) 51st 0 051 -45 16 0-50 Economy Profile Togo Score (imparity = 0 parity = 1) 0.696 Rank (out of 146 countries) 90th Index Edition 2023 Compare with Global average 0 1 Female vs Male Min Max60 60 55 922 32 1 93 29 89 70 11 78 37 21 6397 75 95 96 70 86 57 65 19 71 11 06-80 20 19 80 76 92 23 08 47 58 2 42
Complementary Targets and Contextual Indicators 2023
Global Gender Gap Report 2023 348 Economy Profile Togo Score 0.696 Rank 90th Page 2 of 2
General indicators Indicator Unit Value GDP US$ billions 8 41 GDP per capita constant '17 intl $ 1000 2 12 Population sex ratio female/male 0 99 Population growth rate % 2 37 Indicator Million people Female Male Value Total population 4 40 4 45 8 85 Work participation and leadership Indicator Unit Value Gender pay gap % (OECD countries only) n a Share of women's membership in boards % (OECD countries only) n a Firms with female majority ownership % firms 10 70 Firms with female top managers % firms 11 40 Share of workers in informal sector % workers 90 10 Indicator 1-7 (best) Value Advancement of women to leadership roles n a Indicator Unit Female Male Value Unemployed adults % of labour force (15-64) 2 99 5 00 3 96 Workers employed part-time % of employed people n a n a n a Proportion of time spent on unpaid domestic and care work % n a n a n a Indicator Million people Female Male Value Labour-force 0 98 0 94 1 92 Access to finance Indicator 0-1 (Equal rights) Value Access to financial services Equal rights Inheritance rights for widows and daughters Near-equal rights Access to land assets Uneven rights Access to non-land assets Uneven rights Civil and political freedom Indicator Unit Value Year women received right to vote year 1960 Number of female heads of state to date number 1 Seats held in upper house % total seats n a Indicator Yes/No Value Election list quotas for women, national Yes Party membership quotas, voluntary Yes Indicator 0-1 (Equal rights) Value Access to justice Restricted rights Freedom of movement Restricted rights Family and care Indicator Unit Value
spending on family benefits % GPD n a Unmet family planning % women 15-49 34 00 Early marriage % 13 80 Mean age of women at birth of first child years n a Indicator 0-1 (Equal rights) Value Right to divorce Unequal rights Indicator Days Female Male Value Length of parental leave 98 00 2 00 0 Education and skills Graduates Attainment % Female Male Parity STEM Graduates n a n a n a
n a n a n a Arts & Humanities n a n a n a Business, Admin & Law n a n a n a Education n a n a n a Engineering, Manuf & Construction n a n a n a Health & Welfare n a n a n a
n a n a n a
n a n a n a Social
n a n a n a Vocational training 2 35 3 47 0 68 PhD graduates n a n a n a Graduates % Female Male Value Graduates from tertiary education n a n a n a Health
Unit Value Prevalence of gender violence in lifetime % women 22 10 Births attended by skilled personnel % live births 69 40 Mater nal mortality deaths per 100,000 live births 396 00 Total fertility rate births per woman 4 32 Indicator 0-1 (Equal rights) Value Reproductive autonomy Uneven rights
two health indicators, parity is benchmarked at 1
the case of sex ratio at birth the gender parity benchmark is set at 0 944 (see Klasen and Wink 2003) In the case of healthy life expectancy
gender parity benchmark is set at 1 06, given women's longer life expectancy
Public
Agri , Forestry, Fisheries & Veterinary
Information & Comm Technologies
Natural Sci , Mathematics & Statistics
Sci , Jour nalism & Information
Indicator
*Scores are on a 0 to 1 scale, where 1 represents the optimal situation or “parity” Please see Appendix A and B for detailed methodology, definitions, sources and periods. **For all indicators, except the
In
the
Global Gender Gap Index Indicators
Global Gender Gap Report 2023 349 Global Gender Gap Index 2023 Edition Tunisia score average score 0.451 Economy 0 950 E d u c a t i o n 0.969 Health 0 197 P o i t i c s Overview Index and Subindex 2023 Score Rank 2022 Score Rank Global Gender Gap Index 0 642 128th 0 643 120th Economic Participation and Opportunity 0.451 138th 0 445 140th Educational Attainment 0 950 117th 0 943 115th Health and Survival 0 969 81st 0 969 85th Political Empowerment 0 197 77th 0 216 68th
2023 Indicator Rank Score* Difference F-M Min Max Economic Participation and Opportunity 138th 0 451 -Labour-force participation rate % 137th 0 388 -41 78 0-100 Wage equality for similar work 1-7 (best) 49th 0 672Estimated ear ned income int'l $ 1,000 135th 0 305 -11 16 0-150 Legislators, senior officials and managers % 137th 0 118 -78 93 0-100 Professional and technical workers % 103rd 0 663 -20 28 0-100 Educational Attainment 117th 0.950 -Literacy rate % 121st 0 859Enrolment in primary education % - - -Enrolment in secondary education % 1st 1 000 12 42 0-200 Enrolment in tertiary education % 1st 1 000 22 47 0-200 Health and Survival 81st 0 969 -Sex ratio at birth** % 1st 0 944Healthy life expectancy** years 92nd 1 024Political Empowerment 77th 0 197 -Women in parliament % - - -Women in ministerial positions % 37th 0 500 -33 33 0-100 Years with female/male head of state (last 50) 61st 0 029 -47 23 0-50 Economy Profile Tunisia Score (imparity = 0 parity = 1) 0.642 Rank (out of 146 countries) 128th Index Edition 2023 Compare with Global average 0 1 Female vs Male Min Max68 27 26 4916 05 4 89 89 47 10 54 60 14 39 86-86 90 99 32 26 68 49 15--66 67 33 33 48 61 1 39
Complementary Targets and Contextual Indicators 2023
are on a 0 to 1 scale, where 1 represents the optimal situation or “parity” Please see Appendix A and B for detailed methodology, definitions, sources and periods.
Global Gender Gap Report 2023 350 Economy Profile Tunisia Score 0.642 Rank 128th Page 2 of 2
General indicators Indicator Unit Value GDP US$ billions 46 69 GDP per capita constant '17 intl $ 1000 10 40 Population sex ratio female/male 1 02 Population growth rate % 0 83 Indicator Million people Female Male Value Total population 6 26 6 10 12 36 Work participation and leadership Indicator Unit Value Gender pay gap % (OECD countries only) n a Share of women's membership in boards % (OECD countries only) n a Firms with female majority ownership % firms 7 70 Firms with female top managers % firms 10 40 Share of workers in informal sector % workers 61 30 Indicator 1-7 (best) Value Advancement of women to leadership roles 4 59 Indicator Unit Female Male Value Unemployed adults % of labour force (15-64) 22 77 12 61 15 56 Workers employed part-time % of employed people 28 61 17 26 19 93 Proportion of time spent on unpaid domestic and care work % n a n a n a Indicator Million people Female Male Value Labour-force 1 00 2 53 3 53 Access to finance Indicator 0-1 (Equal rights) Value Access to financial services Equal rights
rights for widows and daughters Unequal rights Access to land assets Near-equal rights Access to non-land assets Near-equal rights Civil and political freedom Indicator Unit Value Year women received right to vote year 1957, 1959 Number of female heads of state to date number 0 Seats held in upper house % total seats n a Indicator Yes/No Value Election list quotas for women, national Yes Party membership quotas, voluntary Yes Indicator 0-1 (Equal rights) Value Access to justice Restricted rights Freedom of movement Equal rights Family and care Indicator Unit Value Public spending on family benefits % GPD n a Unmet family planning % women 15-49 19 90 Early marriage % 3 80 Mean age of women at birth of first child years n a Indicator 0-1 (Equal rights) Value Right to divorce Restricted rights Indicator Days Female Male Value Length of parental leave 30 00 1 00 0 Education and skills Graduates Attainment % Female Male Parity STEM Graduates n a n a n a Agri , Forestry, Fisheries & Veterinary 73 85 26 15 2 82 Arts & Humanities 79 91 20 09 3 98 Business, Admin & Law n a n a n a Education 75 38 24 62 3 06 Engineering, Manuf & Construction 44 19 55 81 0 79 Health & Welfare 75 26 24 74 3 04 Information & Comm Technologies 55 64 44 36 1 25 Natural Sci , Mathematics & Statistics 77 15 22 85 3 38 Social Sci
Information n a n a n a Vocational training n a n a n a PhD graduates n a n a n a Graduates % Female Male Value Graduates from tertiary education 39 79 19 26 29 10 Health Indicator Unit Value Prevalence of gender violence in lifetime % women 20 30 Births attended by skilled personnel % live births 99 50 Mater nal mortality deaths per 100,000 live births 43 00 Total fertility rate births per woman 2 11 Indicator 0-1 (Equal rights) Value Reproductive autonomy Equal rights
parity
benchmarked
case
sex ratio
birth the gender parity benchmark is set at 0 944 (see Klasen and Wink 2003) In the case of healthy life expectancy
gender parity benchmark
set at 1 06, given women's longer life expectancy
Inheritance
, Jour nalism &
*Scores
**For all indicators, except the two health indicators,
is
at 1 In the
of
at
the
is
Global Gender Gap Index Indicators
Global Gender Gap Report 2023 351 Global Gender Gap Index 2023 Edition Türkiye score average score 0.500 Economy 0 980 E d u c a t i o n 0.966 Health 0 106 P o i t i c s Overview Index and Subindex 2023 Score Rank 2022 Score Rank Global Gender Gap Index 0 638 129th 0 639 124th Economic Participation and Opportunity 0.500 133rd 0 493 134th Educational Attainment 0 980 99th 0 973 101st Health and Survival 0 966 100th 0 966 99th Political Empowerment 0 106 118th 0 123 112th
2023 Indicator Rank Score* Difference F-M Min Max Economic Participation and Opportunity 133rd 0 500 -Labour-force participation rate % 130th 0 467 -37 44 0-100 Wage equality for similar work 1-7 (best) 91st 0 603Estimated ear ned income int'l $ 1,000 128th 0 445 -24 17 0-150 Legislators, senior officials and managers % 119th 0 245 -60 70 0-100 Professional and technical workers % 98th 0 708 -17 06 0-100 Educational Attainment 99th 0.980 -Literacy rate % 100th 0 953Enrolment in primary education % 80th 0 996 -0 36 0-100 Enrolment in secondary education % 107th 0 973 -2 85 0-200 Enrolment in tertiary education % 106th 0 971 -3 43 0-200 Health and Survival 100th 0 966 -Sex ratio at birth** % 1st 0 944Healthy life expectancy** years 108th 1 017Political Empowerment 118th 0 106 -Women in parliament % 110th 0 211 -65 20 0-100 Women in ministerial positions % 134th 0 063 -88 24 0-100 Years with female/male head of state (last 50) 49th 0 057 -44 60 0-50 Economy Profile Türkiye Score (imparity = 0 parity = 1) 0.638 Rank (out of 146 countries) 129th Index Edition 2023 Compare with Global average 0 1 Female vs Male Min Max70 26 32 8243 53 19 36 80 35 19 65 58 53 41 4795 28 94 92 105 80 102 95 118 79 115 36-82 60 17 40 94 12 5 88 47 30 2 70
Complementary Targets and Contextual Indicators 2023
Global Gender Gap Report 2023 352 Economy Profile Türkiye Score 0.638 Rank 129th Page 2 of 2
General indicators Indicator Unit Value GDP US$ billions 819 04 GDP per capita constant '17 intl $ 1000 31 47 Population sex ratio female/male 1 00 Population growth rate % 0 76 Indicator Million people Female Male Value Total population 42 58 42 76 85 34 Work participation and leadership Indicator Unit Value Gender pay gap % (OECD countries only) 9 98 Share of women's membership in boards % (OECD countries only) 18 00 Firms with female majority ownership % firms 3 90 Firms with female top managers % firms 3 90 Share of workers in informal sector % workers 29 90 Indicator 1-7 (best) Value Advancement of women to leadership roles 4 08 Indicator Unit Female Male Value Unemployed adults % of labour force (15-64) 15 05 10 88 12 24 Workers employed part-time % of employed people 26 93 15 06 18 77 Proportion of time spent on unpaid domestic and care work % 19 15 3 71 n a Indicator Million people Female Male Value Labour-force 8 82 18 91 27 73 Access to finance Indicator 0-1 (Equal rights) Value Access to financial services Near-equal rights
rights for widows and daughters Near-equal rights Access to land assets Near-equal rights Access to non-land assets Near-equal rights Civil and political freedom Indicator Unit Value Year women received right to vote year 1930, 1934 Number of female heads of state to date number 1 Seats held in upper house % total seats n a Indicator Yes/No Value Election list quotas for women, national Yes Party membership quotas, voluntary Yes Indicator 0-1 (Equal rights) Value Access to justice Equal rights Freedom of movement Equal rights Family and care Indicator Unit Value Public spending on family benefits % GPD 0 54 Unmet family planning % women 15-49 11 60 Early marriage % 6 70 Mean age of women at birth of first child years 26 60 Indicator 0-1 (Equal rights) Value Right to divorce Near-equal rights Indicator Days Female Male Value Length of parental leave 112 00 7 00 0 Education and skills Graduates Attainment % Female Male Parity STEM Graduates 34 69 65 31 0 53 Agri , Forestry, Fisheries & Veterinary 43 62 56 38 0 77 Arts & Humanities n a n a n a Business, Admin & Law 47 00 53 00 0 89 Education 64 03 35 97 1 78 Engineering, Manuf & Construction 27 13 72 87 0 37 Health & Welfare 66 97 33 03 2 03 Information & Comm Technologies n a n a n a Natural Sci , Mathematics & Statistics n a n a n a Social Sci , Jour nalism & Information 53 12 46 88 1 13 Vocational training 20 67 23 16 0 89 PhD graduates 0 34 0 50 0 42 Graduates % Female Male Value Graduates from tertiary education 43 75 39 96 41 82 Health Indicator Unit Value Prevalence of gender violence in lifetime % women 38 00 Births attended by skilled personnel % live births 97 00 Mater nal mortality deaths per 100,000 live births 17 00 Total fertility rate births per woman 1 92 Indicator 0-1 (Equal rights) Value Reproductive autonomy Equal rights *Scores
**For
except
two health indicators, parity is benchmarked at 1 In the case of sex ratio at birth the gender parity benchmark is set at 0 944 (see Klasen and Wink 2003) In the case of healthy life expectancy the gender parity benchmark is set at 1 06, given women's longer life expectancy
Inheritance
are on a 0 to 1 scale, where 1 represents the optimal situation or “parity” Please see Appendix A and B for detailed methodology, definitions, sources and periods.
all indicators,
the
Global Gender Gap Index Indicators
Global Gender Gap Report 2023 353 Global Gender Gap Index 2023 Edition Uganda score average score 0.623 Economy 0 924 E d u c a t i o n 0.980 Health 0 297 P o i t i c s Overview Index and Subindex 2023 Score Rank 2022 Score Rank Global Gender Gap Index 0 706 78th 0 724 61st Economic Participation and Opportunity 0.623 102nd 0 696 73rd Educational Attainment 0 924 126th 0 924 122nd Health and Survival 0 980 1st 0 980 1st Political Empowerment 0 297 49th 0 294 46th
2023 Indicator Rank Score* Difference F-M Min Max Economic Participation and Opportunity 102nd 0 623 -Labour-force participation rate % 108th 0 655 -19 71 0-100 Wage equality for similar work 1-7 (best) 27th 0 720Estimated ear ned income int'l $ 1,000 111th 0 533 -1 37 0-150 Legislators, senior officials and managers % 73rd 0 540 -29 90 0-100 Professional and technical workers % 109th 0 590 -25 77 0-100 Educational Attainment 126th 0.924 -Literacy rate % 118th 0 885Enrolment in primary education % 1st 1 000 3 35 0-100 Enrolment in secondary education % 127th 0 901 -2 51 0-200 Enrolment in tertiary education % 123rd 0 741 -1 52 0-200 Health and Survival 1st 0 980 -Sex ratio at birth** % 1st 0 944Healthy life expectancy** years 1st 1 060Political Empowerment 49th 0 297 -Women in parliament % 45th 0 511 -32 40 0-100 Women in ministerial positions % 37th 0 500 -33 33 0-100 Years with female/male head of state (last 50) 56th 0 035 -46 61 0-50 Economy Profile Uganda Score (imparity = 0 parity = 1) 0.706 Rank (out of 146 countries) 78th Index Edition 2023 Compare with Global average 0 1 Female vs Male Min Max57 13 37 422 94 1 57 64 95 35 05 62 89 37 1184 43 87 78 25 43 22 93 5 84 4 33-66 20 33 80 66 67 33 33 48 31 1 69
Complementary Targets and Contextual Indicators 2023
Agri , Forestry, Fisheries & Veterinary
Business, Admin & Law
Engineering, Manuf & Construction
Information & Comm Technologies
Natural Sci , Mathematics & Statistics
Social Sci , Jour nalism & Information
Vocational training
Graduates from tertiary education
Indicator Unit
Indicator 0-1 (Equal rights)
*Scores are on a 0 to 1 scale, where 1 represents the optimal situation or “parity” Please see Appendix A and B for detailed methodology, definitions, sources and periods. **For all indicators, except the two health indicators, parity is benchmarked at 1 In the case of sex ratio at birth the
Global Gender Gap Report 2023 354 Economy Profile Uganda Score 0.706 Rank 78th Page 2 of 2
General indicators Indicator Unit Value GDP US$ billions 40 53 GDP per capita constant '17 intl $ 1000 2 25 Population sex ratio female/male 1 02 Population growth rate % 3 21 Indicator Million people Female Male Value Total population 23 85 23 40 47 25 Work participation and leadership Indicator Unit Value Gender pay gap % (OECD countries only) n a Share of women's membership in boards % (OECD countries only) n a Firms with female majority ownership % firms 10 20 Firms with female top managers % firms 15 40 Share of workers in informal sector % workers 91 10 Indicator 1-7 (best) Value Advancement of women to leadership roles 4 71 Indicator Unit Female Male Value Unemployed adults % of labour force (15-64) 4 15 2 96 3 54 Workers employed part-time % of employed people 40 61 31 42 35 12 Proportion of time spent on unpaid domestic and care work % 14 58 7 50 n a Indicator Million people Female Male Value Labour-force 6 12 6 50 12 62 Access to finance Indicator 0-1 (Equal rights) Value Access to financial services Restricted rights Inheritance rights for widows and daughters Uneven rights
to land assets Unequal rights
to non-land assets Uneven rights Civil and political freedom Indicator Unit Value Year women received right to vote year 1962 Number of female heads of state to date number 0 Seats held in upper house % total seats n a Indicator Yes/No Value Election list quotas for women, national Yes Party membership quotas, voluntary Yes Indicator 0-1 (Equal rights) Value Access to justice Near-equal rights Freedom of movement Restricted rights
and care Indicator Unit Value
spending on family benefits % GPD n a
family planning % women 15-49 15 00 Early marriage % 22 80 Mean age of women at birth of first child years n a Indicator 0-1
rights) Value
to divorce Restricted rights
Days Female Male Value
leave 84 00 4 00 0
Access
Access
Family
Public
Unmet
(Equal
Right
Indicator
Length of parental
Education and skills
% Female Male Parity STEM Graduates n a n a n a
Graduates Attainment
n a n a n a
n a n a n a
Arts & Humanities
n a n a n a Education n a n a n a
n a n a n a
n a n a n a
Health & Welfare
n a n a n a
n a n a n a
n a n a n a
n a n a n a
n a n a n a
Female Male Value
PhD graduates
Graduates %
n a n a n a
Health
Value
% women 49 90 Births
% live births 74 20 Mater
mortality deaths per 100,000 live births 375 00 Total fertility rate births per woman 4 69
Prevalence of gender violence in lifetime
attended by skilled personnel
nal
Value
rights
parity
case of
life expectancy
Reproductive autonomy Restricted
gender
benchmark is set at 0 944 (see Klasen and Wink 2003) In the
healthy life expectancy the gender parity benchmark is set at 1 06, given women's longer
Global Gender Gap Index Indicators
Global Gender Gap Report 2023 355 Global Gender Gap Index 2023 Edition Ukraine score average score 0.714 Economy 0 996 E d u c a t i o n 0.976 Health 0 172 P o i t i c s Overview Index and Subindex 2023 Score Rank 2022 Score Rank Global Gender Gap Index 0 714 66th 0 707 81st Economic Participation and Opportunity 0.714 55th 0 710 62nd Educational Attainment 0 996 56th 0 995 53rd Health and Survival 0 976 45th 0 978 37th Political Empowerment 0 172 87th 0 145 100th
2023 Indicator Rank Score* Difference F-M Min Max Economic Participation and Opportunity 55th 0 714 -Labour-force participation rate % 80th 0 760 -15 10 0-100 Wage equality for similar work 1-7 (best) 66th 0 640Estimated ear ned income int'l $ 1,000 77th 0 633 -5 93 0-150 Legislators, senior officials and managers % 34th 0 695 -18 00 0-100 Professional and technical workers % 1st 1 000 23 62 0-100 Educational Attainment 56th 0.996 -Literacy rate % 1st 1 000Enrolment in primary education % 1st 1 000 1 94 0-100 Enrolment in secondary education % 101st 0 981 -1 89 0-200 Enrolment in tertiary education % 1st 1 000 11 99 0-200 Health and Survival 45th 0 976 -Sex ratio at birth** % 123rd 0 939Healthy life expectancy** years 1st 1 060Political Empowerment 87th 0 172 -Women in parliament % 95th 0 256 -59 20 0-100 Women in ministerial positions % 68th 0 267 -57 89 0-100 Years with female/male head of state (last 50) 47th 0 060 -44 33 0-50 Economy Profile Ukraine Score (imparity = 0 parity = 1) 0.714 Rank (out of 146 countries) 66th Index Edition 2023 Compare with Global average 0 1 Female vs Male Min Max62 87 47 7716 15 10 22 59 00 41 00 38 19 61 8191 05 92 99 96 92 95 03 76 83 88 82-79 60 20 40 78 95 21 05 47 17 2 83
Complementary Targets and Contextual Indicators 2023
Global Gender Gap Report 2023 356 Economy Profile Ukraine Score 0.714 Rank 66th Page 2 of 2
General indicators Indicator Unit Value GDP US$ billions 200 09 GDP per capita constant '17 intl $ 1000 12 94 Population sex ratio female/male 1 16 Population growth rate % -0 77 Indicator Million people Female Male Value Total population 21 47 18 23 39 70 Work participation and leadership Indicator Unit Value Gender pay gap % (OECD countries only) n a Share of women's membership in boards % (OECD countries only) n a Firms with female majority ownership % firms 15 00 Firms with female top managers % firms 17 70 Share of workers in informal sector % workers n a Indicator 1-7 (best) Value Advancement of women to leadership roles 4 94 Indicator Unit Female Male Value Unemployed adults % of labour force (15-64) 10 63 9 92 10 26 Workers employed part-time % of employed people 19 59 11 26 15 27 Proportion of time spent on unpaid domestic and care work % n a n a n a Indicator Million people Female Male Value Labour-force 7 79 8 49 16 28 Access to finance Indicator 0-1 (Equal rights) Value Access to financial services Near-equal rights Inheritance rights for widows and daughters Equal rights Access to land assets Equal rights Access to non-land assets Equal rights Civil and political freedom Indicator Unit Value Year women received right to vote year n a Number of female heads of state to date number 1 Seats held in upper house % total seats n a Indicator Yes/No Value Election list quotas for women, national Yes Party membership quotas, voluntary Yes Indicator 0-1 (Equal rights) Value Access to justice Near-equal rights Freedom of movement Equal rights Family and care Indicator Unit Value Public spending on family benefits % GPD n a Unmet family planning % women 15-49 n a Early marriage % 7 20 Mean age of women at birth of first child years 26 20 Indicator 0-1 (Equal rights) Value Right to divorce Equal rights Indicator Days Female Male Value Length of parental leave 126 00 14 00 0 Education and skills Graduates Attainment % Female Male Parity STEM Graduates n a n a n a Agri , Forestry, Fisheries & Veterinary 32 89 67 11 0 49 Arts & Humanities n a n a n a Business, Admin & Law 59 16 40 84 1 45 Education 76 57 23 43 3 27 Engineering, Manuf & Construction 25 23 74 77 0 34 Health & Welfare 77 70 22 30 3 48 Information & Comm Technologies 17 46 82 54 0 21 Natural Sci , Mathematics & Statistics n a n a n a Social Sci , Jour nalism & Information 73 04 26 96 2 71 Vocational training 3 31 5 50 0 60 PhD graduates n a n a n a Graduates % Female Male Value Graduates from tertiary education n a n a n a Health Indicator Unit Value Prevalence of gender violence in lifetime % women 13 20 Births attended by skilled personnel % live births 99 90 Mater nal mortality deaths per 100,000 live births 19 00 Total fertility rate births per woman 1 22 Indicator 0-1 (Equal rights) Value Reproductive autonomy Equal rights *Scores
0
1 scale,
1 represents the optimal situation or “parity” Please see Appendix A and B for detailed methodology, definitions, sources and periods. **For all indicators, except the two health indicators, parity is benchmarked at 1 In the case of sex ratio at birth the gender parity benchmark is set at 0 944 (see Klasen and Wink 2003) In the case of healthy life expectancy the gender parity benchmark is set at 1 06, given women's longer life expectancy
are on a
to
where
United Arab Emirates
Global Gender Gap Index Indicators
Global Gender Gap Report 2023 357 Global Gender Gap Index 2023 Edition United Arab Emirates score average score 0.536 Economy 0 988 E d u c a t i o n 0.963 Health 0 363 P o i t i c s Overview Index and Subindex 2023 Score Rank 2022 Score Rank Global Gender Gap Index 0 712 71st 0 716 68th Economic Participation and Opportunity 0.536 128th 0 503 132nd Educational Attainment 0 988 86th 0 997 49th Health and Survival 0 963 119th 0 963 122nd Political Empowerment 0 363 35th 0 402 30th
2023 Indicator Rank Score* Difference F-M Min Max Economic Participation and Opportunity 128th 0 536 -Labour-force participation rate % 122nd 0 582 -37 71 0-100 Wage equality for similar work 1-7 (best) 8th 0 776Estimated ear ned income int'l $ 1,000 133rd 0 381 -53 25 0-150 Legislators, senior officials and managers % 113th 0 301 -53 74 0-100 Professional and technical workers % 127th 0 417 -41 11 0-100 Educational Attainment 86th 0.988 -Literacy rate % 83rd 0 983Enrolment in primary education % 87th 0 990 -0 99 0-100 Enrolment in secondary education % 99th 0 982 -1 87 0-200 Enrolment in tertiary education % 1st 1 000 15 04 0-200 Health and Survival 119th 0 963 -Sex ratio at birth** % 1st 0 944Healthy life expectancy** years 130th 1 005Political Empowerment 35th 0 363 -Women in parliament % 1st 1 000 0 0-100 Women in ministerial positions % 81st 0 214 -64 71 0-100 Years with female/male head of state (last 50) 80th 0 000 -50 00 0-50 Economy Profile
Score (imparity = 0 parity = 1) 0.712 Rank (out of 146 countries) 71st Index Edition 2023 Compare with Global average 0 1 Female vs Male Min Max90 28 52 5786 05 32 80 76 87 23 13 70 56 29 4499 75 98 76 106 22 104 36 49 73 64 77-50 00 50 00 82 35 17 65 50 00 0
Complementary Targets and Contextual Indicators 2023
Global Gender Gap Report 2023 358 Economy Profile United Arab Emirates Score 0.712 Rank 71st Page 2 of 2
General indicators Indicator Unit Value GDP US$ billions 415 02 GDP per capita constant '17 intl $ 1000 69 73 Population sex ratio female/male 0 44 Population growth rate % 0 83 Indicator Million people Female Male Value Total population 2 89 6 55 9 44 Work participation and leadership Indicator Unit Value Gender pay gap % (OECD countries only) n a Share of women's membership in boards % (OECD countries only) n a Firms with female majority ownership % firms n a Firms with female top managers % firms n a Share of workers in informal sector % workers n a Indicator 1-7 (best) Value Advancement of women to leadership roles 5 62 Indicator Unit Female Male Value Unemployed adults % of labour force (15-64) 6 20 2 12 3 12 Workers employed part-time % of employed people 3 94 2 23 2 64 Proportion of time spent on unpaid domestic and care work % n a n a n a Indicator Million people Female Male Value Labour-force 1 65 5 10 6 75 Access to finance Indicator 0-1 (Equal rights) Value Access to financial services Equal rights Inheritance rights for widows and daughters Unequal rights Access to land assets Equal rights Access to non-land assets Equal rights Civil and political freedom Indicator Unit Value Year women received right to vote year 2005 Number of female heads of state to date number 0 Seats held in upper house % total seats n a Indicator Yes/No Value Election list quotas for women, national Yes Party membership quotas, voluntary n a Indicator 0-1 (Equal rights) Value Access to justice Equal rights Freedom of movement Restricted rights Family and care Indicator Unit Value Public spending on family benefits % GPD n a Unmet family planning % women 15-49 n a Early marriage % 6 80 Mean age of women at birth of first child years n a Indicator 0-1 (Equal rights) Value Right to divorce Unequal rights Indicator Days Female Male Value Length of parental leave 60 00 0 0 Education and skills Graduates Attainment % Female Male Parity STEM Graduates 41 49 58 51 0 71 Agri , Forestry, Fisheries & Veterinary 80 95 19 05 4 25 Arts & Humanities 82 34 17 66 4 66 Business, Admin & Law 43 19 56 81 0 76 Education n a n a n a Engineering, Manuf & Construction n a n a n a Health & Welfare 81 09 18 91 4 29 Information & Comm Technologies 55 39 44 61 1 24 Natural Sci , Mathematics & Statistics 85 94 14 06 6 11 Social Sci , Jour nalism & Information 77 44 22 56 3 43 Vocational training 0 78 0 80 0 98 PhD graduates 0 68 1 03 0 88 Graduates % Female Male Value Graduates from tertiary education 26 85 9 52 15 11 Health Indicator Unit Value Prevalence of gender violence in lifetime % women n a Births attended by skilled personnel % live births 99 20 Mater nal mortality deaths per 100,000 live births 3 00 Total fertility rate births per woman 1 46 Indicator 0-1 (Equal rights) Value Reproductive autonomy Restricted rights *Scores
0
1 scale, where 1 represents the optimal situation
parity” Please see Appendix A and B for detailed methodology, definitions, sources and periods. **For all indicators, except the two health indicators, parity is benchmarked at 1 In the case of sex ratio at birth the gender parity benchmark is set at 0 944 (see Klasen and Wink 2003) In the case of healthy life expectancy the gender parity benchmark is set at 1 06, given women's longer life expectancy
are on a
to
or “
Global Gender Gap Index Indicators
Global Gender Gap Report 2023 359 Global Gender Gap Index 2023 Edition United Kingdom score average score 0.731 Economy 0 999 E d u c a t i o n 0.965 Health 0 472 P o i t i c s Overview Index and Subindex 2023 Score Rank 2022 Score Rank Global Gender Gap Index 0 792 15th 0 780 22nd Economic Participation and Opportunity 0.731 43rd 0 733 44th Educational Attainment 0 999 34th 0 999 33rd Health and Survival 0 965 105th 0 965 105th Political Empowerment 0 472 19th 0 423 24th
2023 Indicator Rank Score* Difference F-M Min Max Economic Participation and Opportunity 43rd 0 731 -Labour-force participation rate % 36th 0 858 -9 71 0-100 Wage equality for similar work 1-7 (best) 41st 0 697Estimated ear ned income int'l $ 1,000 86th 0 619 -21 19 0-150 Legislators, senior officials and managers % 57th 0 583 -26 35 0-100 Professional and technical workers % 68th 0 992 -0 41 0-100 Educational Attainment 34th 0.999 -Literacy rate % 1st 1 000Enrolment in primary education % 76th 0 998 -0 22 0-100 Enrolment in secondary education % 1st 1 000 2 78 0-200 Enrolment in tertiary education % 1st 1 000 21 06 0-200 Health and Survival 105th 0 965 -Sex ratio at birth** % 1st 0 944Healthy life expectancy** years 116th 1 014Political Empowerment 19th 0 472 -Women in parliament % 43rd 0 527 -31 00 0-100 Women in ministerial positions % 37th 0 500 -33 33 0-100 Years with female/male head of state (last 50) 9th 0 418 -20 52 0-50 Economy Profile United
Score (imparity = 0 parity = 1) 0.792 Rank (out of 146 countries) 15th Index Edition 2023 Compare with Global average 0 1 Female vs Male Min Max68 17 58 4655 70 34 51 63 17 36 83 50 21 49 8098 13 97 91 115 52 118 30 59 15 80 21-65 50 34 50 66 67 33 33 35 26 14 74
Kingdom
Complementary Targets and Contextual Indicators 2023
Global Gender Gap Report 2023 360 Economy Profile United Kingdom Score 0.792 Rank 15th Page 2 of 2
General indicators Indicator Unit Value GDP US$ billions 3,131 38 GDP per capita constant '17 intl $ 1000 44 98 Population sex ratio female/male 1 02 Population growth rate % 0 37 Indicator Million people Female Male Value Total population 34 15 33 36 67 51 Work participation and leadership Indicator Unit Value Gender pay gap % (OECD countries only) 14 35 Share of women's membership in boards % (OECD countries only) 37 80 Firms with female majority ownership % firms n a Firms with female top managers % firms n a Share of workers in informal sector % workers 24 50 Indicator 1-7 (best) Value Advancement of women to leadership roles 5 10 Indicator Unit Female Male Value Unemployed adults % of labour force (15-64) 3 61 4 02 3 83 Workers employed part-time % of employed people 56 23 27 56 41 11 Proportion of time spent on unpaid domestic and care work % 12 65 6 97 n a Indicator Million people Female Male Value Labour-force 14 02 15 78 29 80 Access to finance Indicator 0-1 (Equal rights) Value Access to financial services Equal rights Inheritance rights for widows and daughters Near-equal rights Access to land assets Near-equal rights Access to non-land assets Equal rights Civil and political freedom Indicator Unit Value Year women received right to vote year 1918, 1928 Number of female heads of state to date number 3 Seats held in upper house % total seats 29 00 Indicator Yes/No Value Election list quotas for women, national Yes Party membership quotas, voluntary Yes Indicator 0-1 (Equal rights) Value Access to justice Equal rights Freedom of movement Equal rights Family and care Indicator Unit Value Public spending on family benefits % GPD 2 31 Unmet family planning % women 15-49 n a Early marriage % 3 00 Mean age of women at birth of first child years 29 00 Indicator 0-1 (Equal rights) Value Right to divorce Equal rights Indicator Days Female Male Value Length of parental leave 42 00 14 00 231 00 Education and skills Graduates Attainment % Female Male Parity STEM Graduates 38 10 61 90 0 62 Agri , Forestry, Fisheries & Veterinary n a n a n a Arts & Humanities 63 30 36 70 1 72 Business, Admin & Law 53 70 46 30 1 16 Education n a n a n a Engineering, Manuf & Construction 23 46 76 54 0 31 Health & Welfare 75 37 24 63 3 06 Information & Comm Technologies 19 38 80 62 0 24 Natural Sci , Mathematics & Statistics 52 96 47 04 1 13 Social Sci , Jour nalism & Information 62 41 37 59 1 66 Vocational training 15 81 18 48 0 86 PhD graduates 0 88 1 29 1 08 Graduates % Female Male Value Graduates from tertiary education 59 94 43 34 51 49 Health Indicator Unit Value Prevalence of gender violence in lifetime % women 29 00 Births attended by skilled personnel % live births n a Mater nal mortality deaths per 100,000 live births 7 00 Total fertility rate births per woman 1 56 Indicator 0-1 (Equal rights) Value Reproductive autonomy Restricted rights *Scores are on a 0 to 1 scale, where 1 represents the optimal situation or “parity” Please see Appendix A and B for detailed methodology, definitions, sources and periods. **For all indicators, except the two health indicators, parity is benchmarked at 1 In the case of sex ratio at birth the gender parity benchmark is set at 0 944 (see Klasen and Wink 2003) In the case of healthy life expectancy the gender parity benchmark is set at 1 06, given women's longer life expectancy
Global Gender Gap Index Indicators
Global Gender Gap Report 2023 361 Global Gender Gap Index 2023 Edition United States score average score 0.780 Economy 0 995 E d u c a t i o n 0.970 Health 0 248 P o i t i c s Overview Index and Subindex 2023 Score Rank 2022 Score Rank Global Gender Gap Index 0 748 43rd 0 769 27th Economic Participation and Opportunity 0.780 21st 0 778 22nd Educational Attainment 0 995 59th 0 996 51st Health and Survival 0 970 78th 0 970 83rd Political Empowerment 0 248 63rd 0 332 38th
2023 Indicator Rank Score* Difference F-M Min Max Economic Participation and Opportunity 21st 0 780 -Labour-force participation rate % 53rd 0 836 -11 18 0-100 Wage equality for similar work 1-7 (best) 9th 0 773Estimated ear ned income int'l $ 1,000 58th 0 675 -24 73 0-150 Legislators, senior officials and managers % 33rd 0 695 -18 00 0-100 Professional and technical workers % 1st 1 000 9 49 0-100 Educational Attainment 59th 0.995 -Literacy rate % 1st 1 000Enrolment in primary education % 68th 0 999 -0 08 0-100 Enrolment in secondary education % 102nd 0 979 -2 15 0-200 Enrolment in tertiary education % 1st 1 000 30 12 0-200 Health and Survival 78th 0 970 -Sex ratio at birth** % 1st 0 944Healthy life expectancy** years 91st 1 028Political Empowerment 63rd 0 248 -Women in parliament % 59th 0 401 -42 80 0-100 Women in ministerial positions % 37th 0 500 -33 33 0-100 Years with female/male head of state (last 50) 80th 0 000 -50 00 0-50 Economy Profile United States Score (imparity = 0 parity = 1) 0.748 Rank (out of 146 countries) 43rd Index Edition 2023 Compare with Global average 0 1 Female vs Male Min Max67 97 56 7976 16 51 42 59 00 41 00 45 25 54 7598 03 97 96 101 56 99 41 72 84 102 96-71 40 28 60 66 67 33 33 50 00 0
Complementary Targets and Contextual Indicators 2023
Global Gender Gap Report 2023 362 Economy Profile United States Score 0.748 Rank 43rd Page 2 of 2
General indicators Indicator Unit Value GDP US$ billions 23,315 08 GDP per capita constant '17 intl $ 1000 63 67 Population sex ratio female/male 1 02 Population growth rate % 0 12 Indicator Million people Female Male Value Total population 170 79 167 50 338 29 Work participation and leadership Indicator Unit Value Gender pay gap % (OECD countries only) 16 86 Share of women's membership in boards % (OECD countries only) 29 70 Firms with female majority ownership % firms n a Firms with female top managers % firms n a Share of workers in informal sector % workers n a Indicator 1-7 (best) Value Advancement of women to leadership roles 5 28 Indicator Unit Female Male Value Unemployed adults % of labour force (15-64) 3 66 3 73 3 70 Workers employed part-time % of employed people 31 62 20 29 25 59 Proportion of time spent on unpaid domestic and care work % 15 33 9 67 n a Indicator Million people Female Male Value Labour-force 66 54 76 65 143 19 Access to finance Indicator 0-1 (Equal rights) Value Access to financial services Equal rights Inheritance rights for widows and daughters Equal rights Access to land assets Equal rights Access to non-land assets Equal rights Civil and political freedom Indicator Unit Value Year women received right to vote year 1920, 1965 Number of female heads of state to date number 0 Seats held in upper house % total seats 25 00 Indicator Yes/No Value Election list quotas for women, national n a Party membership quotas, voluntary n a Indicator 0-1 (Equal rights) Value Access to justice Equal rights Freedom of movement Equal rights Family and care Indicator Unit Value Public spending on family benefits % GPD 0 67 Unmet family planning % women 15-49 7 20 Early marriage % 2 10 Mean age of women at birth of first child years 27 00 Indicator 0-1 (Equal rights) Value Right to divorce Equal rights Indicator Days Female Male Value Length of parental leave 0 0 0 Education and skills Graduates Attainment % Female Male Parity STEM Graduates n a n a n a Agri , Forestry, Fisheries & Veterinary 52 03 47 97 1 08 Arts & Humanities 60 04 39 96 1 50 Business, Admin & Law 50 51 49 49 1 02 Education 78 22 21 78 3 59 Engineering, Manuf & Construction 20 44 79 56 0 26 Health & Welfare 81 40 18 60 4 38 Information & Comm Technologies n a n a n a Natural Sci , Mathematics & Statistics 52 45 47 55 1 10 Social Sci , Jour nalism & Information 65 25 34 75 1 88 Vocational training 1 66 1 36 1 22 PhD graduates 1 76 2 44 2 09 Graduates % Female Male Value Graduates from tertiary education n a n a n a Health Indicator Unit Value Prevalence of gender violence in lifetime % women 35 60 Births attended by skilled personnel % live births 99 00 Mater nal mortality deaths per 100,000 live births 19 00 Total fertility rate births per woman 1 64 Indicator 0-1 (Equal rights) Value Reproductive autonomy Equal rights *Scores
0
1
1 represents the optimal situation
parity” Please see Appendix A
B for detailed methodology, definitions, sources and periods. **For all indicators, except the two health indicators, parity is benchmarked at 1 In the case of sex ratio at birth the gender parity benchmark is set at 0 944 (see Klasen and Wink 2003) In the case of healthy life expectancy the gender parity benchmark is set at 1 06, given women's longer life expectancy
are on a
to
scale, where
or “
and
Global Gender Gap Index Indicators
Global Gender Gap Report 2023 363 Global Gender Gap Index 2023 Edition Uruguay score average score 0.726 Economy 1 000 E d u c a t i o n 0.980 Health 0 152 P o i t i c s Overview Index and Subindex 2023 Score Rank 2022 Score Rank Global Gender Gap Index 0 714 67th 0 711 72nd Economic Participation and Opportunity 0.726 47th 0 717 58th Educational Attainment 1 000 1st 1 000 1st Health and Survival 0 980 1st 0 980 1st Political Empowerment 0 152 94th 0 146 98th
2023 Indicator Rank Score* Difference F-M Min Max Economic Participation and Opportunity 47th 0 726 -Labour-force participation rate % 65th 0 796 -14 35 0-100 Wage equality for similar work 1-7 (best) 59th 0 653Estimated ear ned income int'l $ 1,000 60th 0 669 -9 08 0-150 Legislators, senior officials and managers % 43rd 0 644 -21 62 0-100 Professional and technical workers % 1st 1 000 9 31 0-100 Educational Attainment 1st 1.000 -Literacy rate % 1st 1 000Enrolment in primary education % 1st 1 000 0 89 0-100 Enrolment in secondary education % 1st 1 000 12 44 0-200 Enrolment in tertiary education % 1st 1 000 43 62 0-200 Health and Survival 1st 0 980 -Sex ratio at birth** % 1st 0 944Healthy life expectancy** years 1st 1 060Political Empowerment 94th 0 152 -Women in parliament % 76th 0 357 -47 40 0-100 Women in ministerial positions % 101st 0 167 -71 43 0-100 Years with female/male head of state (last 50) 80th 0 000 -50 00 0-50 Economy Profile Uruguay Score (imparity = 0 parity = 1) 0.714 Rank (out of 146 countries) 67th Index Edition 2023 Compare with Global average 0 1 Female vs Male Min Max70 46 56 1127 48 18 40 60 81 39 19 45 34 54 6699 00 99 89 113 86 126 30 66 04 109 66-73 70 26 30 85 71 14 29 50 00 0
Complementary Targets and Contextual Indicators 2023
Global Gender Gap Report 2023 364 Economy Profile Uruguay Score 0.714 Rank 67th Page 2 of 2
General indicators Indicator Unit Value GDP US$ billions 59 32 GDP per capita constant '17 intl $ 1000 22 80 Population sex ratio female/male 1 06 Population growth rate % -0 08 Indicator Million people Female Male Value Total population 1 76 1 66 3 42 Work participation and leadership Indicator Unit Value Gender pay gap % (OECD countries only) n a Share of women's membership in boards % (OECD countries only) n a Firms with female majority ownership % firms 11 60 Firms with female top managers % firms 10 60 Share of workers in informal sector % workers 27 90 Indicator 1-7 (best) Value Advancement of women to leadership roles 4 82 Indicator Unit Female Male Value Unemployed adults % of labour force (15-64) 9 19 7 08 8 06 Workers employed part-time % of employed people n a n a n a Proportion of time spent on unpaid domestic and care work % 19 87 8 38 n a Indicator Million people Female Male Value Labour-force 0 73 0 85 1 58 Access to finance Indicator 0-1 (Equal rights) Value Access to financial services Near-equal rights Inheritance rights for widows and daughters Equal rights Access to land assets Near-equal rights Access to non-land assets Near-equal rights Civil and political freedom Indicator Unit Value Year women received right to vote year 1932 Number of female heads of state to date number 0 Seats held in upper house % total seats 29 00 Indicator Yes/No Value Election list quotas for women, national Yes Party membership quotas, voluntary Yes Indicator 0-1 (Equal rights) Value Access to justice Near-equal rights Freedom of movement Equal rights Family and care Indicator Unit Value Public spending on family benefits % GPD n a Unmet family planning % women 15-49 n a Early marriage % 12 00 Mean age of women at birth of first child years n a Indicator 0-1 (Equal rights) Value Right to divorce Equal rights Indicator Days Female Male Value Length of parental leave 98 00 13 00 0 Education and skills Graduates Attainment % Female Male Parity STEM Graduates 43 96 56 04 0 78 Agri , Forestry, Fisheries & Veterinary 39 68 60 32 0 66 Arts & Humanities n a n a n a Business, Admin & Law 62 72 37 28 1 68 Education 84 86 15 14 5 60 Engineering, Manuf & Construction 45 92 54 08 0 85 Health & Welfare 77 54 22 46 3 45 Information & Comm Technologies 17 66 82 34 0 21 Natural Sci , Mathematics & Statistics 70 69 29 31 2 41 Social Sci , Jour nalism & Information 74 33 25 67 2 90 Vocational training 9 19 13 62 0 68 PhD graduates 0 06 0 06 0 06 Graduates % Female Male Value Graduates from tertiary education 25 71 12 25 18 87 Health Indicator Unit Value Prevalence of gender violence in lifetime % women 14 80 Births attended by skilled personnel % live births 100 00 Mater nal mortality deaths per 100,000 live births 17 00 Total fertility rate births per woman 1 48 Indicator 0-1 (Equal rights) Value Reproductive autonomy Equal rights *Scores are on a 0 to 1 scale, where 1 represents the optimal situation or “parity” Please see Appendix A and B for detailed methodology, definitions, sources and periods. **For all indicators, except the two health indicators, parity is benchmarked at 1 In the case of sex ratio at birth the gender parity benchmark is set at 0 944 (see Klasen and Wink 2003) In the case of healthy life expectancy the gender parity benchmark is set at 1 06, given women's longer life expectancy
Global Gender Gap Index Indicators
Global Gender Gap Report 2023 365 Global Gender Gap Index 2023 Edition Vanuatu score average score 0.742 Economy 0 991 E d u c a t i o n 0.971 Health 0 006 P o i t i c s Overview Index and Subindex 2023 Score Rank 2022 Score Rank Global Gender Gap Index 0 678 108th 0 670 111th Economic Participation and Opportunity 0.742 35th 0 712 59th Educational Attainment 0 991 74th 0 991 73rd Health and Survival 0 971 65th 0 976 51st Political Empowerment 0 006 145th 0 000 146th
2023 Indicator Rank Score* Difference F-M Min Max Economic Participation and Opportunity 35th 0 742 -Labour-force participation rate % 39th 0 853 -9 27 0-100 Wage equality for similar work 1-7 (best) - - -Estimated ear ned income int'l $ 1,000 94th 0 601 -1 38 0-150 Legislators, senior officials and managers % 55th 0 590 -25 79 0-100 Professional and technical workers % 1st 1 000 1 15 0-100 Educational Attainment 74th 0.991 -Literacy rate % 81st 0 984Enrolment in primary education % 88th 0 990 -0 98 0-100 Enrolment in secondary education % 1st 1 000 3 98 0-200 Enrolment in tertiary education % - - -Health and Survival 65th 0 971 -Sex ratio at birth** % 134th 0 935Healthy life expectancy** years 46th 1 054Political Empowerment 145th 0 006 -Women in parliament % 143rd 0 019 -96 20 0-100 Women in ministerial positions % 140th 0 000 -100 00 0-100 Years with female/male head of state (last 50) 80th 0 000 -50 00 0-50 Economy Profile Vanuatu Score (imparity = 0 parity = 1) 0.678 Rank (out of 146 countries) 108th Index Edition 2023 Compare with Global average 0 1 Female vs Male Min Max63 20 53 933 47 2 09 62 91 37 11 49 42 50 5797 07 96 08 52 99 56 97--98 10 1 90 100 00 0 50 00 0
Complementary Targets and Contextual Indicators 2023
Agri
Engineering, Manuf & Construction
Health & Welfare
Information & Comm Technologies
Natural Sci , Mathematics & Statistics
Social Sci , Jour nalism & Information
Graduates from tertiary education
Indicator Unit
Prevalence of gender violence in lifetime % women
Births attended by skilled personnel %
Indicator 0-1 (Equal rights)
Reproductive autonomy
*Scores are on a 0 to 1 scale, where 1 represents the optimal situation or “parity” Please see Appendix A and B for detailed methodology, definitions, sources and periods. **For all indicators, except the two health indicators, parity is benchmarked at 1 In the case of sex ratio at birth the gender parity benchmark is set at 0 944 (see Klasen and Wink 2003) In the case of healthy life expectancy the gender parity benchmark is set at 1 06, given women's longer life expectancy
Global Gender Gap Report 2023 366 Economy Profile Vanuatu Score 0.678 Rank 108th Page 2 of 2
General indicators Indicator Unit Value GDP US$ billions 0 96 GDP per capita constant '17 intl $ 1000 2 78 Population sex ratio female/male 0 99 Population growth rate % 2 36 Indicator Million people Female Male Value Total population 0 16 0 16 0 33 Work participation and leadership Indicator Unit Value Gender pay gap % (OECD countries only) n a Share of women's membership in boards % (OECD countries only) n a Firms with female majority ownership % firms n a Firms with female top managers % firms n a Share of workers in informal sector % workers 72 40 Indicator 1-7 (best) Value Advancement of women to leadership roles n a Indicator Unit Female Male Value Unemployed adults % of labour force (15-64) 4 27 4 14 4 20 Workers employed part-time % of employed people 34 23 41 48 38 21 Proportion of time spent on unpaid domestic and care work % n a n a n a Indicator Million people Female Male Value Labour-force 0 03 0 04 0 06 Access to finance Indicator 0-1 (Equal rights) Value Access to financial services n a Inheritance rights for widows and daughters n a Access to land assets n a Access to non-land assets n a Civil and political freedom Indicator Unit Value Year women received right to vote year 1975, 1980 Number of female heads of state to date number 0 Seats held in upper house % total seats n a Indicator Yes/No Value Election list quotas for women, national n a Party membership quotas, voluntary n a Indicator 0-1 (Equal rights) Value Access to justice n a Freedom of movement n a
and care
Unit Value
spending on family benefits % GPD n a
family planning % women 15-49 24 20 Early marriage % n a Mean age of women at birth of first child years n a
0-1 (Equal rights) Value Right to divorce n a Indicator Days Female Male Value Length of parental leave 84 00 0 0 Education and skills Graduates Attainment % Female Male Parity STEM Graduates n a n a n a
Family
Indicator
Public
Unmet
Indicator
, Forestry, Fisheries & Veterinary n a n a n a Arts & Humanities n a n a n a
Law n a n a n a Education n a n a n a
Business, Admin &
n a n a n a
n a n a n a
n a n a n a
n a n a n a
n a n a n a
0 67 0 69 0 97
n a n a n a
Female Male Value
Vocational training
PhD graduates
Graduates %
n a n a n a
Health
Value
n a
live births 89 40
live births 72 00 Total
3 78
Mater nal mortality deaths per 100,000
fertility rate births per woman
Value
n a
Global Gender Gap Index Indicators
Global Gender Gap Report 2023 367 Global Gender Gap Index 2023 Edition Viet Nam score average score 0.749 Economy 0 985 E d u c a t i o n 0.946 Health 0 166 P o i t i c s Overview Index and Subindex 2023 Score Rank 2022 Score Rank Global Gender Gap Index 0 711 72nd 0 705 83rd Economic Participation and Opportunity 0.749 31st 0 751 31st Educational Attainment 0 985 89th 0 985 88th Health and Survival 0 946 144th 0 950 141st Political Empowerment 0 166 89th 0 135 106th
2023 Indicator Rank Score* Difference F-M Min Max Economic Participation and Opportunity 31st 0 749 -Labour-force participation rate % 23rd 0 881 -9 30 0-100 Wage equality for similar work 1-7 (best) 28th 0 715Estimated ear ned income int'l $ 1,000 14th 0 814 -2 19 0-150 Legislators, senior officials and managers % 107th 0 344 -48 79 0-100 Professional and technical workers % 1st 1 000 11 68 0-100 Educational Attainment 89th 0.985 -Literacy rate % 87th 0 975Enrolment in primary education % - - -Enrolment in secondary education % - - -Enrolment in tertiary education % 1st 1 000 4 22 0-200 Health and Survival 144th 0 946 -Sex ratio at birth** % 144th 0 896Healthy life expectancy** years 1st 1 060Political Empowerment 89th 0 166 -Women in parliament % 53rd 0 435 -39 40 0-100 Women in ministerial positions % 114th 0 125 -77 78 0-100 Years with female/male head of state (last 50) 80th 0 000 -50 00 0-50 Economy Profile V iet Nam Score (imparity = 0 parity = 1) 0.711 Rank (out of 146 countries) 72nd Index Edition 2023 Compare with Global average 0 1 Female vs Male Min Max77 84 68 5411 73 9 55 74 40 25 60 44 16 55 84-33 35 37 57-69 70 30 30 88 89 11 11 50 00 0
Complementary Targets and Contextual Indicators 2023
Global Gender Gap Report 2023 368 Economy Profile Viet Nam Score 0.711 Rank 72nd Page 2 of 2
General indicators Indicator Unit Value GDP US$ billions 366 14 GDP per capita constant '17 intl $ 1000 10 63 Population sex ratio female/male 1 02 Population growth rate % 0 84 Indicator Million people Female Male Value Total population 49 69 48 50 98 19 Work participation and leadership Indicator Unit Value Gender pay gap % (OECD countries only) n a Share of women's membership in boards % (OECD countries only) n a Firms with female majority ownership % firms 19 30 Firms with female top managers % firms 22 40 Share of workers in informal sector % workers 68 60 Indicator 1-7 (best) Value Advancement of women to leadership roles 4 88 Indicator Unit Female Male Value Unemployed adults % of labour force (15-64) 1 53 1 71 1 62 Workers employed part-time % of employed people 30 53 22 20 26 20 Proportion of time spent on unpaid domestic and care work % n a n a n a Indicator Million people Female Male Value Labour-force 24 06 25 81 49 87 Access to finance Indicator 0-1 (Equal rights) Value Access to financial services Near-equal rights
rights for widows and daughters Near-equal rights Access to land assets Near-equal rights Access to non-land assets Near-equal rights Civil and political freedom Indicator Unit Value Year women received right to vote year 1946 Number of female heads of state to date number 1 Seats held in upper house % total seats n a Indicator Yes/No Value Election list quotas for women, national Yes Party membership quotas, voluntary n a Indicator 0-1 (Equal rights) Value Access to justice Equal rights Freedom of movement Equal rights Family and care Indicator Unit Value Public spending on family benefits % GPD n a Unmet family planning % women 15-49 10 10 Early marriage % 10 30 Mean age of women at birth of first child years n a Indicator 0-1 (Equal rights) Value Right to divorce Near-equal rights Indicator Days Female Male Value Length of parental leave 180 00 7 00 0 Education and skills Graduates Attainment % Female Male Parity STEM Graduates 36 51 63 49 0 58 Agri
& Veterinary n a n a n a Arts & Humanities n a n a n a Business, Admin & Law 59 53 40 47 1 47 Education n a n a n a Engineering, Manuf & Construction n a n a n a Health & Welfare 58 72 41 28 1 42 Information & Comm Technologies n a n a n a Natural Sci , Mathematics & Statistics 50 59 49 41 1 02 Social Sci , Jour nalism & Information n a n a n a Vocational training n a n a n a PhD graduates 0 04 0 11 0 07 Graduates % Female Male Value Graduates from tertiary education 22 95 14 84 18 78 Health Indicator Unit Value Prevalence of gender violence in lifetime % women 34 40 Births attended by skilled personnel % live births 96 10 Mater nal mortality deaths per 100,000 live births 43 00 Total fertility rate births per woman 1 96 Indicator 0-1 (Equal rights) Value Reproductive autonomy Equal rights *Scores
0 to 1 scale,
1 represents the optimal situation
parity
Please see Appendix A and B for detailed methodology, definitions, sources and periods. **For all indicators, except the two health indicators, parity is benchmarked at 1 In the case of sex ratio at birth the gender parity benchmark is set at 0 944 (see Klasen and Wink 2003) In the case of healthy life expectancy the gender parity benchmark is set at 1 06, given women's longer life expectancy
Inheritance
, Forestry, Fisheries
are on a
where
or “
”
Global Gender Gap Index Indicators
Global Gender Gap Report 2023 369 Global Gender Gap Index 2023 Edition Zambia score average score 0.734 Economy 0 979 E d u c a t i o n 0.980 Health 0 102 P o i t i c s Overview Index and Subindex 2023 Score Rank 2022 Score Rank Global Gender Gap Index 0 699 85th 0 723 62nd Economic Participation and Opportunity 0.734 40th 0 803 10th Educational Attainment 0 979 101st 0 938 119th Health and Survival 0 980 1st 0 980 1st Political Empowerment 0 102 119th 0 173 85th
2023 Indicator Rank Score* Difference F-M Min Max Economic Participation and Opportunity 40th 0 734 -Labour-force participation rate % 61st 0 816 -12 20 0-100 Wage equality for similar work 1-7 (best) 47th 0 678Estimated ear ned income int'l $ 1,000 40th 0 717 -1 07 0-150 Legislators, senior officials and managers % 22nd 0 763 -13 43 0-100 Professional and technical workers % 97th 0 740 -14 96 0-100 Educational Attainment 101st 0.979 -Literacy rate % 108th 0 926Enrolment in primary education % 1st 1 000 3 83 0-100 Enrolment in secondary education % - - -Enrolment in tertiary education % - - -Health and Survival 1st 0 980 -Sex ratio at birth** % 1st 0 944Healthy life expectancy** years 1st 1 060Political Empowerment 119th 0 102 -Women in parliament % 118th 0 176 -70 00 0-100 Women in ministerial positions % 94th 0 190 -68 00 0-100 Years with female/male head of state (last 50) 80th 0 000 -50 00 0-50 Economy Profile Zambia Score (imparity = 0 parity = 1) 0.699 Rank (out of 146 countries) 85th Index Edition 2023 Compare with Global average 0 1 Female vs Male Min Max66 36 54 163 78 2 71 56 72 43 28 57 48 42 5283 20 87 03--85 00 15 00 84 00 16 00 50 00 0
Complementary Targets and Contextual Indicators 2023
Agri , Forestry, Fisheries & Veterinary
Natural Sci , Mathematics & Statistics
Social Sci , Jour nalism & Information
Inheritance
Indicator
Global Gender Gap Report 2023 370 Economy Profile Zambia Score 0.699 Rank 85th Page 2 of 2
General indicators Indicator Unit Value GDP US$ billions 22 15 GDP per capita constant '17 intl $ 1000 3 24 Population sex ratio female/male 1 03 Population growth rate % 2 84 Indicator Million people Female Male Value Total population 10 14 9 88 20 02 Work participation and leadership Indicator Unit Value Gender pay gap % (OECD countries only) n a Share of women's membership in boards % (OECD countries only) n a Firms with female majority ownership % firms 16 50 Firms with female top managers % firms 12 90 Share of workers in informal sector % workers 86 00 Indicator 1-7 (best) Value Advancement of women to leadership roles 4 87 Indicator Unit Female Male Value Unemployed adults % of labour force (15-64) 5 91 4 91 5 37 Workers employed part-time % of employed people 17 14 16 14 16 60 Proportion of time spent on unpaid domestic and care work % n a n a n a Indicator Million people Female Male Value Labour-force 2 15 2 48 4 63 Access to finance Indicator 0-1 (Equal rights) Value
to financial services Near-equal rights
Access
rights for widows and daughters Uneven rights
to land assets Near-equal rights
to non-land assets Equal rights Civil and political freedom Indicator Unit Value Year women received right to vote year 1962 Number of female heads of state to date number 0 Seats held in upper house % total seats n a Indicator Yes/No Value Election list quotas for women, national n a Party membership quotas, voluntary n a Indicator 0-1 (Equal rights) Value
to justice Restricted rights Freedom of movement Restricted rights
and care
Unit Value
spending on family benefits % GPD n a Unmet family planning % women 15-49 19 70 Early marriage % 18 60 Mean age of women at birth of first child years n a Indicator 0-1 (Equal rights) Value Right to divorce Near-equal rights Indicator Days Female Male Value
of parental leave 98 00 0 0
skills
Access
Access
Access
Family
Indicator
Public
Length
Education and
% Female Male Parity STEM Graduates n a n a n a
Graduates Attainment
n a n a n a
n a n a n a
Arts & Humanities
n a n a n a Education n a n a n a Engineering, Manuf & Construction n a n a n a Health & Welfare n a n a n a
n a n a n a
Business, Admin & Law
Information & Comm Technologies
n a n a n a
n a n a n a
n a n a n a PhD graduates n a n a n a Graduates % Female Male Value
from
education n a n a n a Health
Vocational training
Graduates
tertiary
Unit Value Prevalence of gender violence in lifetime % women 42 70 Births attended by skilled personnel % live births 80 40 Mater nal mortality deaths per 100,000 live births 213 00 Total fertility rate births per woman 4 38 Indicator 0-1 (Equal rights) Value
autonomy Restricted rights
two health indicators, parity is benchmarked at 1
the case of sex ratio at birth the gender parity benchmark is set at 0 944 (see Klasen and Wink 2003) In the case of healthy life expectancy
gender parity benchmark is set at 1 06, given women's longer life expectancy
Reproductive
*Scores are on a 0 to 1 scale, where 1 represents the optimal situation or “parity” Please see Appendix A and B for detailed methodology, definitions, sources and periods. **For all indicators, except the
In
the
Global Gender Gap Index Indicators
Global Gender Gap Report 2023 371 Global Gender Gap Index 2023 Edition Zimbabwe score average score 0.801 Economy 0 991 E d u c a t i o n 0.980 Health 0 214 P o i t i c s Overview Index and Subindex 2023 Score Rank 2022 Score Rank Global Gender Gap Index 0 746 45th 0 734 50th Economic Participation and Opportunity 0.801 10th 0 766 24th Educational Attainment 0 991 77th 0 989 78th Health and Survival 0 980 1st 0 980 1st Political Empowerment 0 214 72nd 0 202 77th
2023 Indicator Rank Score* Difference F-M Min Max Economic Participation and Opportunity 10th 0 801 -Labour-force participation rate % 52nd 0 838 -11 58 0-100 Wage equality for similar work 1-7 (best) - - -Estimated ear ned income int'l $ 1,000 2nd 0 976 -0 05 0-150 Legislators, senior officials and managers % 77th 0 515 -32 02 0-100 Professional and technical workers % 95th 0 771 -12 95 0-100 Educational Attainment 77th 0.991 -Literacy rate % 1st 1 000Enrolment in primary education % 1st 1 000 1 74 0-100 Enrolment in secondary education % 115th 0 960 -2 15 0-200 Enrolment in tertiary education % 1st 1 000 1 68 0-200 Health and Survival 1st 0 980 -Sex ratio at birth** % 1st 0 944Healthy life expectancy** years 1st 1 060Political Empowerment 72nd 0 214 -Women in parliament % 52nd 0 441 -38 80 0-100 Women in ministerial positions % 61st 0 313 -52 38 0-100 Years with female/male head of state (last 50) 80th 0 000 -50 00 0-50 Economy Profile Zimbabwe Score (imparity = 0 parity = 1) 0.746 Rank (out of 146 countries) 45th Index Edition 2023 Compare with Global average 0 1 Female vs Male Min Max71 59 60 012 14 2 09 66 01 33 99 56 47 43 5385 50 87 24 53 49 51 35 8 01 9 69-69 40 30 60 76 19 23 81 50 00 0
Complementary Targets and Contextual Indicators 2023
Global Gender Gap Report 2023 372 Economy Profile Zimbabwe Score 0.746 Rank 45th Page 2 of 2
General indicators Indicator Unit Value GDP US$ billions 28 37 GDP per capita constant '17 intl $ 1000 2 12 Population sex ratio female/male 1 12 Population growth rate % 2 05 Indicator Million people Female Male Value Total population 8 62 7 71 16 32 Work participation and leadership Indicator Unit Value Gender pay gap % (OECD countries only) n a Share of women's membership in boards % (OECD countries only) n a Firms with female majority ownership % firms 13 90 Firms with female top managers % firms 16 30 Share of workers in informal sector % workers 88 40 Indicator 1-7 (best) Value Advancement of women to leadership roles 4 28 Indicator Unit Female Male Value Unemployed adults % of labour force (15-64) 10 44 9 68 10 05 Workers employed part-time % of employed people 70 94 52 75 61 65 Proportion of time spent on unpaid domestic and care work % n a n a n a Indicator Million people Female Male Value Labour-force 2 25 2 22 4 47 Access to finance Indicator 0-1 (Equal rights) Value Access to financial services Uneven rights Inheritance rights for widows and daughters Near-equal rights Access to land assets Near-equal rights Access to non-land assets Near-equal rights Civil and political freedom Indicator Unit Value Year women received right to vote year 1957, 1980 Number of female heads of state to date number 0 Seats held in upper house % total seats 44 20 Indicator Yes/No Value Election list quotas for women, national Yes Party membership quotas, voluntary Yes Indicator 0-1 (Equal rights) Value Access to justice Restricted rights Freedom of movement Equal rights Family and care Indicator Unit Value Public spending on family benefits % GPD n a Unmet family planning % women 15-49 10 40 Early marriage % 22 90 Mean age of women at birth of first child years n a Indicator 0-1 (Equal rights) Value Right to divorce Near-equal rights Indicator Days Female Male Value Length of parental leave 98 00 0 0 Education and skills Graduates Attainment % Female Male Parity STEM Graduates 28 79 71 21 0 40 Agri , Forestry, Fisheries & Veterinary 50 86 49 14 1 03 Arts & Humanities 46 20 53 80 0 86 Business, Admin & Law 51 80 48 20 1 07 Education 40 41 59 59 0 68 Engineering, Manuf & Construction 20 46 79 54 0 26 Health & Welfare 30 79 69 21 0 44 Information & Comm Technologies n a n a n a Natural Sci , Mathematics & Statistics 30 62 69 38 0 44 Social Sci , Jour nalism & Information 45 66 54 34 0 84 Vocational training n a n a n a PhD graduates 0 02 0 05 0 04 Graduates % Female Male Value Graduates from tertiary education 1 14 1 43 1 28 Health Indicator Unit Value Prevalence of gender violence in lifetime % women 35 40 Births attended by skilled personnel % live births 86 00 Mater nal mortality deaths per 100,000 live births 458 00 Total fertility rate births per woman 3 54 Indicator 0-1 (Equal rights) Value Reproductive autonomy Uneven rights *Scores
methodology, de
periods. **For
indicators, except the two health indicators, parity is benchmarked at 1 In the case of sex ratio at birth the gender parity benchmark is set at 0 944 (see Klasen and Wink 2003) In the case of healthy life expectancy the gender parity benchmark is set at 1 06, given women's longer life expectancy
are on a 0 to 1 scale, where 1 represents the optimal situation or “parity” Please see Appendix A and B for detailed
finitions, sources and
all
Contributors and Acknowledgements
At the World Economic Forum Centre for the New Economy and Society
Kusum Kali Pal
Insight Specialist, Diversity, Equity, and Inclusion
Ricky Li
Insight Product Specialist
Kim Piaget Insights Lead, Diversity, Equity, and Inclusion
Silja Baller Head of Mission, Diversity, Equity, and Inclusion
Saadia Zahidi
Managing Director
Acknowledgements
We are extremely grateful to our colleagues in the Centre for the New Economy and Society for their support, especially to Aengus Collins, Andrew Silva, Attilio Di Battista, Dorsey Lockhart, Elisabeth Pipic, Elselot Hasselaar, Eoin O Cathasaigh, Fernando Alonso Perez Chao, Gulipairi Maimaiti, Ida Jeng Christensen, Julia Hakspiel, Kimberly Bennett and Mark Rayner. We would also like to thank Gina Potarca for her contributions to the report.
We are immensely grateful to Professor Ricardo Hausmann, Director of the Growth Lab at Harvard University’s Center for International Development; Rafik Hariri, Professor of the Practice of International Political Economy at Harvard Kennedy School; and Professor Laura D’Andrea Tyson, Distinguished Professor of the Graduate School at the Haas School of Business, University of California, Berkeley and Chairperson of the Board of Trustees at UC Berkeley’s Blum Center for Developing Economies, for their longstanding guidance and support.
A special thank you to Michael Fisher for his excellent copyediting work and to Accurat for their outstanding graphic designing and layout of the report, as well as for its outstanding work to create the report’s Economy Profiles and online Data Explorer, and SMOG, for their excellent cover design.
For more information, please contact cnes@weforum.org
Global Gender Gap Report 2023 373
Collaborations
The Centre for the New Economy and Society aims to empower decisionmaking among leaders in business and policy by providing fresh, actionable insight through collaboration with leading experts and data-holding companies. We are pleased to have collaborated with LinkedIn and Coursera this year and thank the following contributors:
Coursera
Anna Zhao, Data Scientist
Eric Karsten, Data Science Manager
Maria-Nicole Ikonomou, Director, Global Enterprise Communications
LinkedIn
Kristin Keveloh, Senior Lead Manager, Public Policy & Economic Graph Programmes
Silvia Lara, Data Scientist, Economic Graph Team
Matthew Baird, Senior Staff Economist, Economic Graph Research & Insights
Séin Ó Muineacháin, Manager, Economic Graph Team
Global Gender Gap Report 2023 374
Collaborations
The World Economic Forum would like to thank the Business Partners of the Centre for their guidance and support.
AARP
Accenture
Adecco Group AG
AIG
Al Dabbagh Group Holding Co. Ltd
Al Futtaim Private Company LLC
AlixPartners
AllHere
Amazon
AMTD Group
APCO Worldwide Inc.
Apna Time Inc.
Automatic Data Processing Inc. (ADP)
Automation Anywhere, Inc.
Bahrain Economic Development Board
Bain & Company Inc.
Bank of America
Bank of Montreal
Barclays Bank Plc
BC Energy Investments Corp.
Beamery Inc.
Benepass
BetterUp Inc
BHP Group Limited
BigSpring
Bill & Melinda Gates Foundation
Bloomberg LP
BNY Mellon
BorgWarner Inc.
BRANDi and Companies
Bristol Myers Squibb Company
Capgemini SE
Carlsberg A/S
Check Point Software Technologies Ltd
Checkr
Chegg, Inc.
Cisco Systems, Inc.
Civic Ledger
Clayton, Dubilier & Rice LLC
Coursera Inc.
Crescent Enterprises
Crescent Petroleum
Culture Amp
Dassault Systèmes SE
Dell Technologies
Deloitte
Dentsu Inc.
Deutsche Bank AG
Deutsche Post AG
DoBrain
Dogan Şirketler Grubu Holding A.S
DP World Limited
dsm-firmench
Egon Zehnder International (Schweiz) AG
Emirates Telecommunications Group Company
P.J.S.C (e&)
Eurasian Resources Group Sàrl
European Investment Bank (EIB)
Evermos PTE. LTD.
EY
Fortescue Metals Group Limited
Fortinet Inc.
Frontiers Media S.A.
Globalization Partners
Google LLC
Grupo Salinas
Guild Education
HCL Technologies Ltd
Heidrick & Struggles
Henry Schein Inc.
Hewlett Packard Company
Hitachi Ltd
Hologic Inc.
Holtzbrinck Publishing Group
Hong Kong Exchanges and Clearing Limited (HKEX)
HP Inc.
HSBC Holdings Plc
Hubert Burda Media
IBM Corporation
IDEO
Indiavidual Learning Ltd
Indus Group
Infosys Ltd
Ingka Group (IKEA)
Intel Corporation
Intercorp Peru Ltd
Invesco Ltd
JBS S/A
Jerónimo Martins SGPS SA
JLL
Johnson & Johnson
Jopwell
Kearney
KIRKBI A/S
LGT Group Foundation
LinkedIn Corporation
Lord, Abbett & Co. LLC
Maharashtra Institution for Transformation
Manchester United Football Club Limited
ManpowerGroup Inc.
Marriott International Inc.
Marsh McLennan
Mayo Clinic
McKinsey & Company, Inc.
Medtronic Plc
Merck KGaA
Microsoft Corp.
Mohammed Bin Salman Foundation (MiSK)
Morgan, Lewis & Bockius LLP
Moringa School
Natixis SA
NBCUniversal Media, LLC
Nestlé
Network for Teaching Entrepreneurship (NFTE)
Nexthink SA
Nielsen
Novartis AG
NYSE Group Inc.
Old Mutual Limited
Omnicom Group
OnLoop
Open Society Institute
PAG Holdings Limited
Papaya Global
PayPal
PepsiCo Inc.
Pladis Foods Limited
PricewaterhouseCoopers LLP
Procter & Gamble
PT Bank Rakyat Indonesia (BRI)
Publicis Groupe SA
Pymetrics Inc.
QI Group
Randstad N.V.
RBC Financial Group
Recruit Holdings Co. Ltd
Reliance Industries Limited
RMZ Corp.
Russell Reynolds Associates Inc.
Salesforce, Sàrl
Sanofi
SAP SE
Saudi Arabian Mining Company (Ma’aden)
Saudi Aramco
Sempra
Sequoia Capital Operations LLC
Shell Plc
Siemens AG
Skillsoft
SkyHive
SONAE SGPS SA
Staffbase GmbH
Standard Chartered Bank
State Street Corporation
Takeda Pharmaceutical Company Limited
TechWolf
Teck Resources Limited
The Estée Lauder Companies, Inc.
The New York Times
The Samuel Group
The Standard Bank Group Limited
Trip.com Group Ltd
Uber Technologies Inc.
Unilever
Velocity Global, LLC
Verizon Communications
Visa Inc.
Volkswagen AG
Wipro Limited
Workday Inc.
WorldQuant LLC
Zoom Video Communications, Inc.
Zurich Insurance Company LTD
Global Gender Gap Report 2023 375
Partner Institutes
The World Economic Forum’s Centre for the New Economy and Society is pleased to acknowledge and thank the following organizations as its valued Partner Institutes, without which the realization of the Global Gender Gap Report would not have been feasible:
Albania
Institute for Contemporary Studies & Tirana
Business University and College
Helton Cevi, Project Coordinator
Artan Hoxha, President of ISB and Administrator of TBU
Oltjon Valisi, Assistant Project Coordinator
Algeria
Centre de Recherche En Economie Appliquée Pour Le Développement - CREAD
Yacine Belarbi, Director
Khaled Menna, Director of Macroeconomics and Economic Integration
Angola
Jobartis
João Freitas, Country Manager
Luis Verdeja, Director
Argentina
IAE Business School, Universidad Austral
Eduardo Fracchia, Director of Academic Department of Economics
Martin Calveira, Research Economist
Armenia
Economy and Values Research Center
Sevak Hovhannisyan, Board Member and Senior Associate
Australia, Belgium, Canada, Indonesia, Italy, Sweden, United Kingdom, United States
Dynata
Thomas Huff, Senior Project Manager
Steffen Bott, Vice President, Sales
Valentyna Chuikina, Associate Account Director
Austria
Austrian Institute of Economic Research - WIFO
Gabriel Felbermayr, Director
Michael Peneder, Project Lead
Alexandros Charos, Survey Expert
Bahamas
The Government and Public Policy Institute, University of the Bahamas
Zhivargo Laing, Executive Director
Jeannie D. Gibson, Policy Assistant
Bahrain
Bahrain Economic Development Board
Khalid Humaidan, Chief Executive
Nada Al-Saeed, Executive Director
Rima AlKilani, Executive Director
Fatema Alatbi, Senior Executive
Sara Ishaq, Senior Executive
Bangladesh
Centre for Policy Dialogue - CPD
Dr Fahmida Khatun, Executive Director
Dr Khondaker Golam Moazzem, Research Director
Ratia Rehnuma, Research Associate
Chowdhury Fariha, Research Intern
Barbados
University of West Indies
Jonathan G. Lashley, Senior Fellow
Don Marshall, Professor
Kenisha Chase, Research Assistant
Benin
Institut de Recherche Empirique en Economie Politique - IREEP
Leonard Wantchekon, President
Stéphania Houngan, Research Associate
Bolivia, Costa Rica, Dominican Republic, El Salvador, Honduras, Panama
INCAE Business School
Ronald Arce, Researcher
Enrique Bolaños, President
Octavio Martínez, Director
Bosnia and Herzegovina
School of Economics and Business, University of Sarajevo
Jasmina Selimovic, Dean
Zlatko Lagumdzija, Professor
Amra Kapo, Associate Professor
Botswana
Botswana National Productivity Centre
Letsogile Batsetswe, Research Consultant and Statistician
Zelda Okatch, Information and Research Services Manager
Christopher Diswai, Executive Director
Global Gender Gap Report 2023 June 2023 Global Gender Gap Report 2023 376
Brazil
Fundação Dom Cabral
Carlos Arruda, Professor of Innovation and Competitiveness
Hugo Tadeu, Professor of Innovation
Miguel Costa, Research Assistant
Bulgaria
Center for Economic Development
Maria Prohaska, Director
Ivalina Simeonova, Project Manager
Cambodia
Nuppun Research and Consulting Co., Ltd
Pisey Khin, Director
Chanthan Tha, Researcher
Dalen Vyla, Research Assistant
Cameroon
Compétitivité Cameroon
Hermann Fotie Ii, Permanent Secretary
Tanankem Belmondo Voufo, Expert Investment Climate
Jean Baptiste Nsoe Nkouli, Competitiveness Observatory Expert
Cabo Verde INOVE Research
Frantz Tavares, Chief Executive Officer
Jerónimo Freire, Project Manager
Júlio Delgado, Director
Chad
Groupe de Recherches Alternatives Et de Monitoring Du Projet Pétrole-Tchad-Cameroun
Simael Mbairassem, Economist in charge of Research and Public Policies
Maoundonodji Gilbert, Managing Director
Chile
School of Government, University Adolfo Ibañez
Carolina Apablaza, Director
Patricio Aroca, Professor
Isabella Cuneo, Doctoral Student
China
Dataway Horizon
Lingling Qiao, General Manager
Yuming Zhi, Research Director
Zhuyu Yao, Senior Project Manager
Colombia
National Planning Department of Colombia
Consejo Privado de Competitividad
Jorge Ivan Gonzalez, General Director, Department of National Planning
Camilo Rivera Perez, Technical Director, Innovation and Private Sector Development
Sara Patricia Rivera, Adviser, Innovation and Private Sector Development
Congo, Democratic Republic of Congo-Invest Consulting
Teza Bila Minlangu, Administrator
Faila Tabu Ngandi, Managing Director
Bertin Muderhwa, Head of Service in charge
of Studies and Statistics at the Federation of Businesses of Congo
Côte d’Ivoire
Centre de Promotion des Investissements en Côte D’ivoire - CEPICI
Solange Amichia, CEO
Ramatou Fall, Director of Business Climate
Simon Meledje, Head of Planning and Monitoring
Bernadine Yeble N’Guessan, Research officer
Cyprus
Cyprus Employers and Industry Confederation - OEB
Antonis Frangoudis, Director Business Development and Economic Affairs Department
Bank of Cyprus
Kyriacos Antoniou, Governance Officer
Andreas Alexandrou, Manager Strategy and Customer Insights
Czech Republic
CMC Graduate School of Business
Tomáš Janča, Executive Director
Denmark
Danish Technological Institute
Stig Yding Sørensen, Senior Specialist
Andreas Bjerre Lunkeit, Consultant
Ecuador
ESPAE Graduate School of ManagementESPOL
Sara Wong, Professor
Tania Tenesaca, Project Coordinator
Xavier Ordeñana, Dean
Egypt
Egyptian Center for Economic Studies - ECES
Abla Abdel Latif, Executive Director, and Director of Research
Salma Bahaa El Din, Senior Economist
Ahmed Maged, Research Assistant
Hossam Khater, Research Assistant
Mohamed Khater, Research Assistant
Estonia
Estonian Institute of Economic Research -EKI
Marje Josing, Directorw
Finland
ETLA Research Institute of the Finnish Economy
Aki Kangasharju, Managing Director
Päivi Puonti, Head of Forecasting
Ville Kaitila, Researcher
France
Business France
Cassagnes Louise, Economist
Marcias Manuel, Head of Service: Economic studies
Georgia
TSU Center for Analysis and Forecasting
Vakhtang Charaia, Director
Otar Anguridze, Head of the Board
Global Gender Gap Report 2023 377
Shota Gulbani, Expert
Mariam Lashkhi, Project Manager
Mamuka Tsereteli, Expert
Germany
Institute for Innovation and Technology within the VDI/VDE Innovation + Technik GmbH
Michael Nerger, Project Leader
Ghana
Association of Ghana Industries
Yaw Adu-Gyamfi, President
Seth Twum-Akwaboah, Chief Executive Officer
John Defor, Direcctor, Policy and Research
Greece
SEV Hellenic Federation of Enterprises
Michael Mitsopoulos, Director - Business Environment and Regulatory Affairs
Athanasios Printsipas, Senior Advisor - SEV
Business Council for Sustainable Development
Guatemala
FUNDESA
Juan Carlos Paiz, President of the Board of Directors
Juan Carlos Zapata, Chief Executive Officer
Fernando Spross, Associate Researcher
Priscilla González, Corporate Affairs Coordinator
Hong Kong SAR, China
Hong Kong General Chamber of Commerce
Simon Ngan, Director, Policy and Research
Wilson Chong, Senior Economist
Hungary
KOPINT-TÁRKI Economic Research Ltd
Peter Vakhal, Senior Research Associate
Éva Palócz, CEO
Iceland
The Icelandic Centre for Future Studies
Karl Friðriksson, Manager Director
India
LeadCap Knowledge Solutions Pvt LtdLeadCap Ventures
Sangeeth Varghese, Managing Director and CEO
Vidyadhar Prabhudesai, Director and COO
Ireland
Irish Business and Employers ConfederationIBEC
Geraldine Anderson, Head of Research
Israel
Manufacturers’ Association of Israel - MAI
Ron Tomer, President
Ruby Ginel, CEO
Dan Catarivas, General Manager, Foreign Trade and International Relations Division
Itai Nakash, Deputy General Manager, Foreign Trade and International Relations Division
Jamaica
Mona School of Business and Management -
MSBM, The University of the West Indies, Mona
David McBean, Executive Director
Franklin Johnston, Director
Yvette Cameron-Harris, Project Administrator
Jamaica Promotions Corporation - JAMPRO
Shulette Cox, Vice President, Research, Advocacy, and Project Implementation
National Competitiveness Council Jamaica
Sharifa Powell, Consultant Project Manager
Japan
Waseda University
Jusuke Ikegami, Professor
Mitsuyo Tsubayama, Coordinator
Shoko Miya, Coordinator
Jordan
Ministry of Planning and International Cooperation of Jordan
Hadram Al Fayes, Director
Ghada Issa, Head of Competitiveness Division
Thamer Masarweh, Researcher
Kazakhstan
Center for Strategic Initiatives LPP
Olzhas Khudaibergenov, Senior Partner
Yerbol Tulegenov, Associate Partner
Symbat Aliaskarova, Consultant
Kenya
University of Nairobi
Karuti Kanyinga, Research Professor and Director, IDS
Vincent Mugo, Project Assistant IDS
Paul Kamau, Associate Research Professor, IDS
Korea, Rep.
Korea Development Institute
Inho Song, Executive Director, Economic Information and Education Center
Joohee Cho, Head, Public Opinion Analysis Unit
Boyoung Han, Senior Reseach Associate, Public Opinion Analysis Unit
Kosovo*, North Macedonia
Economic Chamber of North-West Macedonia
Drilon Iseni, Executive Director
Durim Zekiri, Operations Manager
Miranda Ajdini, Legal associate
Kuwait
Kuwait University
Fahad Al-Rashid, Committee Chair
Adel Al-Husainan, Committee Member
Majed Jamal Al-Deen, Committee Member
Kyrgyz Republic
Economic Policy Institute
Marat Tazabekov, Chairman
Lao PDR
Enterprise and Development Consultants Co. Ltd - EDC
Buakhai Phimmavong, Managing Partner
Thipphasone Inthachack, Office administrator
Global Gender Gap Report 2023 378
Latvia
Stockholm School of Economics in Riga
Arnis Sauka, Head of the Centre for Sustainable Development
Lesotho
Private Sector Foundation of Lesotho - PSFL
Thabo Qhesi, CEO
Bokang Tsoanamatsie, Public Relations Officer
Qothoase Khofane, Researcher
Liberia, Sierra Leone
GQRDOTCOM Limited - GQR
Omodele Jones, Chief Executive Officer
Lithuania
Innovation Agency Lithuania
Jone Kalendiene, Head of Research and Analysis Division
Irena Karelina, Analyst
Luxembourg
Luxembourg Chamber of Commerce
Christel Chatelain, Director of the Economic Affairs Department
Jean-Baptiste Nivet, Sr Economist
Sidonie Paris, Economist
Malawi
Malawi Confederation of Chambers of Commerce and Industry
Chancellor Kaferapanjira, Chief Executive
Madalitso Kazembe, Director, Business Environment and Policy Advocacy
Manfred Maguru, Economic Analyst
Chancy Mkandawire, Economic Analyst
Malaysia
Malaysia Productivity Corporation
Dato’ Abdul Latif Abu Seman, Director General
Zahid Ismail, Deputy Director General
Dr Mazrina Mohamed Ibramsah, Deputy Director
General
Wan Fazlin Nadia Wan Osman, Director
Mali
Mali Applied and Theoretical Economics
Research Group - GREAT
Massa Coulibaly, Executive Director
Wélé Fatoumata Binta Sow, Researcher
Badiégué Diallo, Administrative and Financial Assistant
Malta
Competitive Malta - Foundation for National Competitiveness
Adrian Said, Associate Matthew Castillo, Associate
Mauritius
Economic Development Board
Sanroy Seechurn, Head of Department
Ken Poonoosamy, CEO
Dooshala Ramjutun-Ramlaul, Manager
Mexico
Instituto Mexicano para la CompetitividadIMCO
Valeria Moy, General Director
Ivania Mazari, Program Manager Ministry of the Economy
Jorge Eduardo Arreola Cavazos, General Director for Competitiveness and Competition
Carlos Rubén Altamirano Márquez, Director
Fernando Tonatiuh Parra Calvo, Underdirector for Competitiveness
Mongolia
Open Society Forum - OSF
Erdenejargal Perenlei, Executive Director
Oyunbadam Davaakhuu, Program Manager
Montenegro
The Institute for Strategic Studies and Prognoses - ISSP
Maja Drakic Grgur, Project Coordinator
Veselin Vukotic, President
Morocco
The Policy Centre for the New South
Dr Karim El Aynaoui, Executive President
Asmaa Tahraoui, Senior Knoweldge Manager
Abdelaaziz Ait Ali, Head Economics Research Department
Namibia
Institute for Public Policy Research - IPPR
Ndapunikwa Fikameni, Research Associate
Salmi Shigwedha, Research Associate
Graham Hopwood, Director
Nepal
Competitiveness and Development InstituteCODE
Dr Ramesh C. Chitrakar, Project Director/ Country Coordinator
Abhinandan Baniya, Associate Team Member
Menaka Shrestha, Team Member
Netherlands
Amsterdam Centre for Business Innovation, University of Amsterdam
Henk Volberda, Director and Professor
Kevin Heij, Senior Innovation Researcher
Pieter van den Brink, Research Assistant
Nina Versluijs, Research Assistant
Jochem Bouman, Research Assistant
New Zealand
BusinessNZ
Kirk Hope, CEO
Kathryn Asare, Manager Communications
Nigeria
Nigerian Economic Summit Group - NESG
Laoye Jaiyeola, Chief Executive Officer
Dr Olusegun Omisakin, Director of Research and Development
Sodik Olofin, Economist
Global Gender Gap Report 2023 379
Oman
National Competitiveness Office - NCO
Dr Salim Abdullah Al Shaikh, Acting Chief of NCO
Juhaina Saleh Al Balushi, Economic Researcher
Jawaher Sultan Al Habsi, Business Analyst
Pakistan
Mishal Pakistan
Amir Jahangir, Chief Executive Officer
Puruesh Chaudhary, Director
Amna Sabahat Bhutta, Director
Paraguay
Paraguayan Foundation for Cooperation and Development
Martin Burt, CEO
Luis Fernando Sanabria, CEO
Sol Urbieta, Management Assistant
Peru
Industrial Development Center of the National Society of Industries
Luis Tenorio, Executive Director
Maria Elena Baraybar, Project Assistant
Benoni Sanchez, Head of Systems
Philippines
Makati Business Club - MBC
Roxanne Lu, Programs Director
Trisha Teope, Foreign Programs Officer
Poland
National Bank of Poland
Piotr Boguszewski, Economic Advisor
Piotr Szpunar, Director
Portugal
Business Administrators Forum - FAE
Paulo Carmona, President
Mariana Marques dos Santos, Member of the Board
PROFORUM Association for the Development of Engineering
Ilidio De Ayala Serôdio, Vice-President
Helena Roquette, Secretary
Qatar
Qatari Businessmen Association - QBA
Social and Economic Survey Research Institute, Qatar University
Issa Abdull Salam Abu Issa, Secretary General
Sarah Abdallah, Deputy General Manager
Maria Jusay, Executive Secretary
Prof. Kaltham Al Ghanim, Director, Social and Economic Survey Research Institute
Raymond Carasig, Senior Survey Support Specialist
Romania
Association for Women Entrepreneurship
Development - ADAF
The Chamber of Commerce and Industry of Romania
Rotaru Cornelia, President
Rotaru Gela, Business Analyst
Savu Cristina, Communication Expert
Rwanda
Rwanda Development Board
Delphine Uwase, Ag. Head of Strategy and Competitiveness Department
Kennedy Kalisa, Strategy Analyst
Richard Kayibanda, Ag. Chief Strategy and Compliance Officer
Saudi Arabia
Alfaisal University
Mohammed Kafaji, Vice Dean for Quality Assurance and Accreditation
National Competitiveness Centre
Eiman Habbas Al-Mutairi, CEO of the National Competitiveness Centre
Waleed Al-Rudaian, Deputy CEO of the National Competitiveness Centre
Salman Al-Tukhaifi, General manager
Abdulrahman M. Al-Ghamdi, Project Manager
Senegal
Université Cheikh Anta Diop of Dakar
Thierno Thioune, Directeur du Centre de Recherches Economiques Appliquées
Serbia
Foundation for the Advancement of Economics - FREN
Aleksandar Radivojević, Coordinator
Dejan Molnar, Director
Singapore
Singapore Economic Development Board
Cheng Wai San, Director and Head
Teo Xinyu, Executive Officer, Senior
Slovakia
Business Alliance of Slovakia - PAS
Peter Serina, Executive Director
Robert Kičina, Member of the Board
Slovenia
Institute for Economic Research
Peter Stanovnik, Professor
Sonja Uršič, Senior Research Assistant
University of Ljubljana, Faculty of Economics
Mateja Drnovšek, Full Professor
South Africa
Business Unity South Africa
Tyson Thamsanqa Sibanda, Economic Policy Manager
Olivier Serrao, Economic Policy Executive Director
Cas Coovadia, Chief Executive Officer
Spain
IESE Business School
Pascual Berrone, Professor, Director of the International Center for Competitiveness
María Luisa Blázquez, Research Associate
Sri Lanka
Institute of Policy Studies of Sri Lanka - IPS Kithmina Hewage, Research Economist
Tharindu Udayanga, Research Assistant
Global Gender Gap Report 2023 380
Switzerland
University of St.Gallen, Center for Financial Services Innovation
Tobias Trütsch, Managing Director
Taiwan, China
Taiwan Institute of Economic Research
Chen, Yi-Man, Research Fellow
Tsuo, I-Chun, Assistant Research Fellow
Tanzania
REPOA Ltd
Donald Mmari, Executive Director
Lucas Katera, Director of Collaborations and Capacity Building
Cornel Jahari, Researcher and Field Manager
Thailand
Chulalongkorn Business School
Kanyarat (Lek) Sanoran, Assistant Professor and Assistant Dean at Dean’s Office
Wilert Puriwat, Professor and Dean
Nat Kulvanich, Assistant Professor
Trinidad and Tobago
Arthur Lok Jack Global School of Business
Raynardo Hassanally, Alumni Relations Coordinator
Balraj Kistow, Programme Director
Ron Sookram, Academic Coordinator
Tunisia
Institut Arabe des Chefs d’Entreprises
Majdi Hassen, Executive Director
Hager KARAA, Head of Studies Department
Türkiye
TÜSIAD, Sabanci University Competitivness
Forum - REF
Esra Durceylan Kaygusuz, Director
Sezen Uğurlu Sum, Project Specialist
Ukraine
CASE Ukraine, Center for Social and Economic Research
Dmytro Boyarchuk, Executive Director
Vladimir Dubrovskiy, Leading Economist
Oksana Kuziakiv, Senior Adviser
United Arab Emirates
Federal Competitiveness and Statistics Centre
Hanan Ahli, Director General of Federal Competitiveness and Statistics Centre
Rashed Abdulkarim Al Blooshi, Undersecretary of Department of Economic Development, Abu Dhabi
Hend Abdulla, Analyst
Uruguay
Universidad ORT Uruguay
Isidoro Hodara, Professor
Bruno Gili, Professor
Federico Monetti, Professor
Venezuela
Venezuelan Council for Investment Promotion
Jennyn Osorio, Economics Affairs Manager
Jorge García, Business Intelligence Manager
Viet Nam
Ho Chi Minh City Institute for Development Studies - HIDS
Tran Hoang Ngan, Director
Trieu Thanh Son, Head of Rereach Management
Nguyen Manh Quan, Researcher
Yemen
Yemeni Business Club - YBC
Fathi Abdulwase Hayel Saeed, Chairman
Ghadeer Ahmed Almaqhafi, Executive Director
Safa Abdullah Alsayaghi, Projects Manager
Zambia
University of Zambia
Joseph Simbaya, Director
Chitalu Chama Chiliba, Assistant Director and Senior Research Fellow
Patricia Funjika, Research Fellow
Zimbabwe
National Competitiveness Commission
Phillip Phiri, Executive Director
Brighton Shayanewako, Director, Competitiveness
Douglas Muzimba, Chief Economist, International Competitiveness
Elizabeth Magwaza, Economist
Global Gender Gap Report 2023 381
The World Economic Forum, committed to improving the state of the world, is the International Organization for Public-Private Cooperation.
The Forum engages the foremost political, business and other leaders of society to shape global, regional and industry agendas.
World Economic Forum 91–93 route de la Capite CH-1223 Cologny/Geneva
Switzerland
Tel.: +41 (0) 22 869 1212
Fax: +41 (0) 22 786 2744
contact@weforum.org www.weforum.org
