Clayscapes - Antonia Moscoso Gabriele Motta Lorenzo Santelli
clayscapes
MSc Candidates
Avelina Antonia Moscoso Larreamendy
Gabriele Motta
Lorenzo Santelli
Architectural Association School of Architecture
Emergent Technologies and Design 2014/2015
Course Director Michael Weinstock
Course Director George Jeronimidis
Studio Master Evan Greenberg
Studio Tutor Manja Van De Worp
Studio Tutor Mehran Gharleghi
clayscapes
MSc Candidates
Avelina Antonia Moscoso Larreamendy
Gabriele Motta
Lorenzo Santelli
Architectural Association School of Architecture
Graduate School Program
Coversheet for submission 2014-2015
Programme: Emergent Technologies and Design
Term: Dissertation
Student Name(s): Avelina Antonia Moscoso Larreamendy, Gabriele Motta, Lorenzo Santelli
Submission Title: Clayscapes
Course Title: Emergent Technologies and Design, Master of Science
Course Tutors: Michael Weinstock, George Jeronimidis
Submission Date: 18.09.2015
Declaration:
“I certify that this piece of work is entirely my/our own and that any quotation or paraphrase from published or unpublished work of others is duly acknowledged .”
Signature of Student(s):
Avelina Antonia Gabriele Motta Lorenzo Santelli Moscoso Larreamendy
Acknowledgements
We would like to express our sincere gratitude to the Emtech directors Michael Weinstock and George Jeronimidis for their continuous support and guidance throughout the development of this dissertation. Our sincere acknowledgment also goes to the studio tutors for their motivation and advice.
We would like to extend our appreciation to Wilfredo Carazas Aedo, whose expertise
and patience has been fundamental in our experimentation.
We would like to thank our families and friends who have provided continuous support and encouragement.
Finally, we thank our fellow Emtech colleagues for their best wishes and inspirational discussions.
Abstract
In relation to the high resource consumption and pollution induced by the building industry, this research investigates the potential of earth construction as an alternative building material for the contemporary practice.
The research explores the opportunities of fibre-reinforced material composites in order to design self supporting integrated structures at the building scale that can provide different spatial qualities.
The study focuses on textile formwork as a form finding methodology and applies
digital simulation methods to investigate the relationship between geometry and material behaviour, in order to address the material structural limitations.
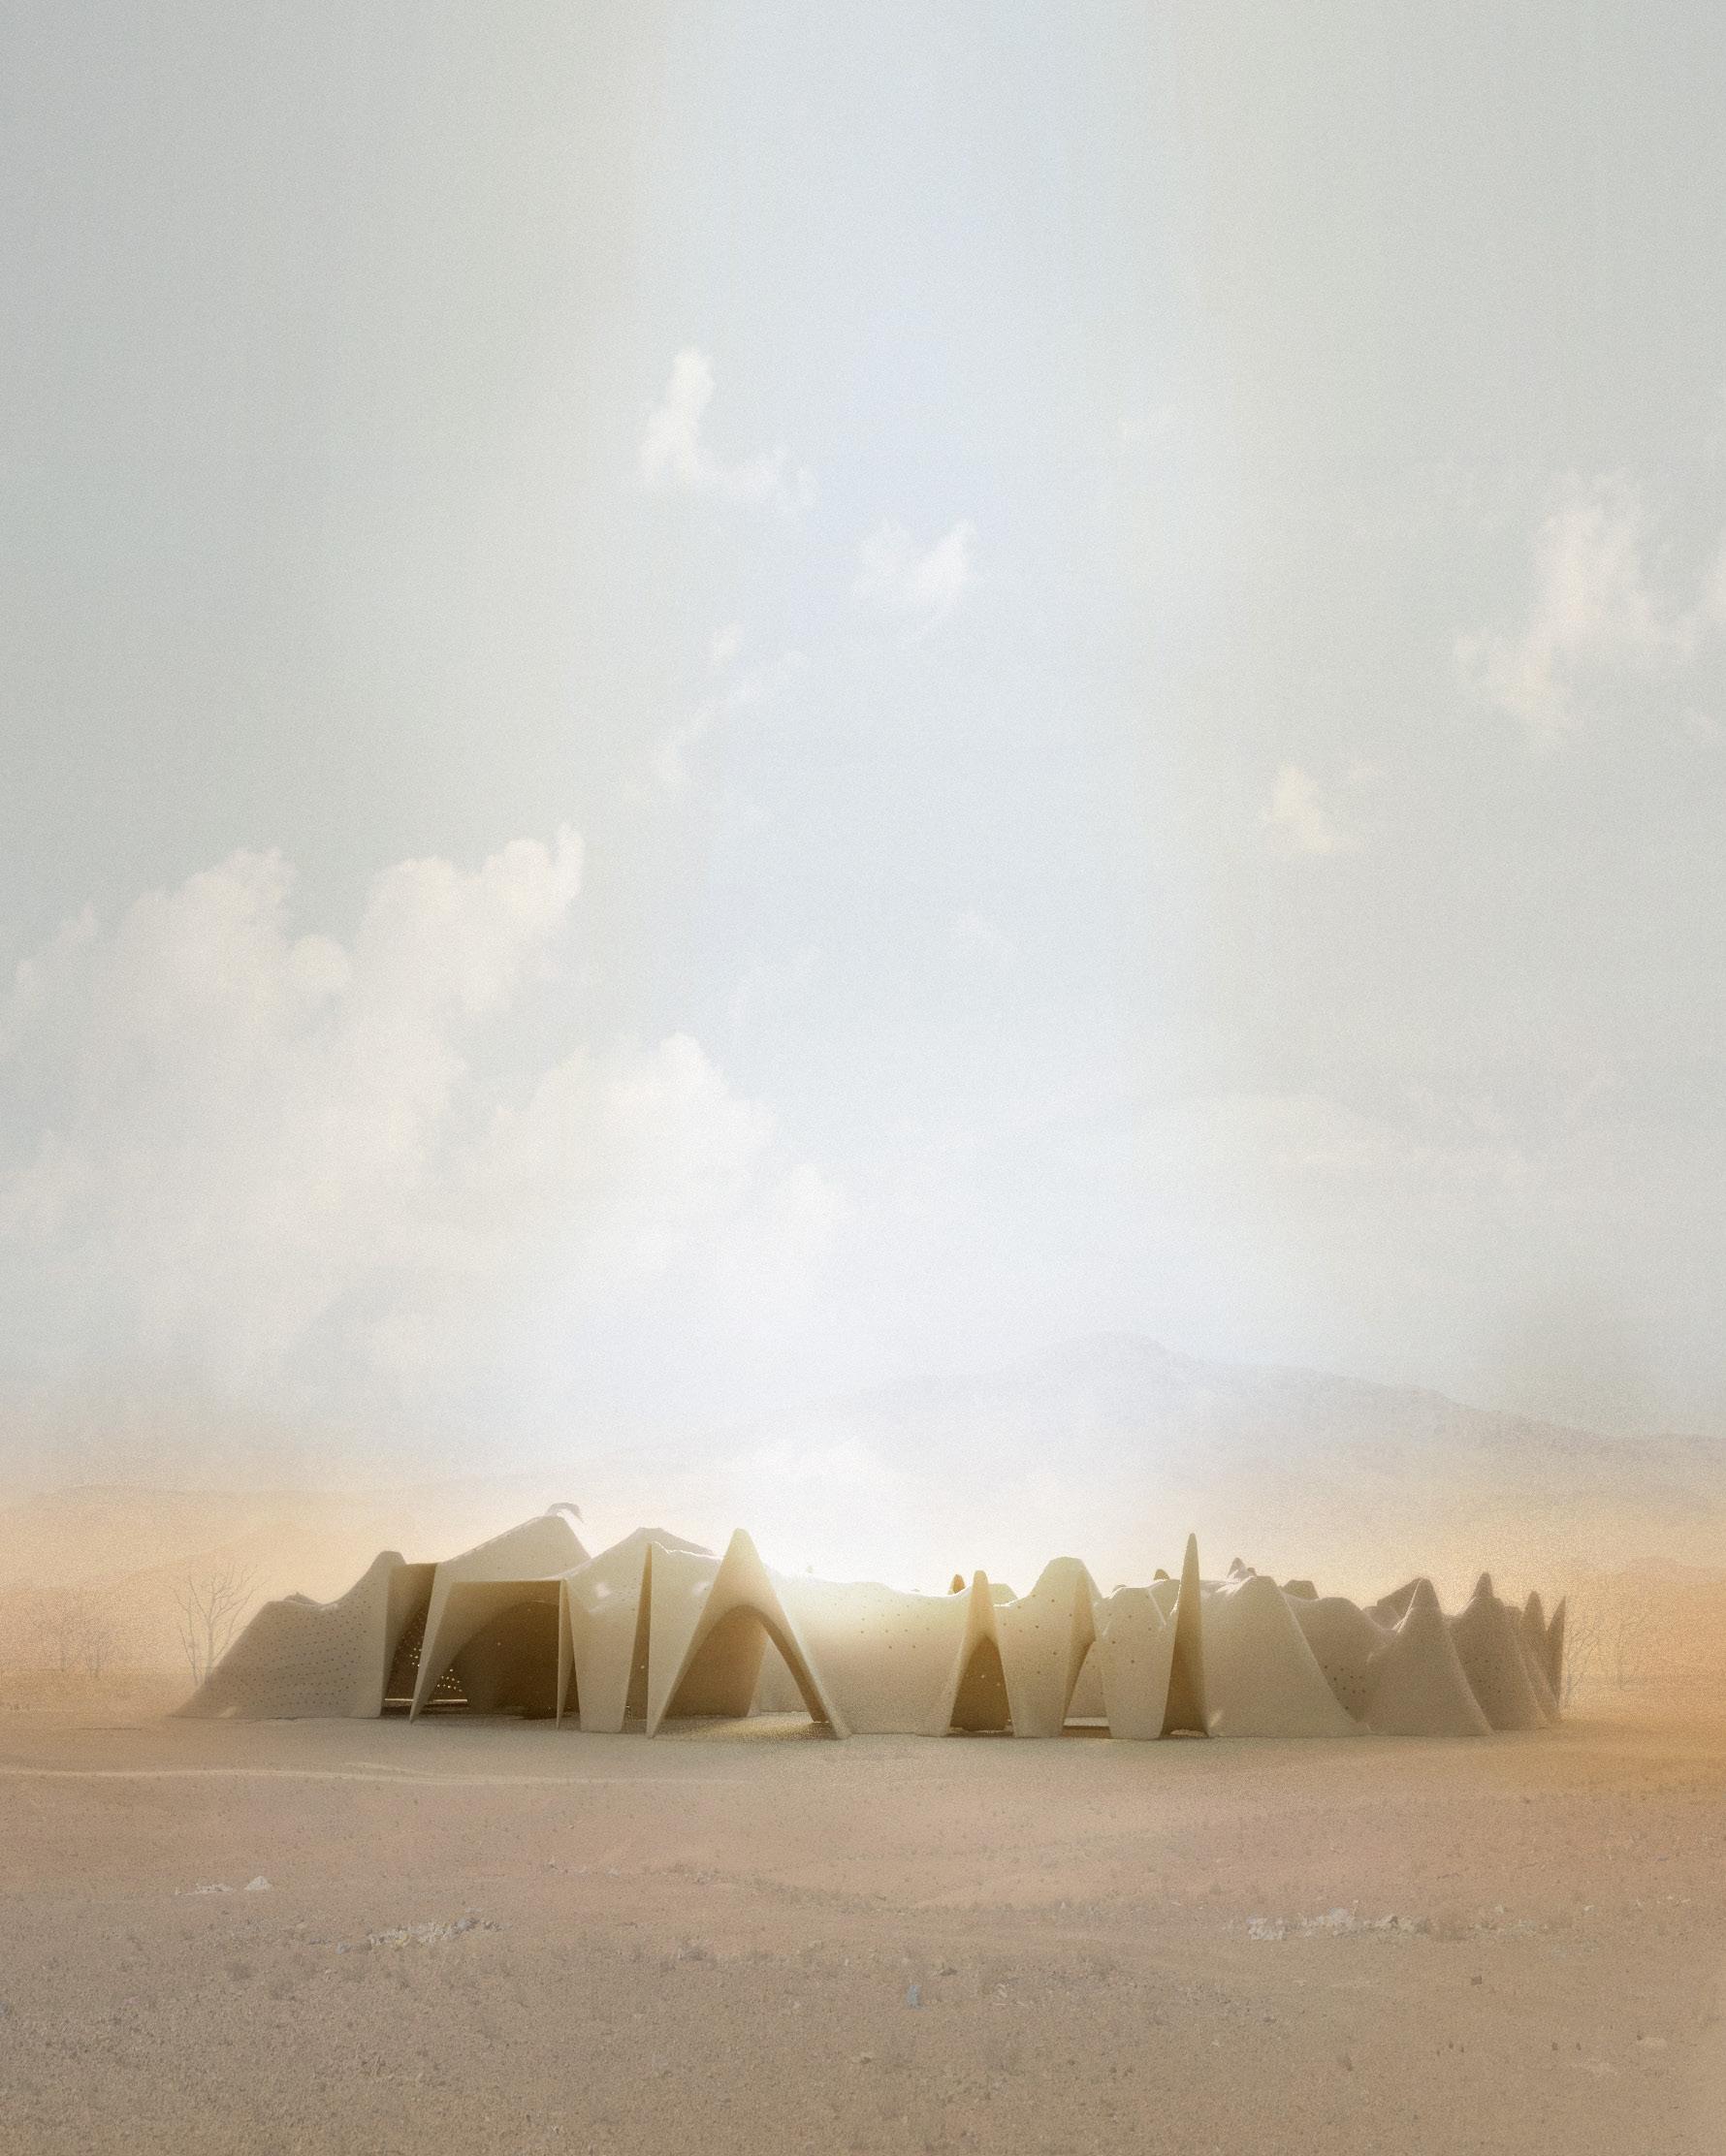
Furthermore, the design development explores the architectural possibilities of the system to provide different spatial qualities. The design project for a Learning Centre is tested in the context of the Sub-Saharan region in relation to the large availability of the material and appropriate environmental conditions.
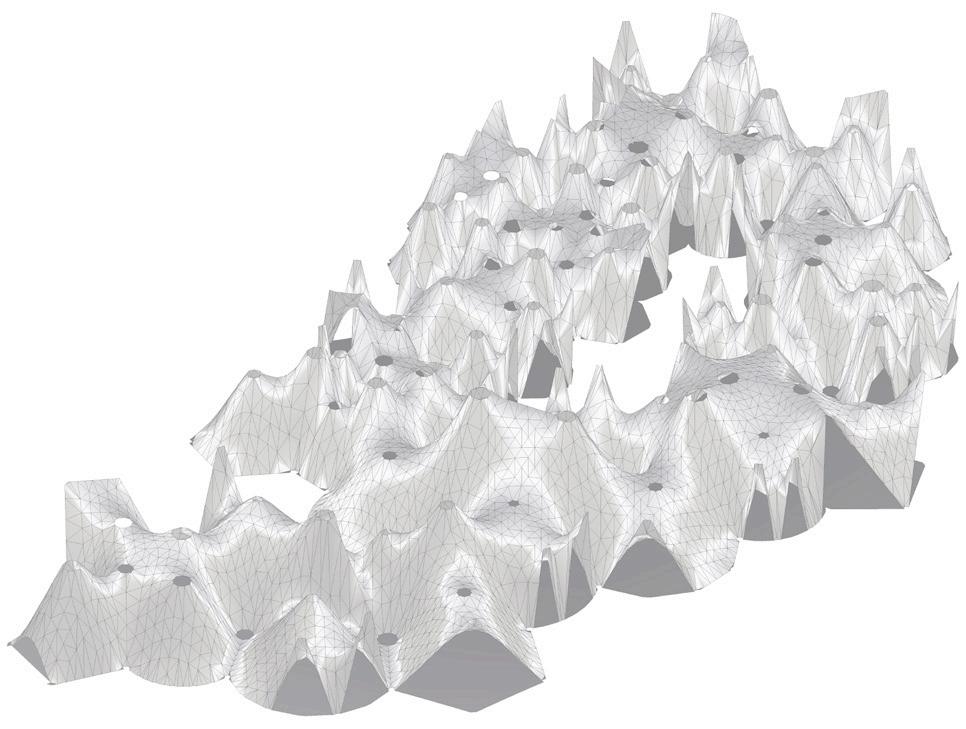
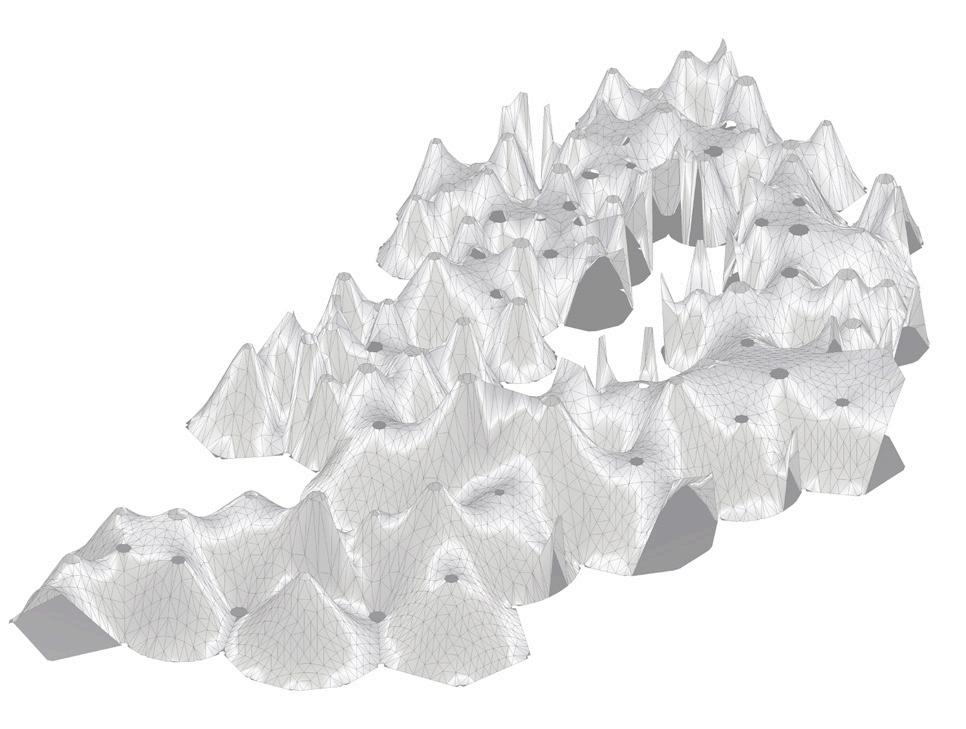
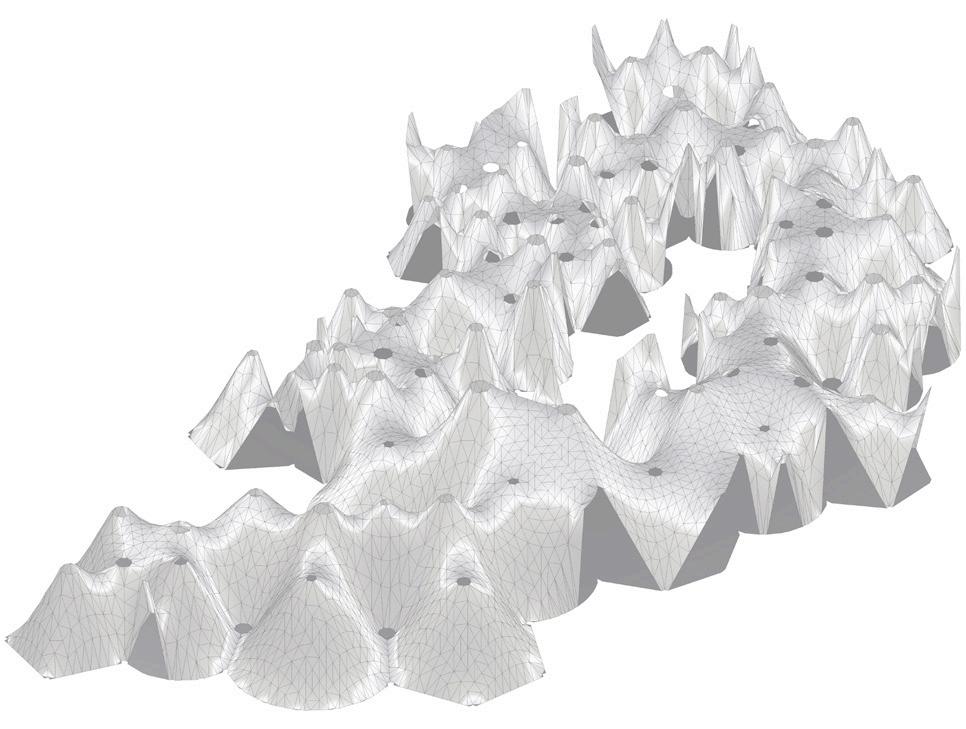
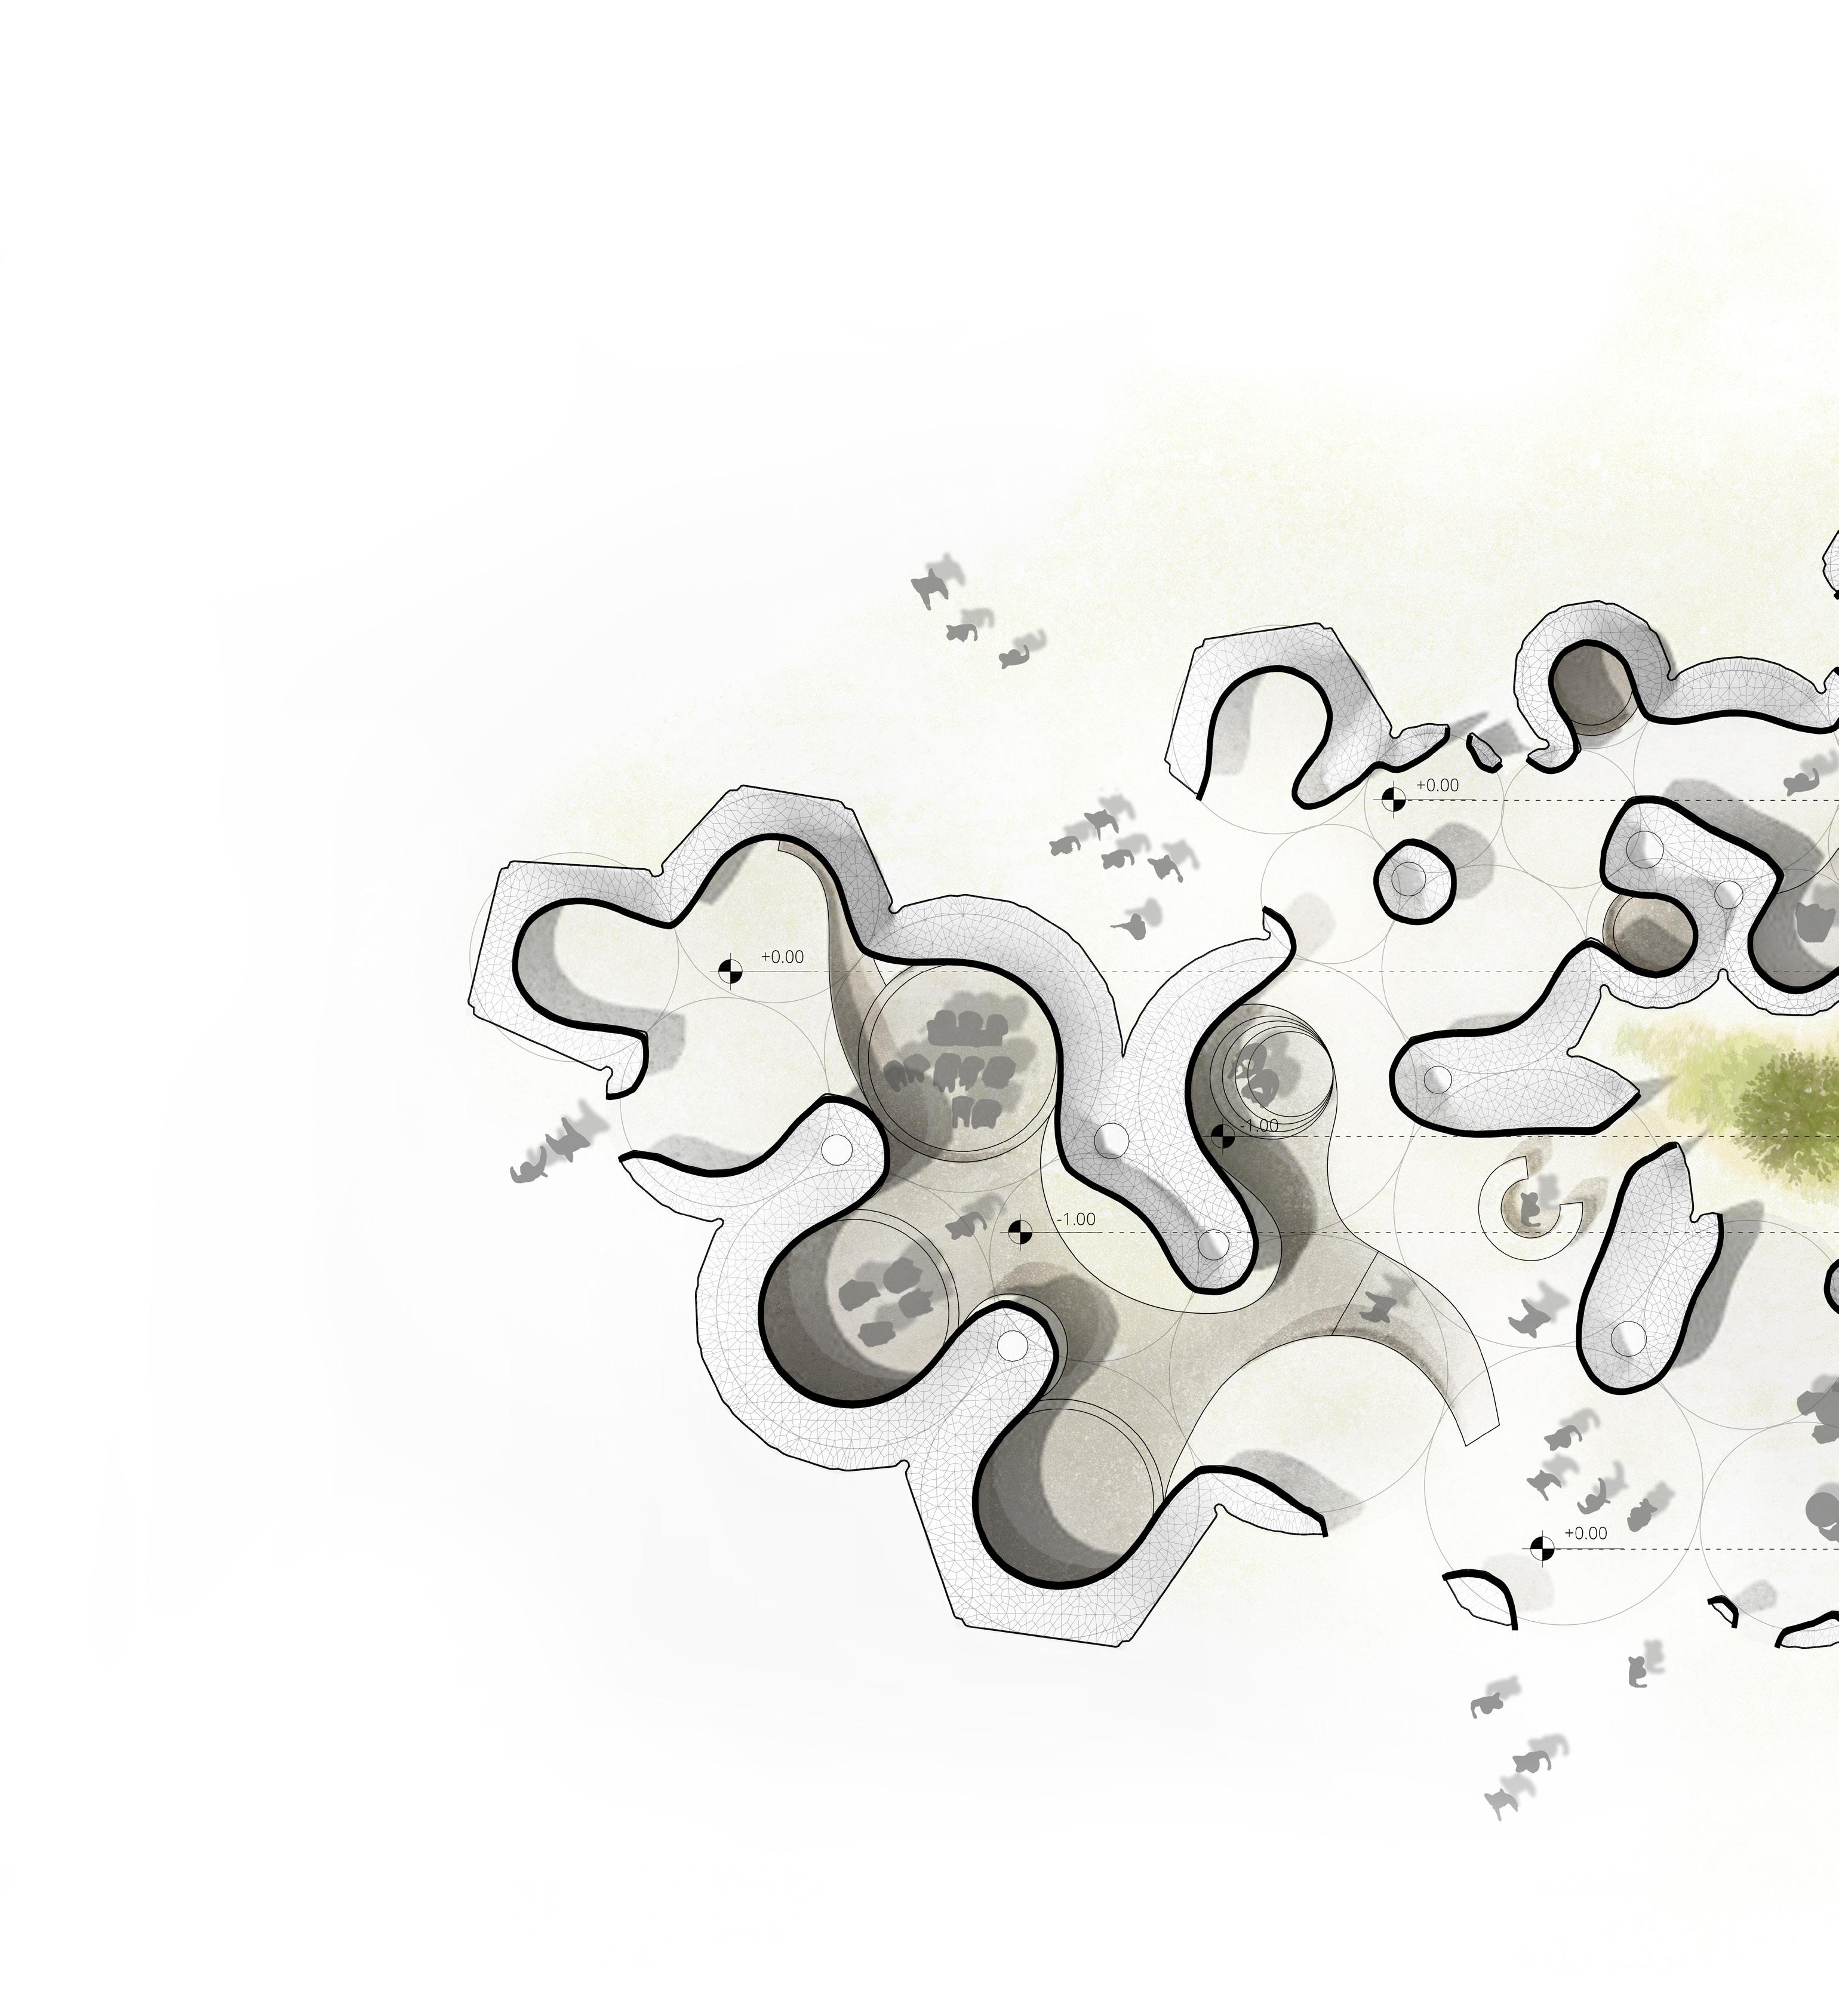
Design Development
System Generative Process
Construction Process
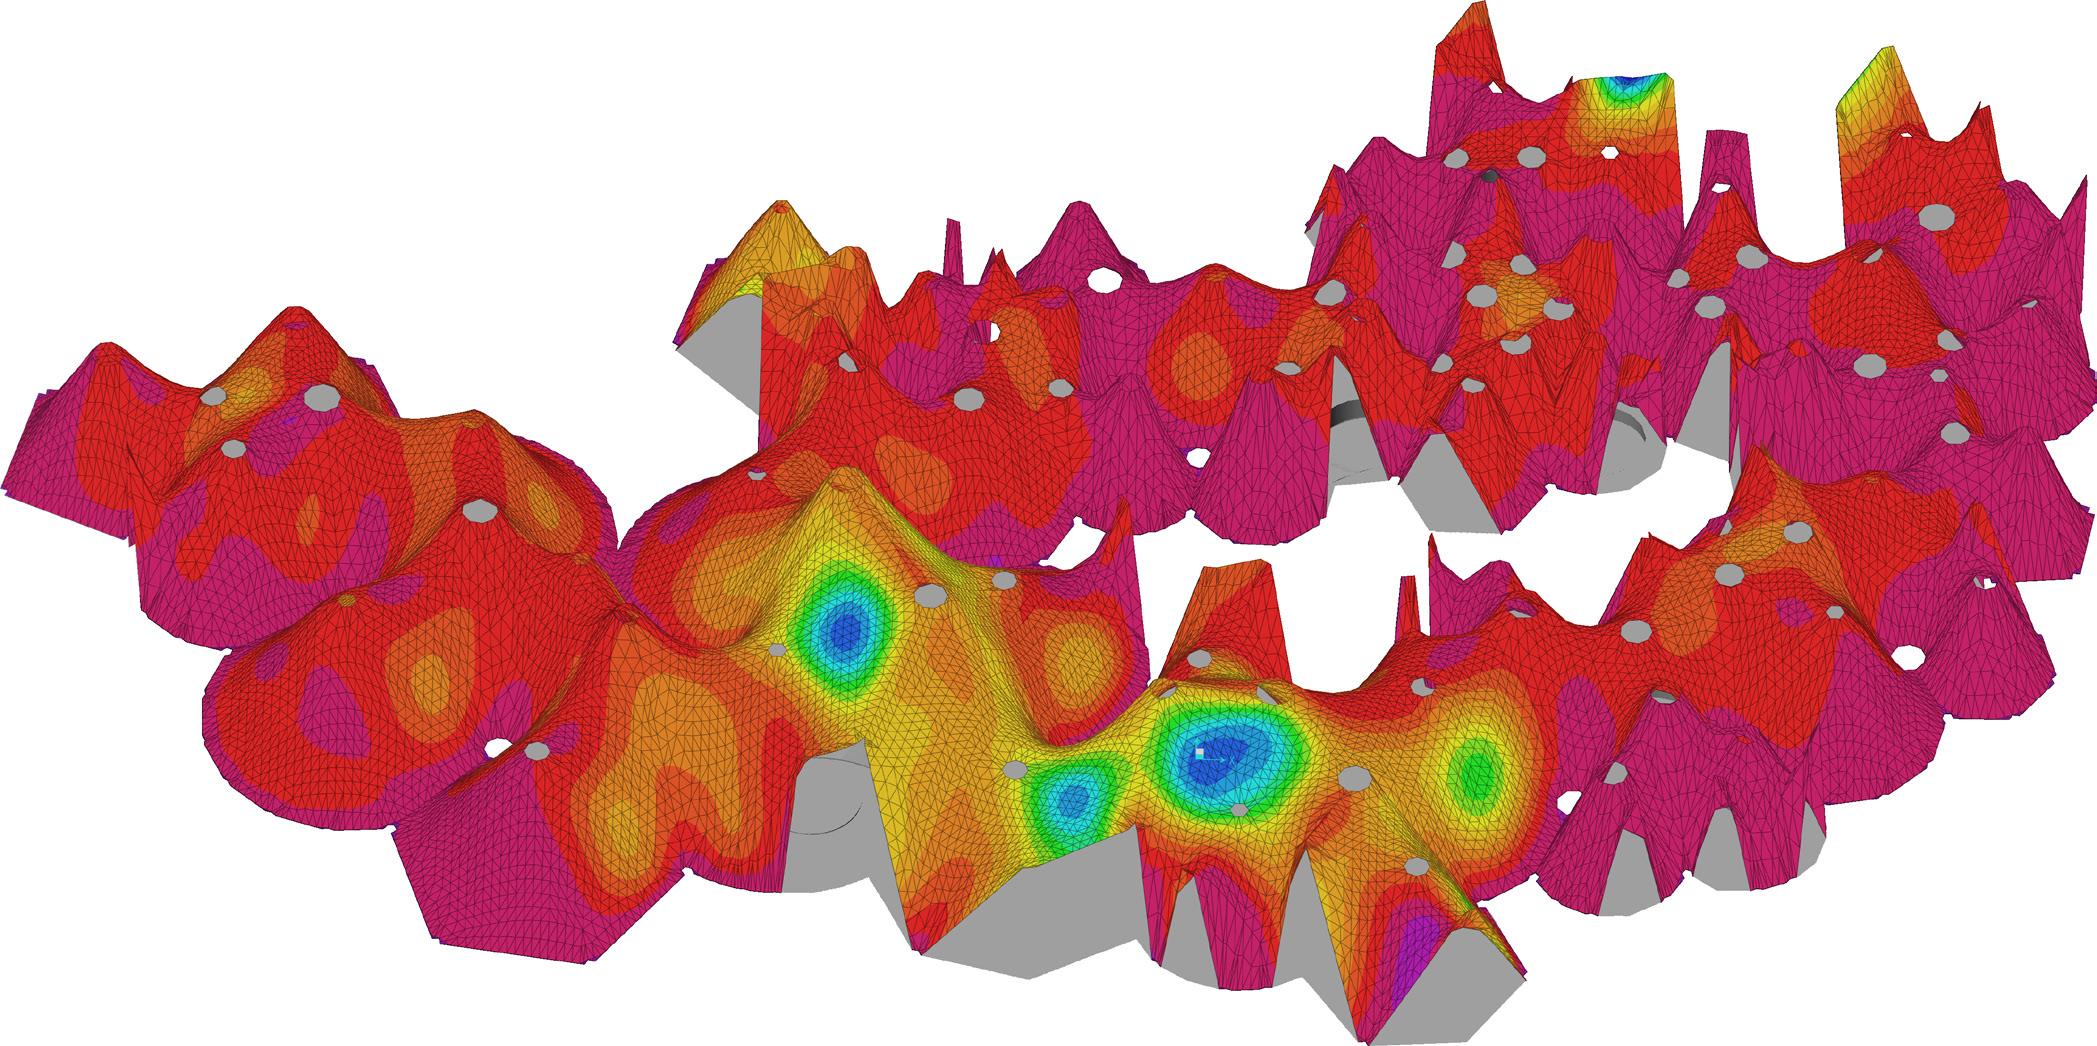
Structural Performance and Geometry
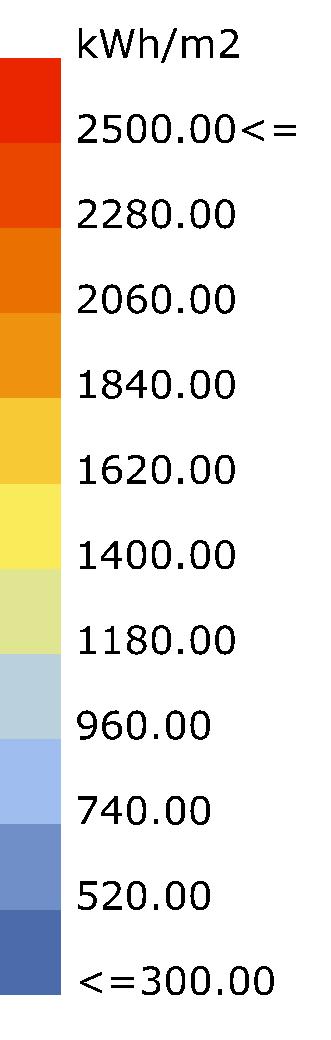
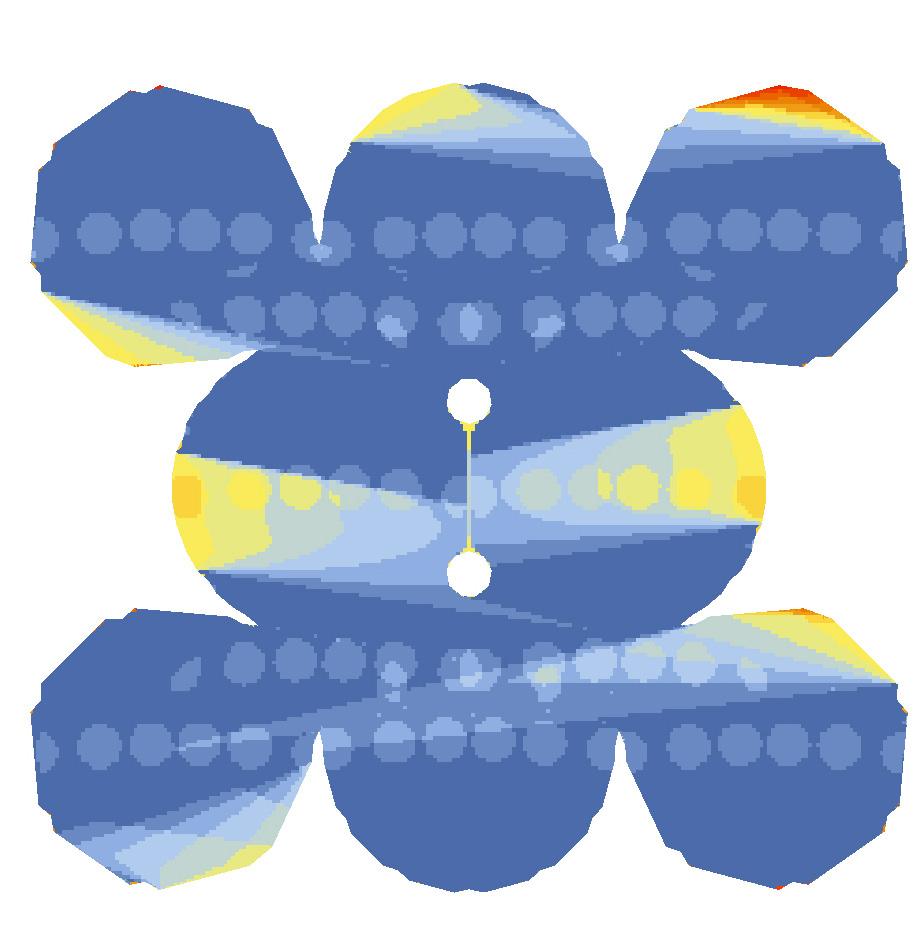
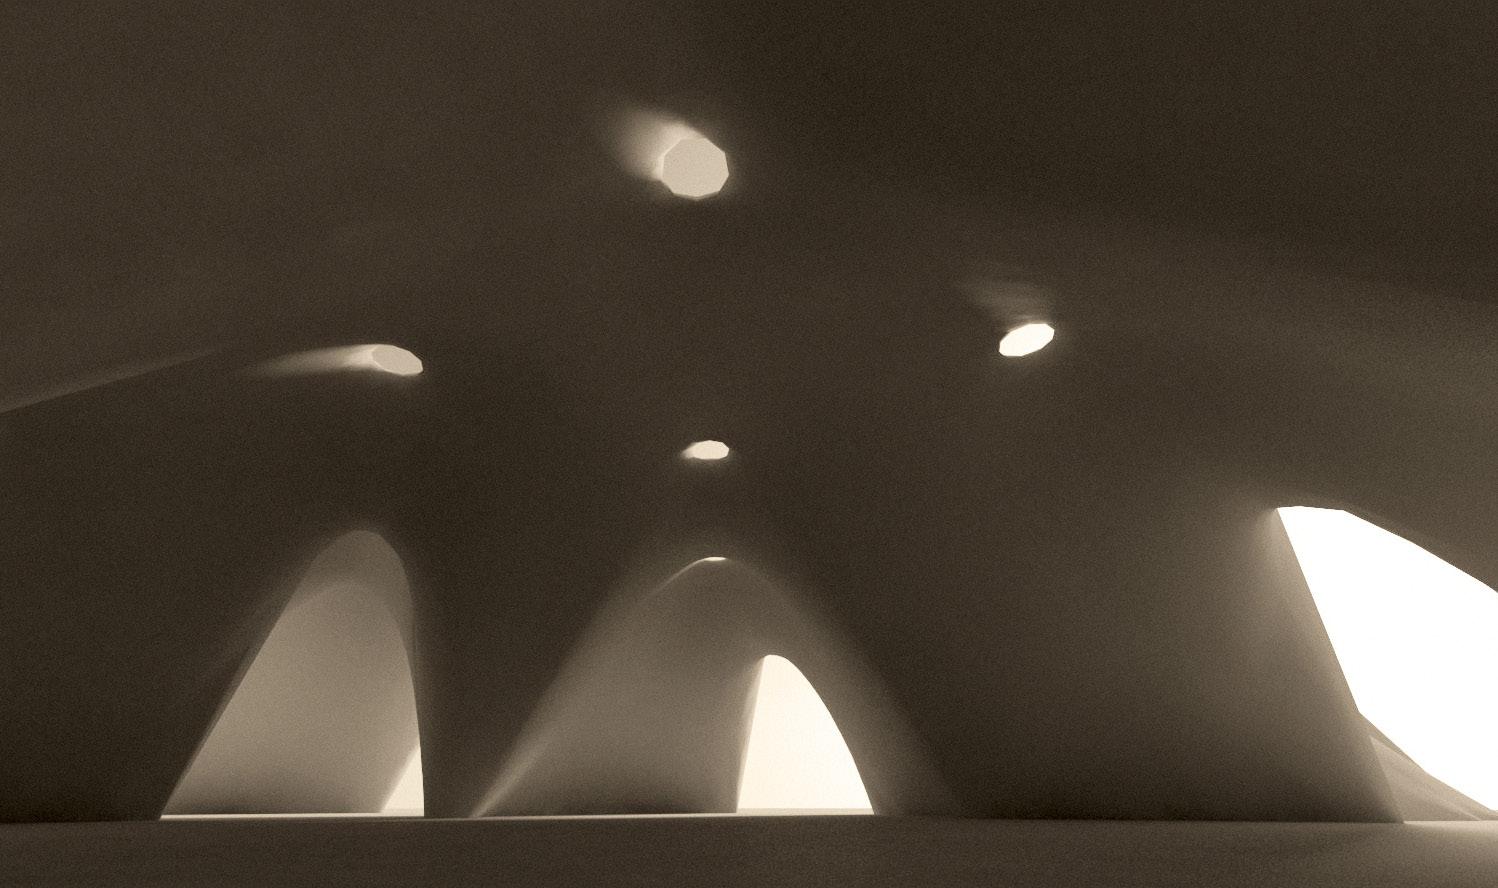
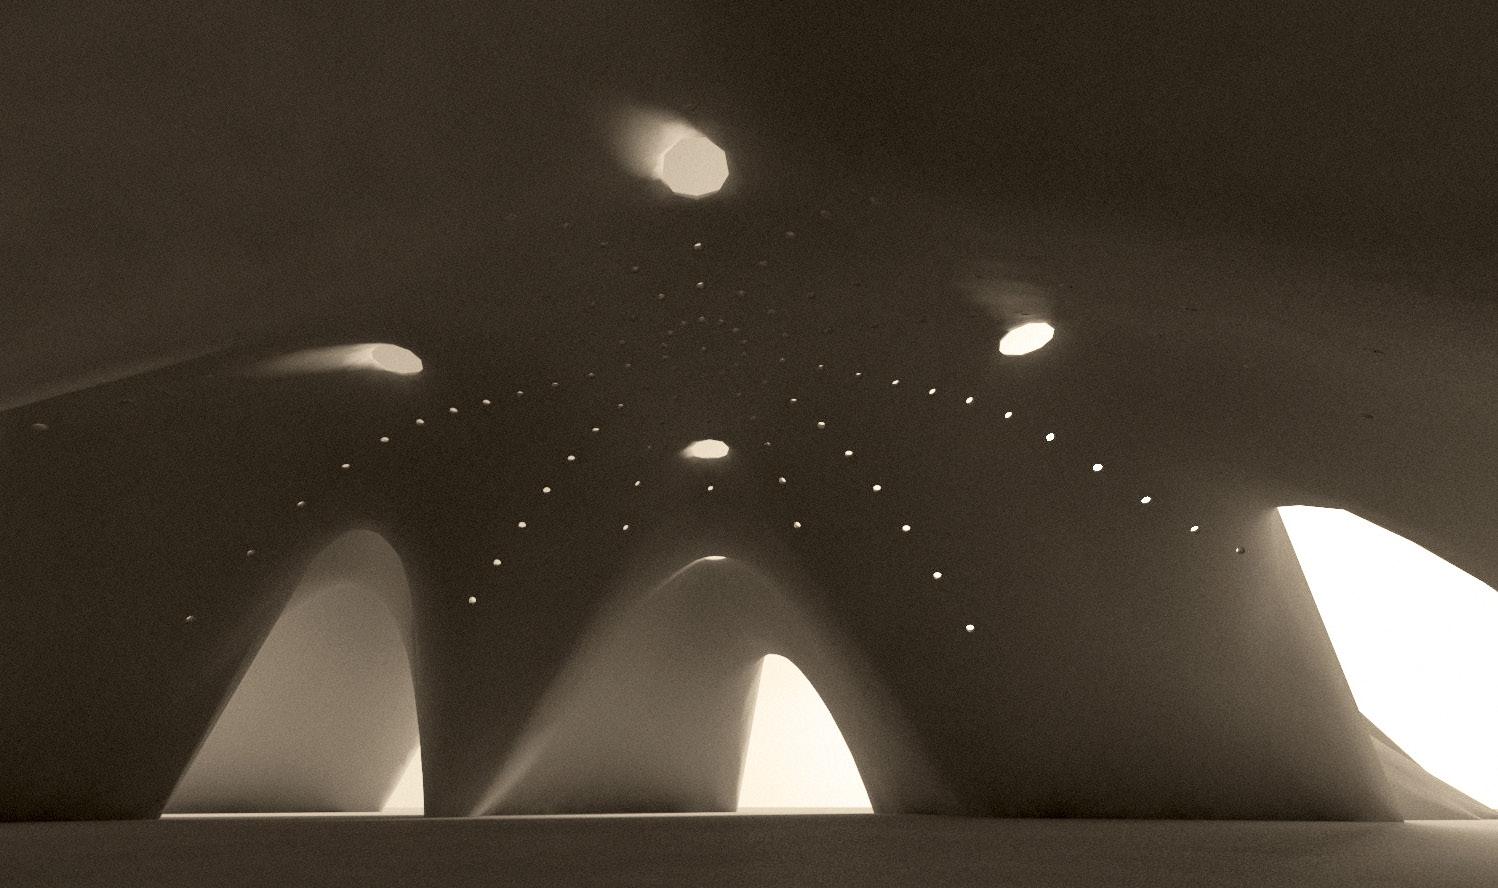
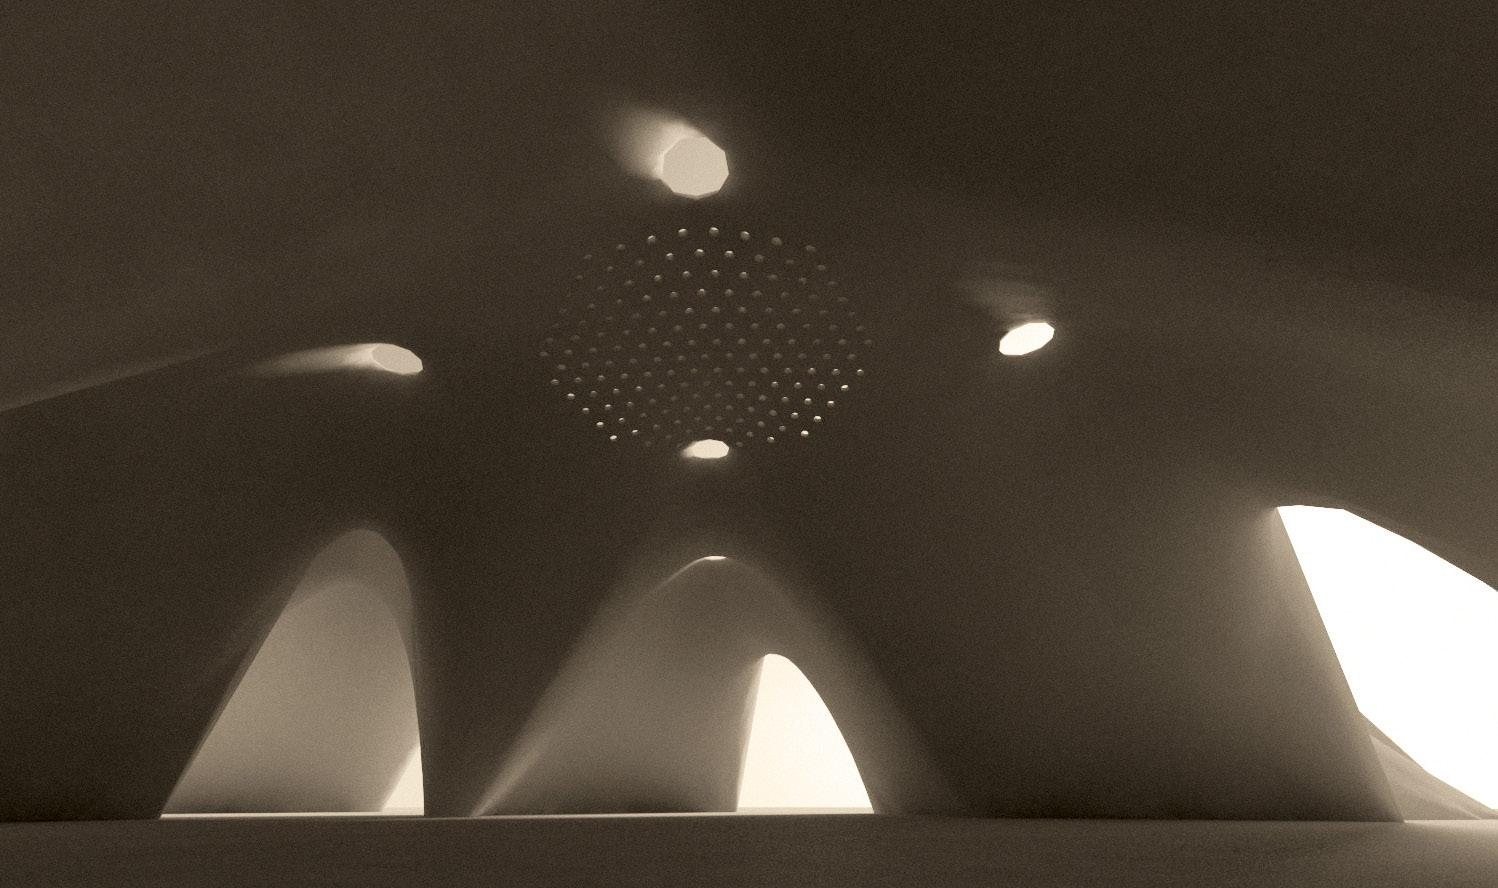
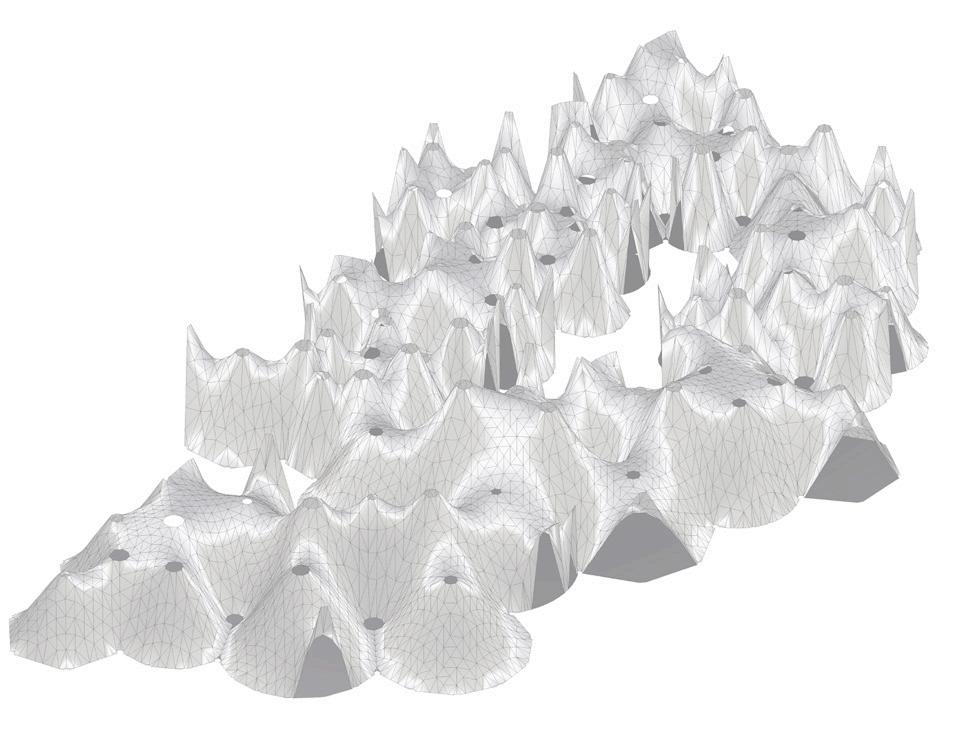
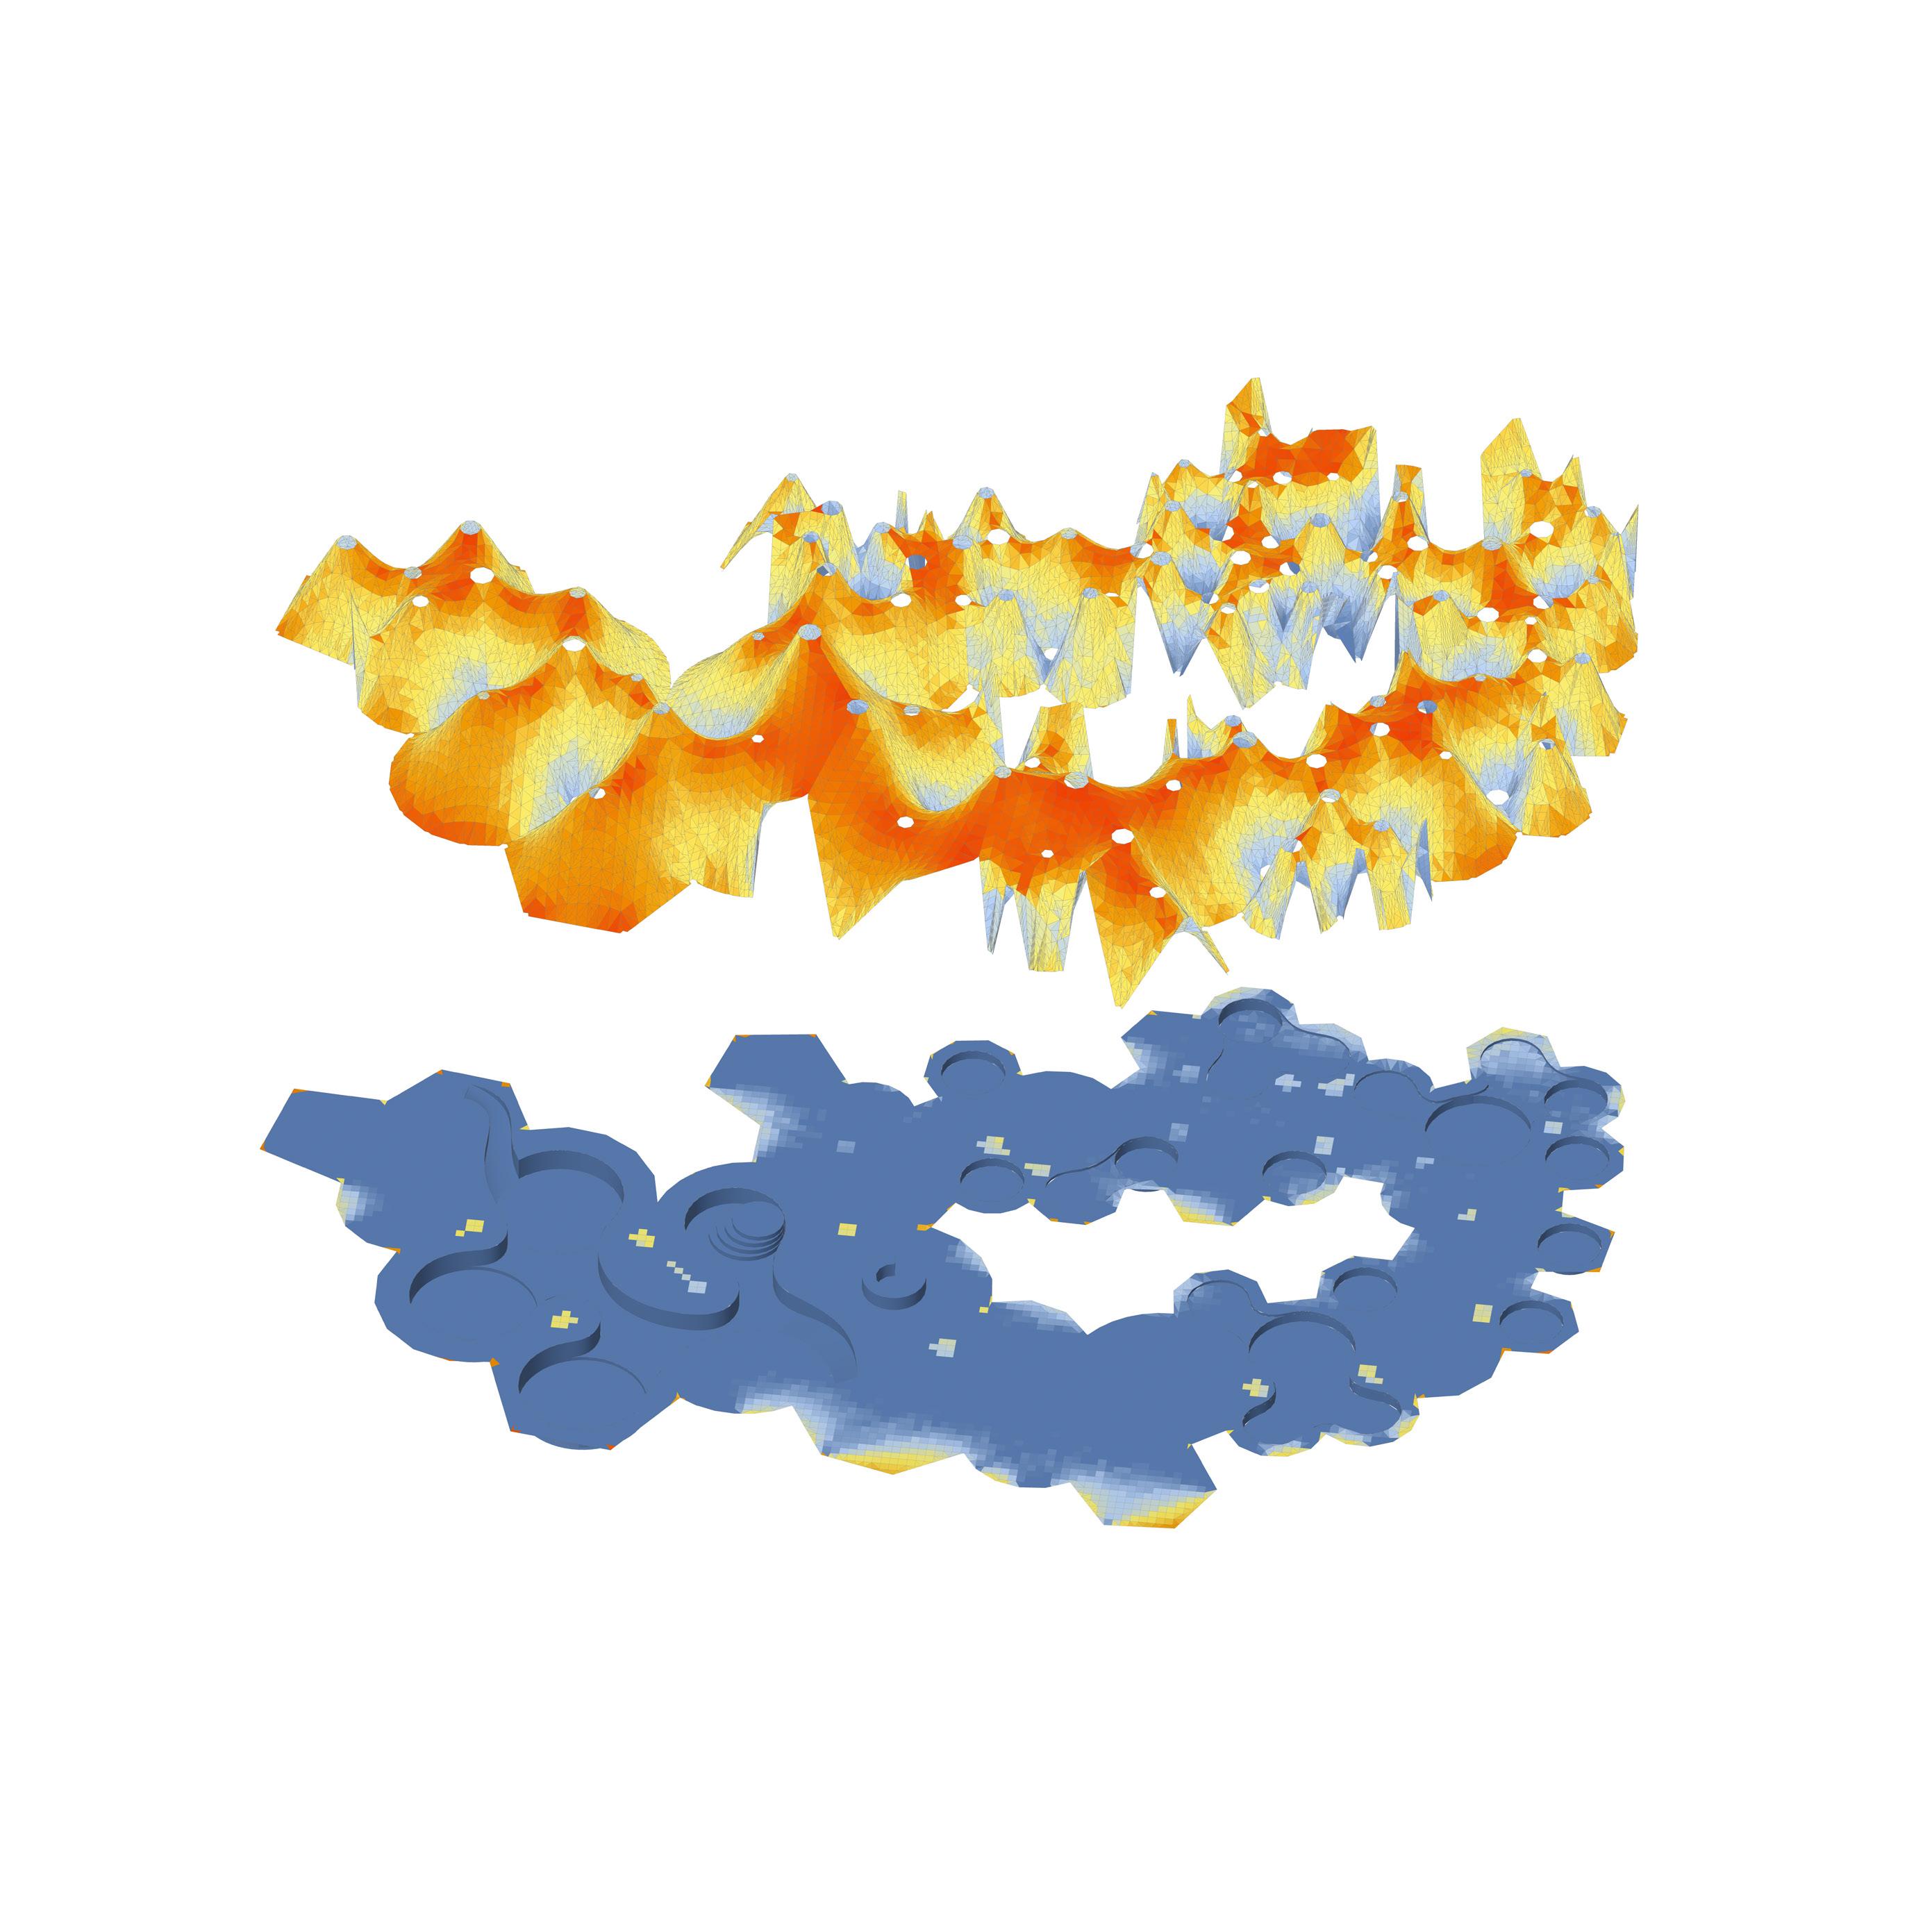
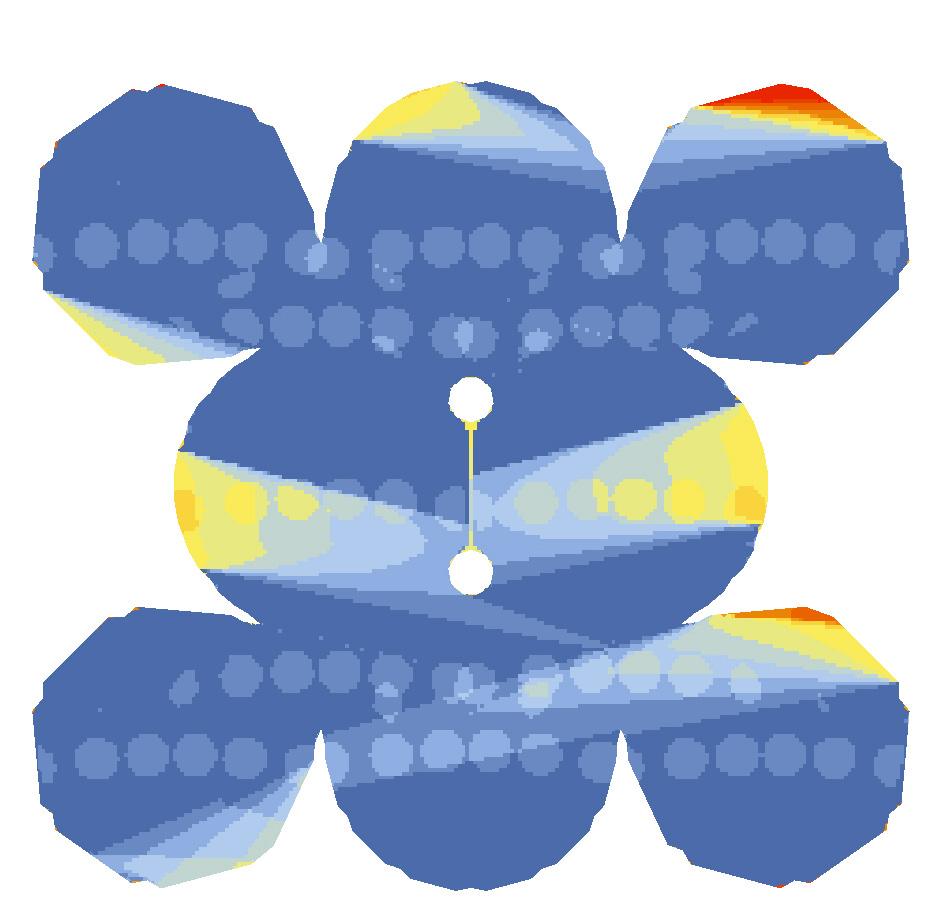
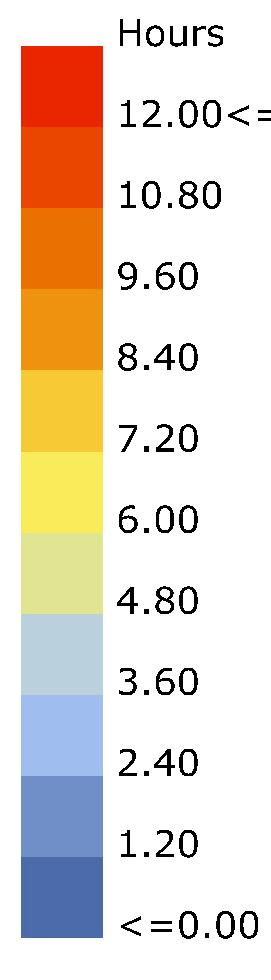
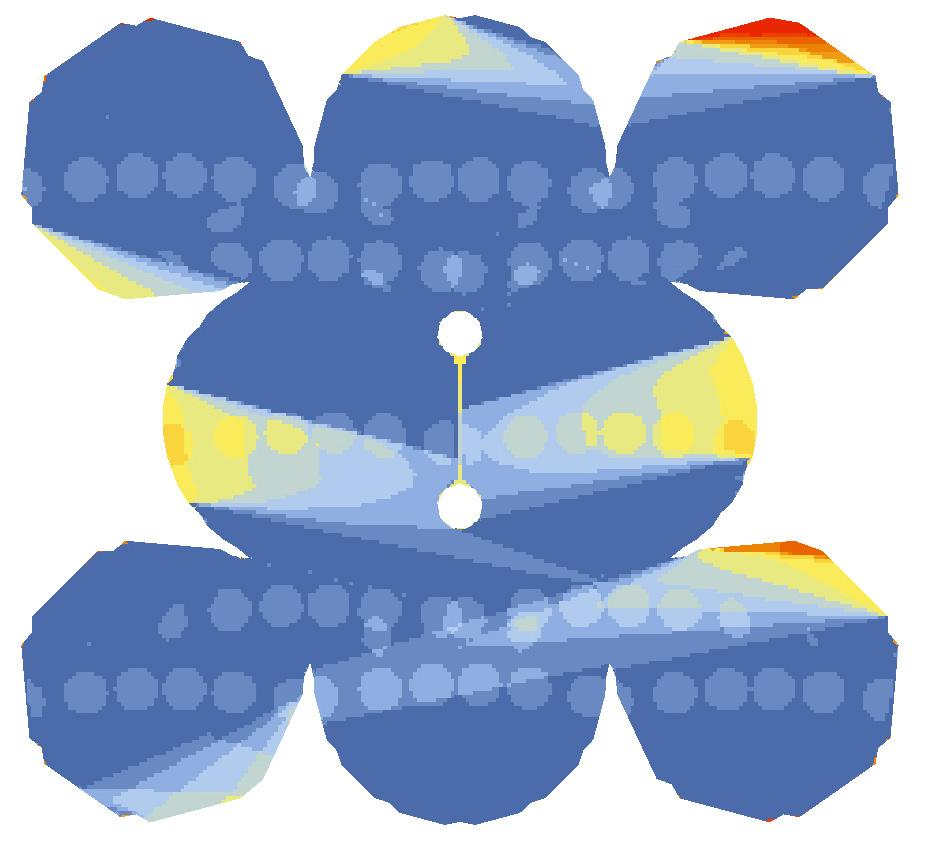
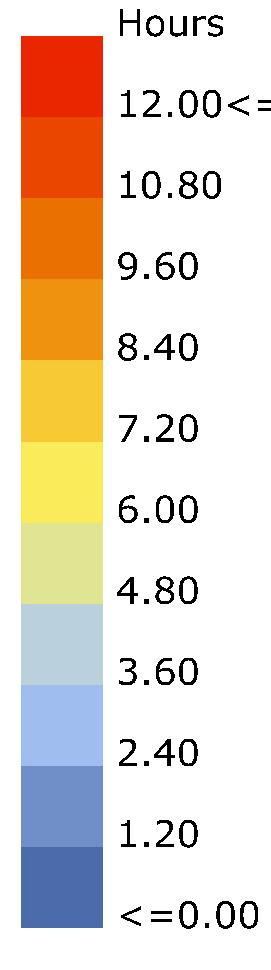
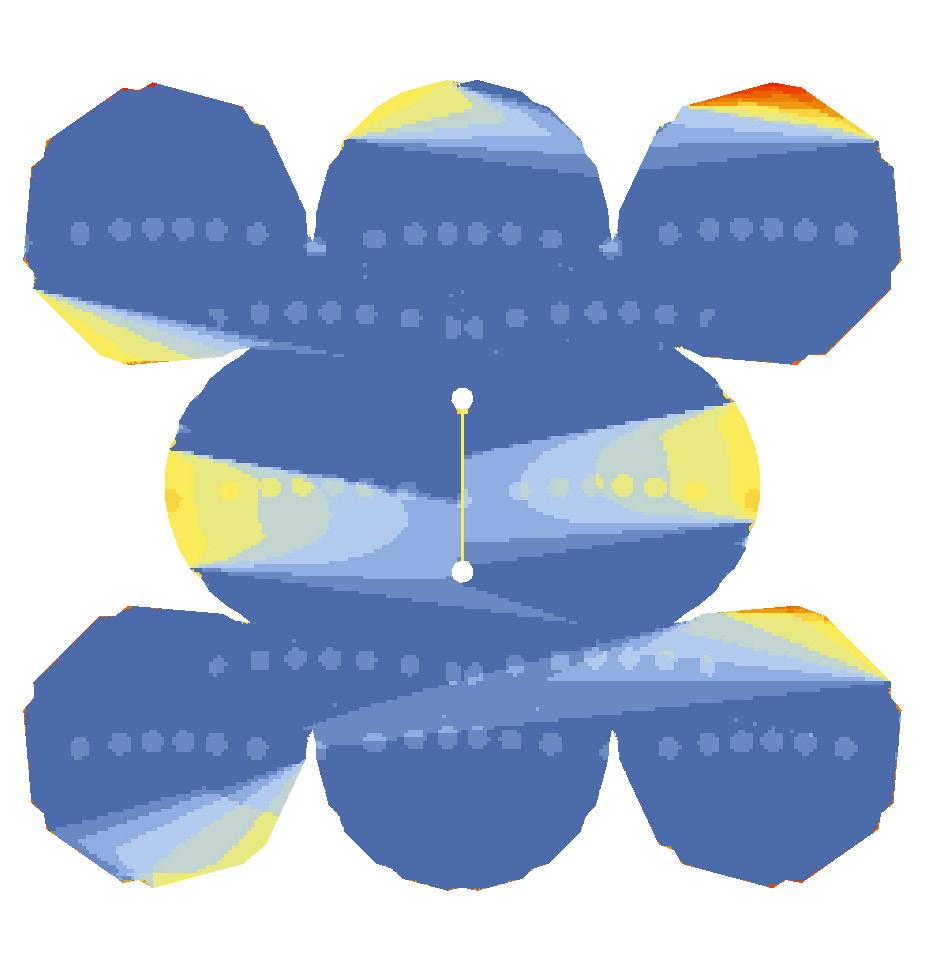
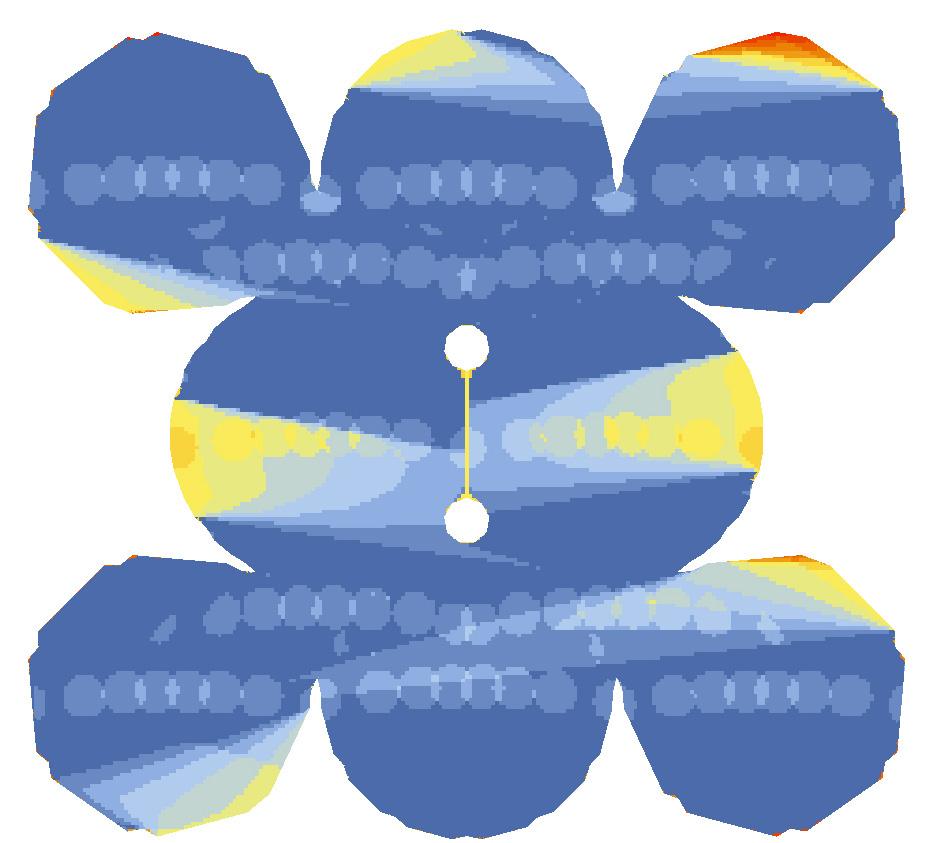
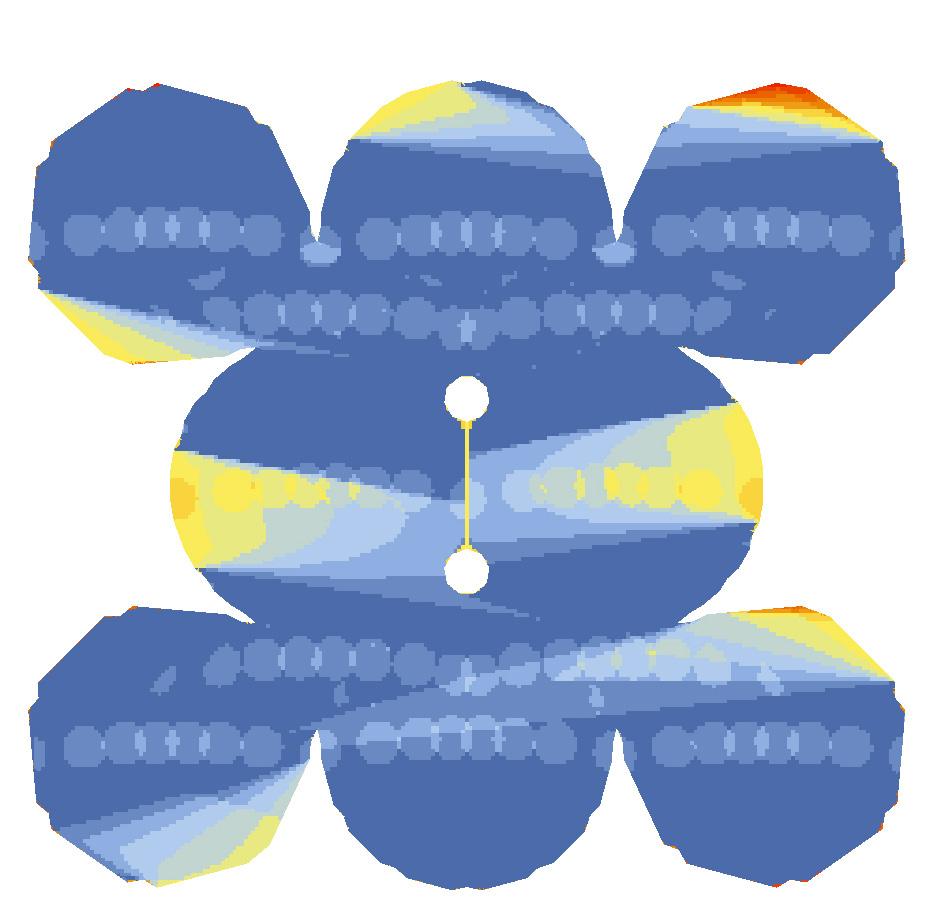
Solar Exposure Analysis
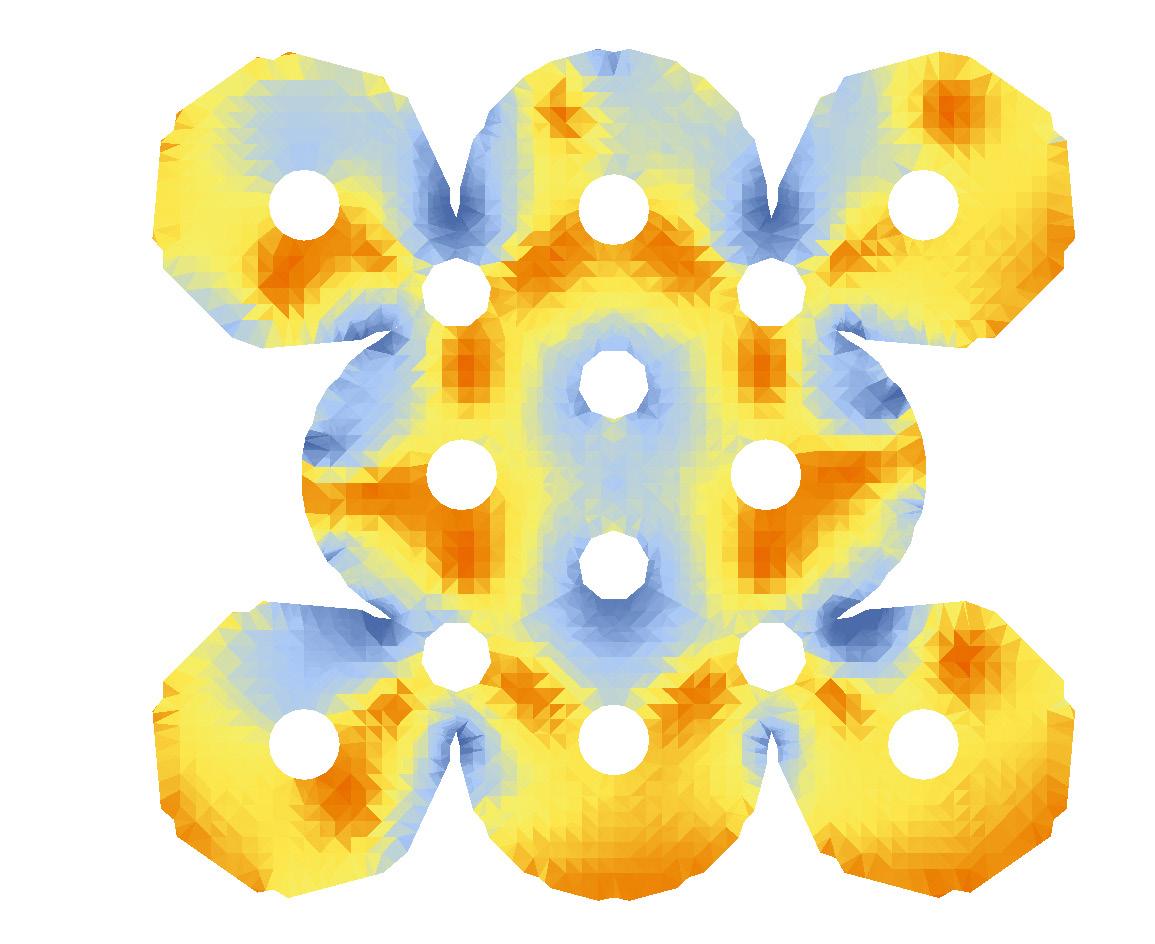
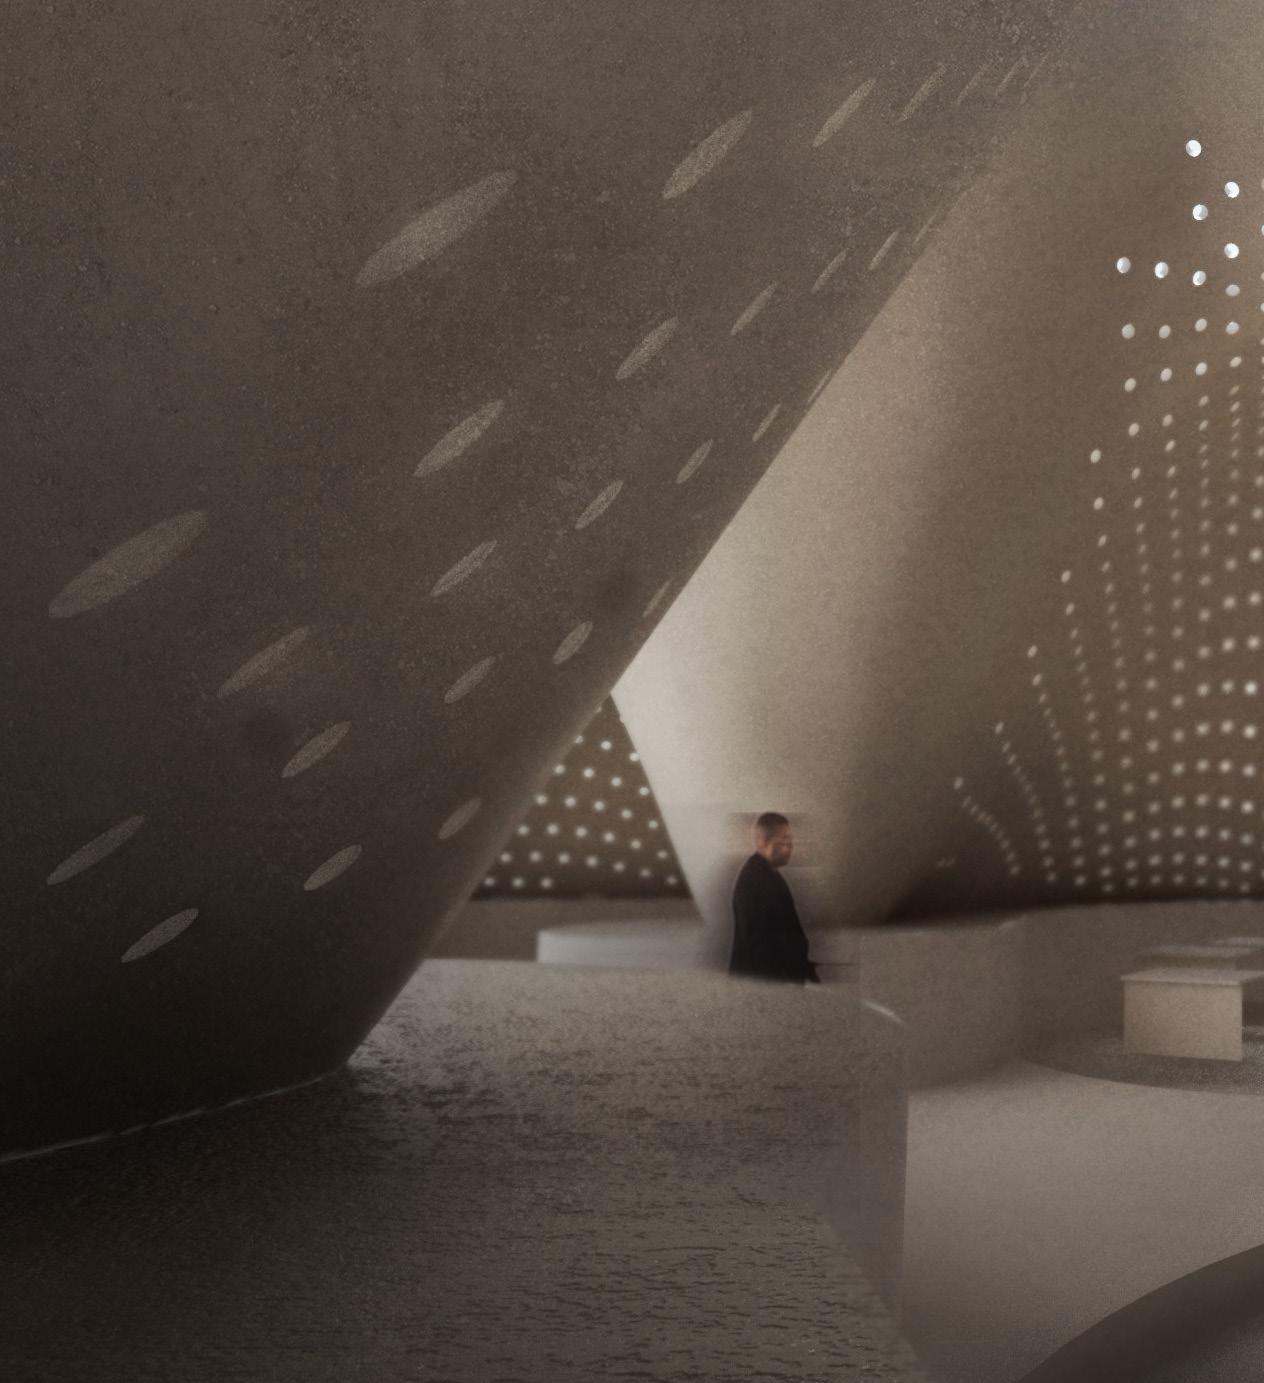
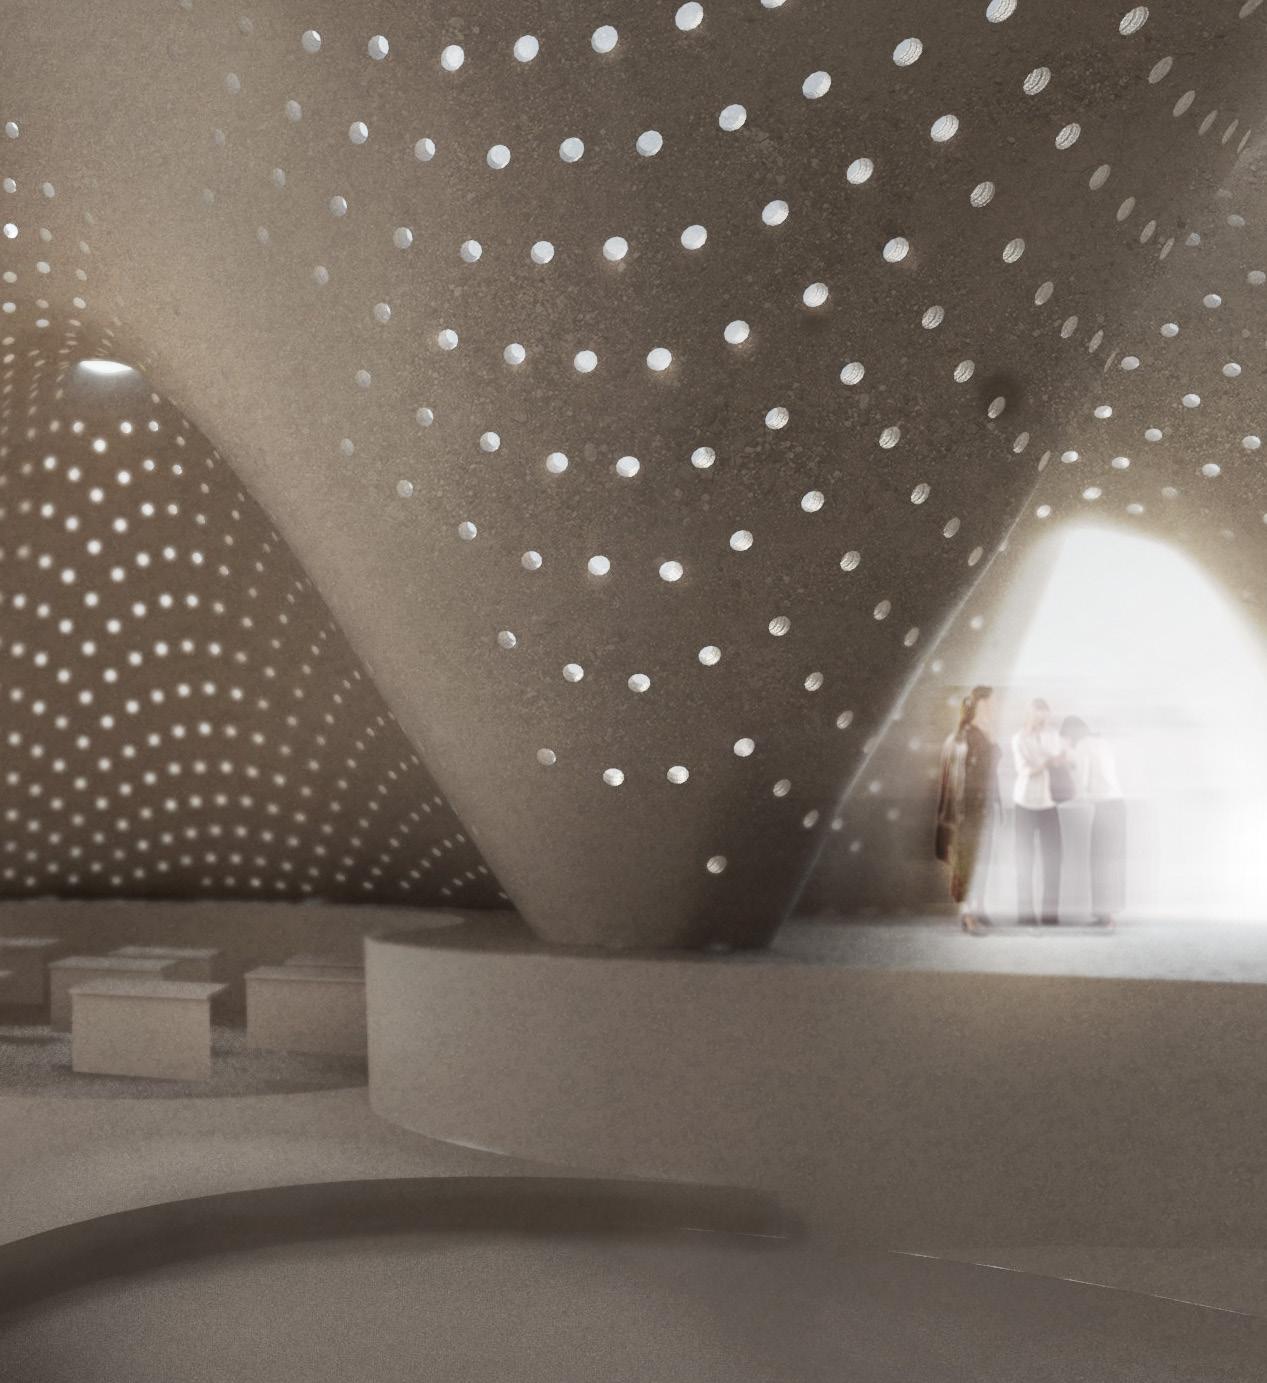
Perforation System
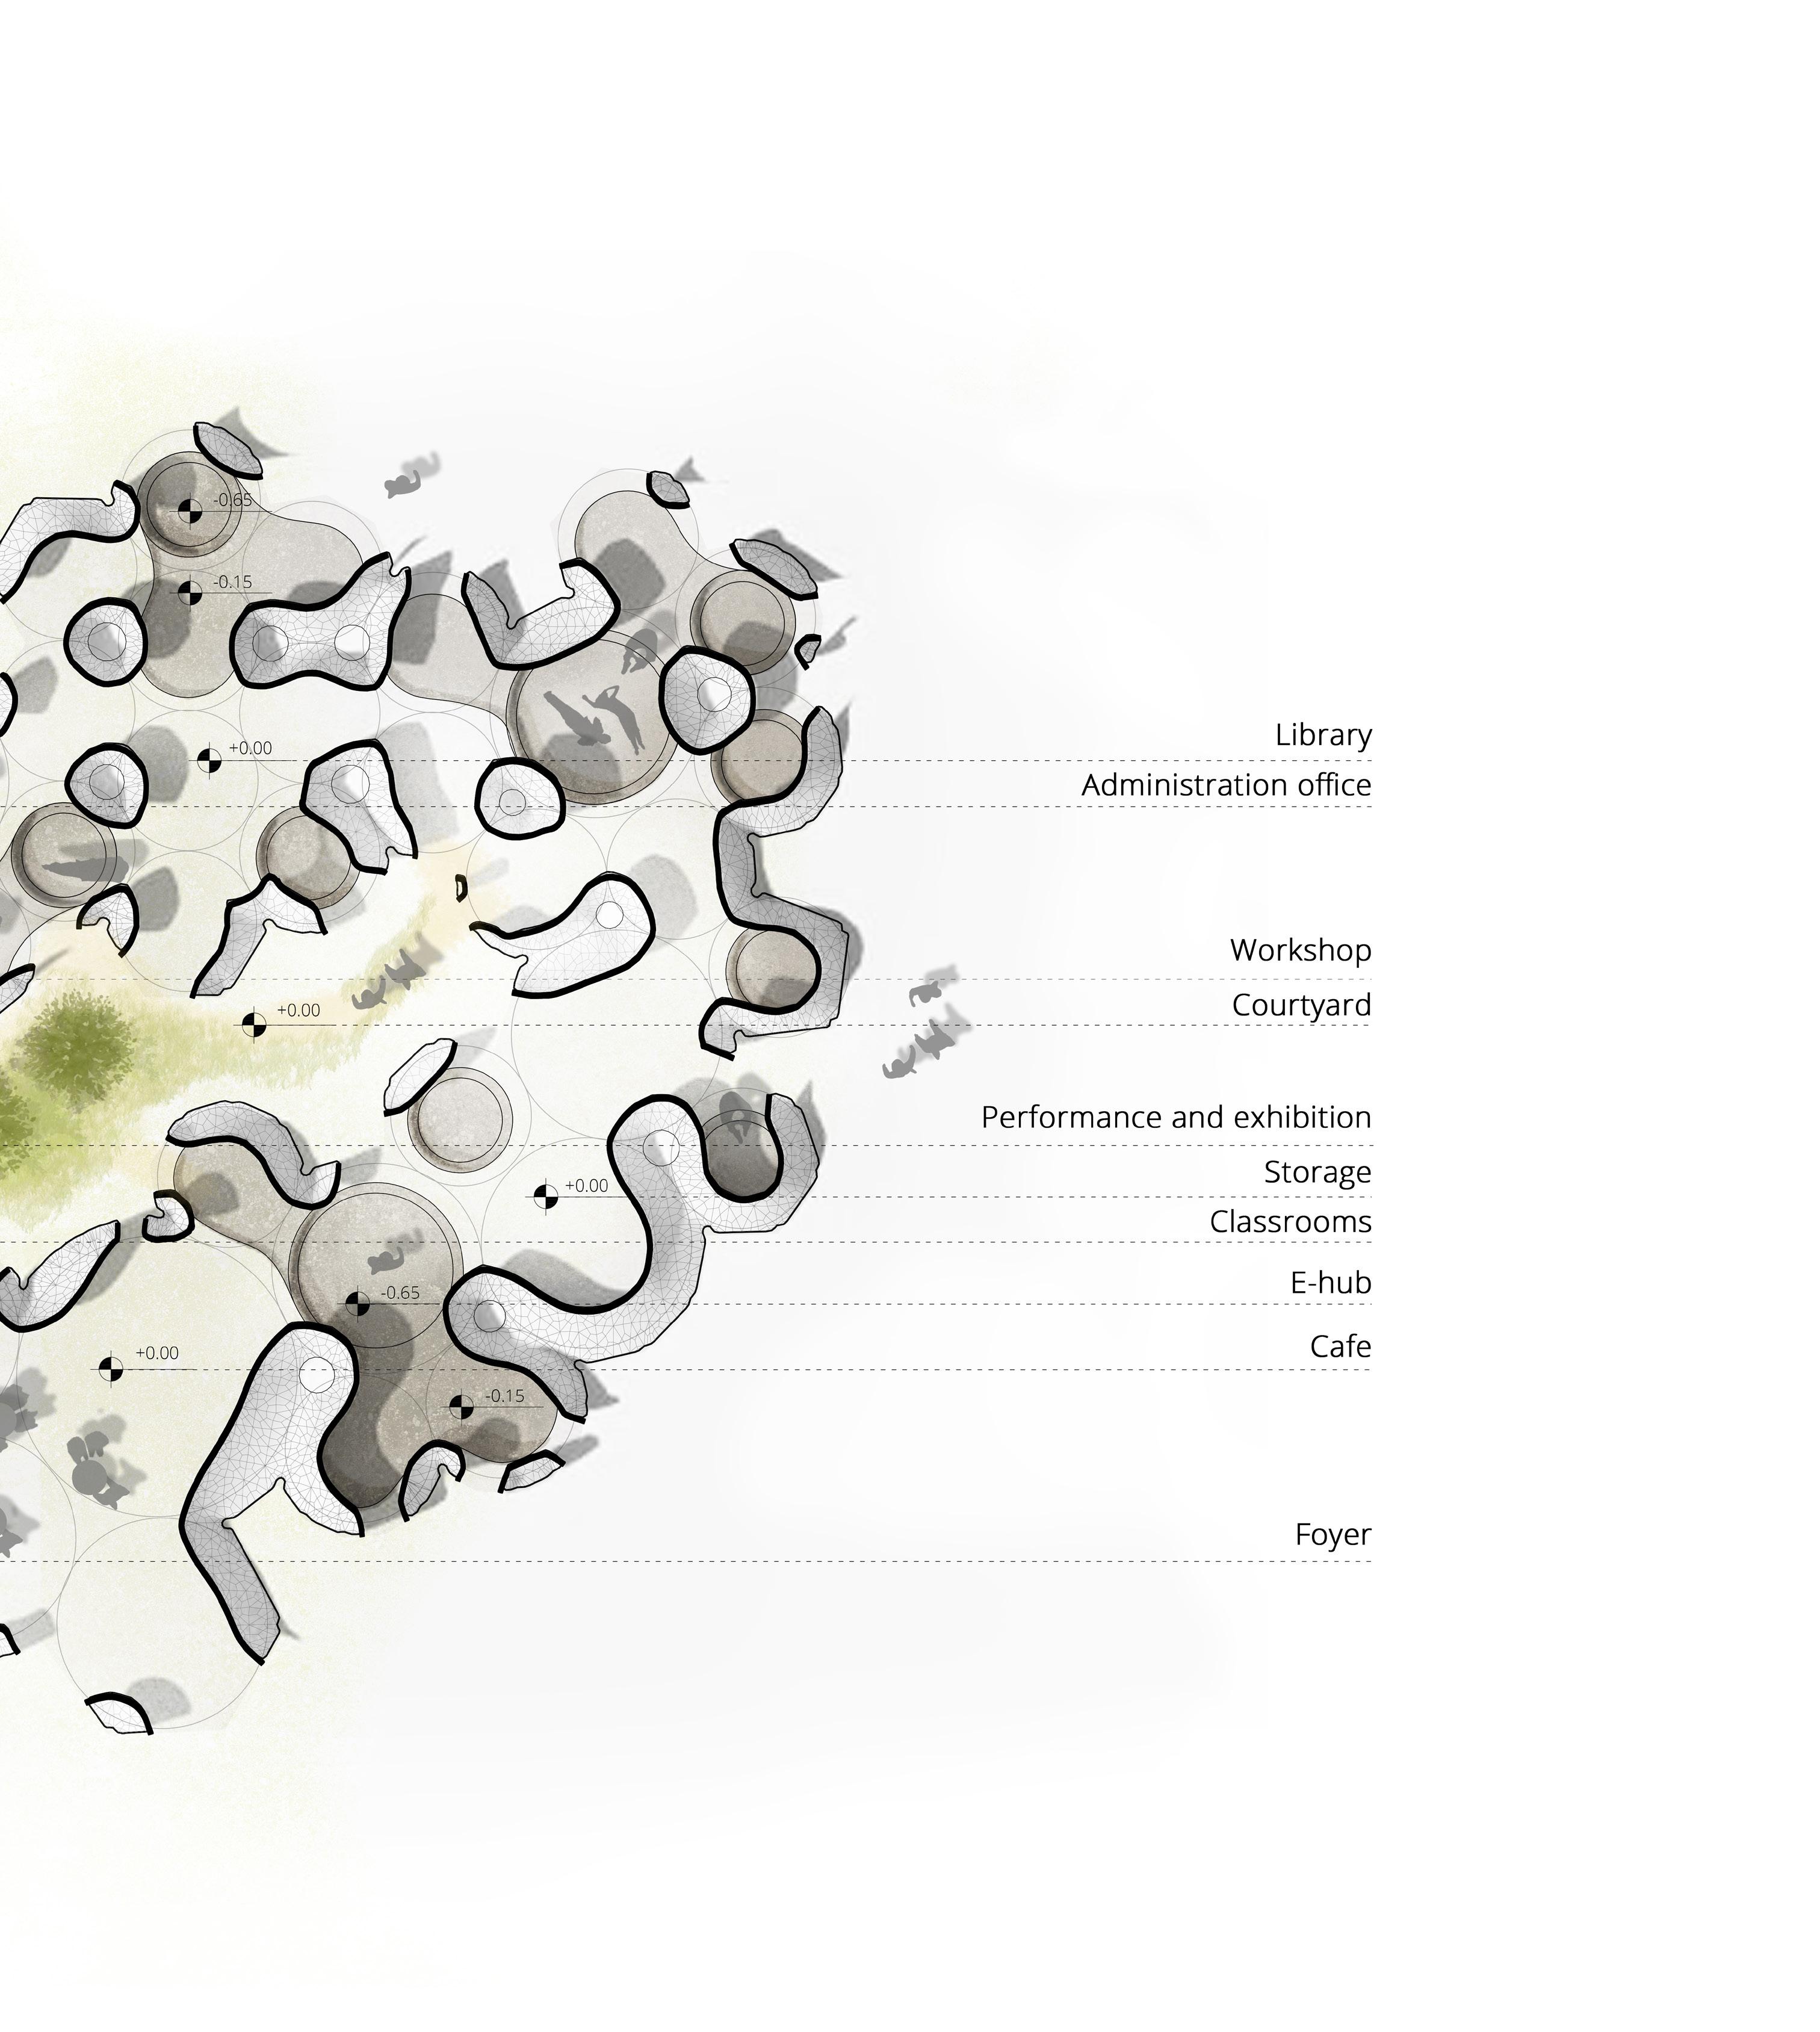
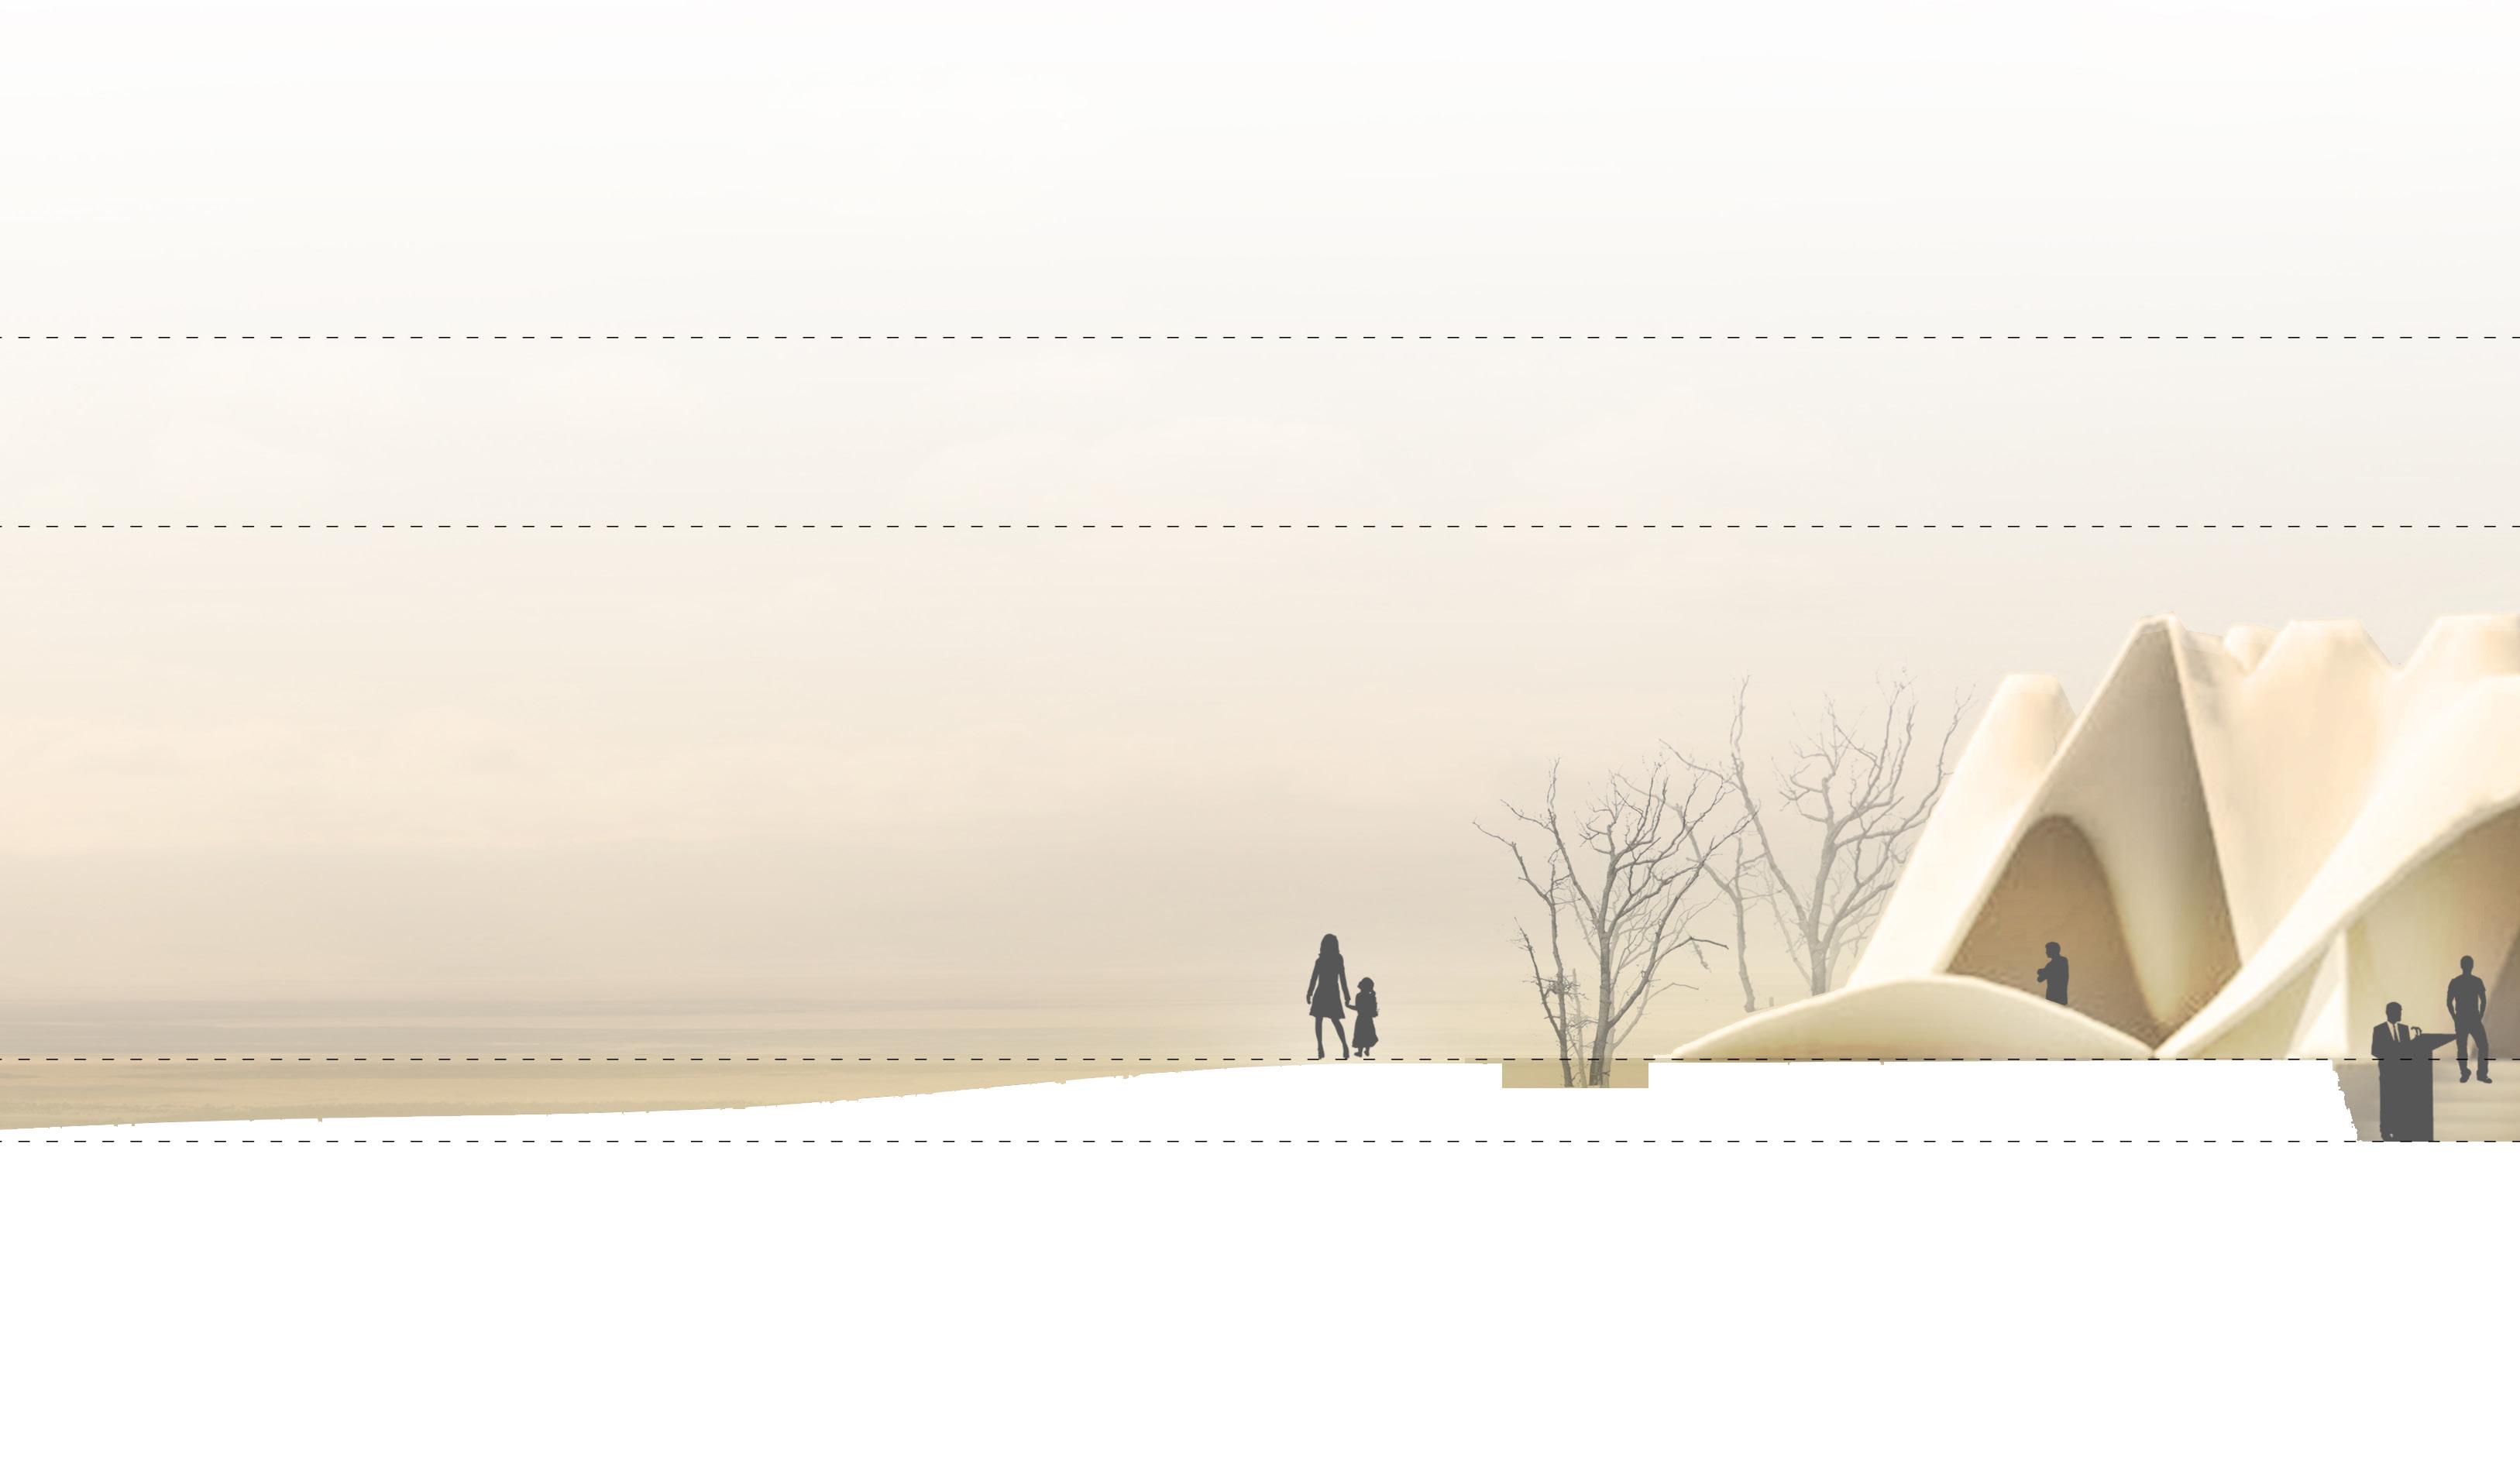
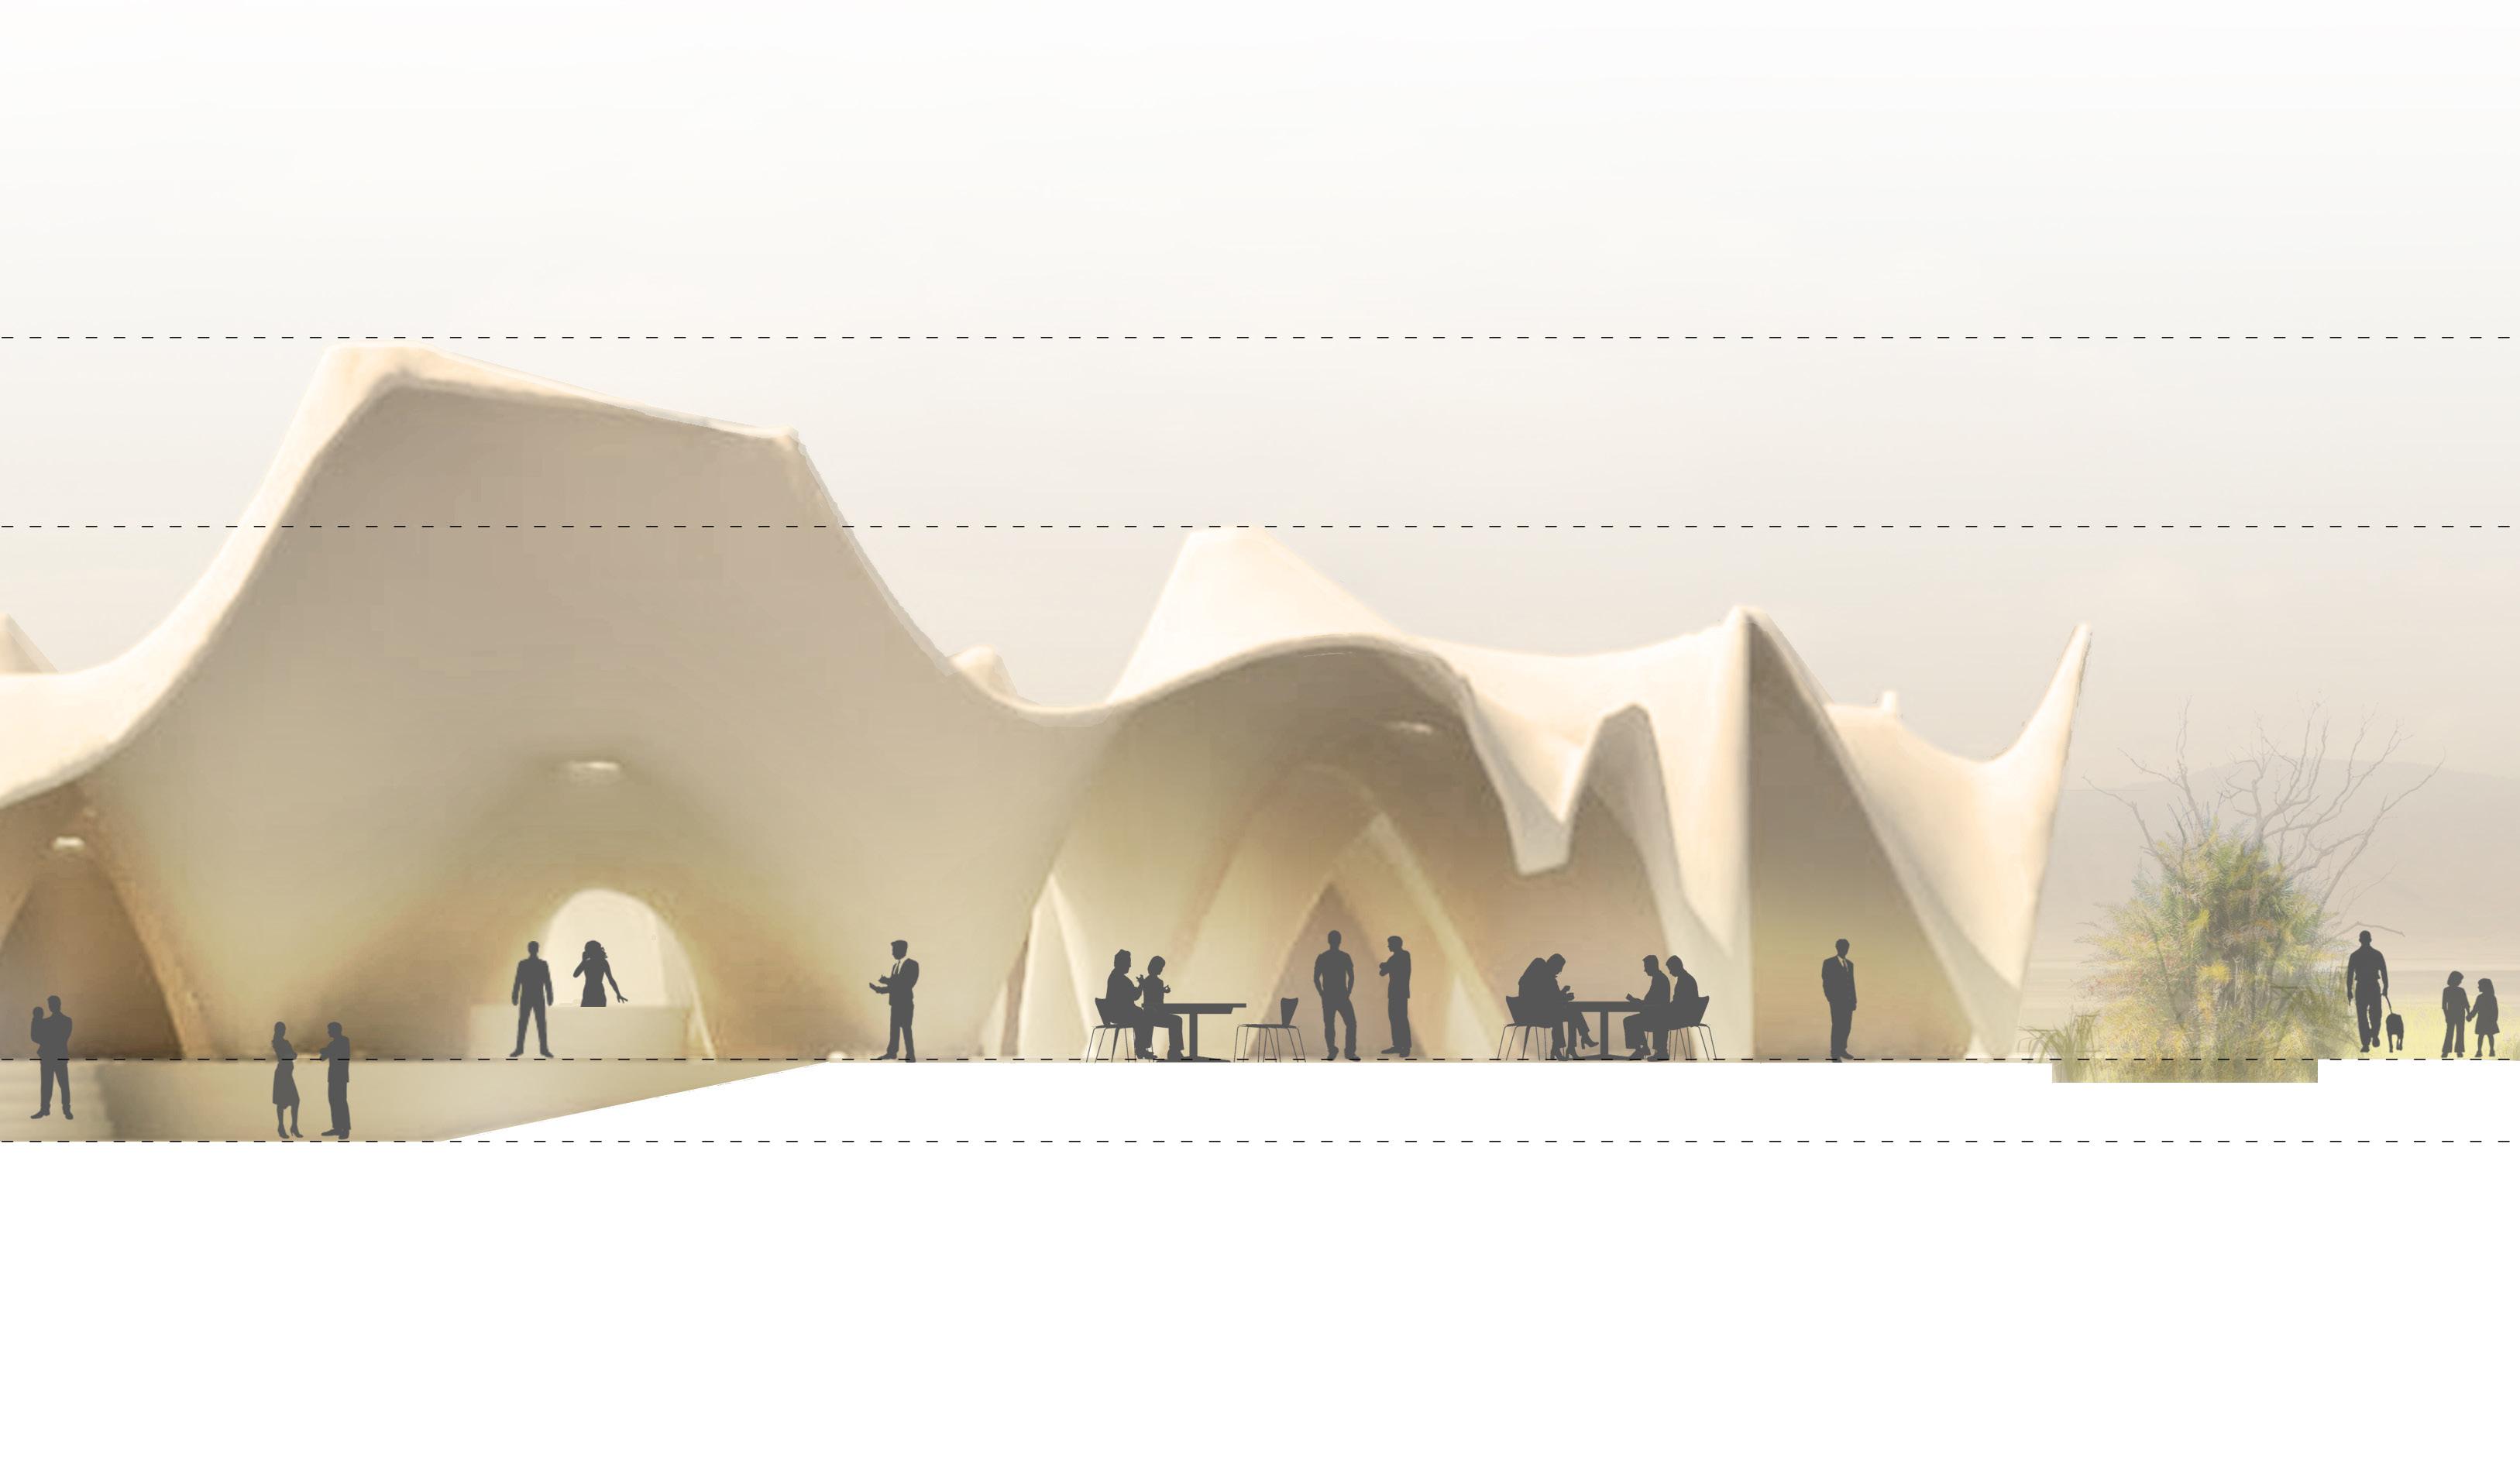
Design Proposal
Learning Centre in the Sahel
Top Down Approach
Multi-Objective Optimisation
The Case Study Project
Design Evaluations
Evaluations of the Structural Performance
Evaluations of the Environmental Performance I
Evaluations of the Environmental Performance II
Evaluations of the Feasibility of the Construction
Conclusions
Appendix
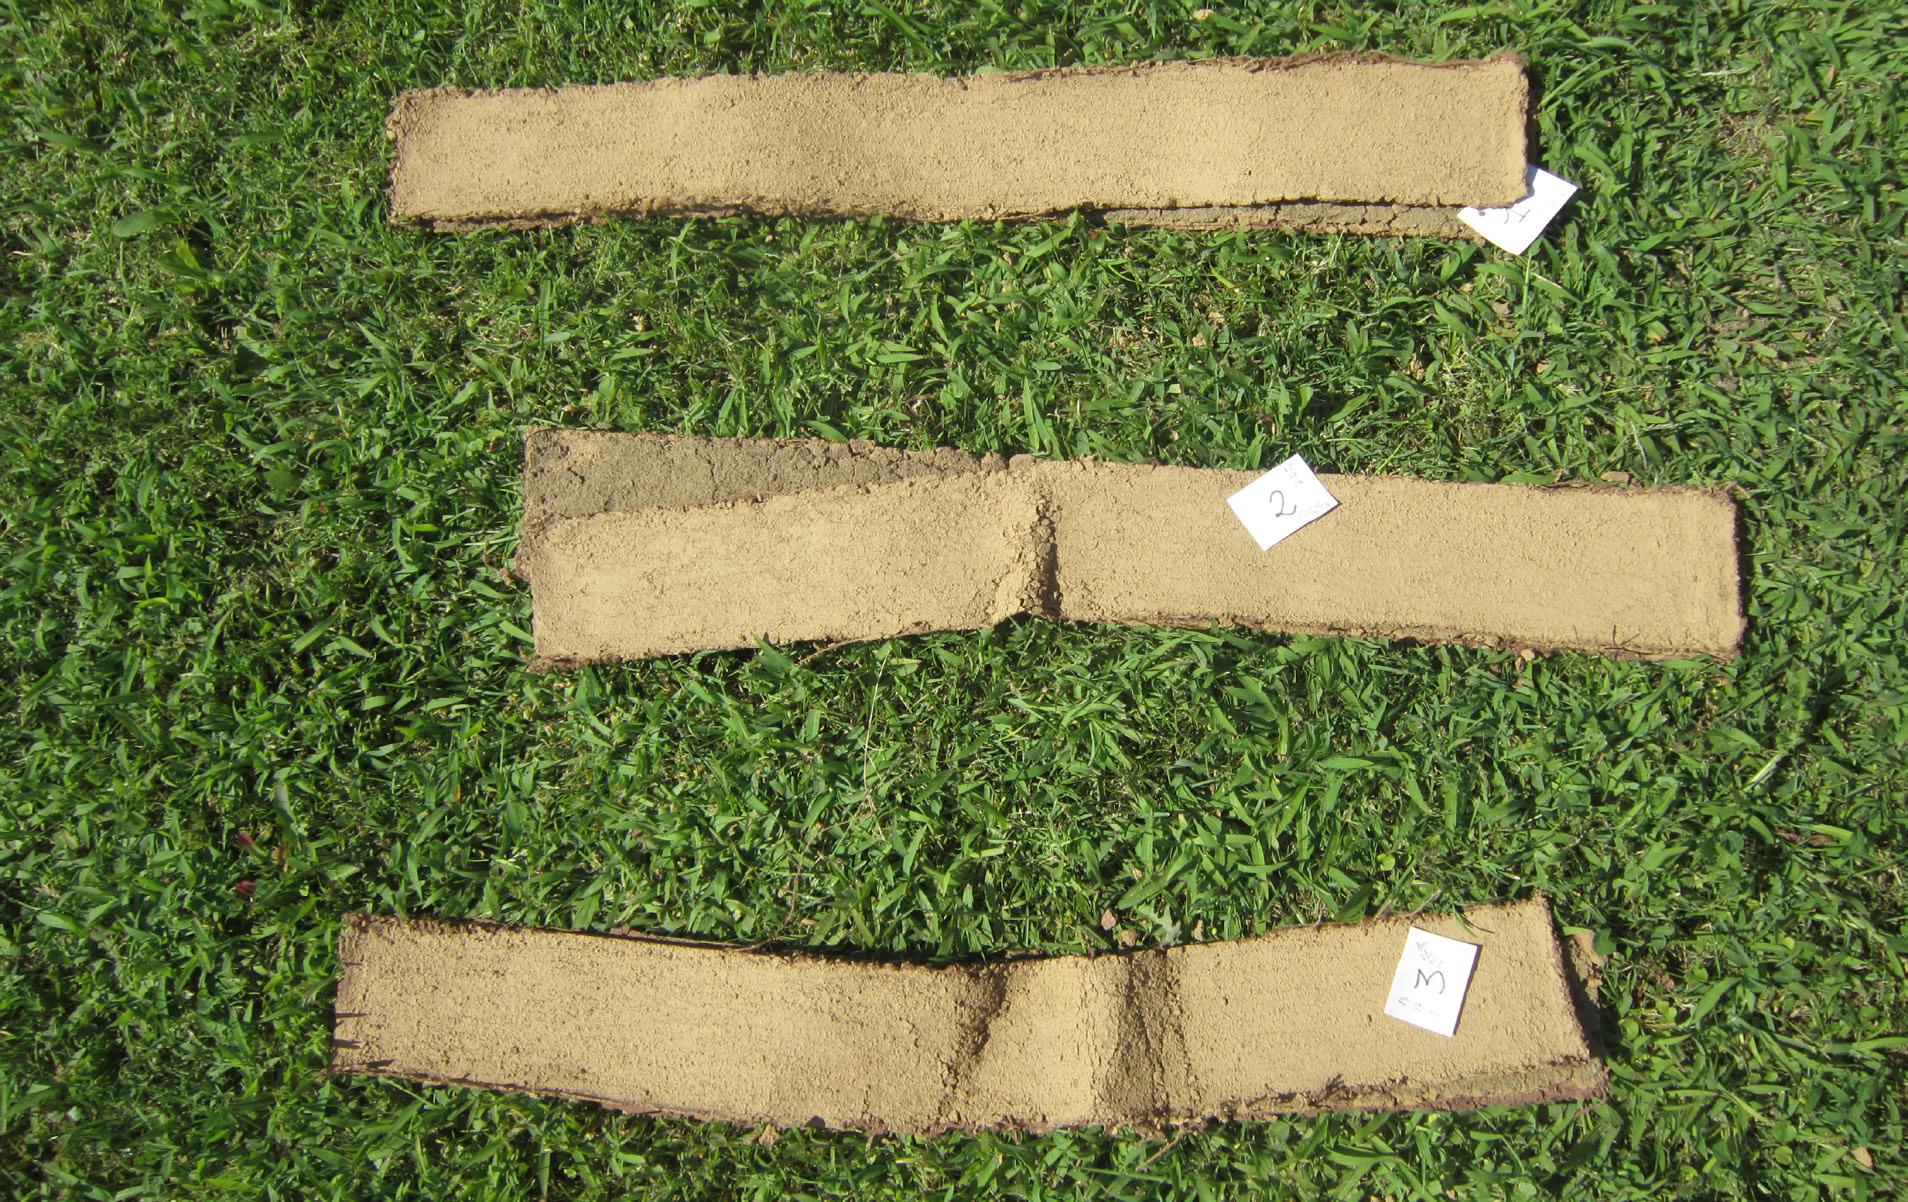
Appendix I - Material Tests
Appendix II - Scripting
Appendix III - Structural Performance and Geometry
Appendix IV - Solar Exposure Analysis
Appendix V - Results of the Multi-Criteria Optimisation
Source of Illustrations
Bibliography Web
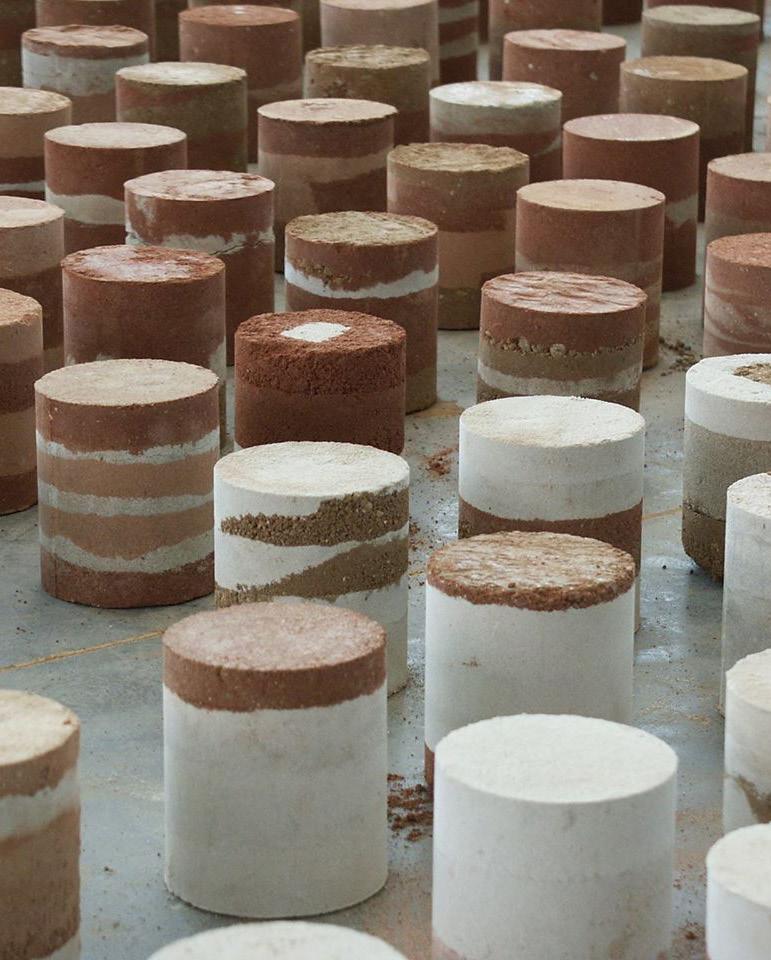
Right
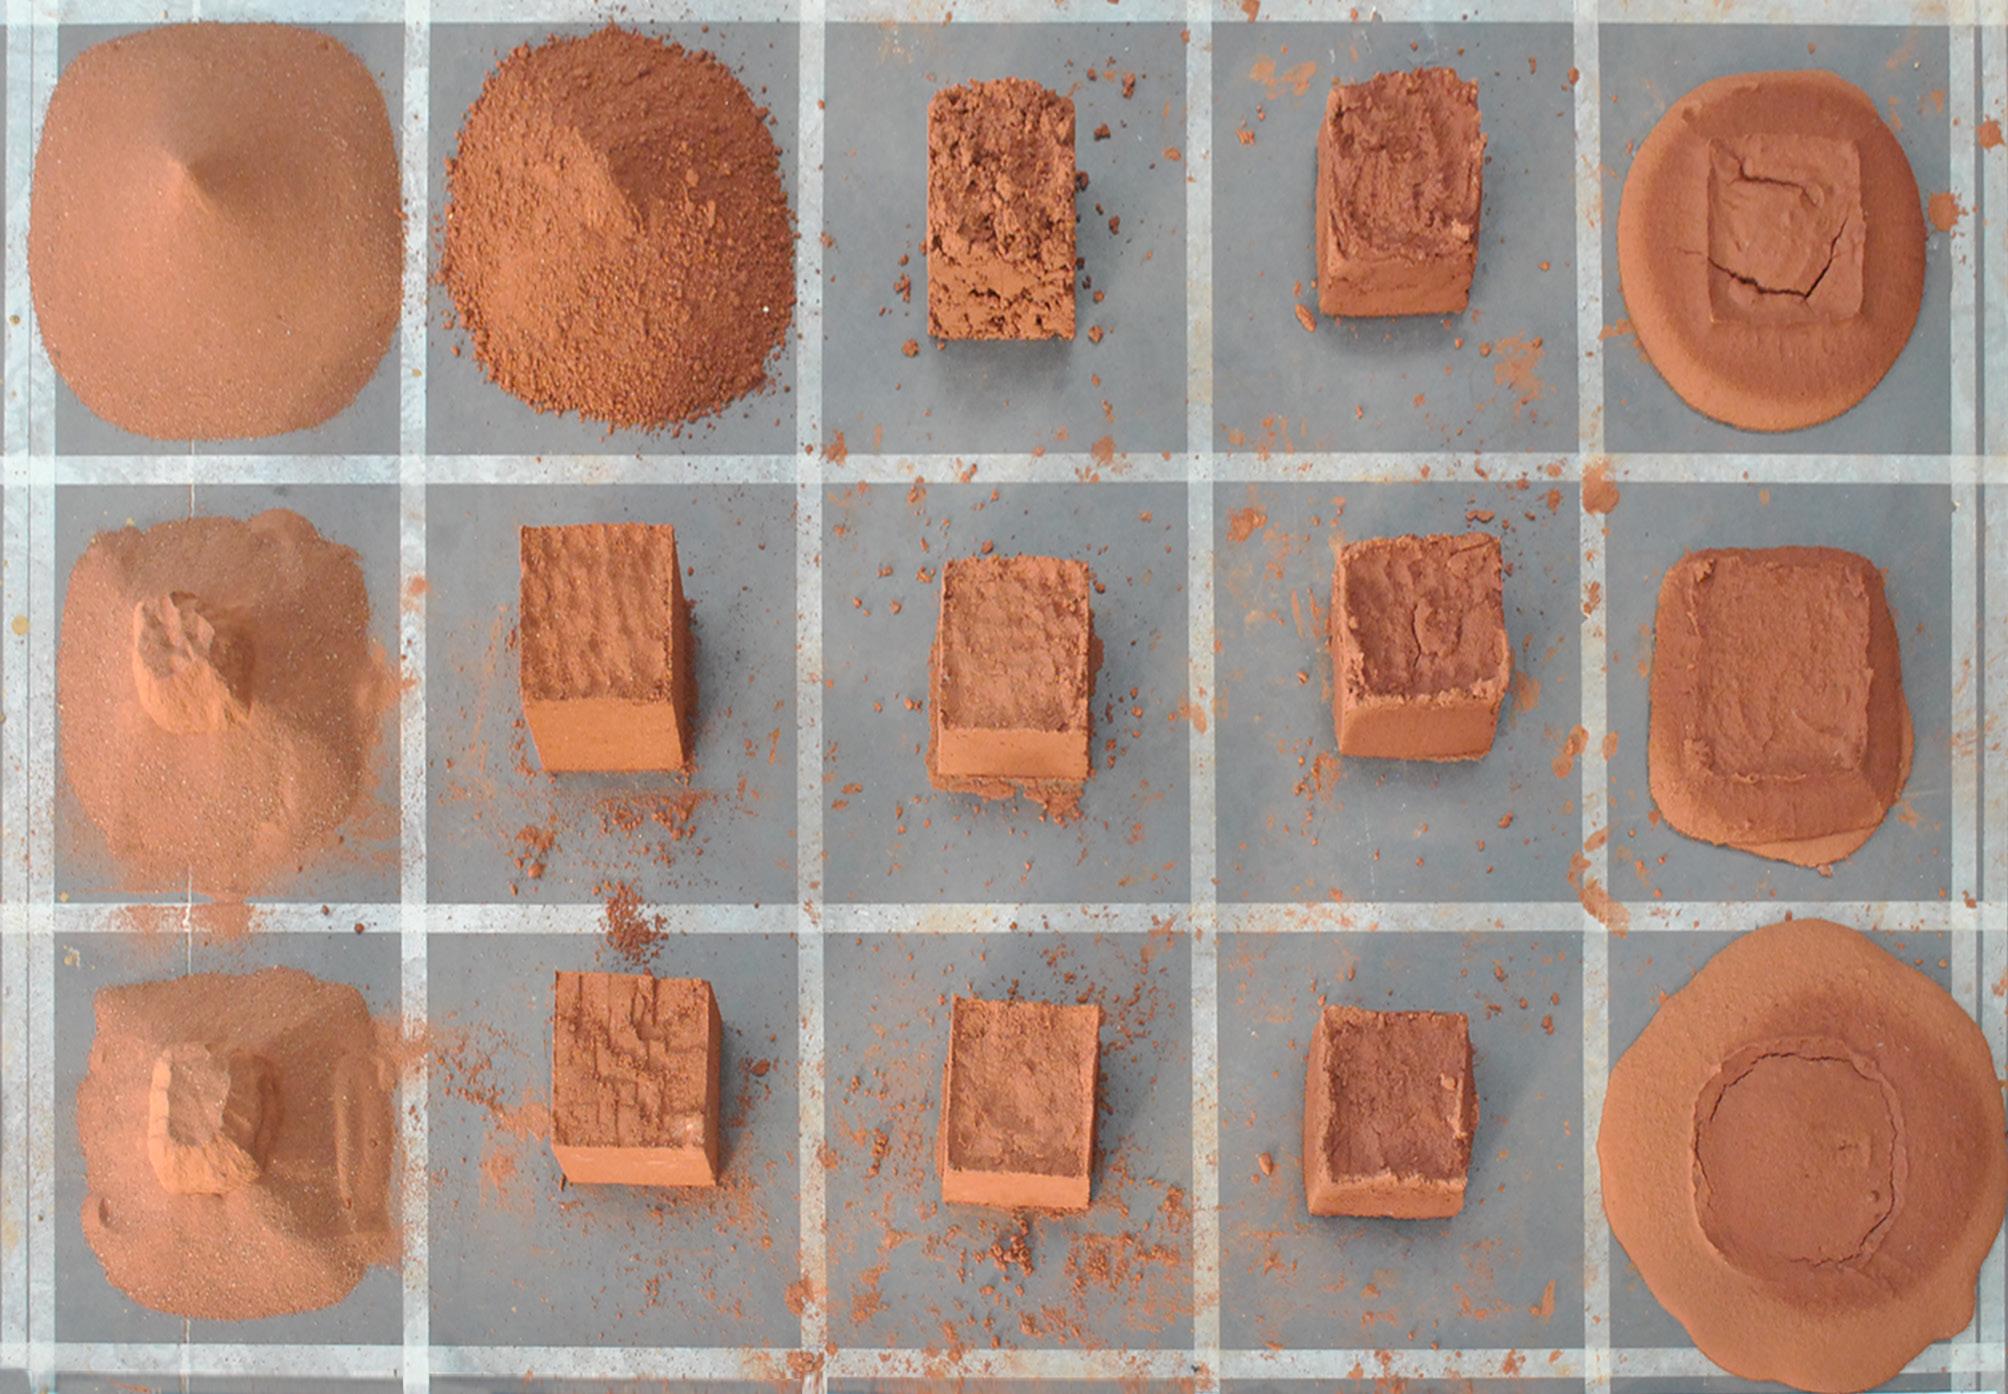
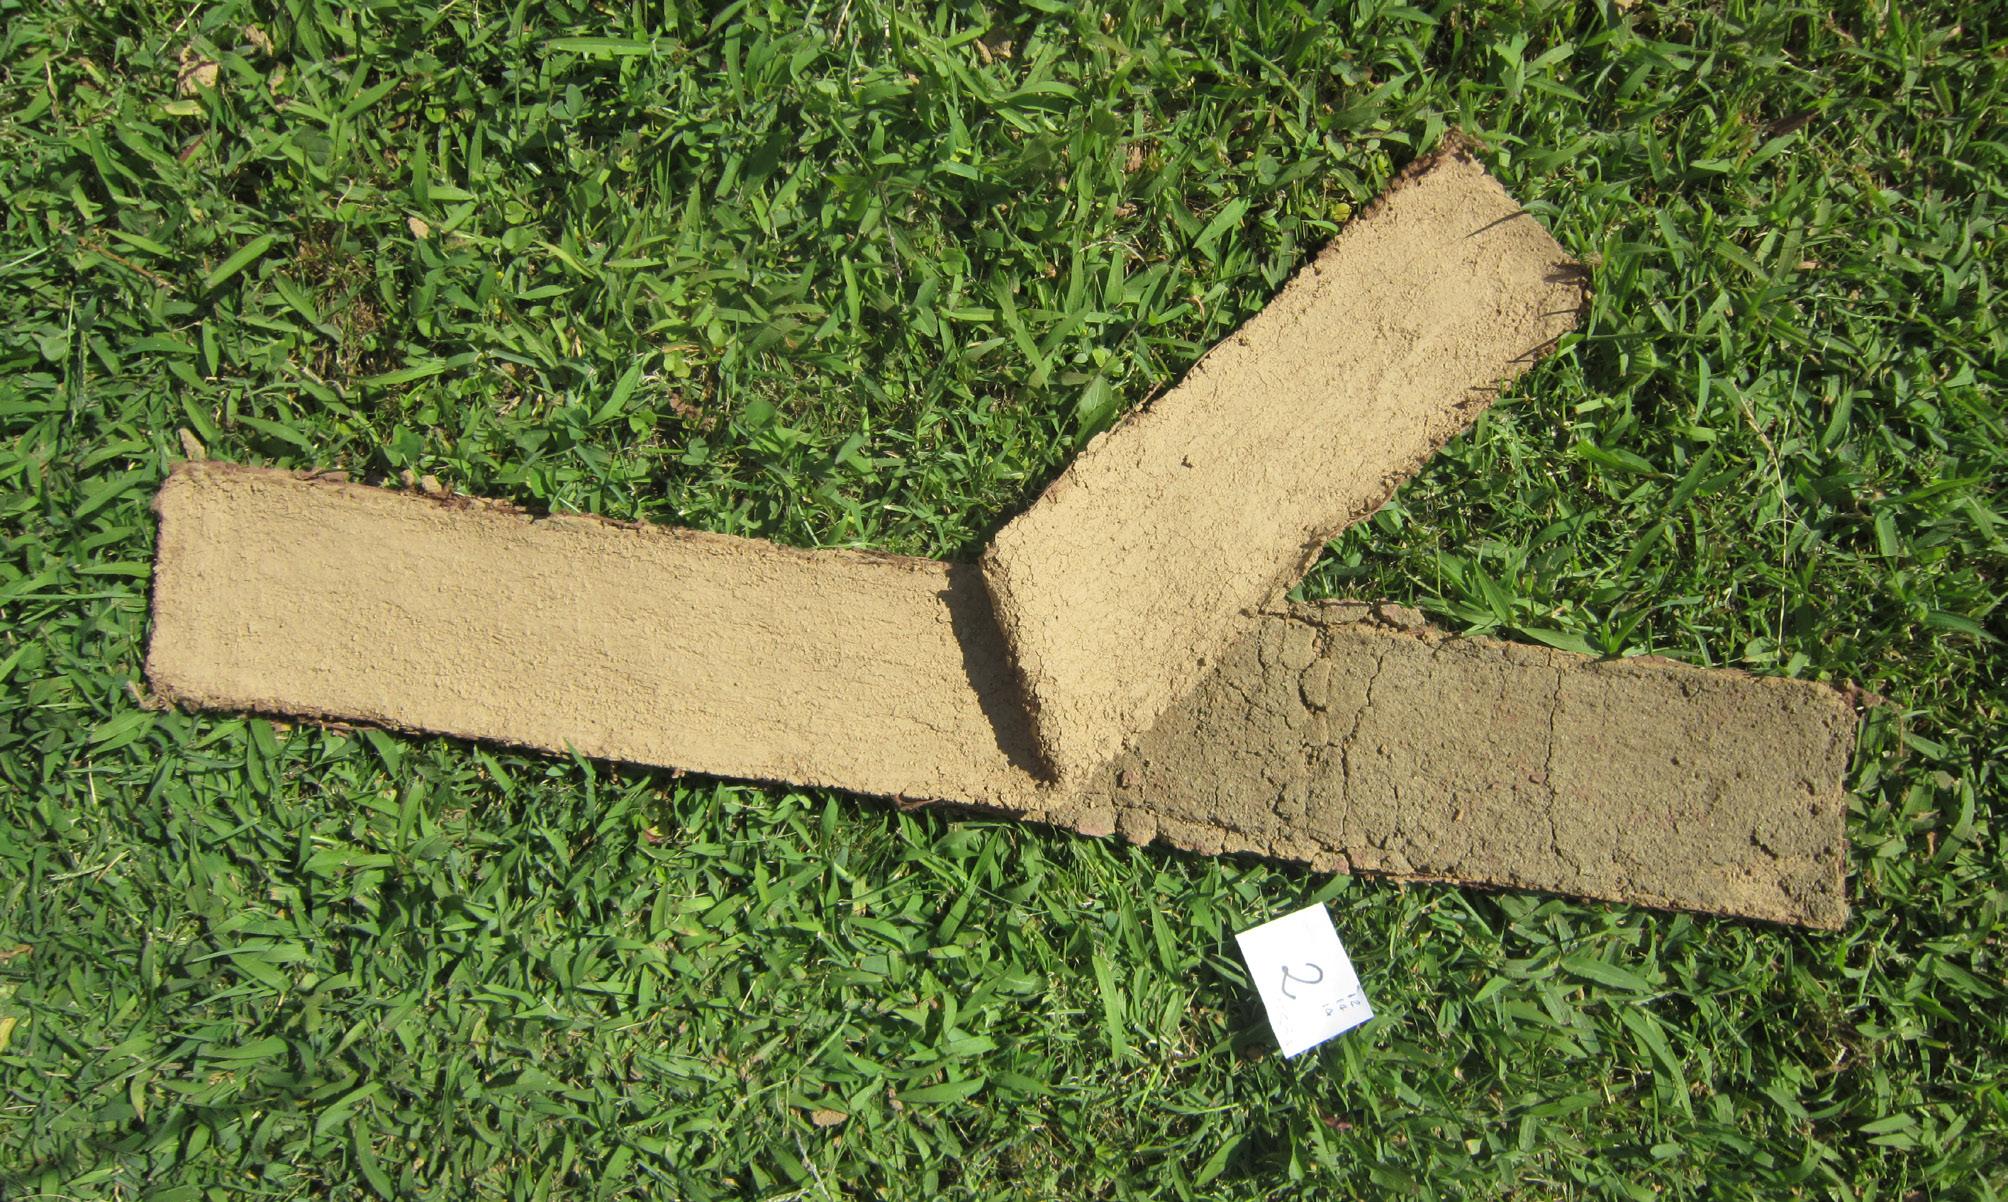
Fig. 0.1 Samples of different types of soil compacted.
Introduction
The current advances in material science and computational design methods encourage the research on sustainable architectural solutions with local affordable resources. Applying the knowledge extracted from nature’s configuration, the development of composites benefit from the anisotropic behaviour of the fibres and the matrix to design materials with specific properties. Whereas digital design enables to generate systems in which the material organisation is informed by the inherent properties and can be adapted and optimised through simulations. This combination allows the development of an architecture based on the relationship between geometry and material performance.
The following research focuses on the implementation of these novel design strategies on the field of earth constructions. Earth is widely available, has a low carbon emission and effective hygrothermal properties, despite this benefits it is not adopted by the construction industry nor commonly used in the contemporary architecture practice. This is due primarily to its structural performance limitations and to an association with outdated aesthetics. The research aims to address these constraints by developing a material system capable of generating integrated self-supporting structures at the building scale. Identifying the properties of a composite of clay and jute fibres, the morphogenesis relies on the
use of fabric formwork to determine the realm of possible geometries. The use of flexible formwork contributes to further reduce the material consumption and also reduces the cost of the construction.
The implementation of these architectural solutions is particularly coherent in hot semi arid climates which are characterised by the scarcity of resources and the extreme environmental conditions demand for thermal efficiency. For the purpose of this exploration the system is evaluated in the context of the Sahel through the development of a case study project for a Learning Centre.
The investigation is divided in four stages. An initial research on the specific material properties of earth and state of the art in relation to construction techniques that either use soil or can be translated to earth. Followed by the definition of the material system through a combination of physical prototyping and digital simulation. Then, an exploration of a higher system level of organisation is conducted, and a set of experiments allow to establish the principal strategies regarding structural and environmental behaviour. Finally the systems capacity to provide spatial differentiation and to respond to specific climate conditions is investigated and evaluated through the development of the Learning Centre.
Domain
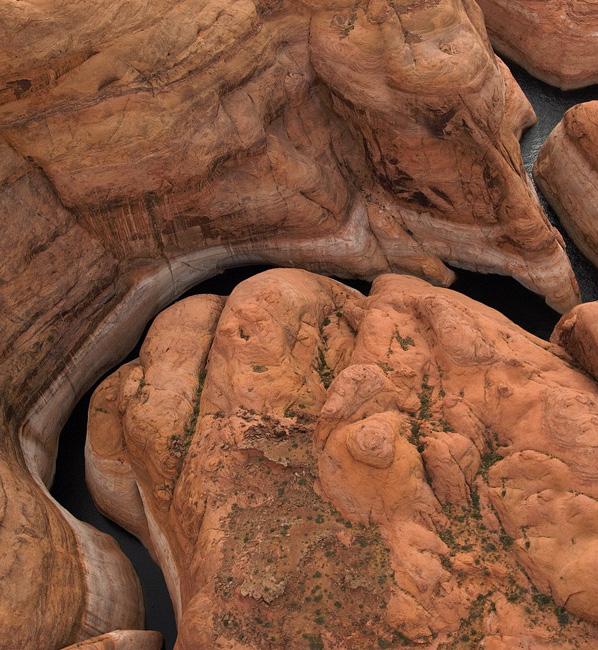
Right
Fig. 1.1 Aerial view Anasazi Canyon Narrows.
In the search to reduce the environmental impact of the building industry the relevance of earth constructions has augmented. Innovative alternatives to expand the domain of application of natural materials can contribute to lessen this impact.
Therefore the initial research focuses on understanding what are the material properties of earth. Secondly to study solutions developed with other materials that can be transposed into earth constructions in order to enhance its suitability. Finally to identify a pertinent context for the implementation of earthen architecture.
Earth as a Natural Building Material
Currently one-third of the world’s population inhabits earth constructions in different contexts however the perception towards the use of this material has followed different trends. Developing countries have witnessed a decline in the use of local building techniques since there has been a social cultural transformation of the values privileging more modern methods. Different initiatives carried out in developing countries try to overcome the barriers imposed by the association of earth constructions to poverty or low social class.
Additionally, awareness has been drawn to the lack of building codes, material standardisation and governmental policies to promote the adoption of earth as a viable material in the construction industry of these countries. These initiatives have also pointed out the necessity of more institutional buildings in earth in order to encourage its use. (Baiche,2008)
On the other hand, developed countries have experienced an increasing interest in sustainable materials since the late 1970s. Building regulations that include the use of earth are now common in countries such as Australia and New
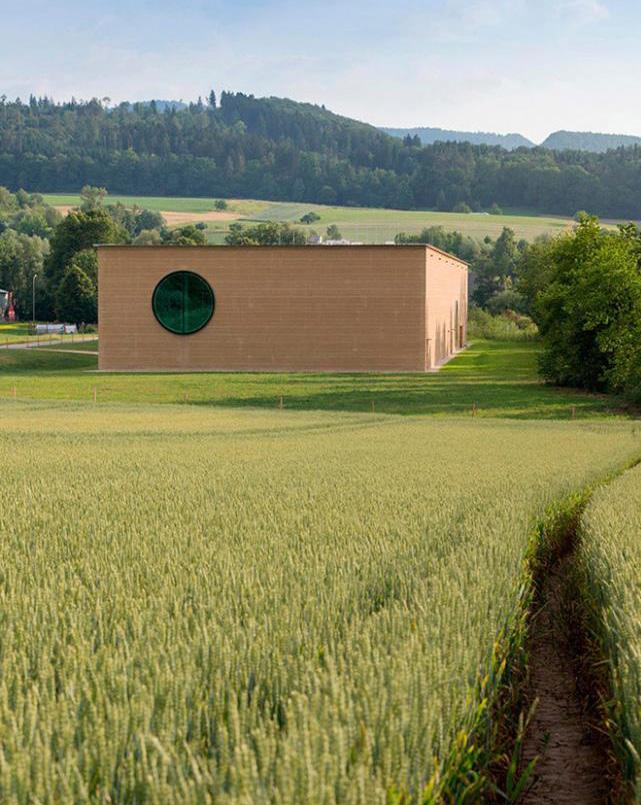
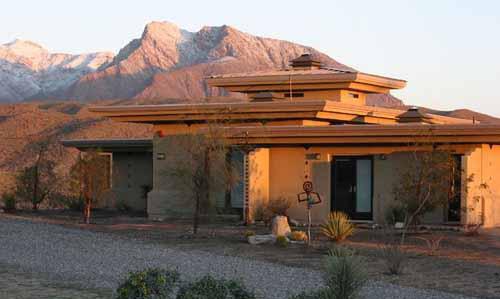
Zealand and were developed as early as 1951 in Germany. Current research has been focused on improving the durability of earth constructions. For instance, developing machinery for pressed blocks and walls with dynamic press. Additionally, proposing alternatives for soils stabilisation to increase its mechanical resistance to water erosion using natural and synthetic additives. Architecture projects using rammed earth with a small content of cement for stabilisation have become more common such as the Ricola Sotage Building in Switzerland or the Eden Centre in Cornwall. (Fig 1.2)
Earth has a low embodied energy, when used locally it represents 1% of the energy necessary to produce backed bricks or reinforced concrete. (Minke, 2007, p14) Besides, it’s wide availability can reduce significantly transportation and construction cost when the soil can be excavated locally. The material’s capacity to absorb heat and humidity can provide indoor thermal comfort in different climatic conditions. However the recognition of earth as a valid building material by both consumers and the building industry in developed and developing countries still needs to be enhanced.
Left
Fig. 1.2 Ricola Storage Building rammed earth walls, Herzog & de Meuron, Laufen, 1987.
a10 = 100 √d/D + 10 (g)
Material Research
Material Composition
Earth used as a building material is composed by a mixture of different proportions of clay, silt and sand, and might contain larger aggregates like gravel and stones. This denomination relies on the particle’s diameter: those smaller than 0.002 mm are considered clay, those between 0.002 and 0.06 mm are silt, and those between 0.06 and 2 mm are defined as sand. Gravels and stones refer to particles of larger diameter.
Some literature denominates the mixture as loam. The exact composition of the loam depends on the type of soil available on site.
The material properties of loam also differ according to its composition. The types of loam are named in relation the dominant component: clayey, silty or sandy loam.
The proportions of mixture as well as the percentage of water depends on the application intended. Loam can be classified and evaluated
Right
Fig. 1.3 The curve derived from the modified formula of the Fuller curve for a maximum grain size of 4 mm.
Physical Characteristics
Density
Grain size distribution of the aggregates (silt and sand)
Left Fig. 1.4 The diagram shows the relationship between material composition and properties.
Shrinkage
according to plasticity, density, consistency and compactability.
These characteristics are used to identify the mechanical properties, compressive and tensile strength, that the loam will acquire when dry.
The German Standards have defined specific tests to analyse the loam composition and determine its suitability. (Minke, 2007)
The principal role of clay is that it acts as the binder between the aggregates, and it is activated by the presence of water. The Fuller curve, usually used to define proportions for concrete can be used as an empirical reference for aggregates distribution to ensure cohesion of the mixture. In the late eighties the formula was modified taking into account a higher presence of clay. (Fig 1.4)
One of the critical aspects of loam is the water content in the mixture since it affects the shrinkage behaviour of the loam when dry.
Regulations usually consider the maximum permissible linear shrinkage between 2-3%. Shrinkage induces cracking and can compromise the mechanical properties of the loam.
The addition of stabilisers is a common practice to enhance the cohesion of the mixture and prevent from erosion. Lime is considered an effective stabiliser when the clay content is high whereas cement and soda water-glass are commonly used for sandy loams.
The optimum lime or cement content for loam differs and can even reduce the binding forces. Cement is currently the most used stabiliser in proportions between 6% to 15% because of its effectiveness. While arguably this decreases the sustainability of the use of earth it still considered a relatively low ratio.
Right
Fig. 1.5 Material tests, Different compaction methods tested on silty loam, Grand Ateliers, Lyon, 2015.
Thermal Conductivity (k) - W/(mK) Density (ρ) - kg/m³
Thermal Conductivity (k) - W/(mK) Density (ρ) - kg/m³
Compressive Strength (fc) - MPa
Modulus of Elasticity (E) - GPa
Resistance Factor (μ) Modulus of Elasticity (E) - GPa Concrete, 250 mm Baked bricks, 250 mm Rammed earth, 350 mm Adobe, 250 mm
Concrete, 250 mm Baked bricks, 250 mm Rammed earth, 350 mm Adobe, 250 mm
Structural Properties
In terms of compressive strength attained by earthen building elements, there is a large amplitude of results variate from 0.2 to 20 MPa. This values are correlated to the thickness of the element analysed and depend on the method of preparation and compactation.
The result can be enhanced by organising the grain size distribution of silt, sand and larger aggregates.
In general both the tensile and the bending strength have very low values and are considered irrelevant. The modulus of elasticity of loam usually lies between 1 to 6 GPa.
The values of density, compressive strength and modulus of elasticity for earthen building elements no matter the fabrication technique are significantly lower than the ones obtained with concrete.
Vapour Diffusion Resistance Factor (μ)
Thermal Properties
The thermal properties of a material and its performance in relation to heat flow in a building are determined by its conductivity (k-value), its specific heat capacity (Cp), and its density. A material with low thermal conductivity can reduce the amplitude of temperature variations providing insulation. Additionally, a high thermal storage capacity (Cp) implies that the heat takes a longer time to pass through the material which is generally referred as a large time lag.
Thermal mass (Cth) is the relation between the specific heat capacity and the mass (m) of the material: Cth= mCth and is fundamental to describe its potential to provide internal thermal comfort. Moreover, the capability of a material to moderate the fluctuation of external temperature can be described through its heat decrement. It represents the ratio between the internal temperature variation over the external. Thus, the lower the value the higher the
Left Fig. 1.6 Comparison between earth material properties and other building materials in use.
Above right
Fig. 1.7 Loam conductivity value in relation to density variation.
Below right
Fig. 1.8 The graph shows the absorption curves of 11.5 cm thick unplastered walls of different materials over 16 days. The results show that mud bricks absorb 50 times as much moisture as solid bricks baked at high temperatures.
kN/m3
loam
Silty loam
Clayey loam
Straw loam 14 kN/m3
Straw loam 7 kN/m3
Straw loam 5
Porous concrete
Expanded clayey
Porous brick
Solid brick
Concrete
material’s capacity to attenuate the temperature variation.
Building elements fabricated with loam have a low thermal conductivity, a high specific heat capacity, thus a large time lag and a low heat decrement. For instance, a typical k-value for adobe bricks of thick loam mixed with cut straw is 0.53 W/(mK), and a time lag between 9 and 10 hours. Compared to concrete the properties of loam are more beneficial in climatic zones with high diurnal temperature differences, or where it becomes necessary to store solar heat gain by passive means, helping to balance indoor
climate. Furthermore loam has the capacity to absorb and desorb humidity from the ambient air, in other to control the indoor humidity. Loam absorbs humidity under the influence of vapour but remains solid and retains its rigidity without swelling. The equilibrium moisture content generally depends on the temperature and humidity of the ambient air; however the higher the clay content of loam, the greater its equilibrium moisture content, which for loam is usually around 5-7%. This value is usually sufficient to balance air humidity between 40-60%.
Composites
Fibre Reinforced Materials
Composite materials combine two or more materials to improve their mechanical, physical, chemical or electrical properties. Most composites consist of a structure made of two elements: a matrix, which acts as a binder, and a reinforcement material which increases its stiffness. Composites exist in nature in both animals and plants. Wood is a significant example: it is made from long cellulose fibres held together by lignin. In the building industry, adobe bricks and concrete are the most common examples of composite technologies.
The matrix material surrounds and supports the reinforcement by maintaining its relative position and desired orientation, it protects it from external chemical and environmental attack, and it bonds the reinforcement so that applied loads can be effectively transferred. Many composites are based on a polymer matrix formed by a resin solution ( polyester, vinyl, polyester, epoxy, phenolic, polyimide, polyamide, polypropylene, PEEK). Other polymer binders are mud, cement, metals, and ceramics. Reinforcement materials are often fibres or ground minerals. Reinforcement usually transmits its specific mechanical and physical properties to add stiffness and regulate crack propagation.
Fibre reinforcement can be introduced in form of short fibres, which usually come in the form of flakes, chips, and random mate, or continuous woven material, which leads to a layered or laminated structure. Common fibres used
for reinforcement include glass fibres (GFRP), carbon fibres (CFRP), aramid (e.g. Kevlar) and natural fibres with cellulose (wood/paper fibre and straw). The mechanical properties of natural fibres are lower that synthetic fibres, however they can be applied for low strength purposes.
Different methods are used to bind together the two materials. Various methods have been developed to reduce the resin content of the final product and increase the fibre content. Generally, lay up results in a product containing 60% resin and 40% fibre, whereas vacuum infusion gives a final product with 40% resin and 60% fibre content. The strength of the product is greatly dependent on this ratio.
However, as the development of composites evolve the aim is to achieve more performative composites in terms of young modulus without over increasing the amount of fibres since this action has a high impact on the cost of the composite.
Properties of the overall system depend on fibre distribution, orientation, continuity and density. In the case of woven fibres the structural performance is influenced by the construction pattern, the method of bundling the fibres and the friction between the filaments, which relates to the load bearing behaviour of the thread. On the other, both the shear angle and the locking angle can differ depending on the direction of the deformation if parallel or perpendicular to the thread.
Research regarding the efficiency of textile reinforced concrete has shown that the tensile
strength is higher when tested along the weft direction and these should be set on the direction of principle stresses. Additionally, cracks on the matrix are reduced when there are unidirectional fibres on the load and glass fibre reinforcement, (GRC) achieve thinner crosssections of concrete with high compressive strength and elastic behaviour. In relation to the anisotropic behaviour of the fibres, stiffness and
Natural fibres or Synthetic fibres
Short fibres diffused in the mix or Fibre mesh interposed between two layers
strength can be influenced at the development stage. The material structure can be engineered so that the directionality of the reinforcement material is arranged to match the loading on a given component. Engineered composite materials must be formed to shape and this provides design flexibility because many of them can be moulded into complex shapes.
Left Fig. 1.9 Parameters controlling the performance of a composite.
Right
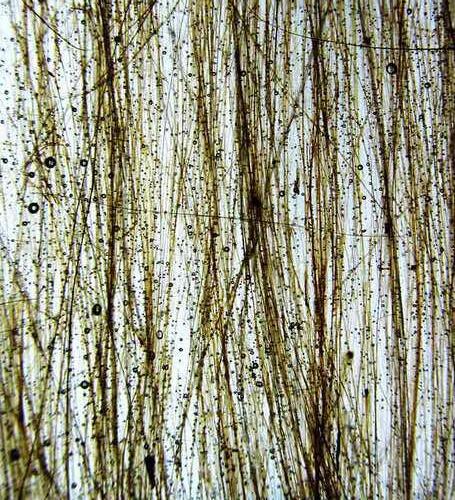
Fig. 1.10 Microscopic image of hemp fibres.
Natural Fibre Reinforced Composites
During the last decade there has been a growing interest in the use of natural fibres in composites because of their lower cost, their low specific weight that contributes in their bending stiffness, as well as for their ecological benefits.
Even tough the material properties of natural fibres are considerably lower than the ones from glass fibres, recent development on their treatment by removing the lignin between the cells has allowed to improve their performance
considerably. Flax and hemp are the most commonly used in the fabrication of composites because of their tensile strength and their elastic modulus, and have been adopted in the automotive industry. However, jute is more widely available thus cheaper and its performance is still admissible for some applications. The principal difficulties related to the use of natural fibres is the variation of their mechanical behaviour depending on their origin and the absorption of moisture that has an impact on their strength.
Left Fig. 1.11 Comparison between the material properties of natural fibres.
J: jute
H: hemp
S: sisal
F: flax
R: ramie
Construction Techniques
Current Construction Techniques with Loam
Rammed earth is one of the most used building techniques in both hot and cold climates. Moist loam is poured into a formwork in layers (15 cm) and then compacted by ramming up to 50% of its original height.
The formwork usually consists of two parallel walls separated and interconnected by spacers. Refined formwork systems and electrical or pneumatic ramming reduces labour input
significantly, however, the cost of this formwork is generally quite high. Rammed earth achieves high levels of compression strength, however its insulation values of 1.9-2.0 W/(mK) are not sufficient to provide the levels of thermal insulation required in cold climates.
(Fig. 1.14)
Other construction method is building with pressed stabilised earth blocks. Different kinds of blocks are produced in relation to the mixture adopted. Bricks are produced by using
Right
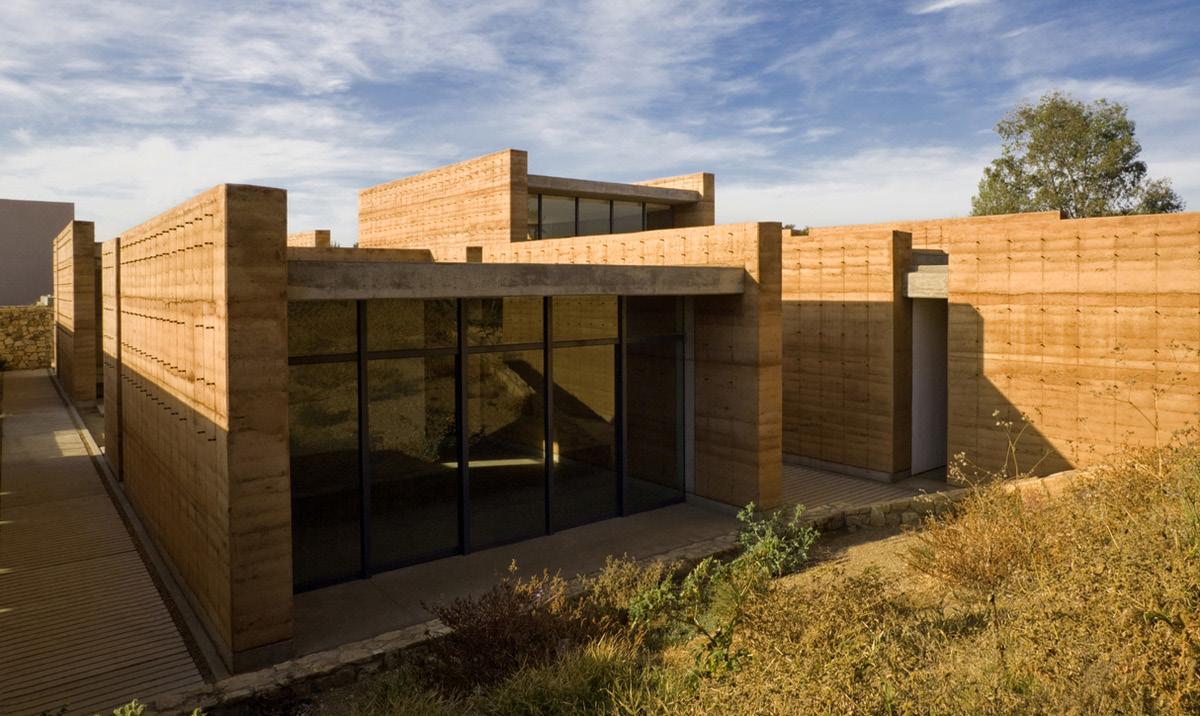
Fig. 1.12 Taller de Artes Visuales, Oaxaca, Mauricio Rocha, 2007 - 2008
Water resistance: Stabilization 15 % cement + metallic roof
Design limitations Walls, blocks and panels
Formwork module
Labur input efficiency 2-10 h/m3
Maximum strength
1.8-8.0 MPa
Ground
Thermal insulation
0.9-1.3 W/(mK)
Heat storage High
Above left Fig. 1.13 Rammed earth, construction diagram.
Below left
Fig. 1.14 Analysis of rammed earth opportunities and limitations.
Shrinkage Low
Rammed earth
a block press and a mixture of wet loam sand and cement, the bricks are then dried in the sun. Regarding the mechanised press: the level of compression defines the strength of the product.
These techniques provide significant structural performances, however design opportunities are limited to compression-only loaded structures such as walls and vaulted constructions. (Fig. 1.17)
In terms of design wet loam techniques presents high opportunities. Wet loam can be formed
directly without intermediate processes into any designed shape since no other external tools are required. Many processes couple wet loam techniques with skeleton structures made of branches or bamboo, as in the wattle-and-daub technique.
Since these techniques are very labour-intensive, various attempts have been made to use spraying machines to apply mixtures. Otherwise, the composite is generally spread in layers 2-4 cm thick and pressed. Plastic loam needs high clay content to achieve the necessary plasticity to be modelled resulting to high shrinkage ratio.
Right
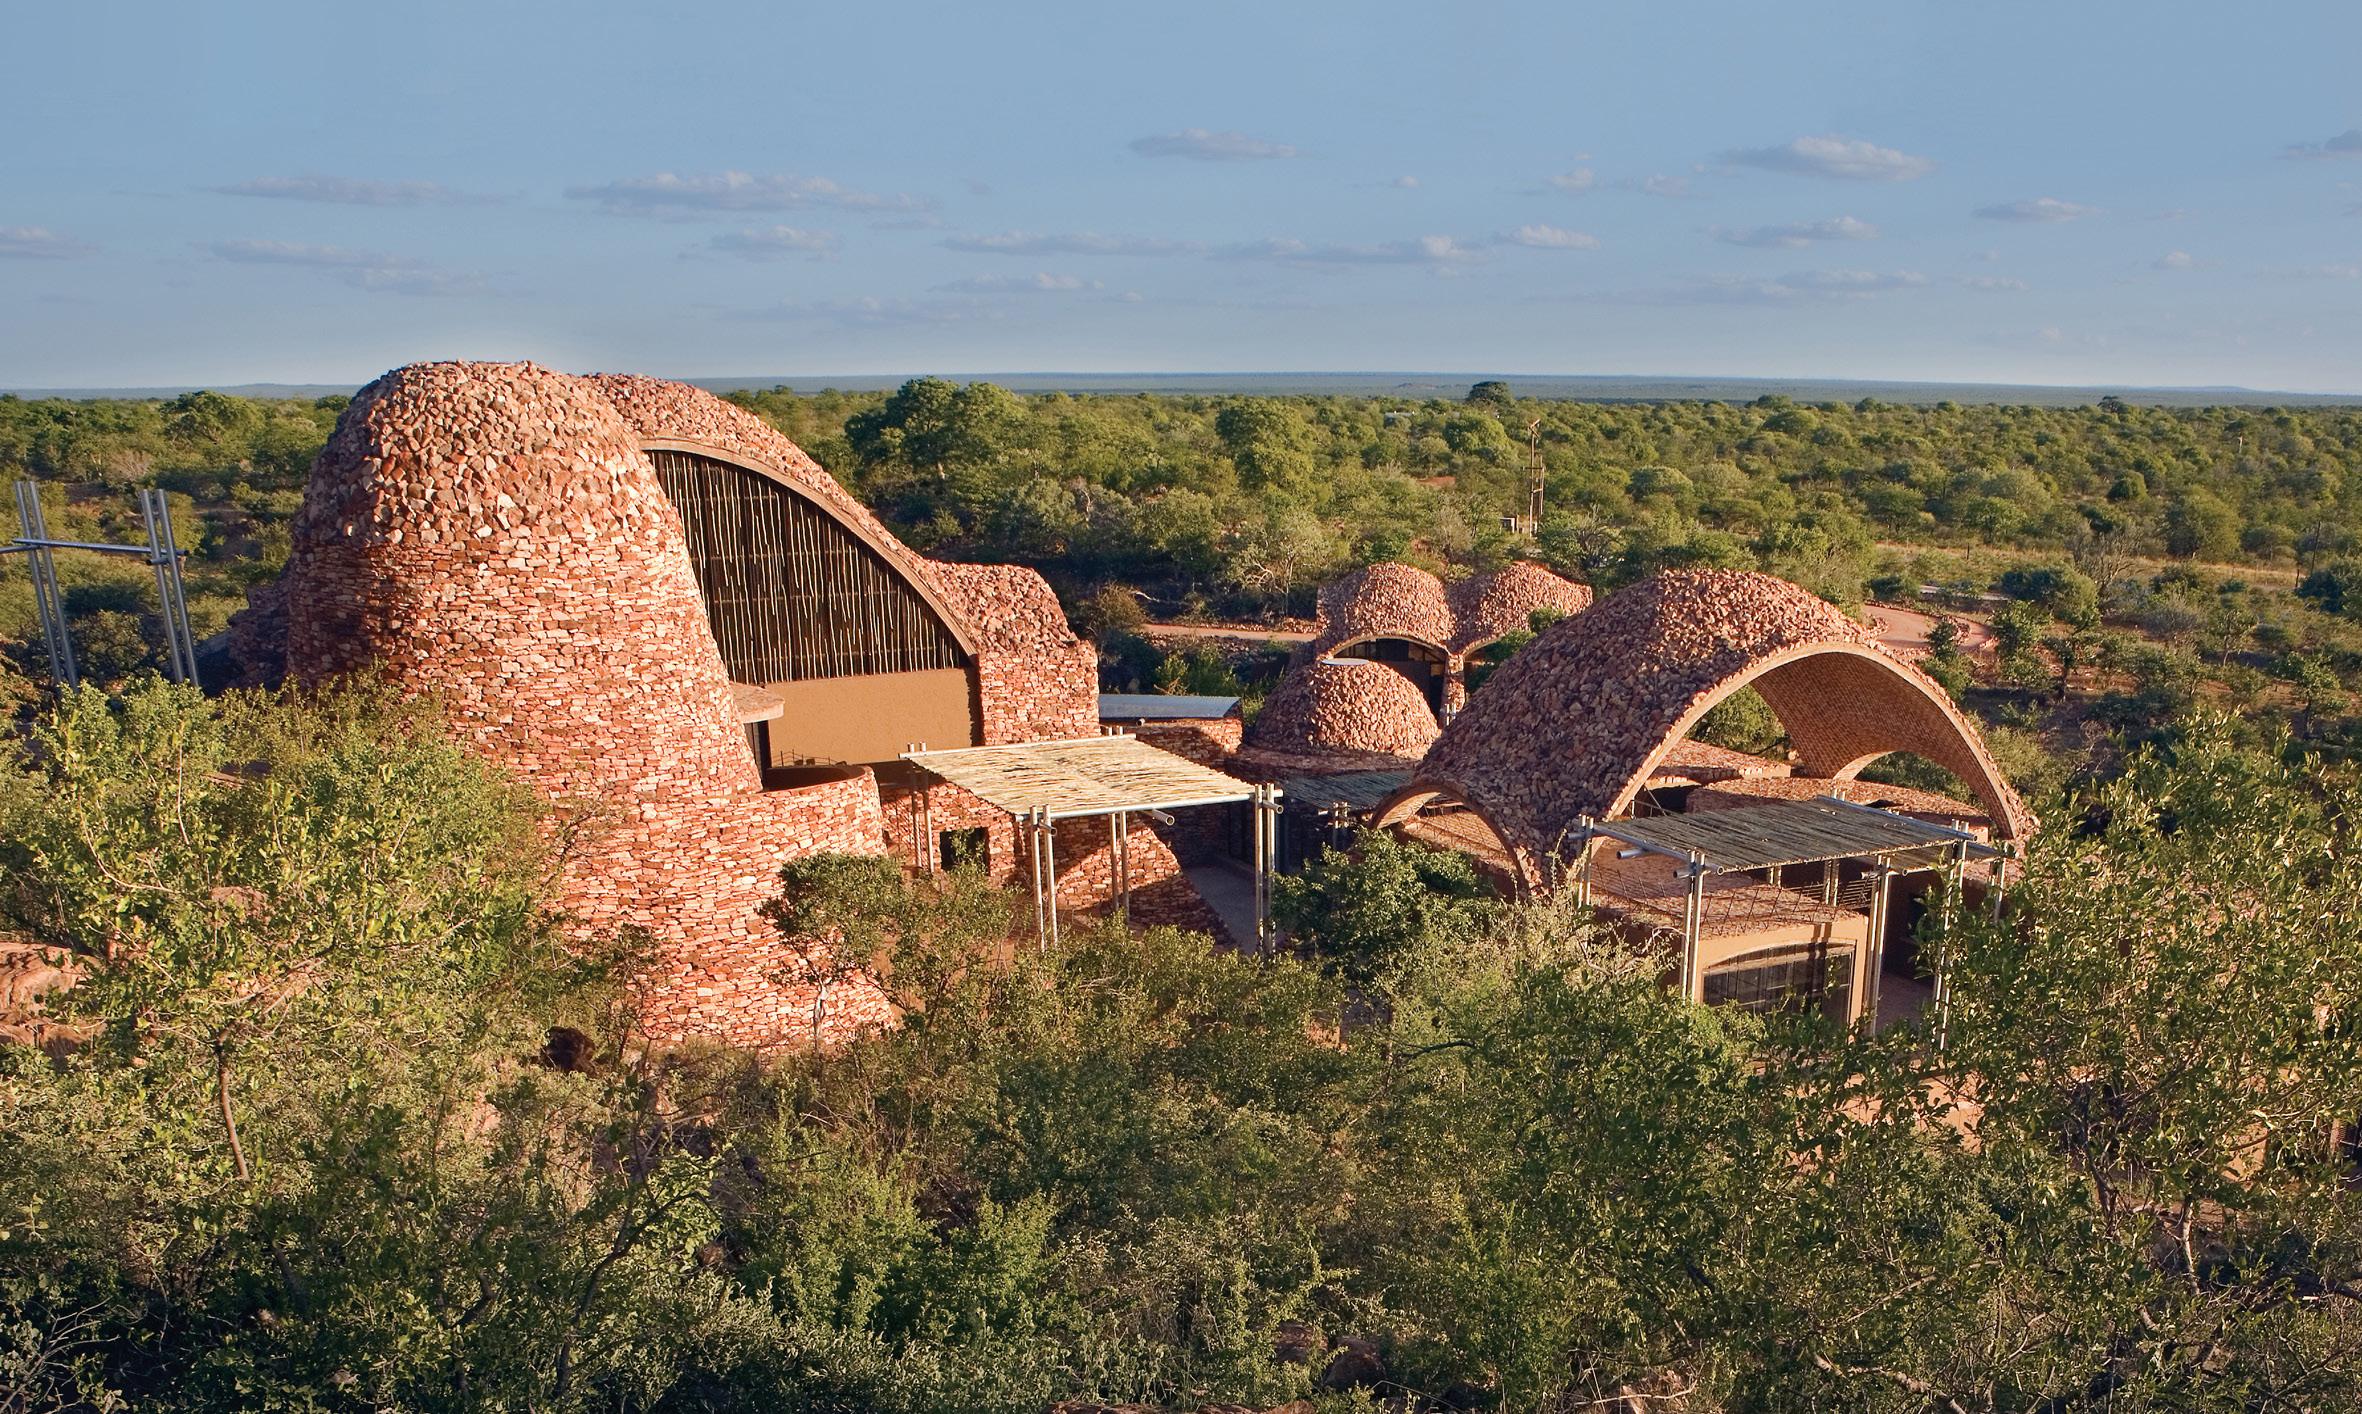
Fig. 1.15 Stabilised earth tiles in the vaults of the Mapungubwe Interpretation Centre, Peter Rich Architects, 2005-2010.
Structure
Covered Area (2 750 m² ) Catalan vaults: max. span 14.5m Vault thickness: 30cm
Construction Method
Construction Method 2 layers of bricks applied on timber falsework
Observations
Thermal and acoustic comfort: comfort
Durability: good
Construction time: -
Water resistance: Stabilization: Gypsum mortar and stones on the outer layer.
14.5 m Second layer of bricks
Design limitations Walls and vaults
Labur input efficiency 300/500 blocks per day (per person)
Maximum strength
2.0-4.5 MPa
Thermal insulation
0.5-0.8 W/(mK)
Heat storage Medium
Above left Fig. 1.16 Diagram, construction of the Guastavino Vaults.
Below Left Fig. 1.17 Analysis of compressed earth blocks opportunities and limitations.
Shrinkage Medium
Formwork
layer of bricks
Recent research investigates the material composition for earth casting. Lightweight loam is poured into a formwork as it occurs with concrete. Several techniques use cement or lime as stabilisers.
Most renown processes are Cast Earth, by H. Lowenhaupt and M. Frerking (1990), which integrates calcinated gypsum (15%) for stabilisation removing any use of cement; and Cematerre, developed by A. Lefebvre (2008) as a composite of clayey loam, cement and lime to which recycled concrete aggregates are added.
(Fig. 1.18 - 1.19 )
Technologies used by concrete and ceramic industries can be transferred to the field of earthen construction: striking results have been obtained by the use of deflocculating agents (Sodium silicate, Polyacrylic acids, 0.5%) for the dispersion of the colloidal fraction of earthen materials and then reduce to the minimum the water content.
Experiments leaded to high values of compressive strength (4.8 MPa), negligible shrinkage and levels of viscosity comparable to those of vibrated concrete.
Right
Fig. 1.18 Poured earth used in the House in Borrego Springs California, by LSSA, 2006.
Binding between inner and outer modules
Formwork module
Bracing
Poured earth
Structure
Covered Area (1h78 m² ) Wall thickness: 30 - 40cm
Construction Method
Formwork modules width 40cm
Compacting method: Vibration 24h
Observations
Thermal and acoustic comfort (k: 0.85), (walls 50 dB)
Durability: good
Construction time: 1h/m²
Water resistance: Stabilization
10 % cement + metallic roof
Design limitations Curved walls and vaults
Labur input efficiency 1h per m2
Maximum strength 2.0-4.8 MPa
Ground
Heat storage Medium
Above left Fig. 1.19 Diagram, construction in poured earth.
Below Left Fig. 1.20 Analysis of poured earth opportunities and limitations.
Thermal insulation High
Medium
Shrinkage
Above right
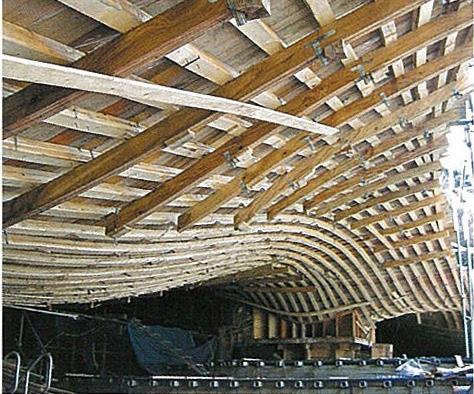
Fig. 1.21 Images of the formwork for the Crematorium in Kakamigahara, Toyo Ito.
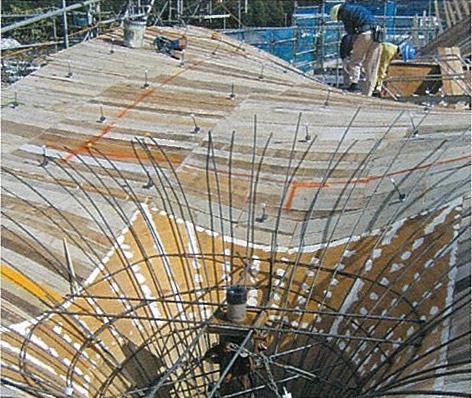
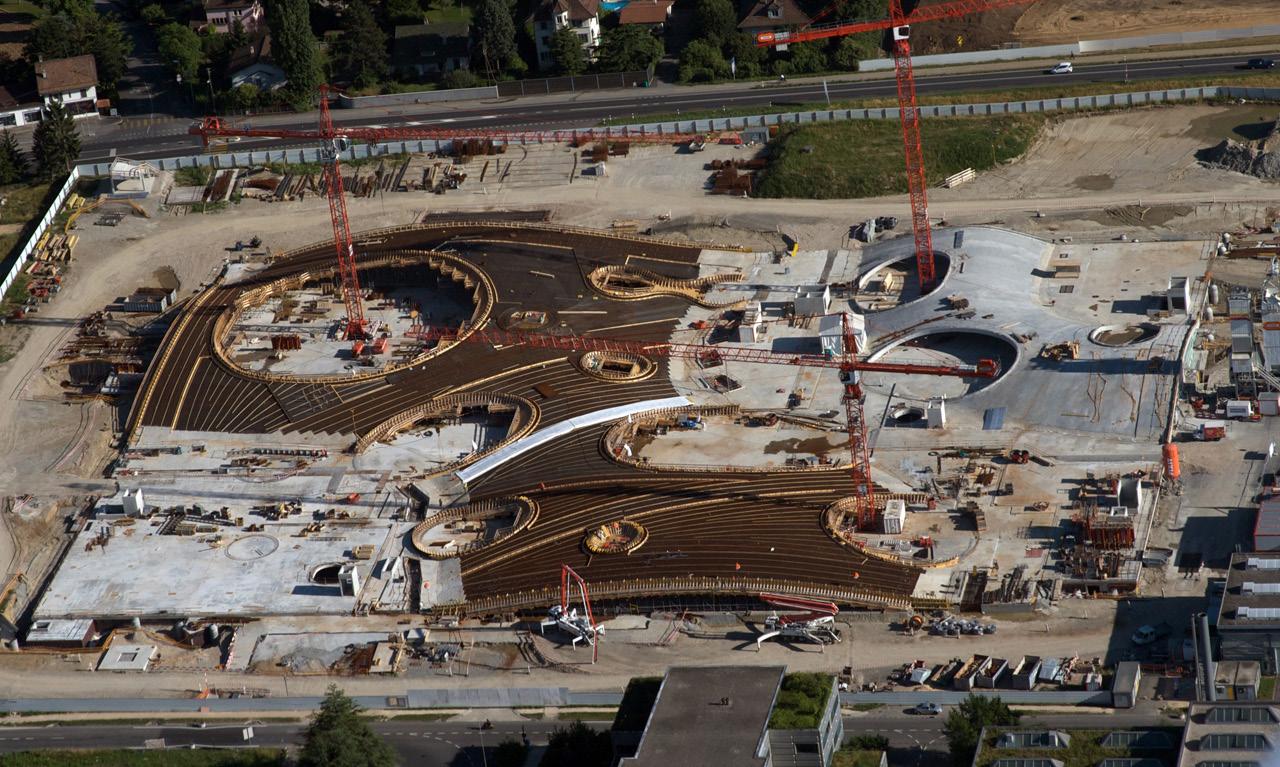
Below right
Fig. 1.22 Images of the reinforcement over the formwork on the Rolex Learning Centre, SANAA.
Construction Techniques Applicable to Loam Fabric Formwork
Fabric formwork can reduce the use of material consumed in the fabrication of moulds and can contribute to lessen the cost of production. The increasing availability of resistant fabrics on the 1960’s catalysed the research on fabric formwork that had already been explored in Roman times by Vitruvius and later at the Industrial Revolution. Miguel Fisac’s concern with the texture of cast concrete “shuttering with boards and borrowing the wood-grained quality of the surface to imprint it, inappropriately, onto the concrete” led him to develop prefabricated fabric formed wall panels. Separately, in the early 80’s Kenzo Unno developed a low construction method by using plastic nets for concrete formwork. (Veenendaal & Block, 2014)
Flexible formwork enables to distribute material according to structural requirement, casting with variable cross section, to further lower the material consumption. Additionally, while working with concrete, the fabric allows the water to drain while curating which results on having high quality surface hardness and finish.
Regarding the fabric, the tensile strength of warp and weft have to be sufficient to support the weight: geotextiles, polyester and lycra have been used. Research states that introducing reinforcements for variable cross sections into this system can be difficult and time consuming, consequently, some explorations have taken
a trajectory towards the use of carbon fibres acting as both reinforcement and formwork. An experiment to use flexible formwork with rammed earth has been developed by The research program at the University of East London. To build a 35cm thick wall, polypropylene with a tensile strength between 9 and 22 kN and an elongation capacity between 15% and 28% in both warp and weft was used. The deformation of the flexible formwork was controlled by bolts and ropes, however since the earth is not at a very plastic state there were small variations in the form. (Chandler & Keable, 2009).
Spraying earth
Spraying wet concrete pumping it trough a nozzle is a technique that has been more widespread in the last thirty years. Its equivalent using earth is called Pneumatically Impacted Stabilised Earth (PISE) and sprays earth through high air pressure to a single sided formwork. Despite the necessity of more costly equipment, this technique is highly efficient in terms of labour input since it enables to build 100 m² of a 45 cm thick wall in one day. However, on the one hand the mix applied in PISE contains a larger proportion of dry cement than rammed earth to avoid shrinkage and on the other it is stated that it requires skilled labour. On going research is attempting to reduce the ratio of cement on the mixture as well to refine the design of the formwork.
Case Studies
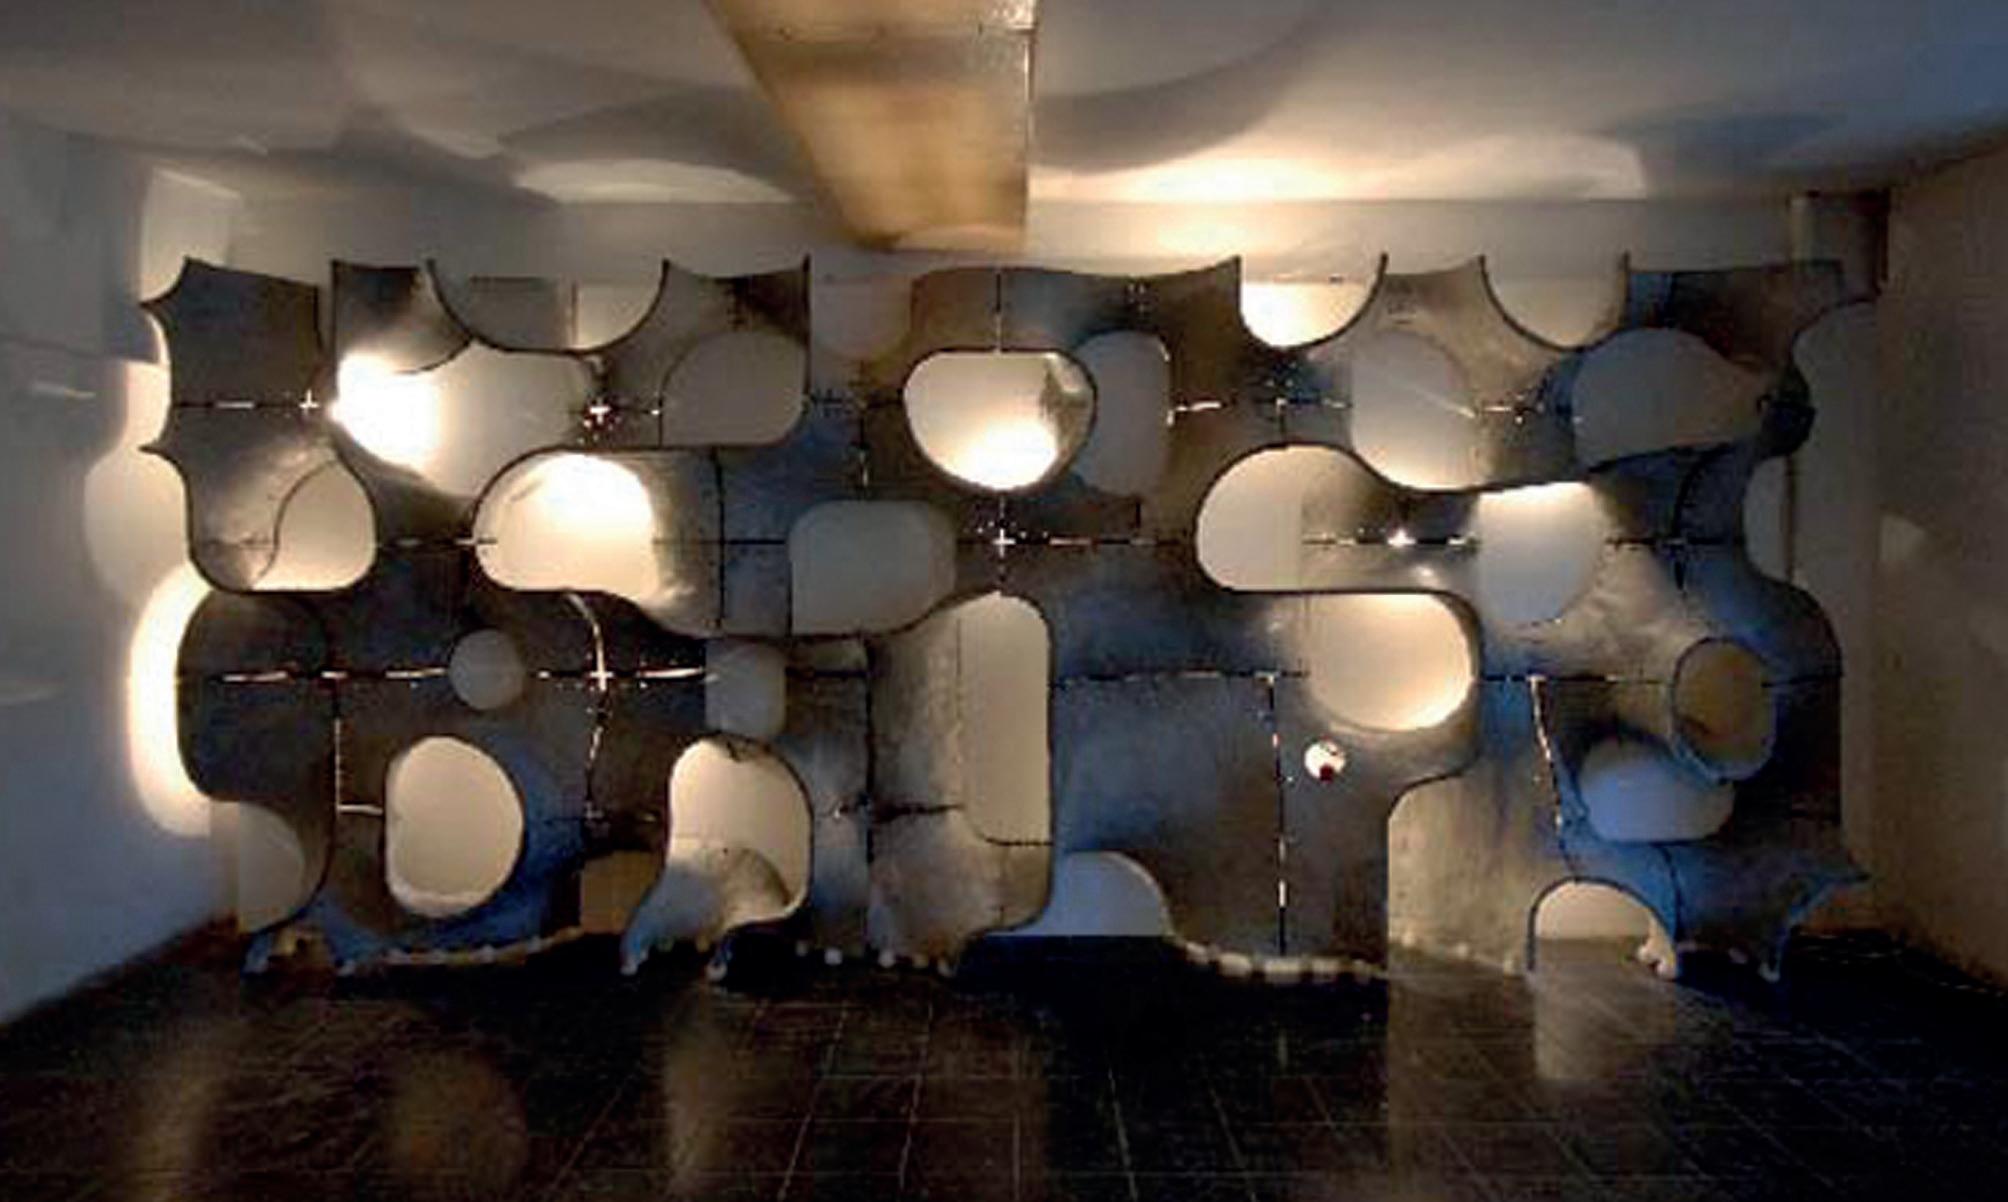
Twisting Concrete Modules
Shin Egashira, Hooke Park, 2011
Fibre cement double curvature modules can be assembled into building elements forming walls, furniture or landscape elements. The double curvature of the shells gives them structural integrity making them self supported. Each individual module is defined by curves drawn on each face of a cube. The curves define a template that becomes the formwork where a surface is stretched and the shell
cast in fibrocement. By applying this system it is possible to vary the functions within a surface just by adjusting and controlling the relationships between the curves that define the individual modules. A continuous surface that can develop from being a barrier to generate passages and light control without losing its expression and structural logic. What distinguishes this system from a conventional fence and what makes it variable is its depth. The foreground defines a clear structural line that forms openings and closures, but it is
4 Fibreglass reinforced concrete is cast in the fabric.
5 The fabric and the wooden frame are removed when the concrete is dried.
6 The module is jointed to other ones thanks to plastic cable ties.
Description
Geometry: Minimal surface (anti-clastic)
Dimension: 1 x 1 x 1 m.
Material composition: Fibreglass reinforced concrete.
Material Application: Casting.
Formwork: Stretchable fabric.
Kind of formwork: Removable.
Boundaries conditions: Wooden frame.
Joints among elements: Cable ties among the modules.
Observations
1 Necessity of a continuous frame to stretch the fabric.
2 Anti-clastic surfaces only.
3 Reinforcement introduced on the mix.
4 Defined geometry of the boundaries enables aggregation on all directions.
Left Fig. 1.24 Frame of a single module. Process of construction, analysis and opportunities.
Cast fibreglass reinforced concrete
Common curve between two modules
Stretchable fabric
Wooden frame
the relation between the foreground and the background line that controls its porosity. The design decisions become limited in the overall form of the combination and the puzzle designs itself by following the basic rule. In terms of fabrication what is systematic is the components that generate each individual module and not the module itself. A set of templates that can be put together in different combinations according to the whole panel. Within this system, software is capable of calculating the necessary combination of curves if given a starting line path across the whole surface.
Cable-Net and Fabric Fomwork Hypar Block Research Group, 2014
The project aims on the one hand, to build a structurally optimised hypar shell with a composite of concrete and AR-glass textile reinforcement with fabric formwork and no
internal falsework as close as possible to a designed model. On the other, to present a workflow that combines computational and physical models that can be applied into other anti-clastic shell structures. Through the definition of a target geometry the boundary conditions of the frame, the patterning of the fabric and the cable net topology that can be mapped into the surface are determined. Considering the load cases, self-weight of the formwork and the concrete, the shape is optimised to minimise the deflections. In order to proceed with these optimisation the control points of the surface are parametrised and their movement is restricted within a bounding box that guarantees that the geometry will remain anti-clastic. The cables follow the principle stress lines and their density is quantified in order to reduce the demands of the secondary fabric. Applying dynamic relaxation the length of the cables is calculated to achieve minimal deformation of the cast geometry instead of its usual application in form-finding.
Right
Fig. 1.25 Hypar cables net covered by removable geotextile.
Construction Process
1 Construction of a wooden frame.
2 Metal cables are connected to the frame and pre-stressed.
3 A geotextile fabric is placed on the cable mesh.
4 Fibreglass reinforced mortar is cast in the fabric.
5 Fabric and the cables net are removed when the concrete is dried.
Removable cables net
Removable geotextile fabric
Description
Geometry: Hyperbolic paraboloid.
Dimension: 2 x 1 x 1 m.
Material composition: Fibreglass reinforced concrete.
Material Application: Casting and spreading.
Formwork: Geotextile on cables net.
Kind of formwork: Removable.
Boundaries conditions: Wooden frame.
Joints among elements: Not present.
Observations
1 Necessity of a continuous frame to pre-stress the cables.
2 Anti-clastic surfaces only.
3 Reinforcement introduced on the mix.
4 Use of pre-stressed cable net to reduce the amount of demand of the secondary fabric formwork (strength, pre-stress and pattern requirements).
5 Shape optimisation, controlling the height of the vertices to minimise deflection instead of form finding under self weight.
6 Reduce the loads by curing the shell in stages.
Left Fig. 1.26 Hypar cables net covered by removable geotextile.
Cast fibreglass reinforced concrete
Wooden frame
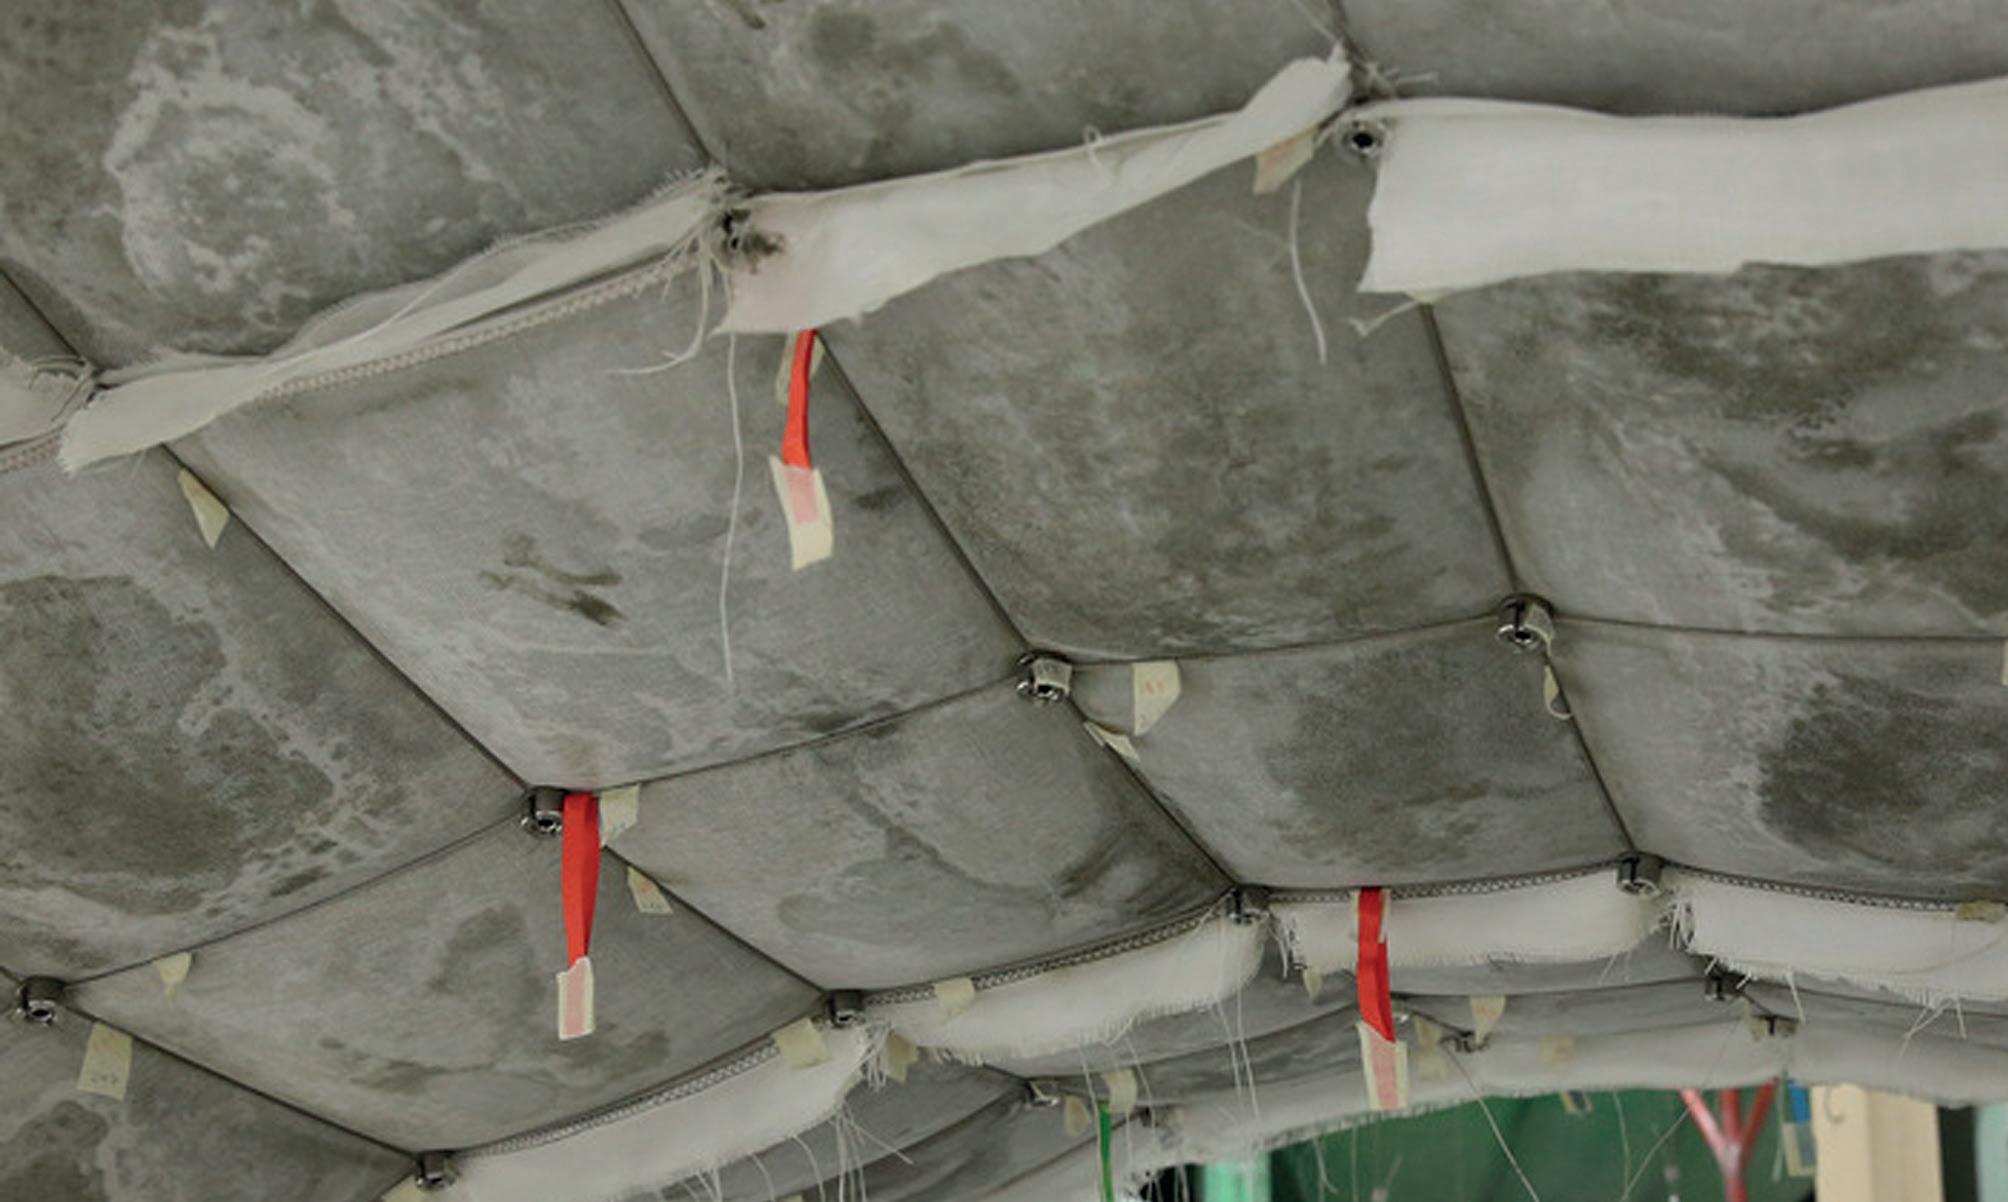
Inverted Catenary Modules
AA Lyon Visiting School, 2014
The visiting school in Lyon examines new methodologies to renovate earth construction processes through the integration of digital design and new fabrication techniques. First, digital exploration is introduced for the analysis and implementation of the design process to integrate new form-finding techniques and optimise the behaviour of free-form structures. Second, the experimentation involves new machines and robots to push forward the fabrication process. Projects are developed at different scales to fully understand the material capabilities. Pre-fabricated modules 1x1m are tested using pulled fabric as both lost and removable formwork for different layers of earth. Fabric is initially immersed into a watery mix of clay. Then different coatings of earth with distinct mixtures are layered on the formwork. Sheets of jute fabric are interposed
between the earth layers to strengthen the all material system. Earth layers are left to dry one day before proceeding to next applications. Flexible bunches of thin bamboos are used as temporary falsework for the pulled fabric as nerves for the vaulted geometries. Some experiments introduce olive oil in the mixture to make the system waterproof.
Conclusions
Three main observations have been extracted from these case studies: achievable geometries with fabric formwork are anti-clastic due to the way a fabric can be stretched, the necessity of a continuous frame holding the boundary of the fabric, the possibility to control the height of the vertices of the geometry as a form finding method instead of the deformation by self weight.
Right
Fig. 1.27 Inverted catenary modules, Lyon, 2014.
Inverted catenary
Earth
Jute
Earth
Jute
Earth
Jute
Earth
Jute
Clay Starch
Spandex
Construction Process
1 Inverted catenary modules are designed.
2 Construction of a wooden frame.
3 Spandex is soaked in barbotine (a mix of water and clay).
4 Applying of several layers of different mix of clay, silt and sand with interposed jute.
5 Removal of lycra and of the wooden frame when dried.
6 Overturning of the module.
Description
Geometry: Inverted catenary.
Dimension: 1 x 1 x 1 m.
Material composition: Earth and jute (layers).
Material Application: Spreading.
Formwork: Spandex.
Kind of formwork: Removable.
Boundaries conditions: Wooden frame.
Joints among elements: Not present.
Observations
1 Necessity of a frame to stretch the fabric.
2 Designed and fabricated as inverted catenary.
3 Layering of reinforcement by patches of jute textile.
Left Fig. 1.28 Diagram, inverted catenary modules and lay, Lyon, 2014.
Spandex
Wooden frame
Spread earth layers
Suitable Geographical Context: Sahel
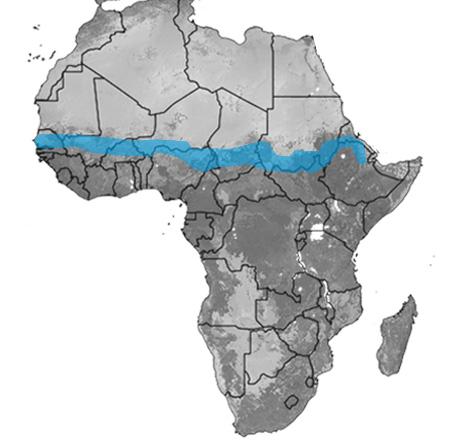
Even though earth constructions are present in over 150 countries with different environmental conditions this research focuses on their application on the Sahel semi arid region. Firstly, the hygrothermal properties of earthen constructions are particularly appropriate for its environmental conditions. Secondly, 95% of the soils of this region are entisols and alfisols this means that clay is widely available in the b horizon at a depth of -5 to -60 cm. Last, there is an existing local knowledge of earth constructions since around 20% of the village
houses are built with dried earth brick walls. Thus, there is a possibility to strengthen local labour force work.
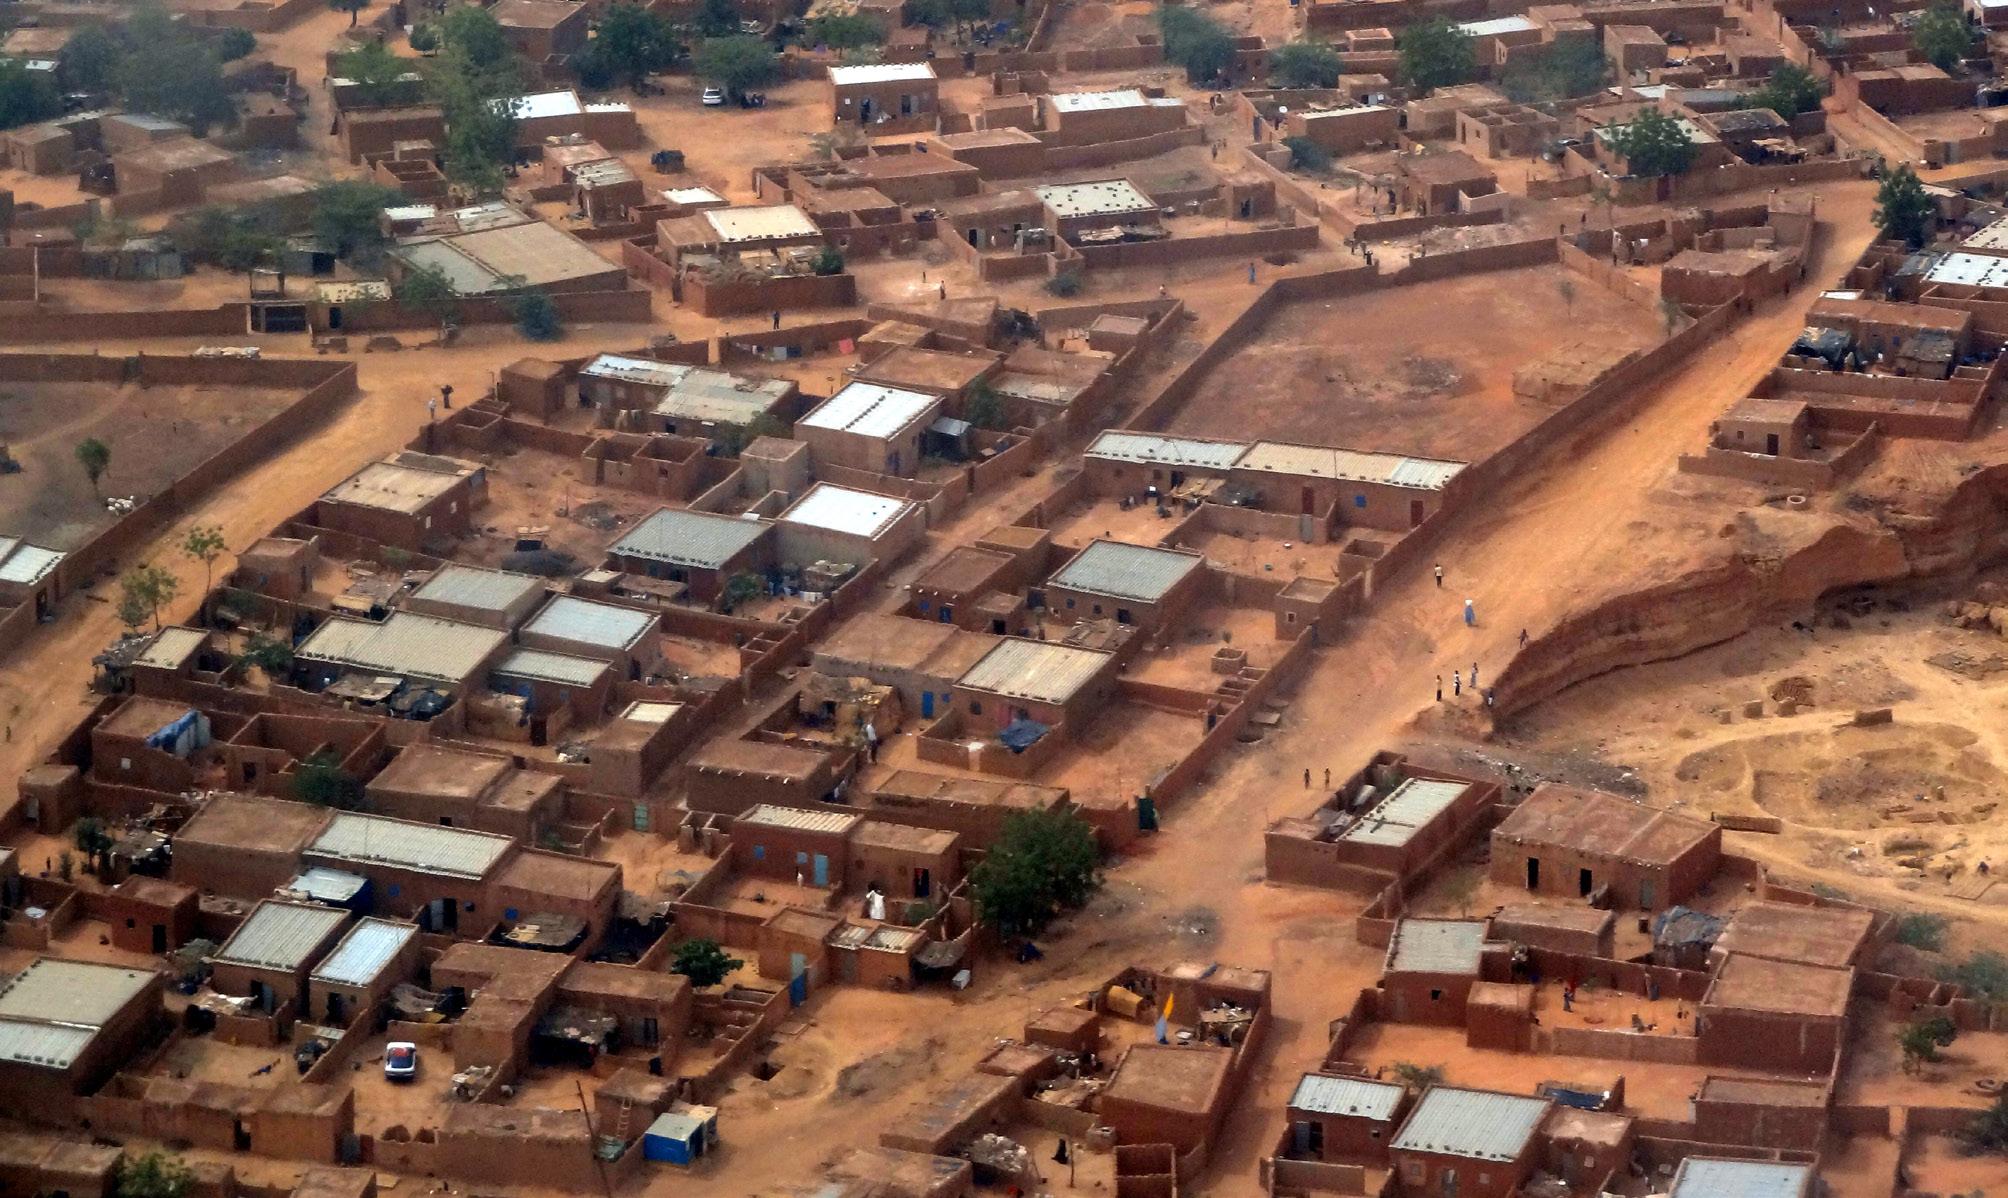
The Sahel has an approximate area of 3.053 million km² and a current estimate population of 150 millions, however the UN estimates that this number will be 4 times higher by 2050. This region has been drastically affected by global warming experiencing more frequent severe drought. An increase of temperature is also foreseen by 2050 of about 3 to 5 degrees. The Sahel is the transition region between Sahara
Right
Fig. 1.29 Aerial view of Niamey Niger fast growing city because of migration.
Area
Population
More than 5 million Semi Arid region
Area
Amount of clay
Between 2 and 5 million High Low
Population
More than 5 million Semi Arid region
Between 2 and 5 million
Amount of clay
High Low
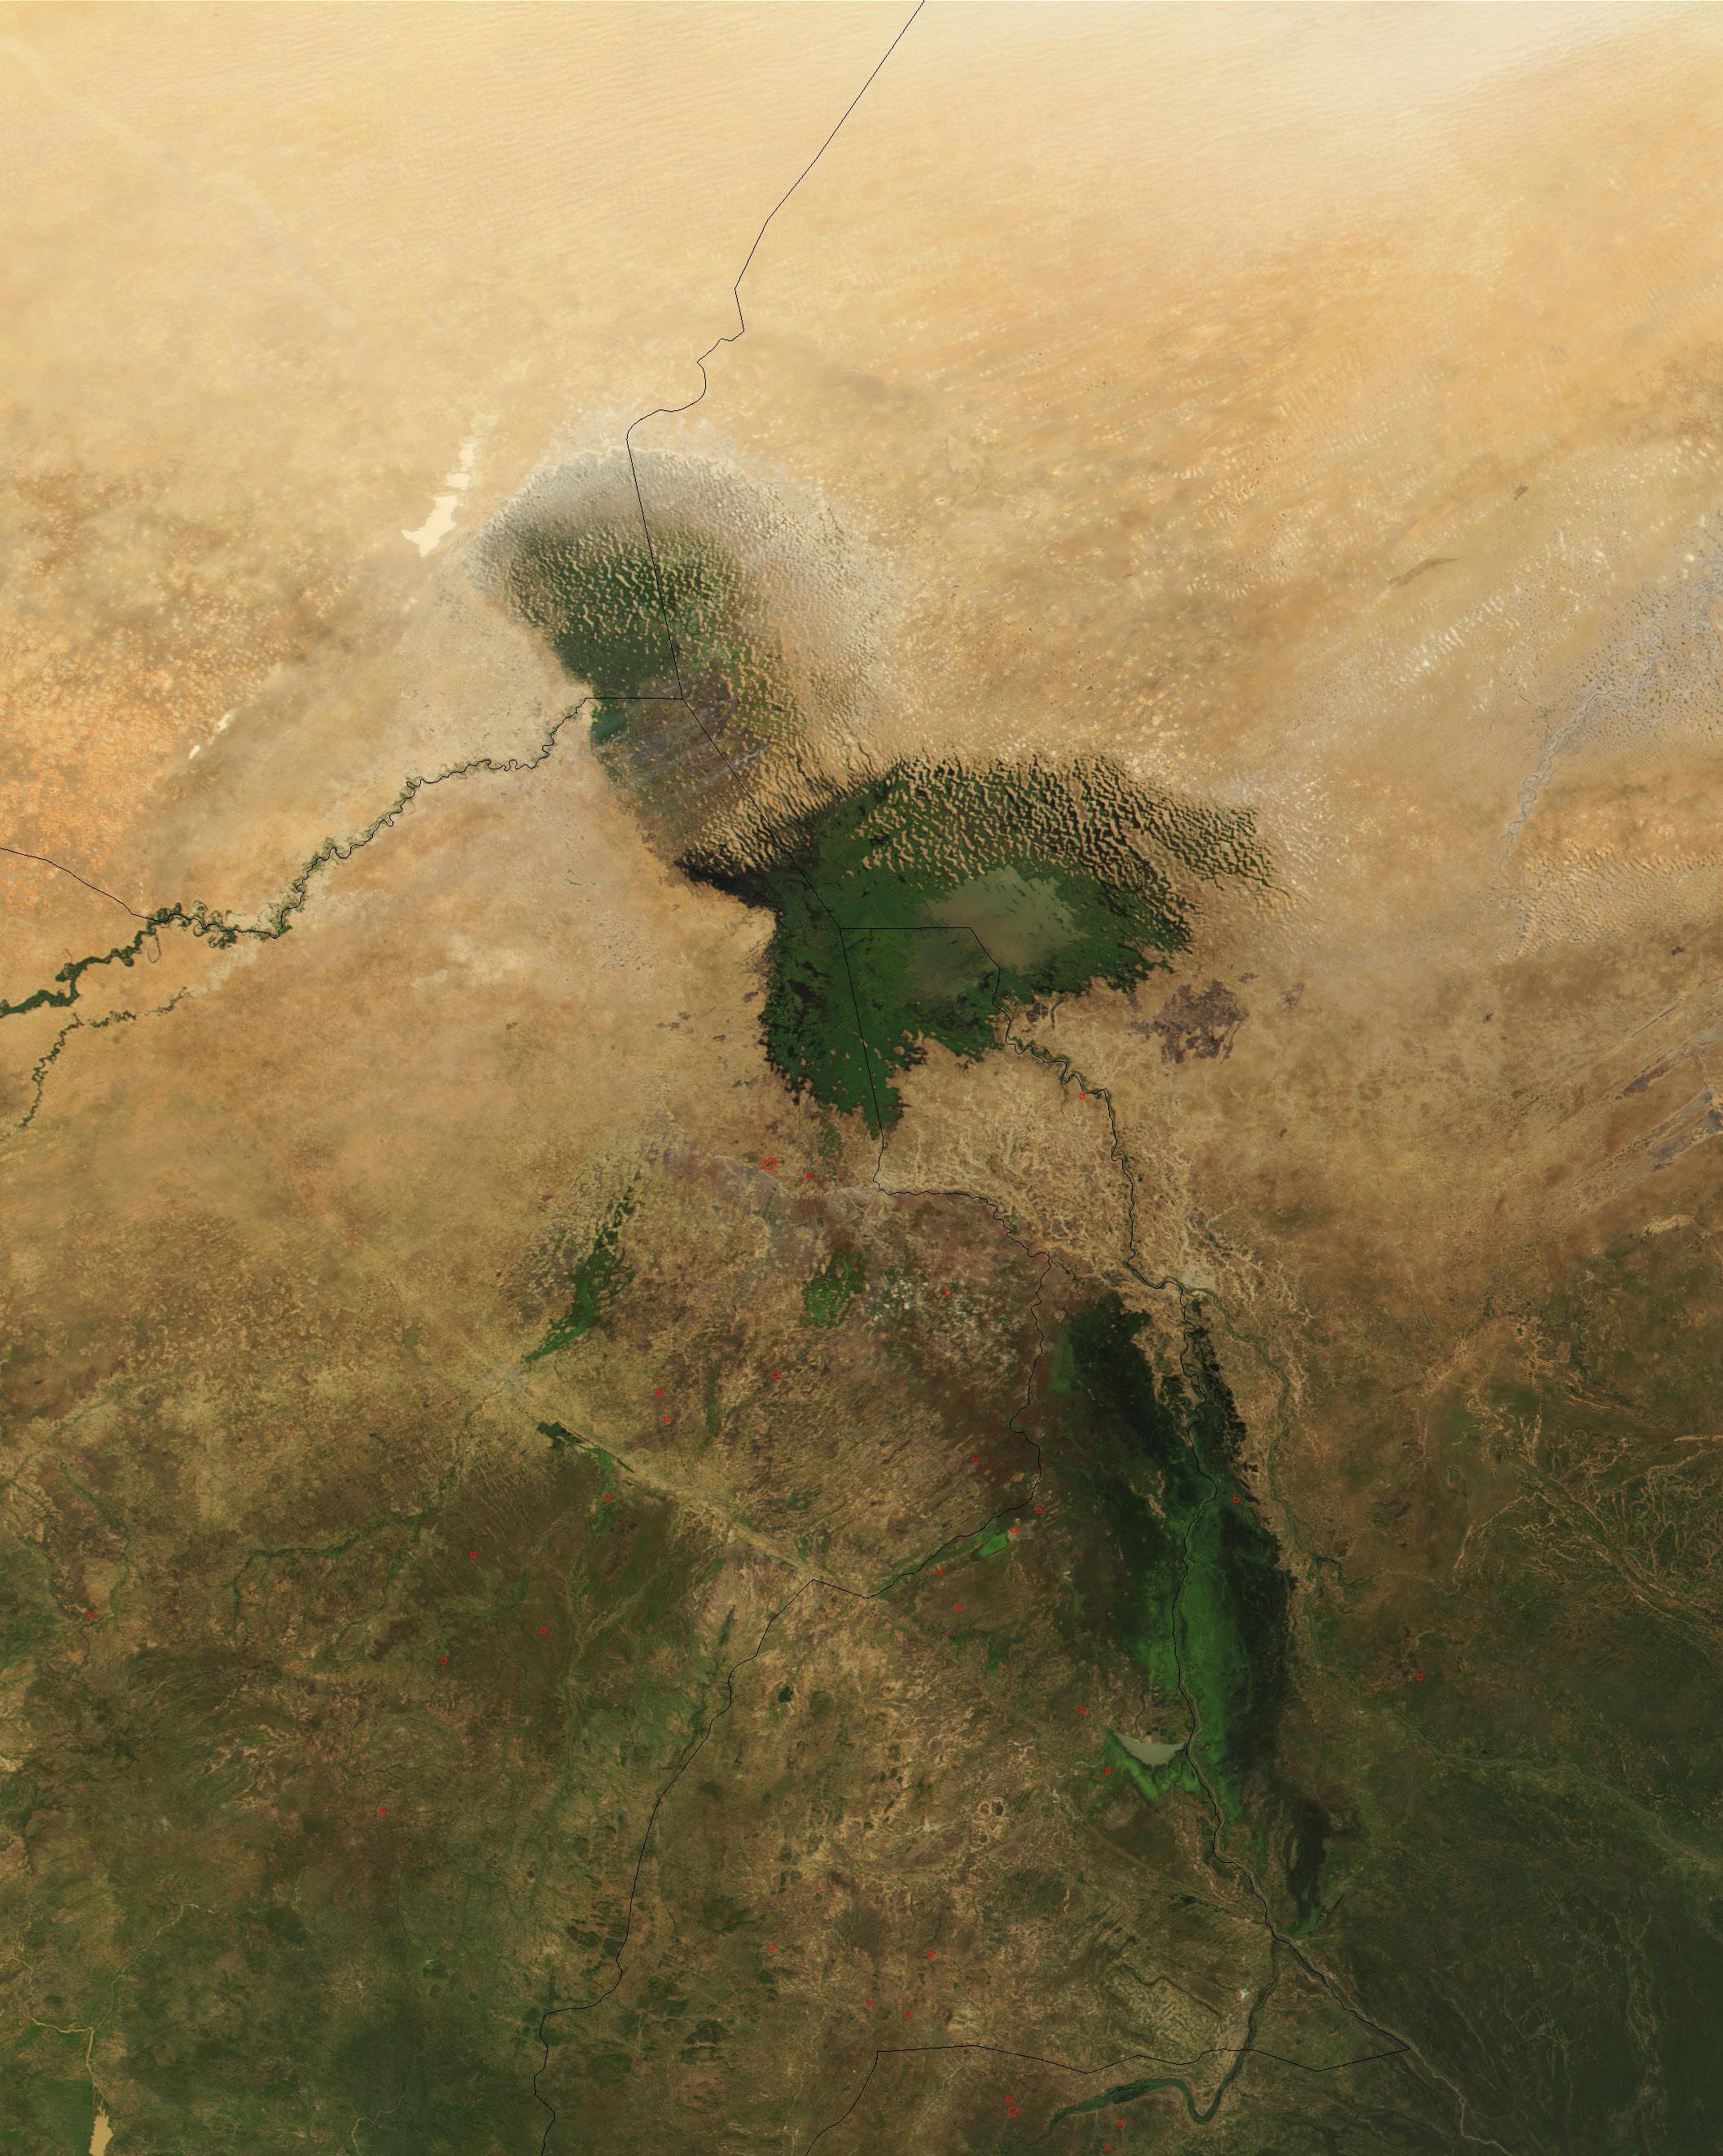
Left
Fig. 1.30 Clay content on the Sahel, the current boundaries of the semi arid region an the fastest growing cities.
Addis Ababa
Mogadishu
Kano
Ouagadougou
Khartoum
Addis Ababa
Mogadishu
Kano
Ouagadougou
Khartoum
Right
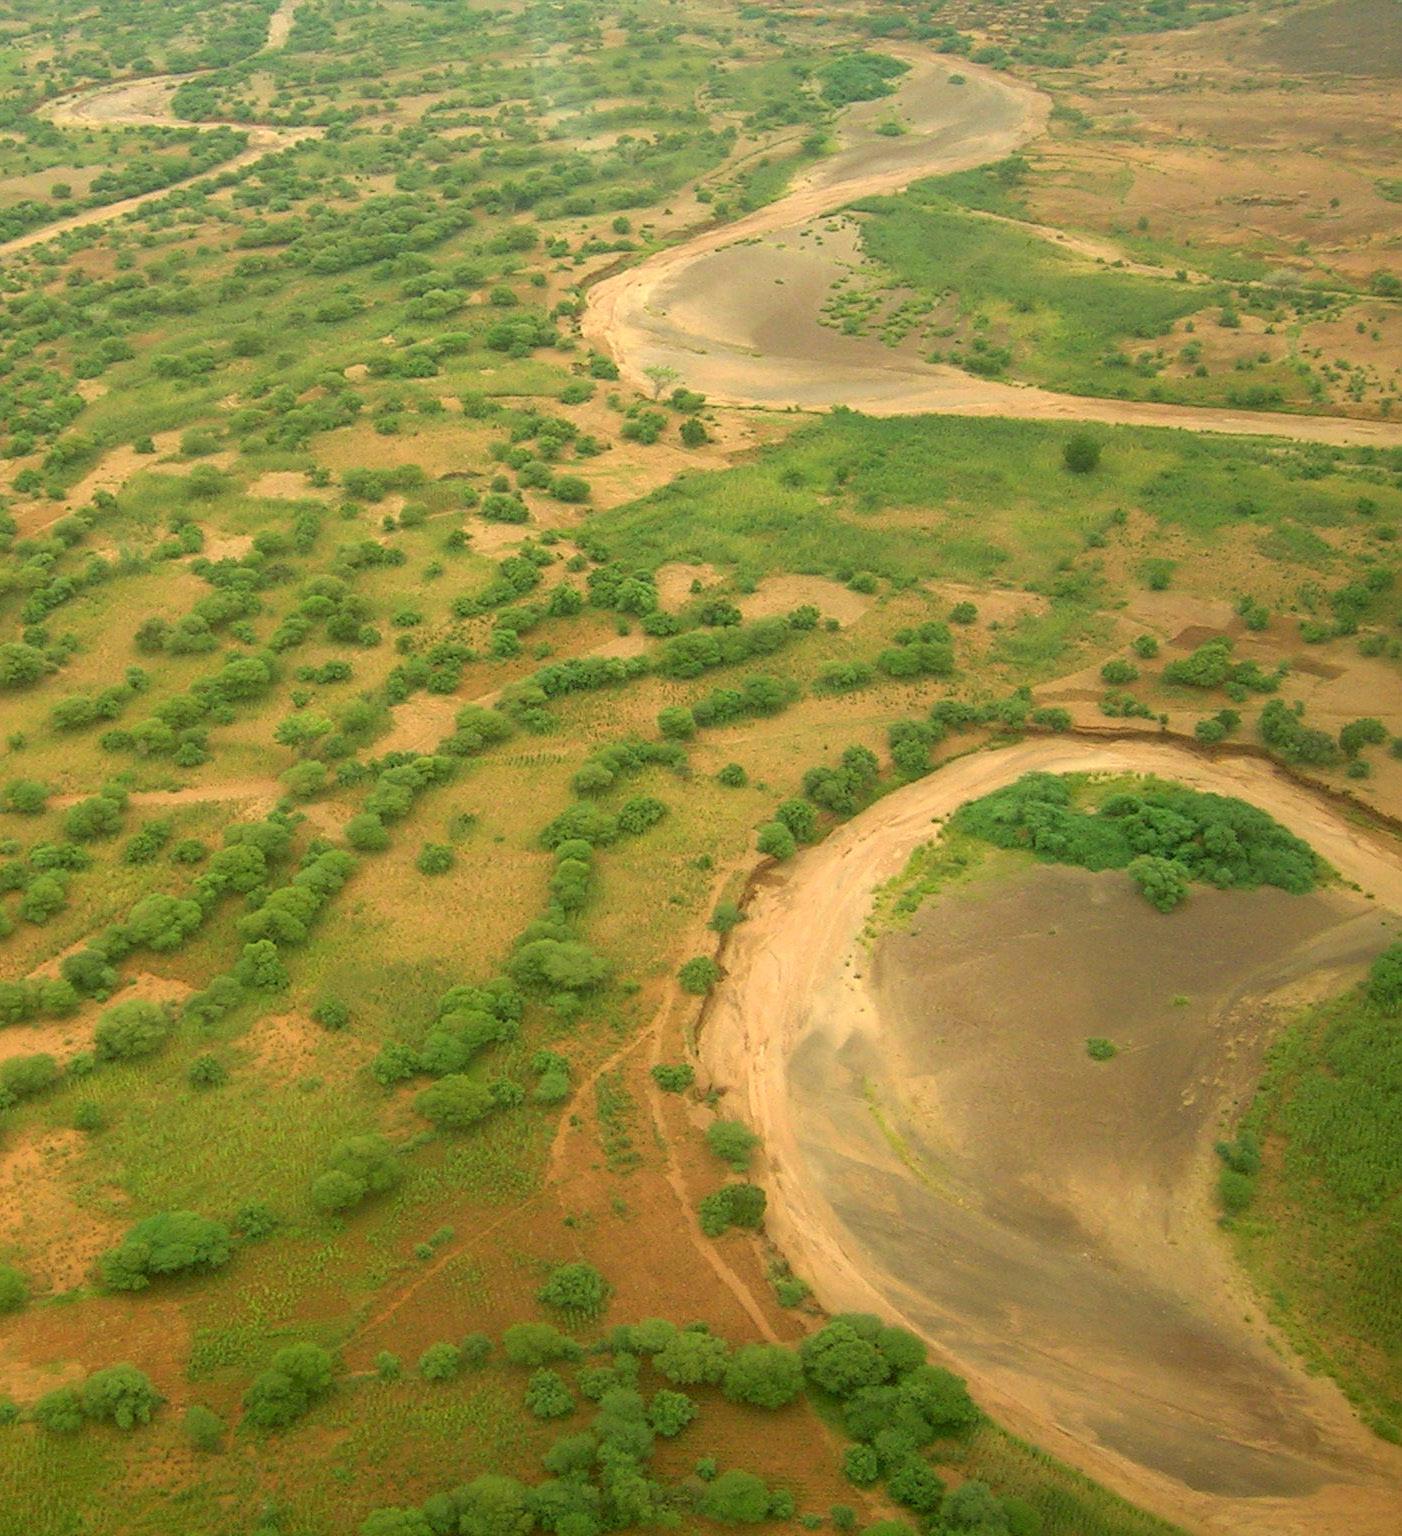
Fig. 1.31 Aerial view of the Sahelian Savannah in Mali.
Desert to the north and the humid savanna to the south.
It is classified as a semi arid climate since its average annual rainfall is between 300 to 600 mm, moreover 70% of the annual rainfall is on the wet season between May and September. Humidity is in average 20% on the dry season and three times higher on the wet season.
The diurnal temperature range is in average 11°, however the temperature is relatively high all year long with an average of 42°C to 31°C in the dry season to between 33°C and 21°C in the rainy season. The mean daytime wind speeds are relatively low in general Below 2.5 m/s.
The raising pressure associated not only to extreme environmental conditions and the scarce of natural resources but also to conflicts has intensified the migrations to urban areas. The involvement of local communities in the construction of the built environment can enhance local employment.
Moreover, the construction of buildings for community use with local available materials like earth can help to strengthen the use of cheap materials for housing. Simultaneously, can discourage the wide spreading of imported materials such as sheet metal roofs that aside from providing low thermal comfort at a higher cost have a life of around ten years.
Conclusions and Design Ambition
On the field of earth construction, current research has been focused on increasing its mechanical properties. By developing new construction methods, durability can be ensured while reducing the labour input and proposing sustainable alternatives for soil stabilisation. Separately, the development of a composite using natural fibres such as jute, can benefit from the increase of tensile strength to improve the structural performance of earth. in addition, the use of fabric formwork can further reduce the material wastage while allowing the optimisation of geometry to improve the structural performance.
Therefore, this investigation aims to contribute, in the consolidation of earth construction, as a sustainable building alternative for the contemporary practice. Through exploring the relationship between geometry and material performance, the research focuses on the development a material system capable to achieve self supporting integrated structures at the building scale that can provide different spatial qualities. The system will be tested in a project for a Learning Centre in the Sahel to evaluate its potential for adaptability to specific environmental and spatial requirements.
Geometry research and form finding
Perfomance oriented design
Material intelligence
Construction process efficiency
Bibliography
Block, P., Knippers, J ., Mitra, N., Wang, W. (2014) Advances in Architectural Geometry 2014. Springer.
Brouwer, R. (2001) Natural Fibre Composites in Structural Components: Alternative Applications for Sisal. Delft University.
Chandler, A. & Keable, R. (2009) Achieving carbon neutral structures through pure tension: using a fabric formwork to construct rammed earth columns and walls. Proceedings of the 11th International Conference on Non-conventional Materials and Technologies. (NOCMAT2009)
Chandler, A., Pedreschi,R. (2007) Fabric Formwork. Riba Publishing
Ciancio, D. & Becke, C. (2015) Rammed Earth Construction: Cutting-Edge Research on Traditional and Modern Rammed Earth. CRC Press.
Eyring, G. & Bull, T. (1988) Advanced Materials by Design; Energy and Materials Program. DIANE Publishing.
Hall, M. , Krayenhoff, M. & Lindsay,R. (2012 ) Modern Earth Buildings: Materials, Engineering, Constructions and Applications. Woodhead Publishing
Lyamuya, P. & Nurul, A. (2013) Earth Construction in Botswana: Reviving and Improving the Tradition. CAA DHAKA 20th General Assembly and Conference.
Minke, G. (2007) Building with earth: design and technology of a sustainable architecture. Birkhauser.
Pacheco Torgal, F. & Jalali, S. (2011) Eco-efficient Construction and Building Materials. Springer.
Rael, R. (2009) Earth architecture. New York : Princeton Architectural Press.
Veenendaal, D. & Block, P. (2014) Design process for a prototype concrete shells using a hybrid cable-net and fabric formwork. ETH Zurich.
Methods
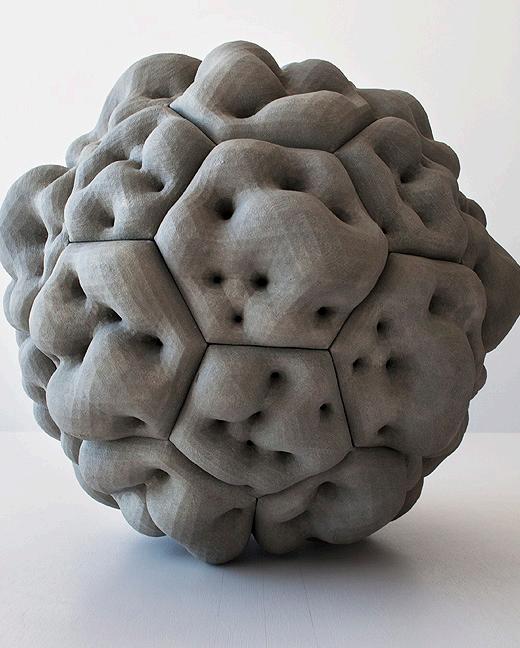
Right
Fig. 2.1 Seed (P_Ball), MATSYS, 2012. University of California, Berkeley Botanical Garden, Redwood Grove.
The chapter describes the methodology and the tools that have been used for the research, the system experimentation and the design process.
The methods defined in this chapter have been used in the sequence which can be observed in the following flowchart. Furthermore, all the techniques are described in order to explain the reasons why specific methodologies have been chosen and the way they have been applied to contribute to the system investigation.
The different methods employed in the research and experimentation complement each other in order to develop an integrated approach for the design process and to understand the interdependency between the morphological aspects and the behaviour of the system to be developed.
Process Overview
Design Workflow
The design workflow is conceived in three stages:
1. Research and data collection. The investigation is based on the state of the art of the relevant explorations conducted in the field of earth construction, material composites and fabric formwork techniques. Case studies have been selected to be studied in detail and inform the technical aspects of the design research. Experiments have been conducted to collect the necessary data which have not been acquired in the initial research.
2. System development. The organization of the system is developed through form finding explorations on the basis of the previous research employing computational techniques. Selected outputs are then identified to be
tested with physical models. The design is conceived as a system, which relies on a set of distinct variables which can be defined in the parametric environment of Grasshopper for Rhino. The simulations are informed with the material characteristics, geometric behaviour, manufacturing constraints and assembly logics in order to enable the process for recurrent evaluation of the system manipulations.
3. Analysis and evaluation. In the context of for morpho-ecological design, analysis is a process of fundamental importance during the entire morphogenetic process to establish and assess evaluation criteria in relation to structural and environmental performance and to reveal the system capacity to enable specific micro-climatic conditions. (Hensel & Menges, 2008)
Methods Flowchart
Research and Data Collection
a. Material Research:
Earth Physical Properties Material Composites
b. Construction Process: Earth Construction Fabric Formwork
c. Membrane Design
d. Case studies
System Development Analysis and Evaluations understanding of the design logic and essential parameters
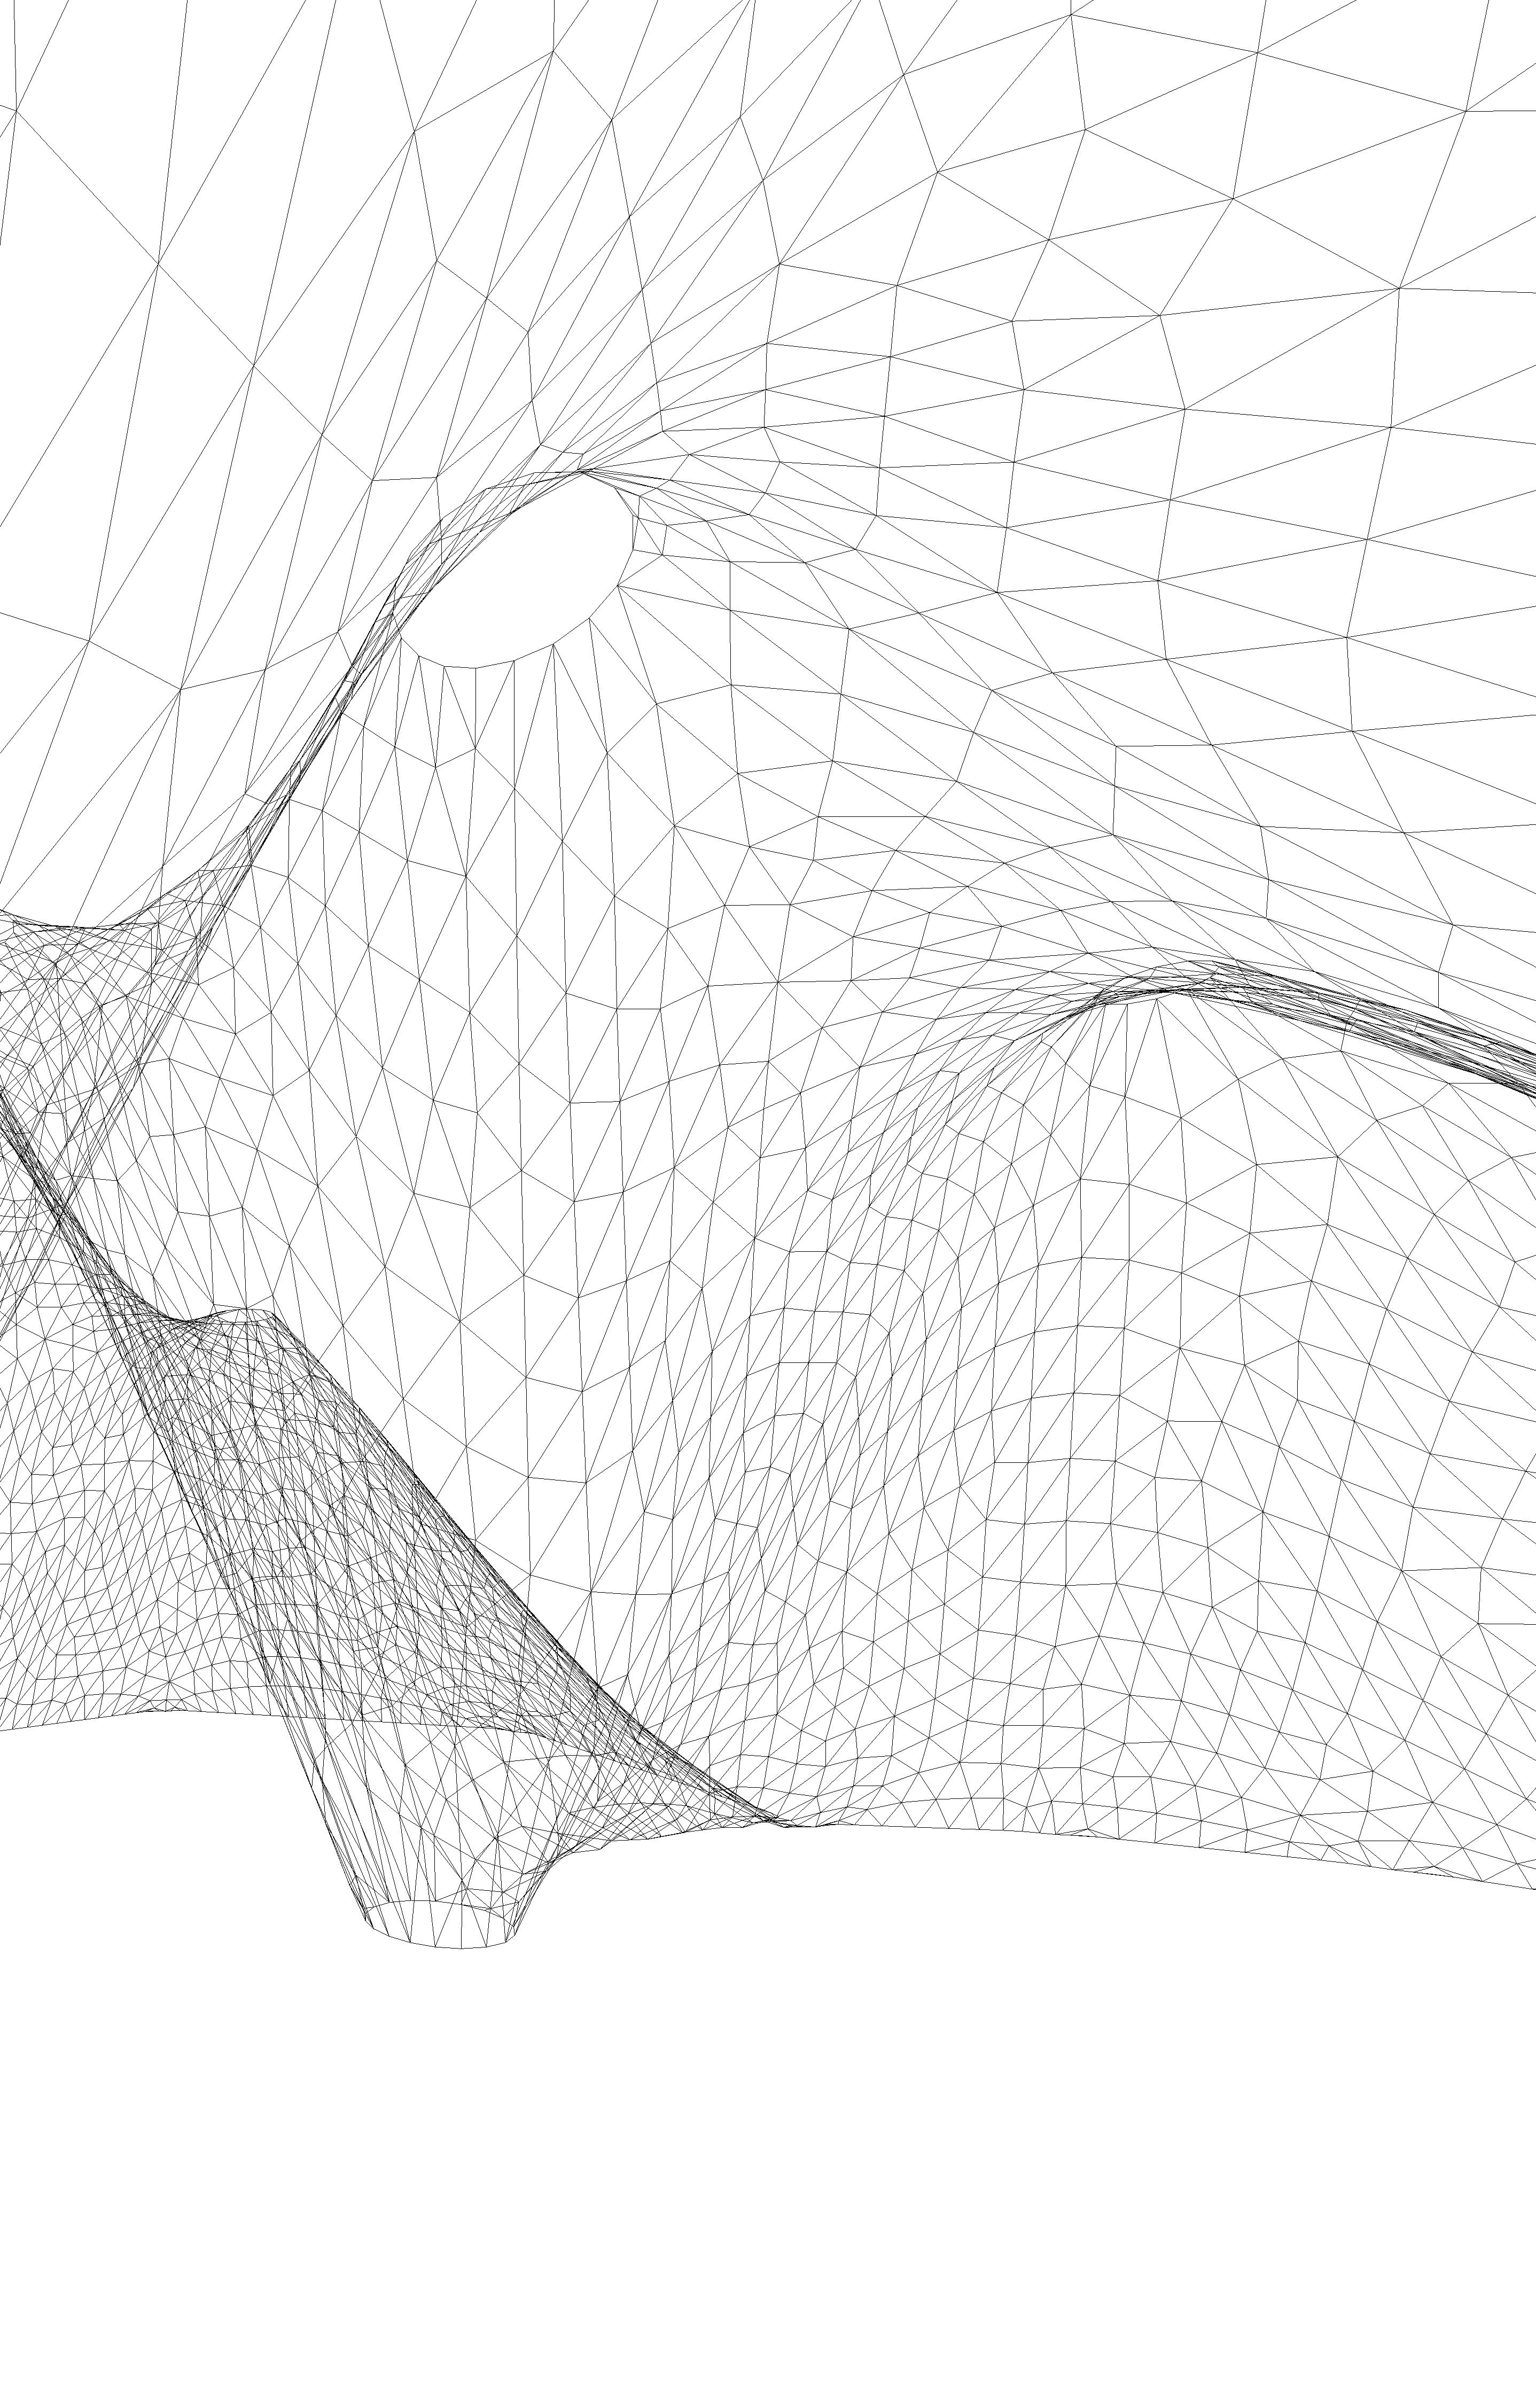
Mesh Relaxation and Form-Finding
Geometry Generation
Physical Test and Prototyping
Genetic Algorithms: Morphogenesis Exploration
Environmental Context: Sahel region and climatic area
Material System
Material Data and Physical Properties
Left Fig. 2.2 Diagram of the design workflow.
Structural Analysis
Solar Analysis Wind Analysis
Design Proposal: Case Study Project
Genetic Algorithms: System Optimization
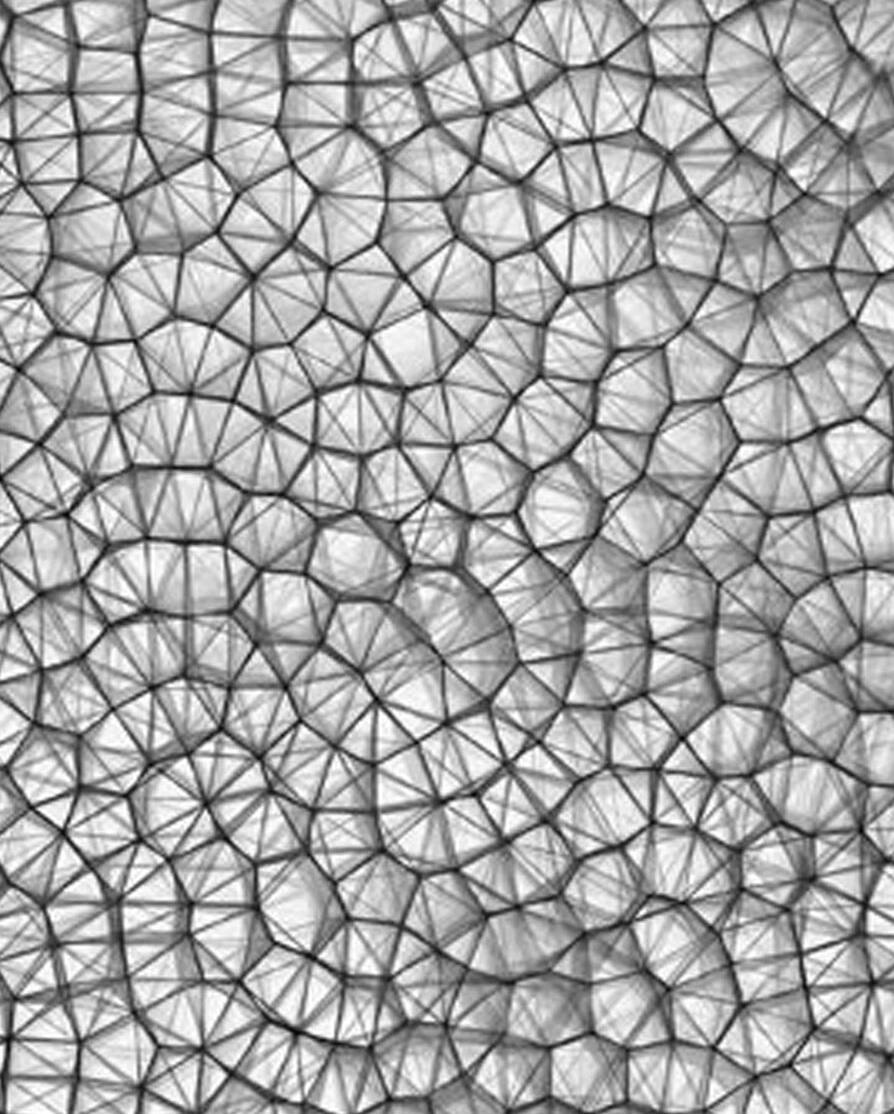
2.3 Essential steps of a Particle-Springs System simulation.
2.4 Self-organising mesh by Enrique Ramos, 2011. Digital Studio, Adaptive Architecture and Computation MSc, the Bartlett.
Dynamic Mesh Relaxation
Dynamic relaxation is a digital form-finding technique to explore the spatial configuration of a shell or a cable-net structure and simulate the behaviour of textiles and membranes under tension. The process relies on a Particle-spring system (PPS) to simulate the physical behaviour of deformable bodies under a given load.
A PPS is a discrete model of a continuous geometry into a finite number of masses, called particles. Each particle is conceived as a lumped mass, connected by perfectly elastic springs, that changes position and velocity as the simulation evolves. Mathematical solvers are used for iterative calculations to find the solution of equilibrium. The movement of the particles is based on Newton’s Second Law of motion (F=ma). Therefore, the particles start to accelerate when an external load is applied and continue to move until the sum of the spring forces acting at that particle equilibrates the
external load. The majority of the simulation solvers are based on the elastic behaviour defined by Hooke’s law (F=kx). (Tedeschi, 2014)
In this research, mesh relaxation has been used to simulate the behaviour of the textile in order to develop a numerical approach that could perform several tasks from form-finding to geometry analysis and fabric patterning. The design process consists in the conception of the initial geometry and the input of the relevant physical properties of the material (e.g. stiffness). Furthermore, the user can proceed to determine the final resulting shape from elastic deformation. The simulation is conducted in the Rhino+Grasshopper environment in order to allow for real-time experimentation. Kangaroo plug-in has been used for early investigations in order to reduce the boundary conditions at the minimum. Further on, mesh relaxation has been simulated in Karamba assigning a prescribed displacement to the initial geometry.
Above left
Fig.
Above right
Fig.
Basic structure of elastic spring network
Spring relaxation
Additional diagonal springs to simulate textile behaviour
Spring system particles (lumped mass)
Physical Prototyping
The main reason for building full-scale models is to clearly demonstrate the feasibility of the design: Physical models can be loaded and tested. In addition, it is a fundamental procedure to understand economic strategies and simple construction techniques.
Physical experimentation has been fundamental to calibrate the technology to be used in the investigation. In particular, in relation to our research on earth structures, physical testing has been extremely significant to fully explore the material behaviour, the proportions of the earth mixtures that have been used and the construction time needed by the design. Necessary load tests have been conducted to extract the essential data to inform the following digital models and enable further structural analysis and design experimentation.
In fabric formwork technology it is very important a deep understanding of the construction process of such a formwork because its design will directly influence the resulting shape. However, because the textile deformation depends on several parameters, an actual prediction of the body deformation requires a high level of complexity. Physical models have been design to calibrate the digital simulations based on dynamic relaxation in order to develop an effective tool to proceed with the design.
Left Fig. 2.5 Earth mixture of clay, sand, water.
Structural analysis has been adopted to evaluate the results of the design and to integrate the form finding process.
Analysis has been conducted first with Karamba and next with CSI Sap2000. Karamba is a finite element program which is part of the Rhino+Grasshopper environment and allows to combine parametrized geometric models with structural calculations and optimization algorithms. It has been used mainly in the research stage to develop an evaluation tool to understand the behaviour of the system and the effects of the variation of single parameters on the overall structural performance.
then input in the software. In the analysis, the isotropic linear-elastic behaviour is assumed for the material because of the limitations in the model: this might produce inaccurate results in larger configurations. However, it is important to remark that structural analysis has been used primarily to compare and evaluate the relative behaviour of different design iterations and parameters.
The final evaluation on the selected design proposal is conducted with Sap2000 in order to achieve more accurate results.
Right
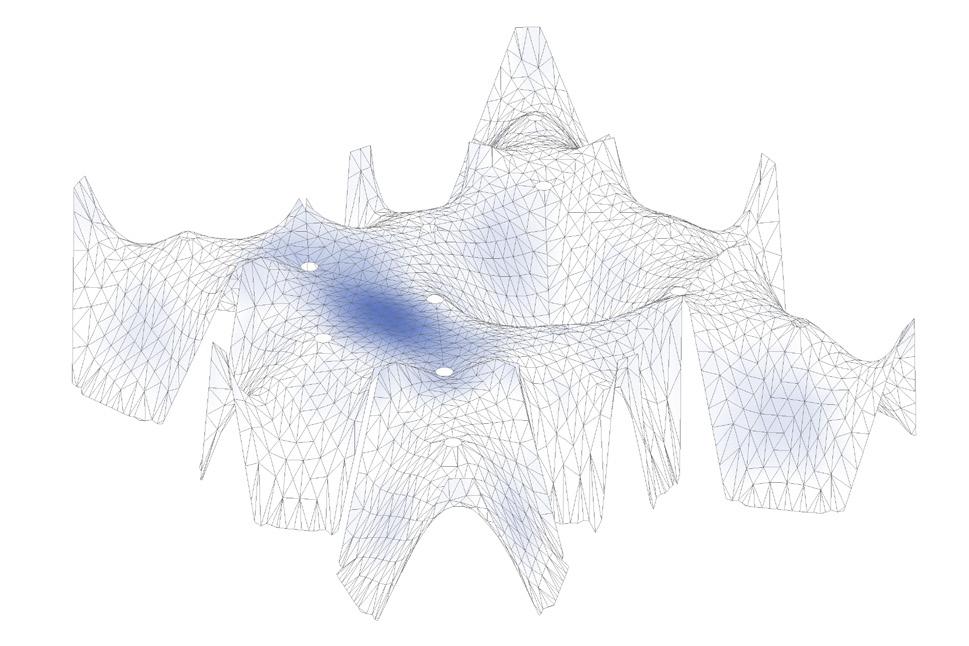
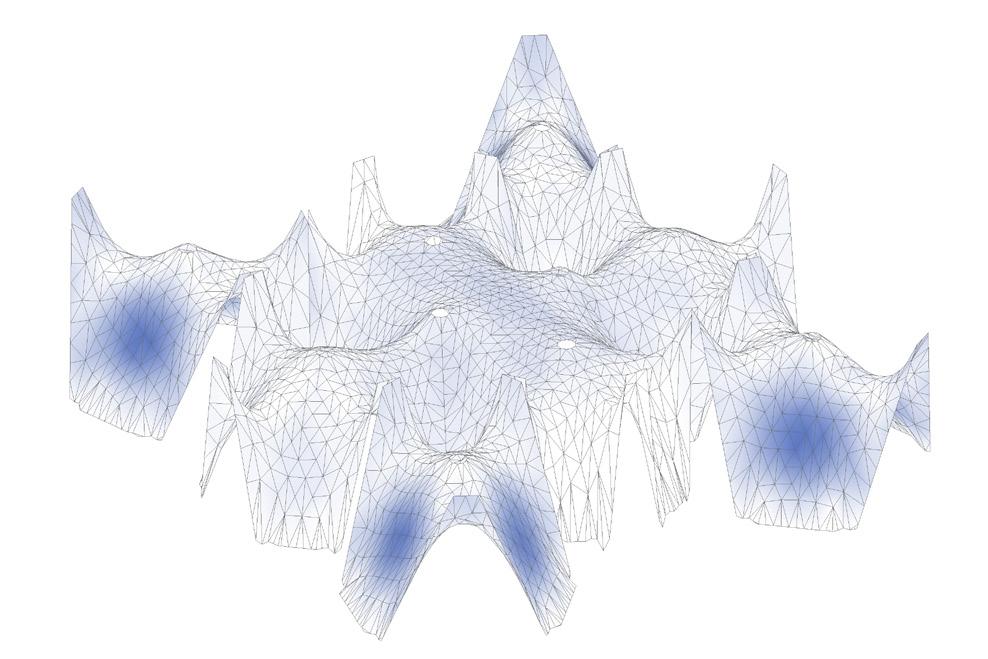
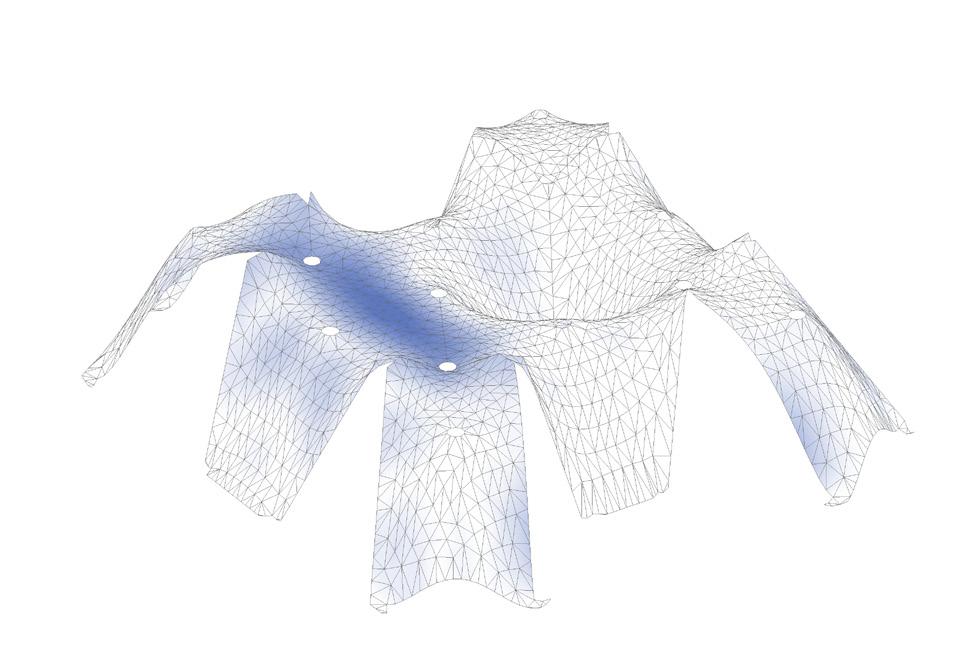
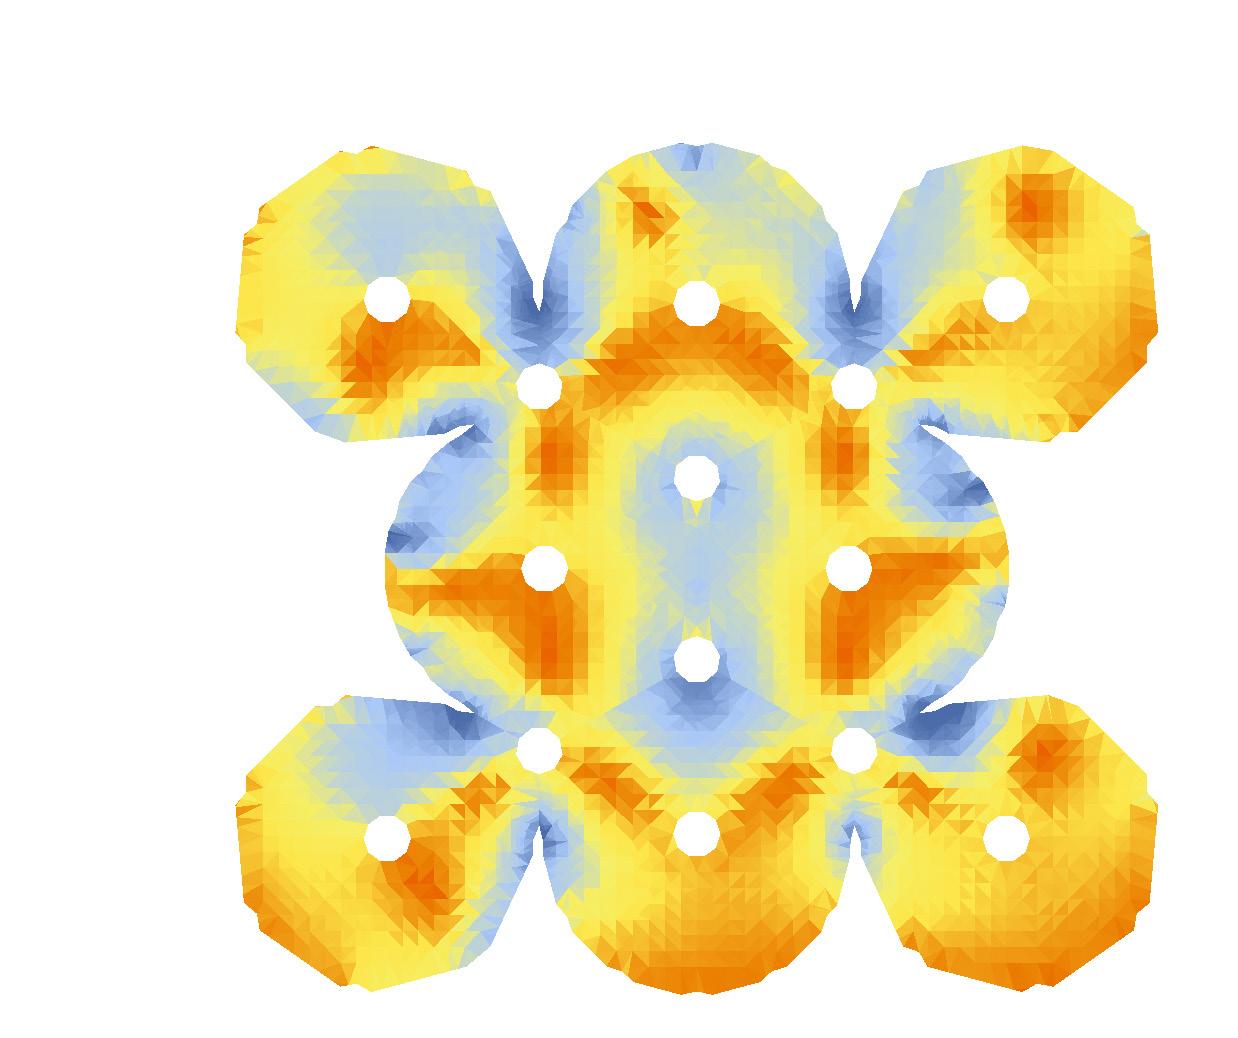
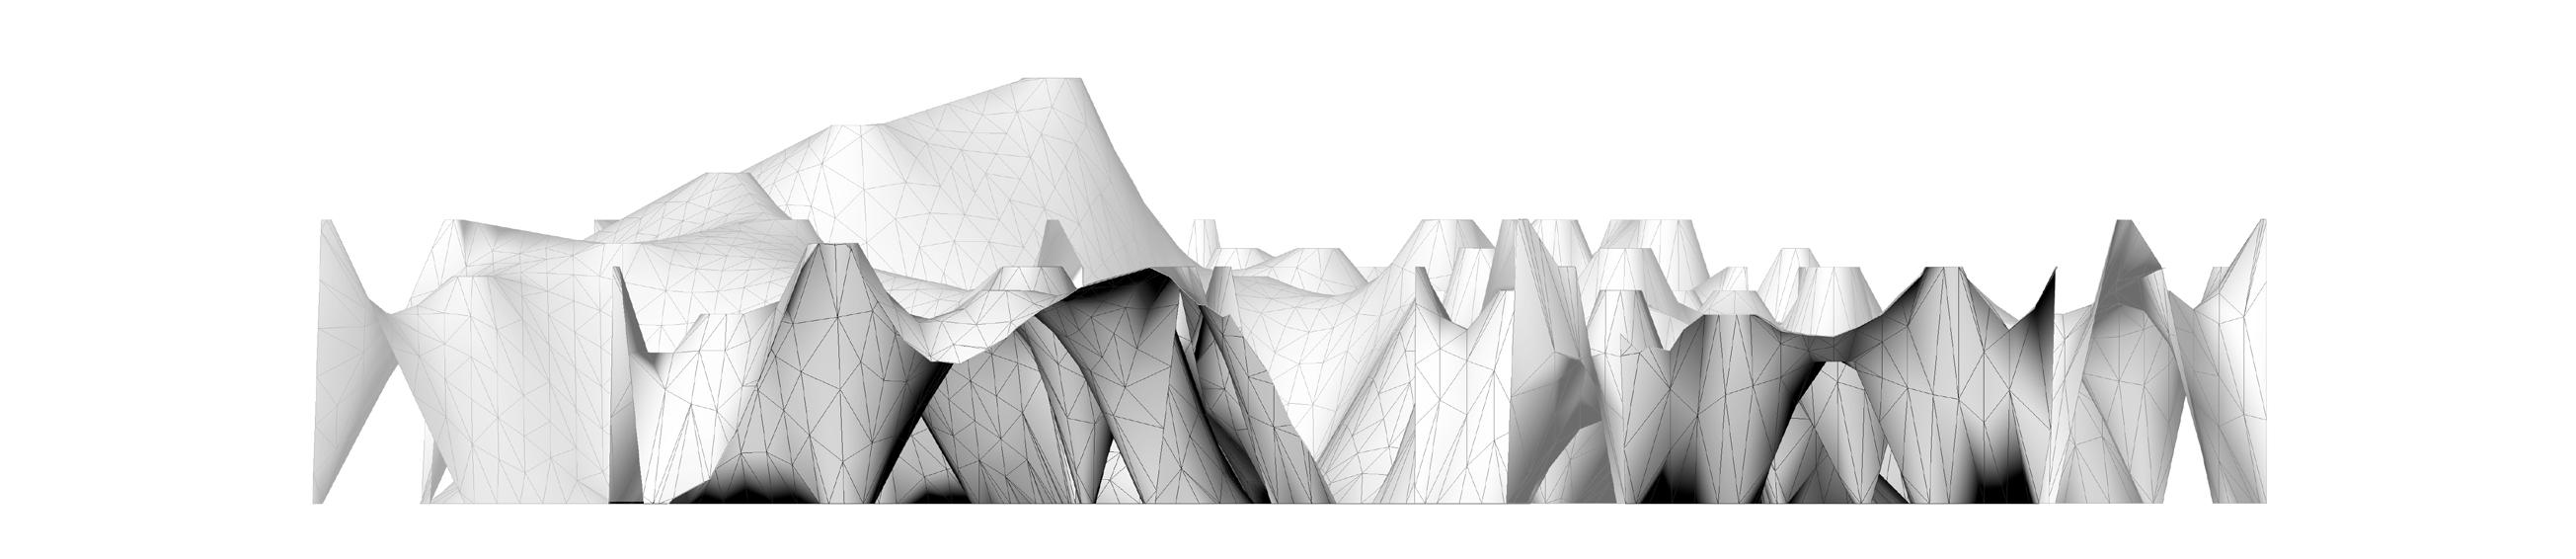
Fig. 2.6 Sample diagram describing the displacement of a curved surface under a uniform load.
Environmental Analysis
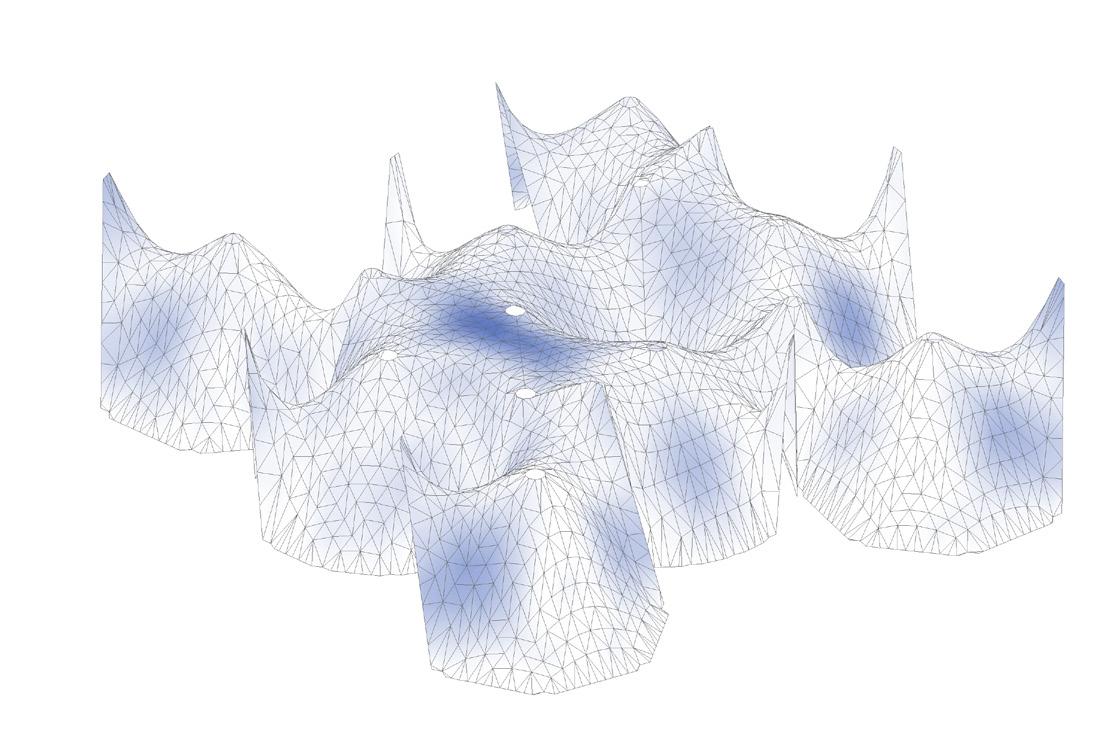
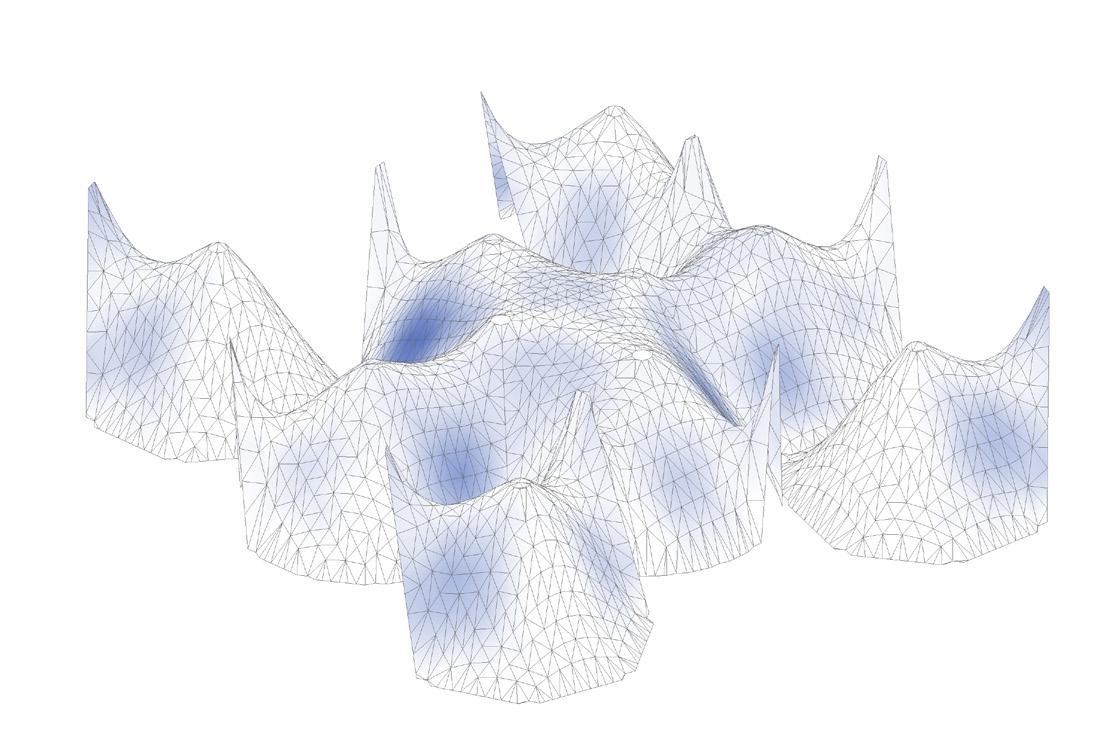
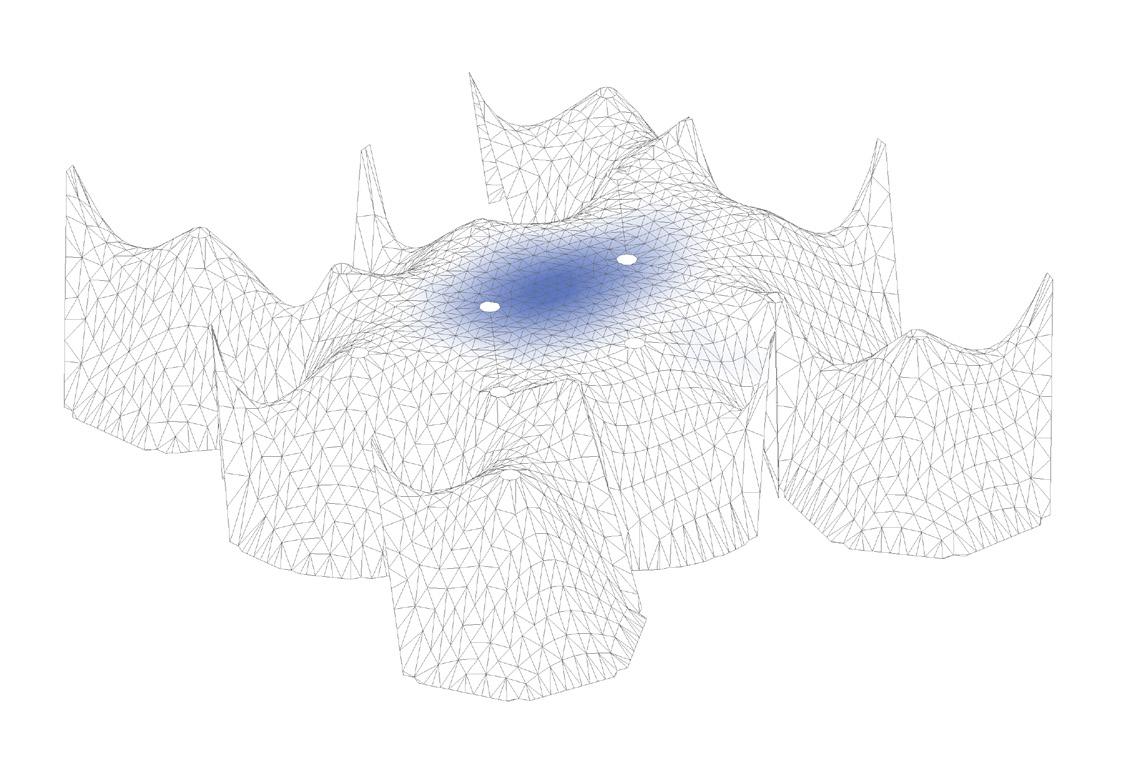
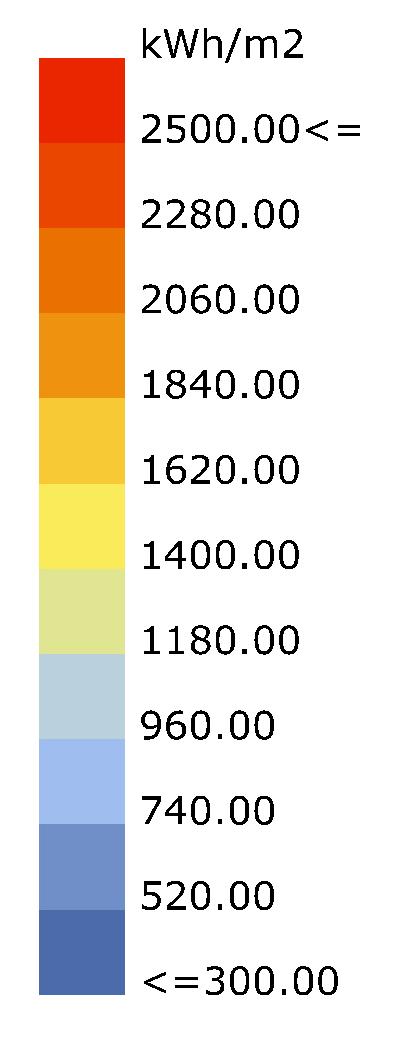
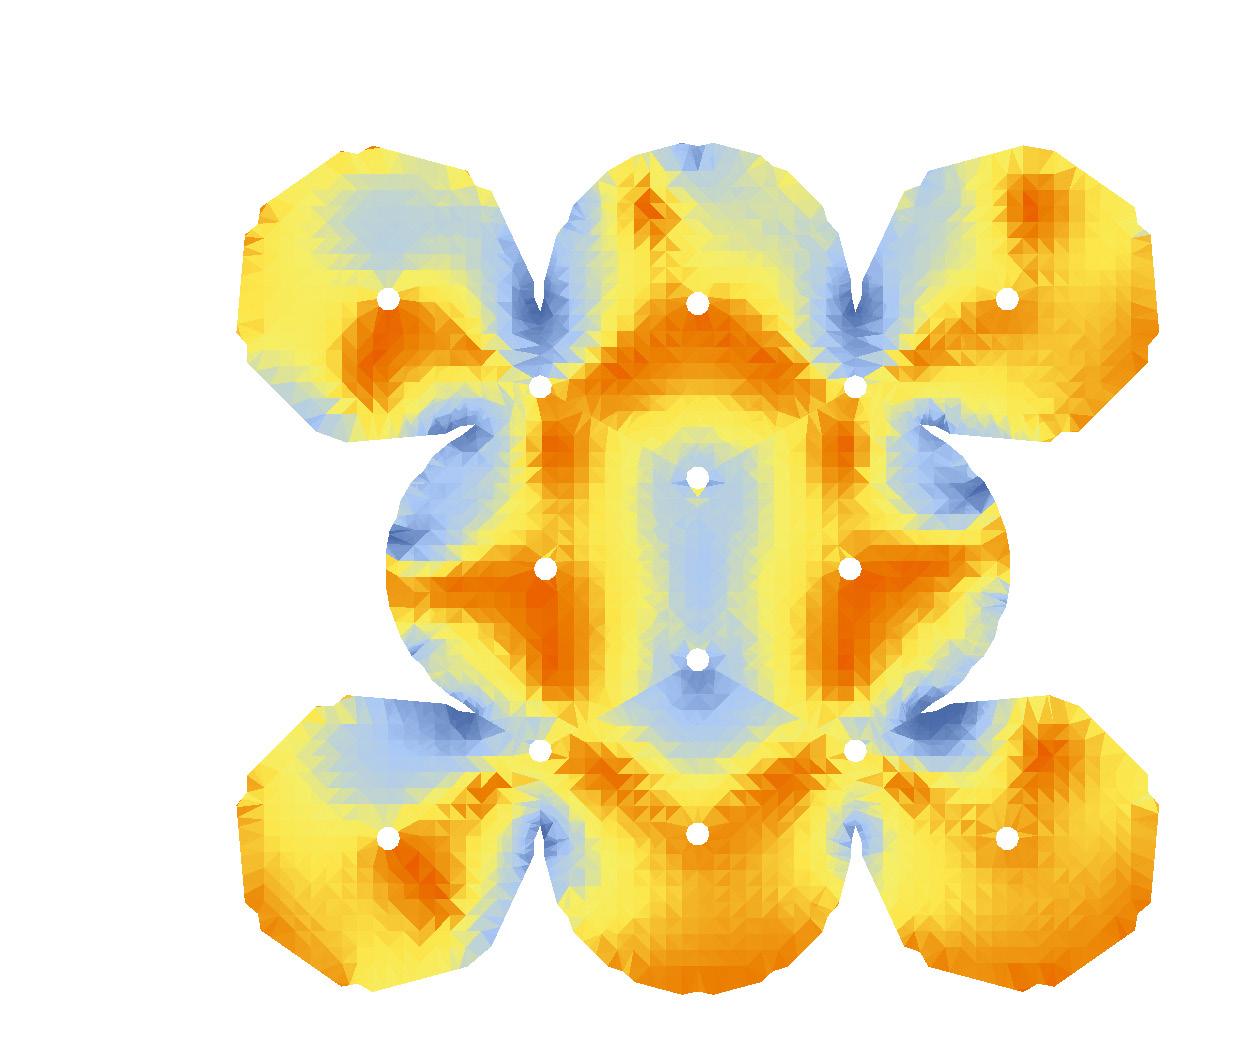
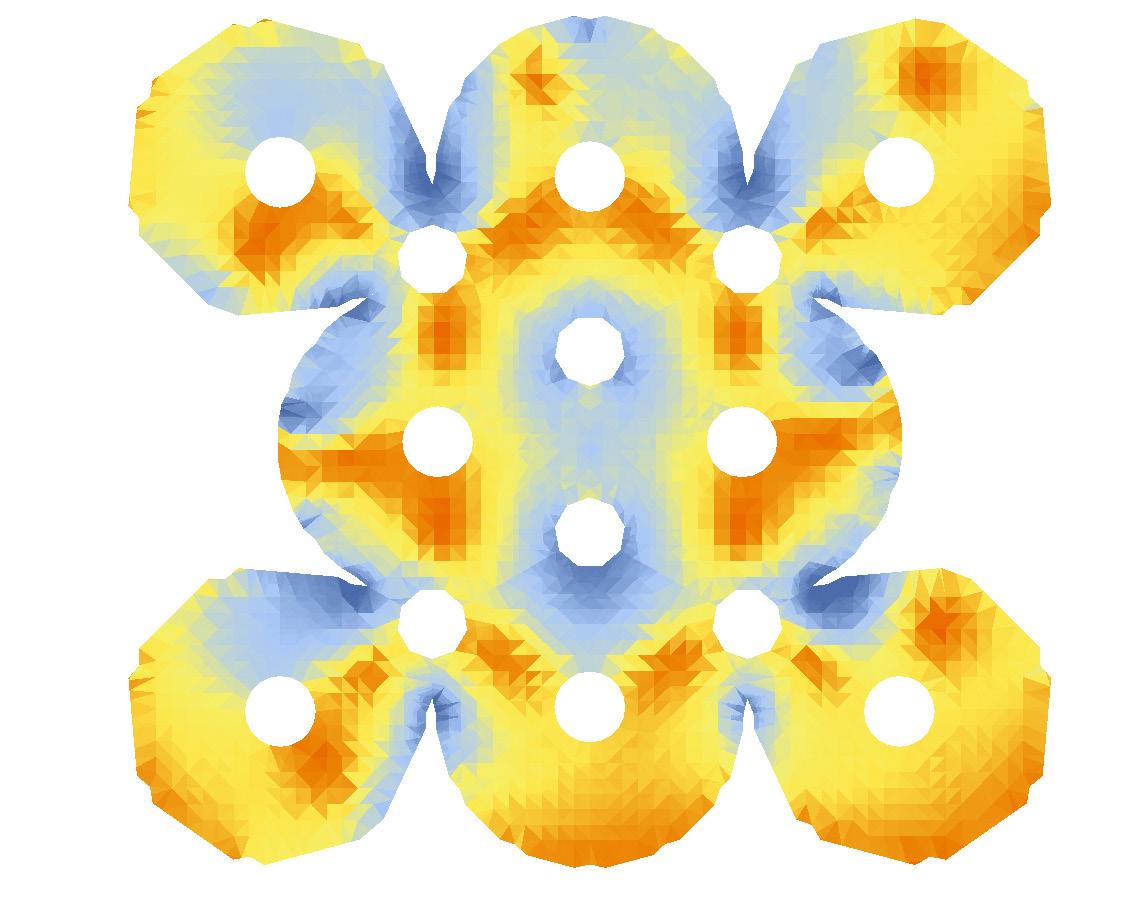
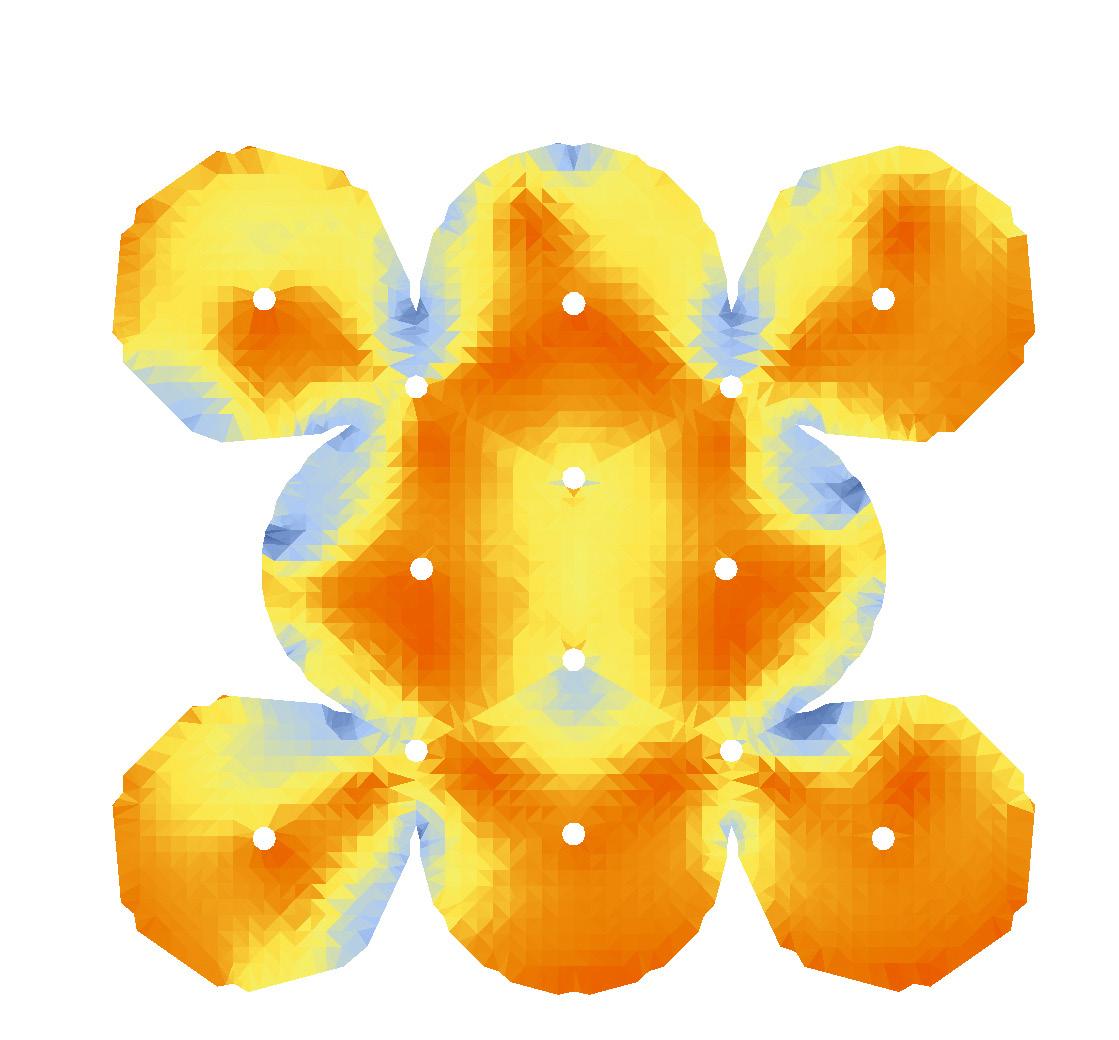
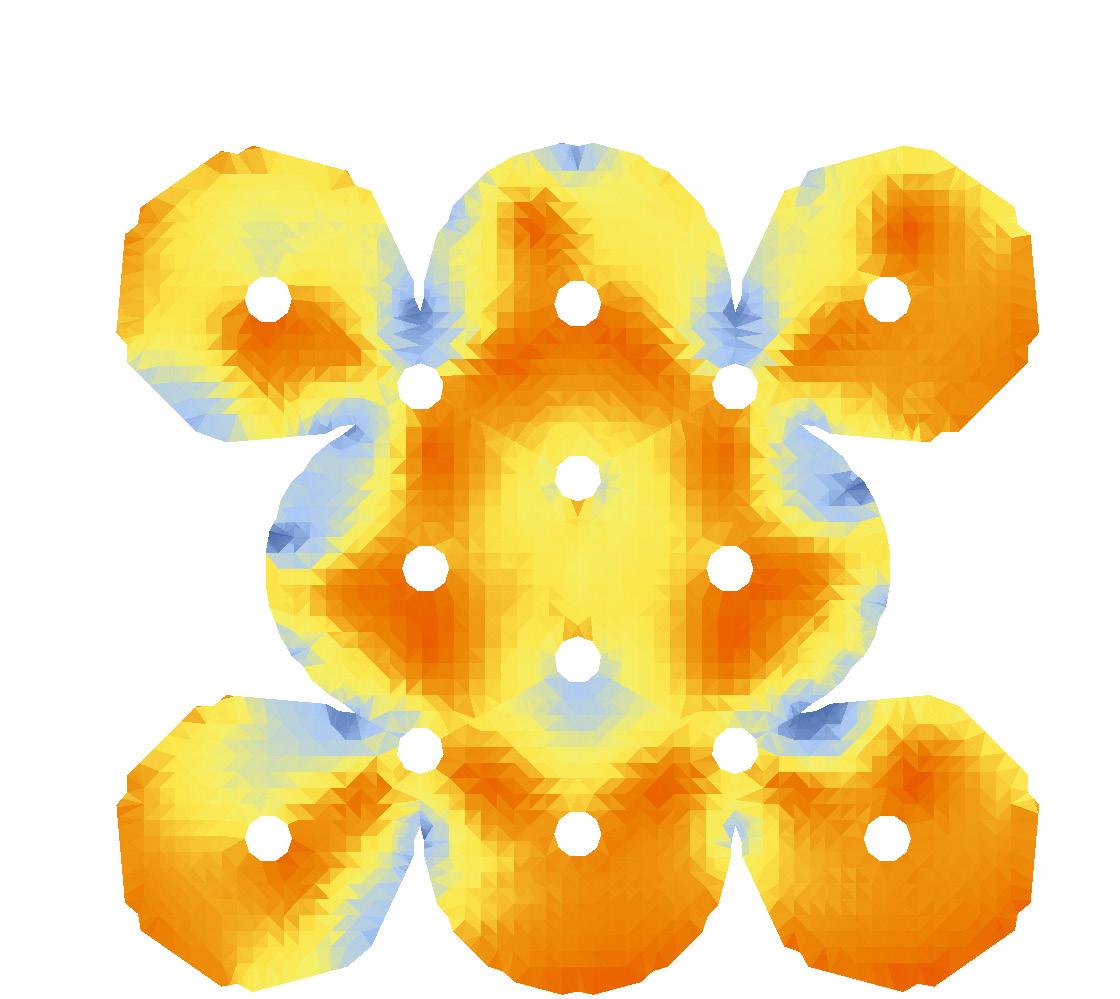
Solar radiation analysis and wind analysis have been conducted to understand the relationship between the design and the environmental context in order to develop precise strategies to design a system which responds to the environmental requirements of the context.
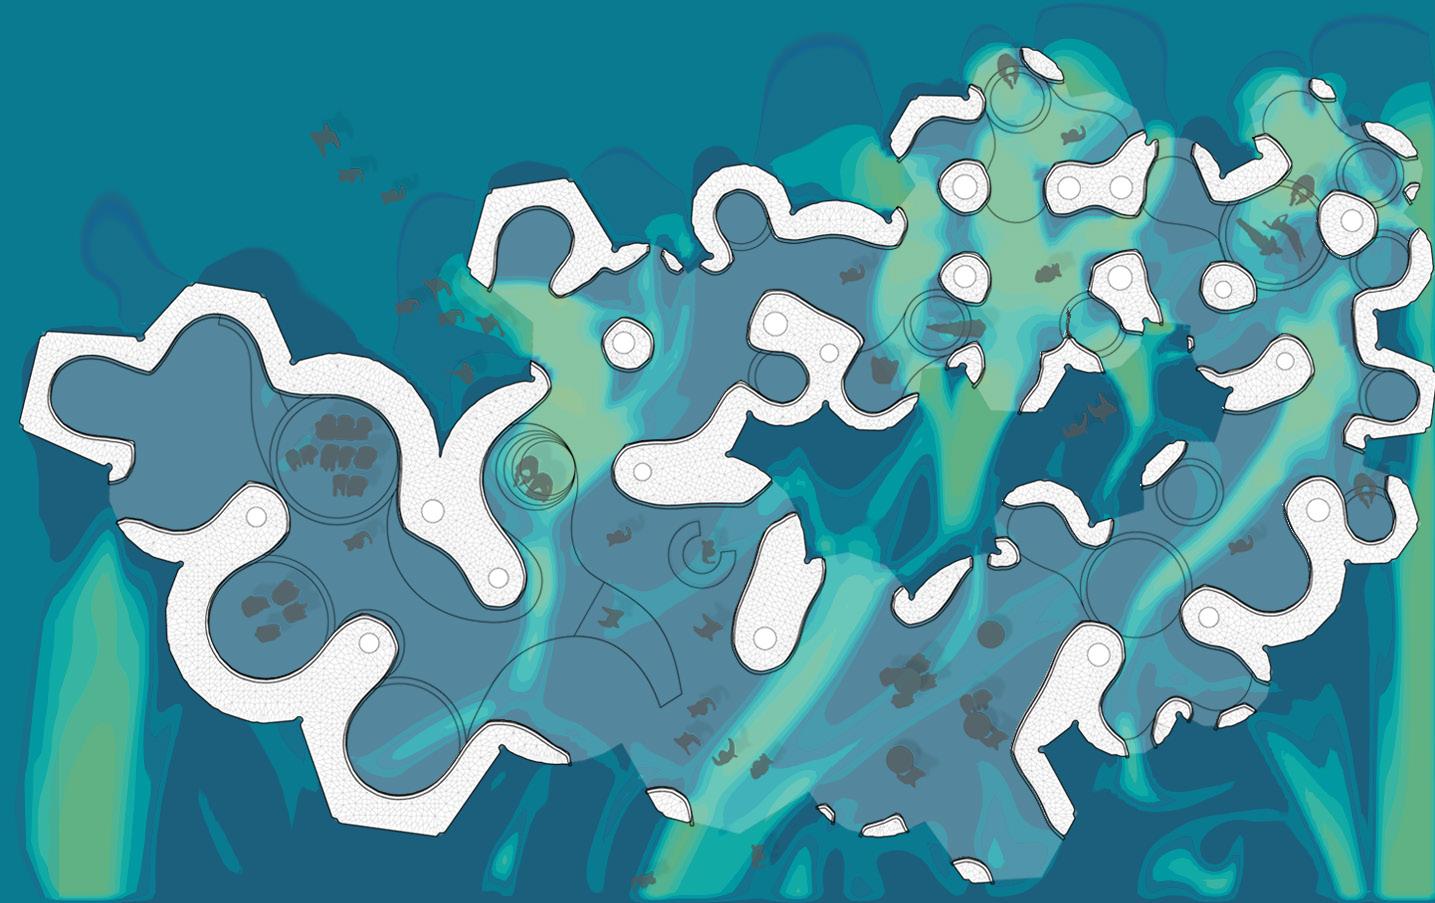
Solar analysis is conducted in the Rhino + Grasshopper environment with the plug-in Ladybug. The design research focuses on the Sahel region in order to explore the behaviour of the system in semiarid climates where is important to minimize the heat gain of the building. The environmental data used for the experiments are relative to the area of Bahar
Dar, Ethiopia. Analysis has been conducted in relation to direct solar radiation and daily sunlight hours, both on the interior and the exterior space to explore different strategies to enhance self-shading and minimize the solar exposure of the inside space. Sunlight hours are calculated in significant periods of the warmest and coolest season to obtain relevant results.
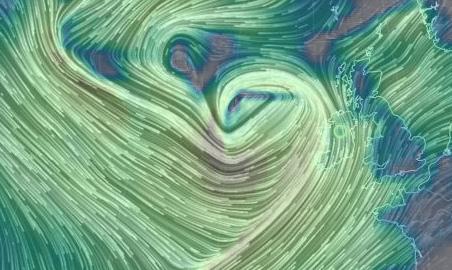
Wind analysis has been operated with Autodesk Flowdesign. The software does not allow accurate simulations because it is not possible to introduce temperature and pressure values in the airflow simulation. However, it can be considered as an important tool to understand the relationship between geometry and the dynamic of wind-flow in order to enable a more conscious design process.
Left Fig. 2.7 Wind analysis on the Atlantic Ocean.
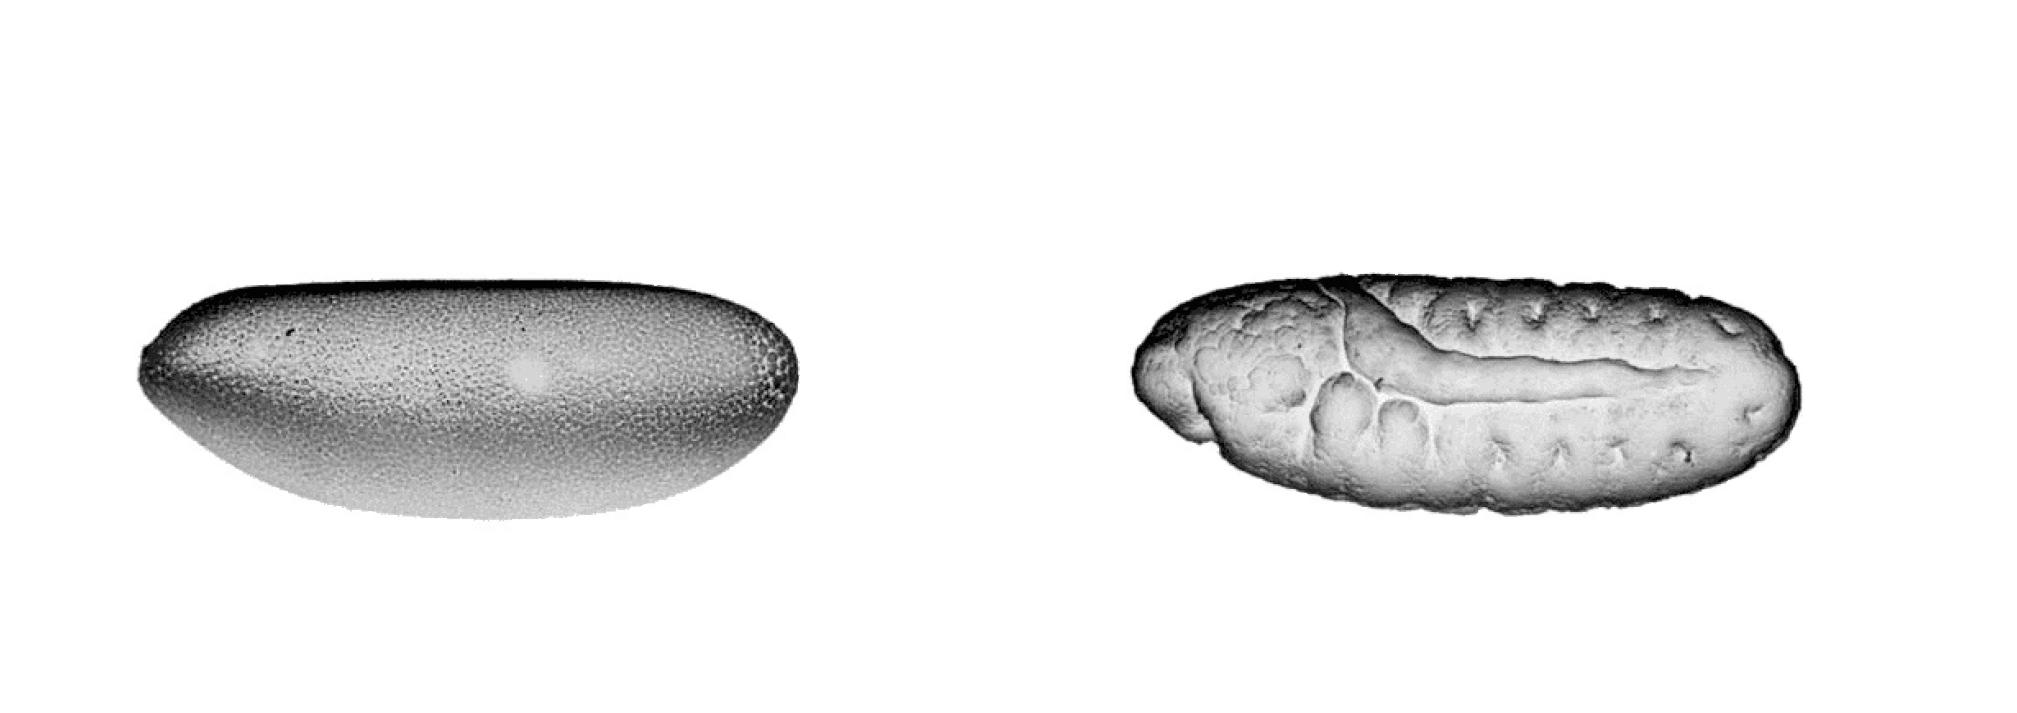
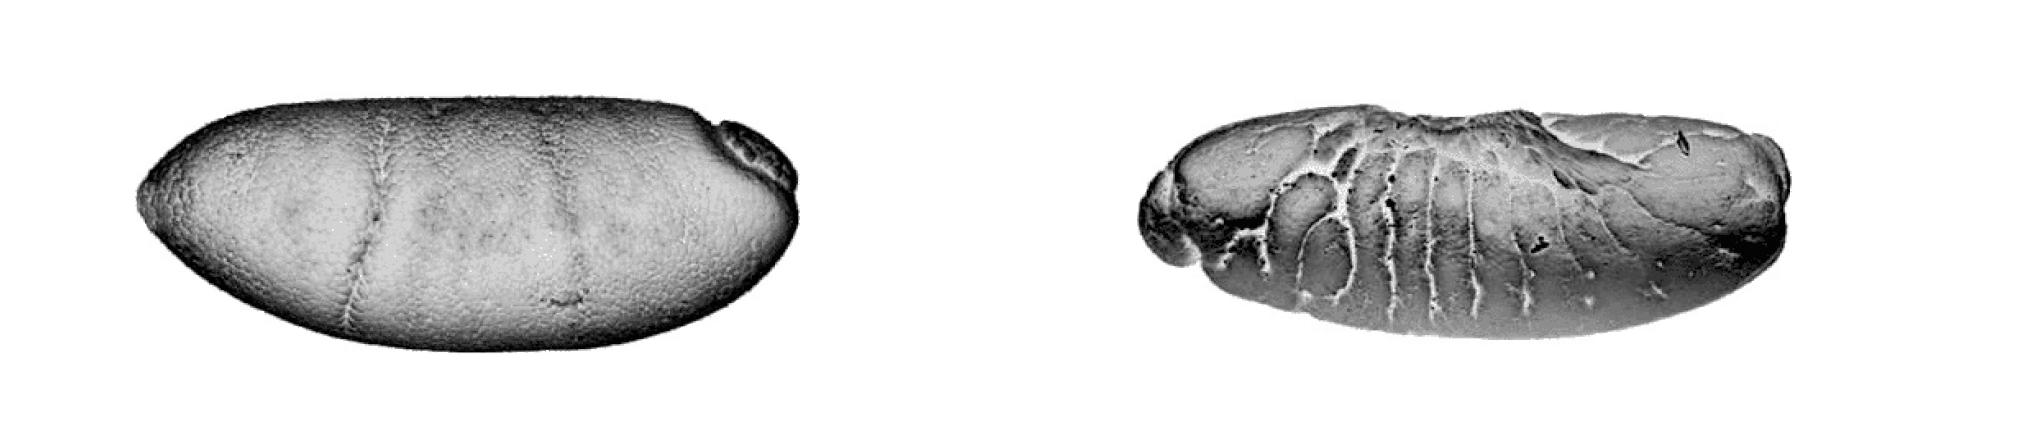
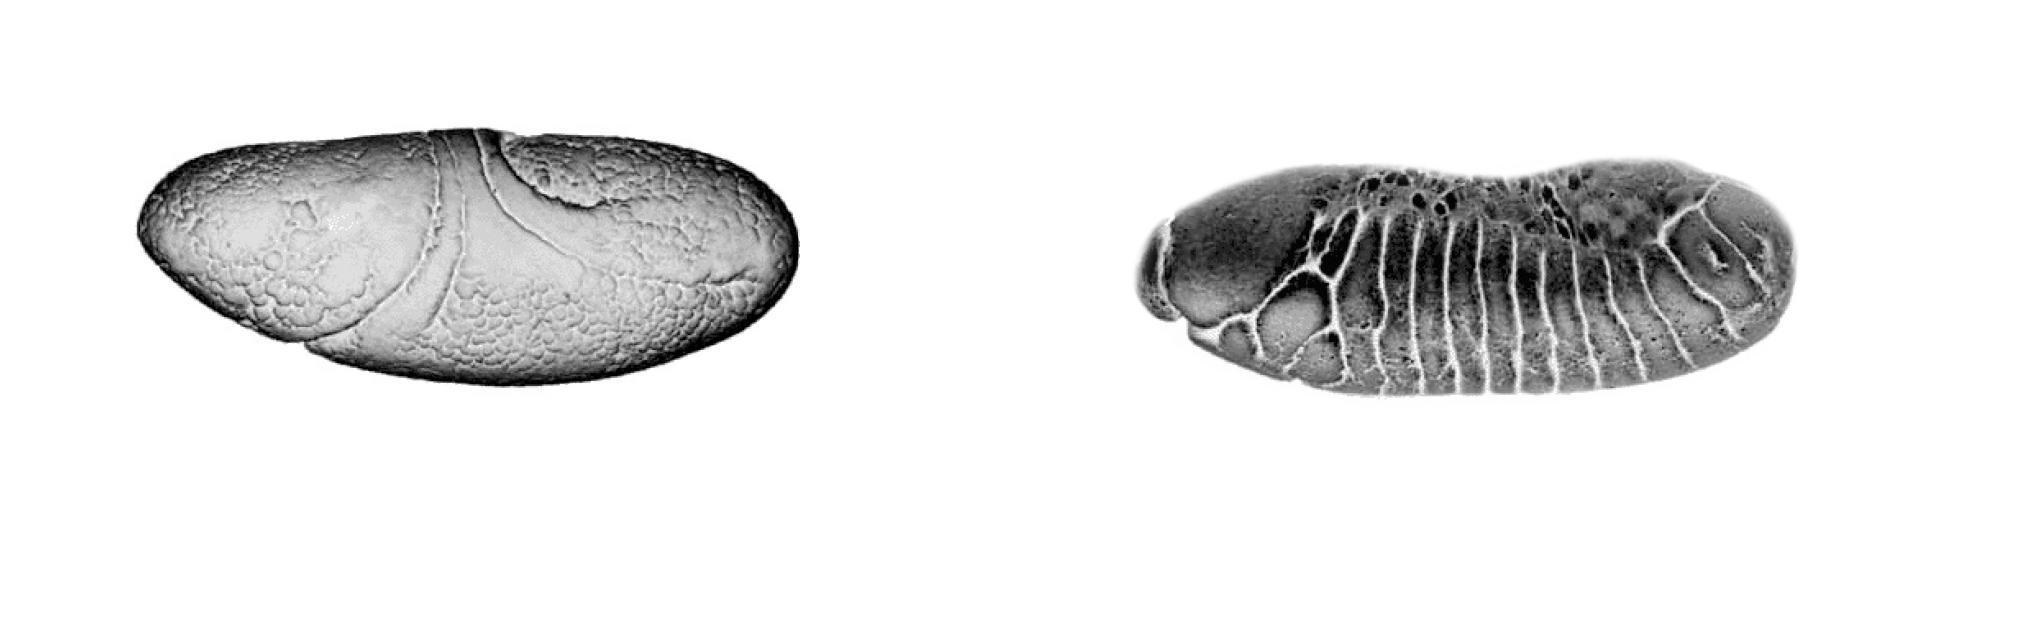
2.8 Stages of growth of the drosophila melanogastera embryo.
Stage 4 Syncytial blastoderm prior to cellularization.
Stage 11
Shows parasegmental furrows posterior spiracle and amnioserosa.
Stage 6 Beginning of germ band elongation.
Stage 12
Head, thorax and abdominal segments are identified.
Stage 7 No sign of segmentation. Showing procephalon.
Stage 13
Nearing end of gastrulation and germ band retraction.
Right
Fig.
Genetic Algorithms
Genetic algorithms (GA) are a digital tool that reproduces the process of natural selection to determine the solution which is the most fit in relation to a selected problem. In order to compute the solution, these evolutionary solvers require a representation of the solution domain and a fitness function to evaluate the fitness domain: each variable is represented by a single parameter which contributes to the development of the form. The fitness objective is defined as a quantitative measure and, in addition, it is possible to input multiple fitness objectives. (Mitchell, 1996)
GA are multi-criteria optimization tools which have potential for virtual prototyping of multiple design iterations and the evaluation of their performance. As in the natural development of organisms, the formation process of a design project is the result of the interdependency of different parameters which
act simultaneously. In order to explore the complexity of this morphogenetic process, GA are used in architectural applications because of the opportunity to clearly analyse and rank quantitative data. The importance and priority of different fitness objectives can be defined in the algorithm by defining the weight of each.
In the research, Octopus for Grasshopper has been used to explore the behaviour of the system. In evolutionary processes it is extremely important to understand the correct relationship between optimization and diversity. Morphogenesis operates over several generations to elaborate a system given form. In early experimentation GA has been used to explore the relationship between form and performance and the main interest has been focused on the differentiation in the system. In the final design stage, a top down approach has been privileged to optimize the system in relation to selected criteria that have been defined in previous experimentation.
Left Fig. 2.9 Example of multicriteria evaluation and ranking.
Bibliography
Carroll, S.B. (2005) Endless Forms Most Beautiful: The New Science of Evo Devo and the Making of the Animal Kingdom. New York: W. W. Norton & Company.
Hensel, M. & Menges, A. (2008) Versatility and Vicissitude An Introduction to Performance in Morpho-Ecological Design. AD Magazine Versatility and Vicissitude Profile No.192, Vol.78 No.2 . Wiley
Kuijvenhoven, M., Hoogenboom, P.C.J. (2012) Particle-Spring Method for Form Finding Grid Shell Structures Consisting of Flexible Members. Journal of the international association for shell and spatial structures: J. IASS, Vol.53, No.1.
Mitchell, M. (1996) An Introduction to Genetic Algorithms. Cambridge, Massachusetts: MIT Press.
Otto, F., Rasch, B (1996) Finding Form: Towards an Architecture of the Minimal. Munich: Edition Axel Menges.
Otto, F. (1969) Tensile structures vol.2 : cables, nets and membranes. Cambridge: MIT Press.
Singh, B. & Pandey, A.K. (2013) Maze using Genetic Algorithm. International Conference of Advance Research and Innovation.
Tedeschi, A. (2014) AAD Algorithms Aided Design, Parametric Strategies Using Grasshopper. Le Penseur.
Veenendaal, D., Block, P, (2012) Computational form-finding of fabric formworks: an overview and discussion. 2nd International Conference on Flexible Formworks (icff).
Research Development
Right
Fig. 3.1 Physical prototype, Grand Ateliers, Lyon.
The chapter develops the initial research into digital and physical design explorations, in order to understand the opportunities and limitations of a potential earthen composite material system.
The first part is related to the geometry generation and it includes several experiments based on evolutionary processes, structural evaluations in the digital environment. While, the central section is mainly dedicated to physical prototypes and material flexure tests.
Finally, once the material properties are clearly defined, new digital explorations are set up to expand the potential of the developed material system and to identify the drivers for new design studies and more complex scenarios.
System Logic of the Spatial Unit
The research focuses on exploring the relationship between forms and performances to develop the generative logic for a self supporting spatial unit. Structurally efficient geometries are able to achieve high levels of strength and stiffness in comparison to the material properties.
Fabric Formwork and Tensile Structures
Fabric formwork is introduced to achieve
complex geometries avoiding expensive and complex formworks. A tensile structure is a form active structure that redistributes external forces in a more efficient way, where geometry, more than the material itself, is responsible for the stiffness. Membranes carry only pure tension loads, therefore, no compression, shear and bending are transferred. While, the final structure, made of earth, will work differently, like a normal thin shell structure. Buildable geometries, in according to this methodology can only be generated by a balance between
Fig. 3.2 Form active structure, plan and elevation.
Plane membranes bordered by cables
Simple sail
Plane membranes with internal supports
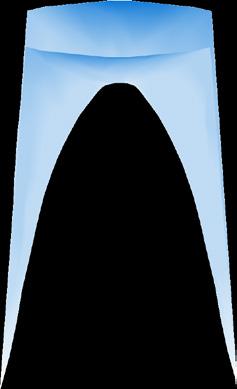
High and low points
Centrally supported membranes
Humped
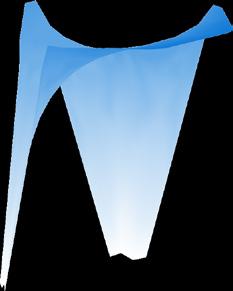
Centrally supported membranes
Pointed
Membranes with two dimension edge members
Tubolar
Membranes with two dimension edge members
Centrally supported
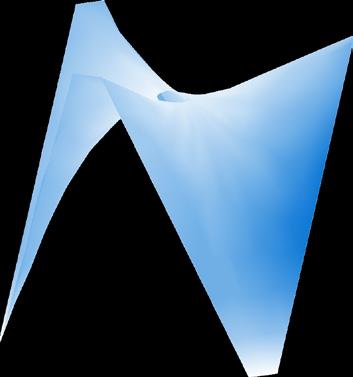
Wave shaped membranes
Parallel
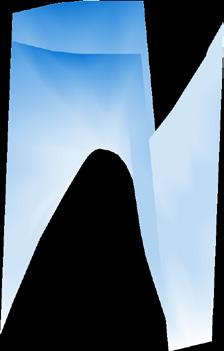
Left
Fig. 3.3 Examples of membranes with different boundary conditions. Ground restraints are identified by a light blue point, while the others are indicated with crosses.
Wave shaped membranes
Radial
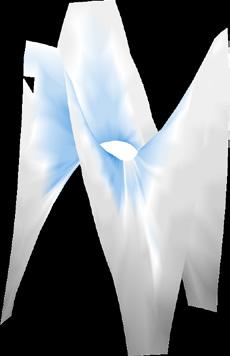
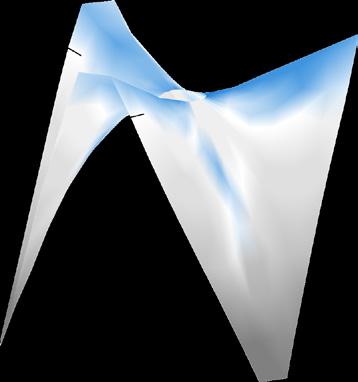
3.4 Spatial unit, main characteristics.
Spatial Unit
Main Characteristics
Radial configuration
Double curvature geometry
Anticlastic surface
Surface Tension
W = (t x /r x + t y /r y)
W: t1 t2 r1 r2
Surface tension
Tension parallel to direction 1
Tension parallel to direction 2
Radius related to direction 1
Radius related to direction 2
Right
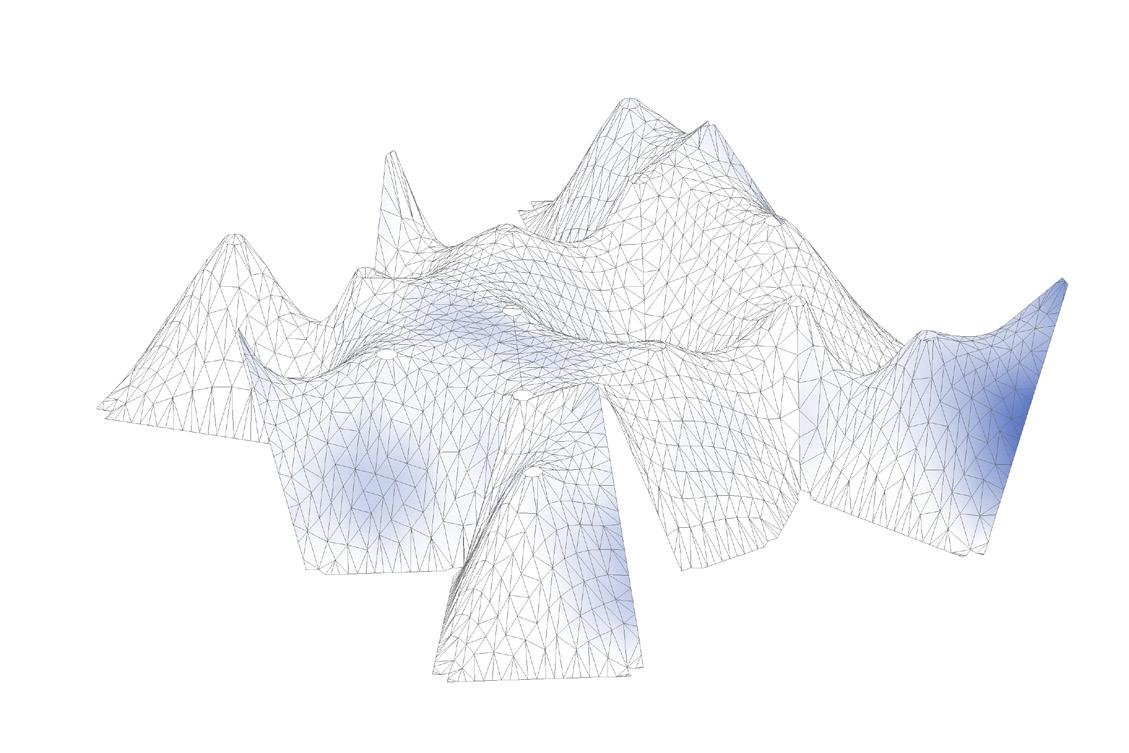
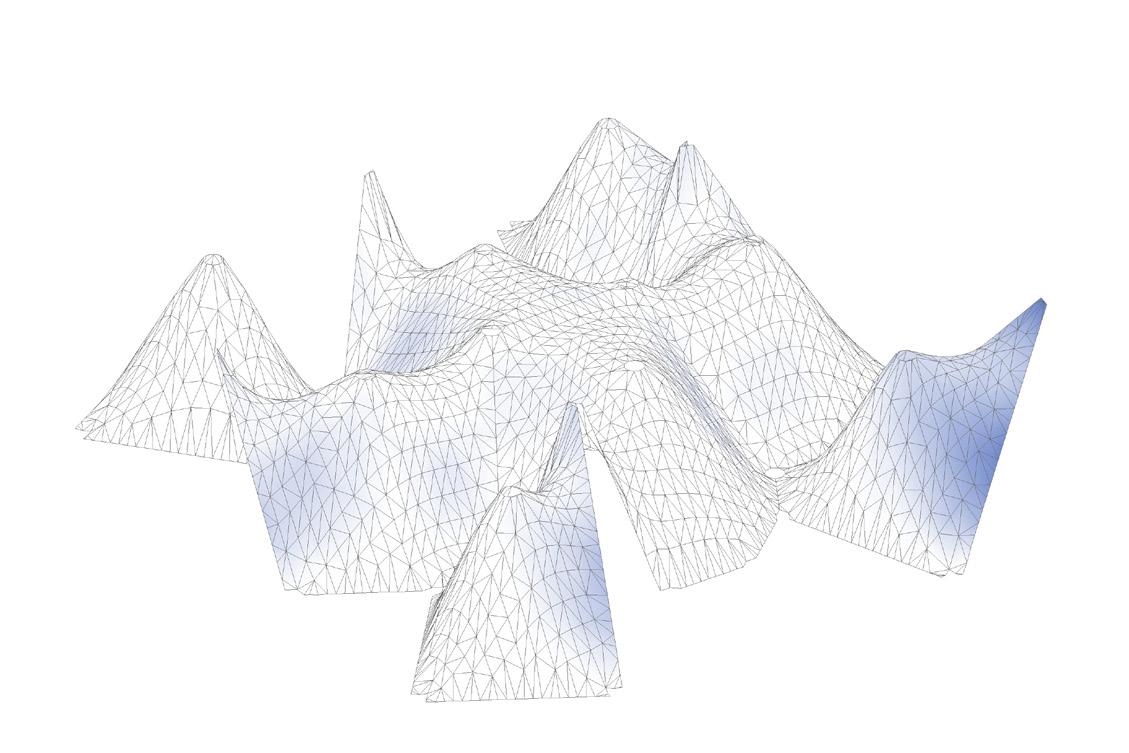
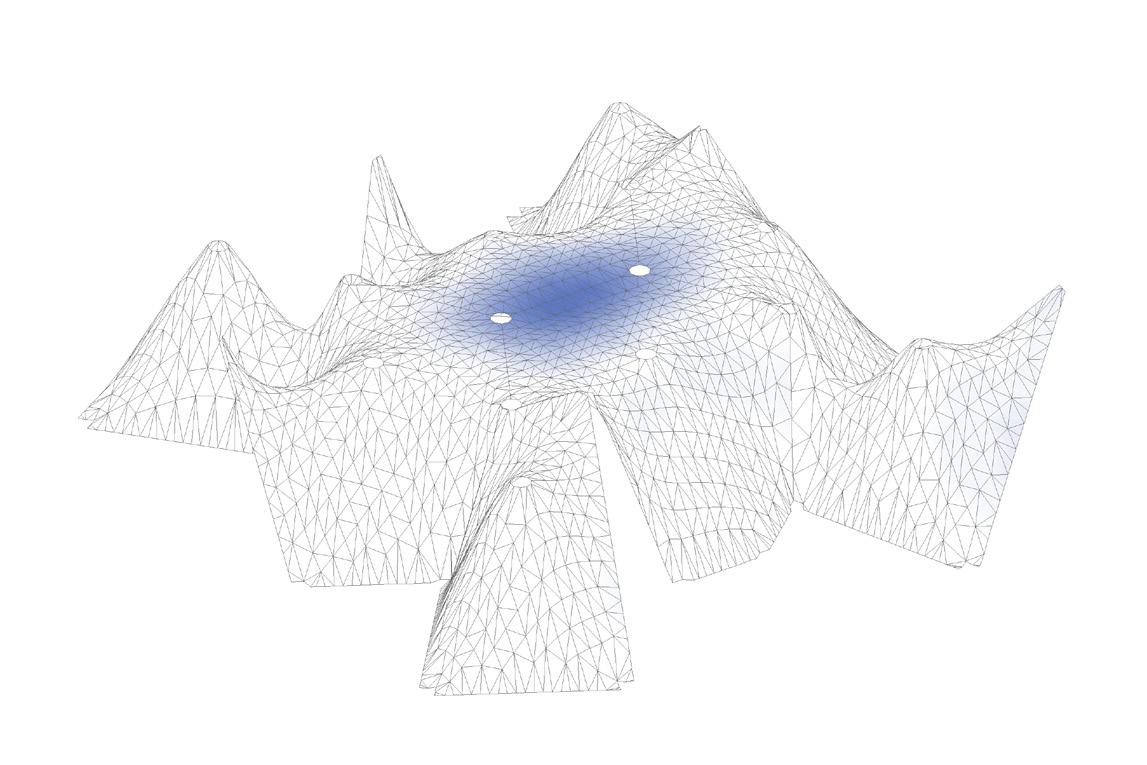
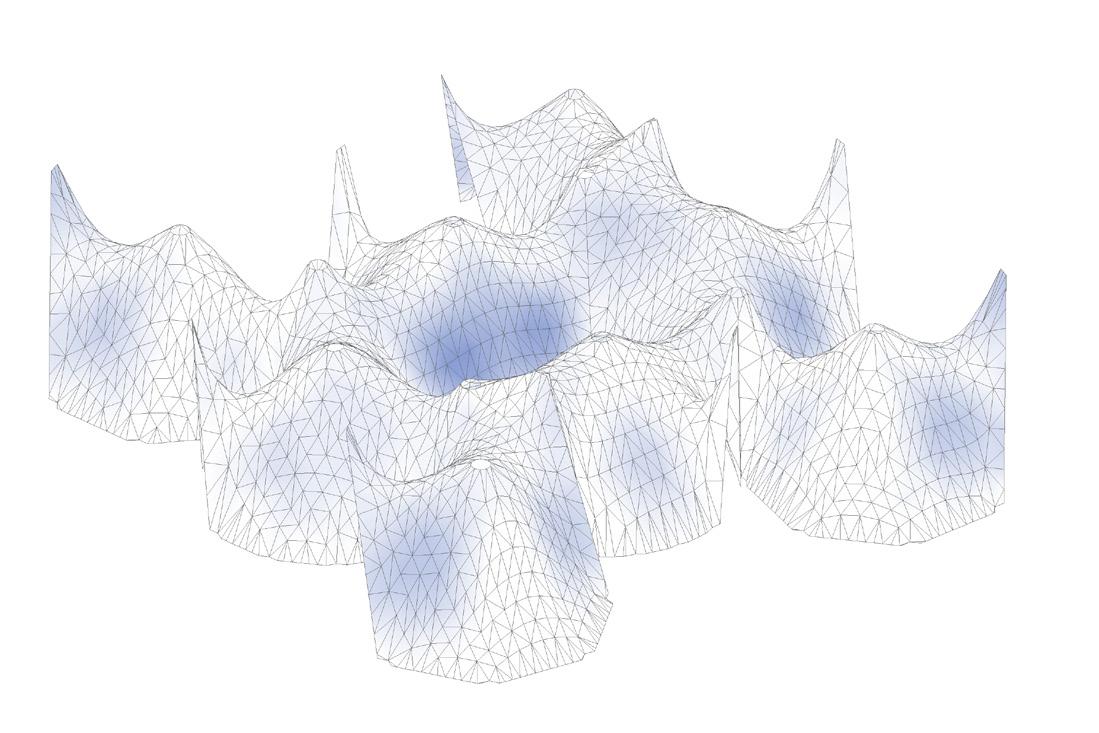
Fig.
fabric formwork and thin shell elements. Tensile structures design has been studied to develop essential design guidelines. Geometry is the main feature for membrane stability and the tension on a doubly-curved surface is given by the equation showed in Fig. 3.3.
Minimal surfaces, that locally minimize their area, are the optimized configurations under pre-stressed loads. Moreover, if the frame and the stresses are equal, they will be always identical. In addition, the minimal surface in not the only design driver, therefore other possible loading scenarios, like dead or wind loads have to be considered.
An elastic sheet could be stretched in any frame that forms a closed line, if the frame is enough strong and stiff to counteract the stresses imposed by the membrane.
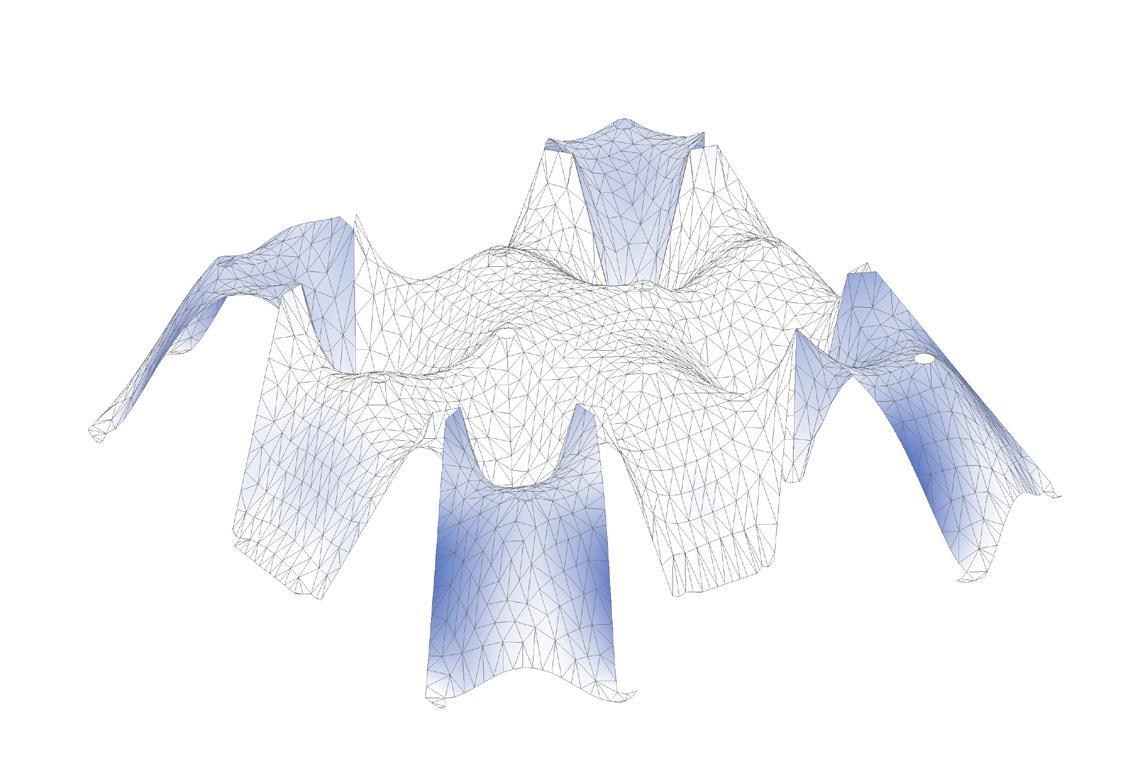
Anchor points with alternating heights, mountains and valleys, are disposed in the space to pull the fabric in opposite directions in order to create an external boundary. This is a fundamental principle to determine the membrane working configuration. Different kinds of formations can be distinguished in according to their formal elements: as the location of the supporting points and the corrugation frequency. (Otto, 1969)
Geometry Generation
Multi-Criteria Evaluation
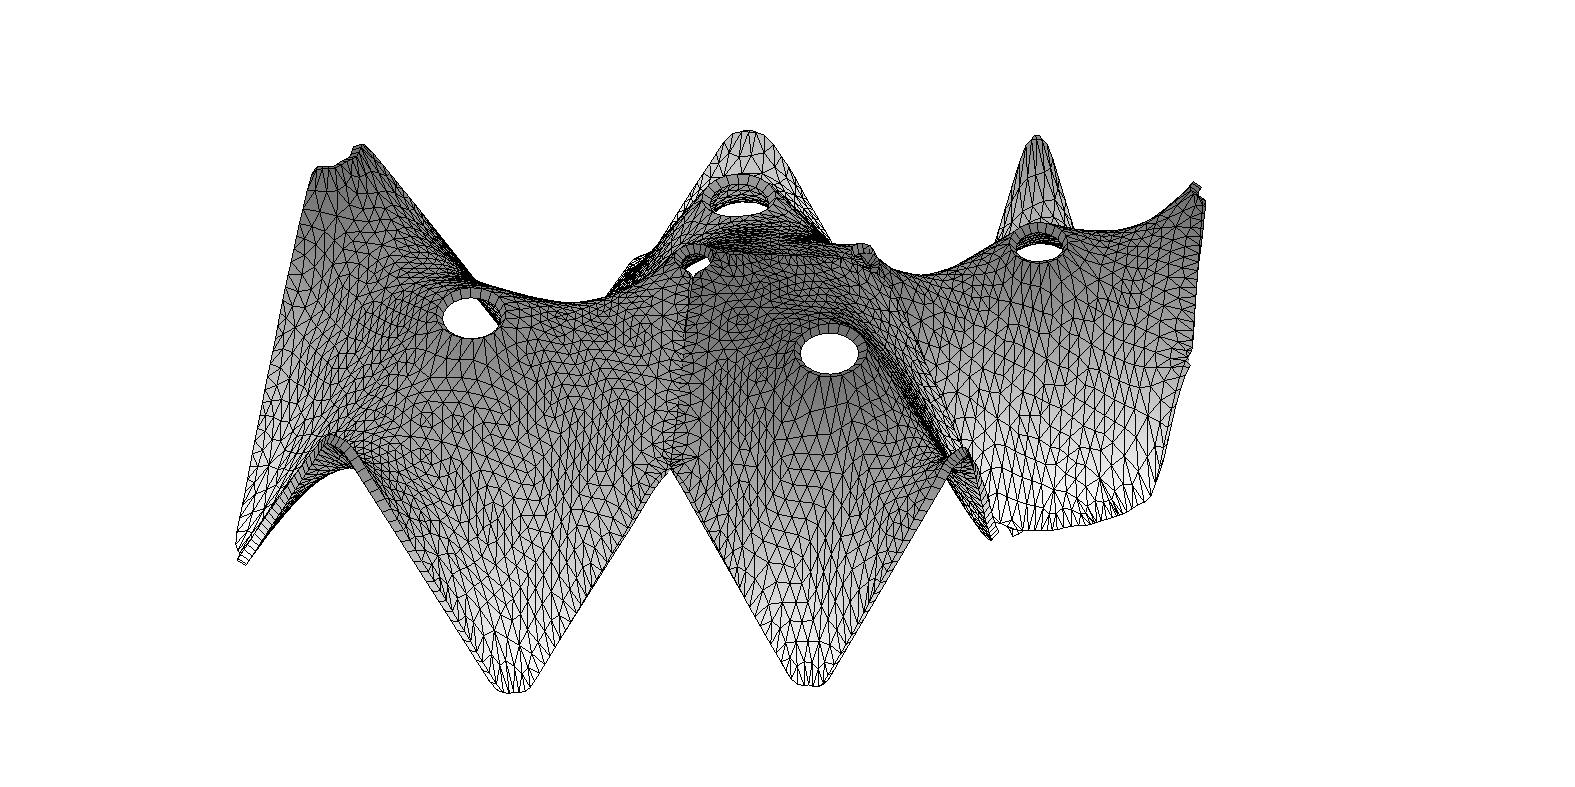
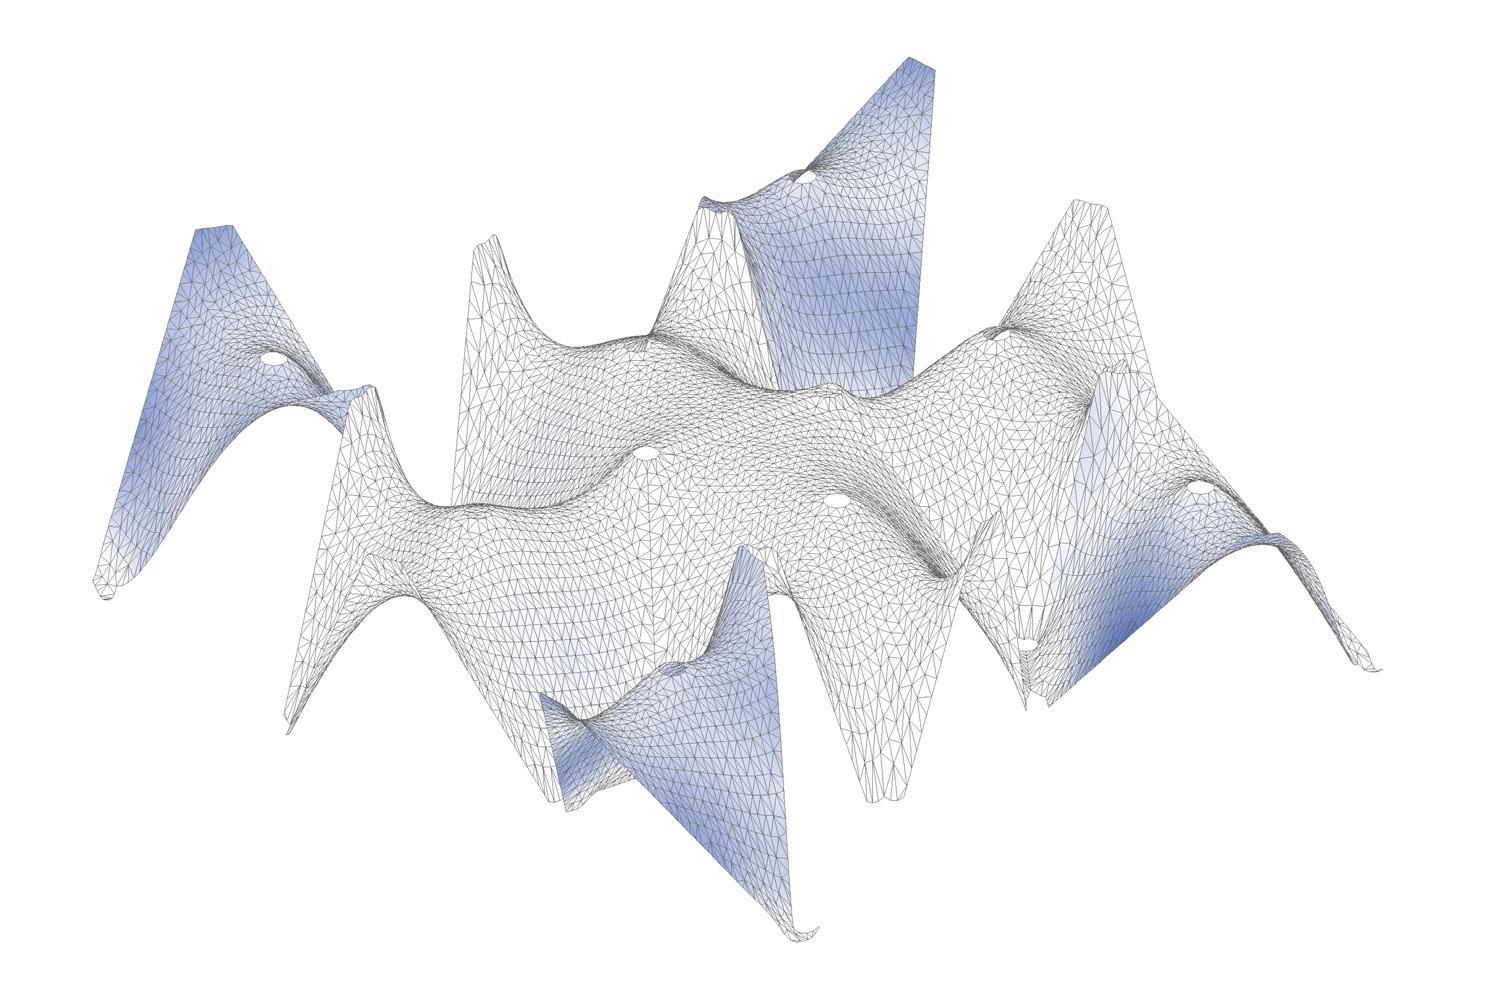
This experiment applies evolutionary computation to generate several different geometries in order to increase the system behaviour in terms of structural performances and architecture potentials for further physical explorations and design developments.
Aim
The intent of this experiment and these evaluations is to identify those geometries which
can have good structural performances and the maximum usable space, without forgetting the construction based on fabric formwork.
Settings
Basic structural aspects on possible structural behaviours led to two different fitness criteria that were set in relation to the curvature degree on resulting doubly curved surface configurations.
All individuals with less than two support points are not evaluated in the process
Mutation Strategy
Mutation probability: 0.4 Mutation rate: 0.3
Left
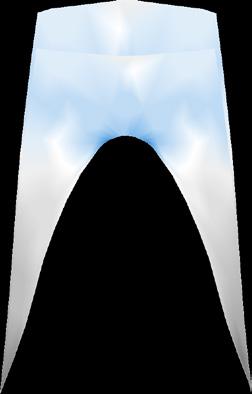
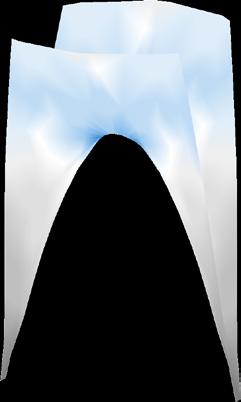
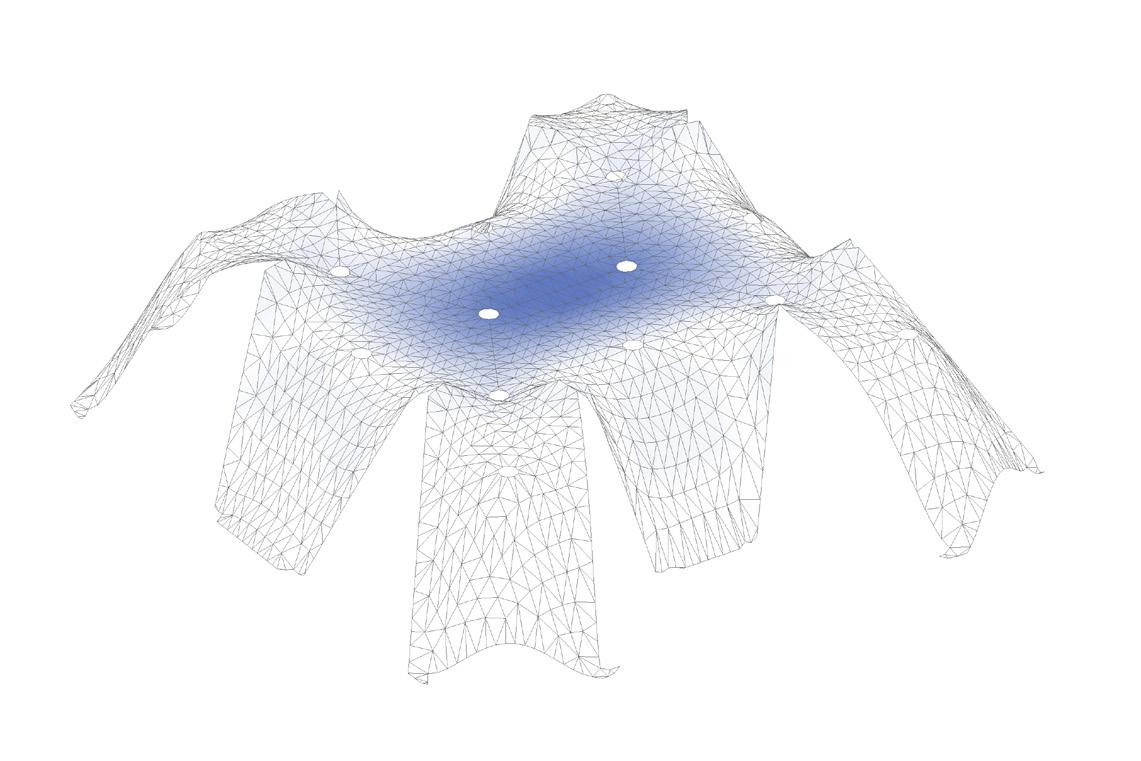
Fig. 3.6 Body plan, parameters and algorithm settings. The body plan is showed with the geometry later selected to make it clearer.
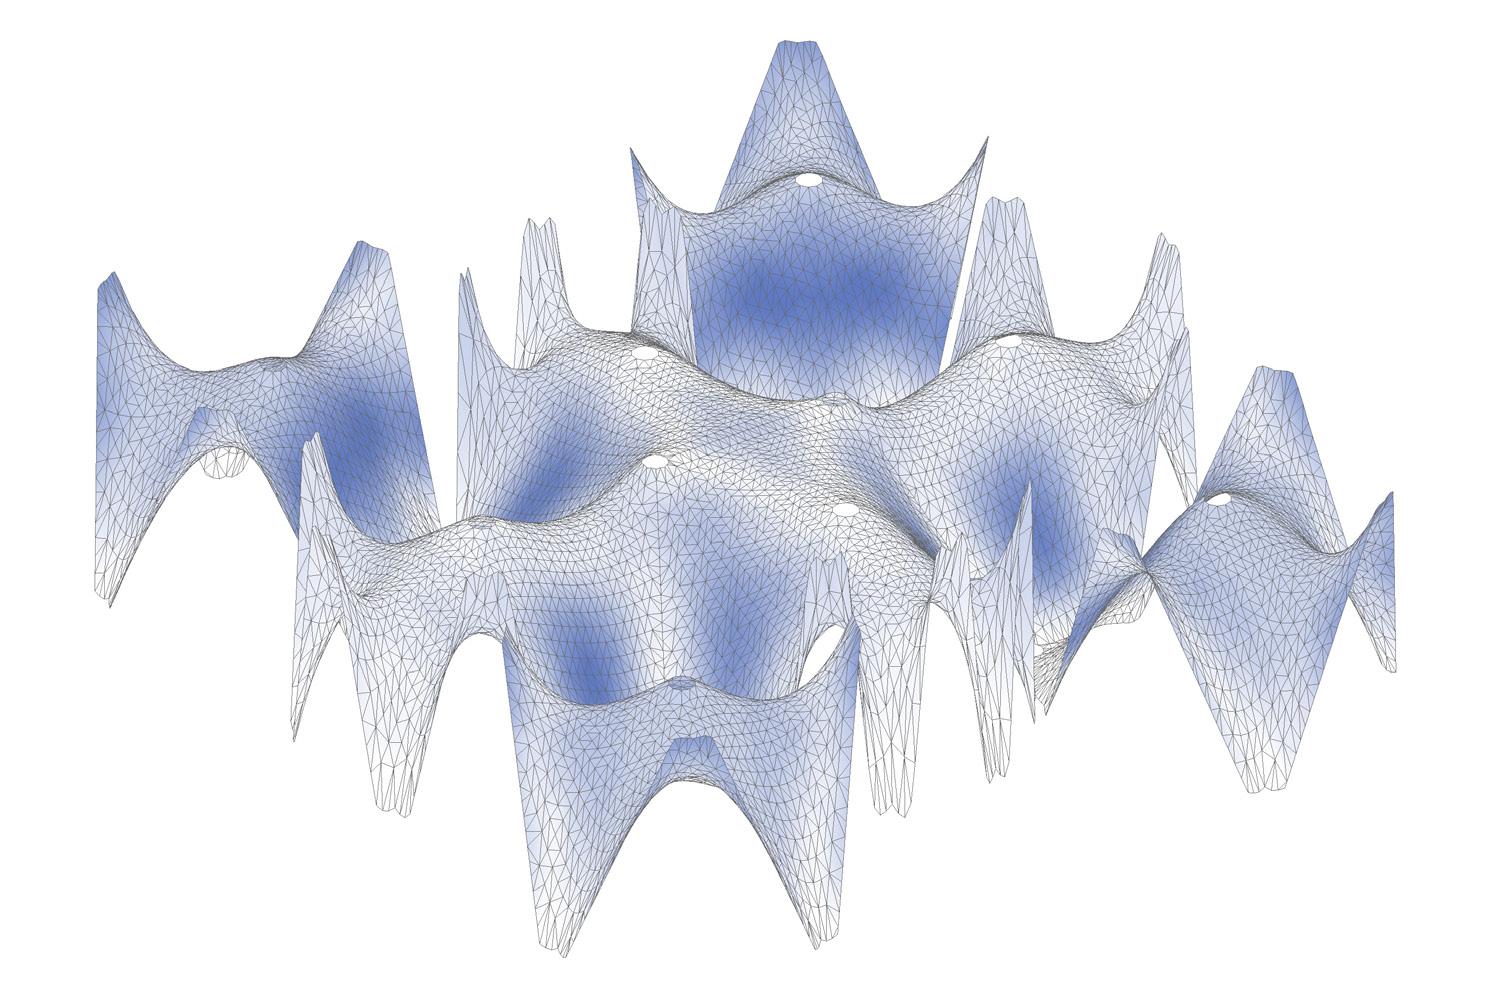
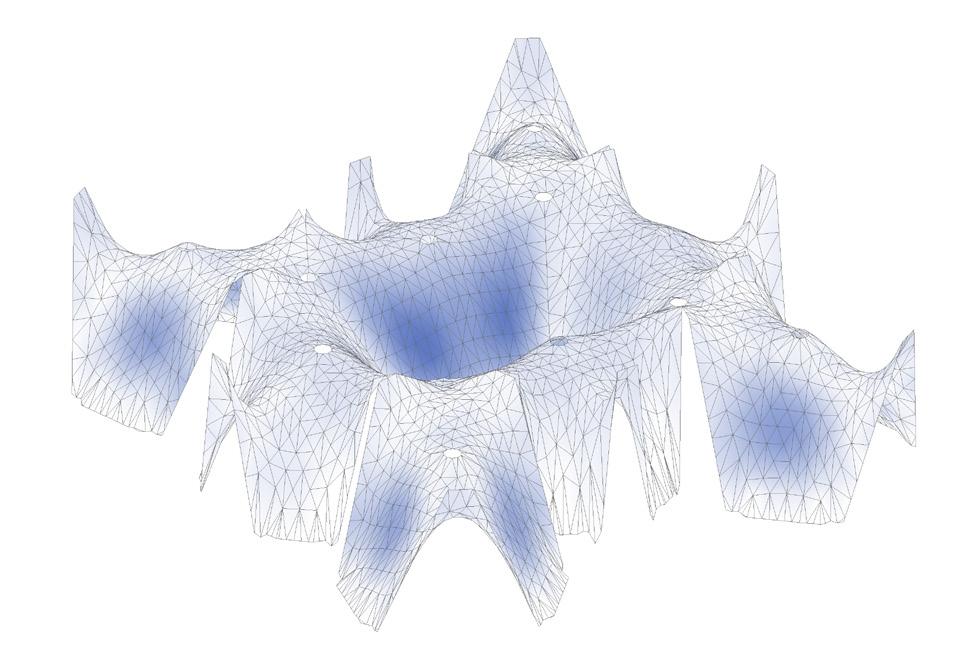
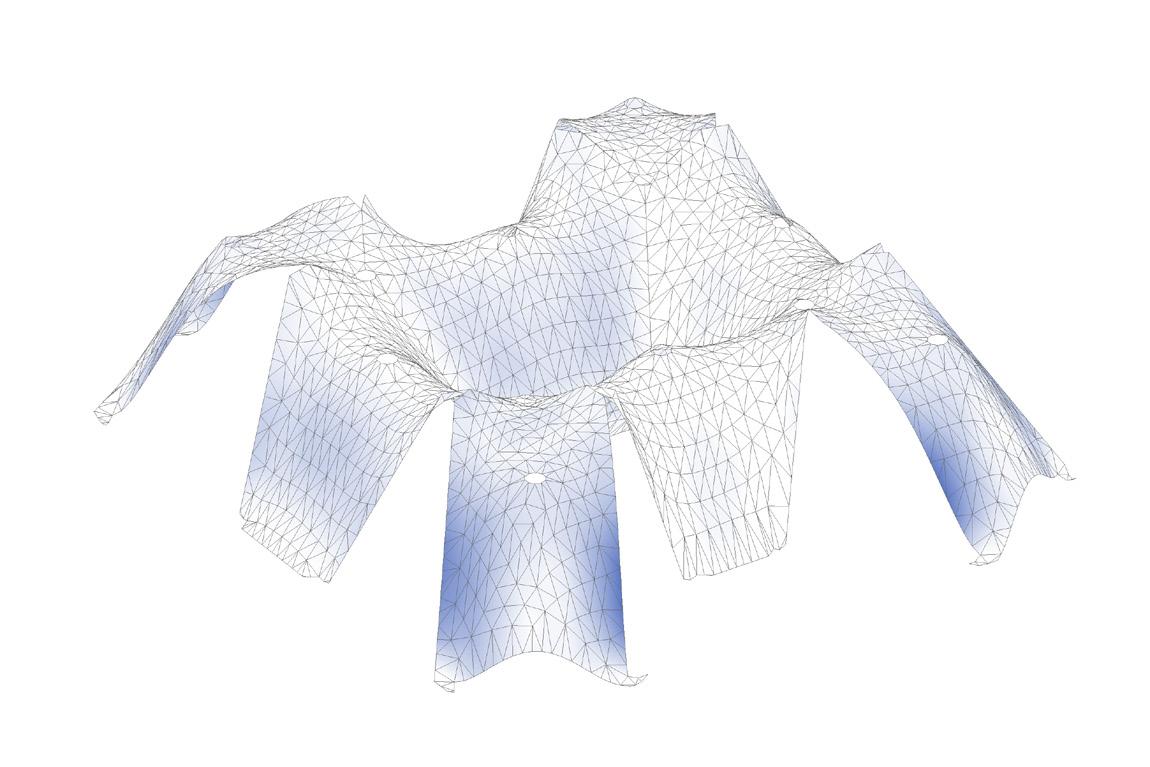
In particular, the system is based on a wave configuration which presents an alternating path of points on which the fabric is stretched. The radial shape generates a vaulted structure which identifies a clear space underneath, without using additional props or falsework.
The geometry is generated on the basis of an initial polygon, while the edges are designed as straight lines to facilitate the fabrication process and the aggregation processes. The curvature of the surface edges is expected not to affect the stability of the design in a significant way. On the other hand, the supporting points, which are restrained to the ground, generate ‘pillars’ formation which are expected to work mainly as compressed members.
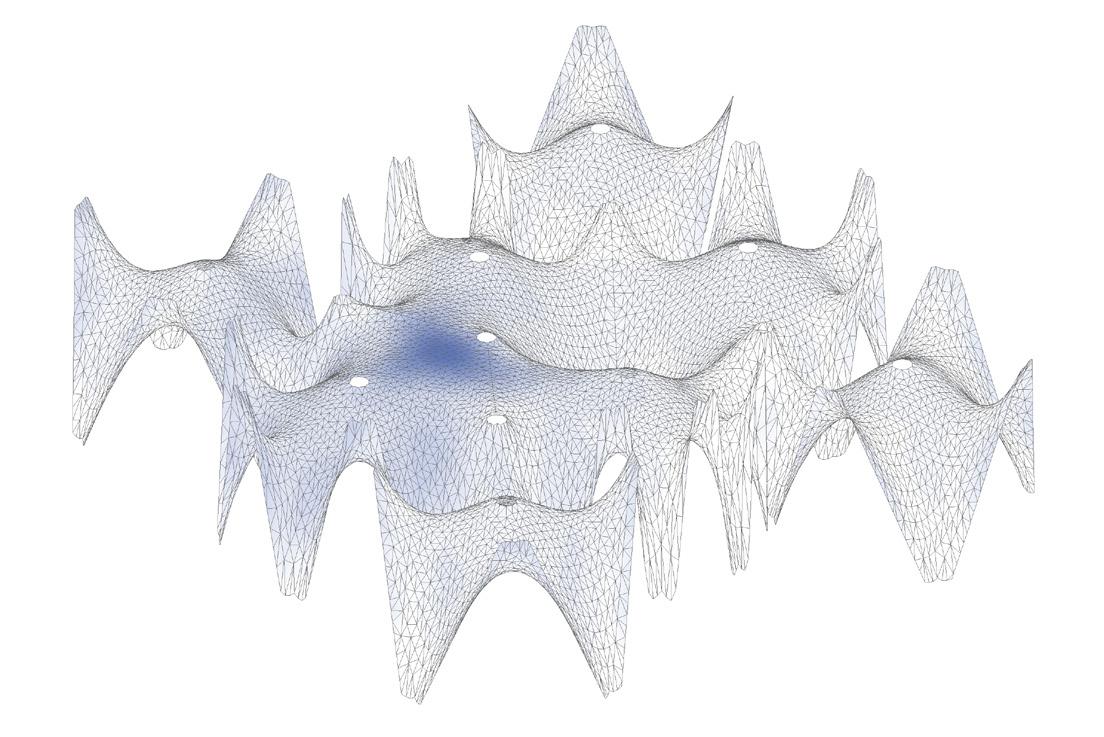
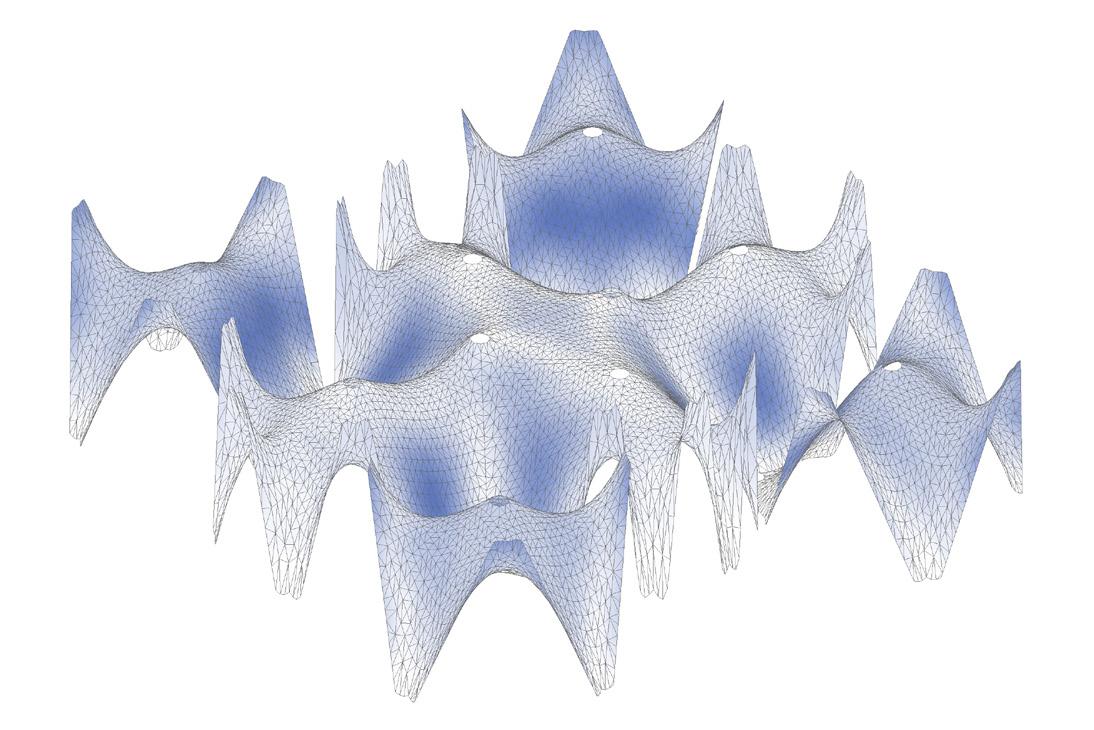
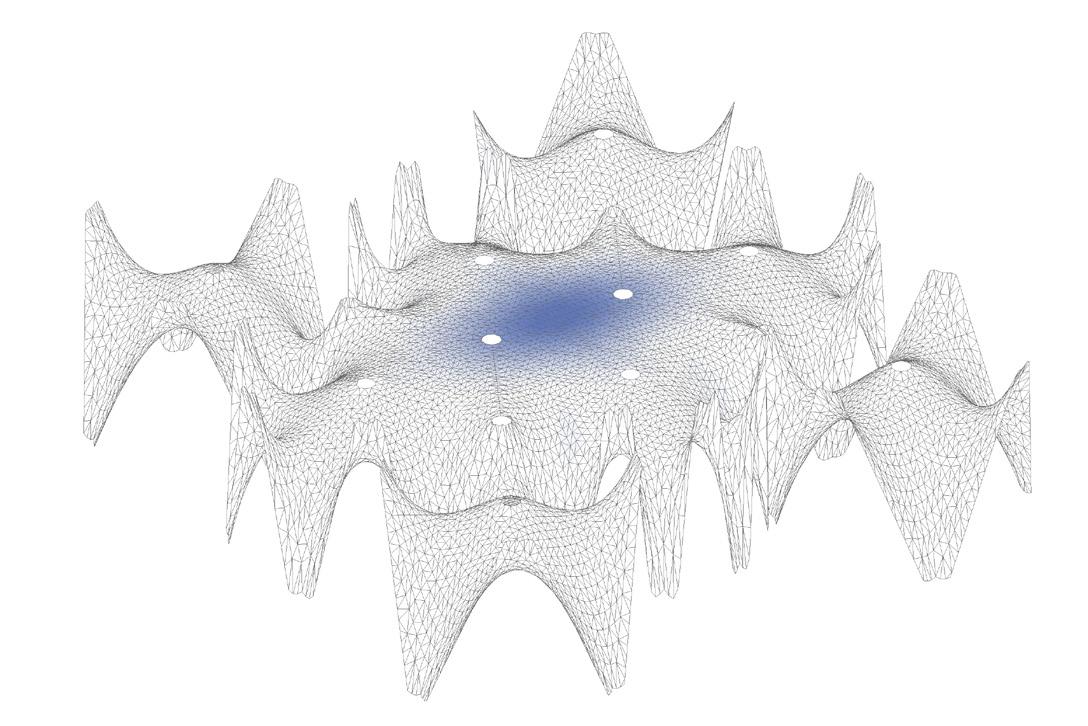
Geometry Evaluations
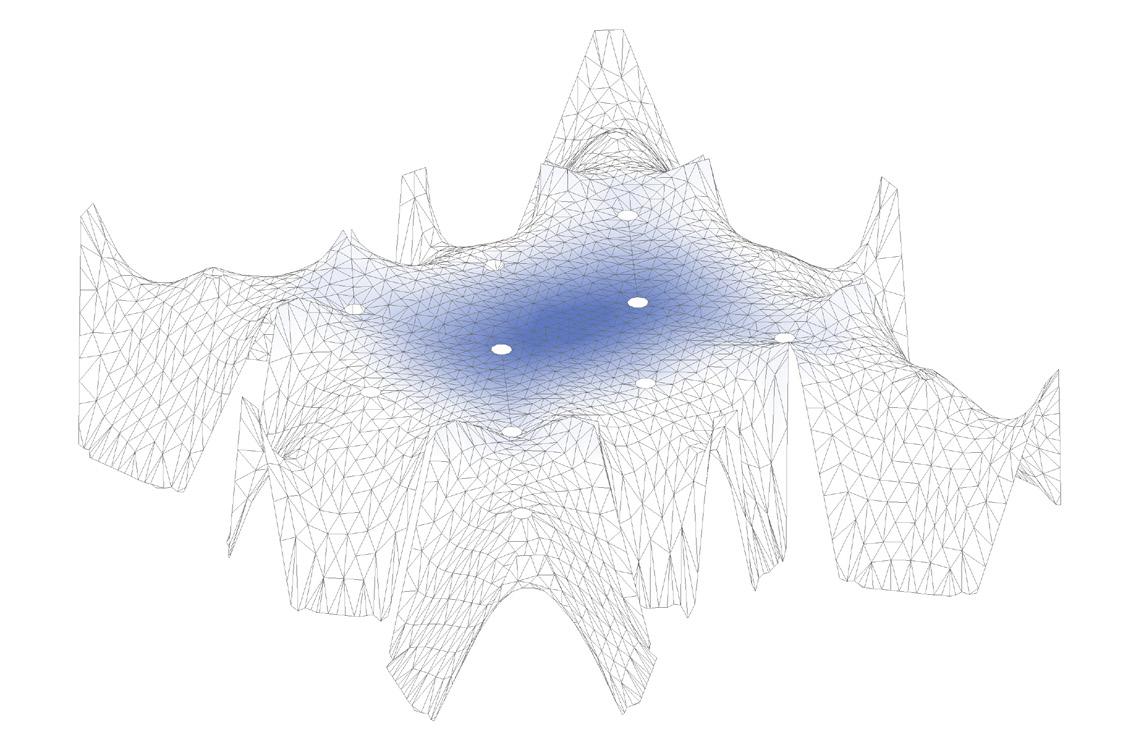
The experiment has led to high convergence in the resulting population. It is possible to observe
two main geometries families, where the number of supporting points is two or three.
The curvature radius is related to the proportion between base and height of the structures. Here, the evolutionary process has privileged tall structures with smaller diameters in order to maximize the curvature degree on the surface. While the anchor points, where the fabric is stretched in opposite directions, should be as close as possible. Moreover, to decrease the distance between two vertical supports, the process led to increase the number of vertices in the polygon; for example, the latest generations present only octagon as final output.
In relation to the space generated, the overall volume results are between 50 and 80 % of the bounding box of the whole geometry. Furthermore, the centre of the membrane was introduced in the algorithm as a constraint element independently from the supporting points: its height is extremely relevant in
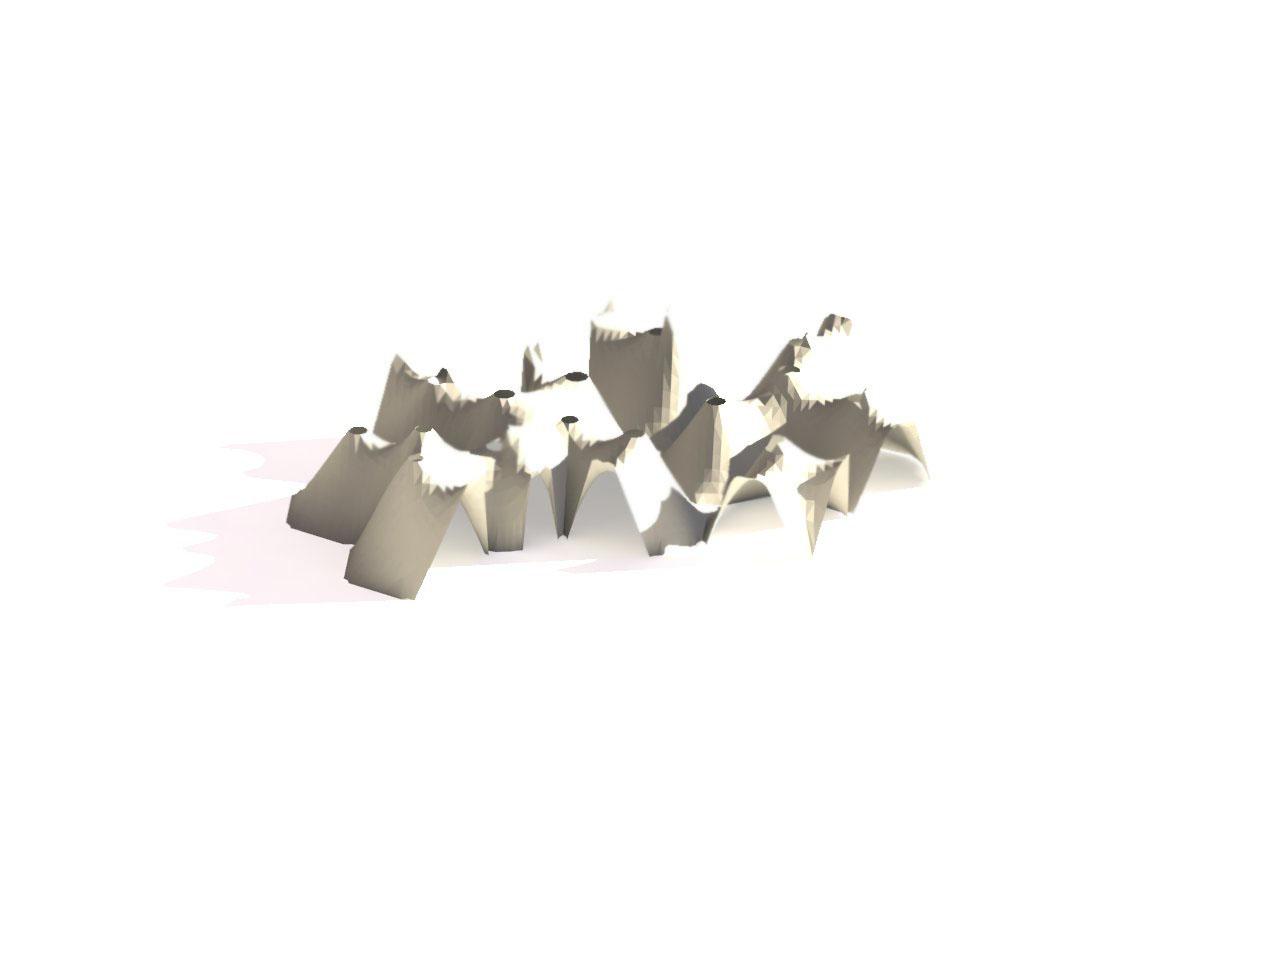
Right
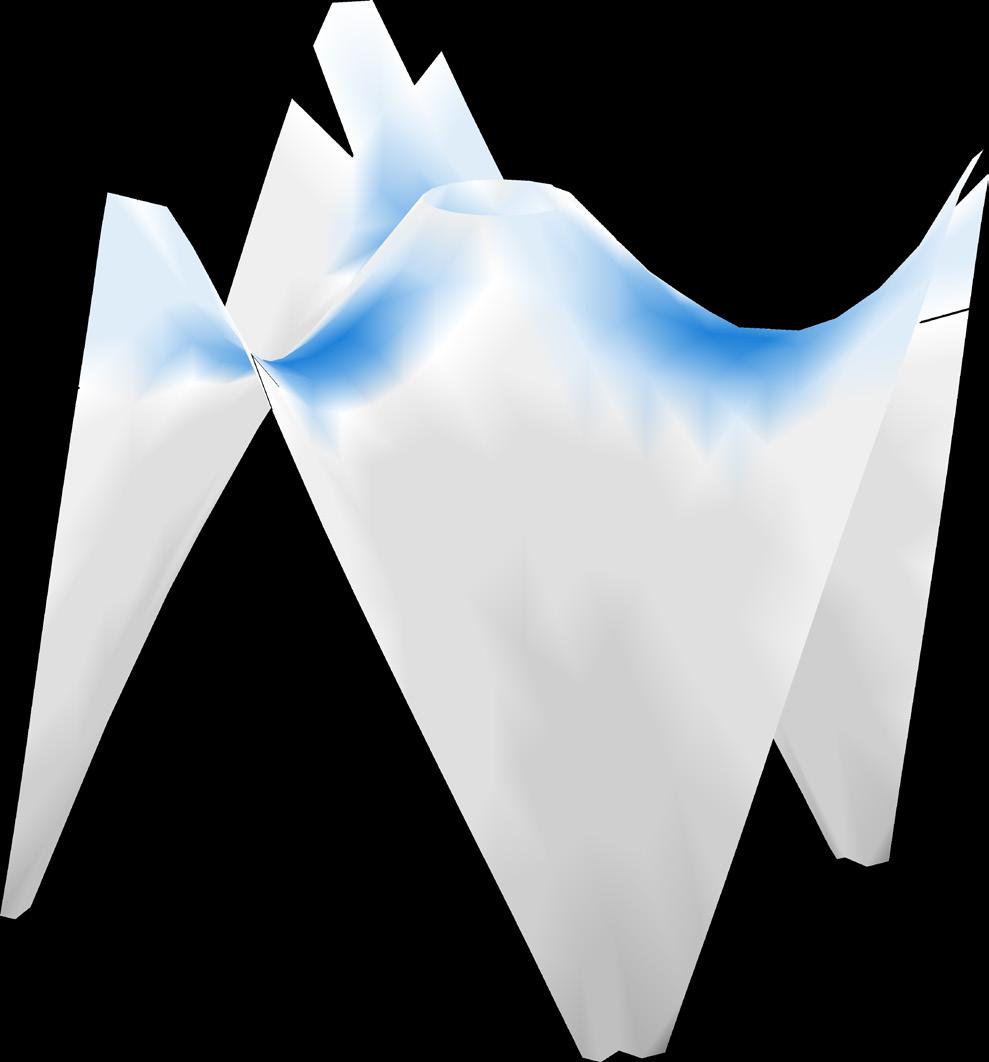
Fig. 3.7 Selected geometry, diagram. This shape was chosen after the whole experiment evaluation, considering geometry and structural analysis.
Anchor
Left
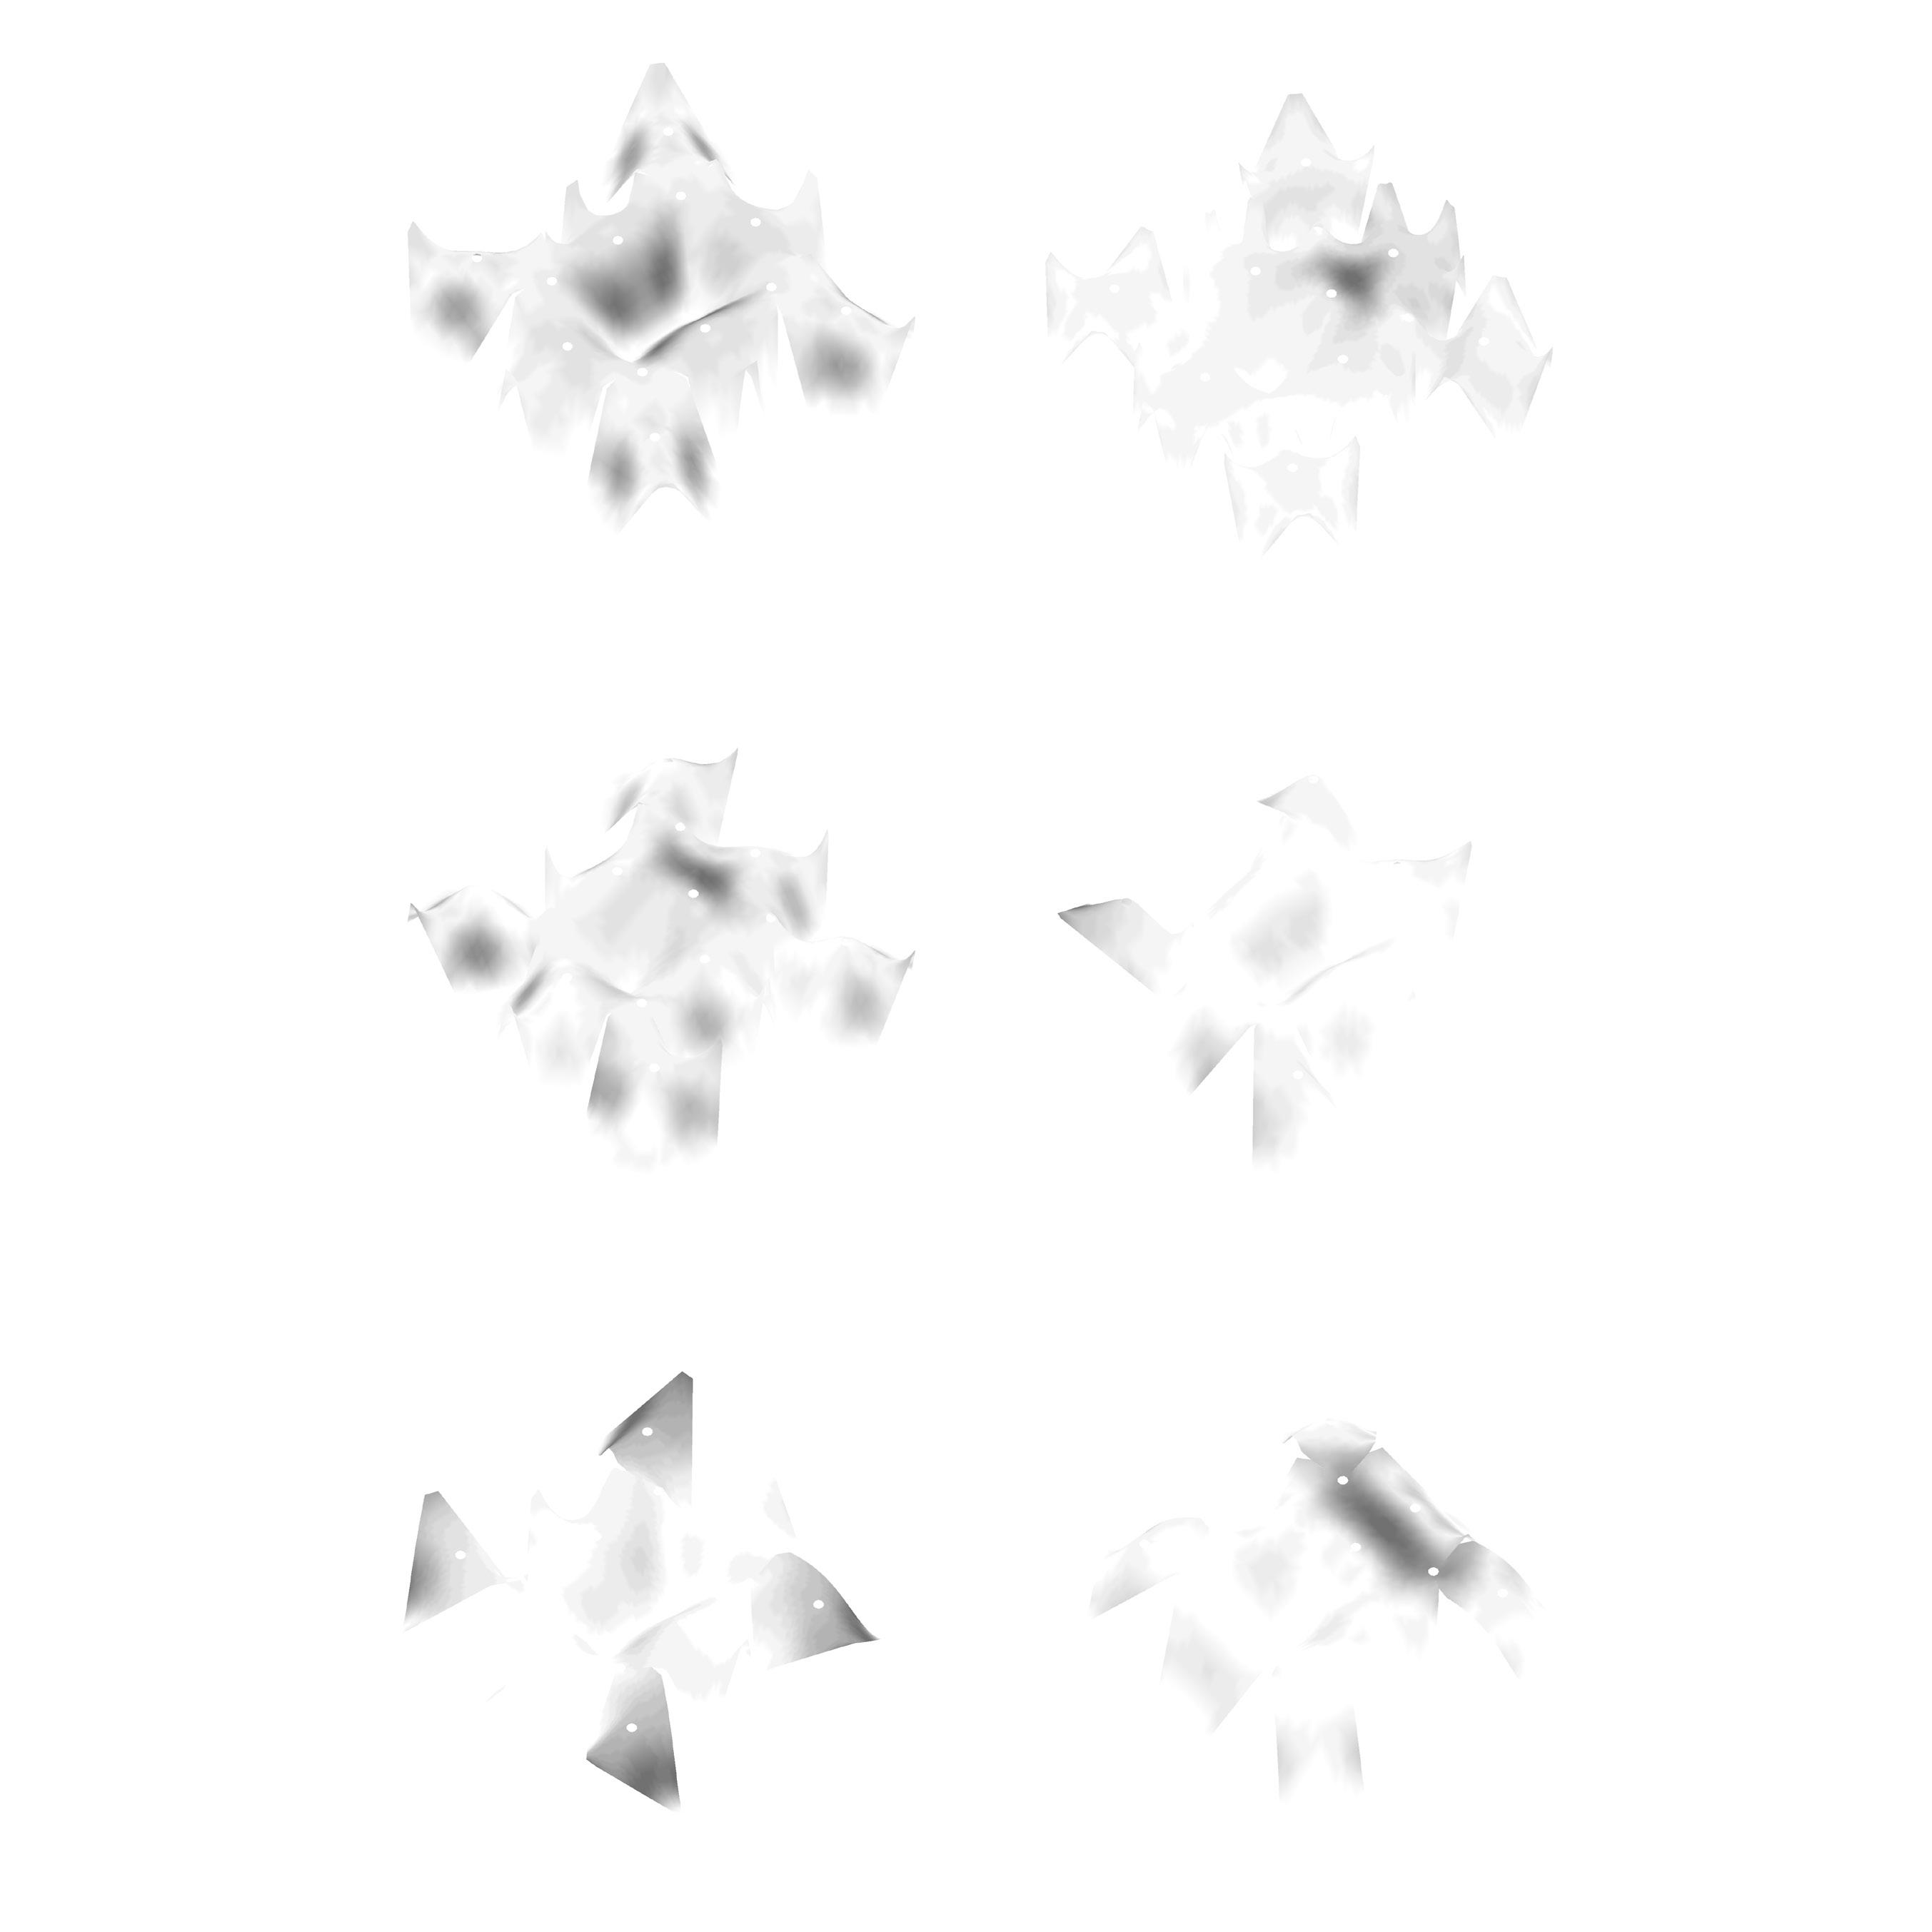
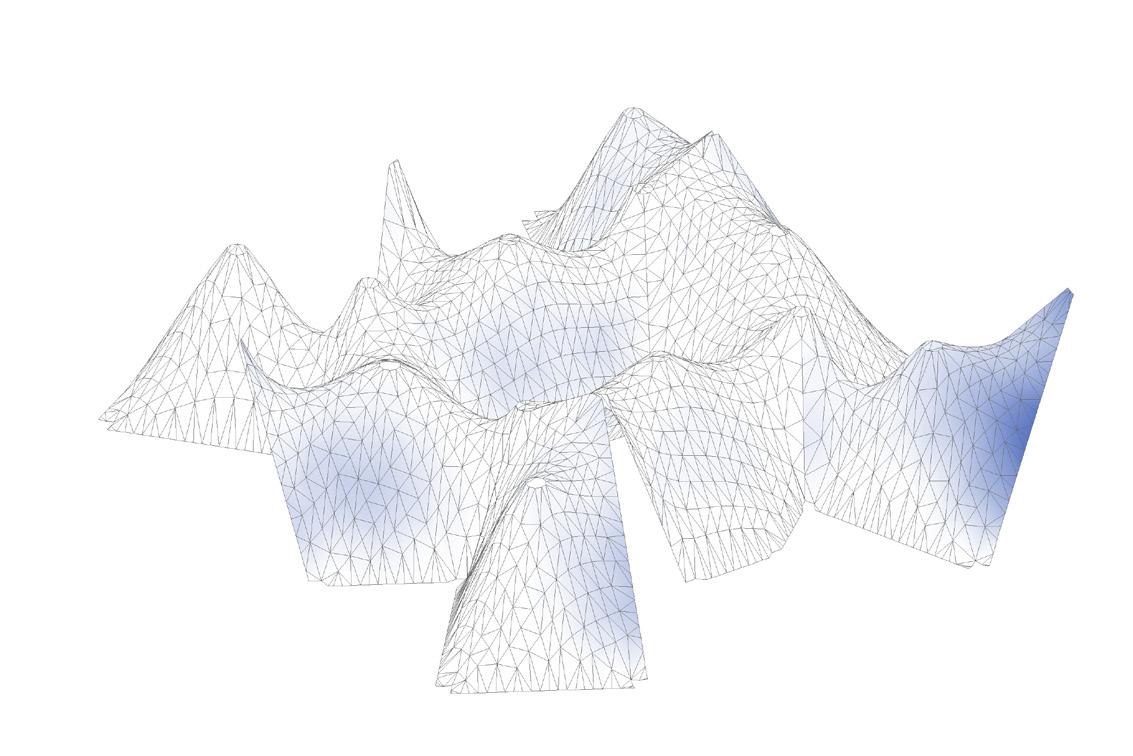
Fig. 3.8 Generations 15 and 30, geometry outputs. The indicated percentage show an average between the two fitness criteria. The best individuals per generation are highlighted in light blue.
Number of verteces
Base radius (m)
Height (m)
Height clearence (%)
Vertical supports
Ground support area
Mean curvature radius (m)
Diameter/Height
at 2 m high (%)
defining a larger value of volume. Higher volume percentages are achieved by those geometries with a central point placed at 0.9 % of the total height. While, not symmetric locations resulted into a non uniform distribution of curvature.
In the end, the number of vertical supports affects the clearance and we can observe, that the individuals with less vertical supporting points present more usable space than the others.
Right
Fig. 3.9 Generations 15 , data.
Number of verteces
Base radius (m)
Height (m)
Height clearence (%)
Vertical supports
Ground support area
Mean curvature radius (m)
Diameter/Height
Clearence at 2 m high (%)
Left
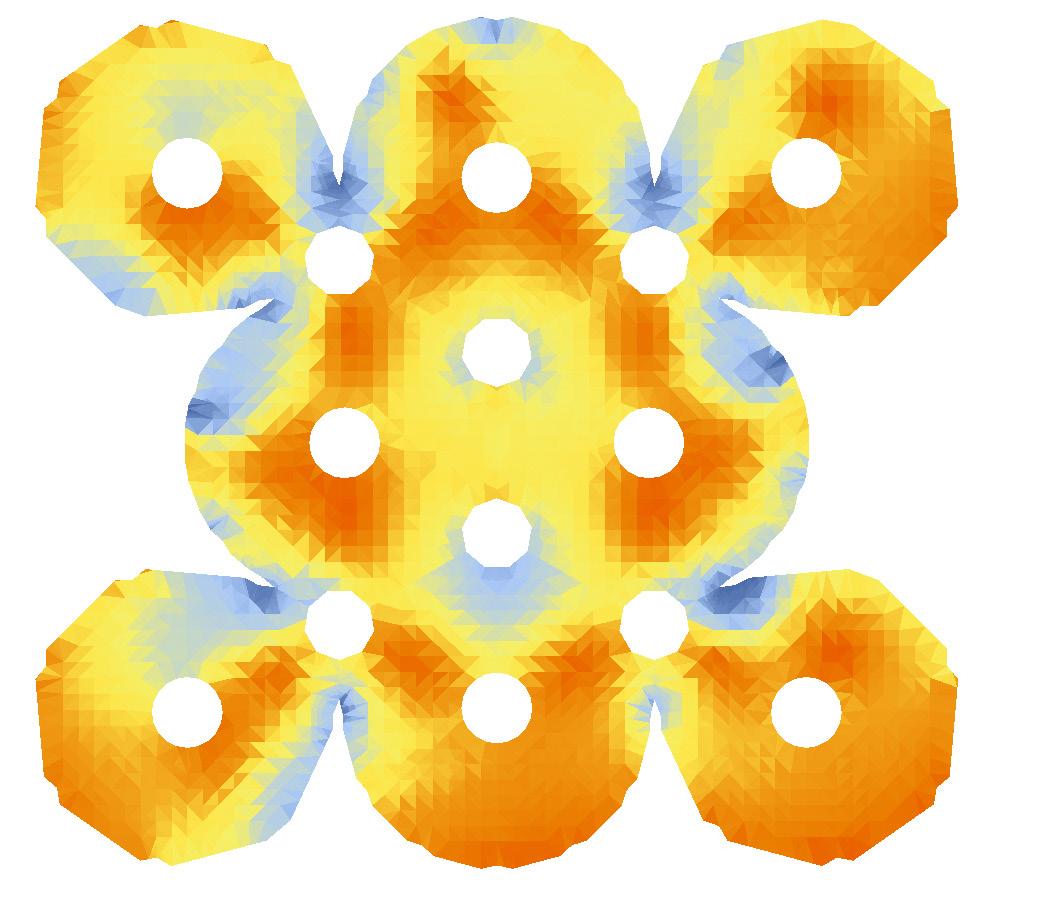
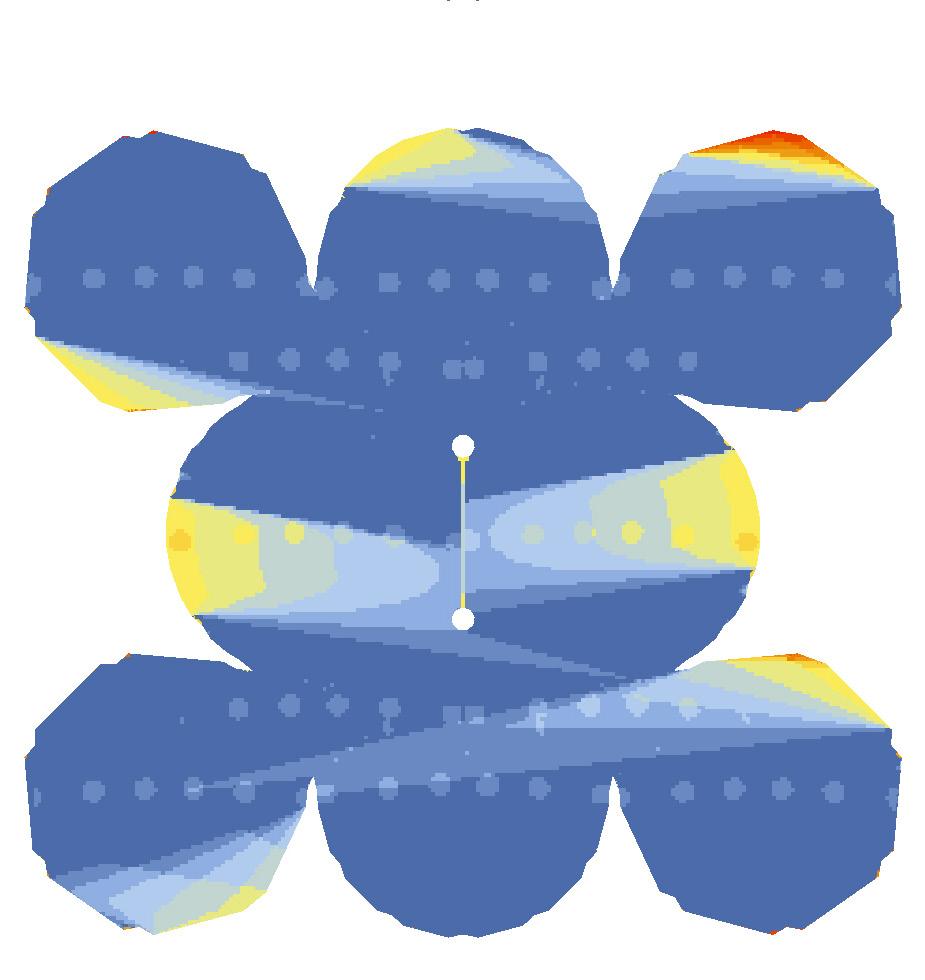
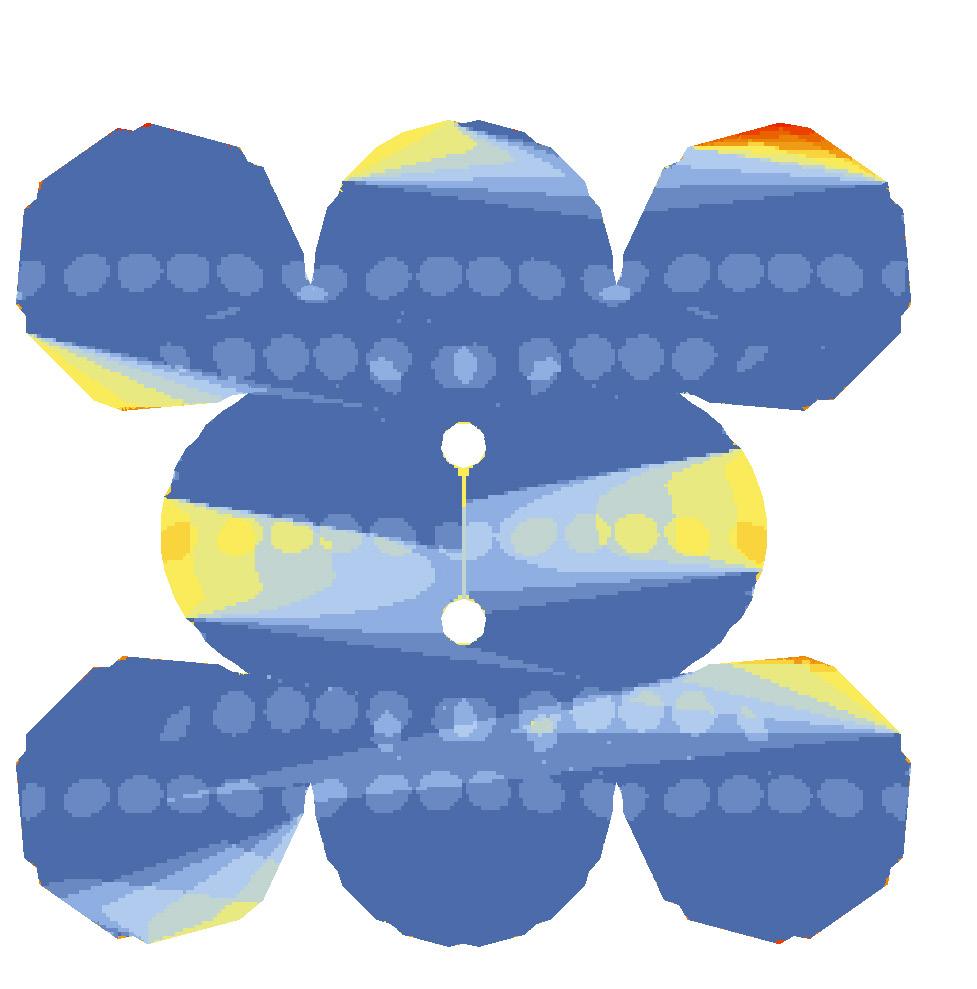
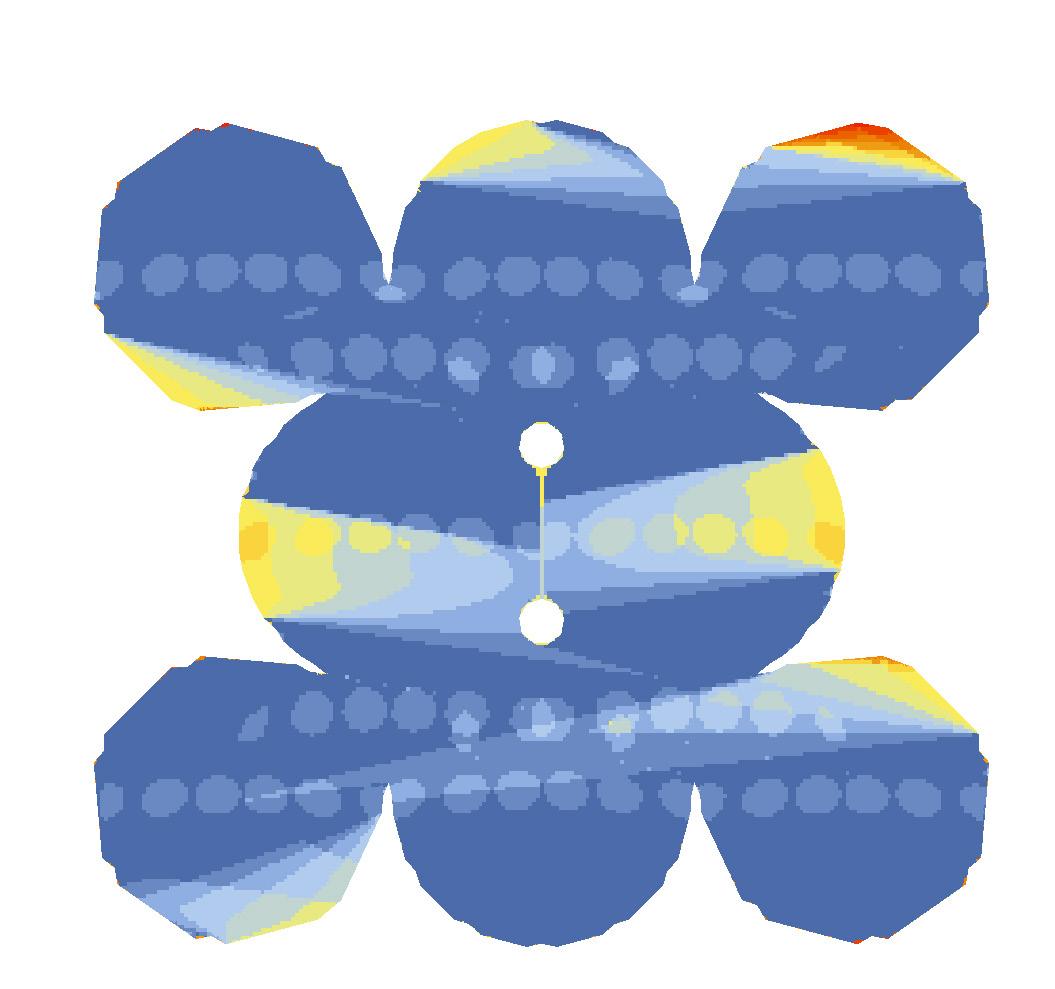
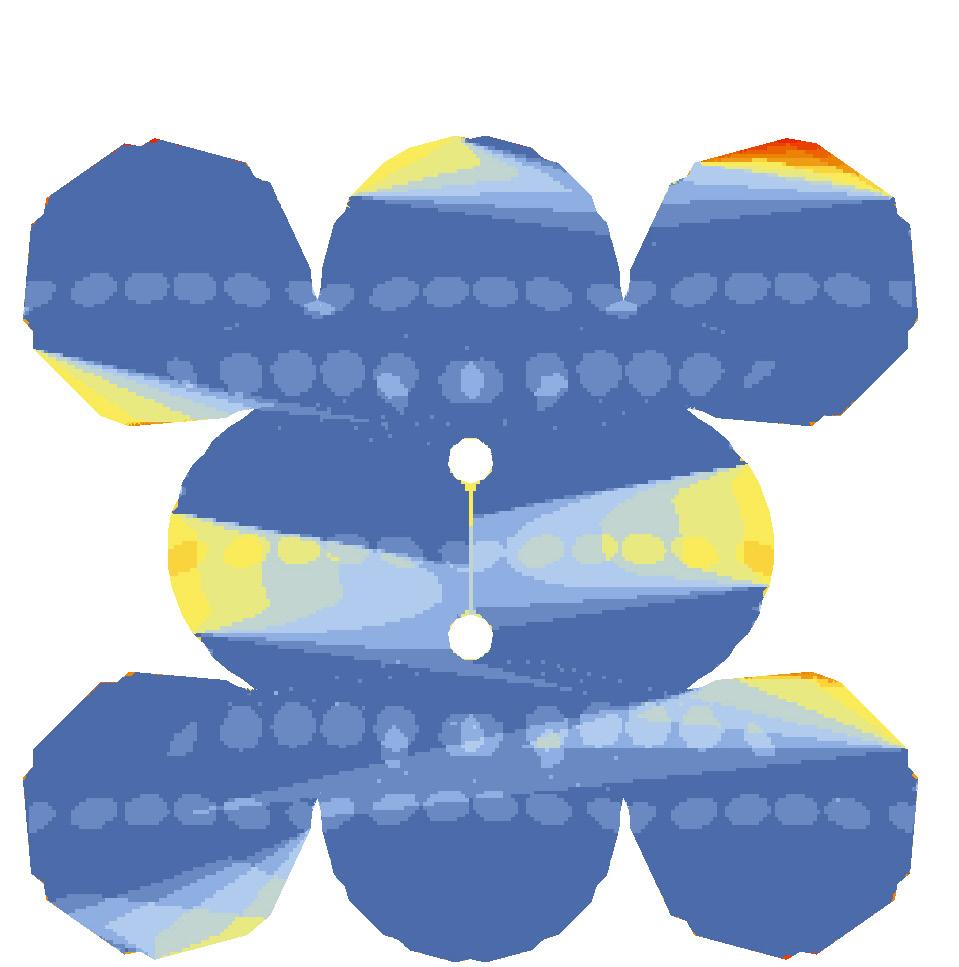
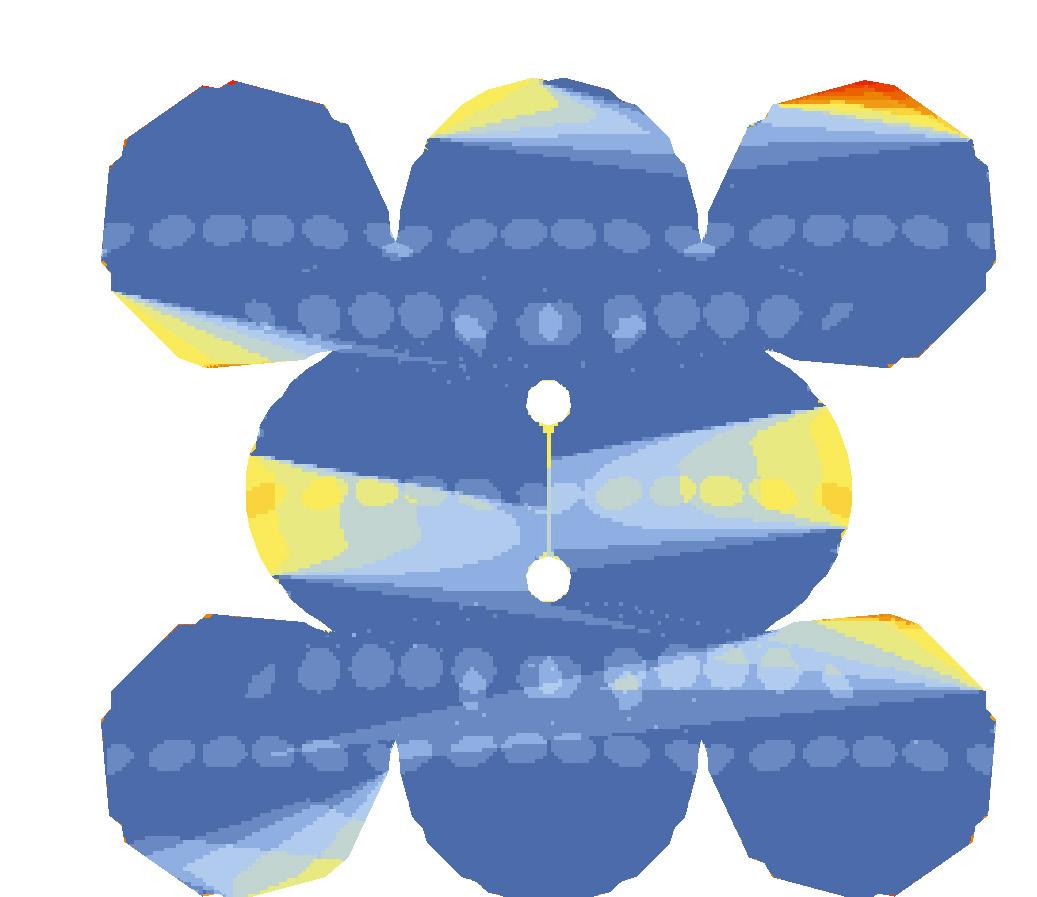
Fig. 3.10 Generations 30 data.
Legend: Displacement
Structural Analysis
The generated outputs were evaluated through a structural analysis to make the evolutionary experiment more complete and to have a deeper knowledge of the possible behaviour of the unit.
Aim
The structural analysis was run with the intention of understanding the main features that affect the design process throughout a comparison amongst all individuals of generation 15 and 30. The values extracted are only valid in terms of comparative evaluations.
Settings
Maximum displacement along the edges
Restraints: x, y, z
The settings come from literature values and they are related to the generic properties of earth materials. The tensile strength of earth is related to a mix of earth plus natural fibres, that are supposed to be used in the next explorations. (Minke, 2007)
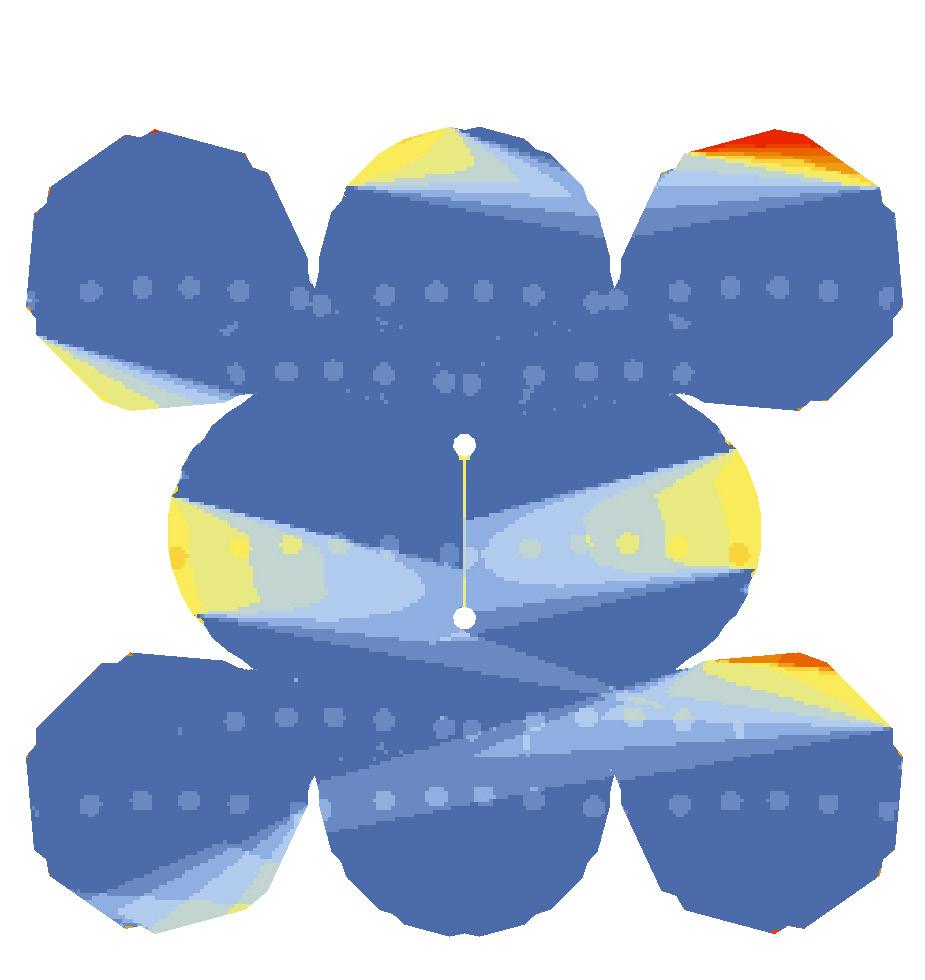
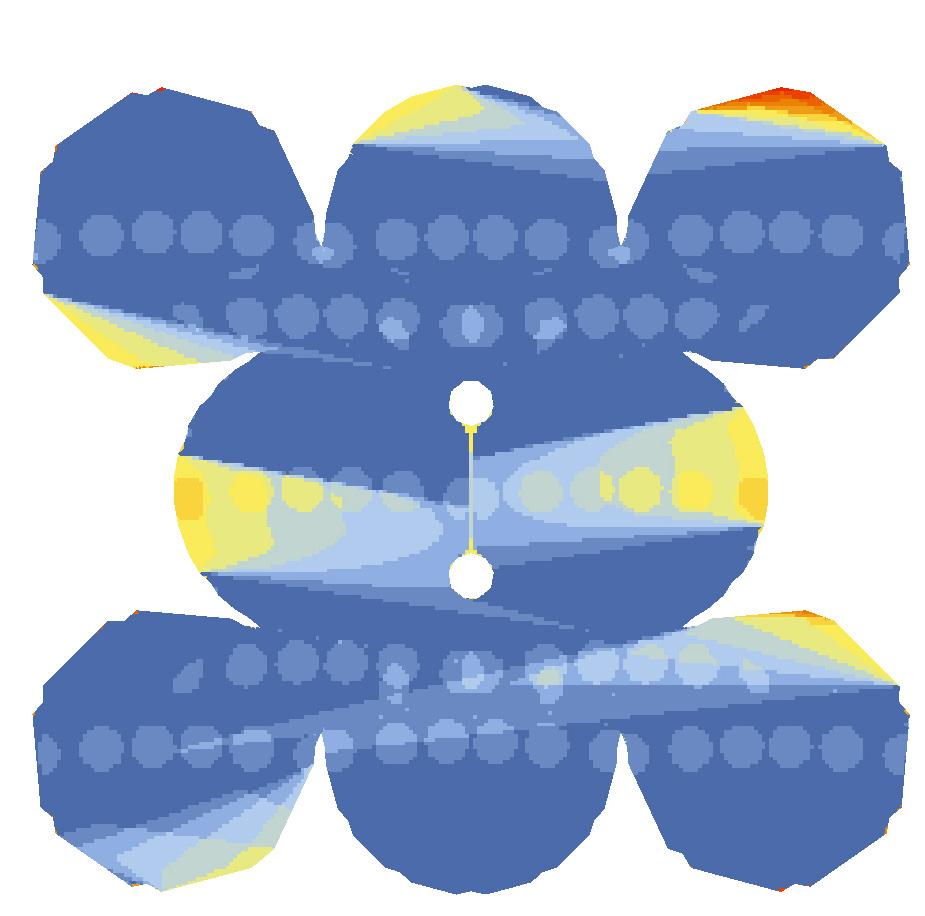
Fig. 3.12 Generations 15 and 30, displacement analysis. The individuals with less displacement are highlighted in light blue.
Left
Utilisation Analysis
Selected output
Legend:
Maximum utilisation in compression 3 %
Maximum utilisation in tension 7 %
Geometry Properties
In order to have a real comparison amongst different geometries, all the meshes have the same cross section.
Shell
Cross section thickness: 10 cm
Restraint Conditions
All the meshes are restrained in x, y and z, where the vertices touch the ground. They were considered as hinges that work in tension and in compression. Unfortunately, this does not represent the real connection to the ground because they can work in tension, therefore, the displacement analysis will be followed by a self stability evaluation.
Load Case
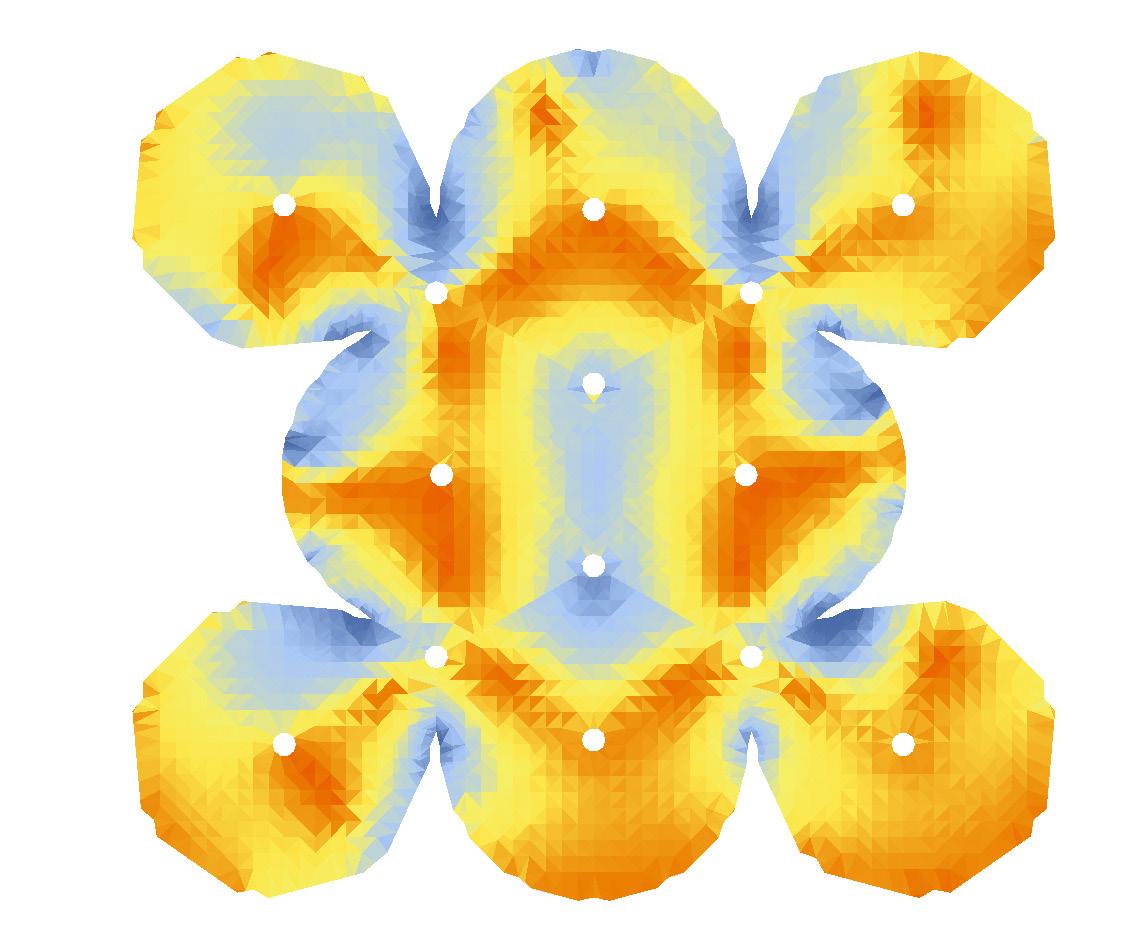
Maximum utilisation in tension (extrados)
Maximum utilisation in compression (extrados)
Restraints: x, y, z
Evolutionary process outputs are evaluated under their self weight without any other dead or wind load.
Observations and Conclusions
In the geometries with two main restraint points, the largest displacement is located on the cantilever side of the surfaces, while in the shape with three anchor points the major displacement is closer to the lateral edges. The best generated output in terms of displacement is G15.06, where the ratio between hight and width is lower.
The utilization output shows that three restraint points geometries have lower values of utilization, while the major part of the two restraint points geometries have much higher values.
Left Fig. 3.14 Generations 15 and 30, utilization analysis. The individuals with lower values are highlighted in light blue.
Ground restraints
Height: 2.00 m
Widht: 1.75 m
Restraints: x, y, z
We can observe, that also in this case, G15.05 has the best values in terms of utilization, both in tension and in compression.
The data extracted from the utilization analysis, is developed in according to the von Mises criterion, that is not the proper way to verify a shell structure in earth. However, the results are used only for the comparison among the generated surfaces and they are not considered as valid structural verifications.
Finally the structure was evaluated in relation to its self stability, without considering working in tension restraints, and, on this basis, the only self stable buildable outputs are G15.04, G15.05, G15.06 and G30.08.
In conclusion, we can say that the shape with the highest rate in terms of constructability is G15.06. Because it is self-stable, has the lowest values of displacement and utilization. In addition, it has a high fitness criteria ratio.
Right
Fig. 3.15 Selected geometry, stability analysis.
Left Fig. 3.16 Generations 15 and 30, stability analysis. The self stable individuals are highlighted in light blue.
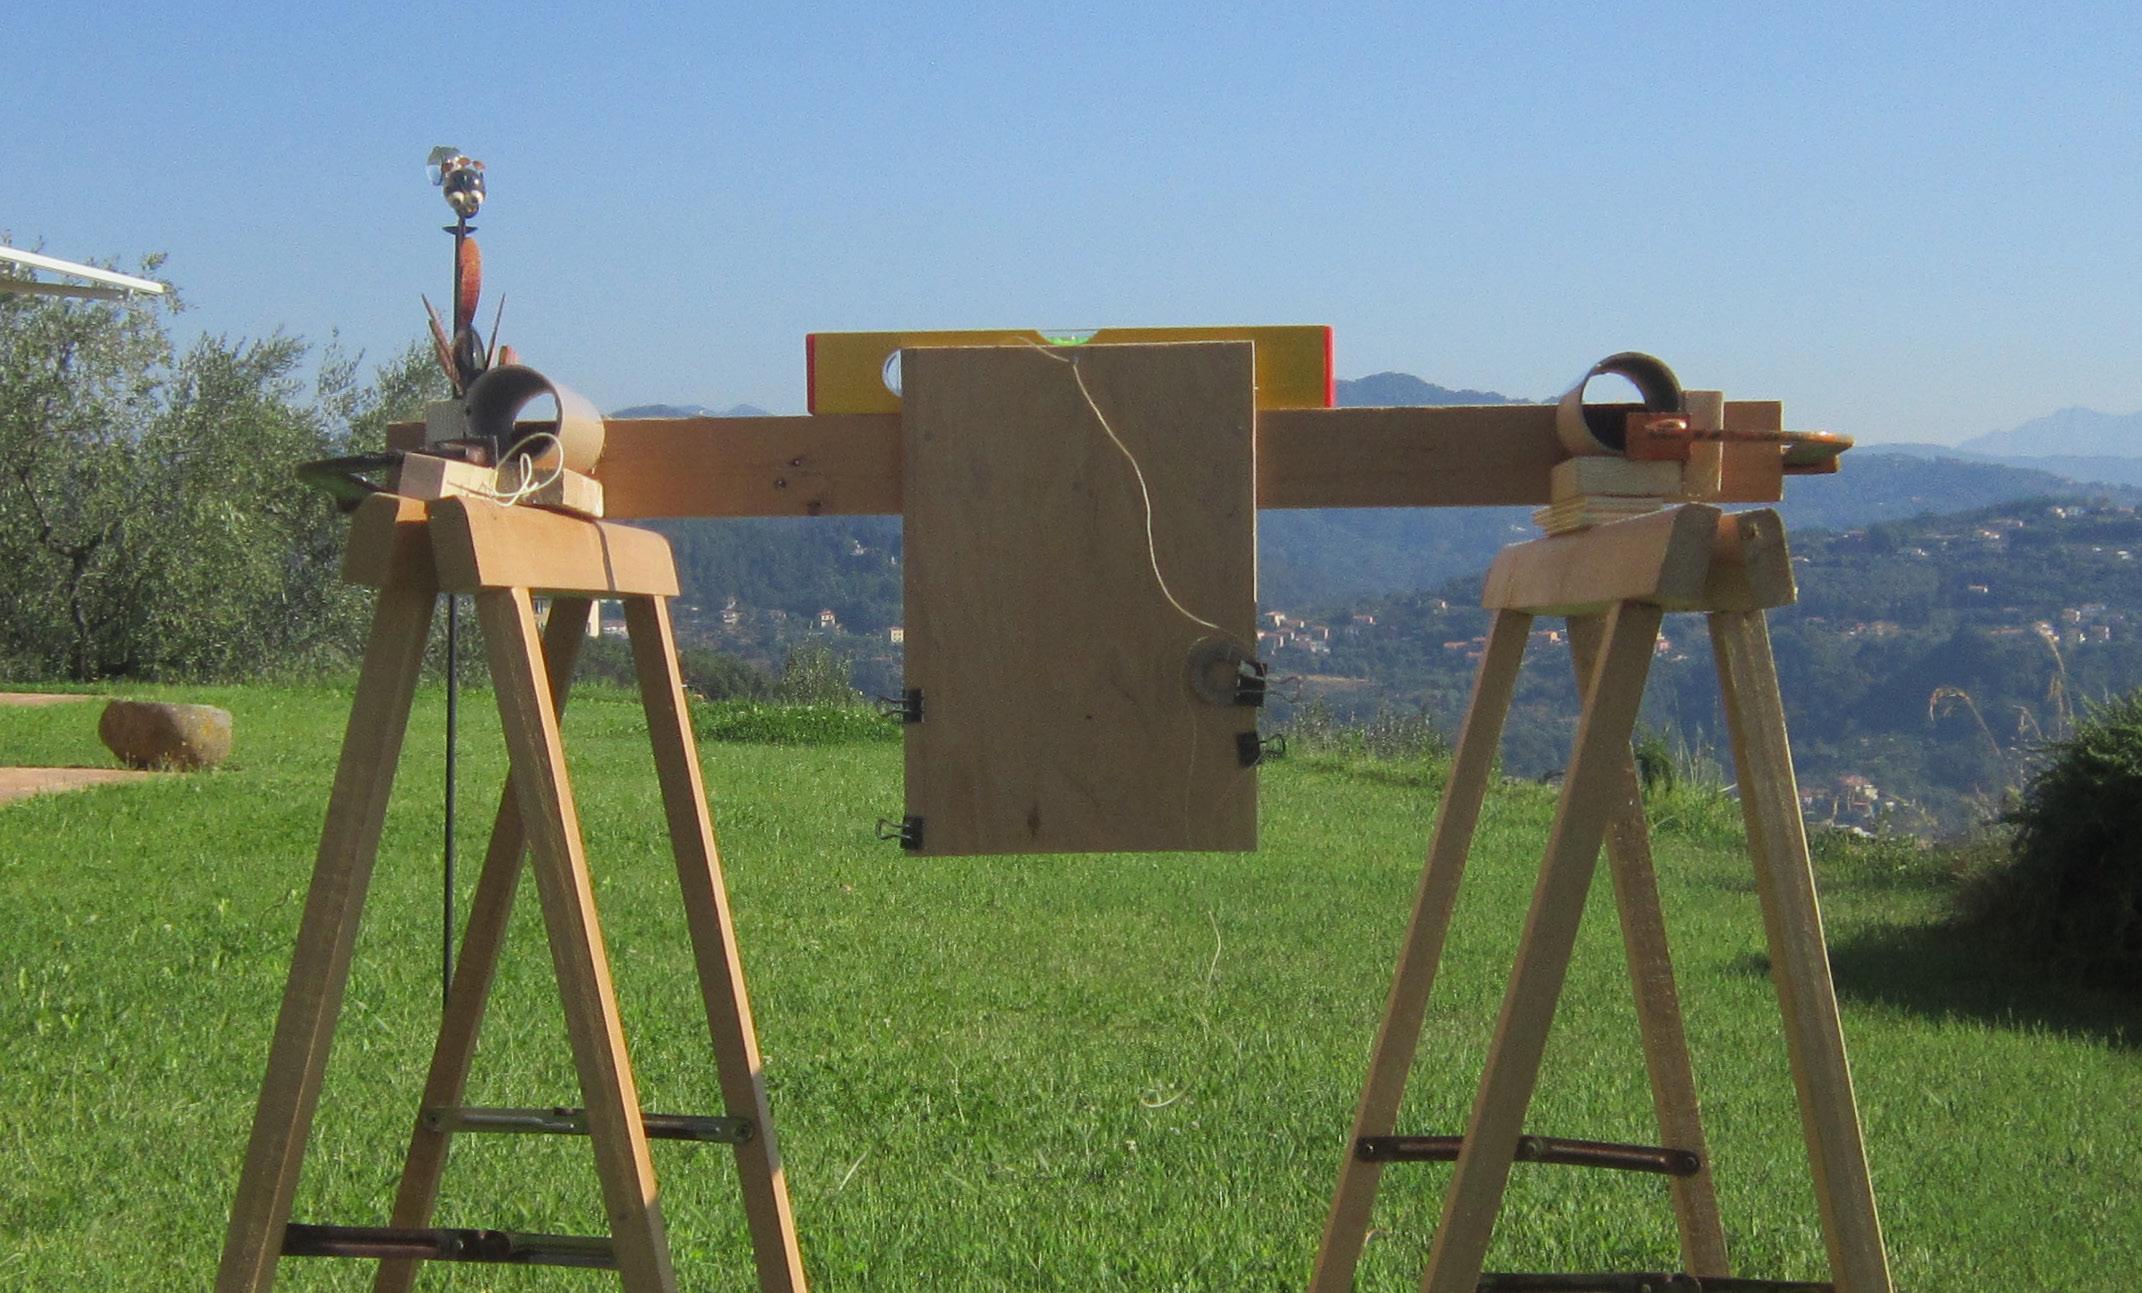
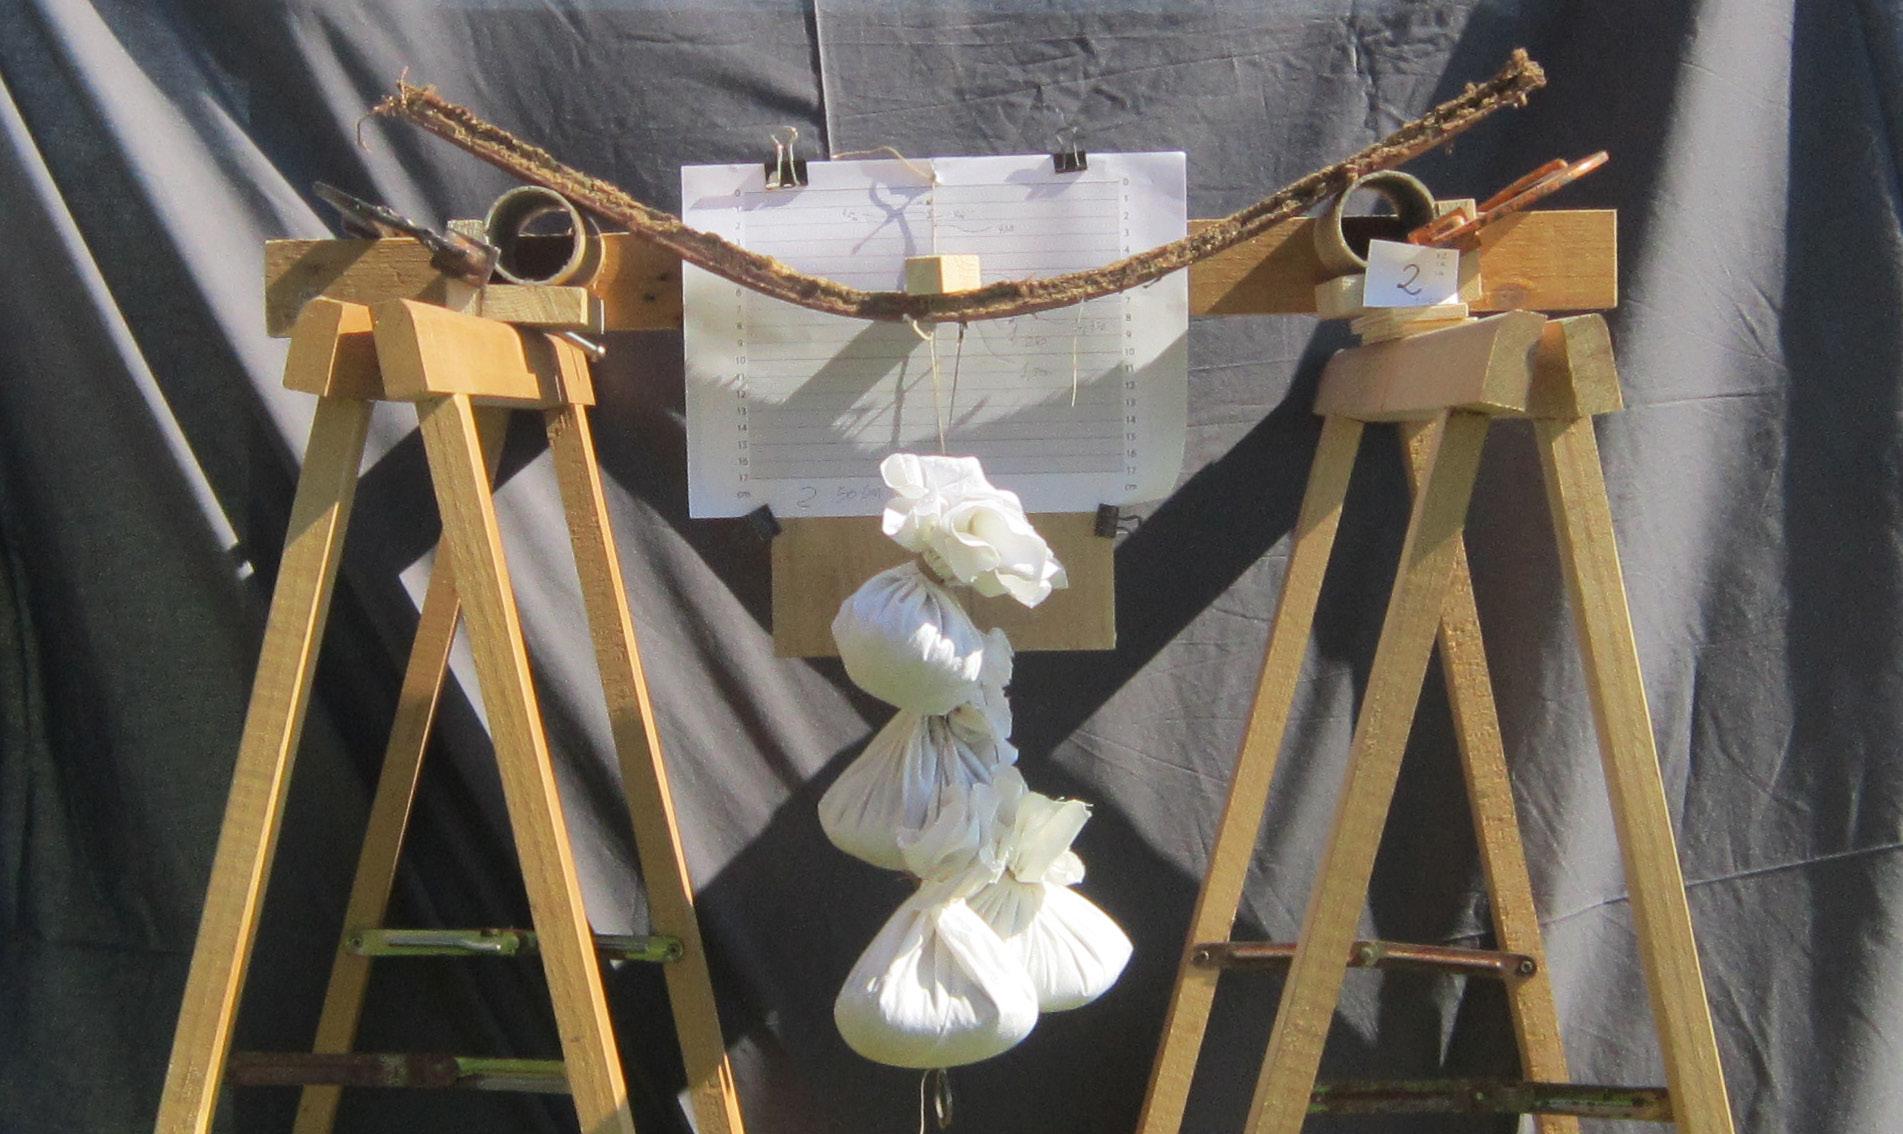
Fabric Formwork Verification
Material Application Feasibility
The aim of the test is to prove, in the digital environment, if a pre-stressed spandex fabric is stiff and strong enough to support the dead load of one or more centimetres of earth. The layer of earth, once dried, will become part of the structure itself, therefore, after few layers, the earthen composite will be self supported, making the fabric formwork no necessary any more.
The displacement analysis was run with the same settings of the previous experiment,
considering one of the highest value of self weight for earth. (Minke, 2007)
The maximum displacement showed under a dead load of 2 cm of earth is around 2 cm.
In conclusion, we can say, that a standard prestressed spandex fabric can be loaded with one or two layers of earth, without achieving higher displacement values. By contrast, we can state that the value of displacement is also directly connected to the membrane pre-stress.
Right
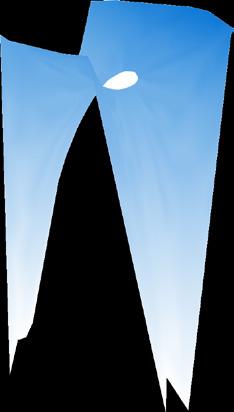
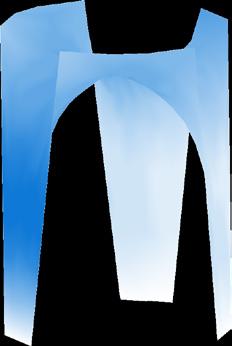
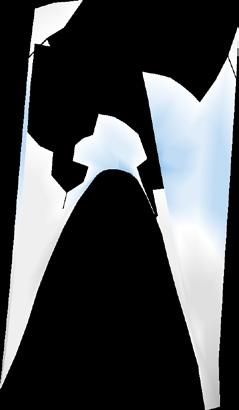
Fig. 3.17 Construction process, diagram.
1. Not stretched spandex fabric
2. Stretching directions
Layers of earth
3. Stretched spandex fabric
4. Pre-stressed fabric formwork under earth dead load
Displacement Analysis
Spandex fabric is restrained on all the external boundary
Above left Fig. 3.18 Table, setting values and results.
Below left
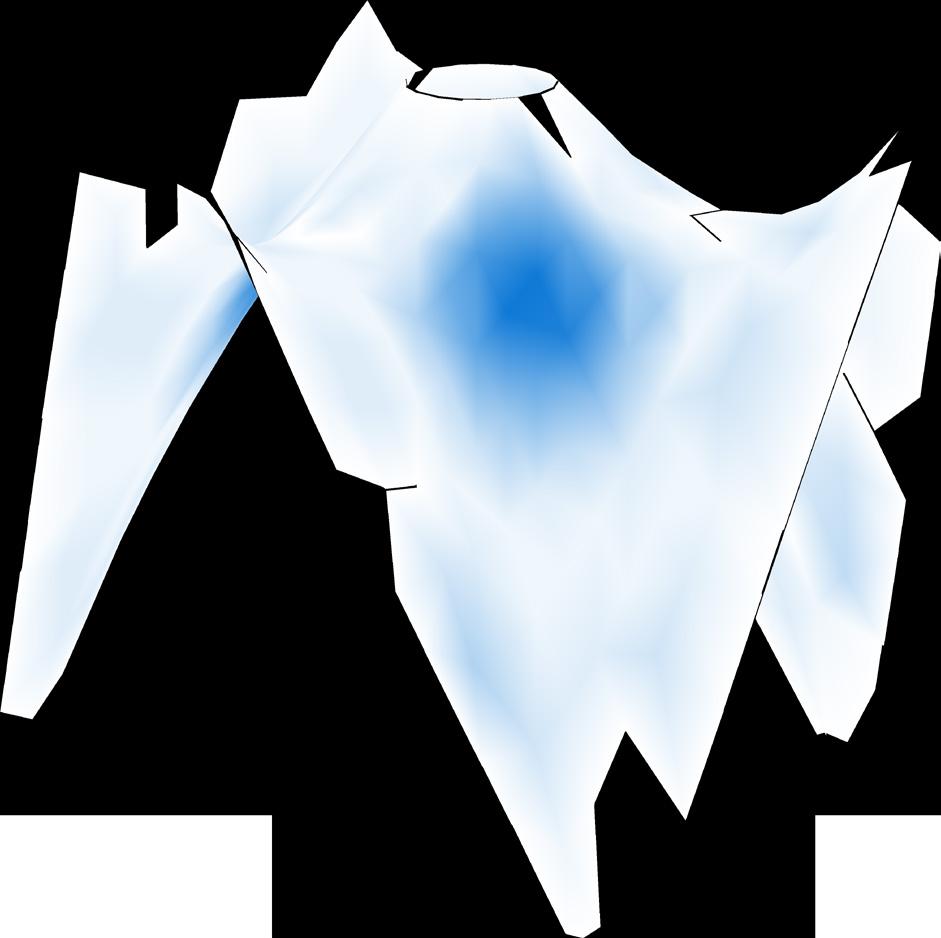
Fig. 3.19 Displacement on a spandex fabric loaded with one layer of earth 2 cm thick.
Spandex fabric is restrained on all the external boundary
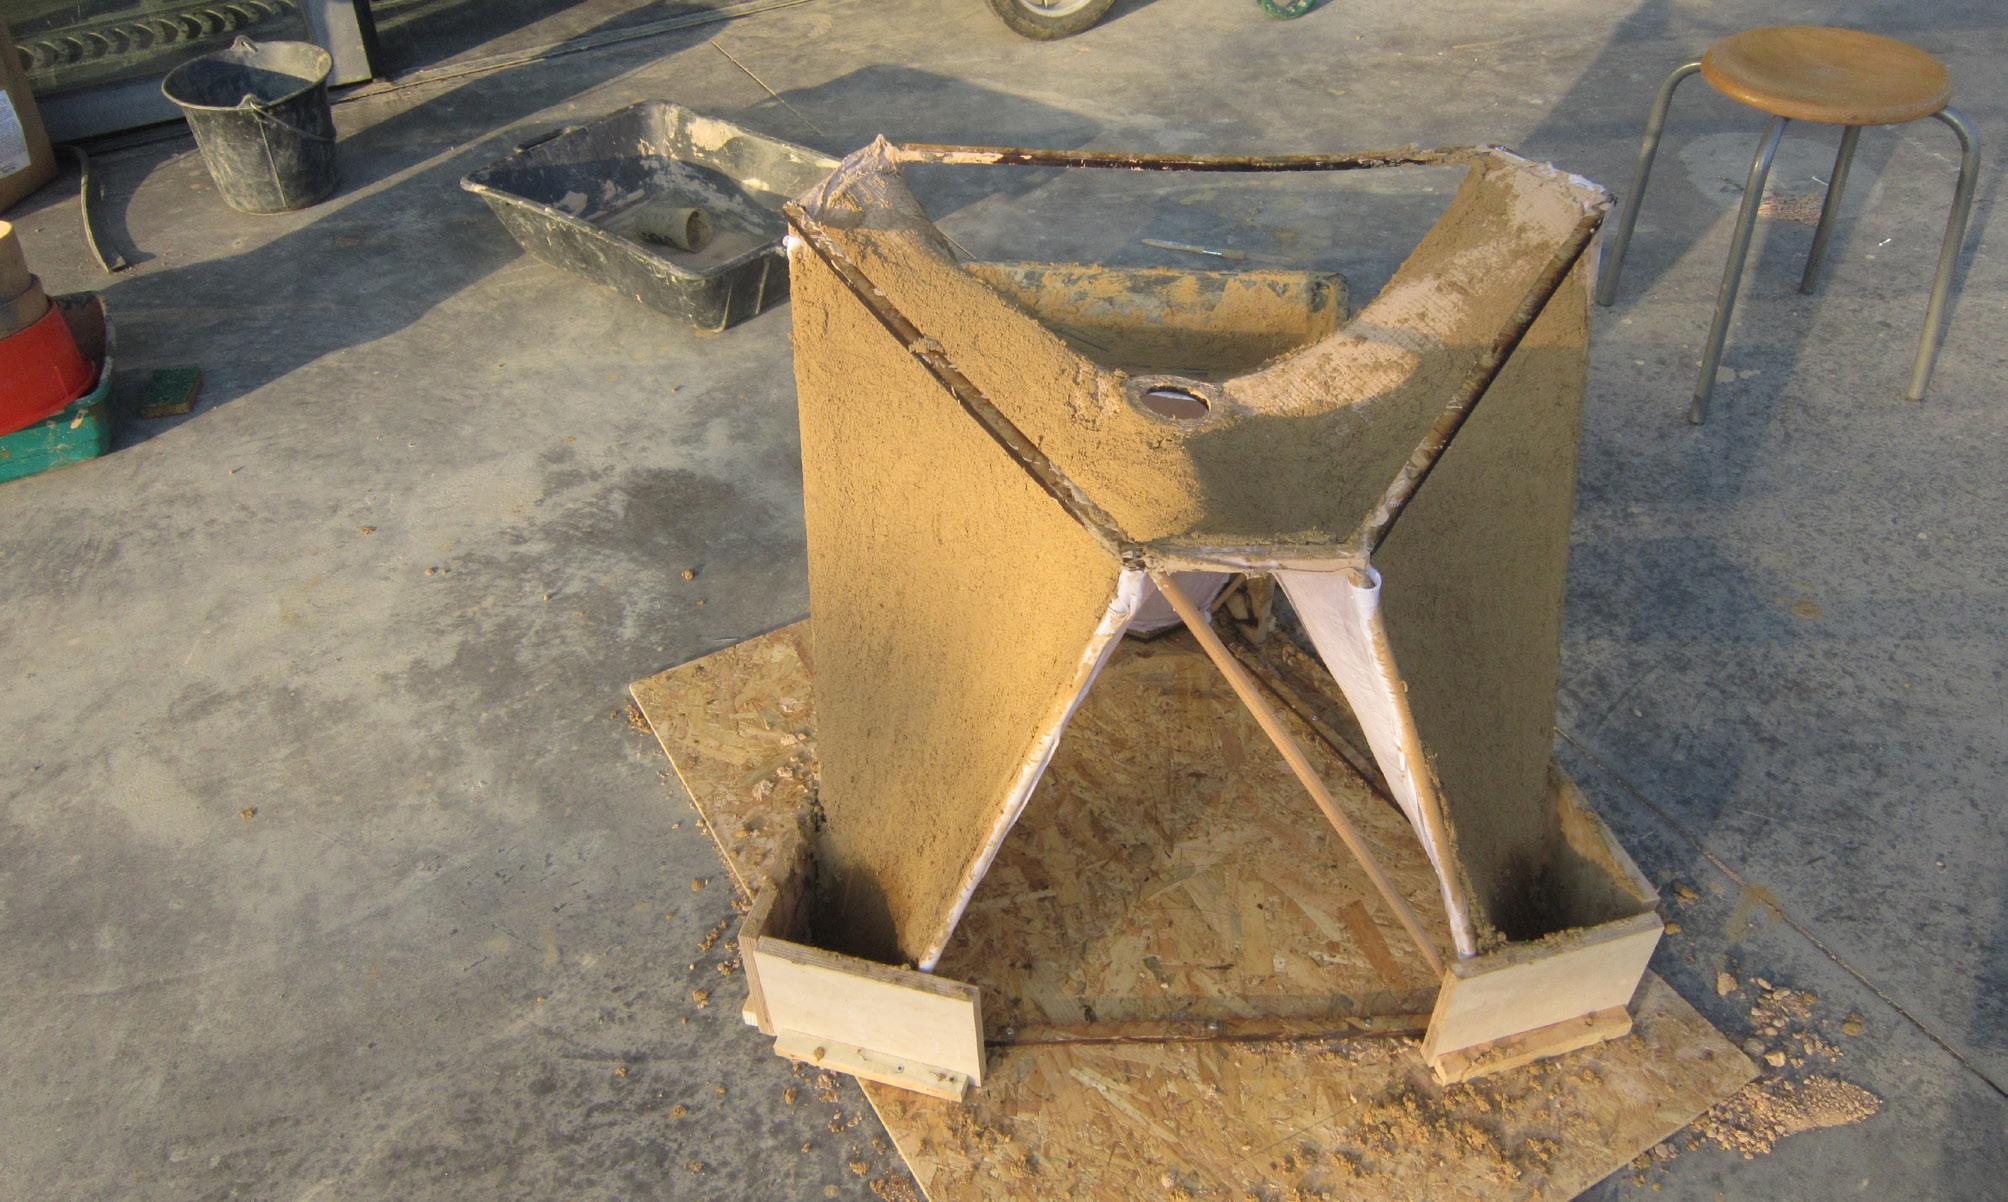
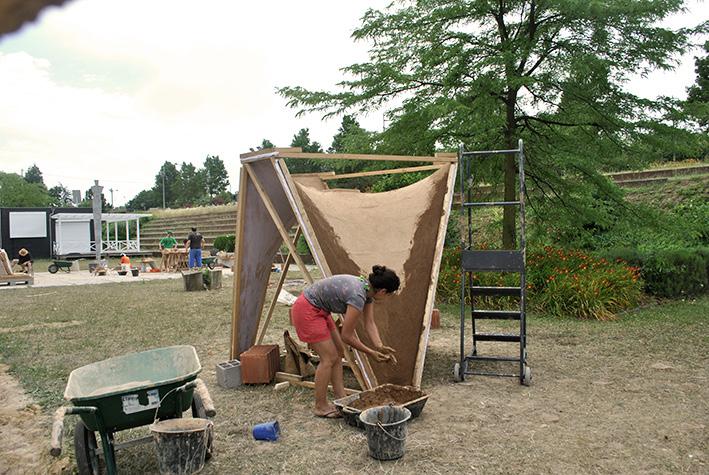
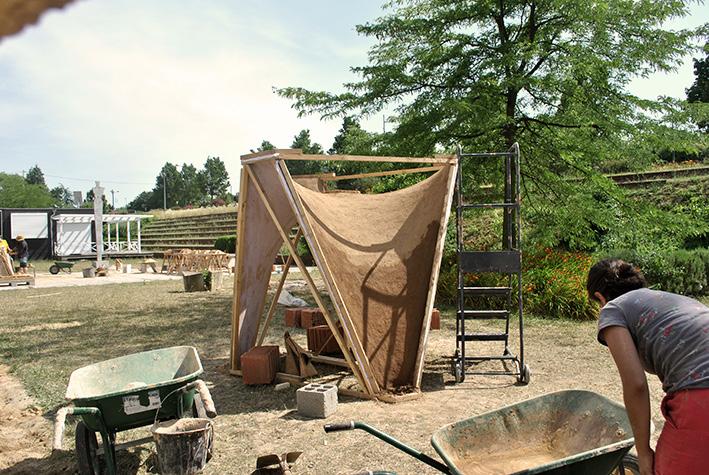
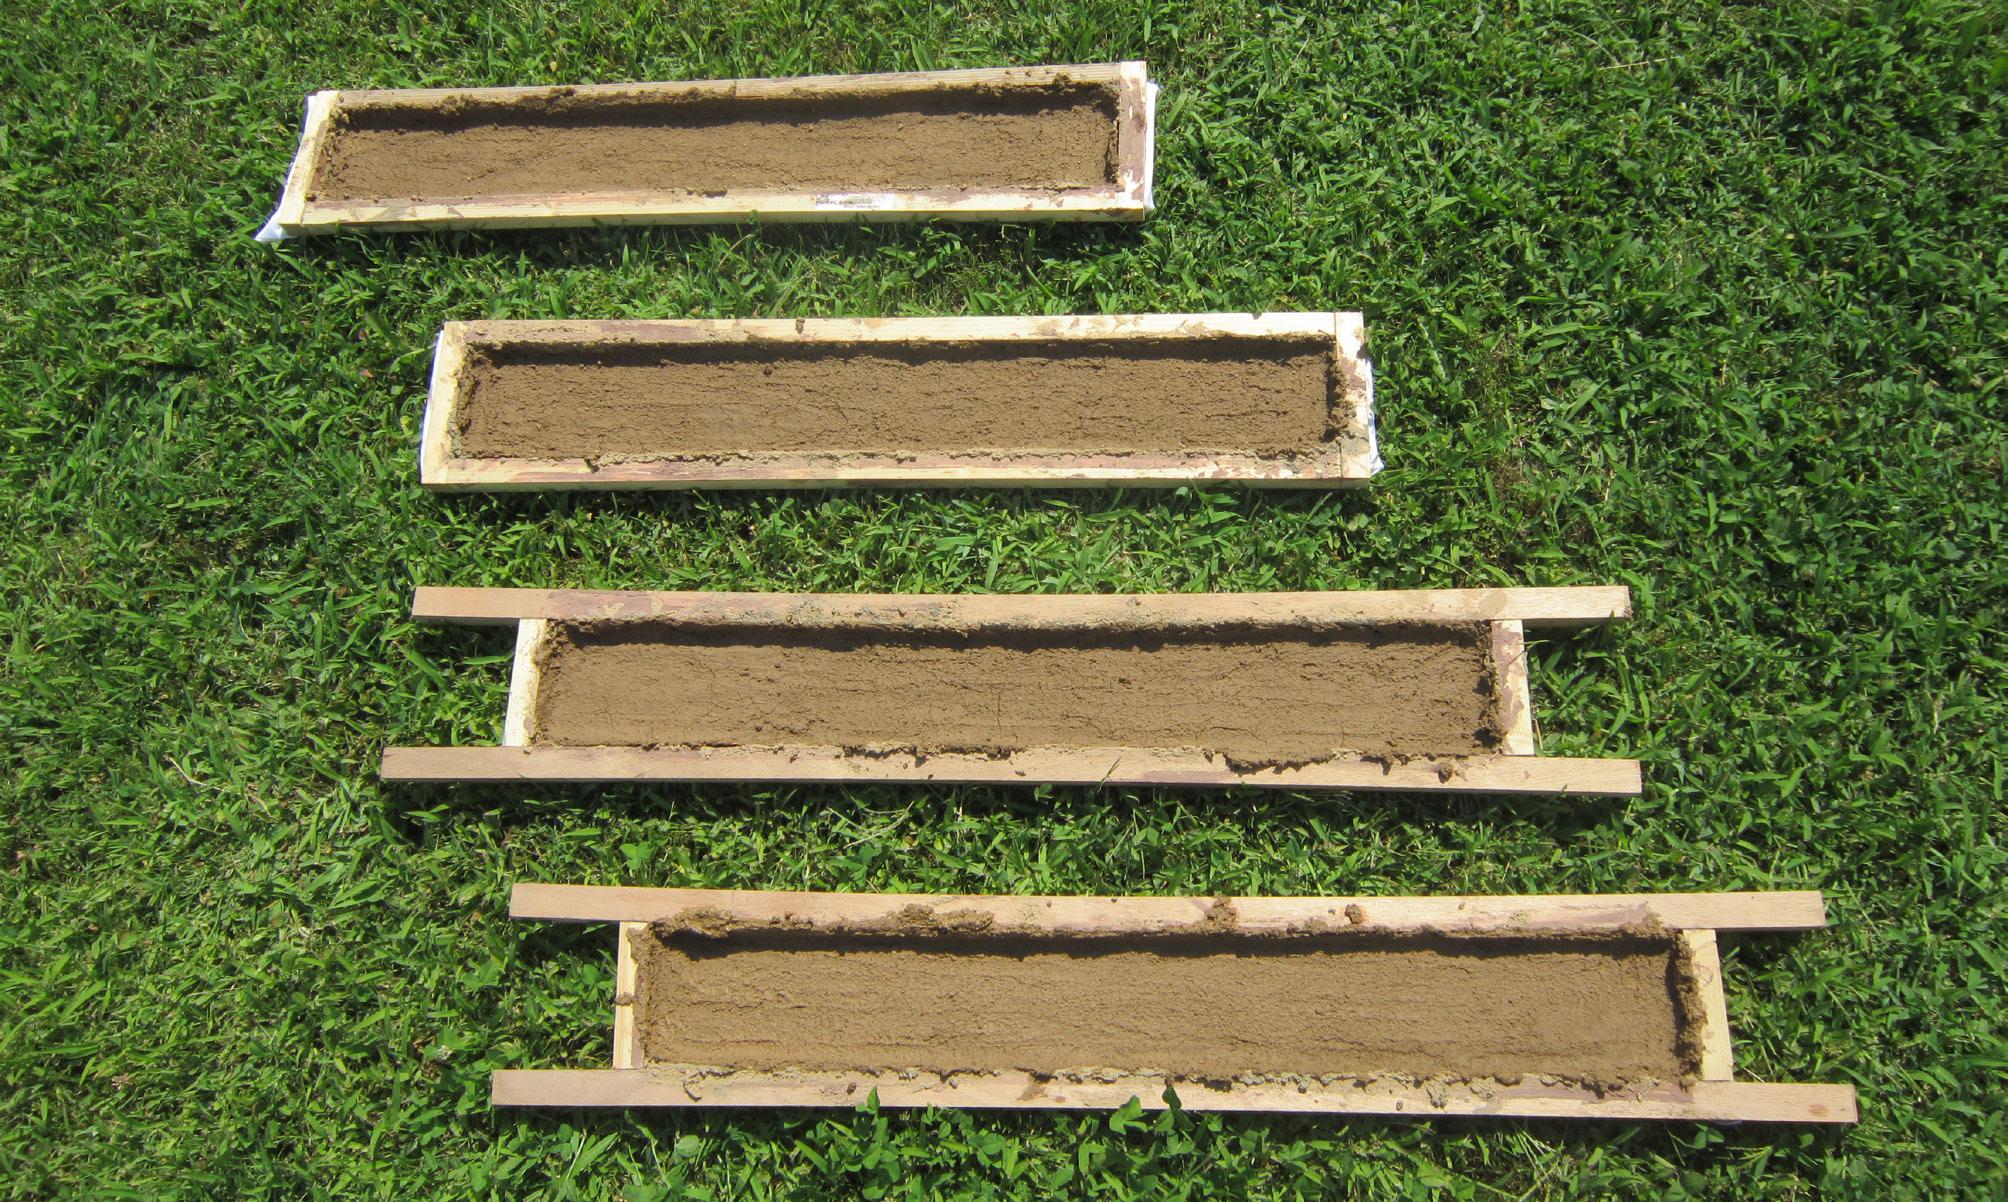
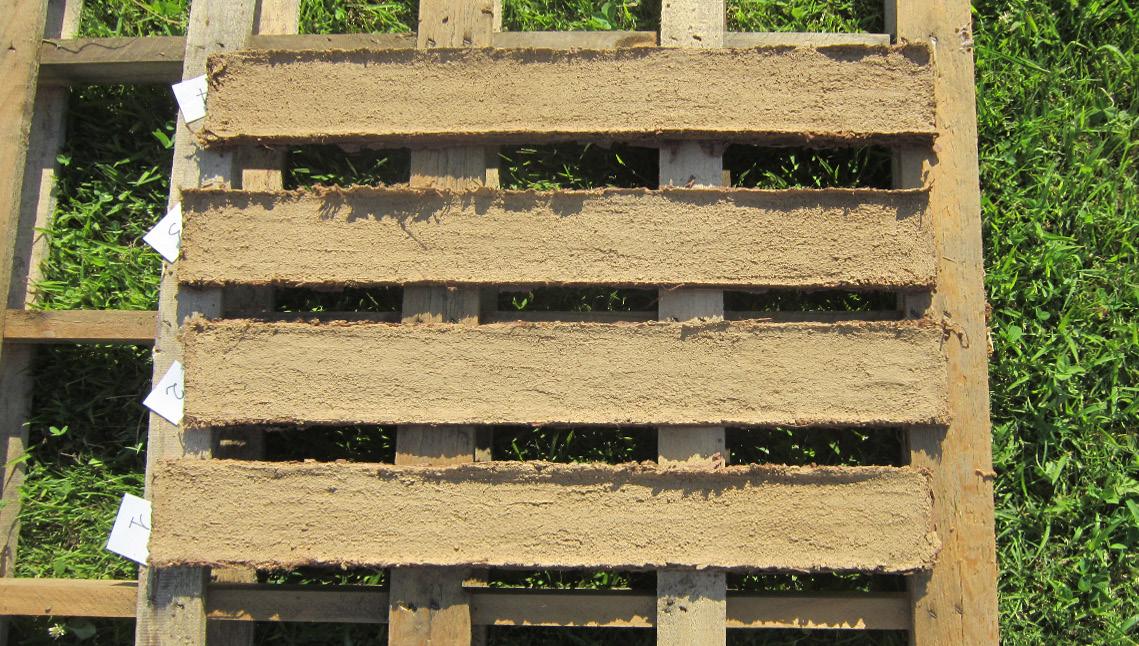
Material Application: Layering Technique
A Structure in Progress
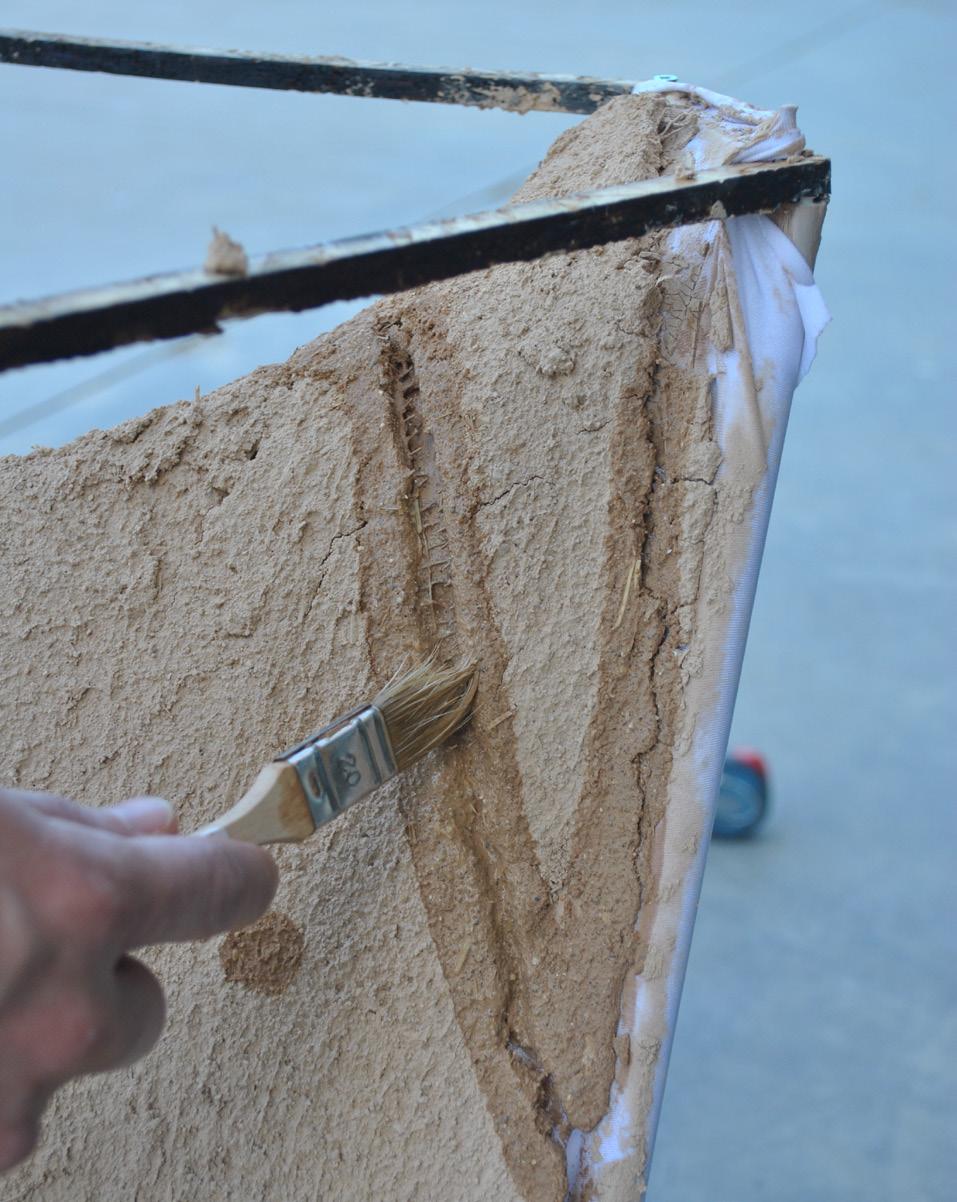
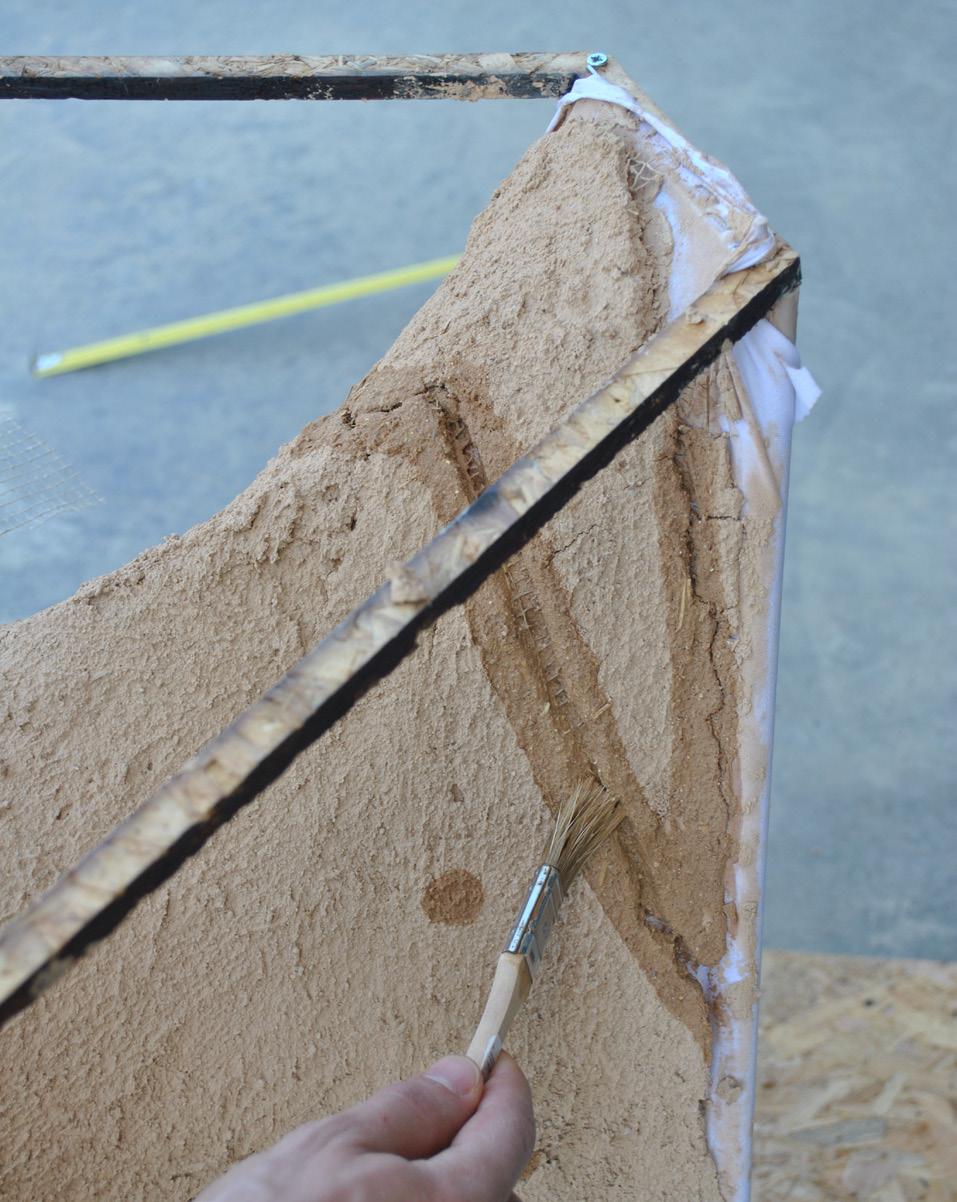
Layering allows to build on a fabric formwork by spreading earth without compromising the target shape. The material is applied in layers of progressive thickness, from starch to finishing, to minimaze the displacement of the formwork. The sequential drying of the layers allows them to harden as composite and collaborate on the load bearing capacity of the structure. For this construction reason, the spandex fabric is expected to be able to support only 2 or 3 cm of earth composite in order to allow the beginning of the construction process.
The first layers, like starch, jute mesh and clay, are due only to prepare the spandex for the first mix of clay, sand and fibres, where straw is chopped in smaller elements to give the material a more diffused strength.
The jute mesh works as re-bars in concrete, because, when they are embedded into the clay, they do not buckle in compression and they contribute to make the earth composite to perform in tension. An other jute mesh is placed before the last layer of clay and sand to work as a ‘sandwich’.
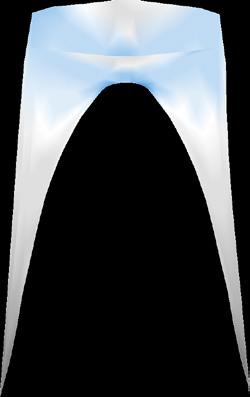
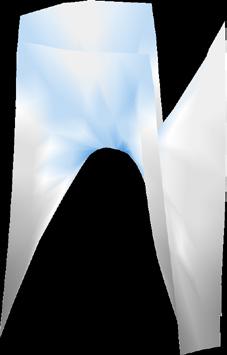
Right
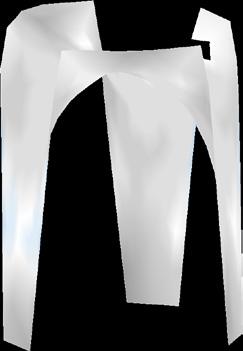
Fig. 3.20 Layering technique, diagram.
Wooden frame
Clay 67% + Sand
Spandex fabric
Starch
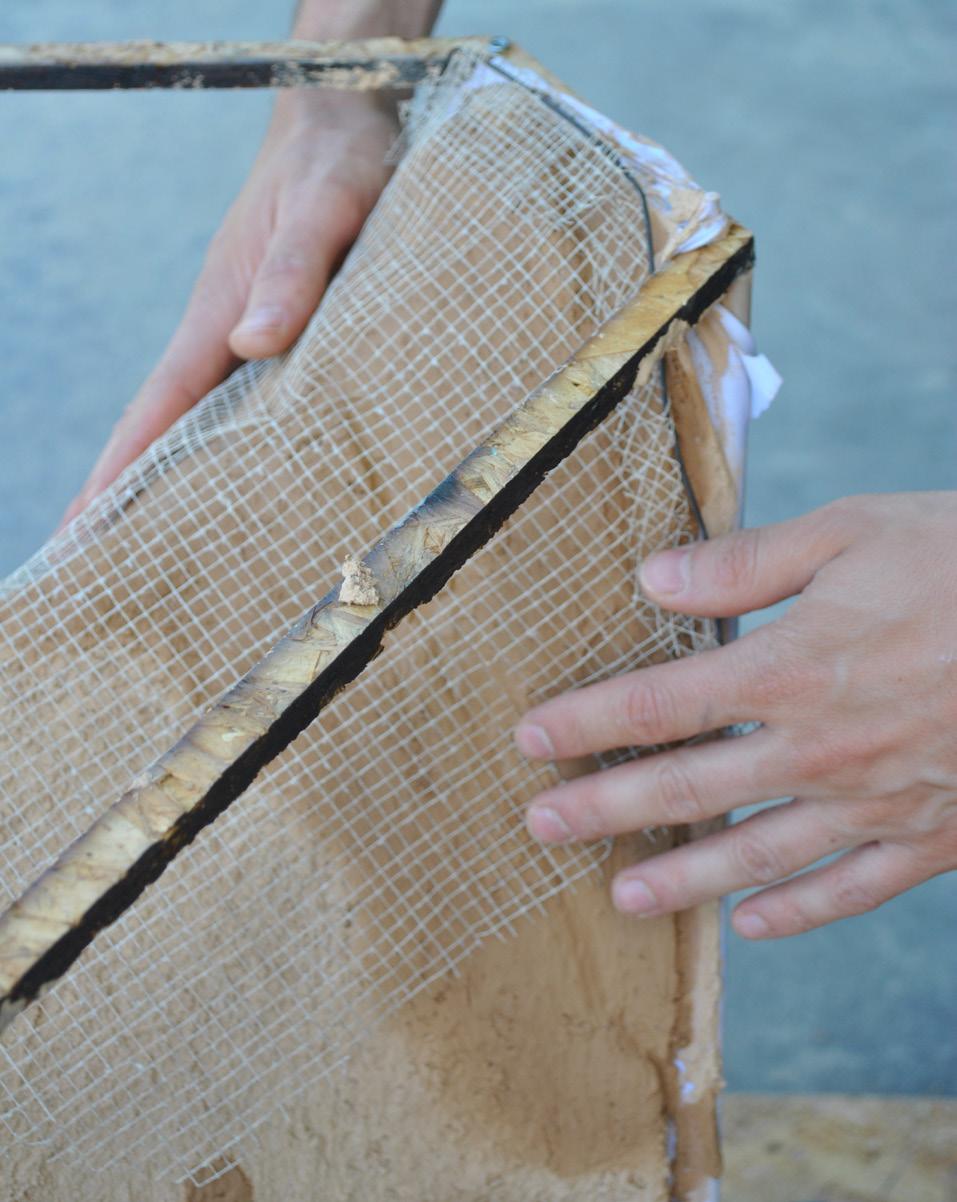
Above right
Fig. 3.21 Jute mesh.
Above left
Fig. 3.22 Clay and sand on a previous dried layer of jute mesh.
Below right
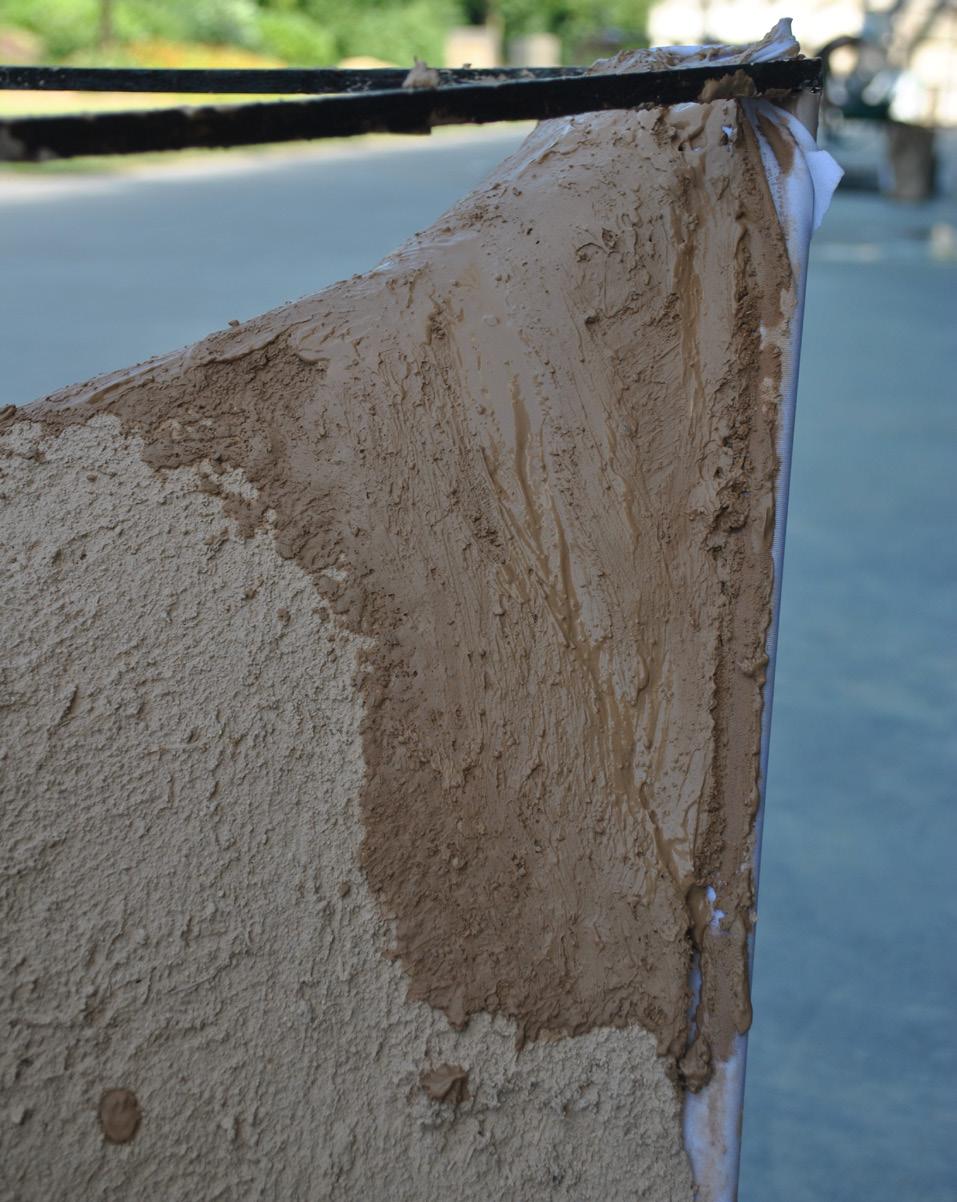
Fig. 3.23 Clay 67% and sand 33 %.
Below left
Fig. 3.24 Finishing.
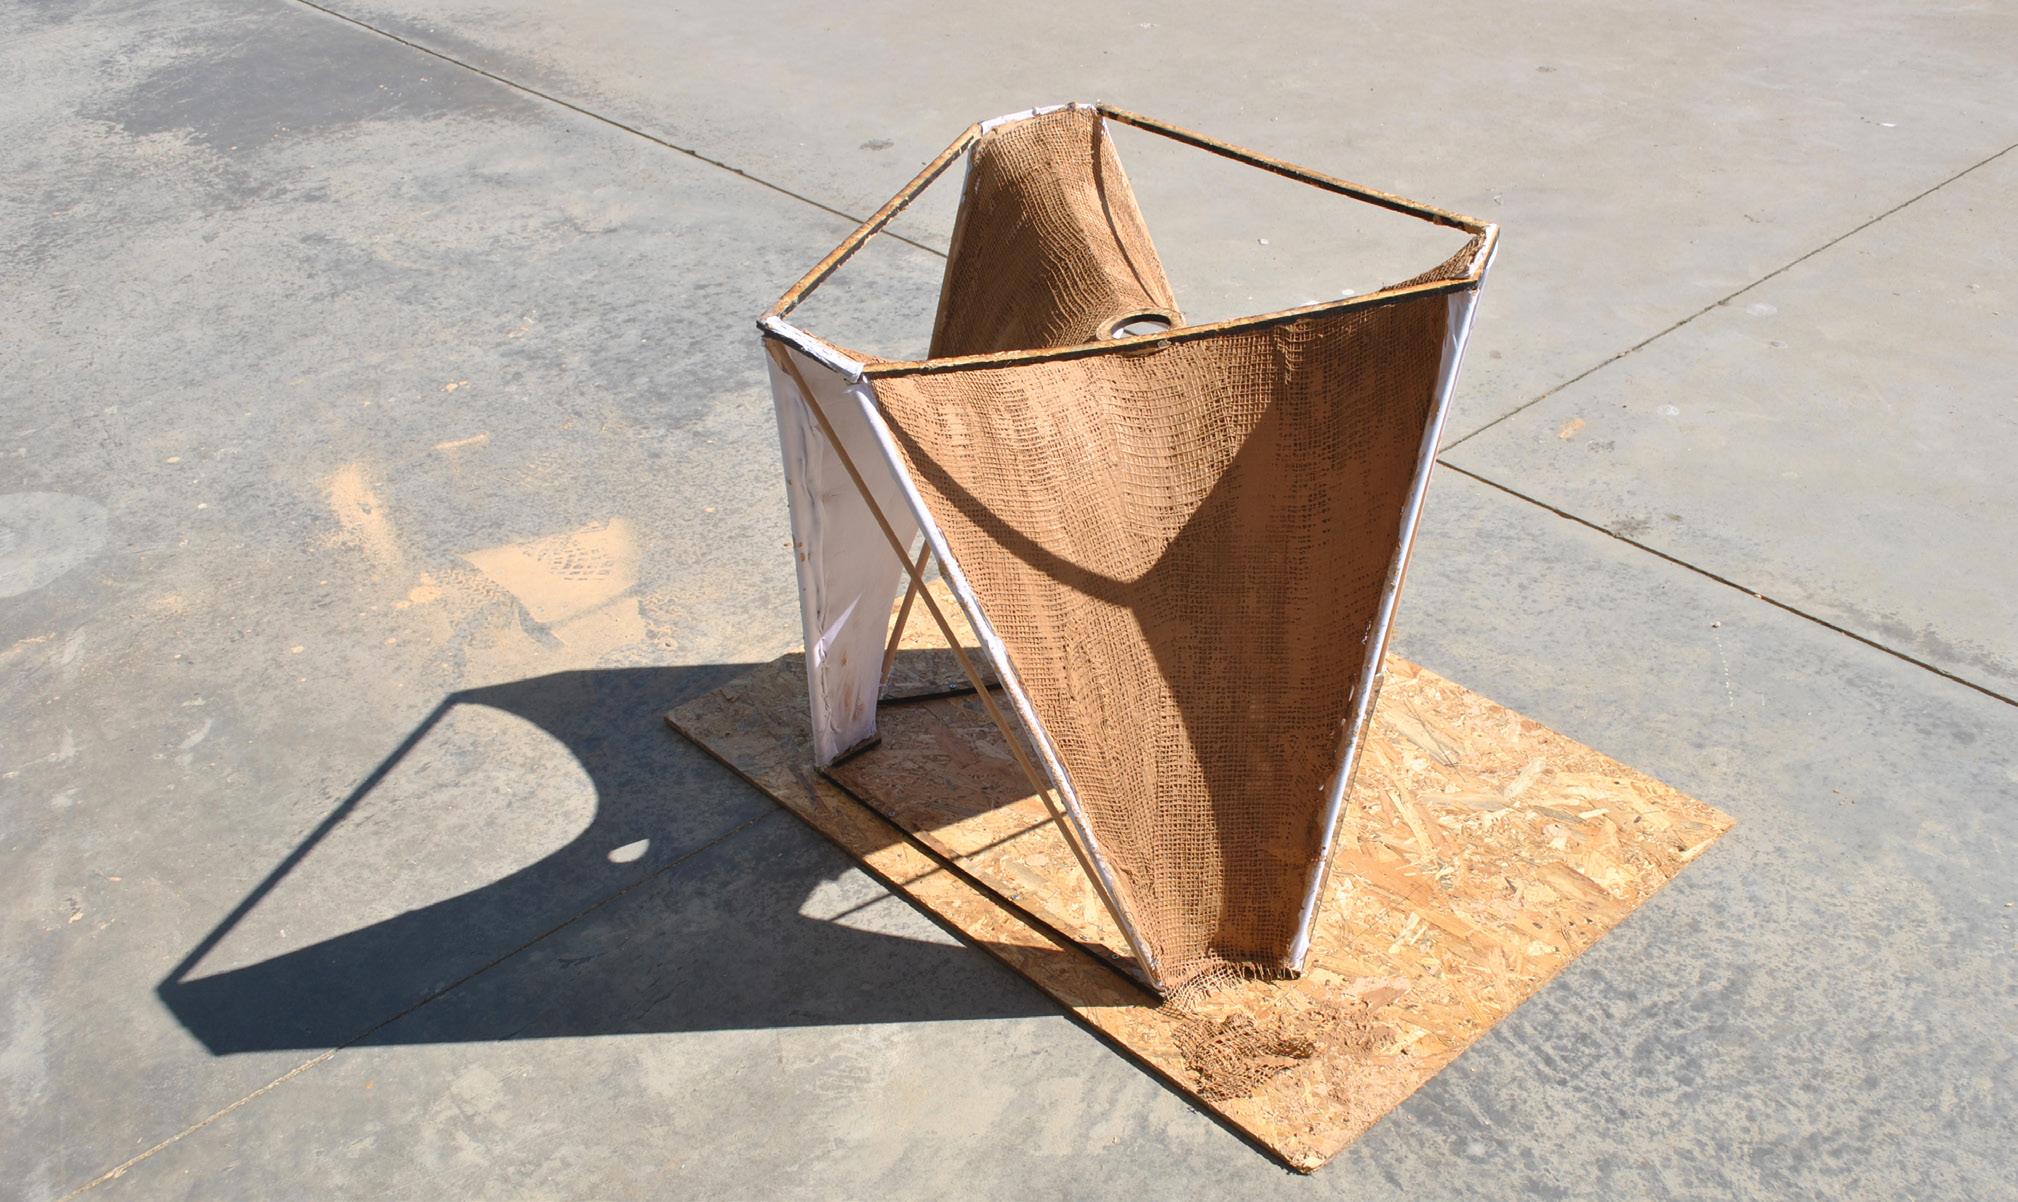
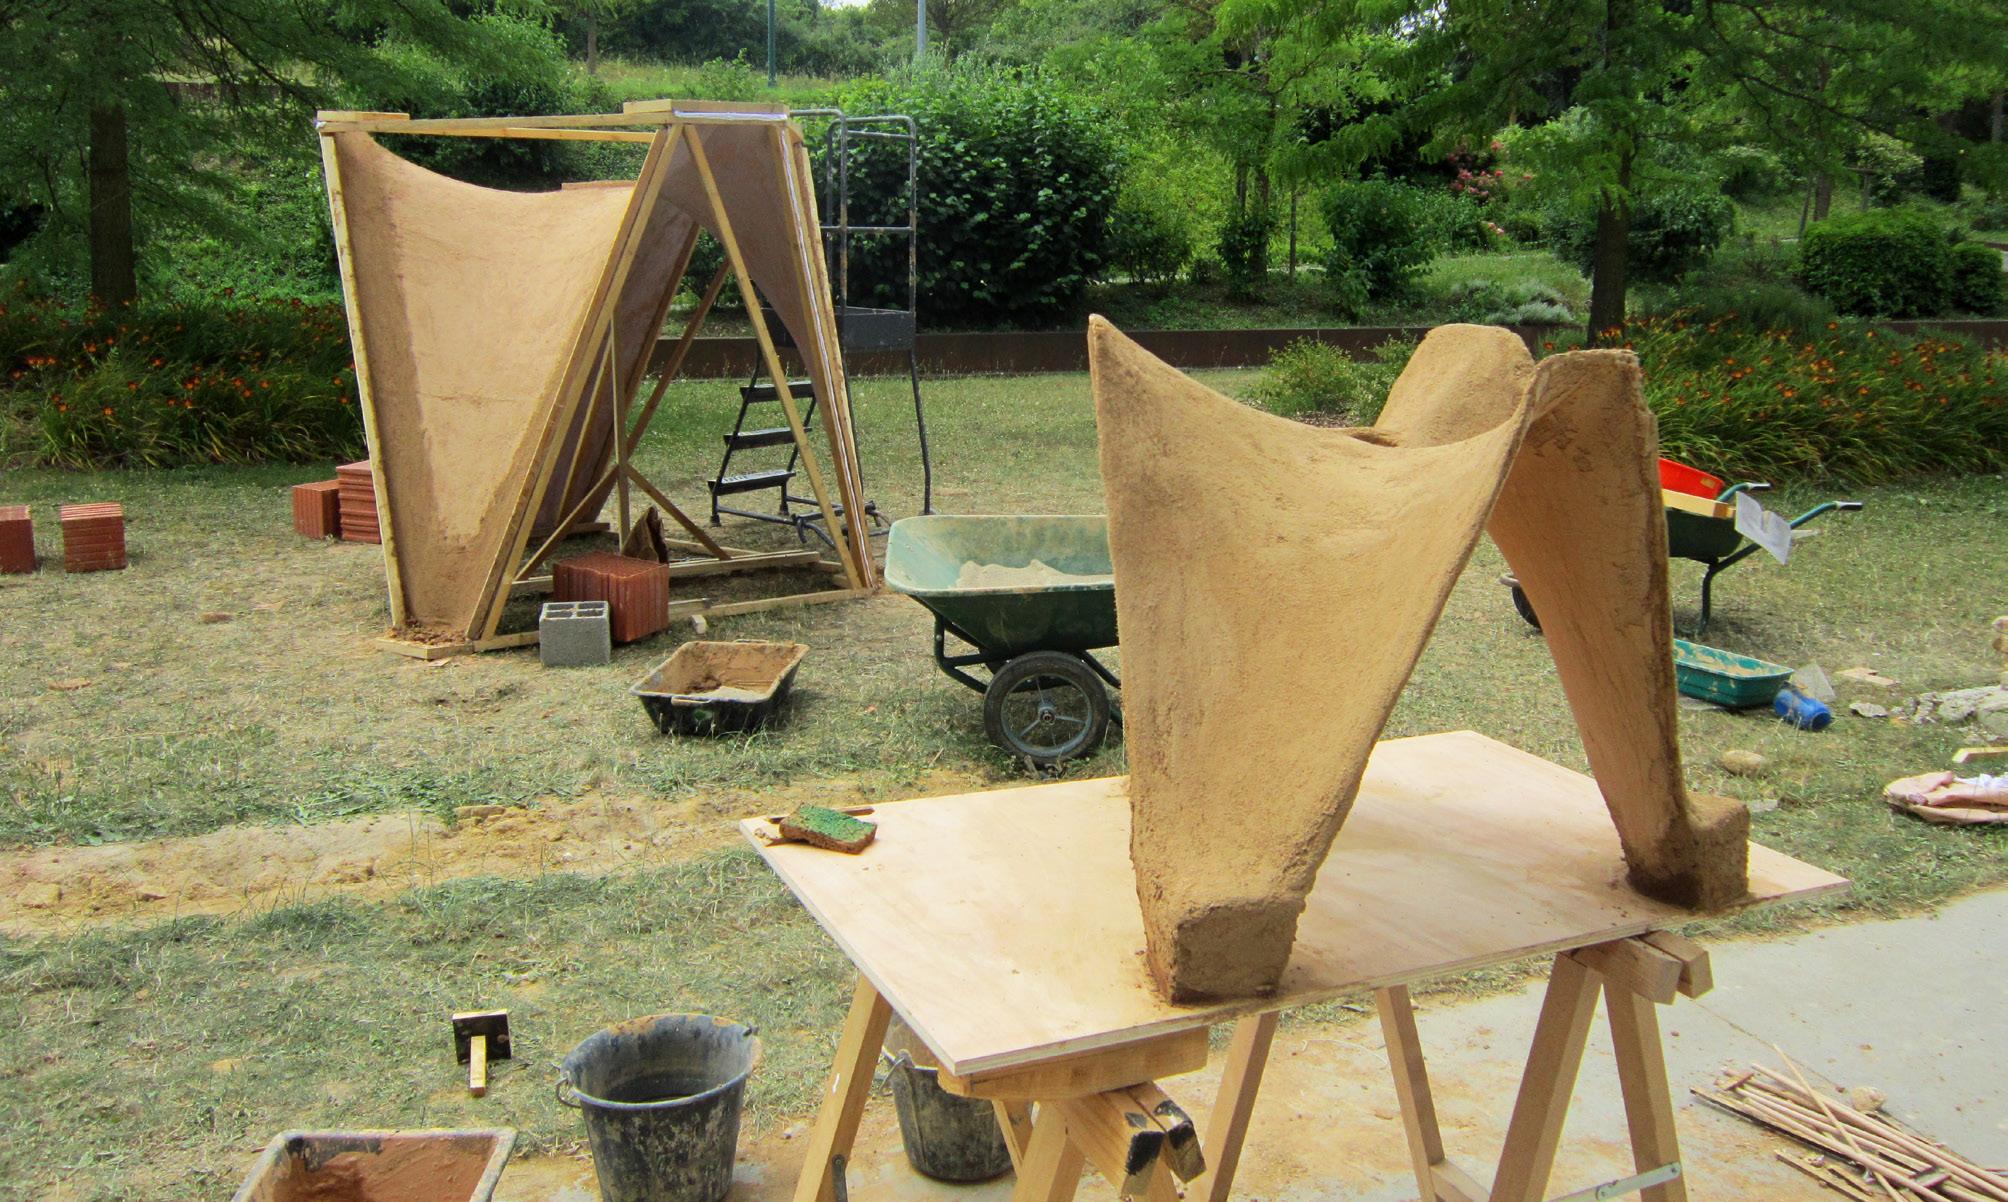
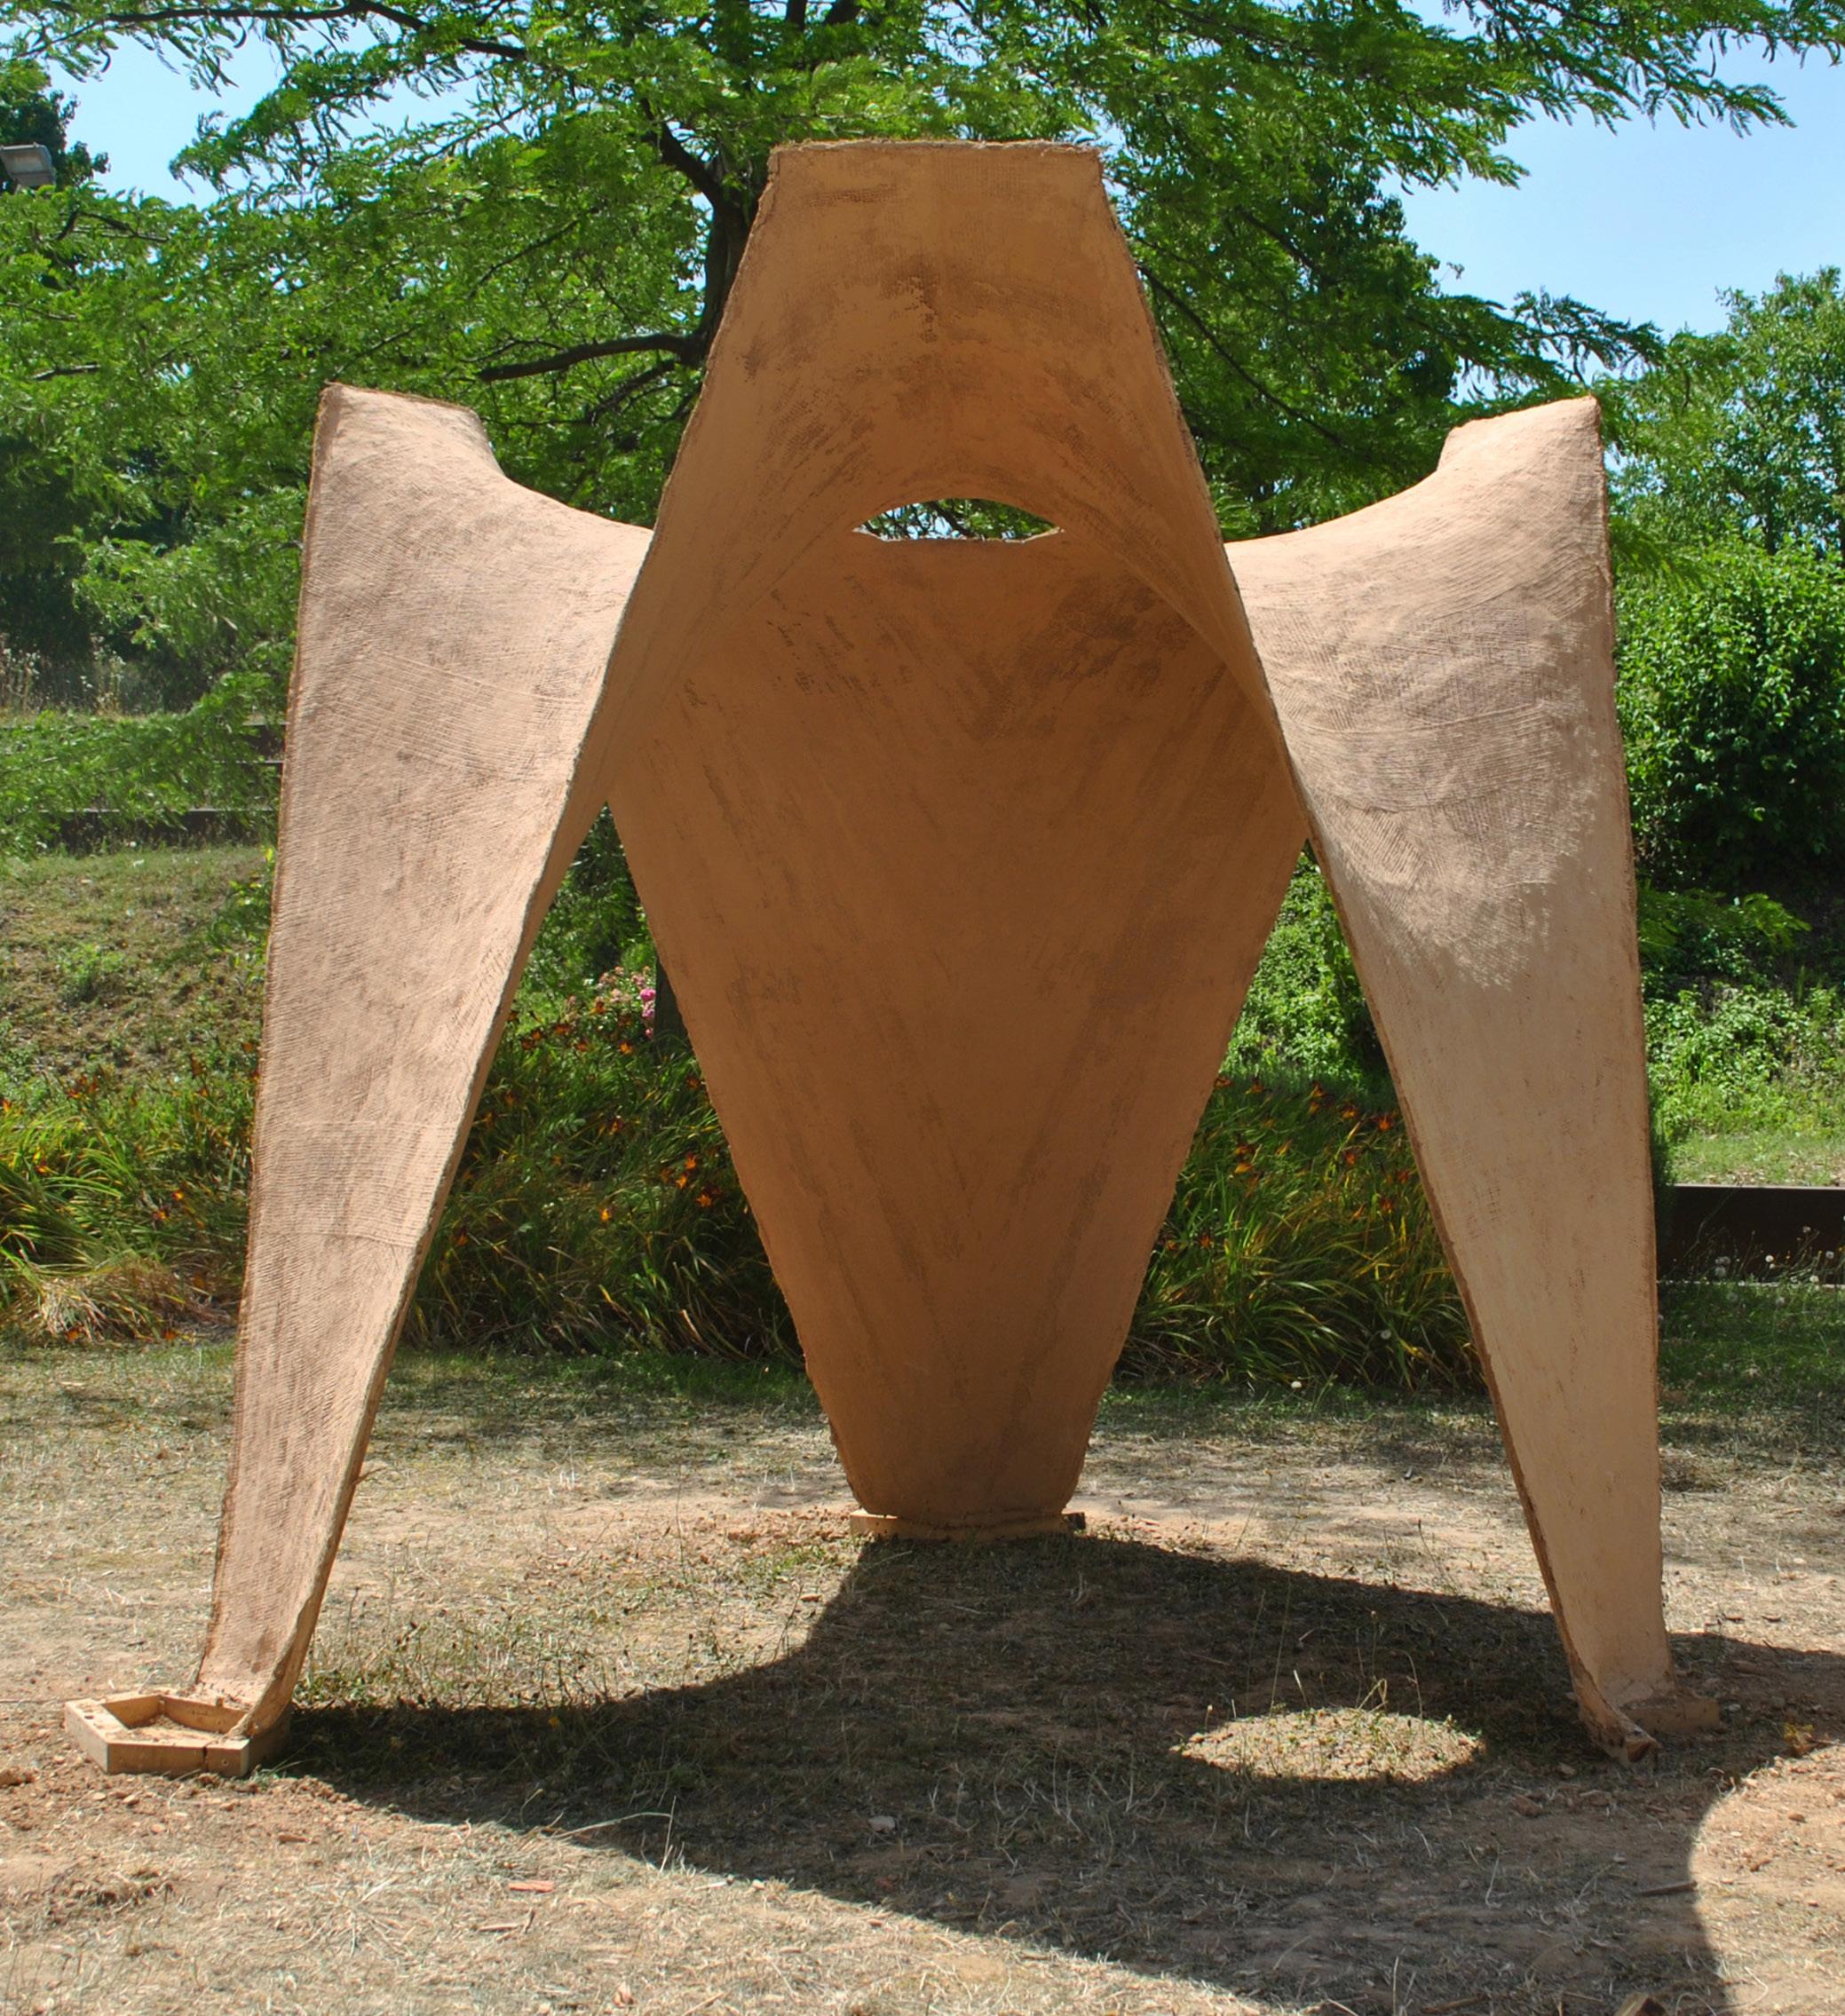
Physical Test
Model of the Unit: 0.70 x 0.56 x 0.50 m
Taking into account the results from the previous experiments and regarding the maximum load that can be applied on the fabric formwork, this physical prototype aims to determine the principles of the construction with the layering technique. A succession of loam and jute mesh reinforcement layers will reach the necessary thickness to have a self supporting system.
The model has a completely a different ground support condition, all the vertical elements are
not flat any more, but the shape developed throughout the evolutionary processes was changed into a ‘V’ shape in order to make it stiffer (Fig. 3. 24 and 3.30). Moreover, he central zenithal opening is not part of the external boundary and it is connected to the spandex fabric, but is not restrained to the ground. While the upper side is always made up of a single segment.
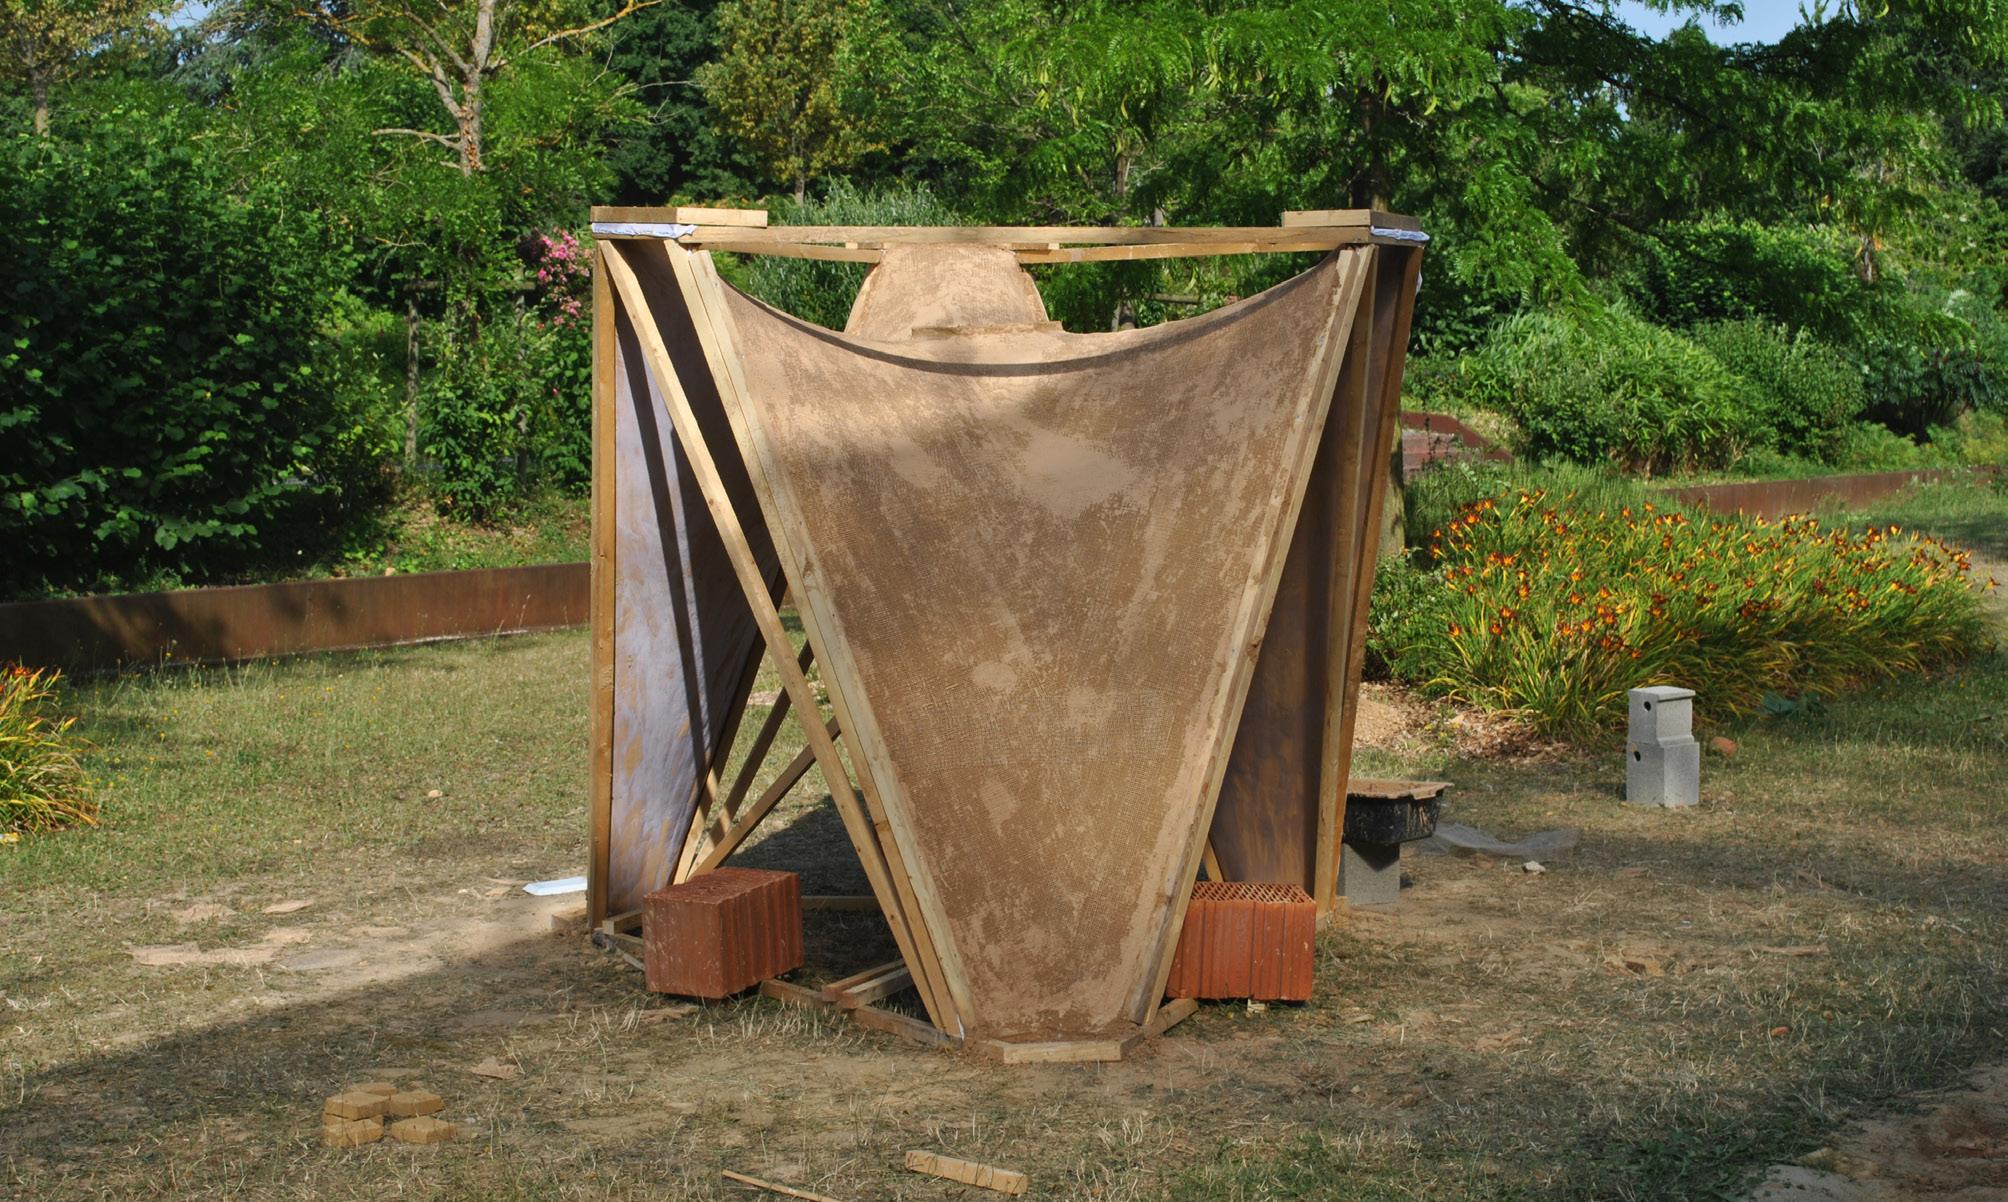
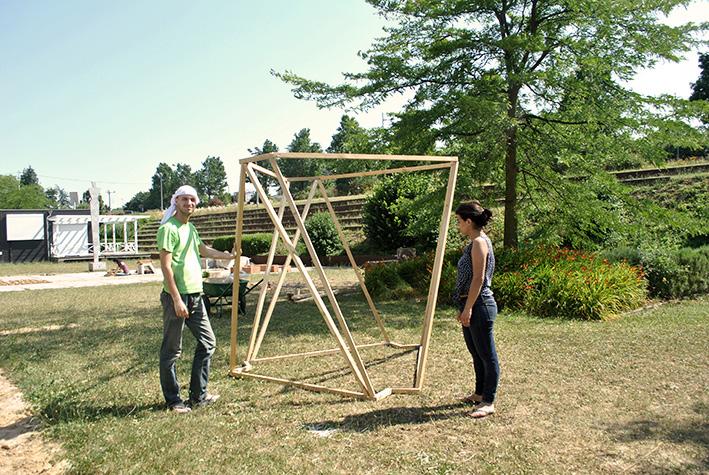
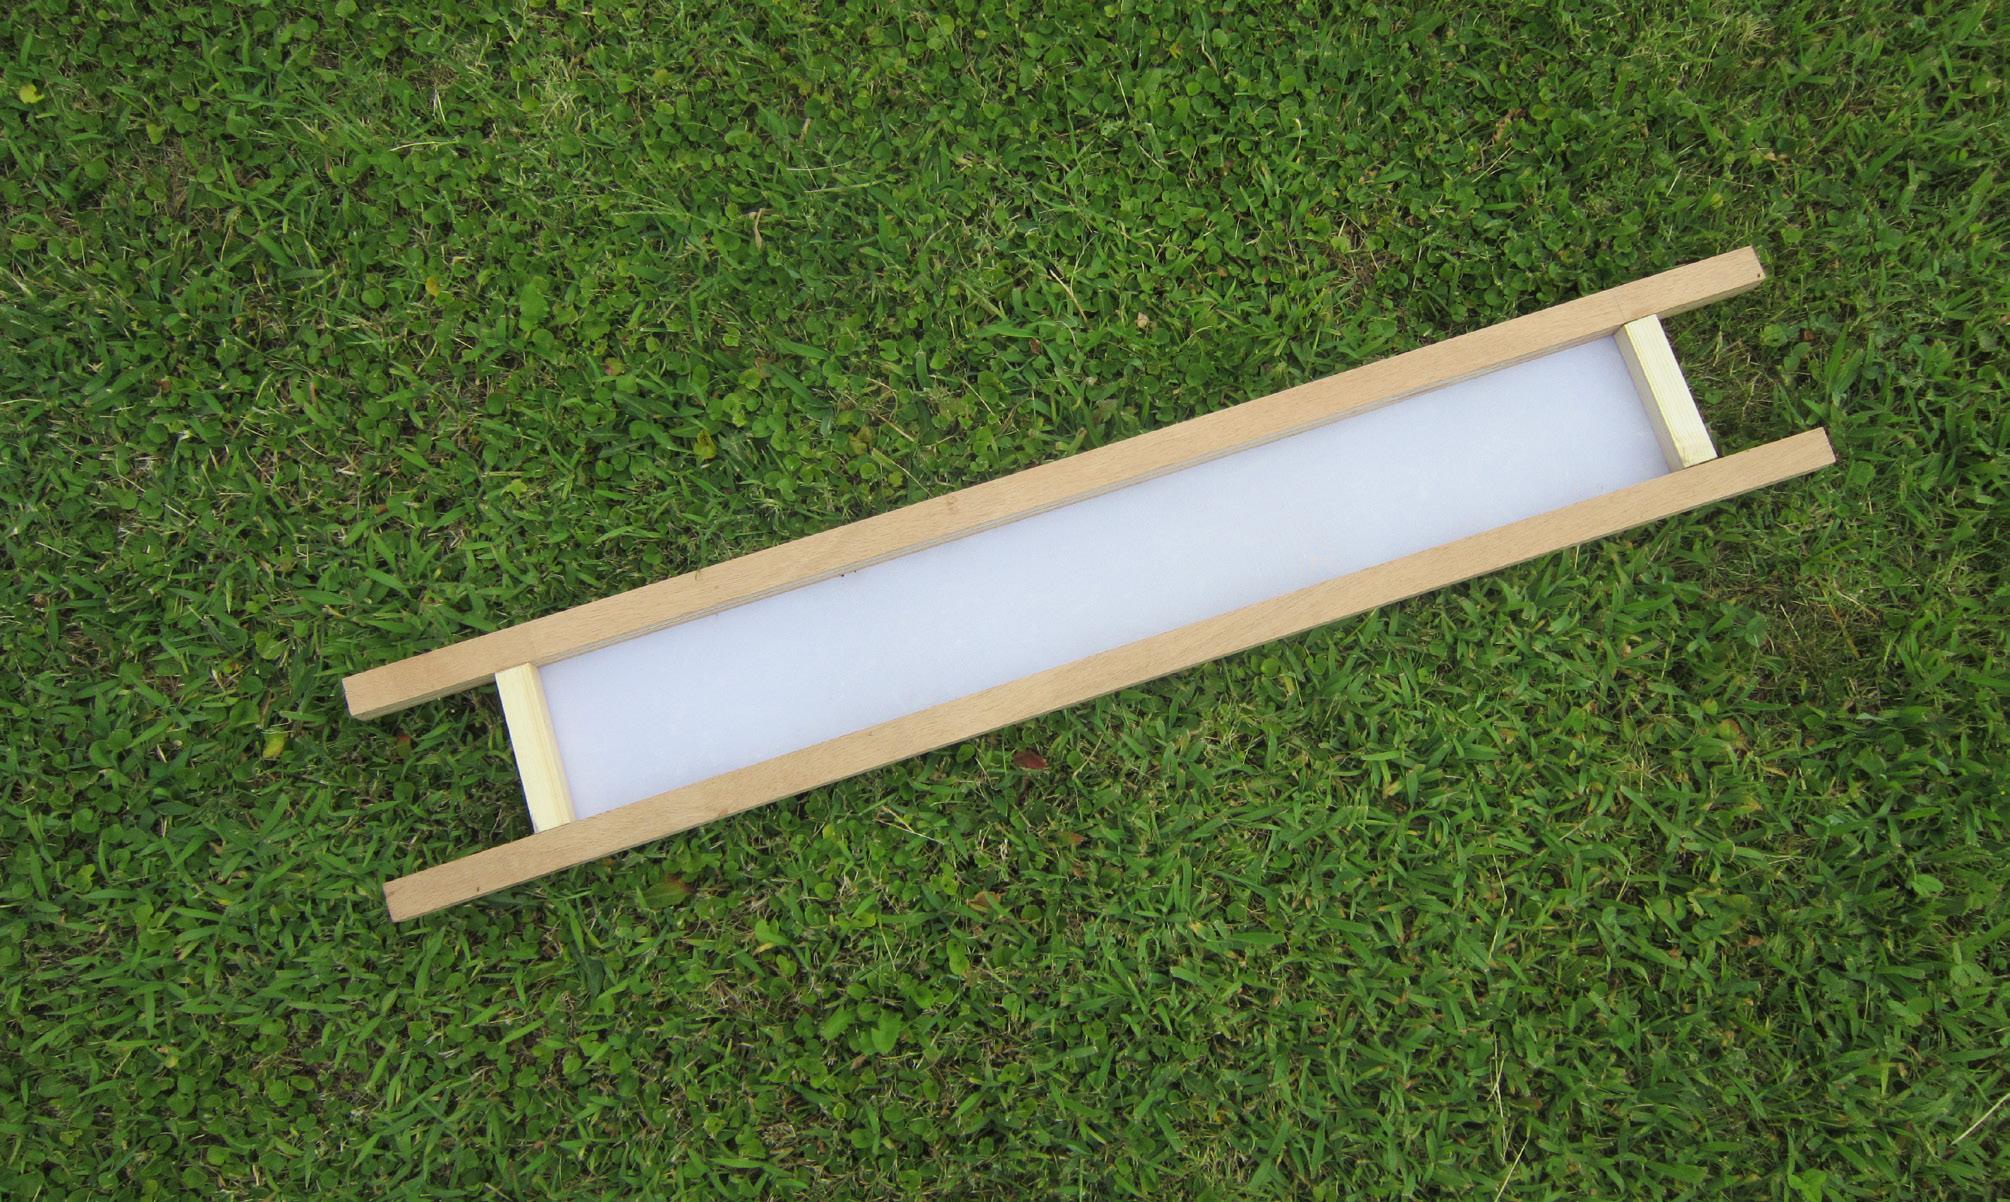
The frame was laser cut and diagonals were added to make it stronger to counteract the
Right
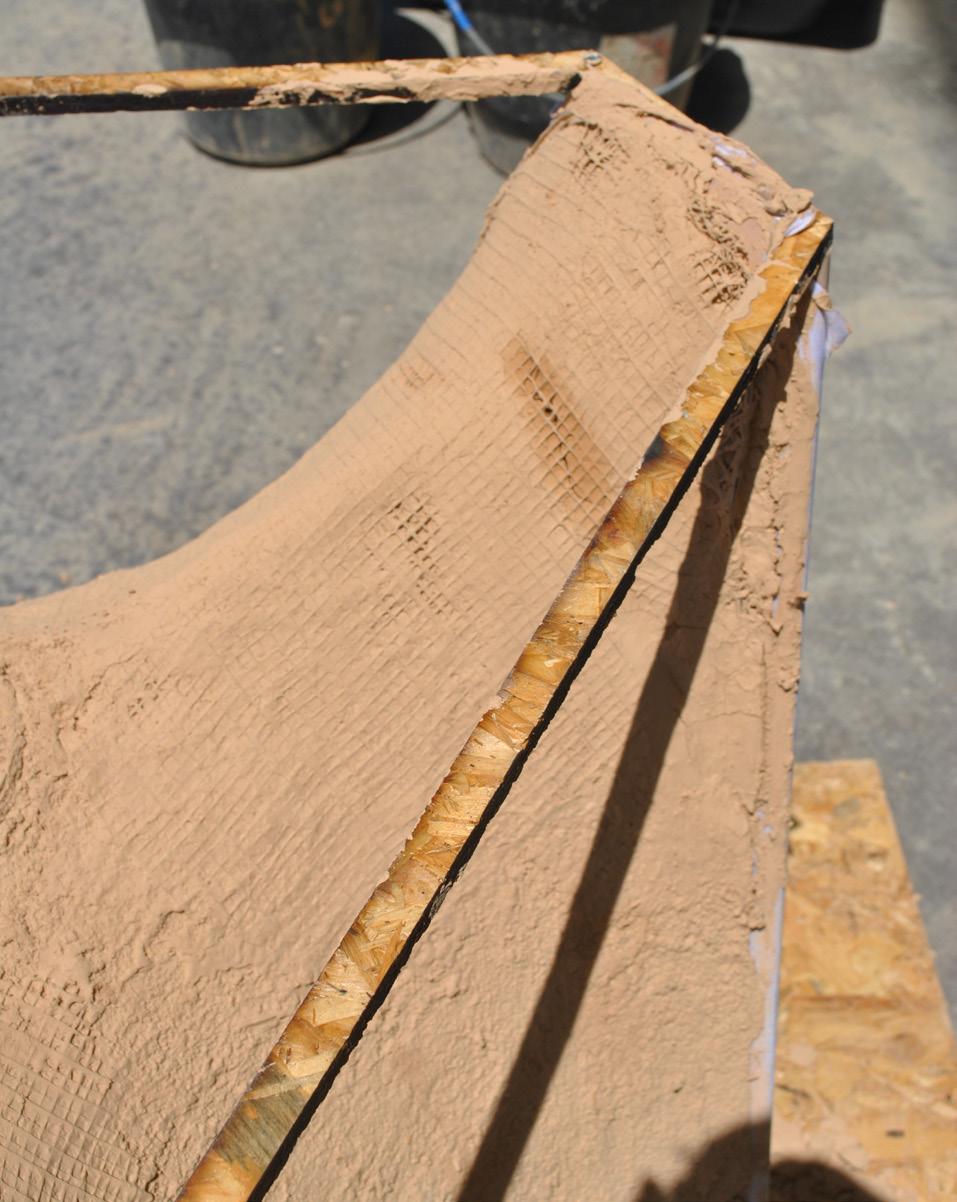
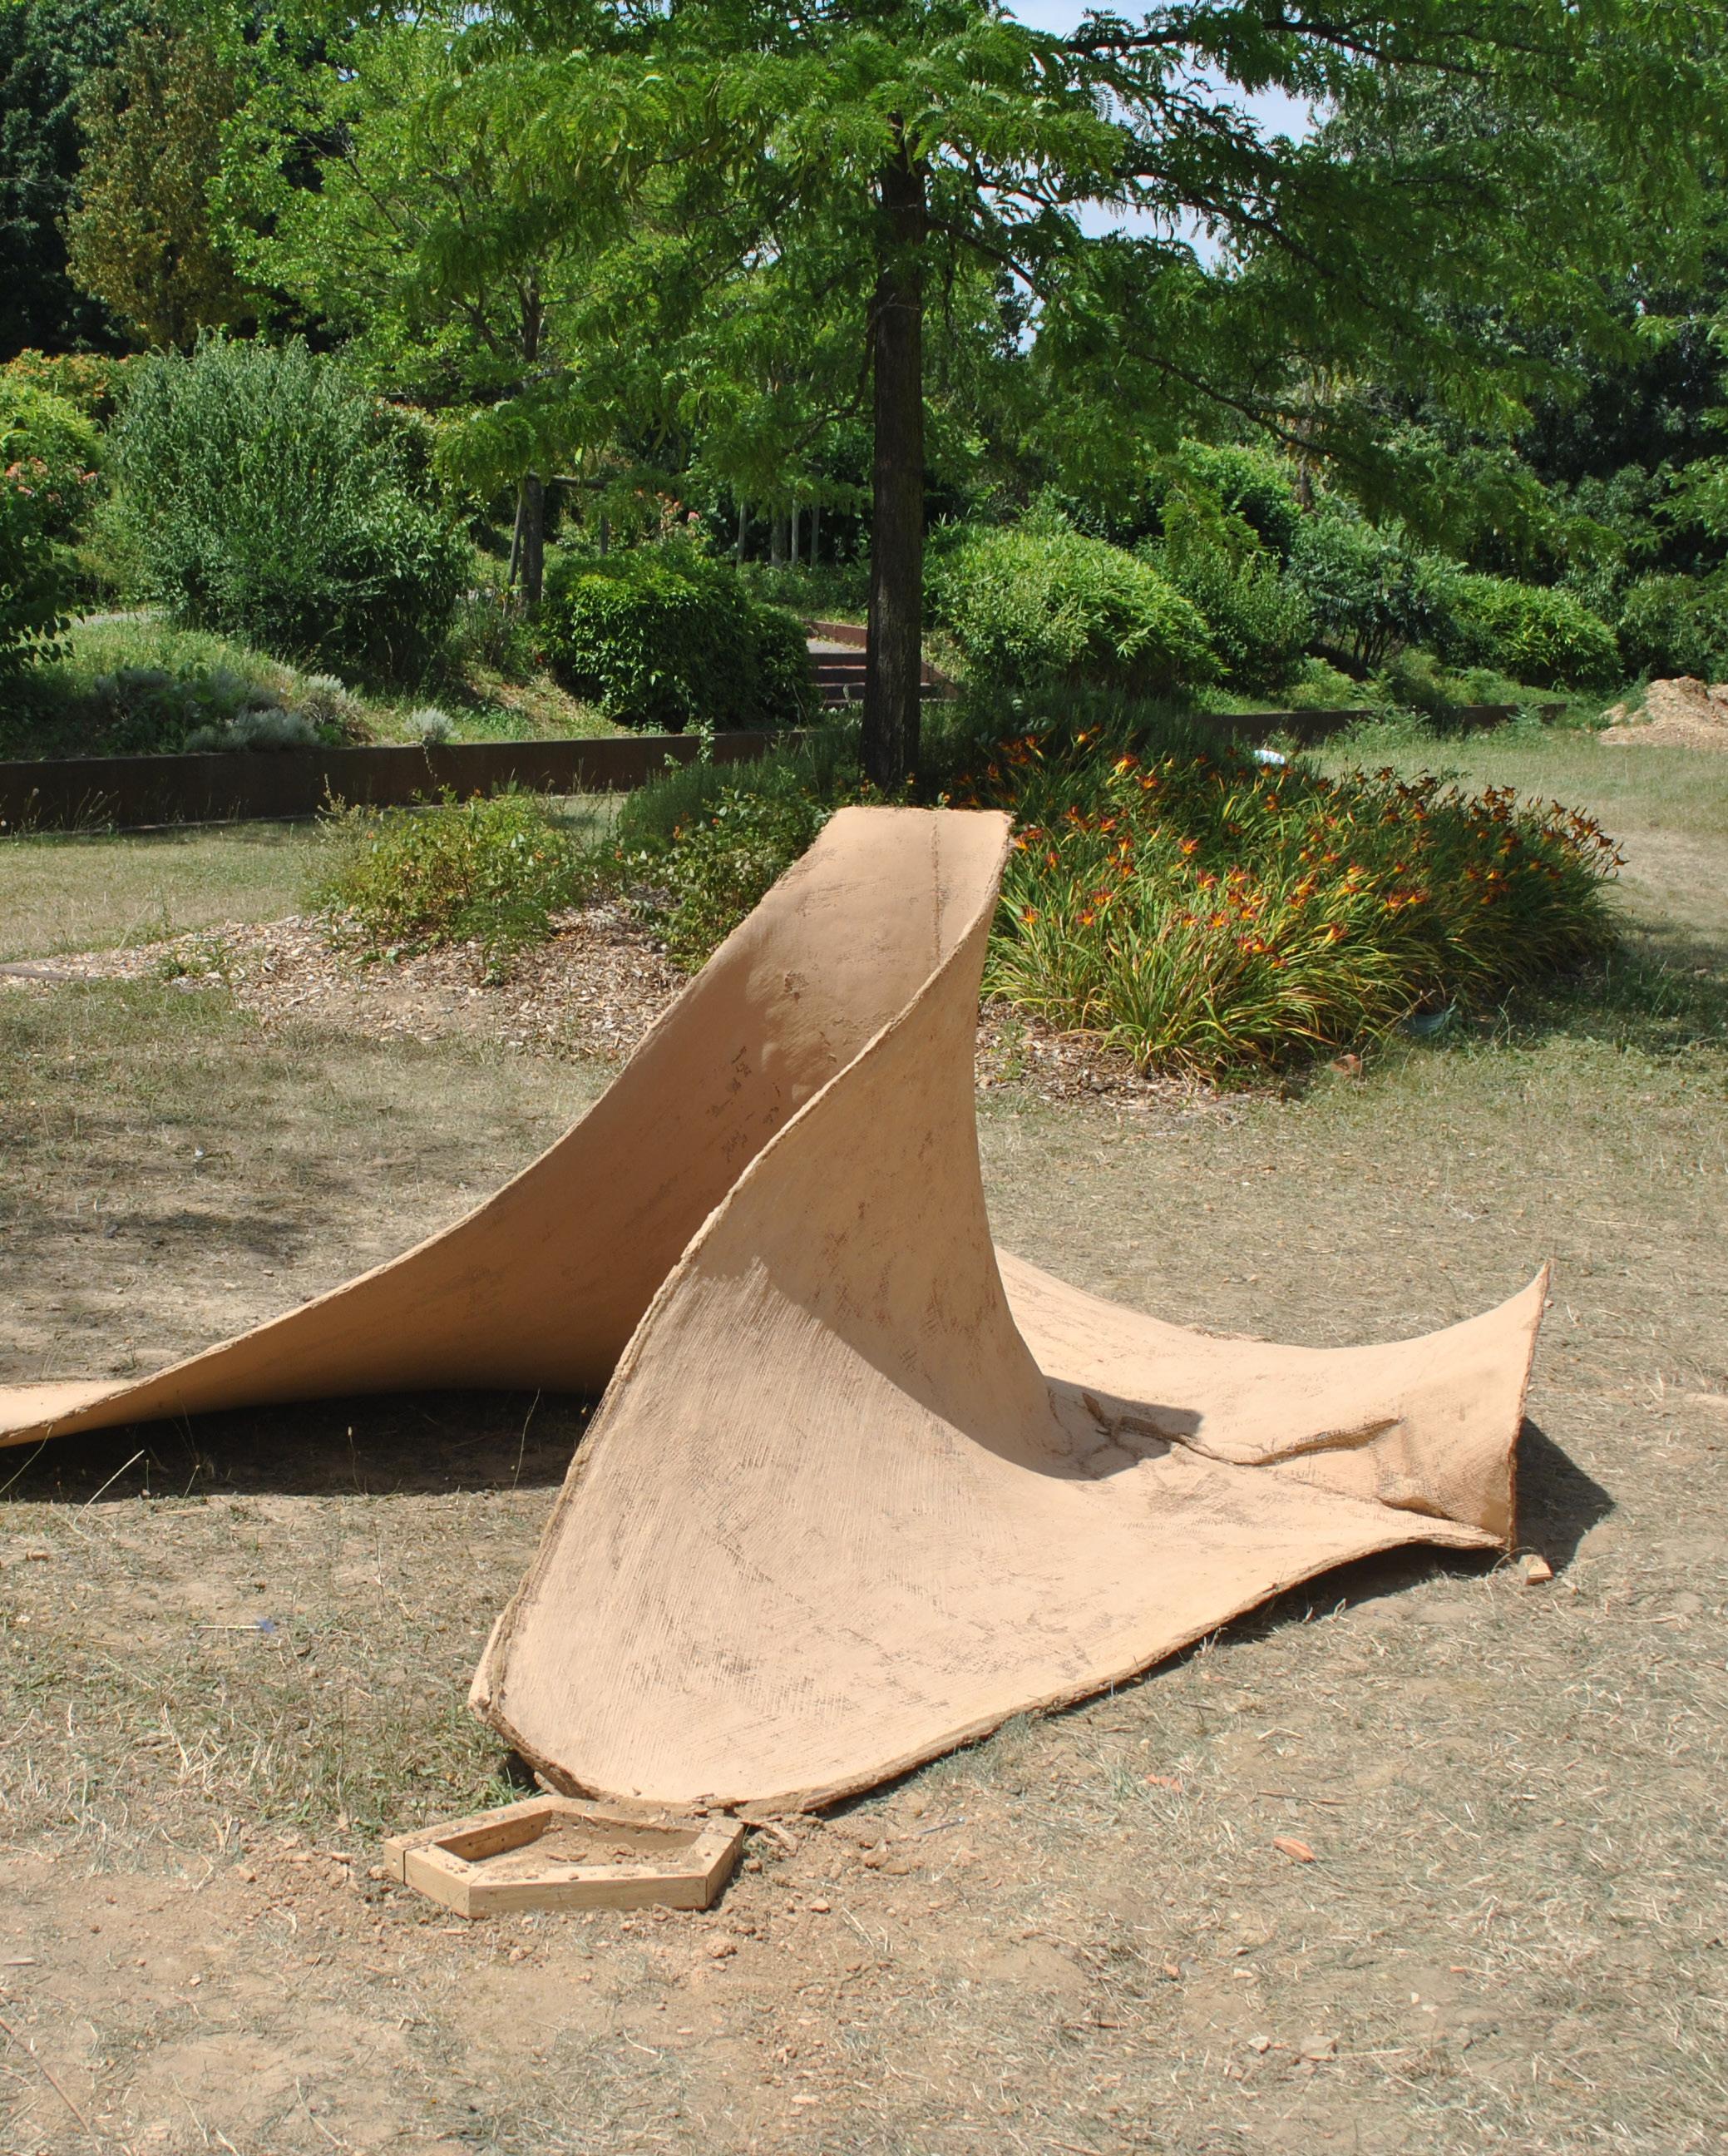
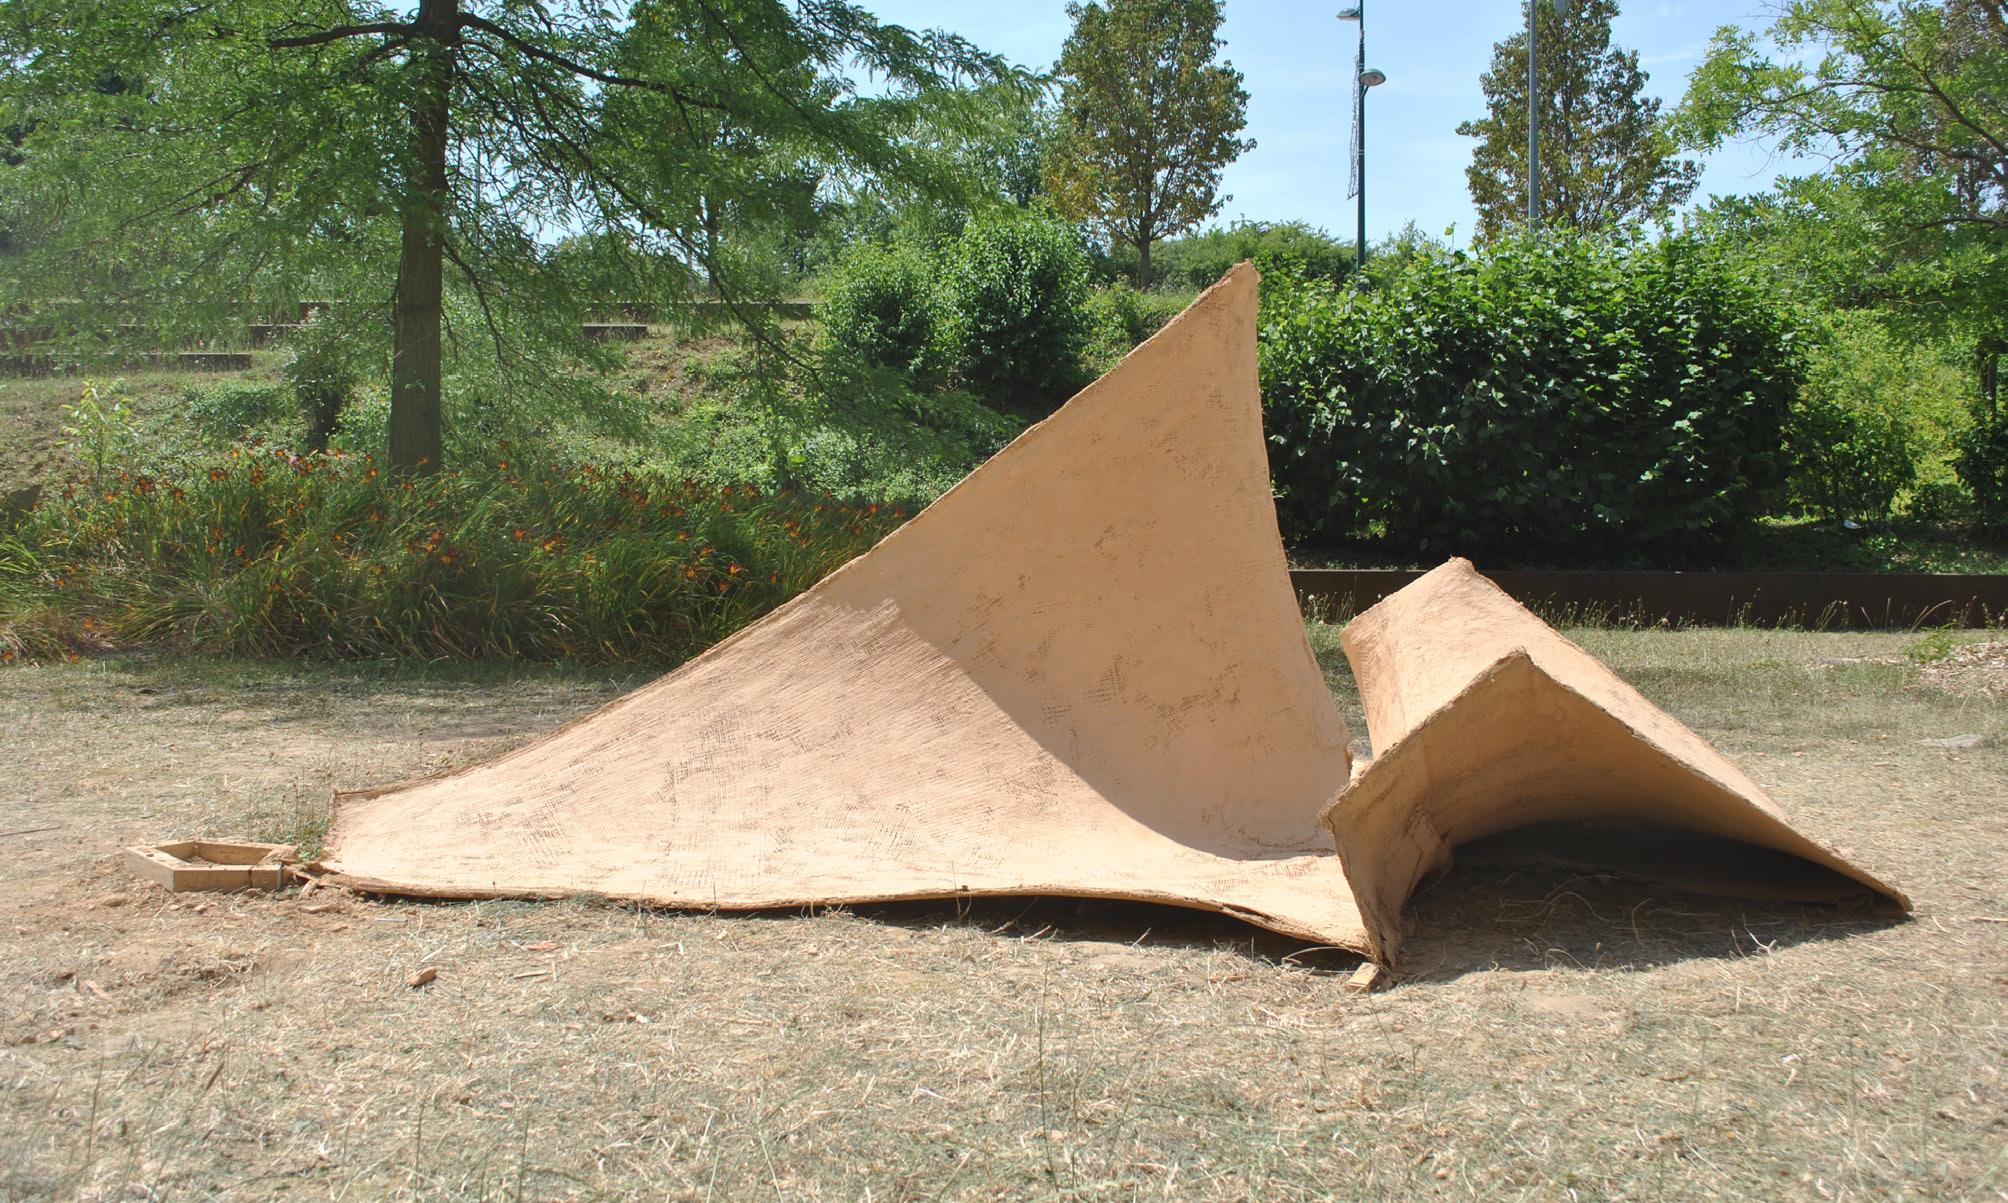
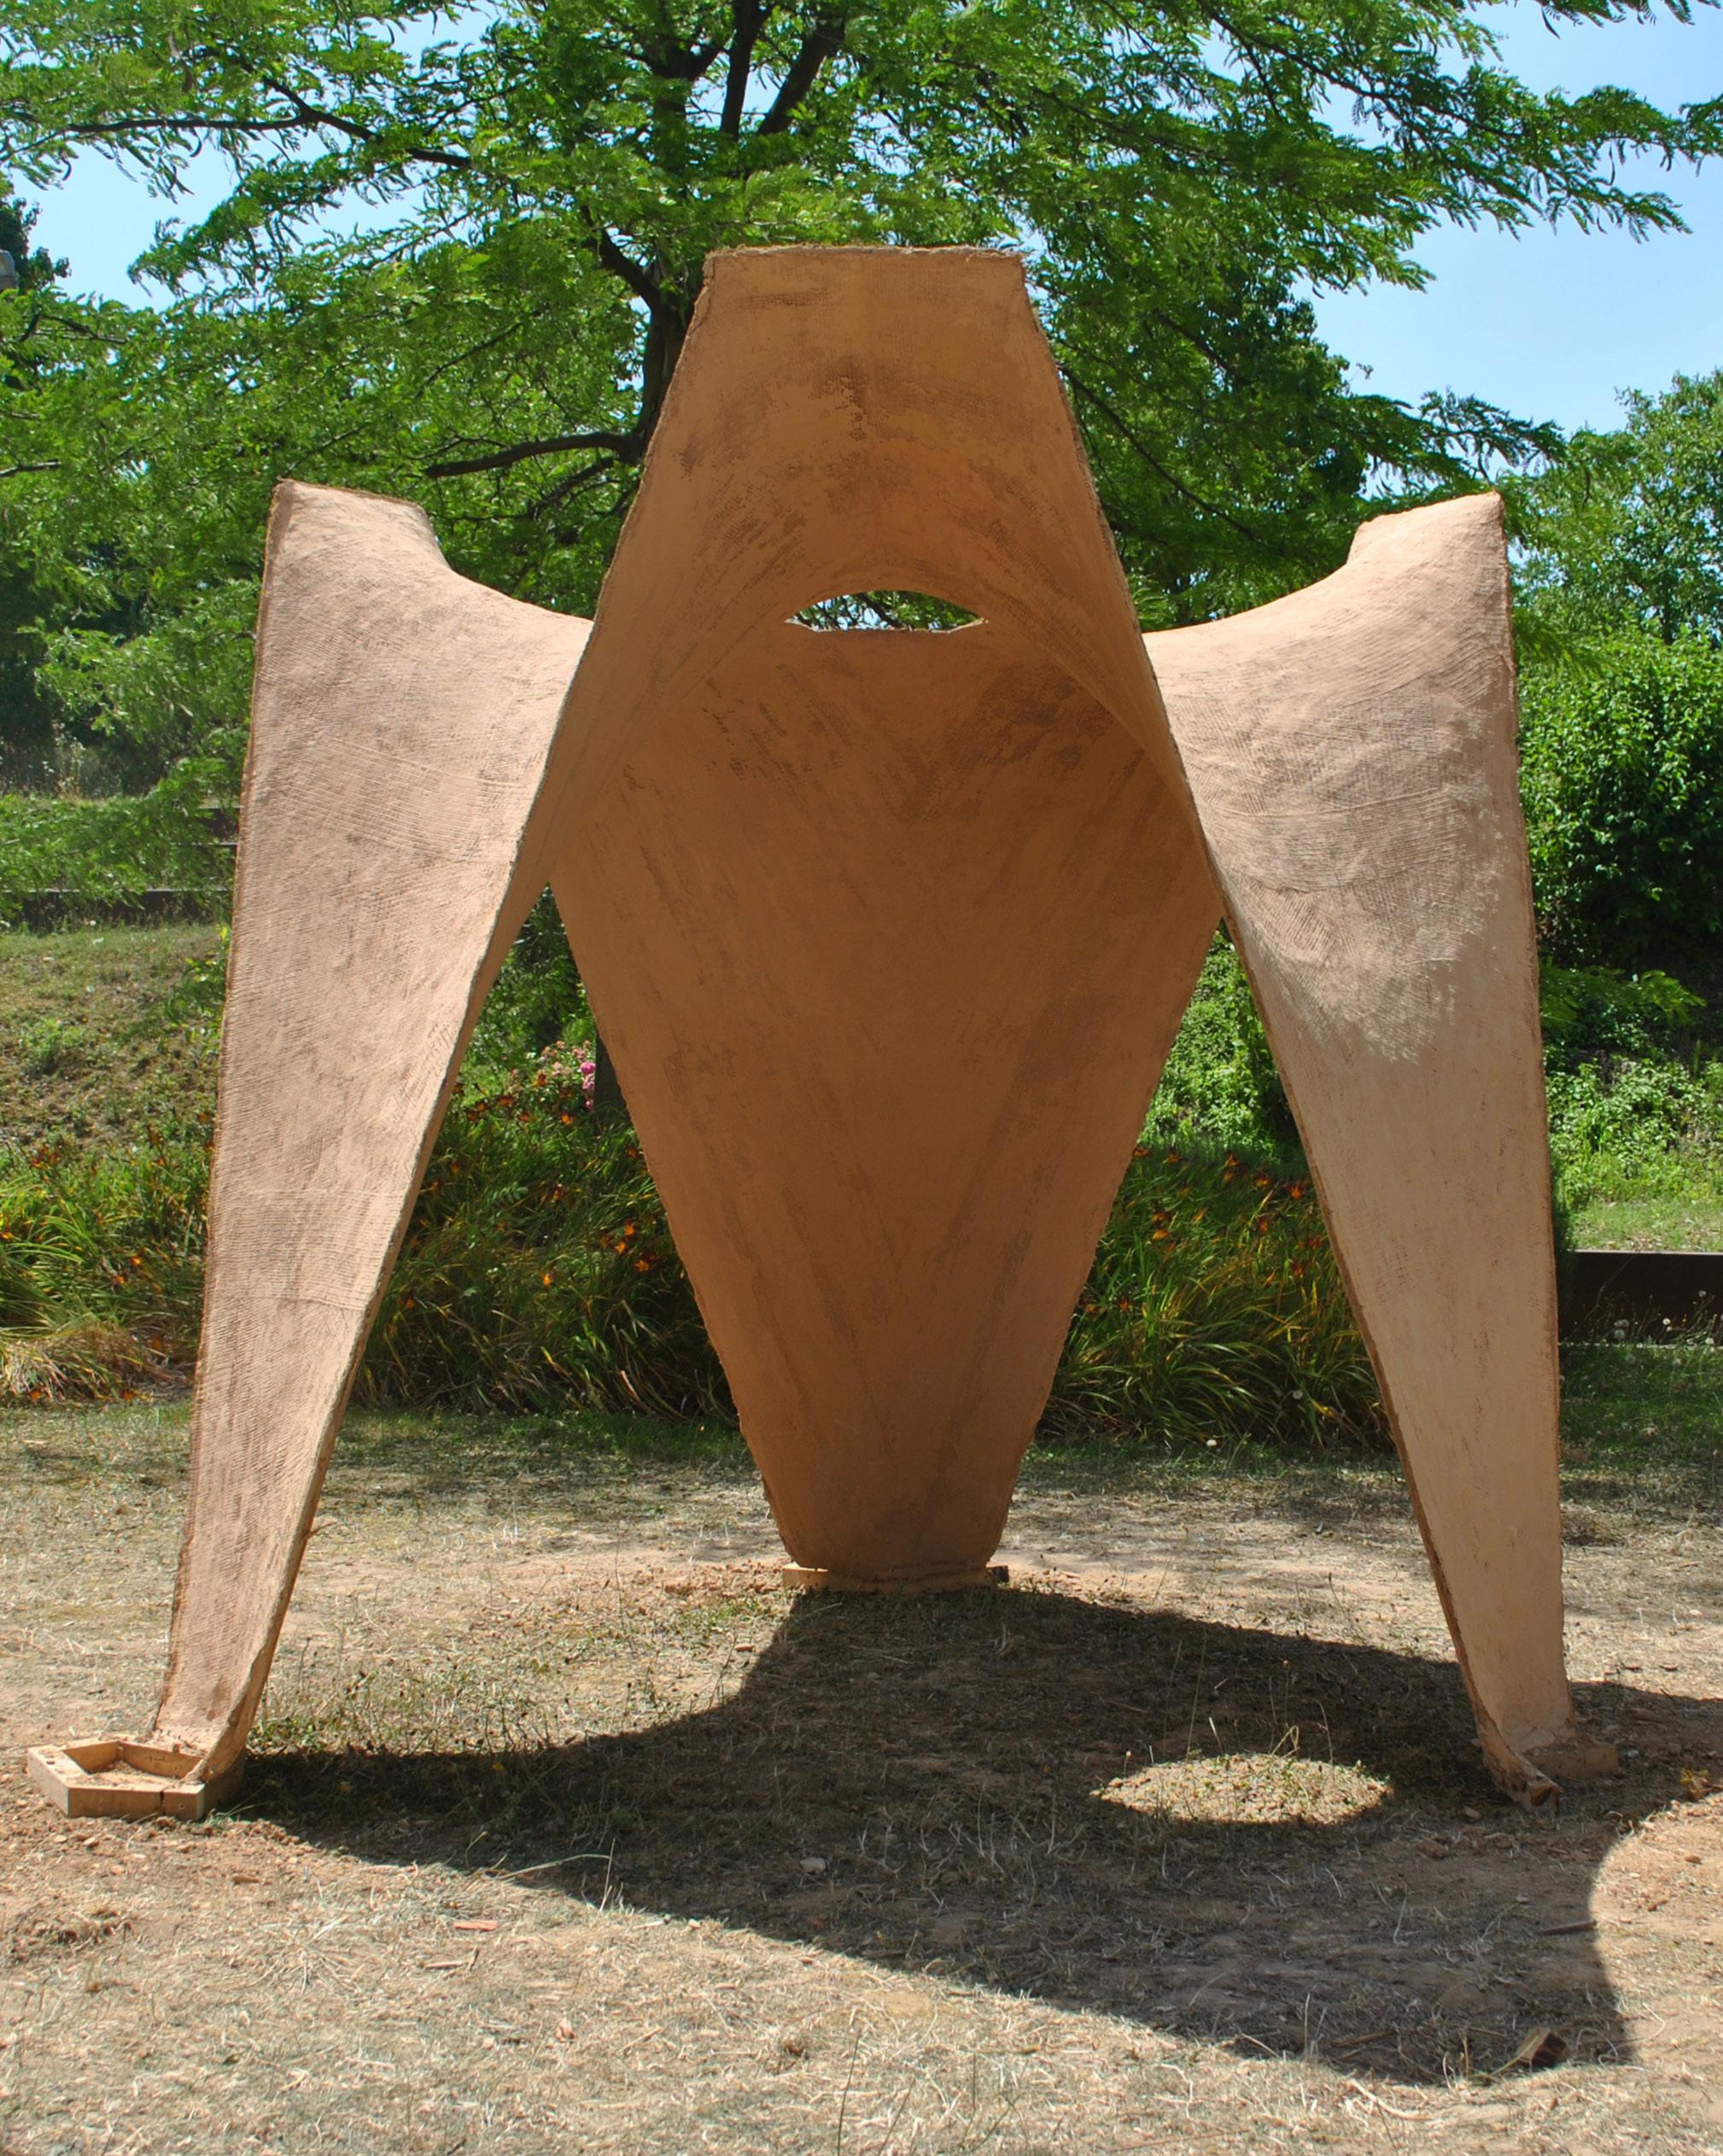
Fig. 3.25 Completed model, with finishing, the overall thickness is between 2 and 15 cm. Le Grand Ateliers, Lyon.
Fig. 3.26 Model, construction elements for the formwork and diagram.
Left
Spandex cuts
Diagonals and bracing Base Ring and upper frame
Spandex fabric
Zenithal opening Wooden frame
Angled ground support 56 cm
67 cm
Above right
Fig. 3.27 The picture shows the model with the first layer of clay with embedded jute mesh.
Below right
Fig. 3.28. Arrangement of the layers, diagram.
Earth, 2-15 cm thick Wooden frame
Jute
Finishing
Clay
Starch
Spandex
Jute
stresses imposed by the stretched membrane. The spandex fabric is stapled on the wooden frame every two centimetres in order to make it as pre-stressed as possible.
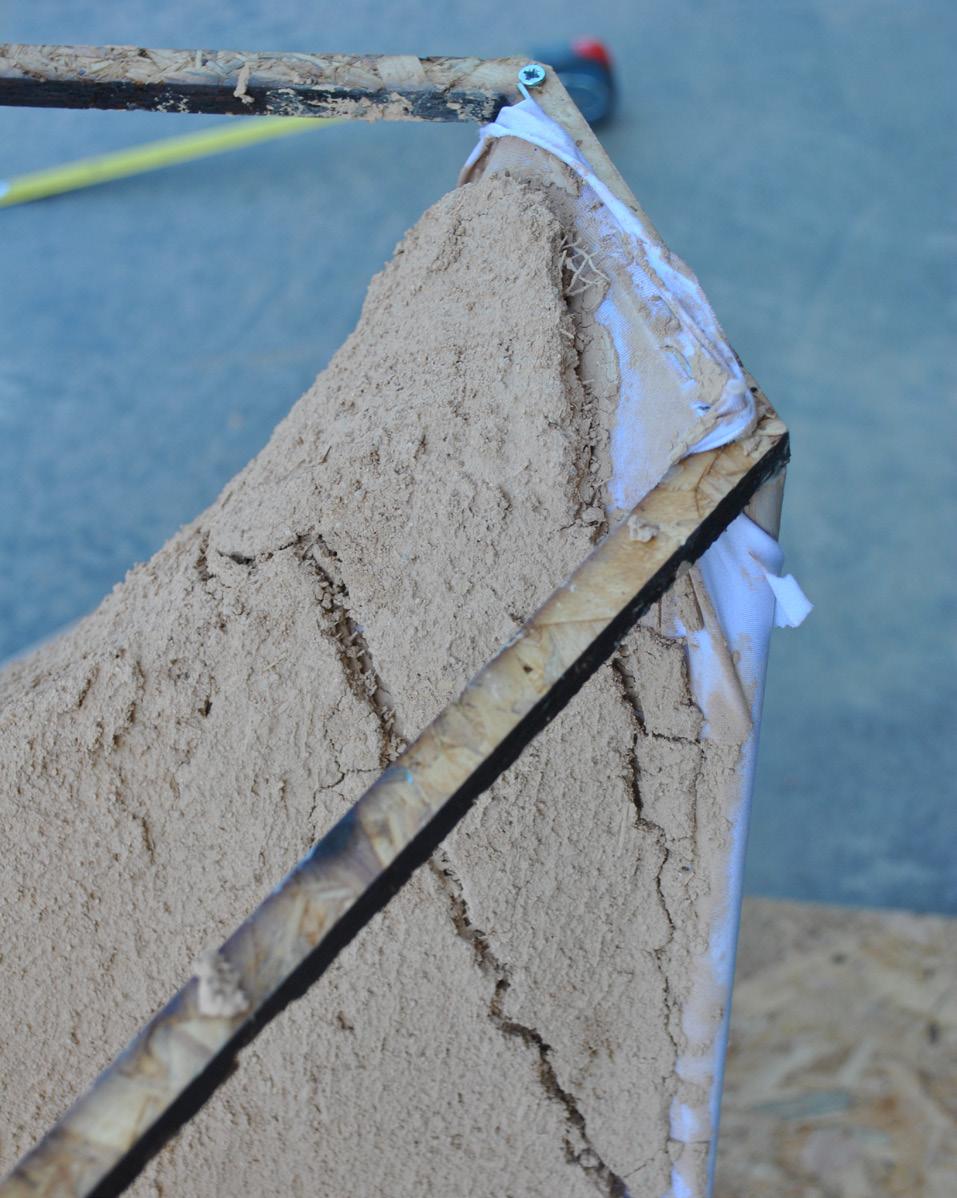
Observations
Firstly, fabric elasticity on one of the directions is larger than predicted, therefore on this direction the pattern could be reduced around 20%. Moreover, fabric deformation from the centre point is very high, with a maximum values of 45 mm.
After a load testing with more then 75 bricks, we can observe that the model is able to support a load of 2.55 kN (260 kg), with a displacement of less then 5 mm. In addition, the amount of load was not high enough to crash the prototype, therefore, we do not know the maximum bearable load.
Conclusions
A double boundary frame enables a better finishing of the edges of the final structure, while, the frame cross section needs to be rectangular to allowed a good connection and to prevent the fabric from sliding. Besides, anchor the zenithal opening to the ground would allow to control the clearance height of the internal space.
The succession of layers allows: repair-ability and progressive thickness; for example, dry layers work as a thin shell. The jute mesh should allow clay to fix it on the fabric formork and a small overlapping allow to make jute more continued.
In the end, the supporting points, built with a thickness of 15 cm prevent the arcs from sliding and opening, making the whole structure more stable and stronger in terms of resistance against dead loads.
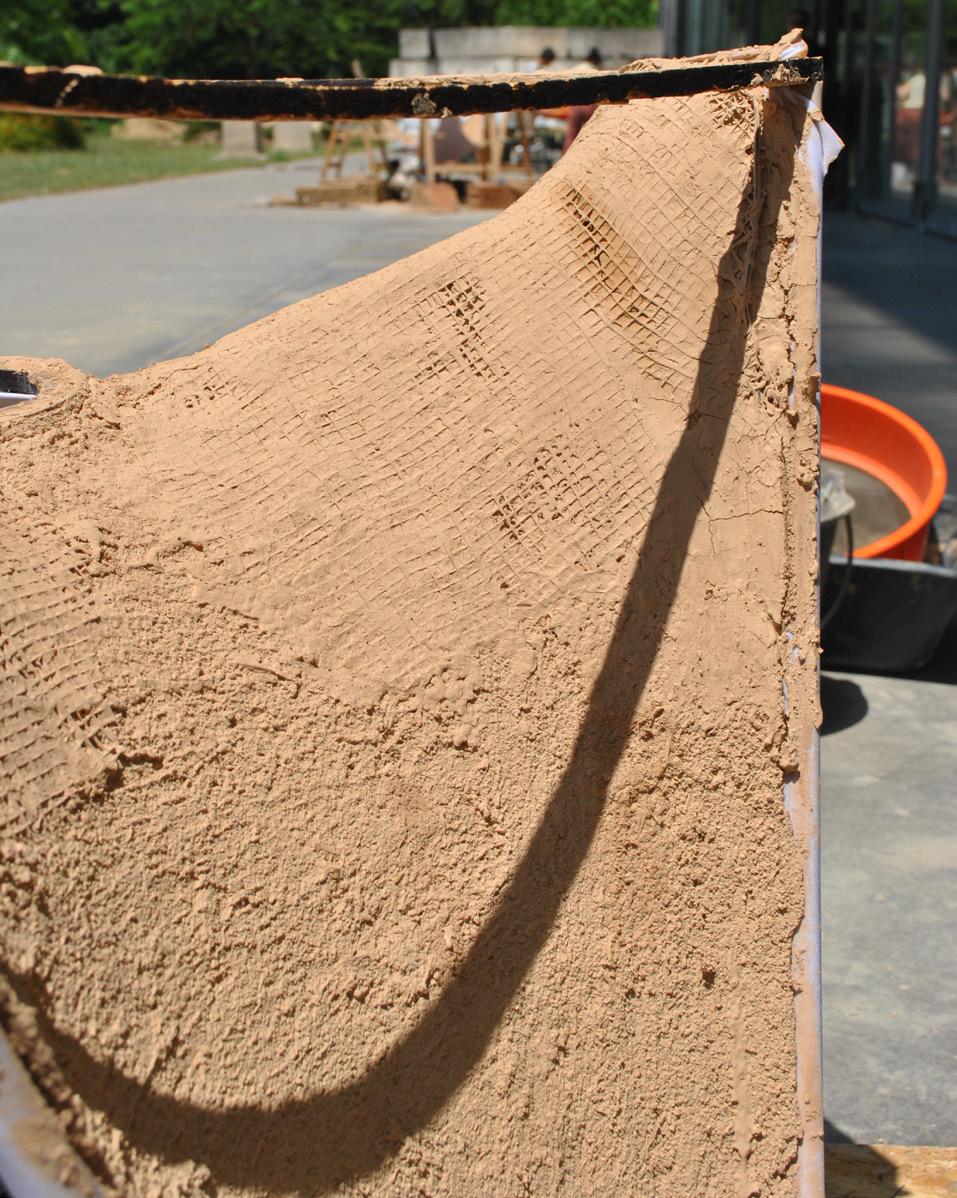
Left Fig. 3.29 The picture shows the model with the second layer of clay and sand.
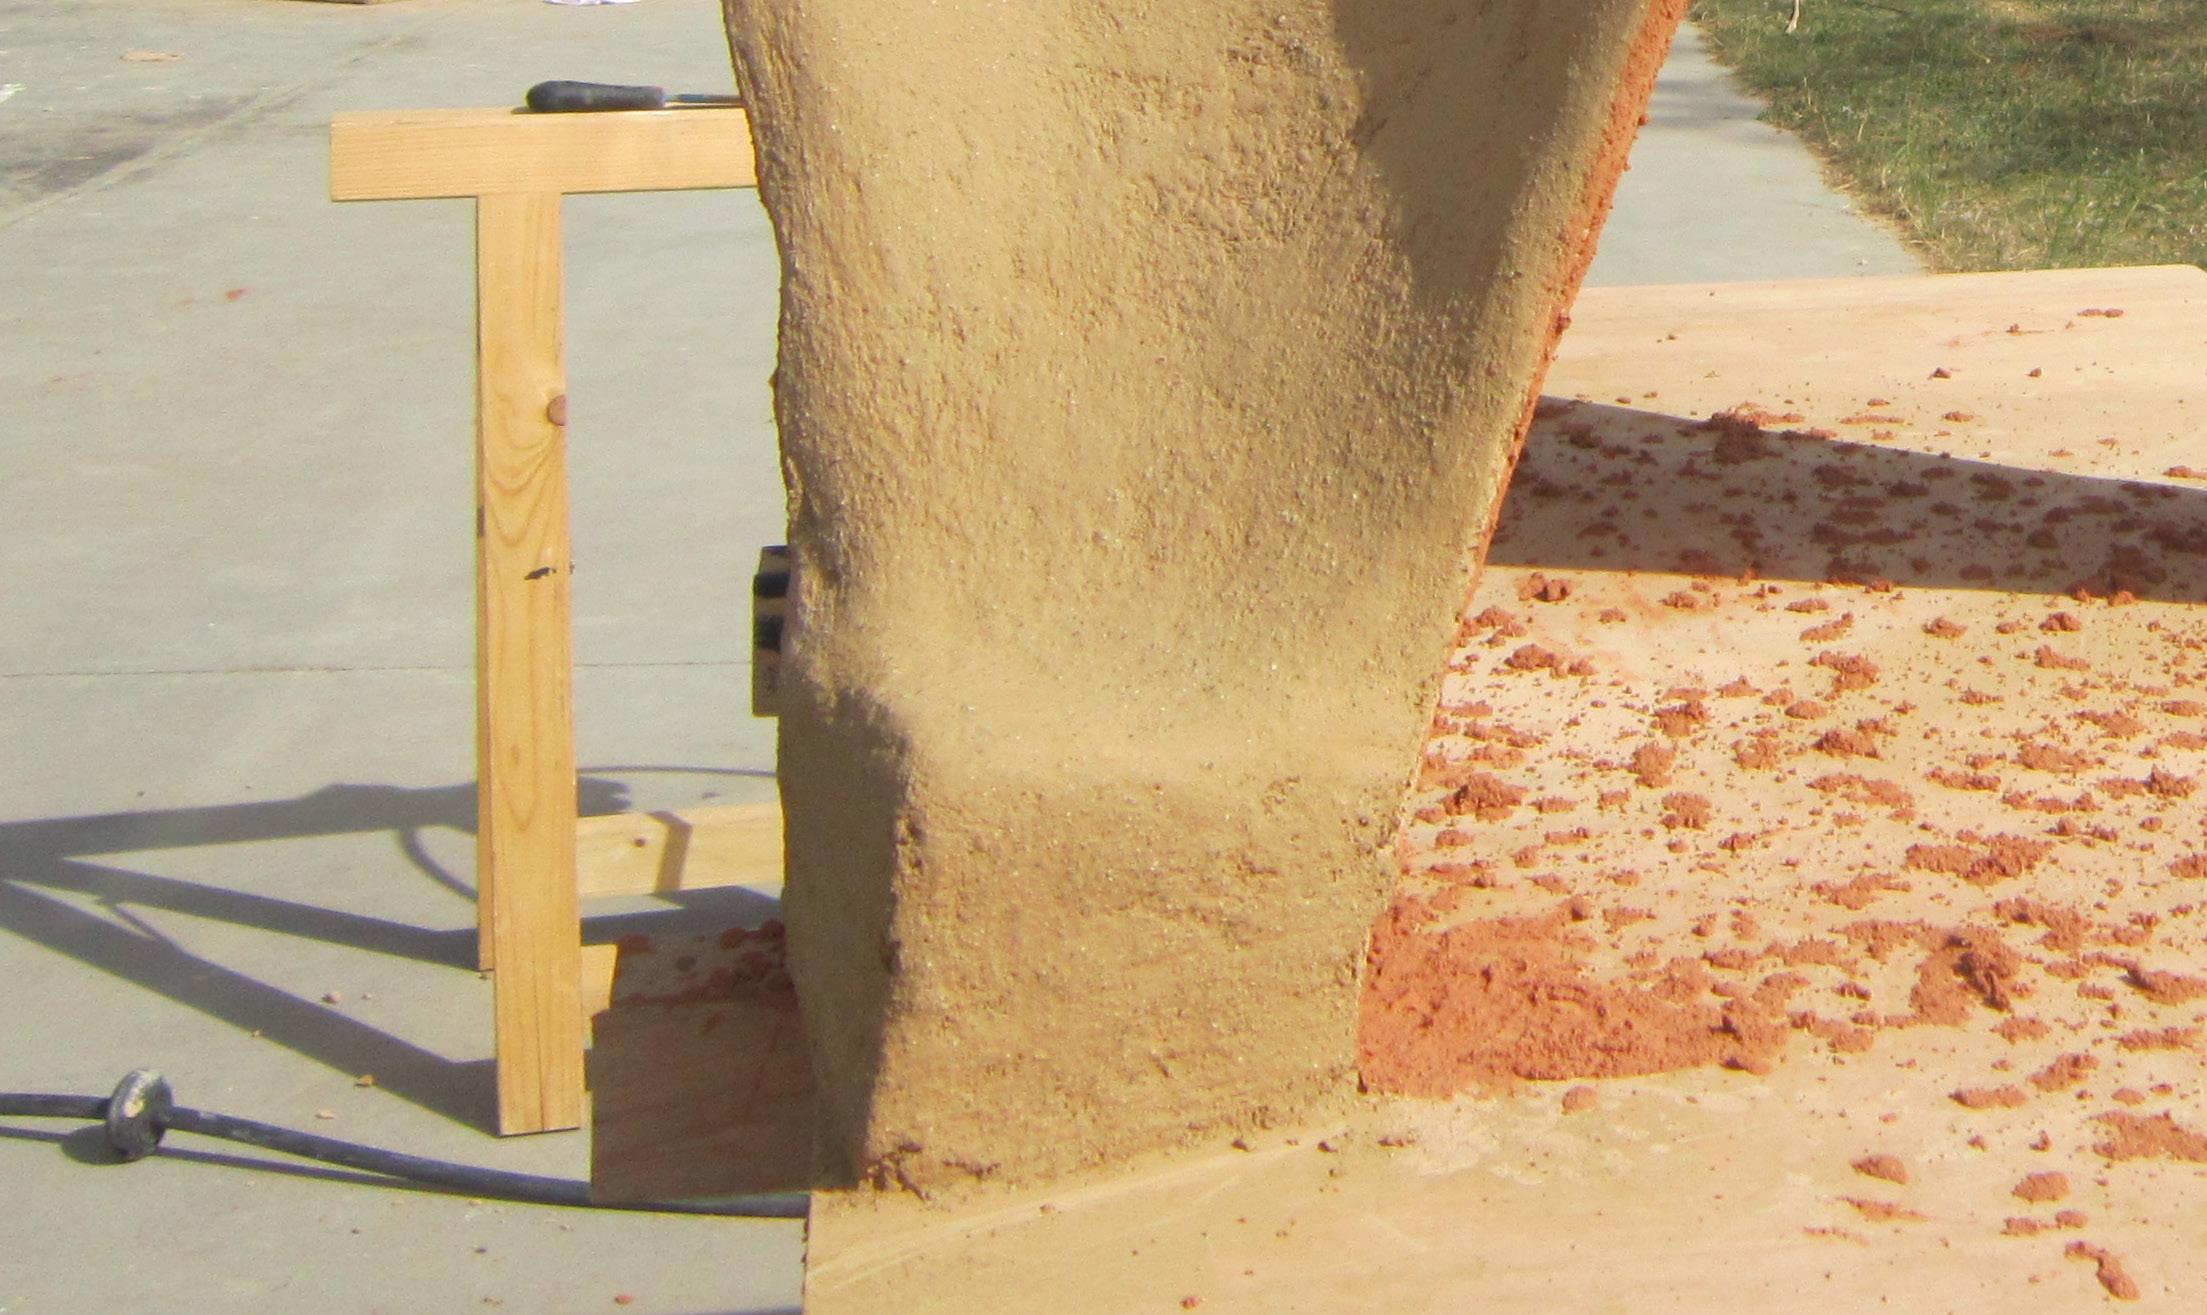
Right
Fig. 3.30 The sequence shows the reparation of the model. Repairability is significant opportunity of earthen structures.
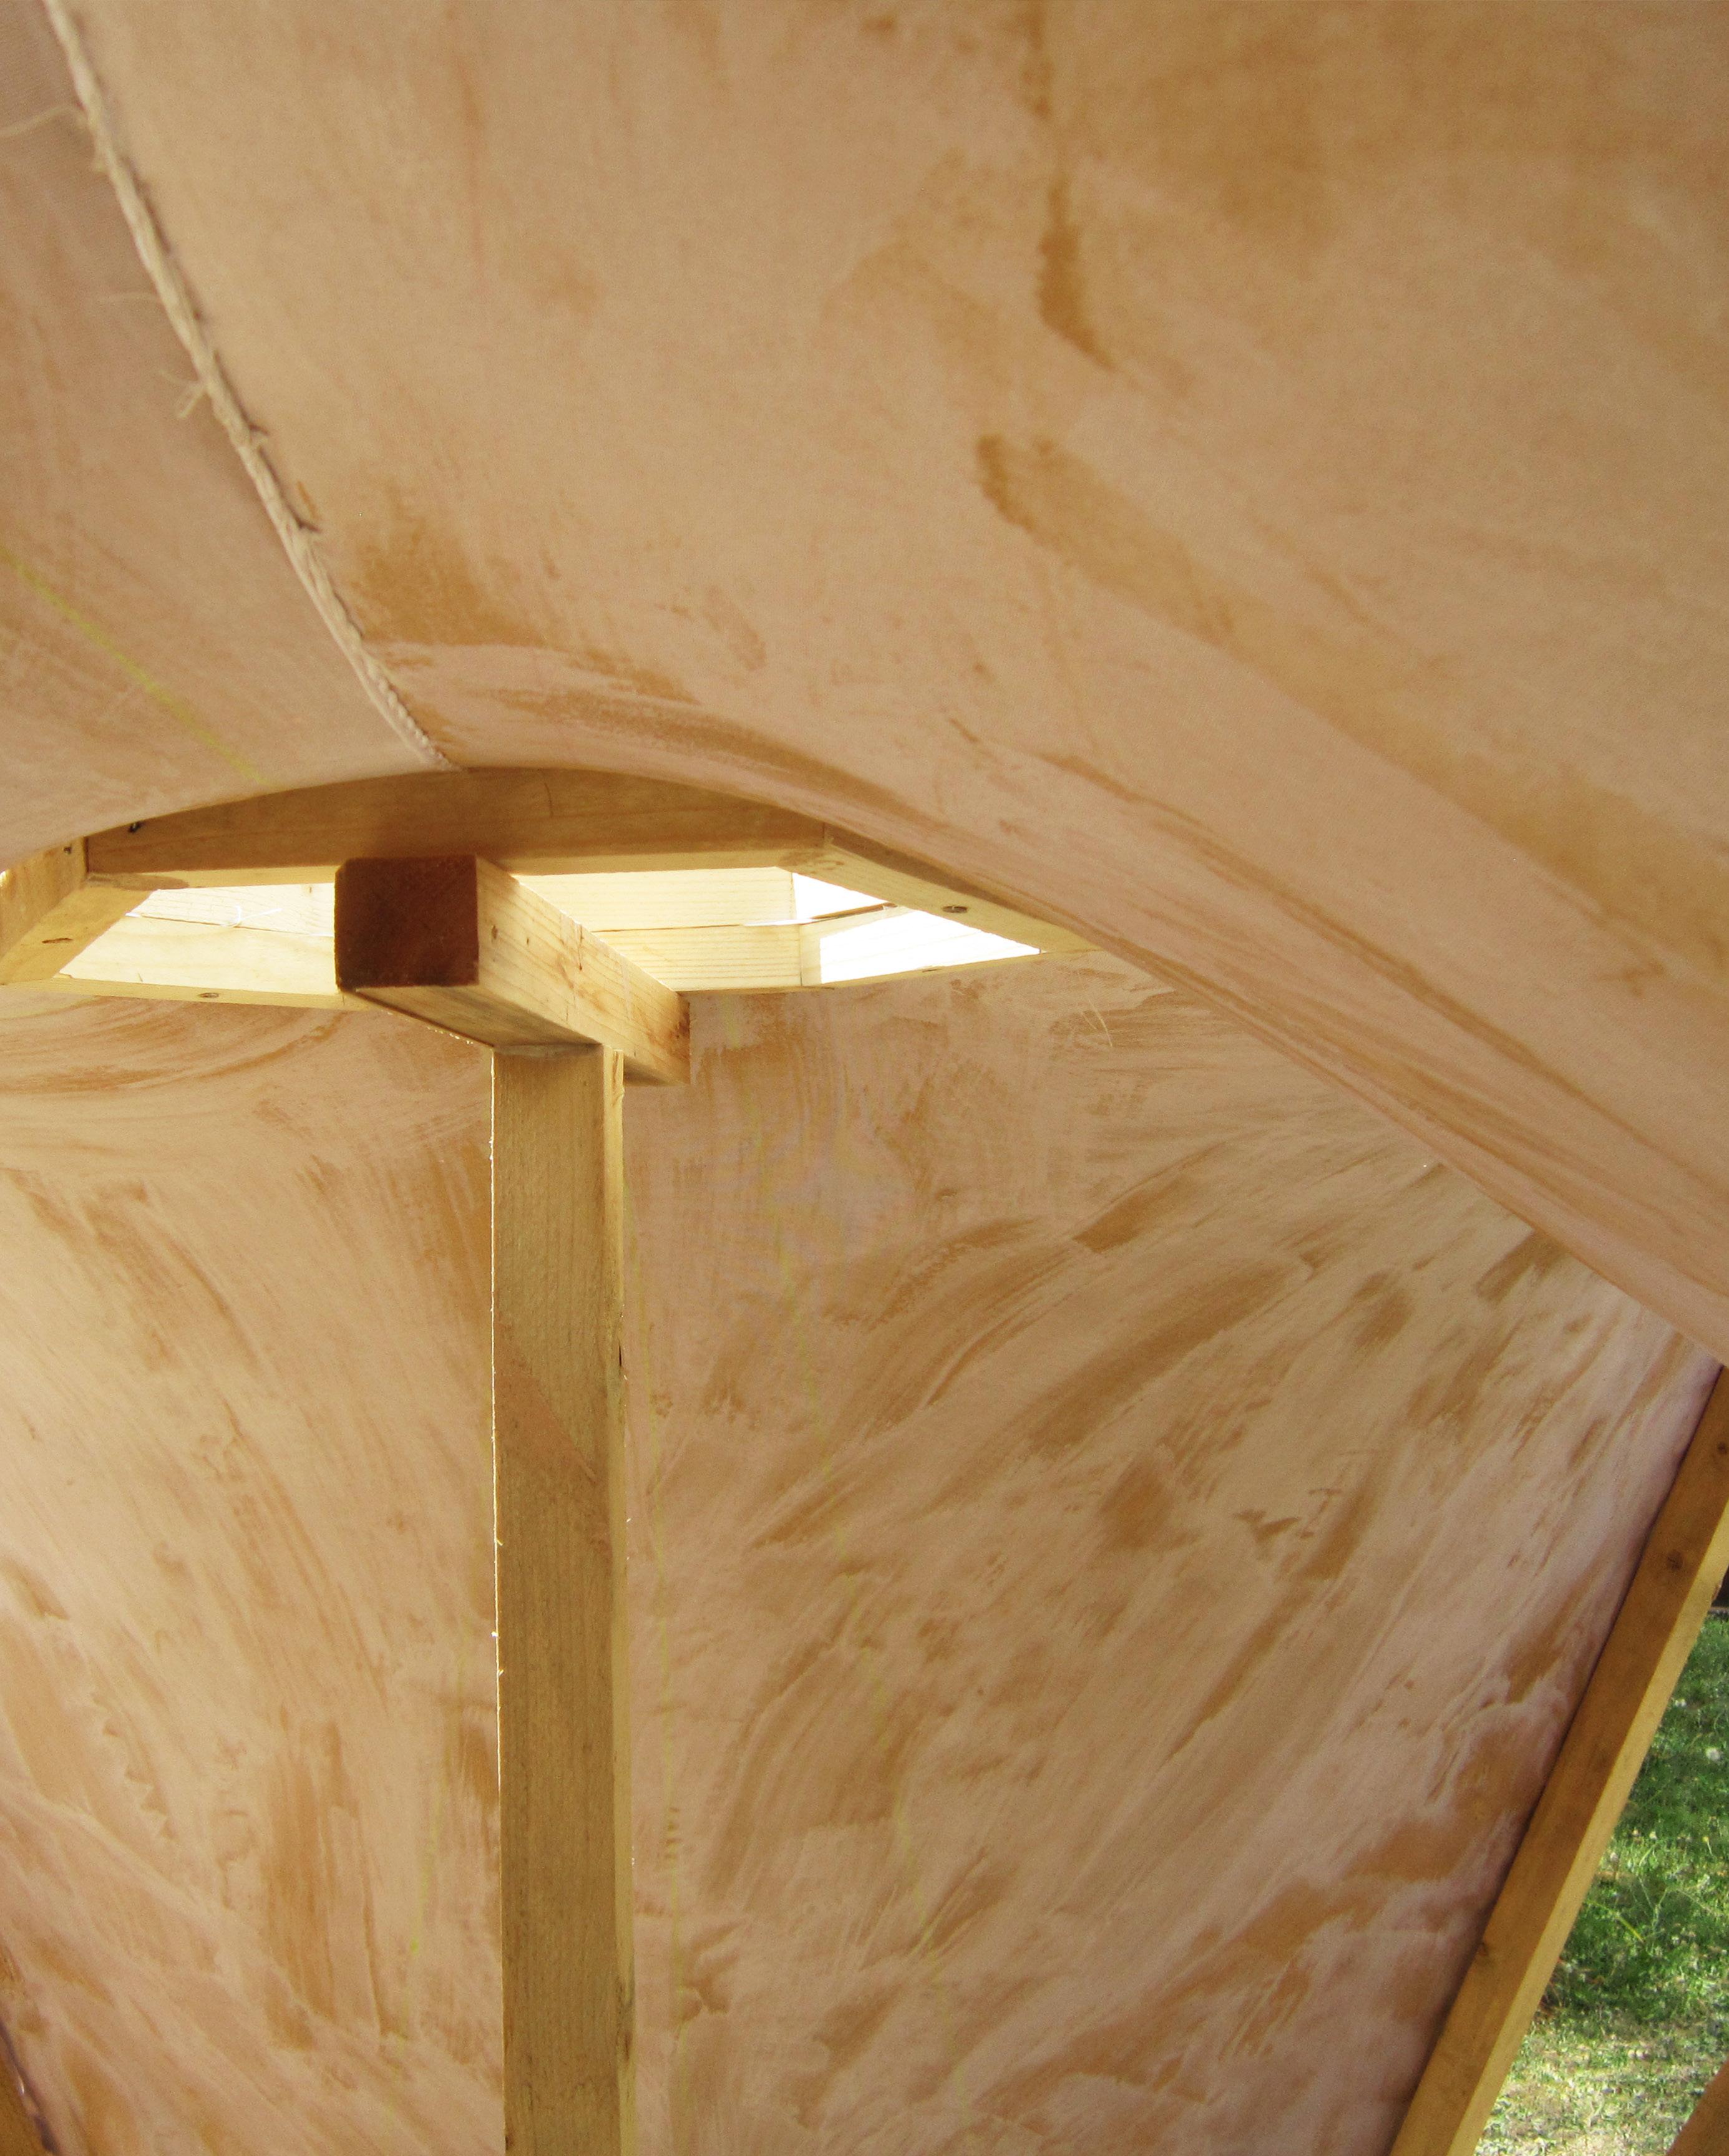
Above right
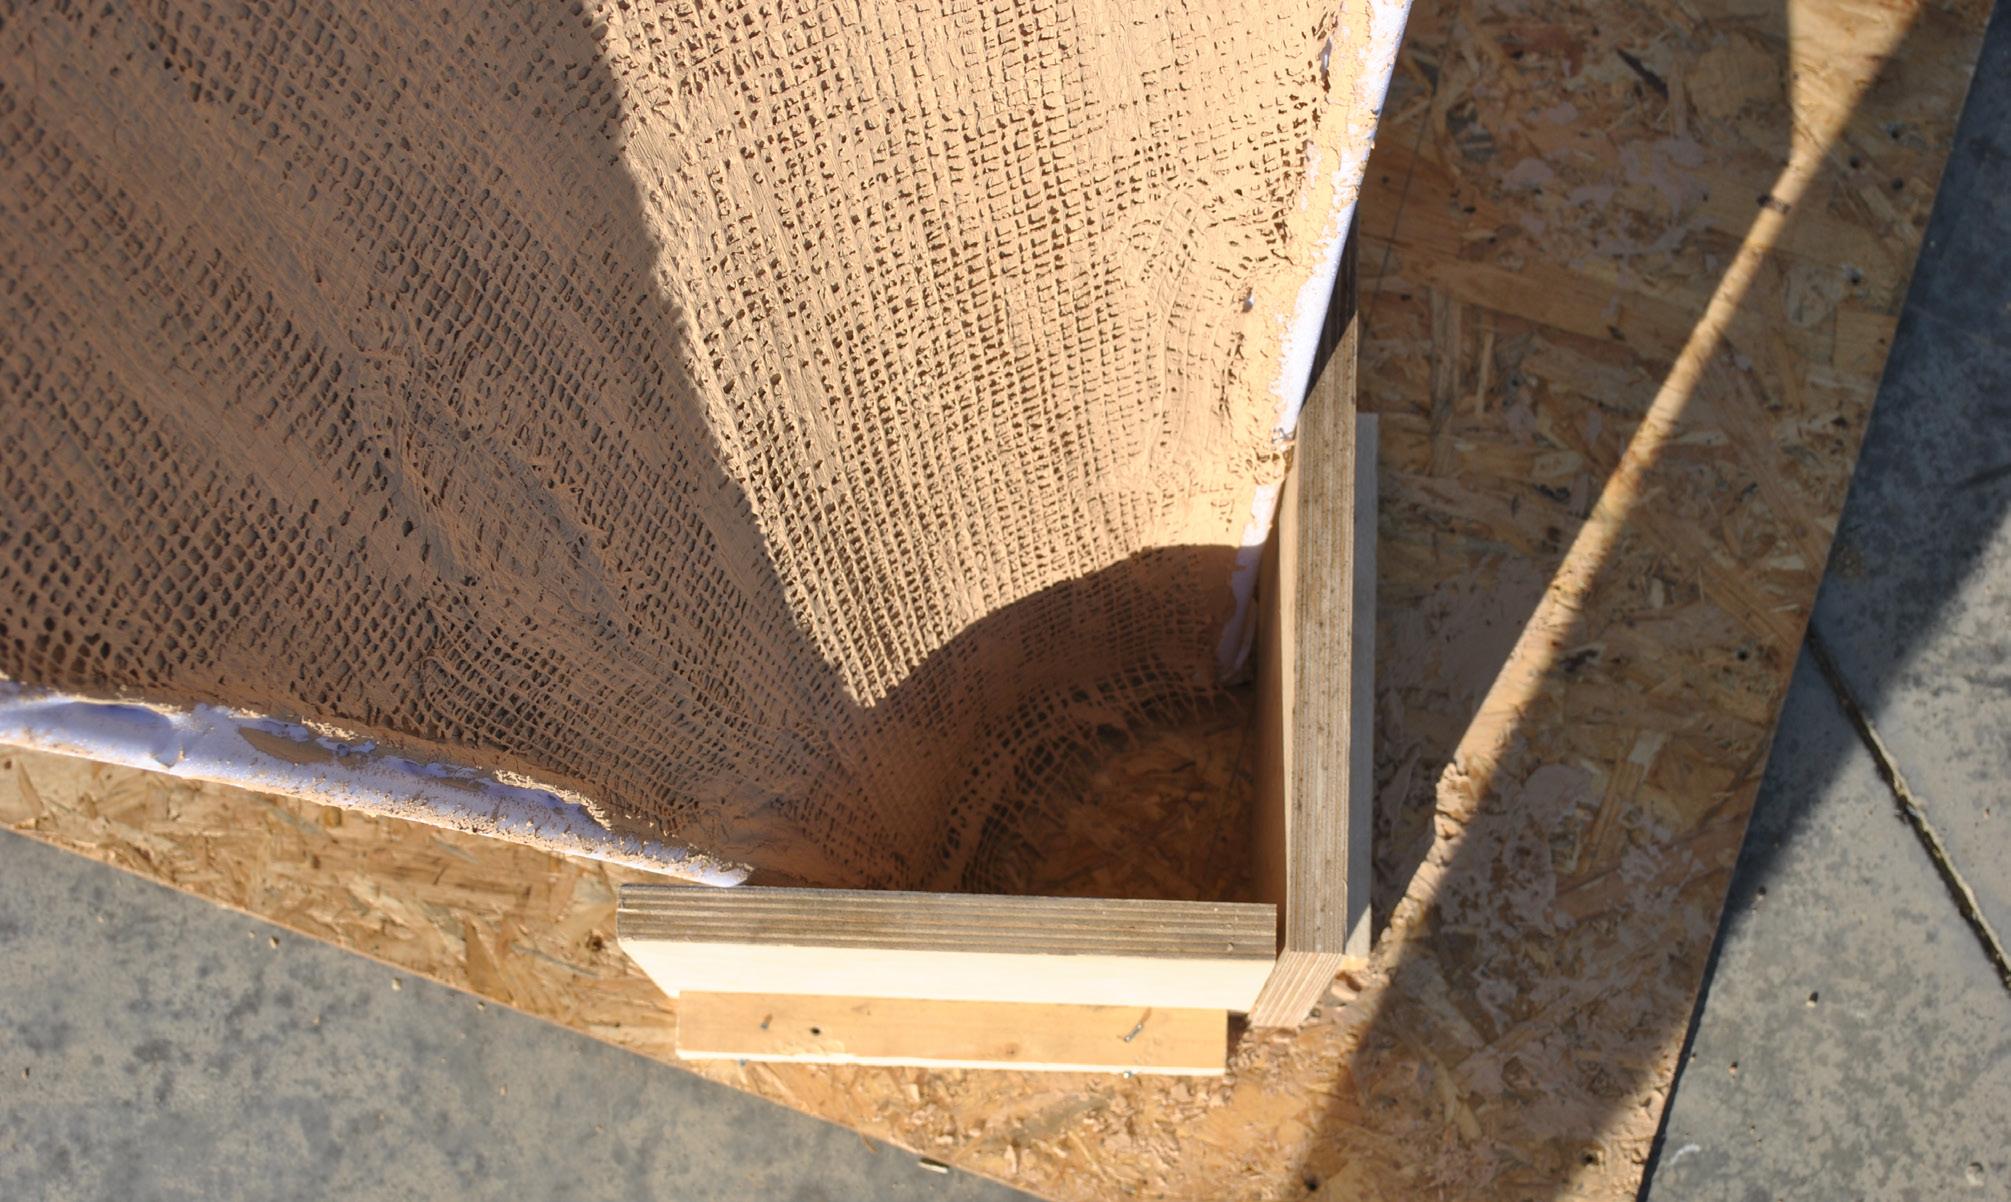
Fig. 3.31 Formwork for support element, detail.
Below right
Fig. 3.32. Support element, detail.
Left Fig. 3.33 Model, loading test, maximum load: 260 kg.
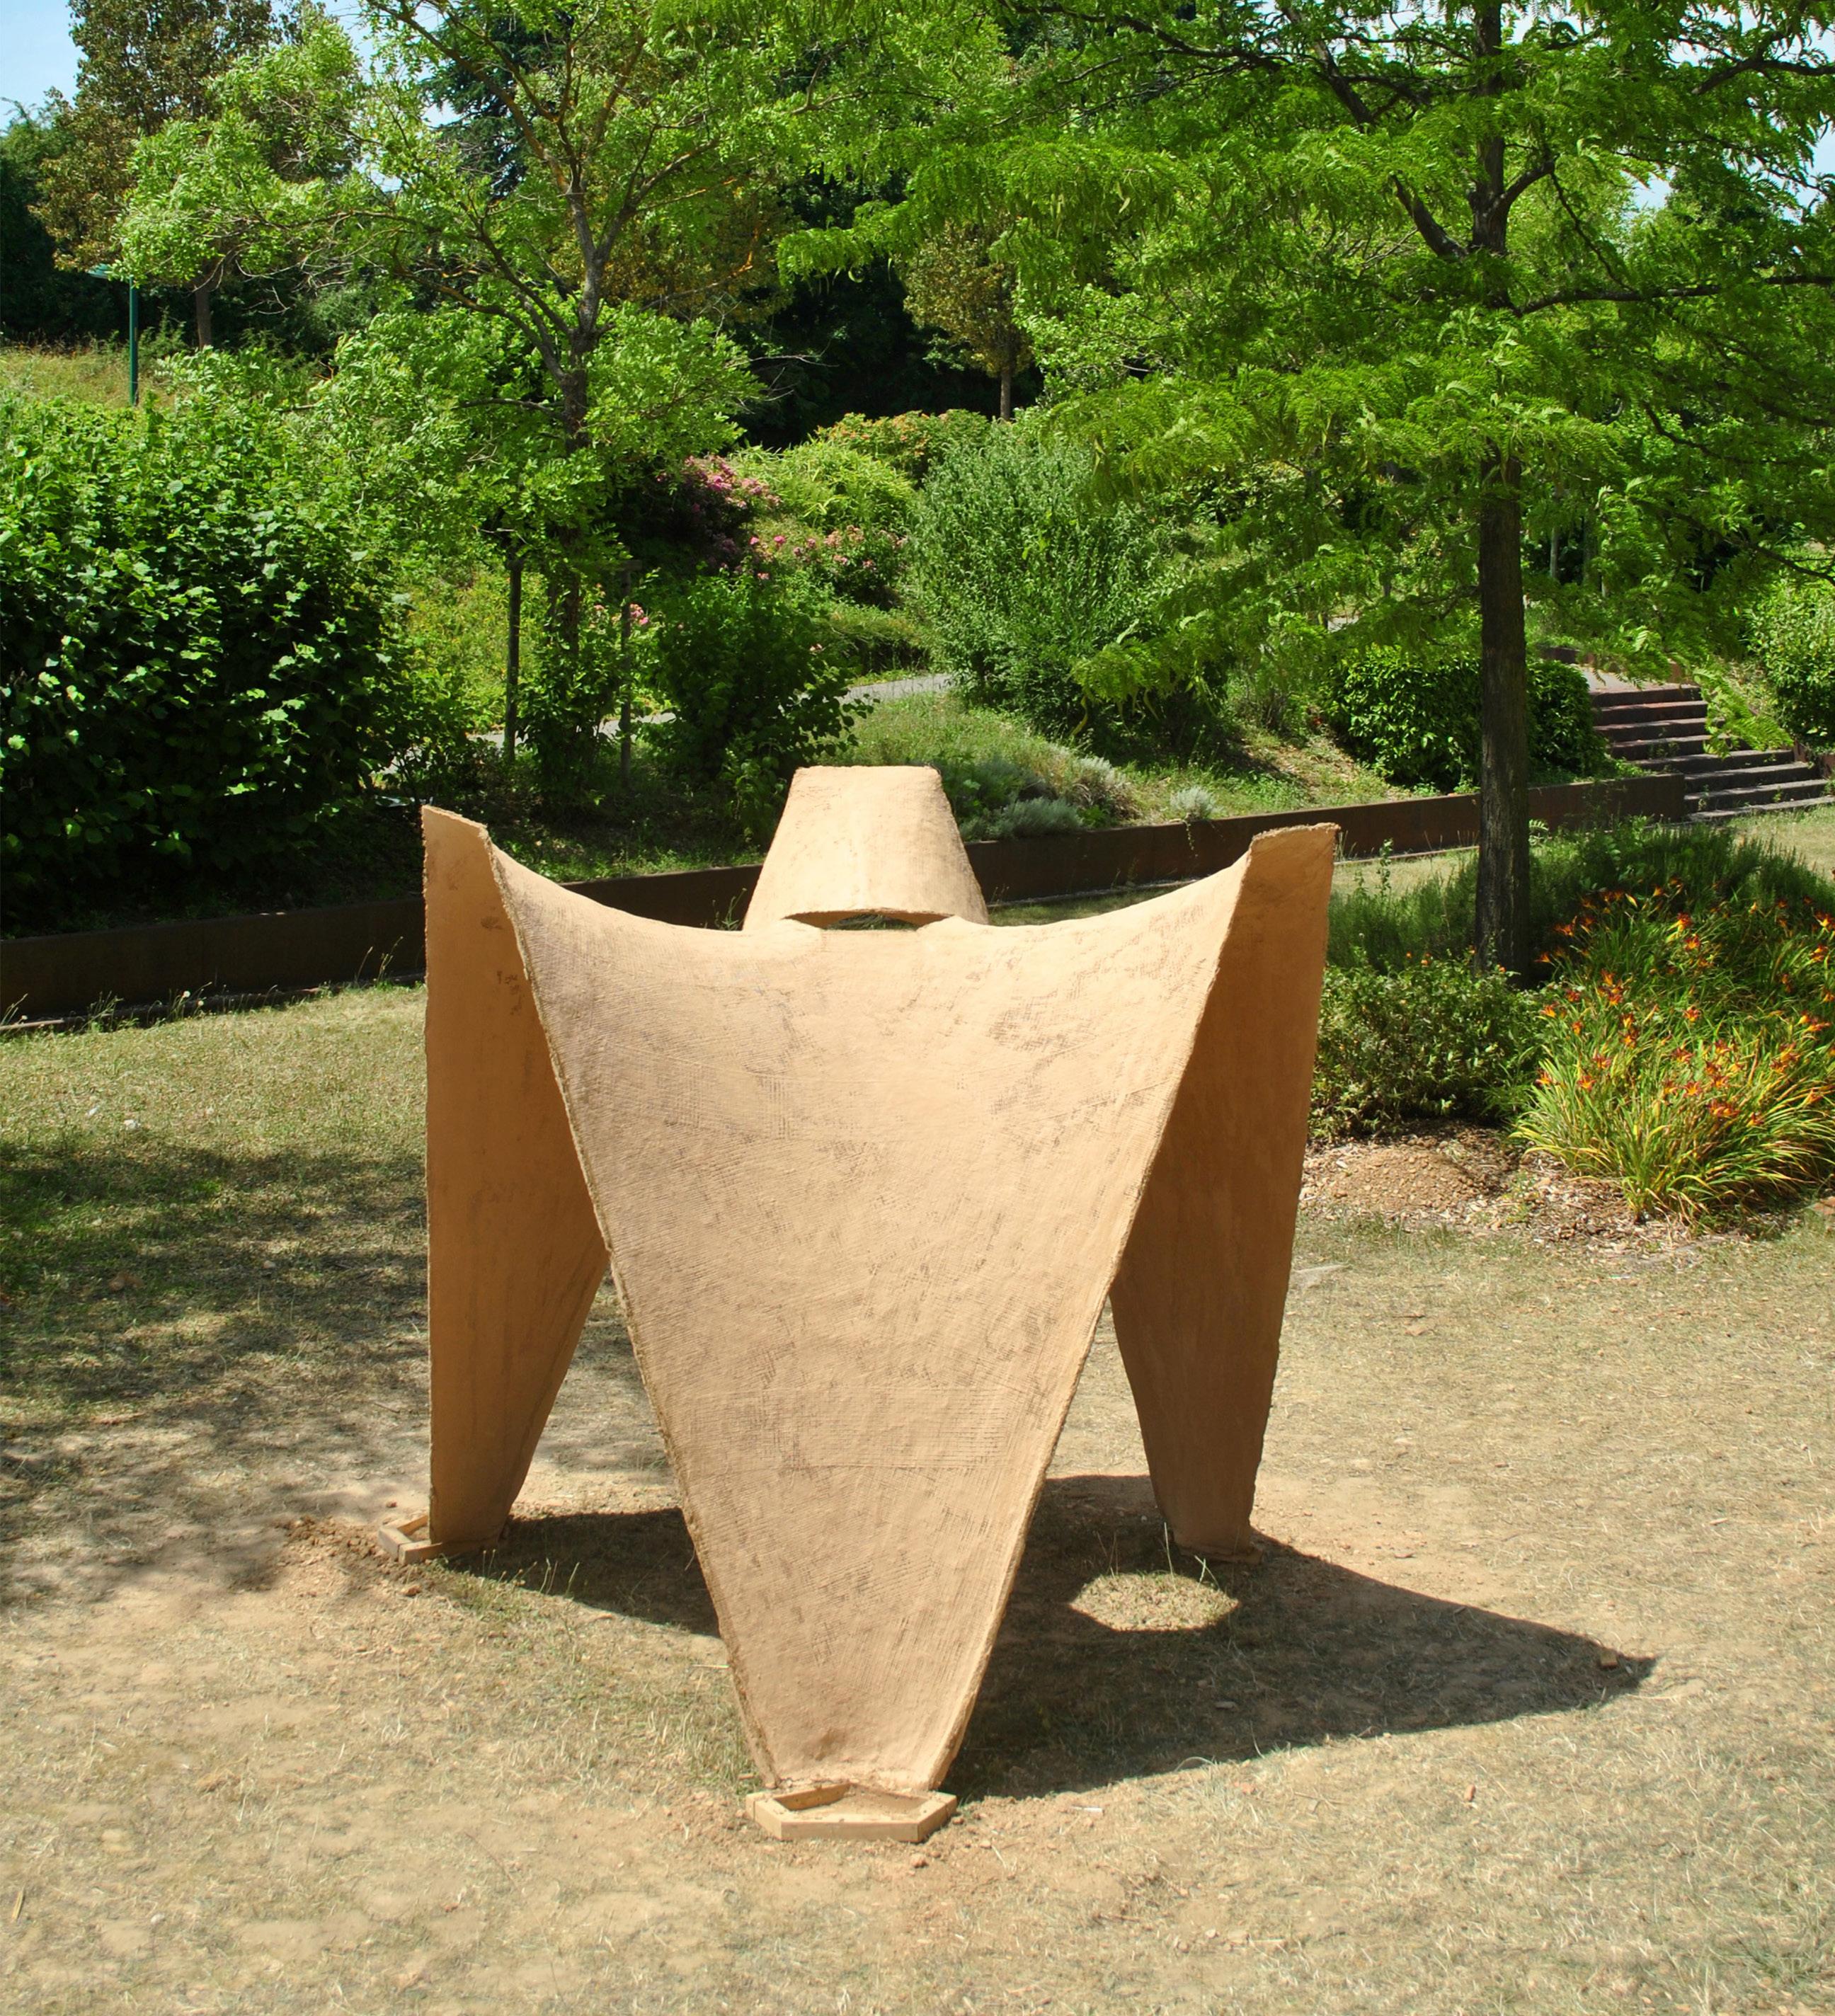
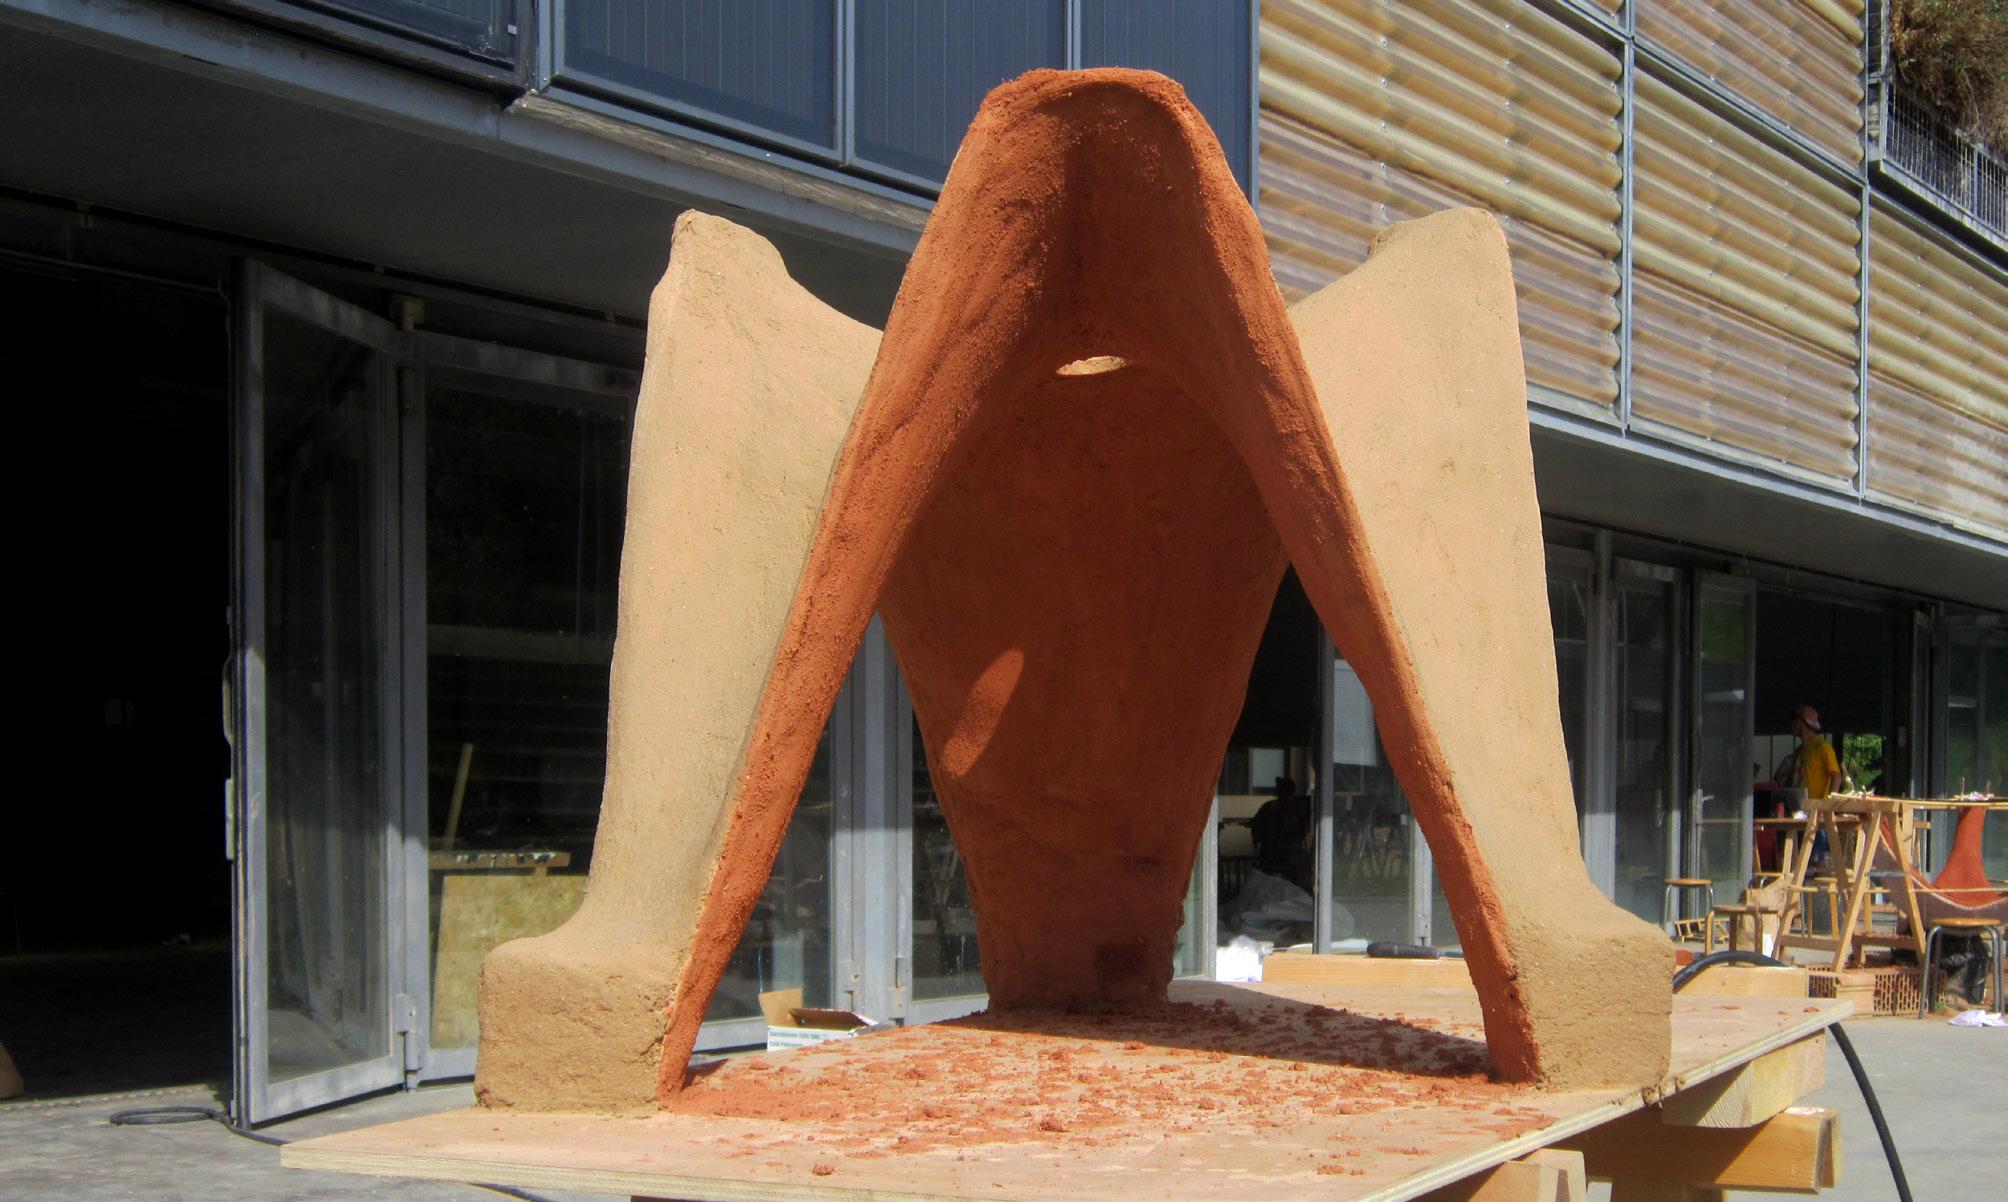
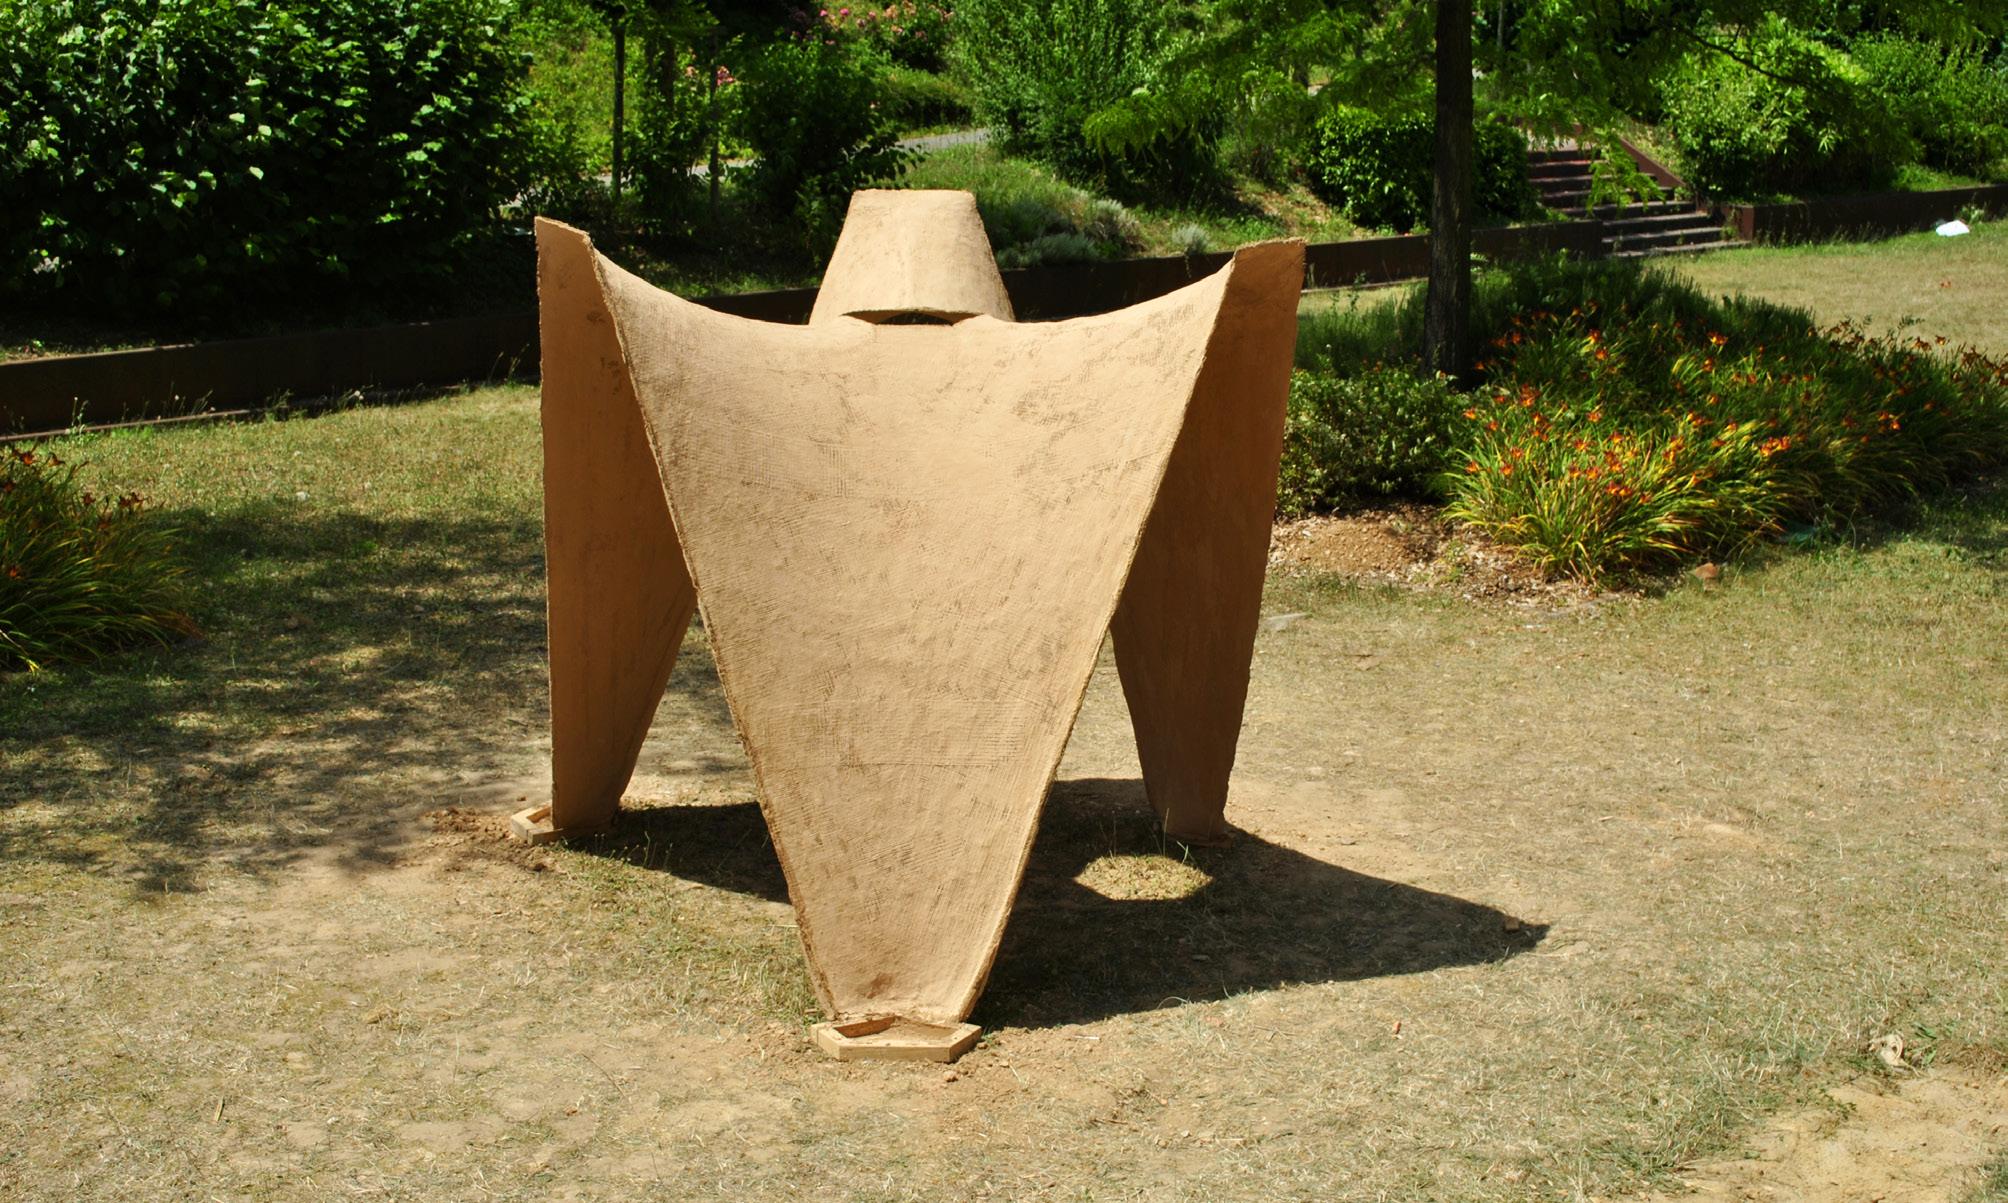
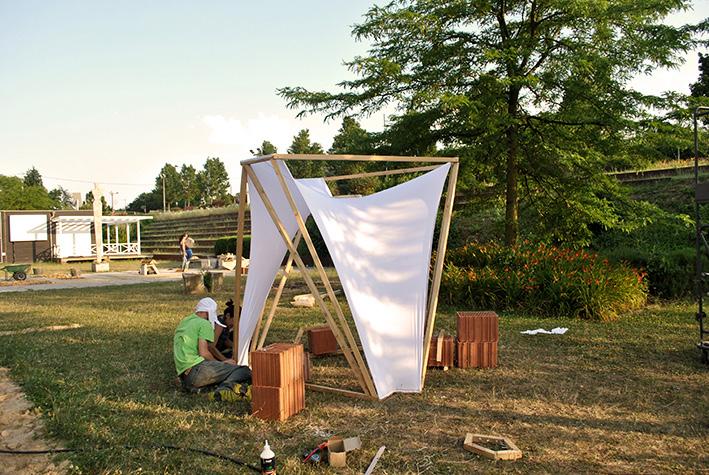
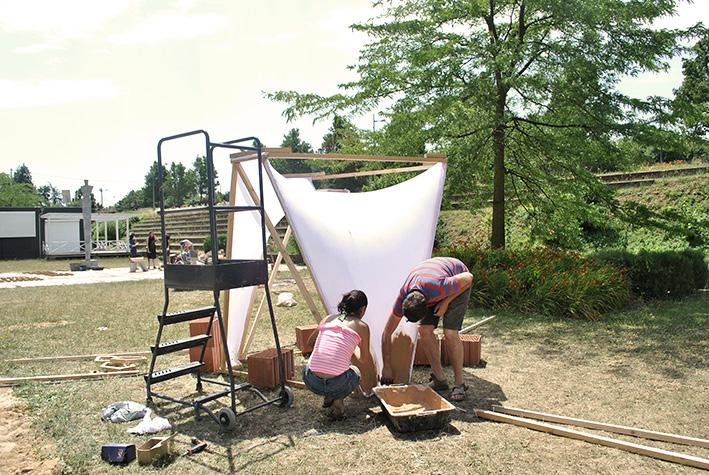
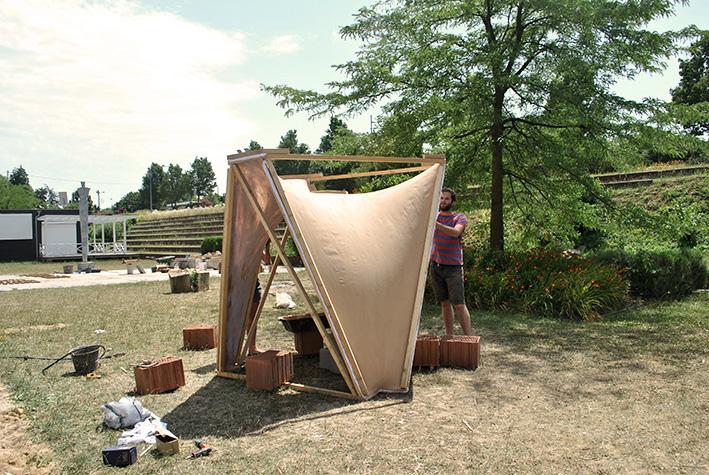
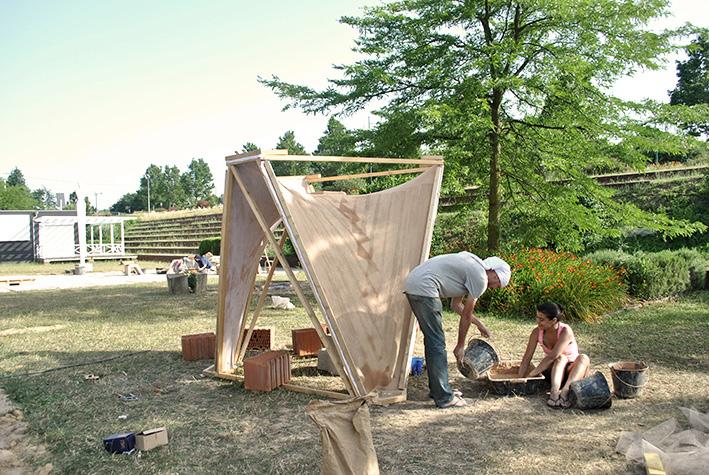
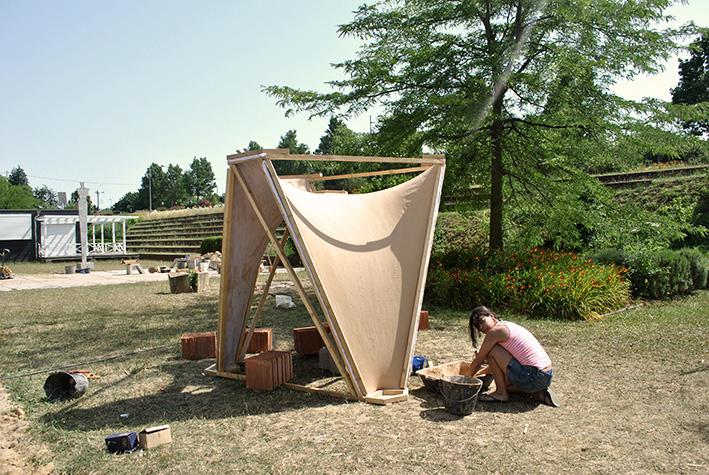
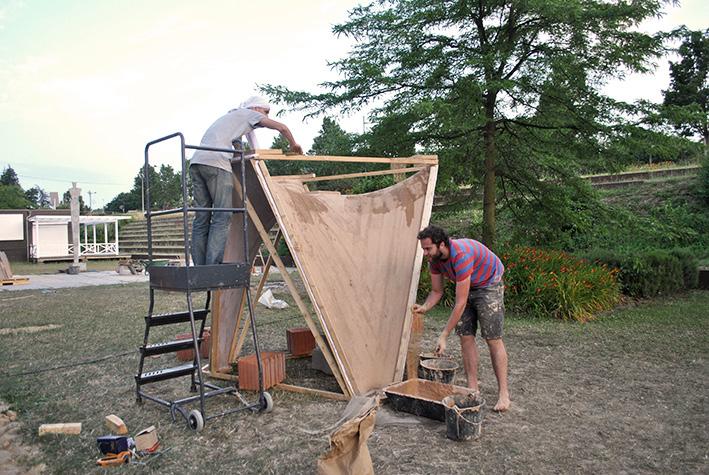
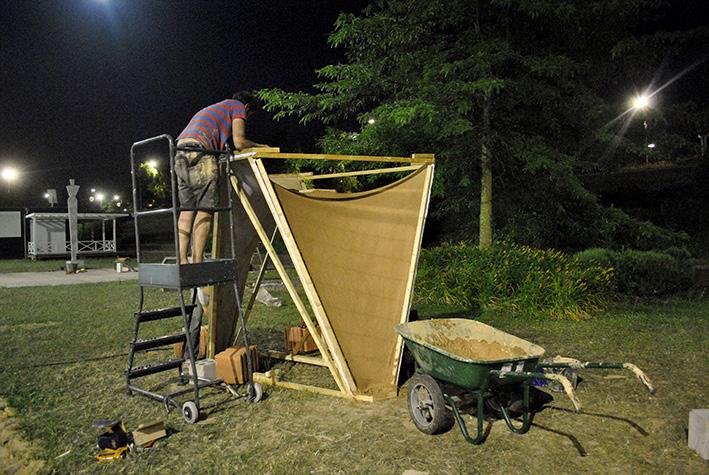
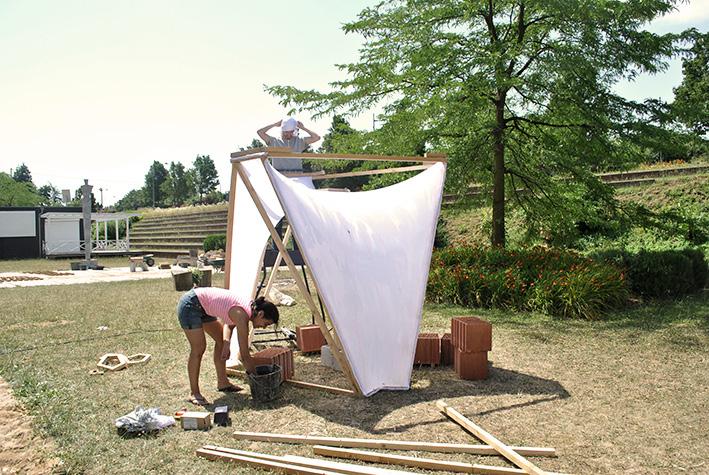
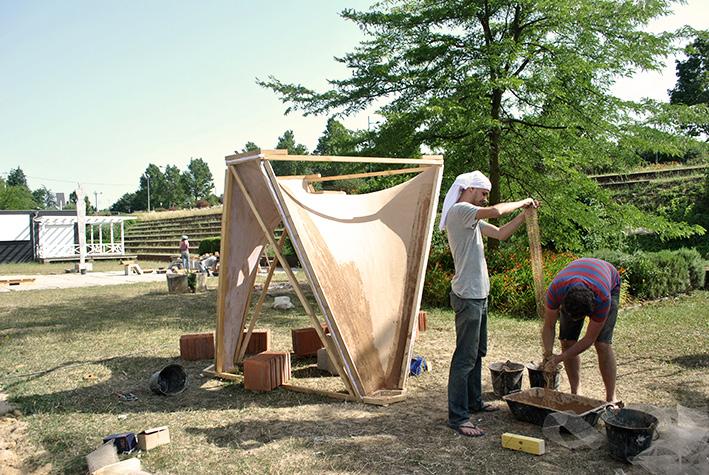
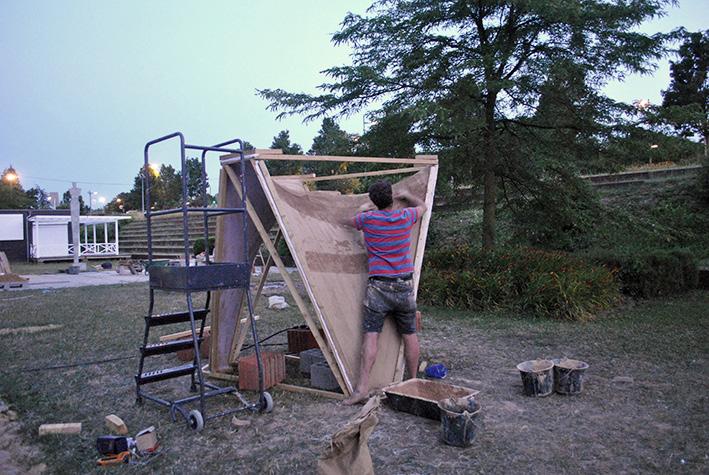
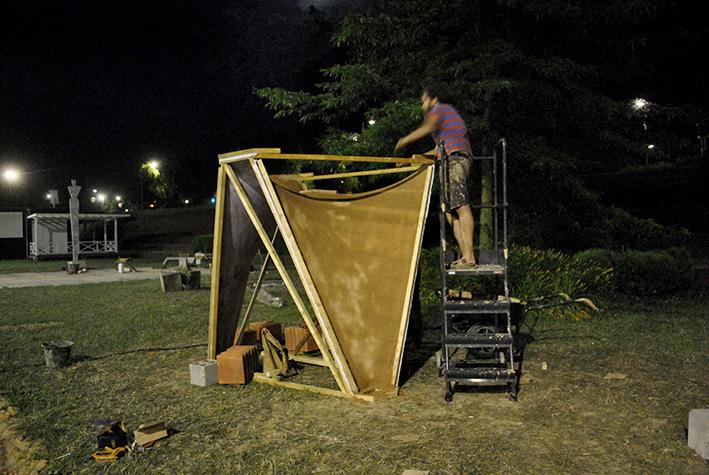
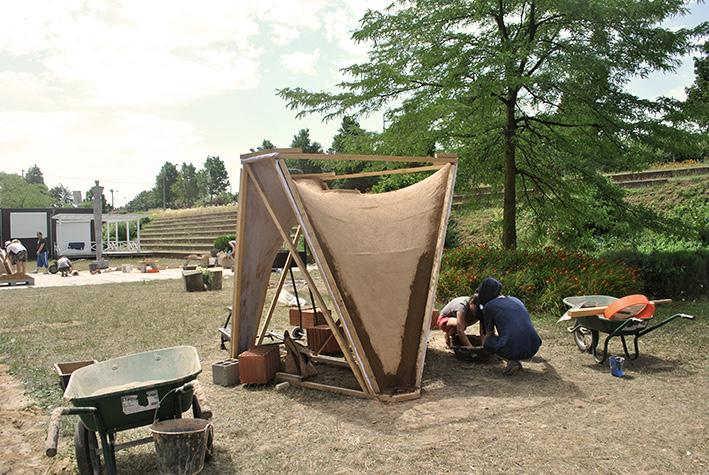
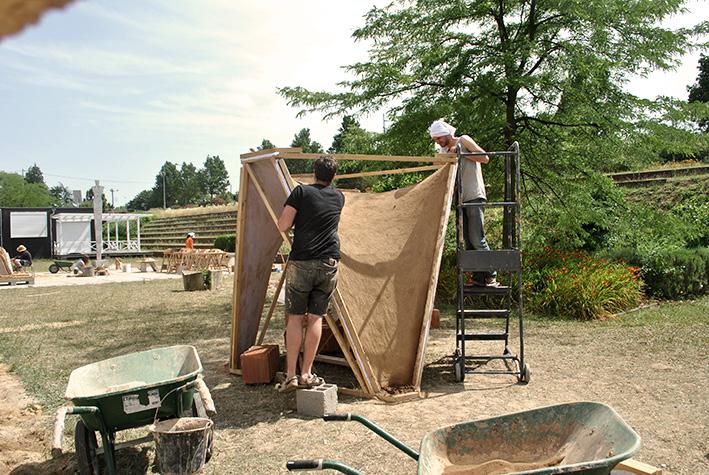
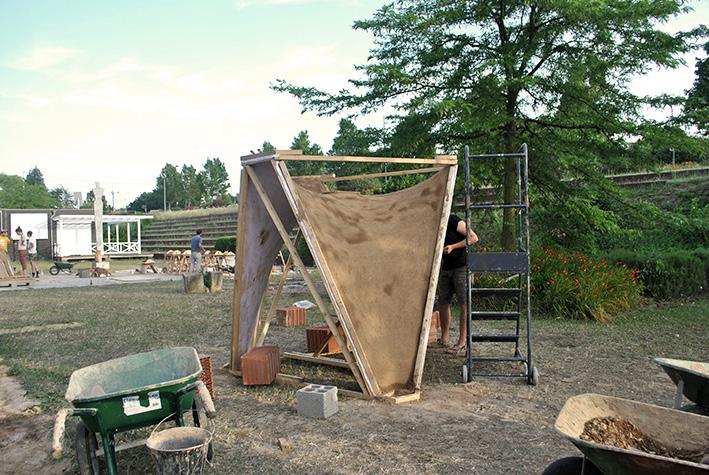
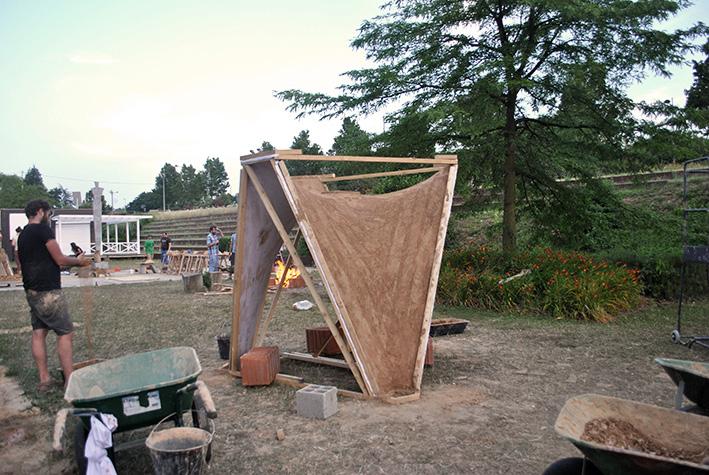
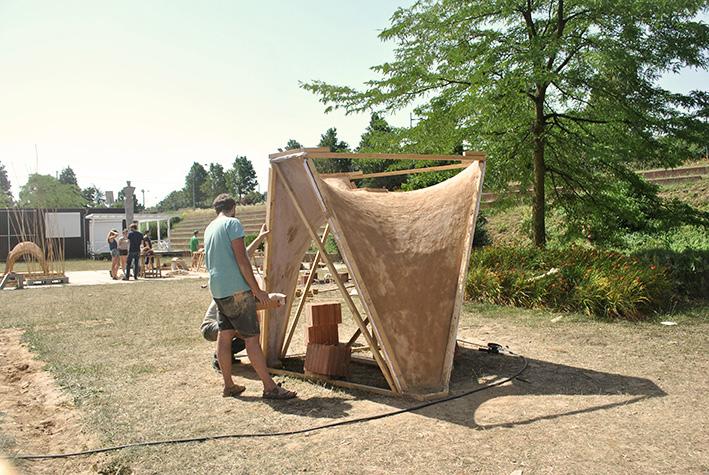
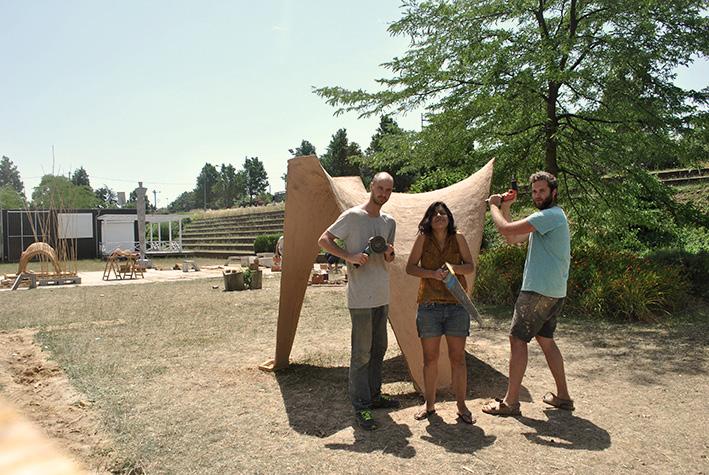
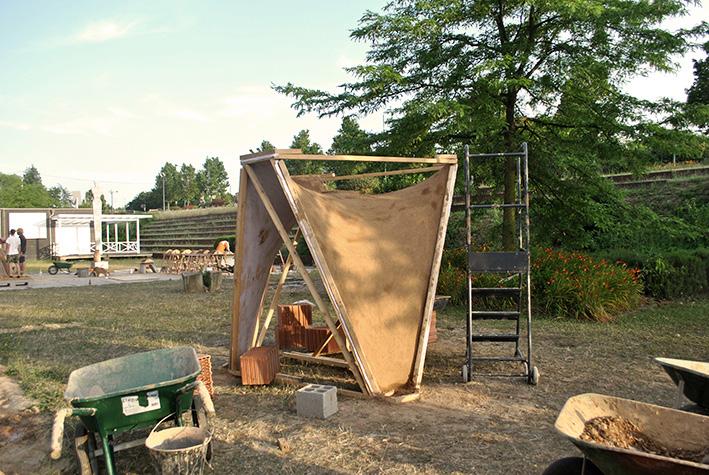
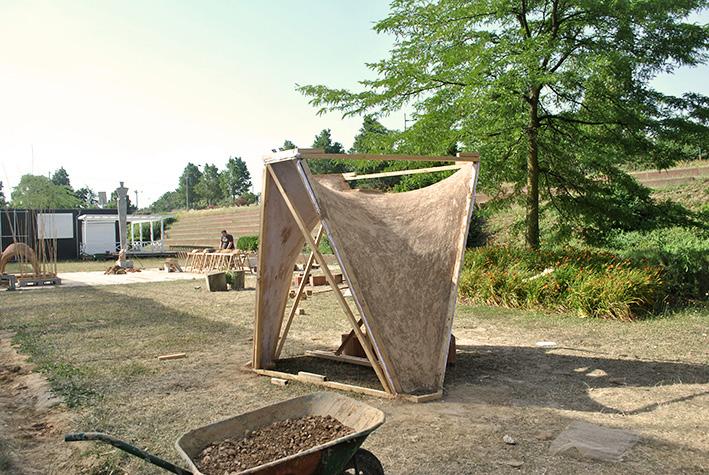
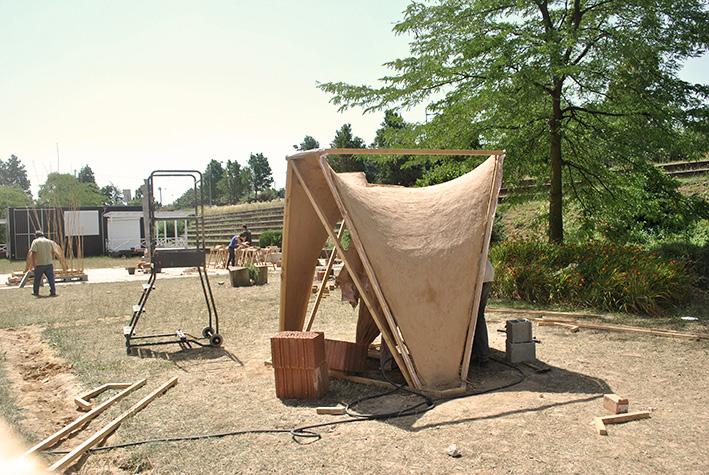
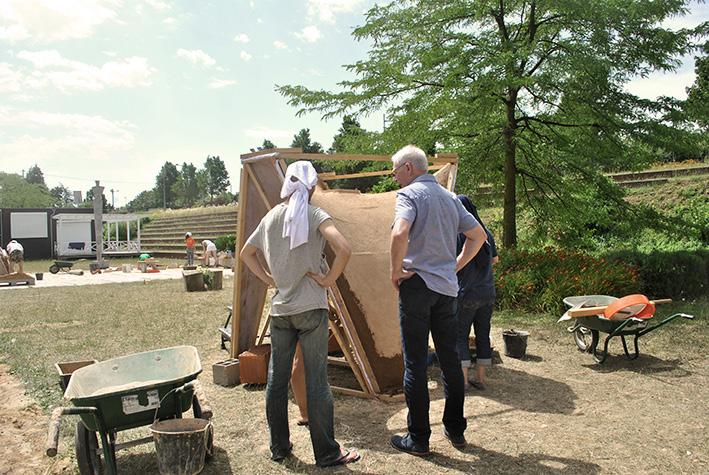
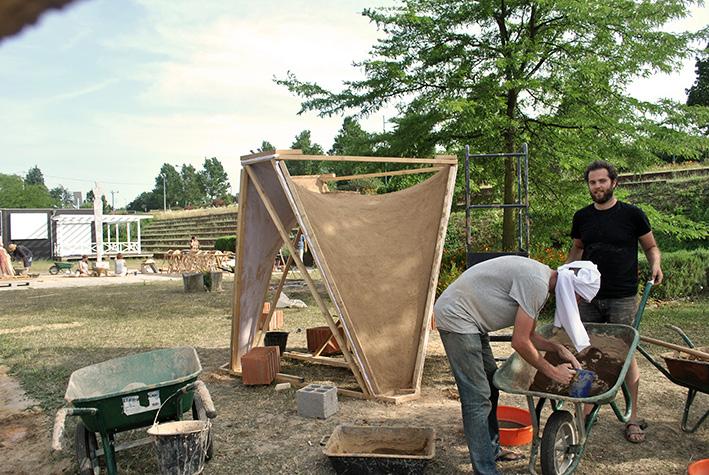
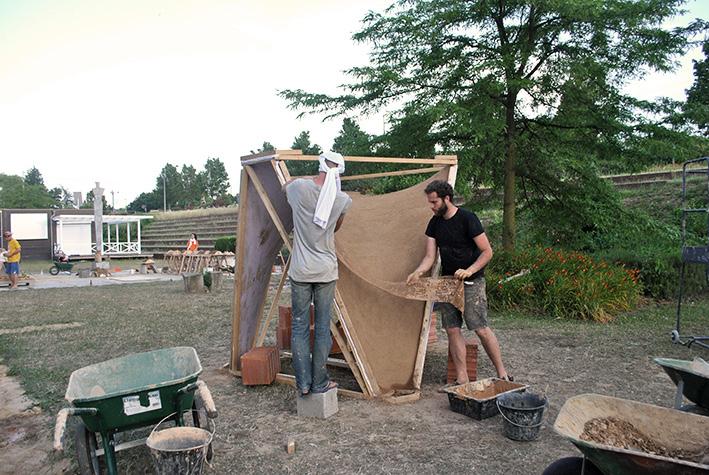
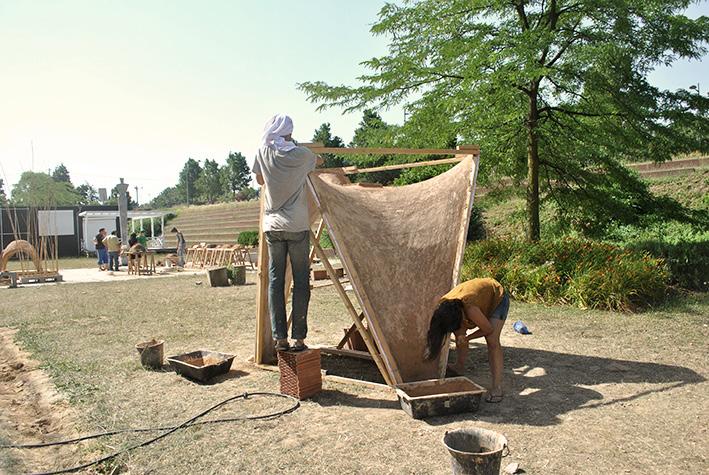
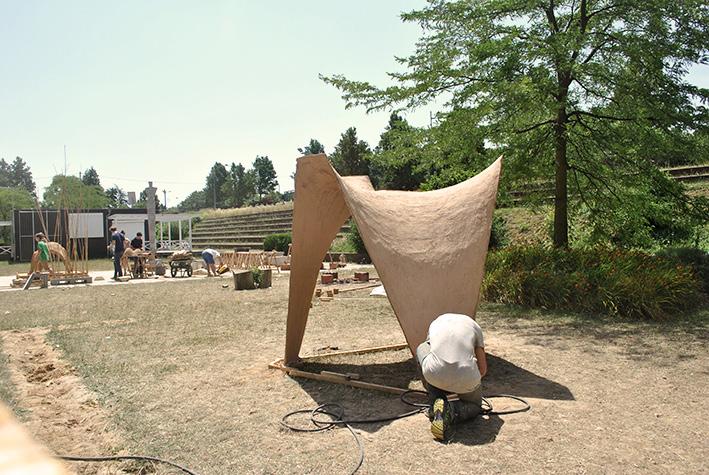
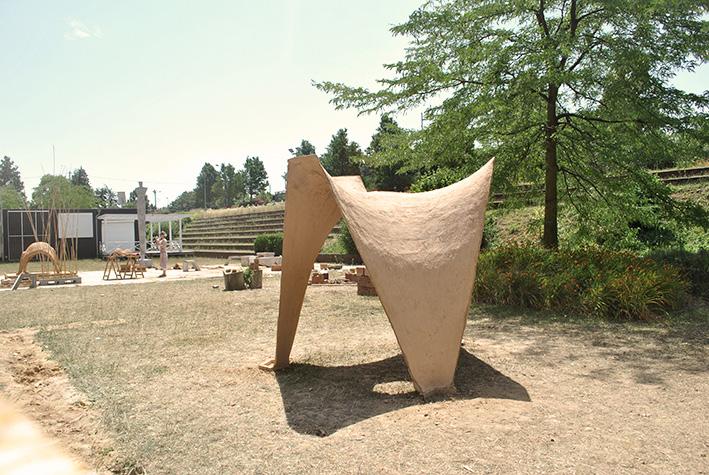
Physical Prototyping
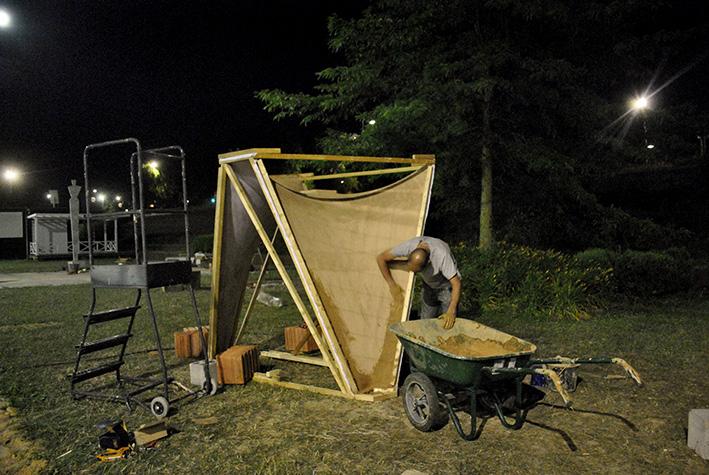
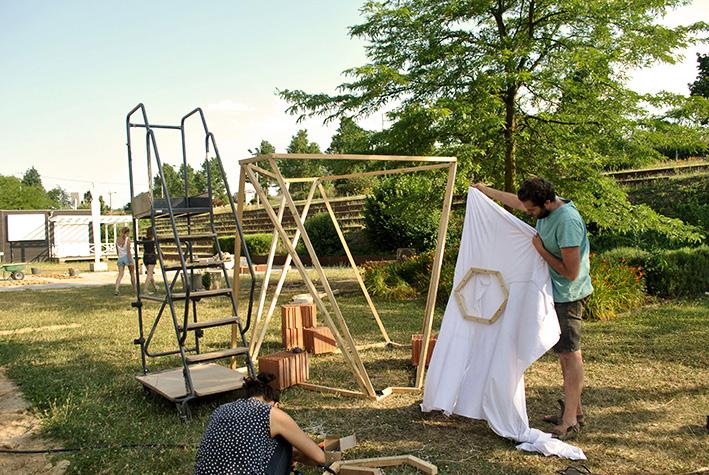
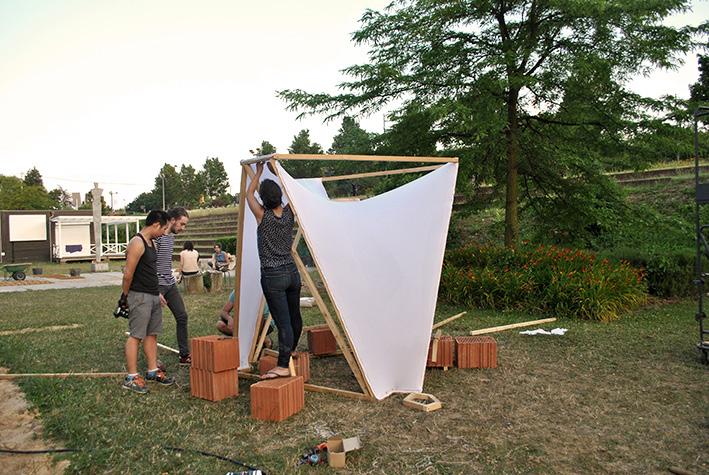
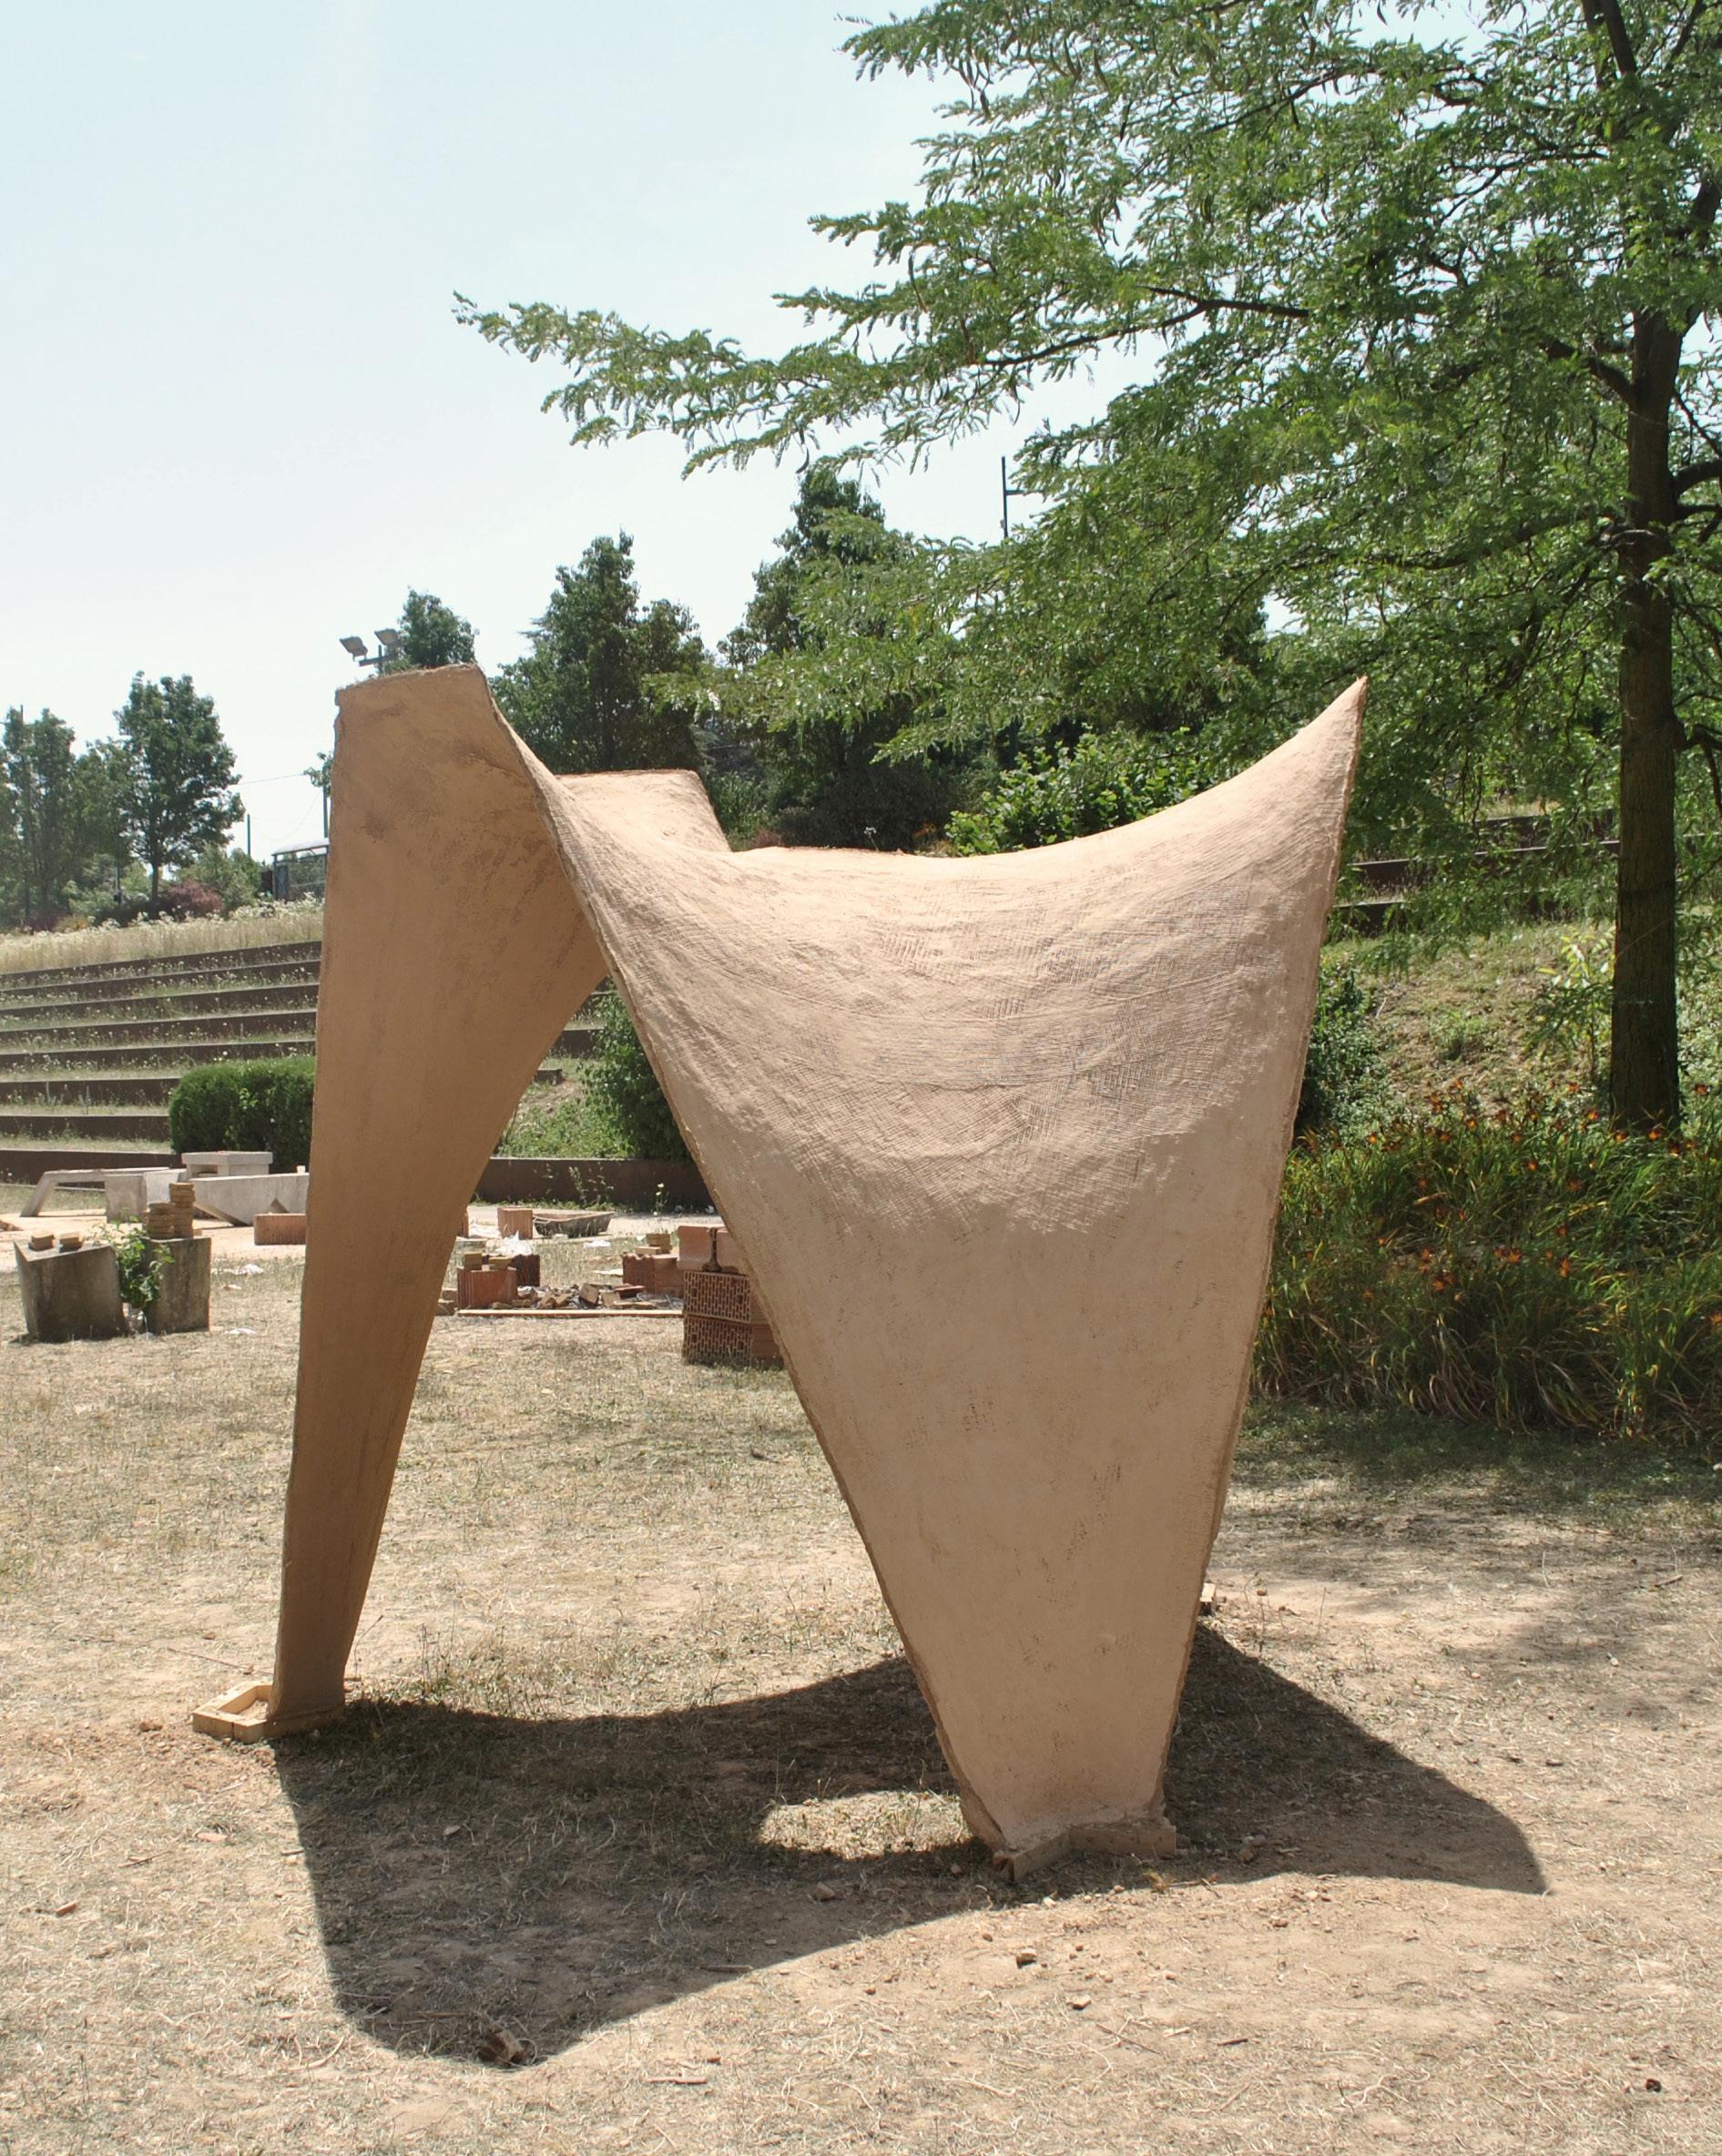
Unit: 2.50 x 2.50 x 2.00 m
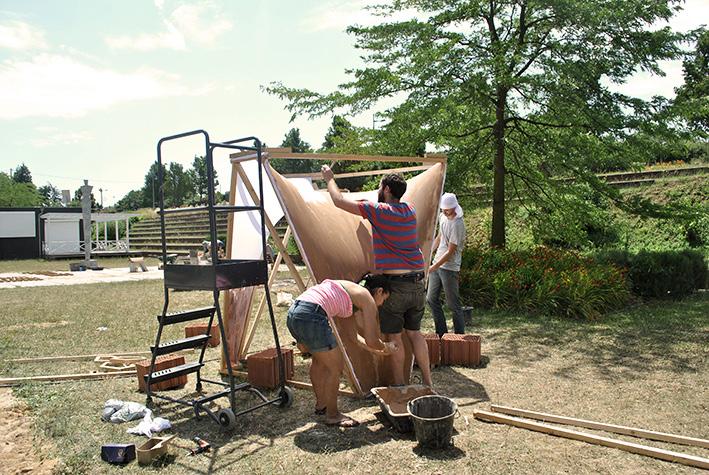
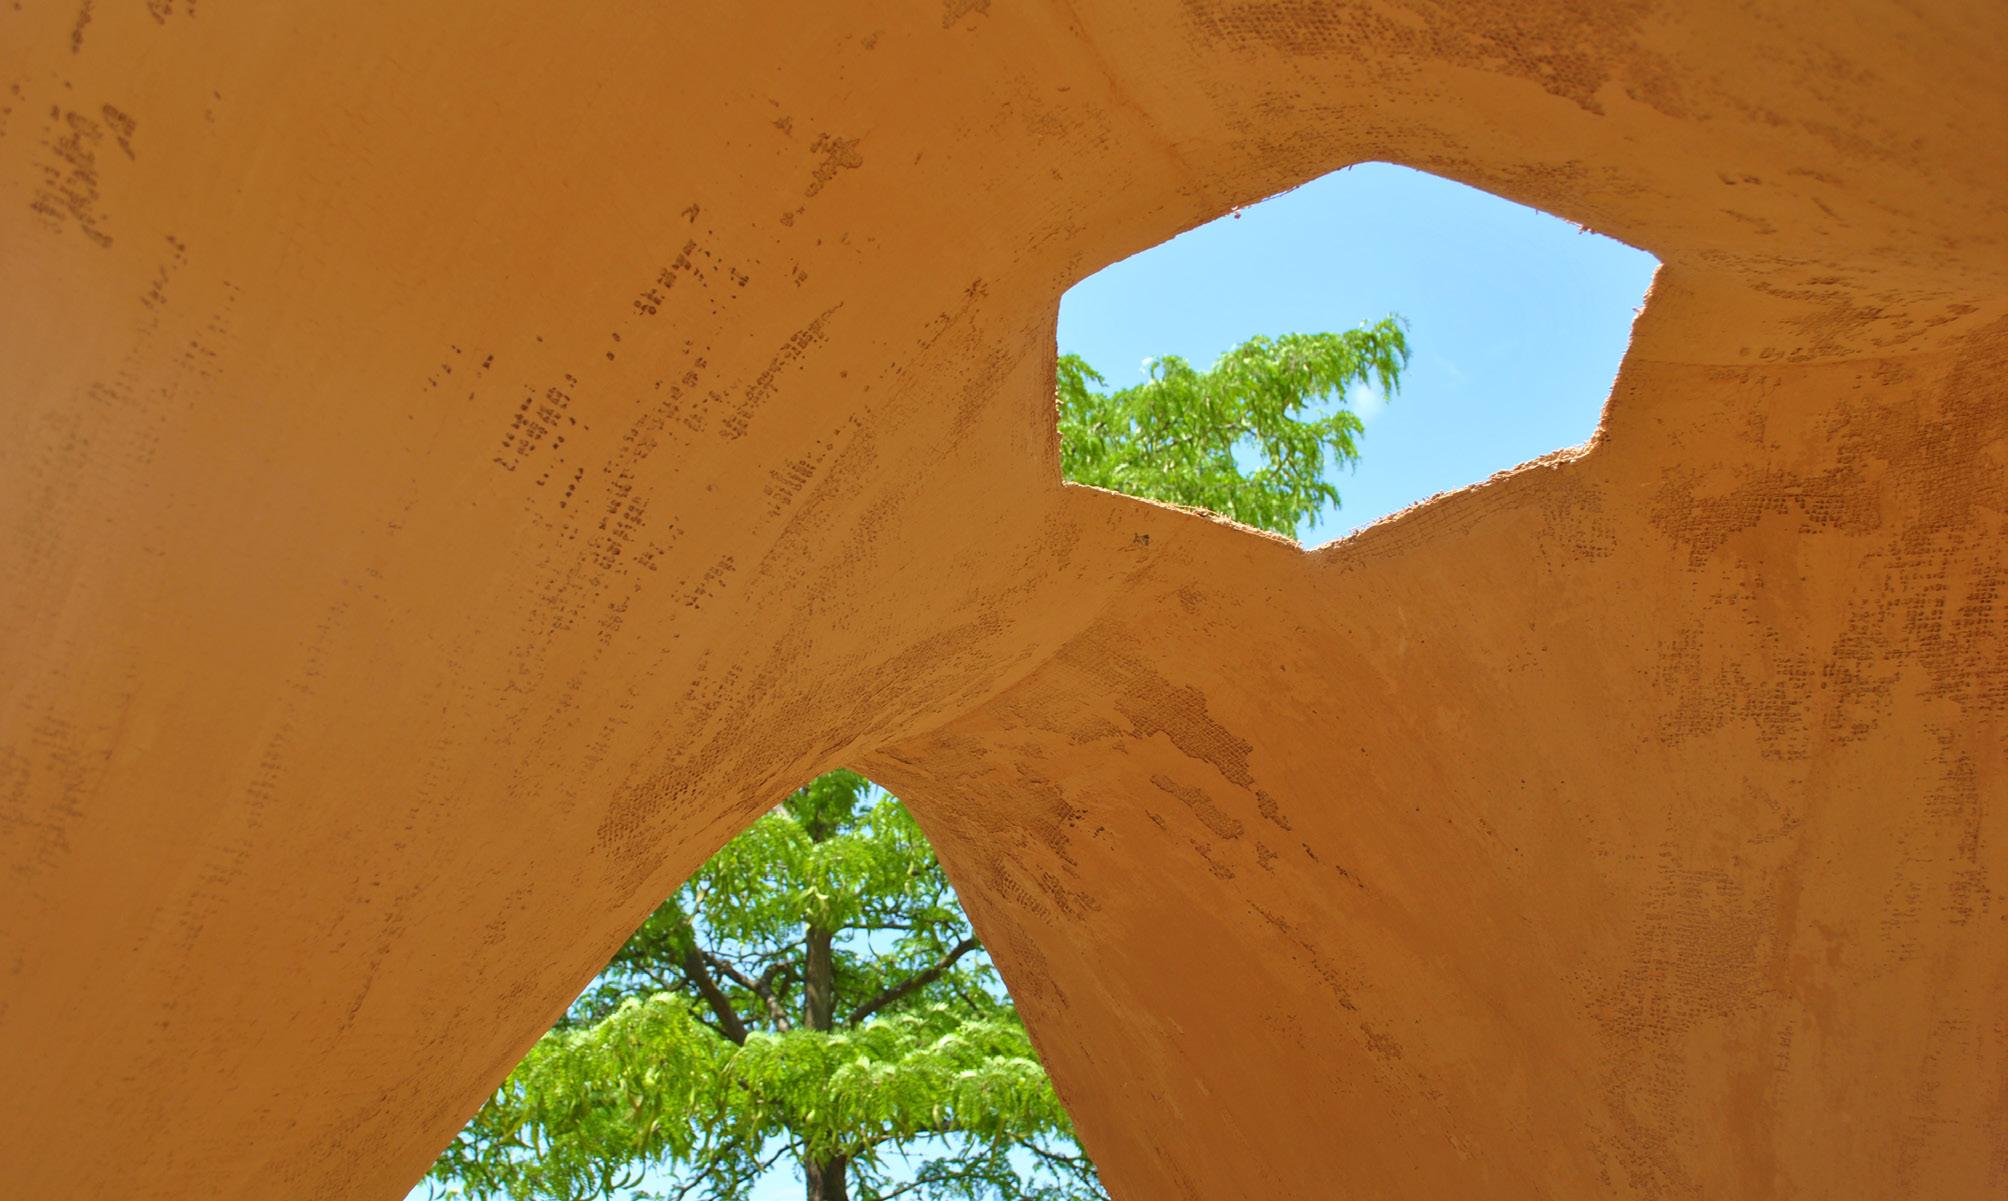
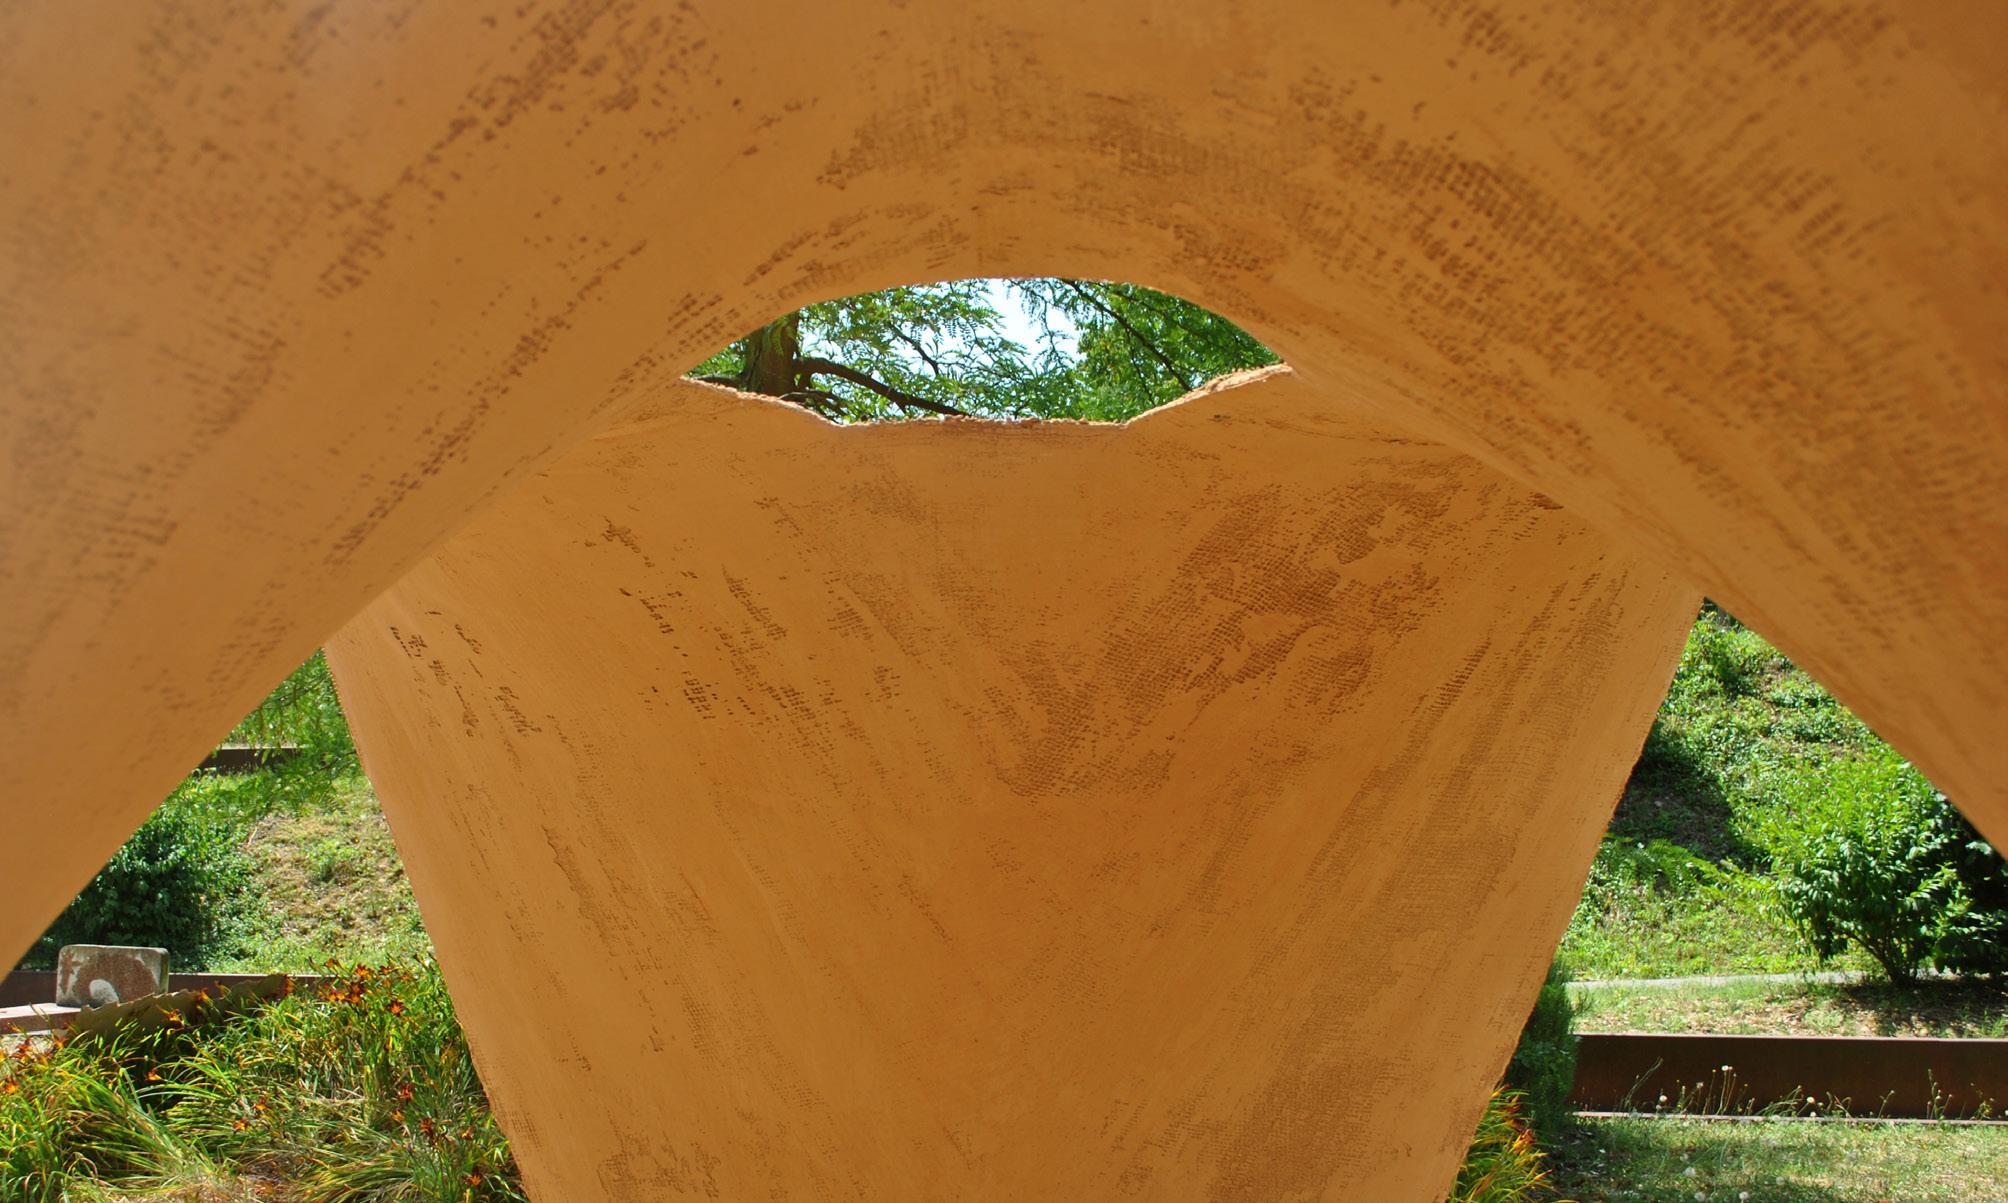
Although the construction of the two started in parallel, the previous model has been the driver for the larger prototype. The acquired knowledge was applied throughout its realisation, aside from the supporting point conditions where no extra thickness was applied. Whereas, the zenithal opening was restrained to the ground in order to avoid too large fabric displacement.
The construction process took around four days, therefore considering the amount of people
that work on it for eight or nine hours per day, we can say that, the experienced labour input was almost 9 h/m2, for a thickness of 2 cm, considering the construction of the formwork and the preparation of the materials: collection, sieving and mixing.
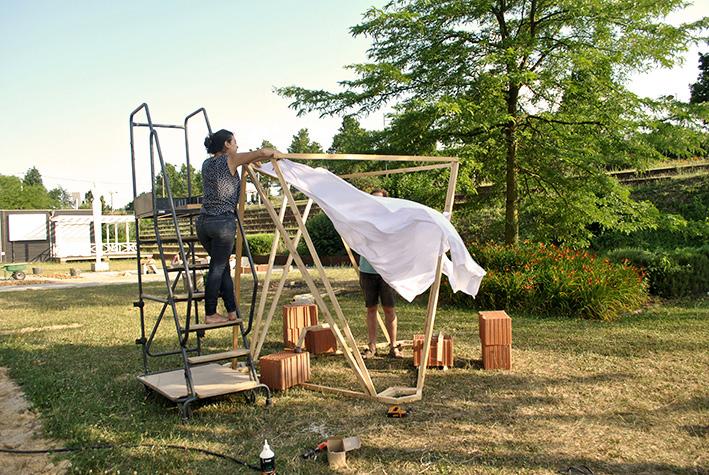
Observations
The fabric cutting pattern was reduced according to the conclusions from the previous
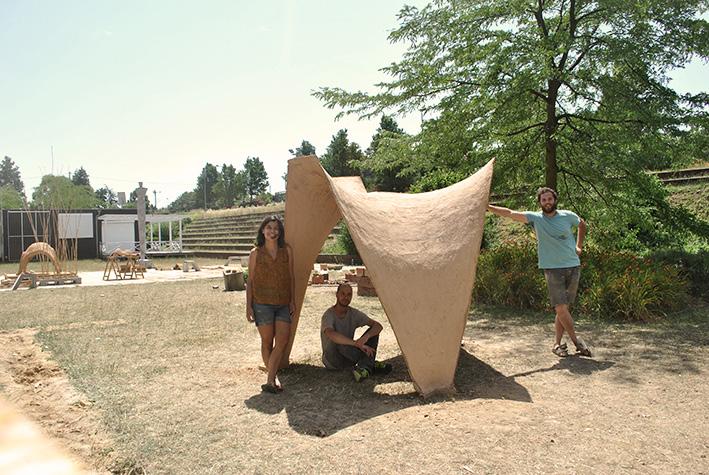
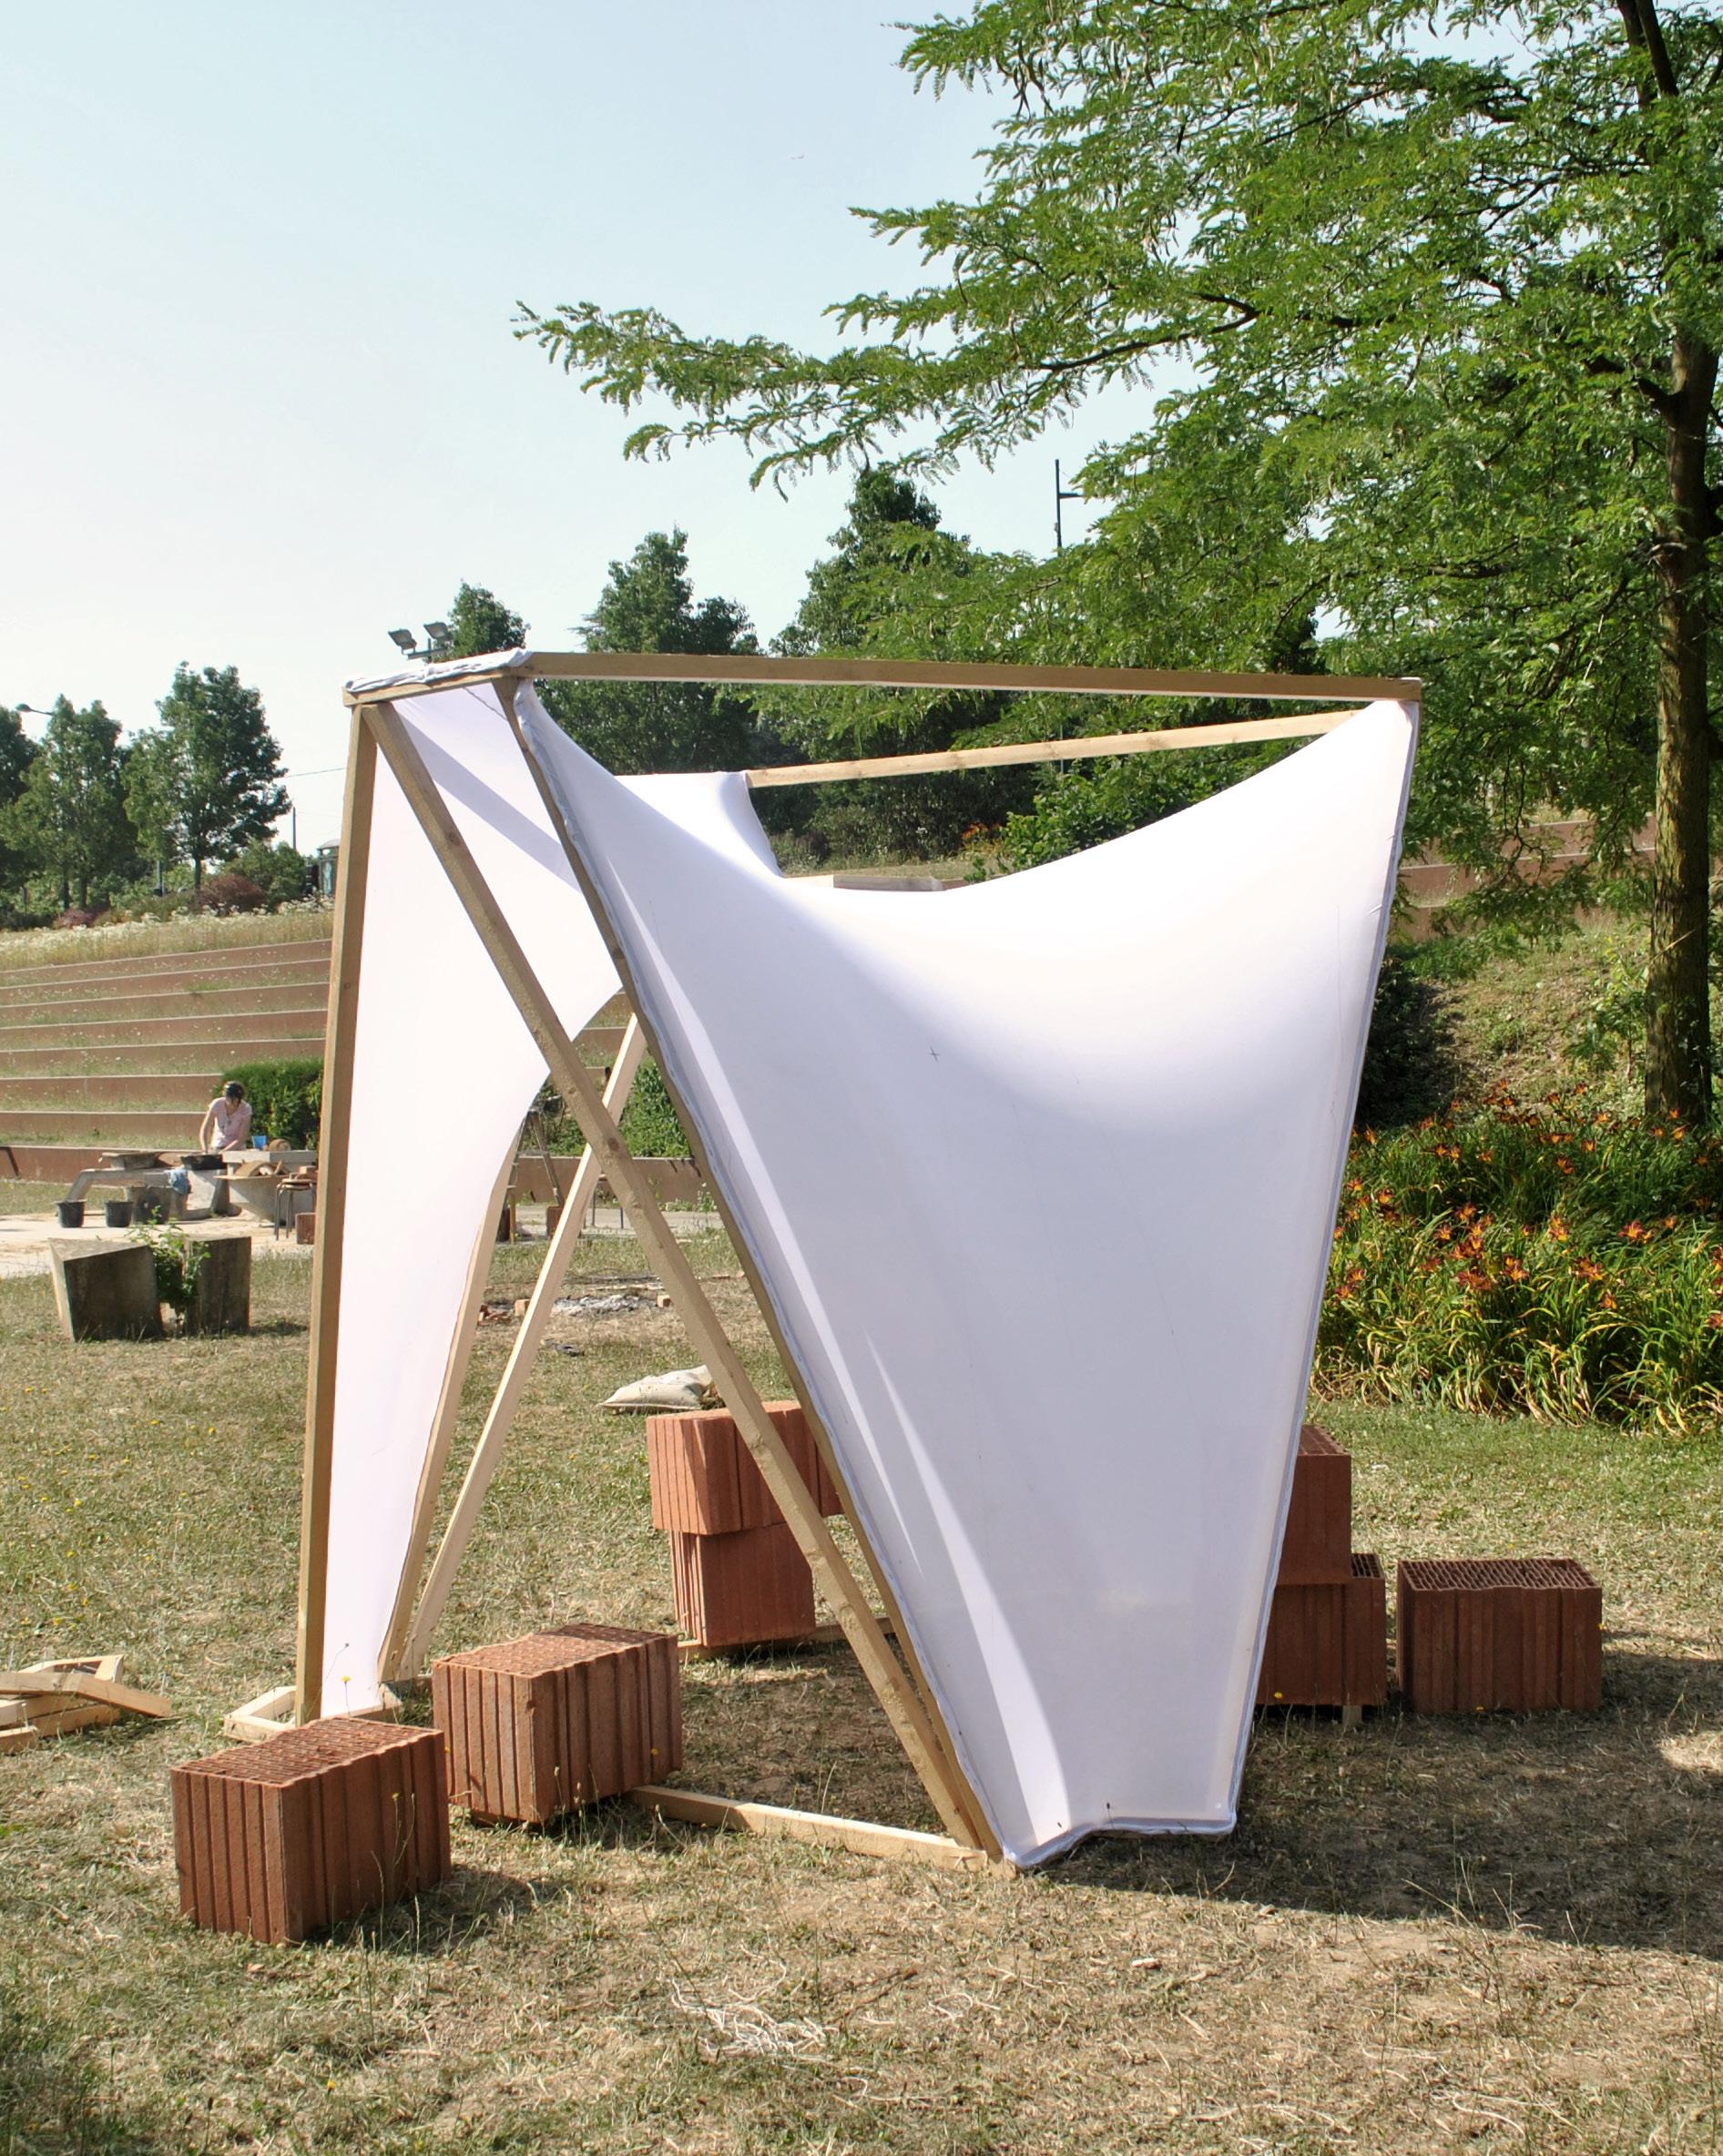
Right
Fig. 3.34 Physical prototype, Le Grand Ateliers, Lyon.
Fig. 3.35 Model, construction elements for the formwork with reduced spandex fabric and diagram.
Restrained zenithal opening
Left
Spandex fabric
Double wooden frame
Double wooden frame
Angled ground support
170 cm
200 cm
Spandex cuts
Diagonals and bracing Base
Corner double frame
Double diagonals Ring and upper frame
3.36 Comparison between the two prototypes.
Above right
Fig.
Below right
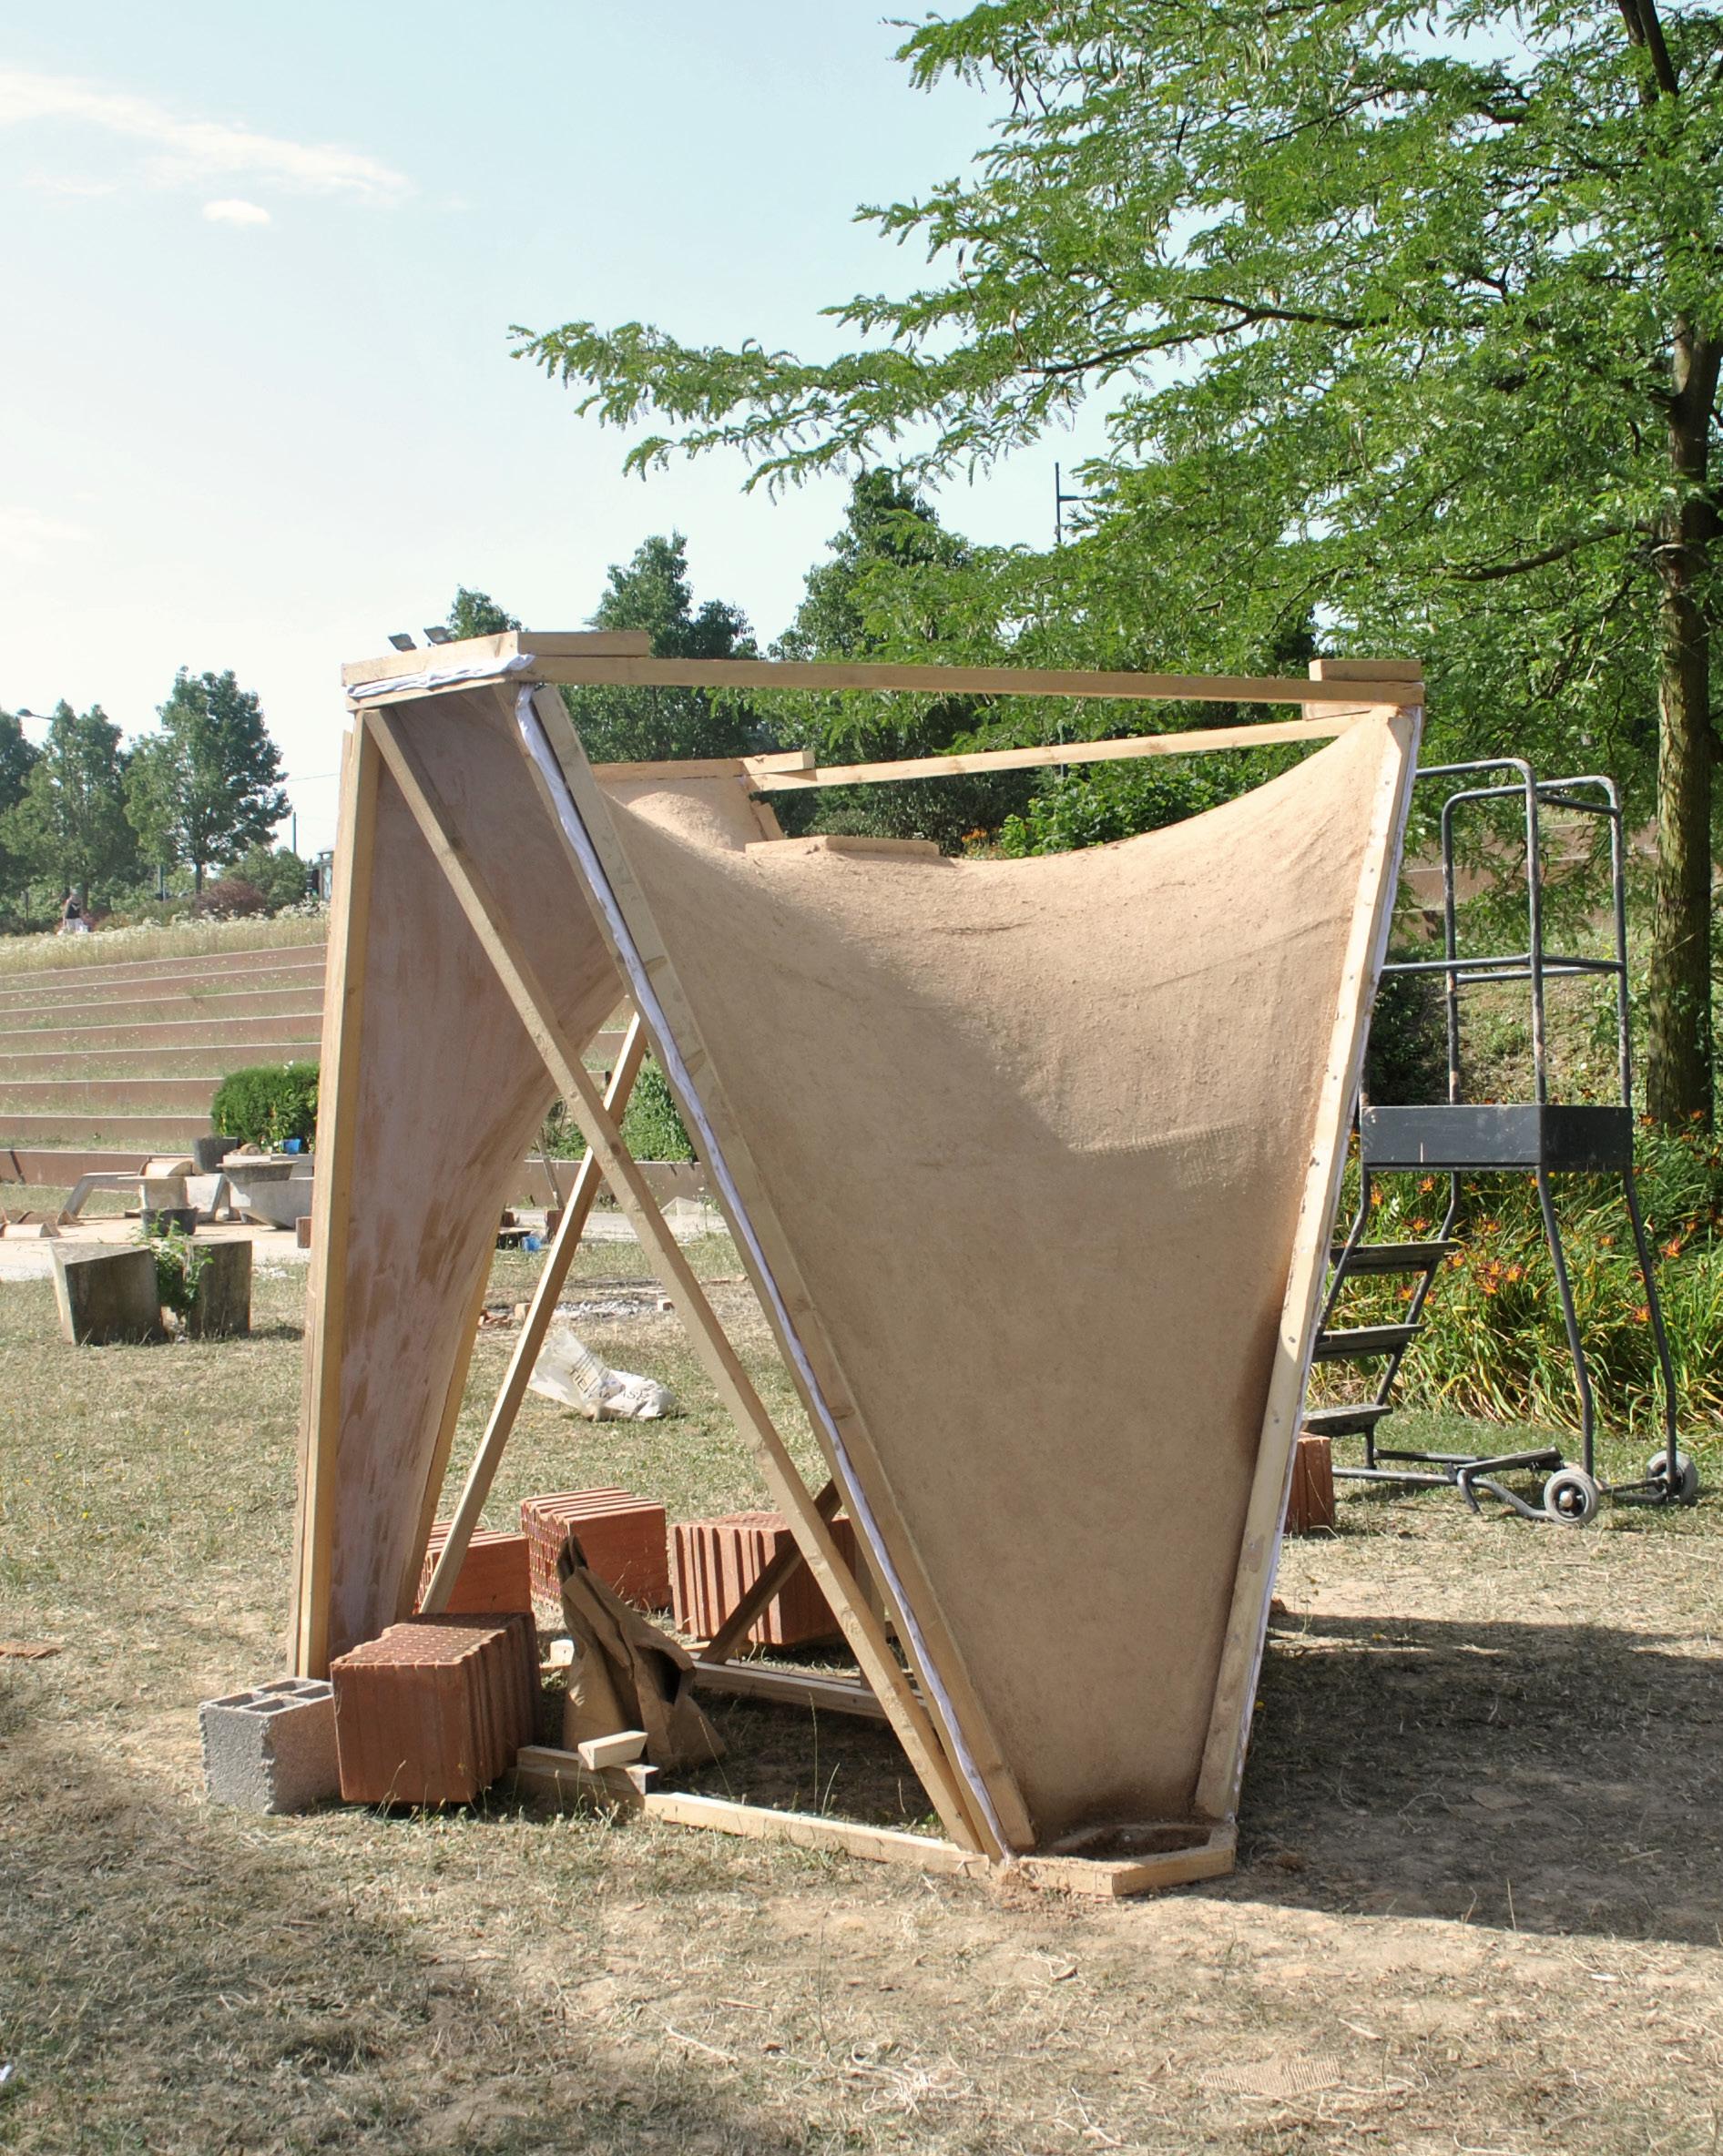
Fig. 3.37 Arrangement of the layers, diagram.
Earth, 1-2 cm thick Wooden frame
Restrained zenithal opening
mode. Moreover, it was cut down of additional 18 cm in order to stretch it with a higher level of pre-stress.
The restrained condition for the zenithal opening is included in the framework to reduce the displacement in upper area.
The prototype has a thin cross section of 1.5 cm and it was overturned by the wind because its lightweight, moreover the specific geometry increases the effect of the wind load.
Conclusions
The design resulted successful. The edges of the formwork are doubled to create sharper surface boundaries and to make the fabric easier to remove. The central zenithal opening is restrained to control the clearance height of the internal space.
The relative flexibility of the composite can accommodate small deflections without affecting the stiffness of the whole structure. Finally, a stronger connection to the ground is necessary in order to make the structure more stable.
Above left Fig. 3.38 Physical prototype, formwork with wooden frame. Layer: clay 67 % and sand 33 %.
Right
Fig. 3.39 Physical model, construction sequence.
Left Fig. 3.40 Physical model, construction sequence.
Right
Fig. 3.41 Physical prototype, wooden frame with stretched spandex fabric.
Left Fig. 3.42 Physical prototype, jute mesh layer.
Fig. 3.44 Physical prototype with the wooden frame and the fabric removed.
Right
Fig. 3.45 Physical prototype, internal side of the fabric formwork with the central prop.
Above left
Fig. 3.46 Physical prototype, interior with the wooden frame and the fabric removed.
Below Left
Fig. 3.47 Physical prototype, interior with the wooden frame and the fabric removed.
Right
Fig. 3.48 Physical prototype, failure due to wind load. The to much thin structure did not counteract the lateral forces imposed by the environmental conditions.
Fig. 3.50 Physical prototype, detail of the ground restraint that was not able to work in tension in order to counteract the wind load.
Right
Fig. 3.51 Physical prototype, view.
Left
Fig. 3.52 Physical prototype, view.
3.53 Specimens construction sequence, diagram.
Earthen Composite Properties
Material Tests
The explorations aims to understand the mechanical and physical properties of the composite in terms of elastic modulus, tensile strength and specific weight. A flexural experiment was chosen to test the behaviour of the composite and to explore the property of the embedded jute mesh.
Four specimens were built with the layering technique applied on fabric formwork in order to reproduce the material which has been used in the previous physical prototypes.
At the beginning, the first specimen was tested with a span of 60 cm. Later, the span was reduced to 50 cm to increase the accuracy of the results. Three, specimens were tested after 12 hours the last material application, while the fourth test, which was tested after 96 hours was lighter because of lower water content.
In conclusion, the material composite is more elastic then what expected with a E value of 0.20 GPa (Adobe: 2-6 GPa, ), while the value of the tensile strength is around 1.40 MPa.
specimen
Thickness: 13-14 mm
Right
Fig.
Extracted
Earthen layers
Placement of the jute mesh
Wooden frame with stretched spandex
Above left
Fig. 3.54 Specimen, wooden frame with spandex fabric.
Below left
Fig. 3.55 Specimen during the earth layering.
Above right
Fig. 3.56 Specimen, out of the formworks.
Below right
Fig. 3.57 Beam under a concentrate load, diagram and deflection.
Above left Fig. 3.58 Test mechanism.
Below Left
3.59 Test mechanism and relationship with the abstract diagram.
Fig.
Above right
Fig. 3.60 Material test in progress, with load steps of 250 g.
Below right
Fig. 3.61 Material test and deflection diagram.
Above left
Fig. 3.62 Specimen, failure.
Below left
Fig. 3.63 Specimen failure, diagram. The failure is due to internal shear stresses between the higher and lower side of the specimen.
Load
Above right
Fig. 3.64 Material tests results and properties.
Below right
Fig. 3.65 Load-Displacement graph, overlapping of the four specimens.
Displacement (mm)
(N)
Above left
Fig. 3.65 Elastic modulusLoad graph, overlapping of the four specimens.
Below left
Fig. 3.66 Elastic modulusDisplacement graph, overlapping of the four specimens.
Digital Model Calibration
Comparison between Digital and Physical Models
The comparison is set up to understand the validity of the values the previous flexural tests and calibrate the settings of the digital analysis according to the dead load experiment led in Lyon.
The digital model was loaded with 2.55 kN placed on the upper part (Fig. 67), while the cross section thickness was variable according to the real model from 2 to 5 cm in the lower area. The structural analysis shows that the maximum displacement is around 7 mm in the area
closer to the zenithal opening and the output is fully compatible with the experimental value. Furthermore, the utilization is 92% for compression and 5% in tension, this means that the physical prototype was near its structural limit. However, the values extracted from the utilisation analysis follow the von Mises criterion, that is not the proper way to verify shell cross section made up of earthen composites.
The mechanical characteristic were used to analyse the developed geometry at different scales with a cross section of 15 cm in order to understand the maximum dimension achievable.
The base diameter was increased progressively from 3 m. In this last scenario, with a maximum
span of 7.80 m the displacement is 21 mm, while the utilisation presents values between 96% for compression and 21% for tension.
In the end, we can say that the largest span achievable with a cross section of 15 cm is 8 m.
Right
Fig. 3.70 Scalability test, diagram.
Base Diameter
3.00 m
4.00 m 5.00 m 6.00 m 7.00 m 8.00 m 9.00 m
Displacement Analysis
Settings
E: 0.20 GPa
σ: 1.40 MPa
Cross section: 15 cm
Load: Self weight + 1 kN/m2
Legend: Maximum displacement 21 mm
- 44 to 6 % - 54 to 7 %
- 64 to 11 %
- 75 to 13 % - 34 to 4 %
- 85 to 16 %
- 96 to 21 %
Maximum height: 7.20 m
Above left Fig. 3.71 Displacement values in according to different sizes, table.
Below left Fig. 3.72 Displacement analysis.
Maximum displacement close to the edges
Maximum span: 7.80 m
Restraints: x, y, z
Conclusions
The values extracted from the material tests, the geometrical explorations and the verification derived from the physical prototypes have enabled to have a detailed understanding of the material behaviour of the system at different scales. The system enables to widen the design possibilities of earth constructions, the material selection doesn’t restrict the outcomes to compression only structures.
The principle parameters that define the system have been identified: radial configuration, corrugation, as well as the limits in angled supports. And the limits in terms of structural performance as wells as fabrication constraints.
It is important to state, that all the previous structural explorations are based on elastic linear isotropic homogeneous behaviour and this does not represent the real material elastic and plastic properties. However, this choice was necessary to simplify the whole design and experimentation processes.
The next phase of the investigation focuses on how the system can evolved into an organisation of higher complexity with differentiation in between its parts. Simultaneously, on identifying strategies to optimise the performance of the systems in response to its context.
Bibliography
Minke,G. (2007) Building with Earth: Design and Technology of a Sustainable Architecture. Birkhauser Otto, F. (1969) Tensile Structures vol.2: cables, Nets and Membranes. Cambridge: MIT Press.
Design Development
Fig. 4.1 Multiple iterations of the system in order to test the potential for performance differentiation.
Right
The system is developed to a higher level of organisation in order to explore more complex configurations which can better respond to the exterior environment and that can lead to different design options.
The base unit has been defined as a radial self-supporting structure with a maximum radius of 8 m and a thickness of 15 cm. The curvature flow of the surface is the fundamental element which affects the structural performance and it is determined by the articulation of the tension points of the fabric formwork. In this chapter, the research explores further the rules that have been examined in previous investigations and develops a new formation process based on circle packing to generate structural formations with multiple centres and identify new design strategies.
The generative logic is based on a parametric three-dimensional representation which is directly informed by the physical properties
of the textile and the earthen composite. The system relies on a set of distinct variables which are input in the form finding process as design parameters to define the boundary conditions of the fabric formwork and introduce the potential for spatial and performance differentiation. The behaviour of the textile is simulated through dynamic relaxation on the basis of the selected conditions in order to generate the correspondent geometry.
The behaviour of these complex structures will be evaluated in relation to different conditions in order to understand the possibilities of the system and calibrate the validity of single parameters. In particular, structural and environmental performance is explored. Several parameters are interdependent and participate in the generative process affecting multiple aspects of the performance: for this reason the research aims to establish an efficient hierarchy between design parameters in order to improve the overall performance of the system.
System Generative Process
Design Formation Sequence
The formation logic is based on the juxtaposition of tangent units which are organized into an interconnected layout with multiple centers for the base configuration in plan. Each unit is characterized by an individual radius which allows quantifying the dimensions of the interior space. Different circle packing strategies can generate distinct layouts according to specific design requirements with unit of uniform or different radii.
The intersection of the tangents of the circles determines intersection points between the units. These points are introduced as new tension points of the fabric which can be pulled up to increment the curvature in the upper area of the structure or can be moved down to the ground to provide additional interior supports. In addition, the pattern of these ground supports is used to design the division of the interior space and generate different gradients of permeability.
The exterior boundary of the structure corresponds to the perimeter that results from
the unit packing and its quality is determined by alternating points that create corrugation with different amplitude and frequency. Each element is segmented by a specific amount of edges which defines the frequency of mountains and valleys of the surface and its curvature. This is the main parameter that affects the structural behaviour and the stability of the configuration. In addition the pattern of alternating points defines the relationship between interior space and exterior environment determining the formation of lateral openings.
In order to stretch the textile in the requested radial configuration and avoid wrinkles and deformation during construction, a small central opening is required for each unit: the position for these points is fixed by a ring element in the framework. These elements are used as zenithal openings to introduce additional light in the interior space. The size of the openings is controlled by the radius of the rings and can be calibrated according to the light requirements of the space.
01 Radial Structural Unit and Distribution Layout 02 New Tension Points at Unit Intersections
Left Fig. 4.2 The diagram shows the formation sequence of the design of the material system.
Body Plan
Right
Fig. 4.3 The diagram reproduce a single design iteration. The script receives the input parameters and returns the three-dimensional representation.
number of units (un)
unit base radius (r): range (2 , 4m)
number or mountains/valleys (p.n)
edge length (l)
Interior vertical supports (s n.)
ground support lenght (d1): range (0.5,1m)
upper edge lenght (d2): range (0.5,1m)
height (h): range (4 , 6m)
height clearance (h1/h): range (0.5,1)
opening radius (r1): range (0.2 , 0.8m)
opening inclination (θ°): range (0°,45°)
Construction Process
Assembly Sequence and Material Application
In order to preserve the facility of construction achieved in the previous experimentation, the design logic developed for complex configurations with multiple centers aims to maintain a simple construction process to achieve a continuous integrated structure.
Therefore, the formwork for the single units is built and assembled individually as a selfsupporting structure in relation to its own specific geometry and fabric pattern. The edges of the formworks are designed to coincide when they will be juxtaposed.
The design of the formwork is based on a minimum number of straight wooden elements and the textile in order to reduce its weight and allow the opportunity for transportation in site and possible reparation.
The material is applied to achieve a single surface allowing for the jute fibre to join the different units and generate a single shell with no connections. After the appropriate time needed for the earthen composite to be dry the formwork can be disassembled and removed from below.
01 Formwork Construction
1 unit formwork
02 Aggregation of Multiple Formworks
03 Material Application as a Single Surface
04 Removal of the Formworks
Left Fig. 4.4 The diagram reproduce the construction sequence of a sample configuration with multiple centres.
Structural Performance and Geometry
Experiment 4.1
Structural analysis is conducted with different load cases to evaluate the performance of a simple configuration. The experiment analyses the effect of the variation of specific design parameters on the displacement and utilization in the structure.
Ambition
The experiment aims to understand the possibility of increasing the structural performance introducing a more complex configuration with multiple centres which could increase the surface corrugation in the upper part of the structure. Based on the previous experimentation a single radial single unit can achieve a maximum span of 8m with a thickness of 15 cm. Results are compared through the different test models to understand the consequence of the specific variables on the overall structural performance.
Evaluation Criteria
Test models are evaluated to achieve minimum displacement. The displacement values which result higher than 2-3 cm are considered not acceptable. In addition the difference between the two load cases is taken into consideration.
Analysis Data
The analysis is conducted in the Rhino + Grasshopper environment with the software Karamba. Test models are evaluated on two load cases. In load case 1 (LC1) self-weight and dead loads are considered. Dead loads are defined as 1KN/m2 to simulate a common weight for a floor area. In the second load case (LC2) a lateral load of 0.13 KN/m2 in the x and y axes is added to LC1 in order to evaluate a simplified model for wind loads.
The values input for the earth composite in the structural model are the following:
Cross section thickness: 15 cm
E = 0.20 GPa
ν = 0.3
Tensile strength fy = 1.40 GPa
Fixed Design Parameters
units: 8
unit radius: 4 m
height of the exterior boundary: 6 m
tot. Srf. Area: 175 m2
diameter central openings: 0.6 m
height of central openings: 4 m
Layout:
Ø: 8m r: 4m
A: 25m2
Test Parameters
1 Curvature Frequency
The frequency of the curvature is defined by dimension of the polygonal edges on the exterior pattern.
In the experiment two series with 24 and 48 segments are tested which correspond to a span in the mountains and valleys of the exterior boundary of 7.8 m (a) and 6.5 m (b).
2 Interior Ground Supports
The position of the pillars is fundamental to define the maximum span covered by the shell structure. Different configurations lead to totally different behaviour and generate geometries with distinct spatial configurations. Four configurations with increasing span and number of supports are tested.
3 Exterior Boundary
Three different patterns of alternating points on the exterior boundary are tested. The pattern defines the percentage of the edge boundary which is on the ground.
A.04
pattern A
boundary on the ground: 5%
n. of exterior supports: 12
span lateral opening: 7.8 m
n. interior supports: 0
max. span: 14 m
LC1
max. displacement: 45.9 cm utilization: 36.6%, -70.5%
LC2
max. displacement: 46.2 cm utilization: 43.6%, -103.2%
A.08
pattern A boundary on the ground: 5%
n. of exterior supports: 24
span lateral opening: 6.5 m
n. interior supports: 0
max. span: 14 m
LC1
max. displacement: 29.1 cm utilization: 29.2%, -32.5%
LC2
max. displacement: 29.2 cm utilization: 29.9%, -48.9%
max. displacement
Results Pattern A
Load case 1
Curvature Frequency
Significant test models and results have been extracted to discuss about the results of the experiment.
One of the most relevant result concerns the effect of the curvature frequency on the structural performance. Reducing the span of the lateral openings and increasing the curvature frequency reduces displacement and utilization of the 30-60%. For example, in the
test models A.01 – A.08 which are characterized by a small percentage of ground support in the exterior boundary the difference is particularly remarkable: doubling the frequency of mountains and valleys from 12 to 24 support points results in an average reduction of the maximum displacement of 68.3 %.
This parameter needs to be taken into consideration as a fundamental design principle in relation to the dimensions of the space.
Above left Fig. 4.5 The graph shows the results on displacement in relation to the maximum span for pattern A.
Above right Fig. 4.6 The graph shows the results on utilisation in relation to the maximum span for pattern A.
B.05
pattern B
boundary on the ground: 30%
n. of exterior supports: 16
span lateral opening: 6.5 m
n. interior supports: 2
max. span: 8 m
LC1
max. displacement: 3.57 cm utilization: 12.3%, -18.2%
LC2
max. displacement: 4.51 cm utilization: 14.6%, -25%
B.06
pattern B
boundary on the ground: 30%
n. of exterior supports: 16
span lateral opening: 6.5 m
n. interior supports: 1
max. span: 10 m
LC1
max. displacement: 8.33 cm utilization: 12.3%, -19.3%
LC2
max. displacement: 8.46 cm utilization: 14.5%, -28.1%
B.07
pattern B
boundary on the ground: 30%
n. of exterior supports: 16
span lateral opening: 6.5 m
n. interior supports: 4
max. span: 12.5 m
LC1
max. displacement: 2.07 cm utilization: 11.7%, -18.7%
LC2
max. displacement: 3.16 cm utilization: 13.3%, -23.8%
B.08
pattern B
boundary on the ground: 30% n. of exterior supports: 16
span lateral opening: 6.5 m
n. interior supports: 0 max. span: 14 m
LC1
max. displacement: 63 cm utilization: 40.5%, -47.1%
LC2
max. displacement: 63.1 cm utilization: 40.3%, -48.2%
span 8 m
max. displacement
span 10 m
span 12.5 m
span 14 m
Results Pattern B
Interior Ground Supports
Furthermore, it can be observed that the span and the interior ground supports configuration is the parameter that resulted to affect the most the structural performance.
As a result it is possible to conclude that complex configurations with multiple centres are able to achieve larger spans in comparison to a single unit. In all models with at least one interior support and free spaces between 8 and 12.5 m length result with values of maximum displacement around 2 - 15 cm and ranges of utilization of 20 - 50%. The models with higher curvature frequency resulted with a maximum displacement of 2 – 3 cm which confirms the efficacy of this parameter in relation to the structural behaviour of the system.
In general, all the test models with a span of 14 m resulted with not acceptable results. It is possible to observe a value around 10 times higher than the other configurations. In fact, these models with no interior support points resulted with a low curvature in the upper areas of the structure and this decreases significantly the structural performance. The more the supports are equally spaced in the interior the better curvature distribution is achieved.
For example all models with a four supports configuration are evaluated to be the most performative layout with lowest values of displacement and utilization, even with a fairly large span of 12.5 m. This configuration can be further explored as a layout for the system to achieve larger spaces.
Above left Fig. 4.7 The graph shows the results on displacement in relation to the maximum span for pattern B.
Above right Fig. 4.8 The graph shows the results on utilisation in relation to the maximum span for pattern B.
A.02
pattern A
boundary on the ground: 5%
n. of exterior supports: 12
span lateral opening: 7.8 m
n. interior supports: 1
max. span: 10 m
LC1
max. displacement: 11.4 cm utilization: 23.5%, -67.9%
LC2
max. displacement: 16.9 cm utilization: 32.3%, -69.2%
B.02
pattern B
boundary on the ground: 30%
n. of exterior supports: 8
span lateral opening: 7.8 m
n. interior supports: 1
max. span: 10 m
LC1
max. displacement: 11.6 cm utilization: 20.8%, -27.9%
max. displacement: 9.62 cm utilization: 21.6%, -28%
LC2
max. displacement: 10.2 cm utilization: 20.6%, -26%
Pattern A Edges on the ground 5%
max. displacement
Pattern B Edges on the ground 30%
Pattern B Edges on the ground 60%
Data Comparison Between the Three Test Pattern
low curv. frequency high curv. frequency
Pattern A
Pattern B
Pattern C
Exterior Boundary
In relation to the pattern of the exterior boundary it can be observed that there are no consistent differences in the tests values and the data appear relatively comparable between the three test patterns.
However it is remarkable that in those models with a higher percentage of exterior boundary on the ground the difference in utilization between the models with higher and lower curvature frequency is reduced. In addition it is possible to observe that when the percentage of the boundary on the ground is low the structures are characterized by higher utilization in tension which might be considered as not appropriate for the material.
Displacement Util. Compression Util. Tension
Regarding the two load cases it is worth mentioning that there is no consistent different in the structure’s behaviour with additional lateral loads. However, the main parameter affected is the utilization of the structure in tension which increases of the 40% in pattern A with a few supporting points and of just 10-20% in pattern B and C. The impact of the wind is reduced the more edges on the ground are in the structure.
Above left Fig. 4.9 The graph shows the results on displacement compared for the three test patterns A, B, C.
Above right Fig. 4.10 The graph shows the results in the two load cases on displacement and utilisation for the three test pattern.
Right above
Fig. 4.11 The table shows all the results derived in the experiment for pattern A.
Right below
Fig. 4.12 The table shows all the results derived in the experiment for pattern B.
avg. = average values
avg. red = average reduction: is calculated as the difference in percentage between the results of the structures with low and high curvature frequency.
avg. wind incr. = average increment in the values in relation to the lateral loads. is calculated as the difference in percentage between LC1 and LC2.
It is possible to conclude that it is necessary to limit the dimensions of free span to a maximum of 12 m in order to achieve an acceptable performance. In addition, a higher curvature frequency is a fundamental element to take into consideration in the design of larger spaces.
The pattern of the exterior boundary instead, can be considered less relevant in relation to the structural evaluation and it can be informed by other architectural and environmental criteria in order to develop an appropriate division of the spaces and control the amount of solar radiation received from the exterior.
However, a certain percentage of the boundary on the ground can be considered important in relation to possible lateral loads. Pattern C, with 60 % of the edge boundary on the ground has recorded the best values and will be developed for further experimentation.
Left Fig. 4.13 The table shows all the results derived in the experiment for pattern C.
Solar Exposure Analysis
Experiment 4.2
An exploration of different was conducted on a simple configuration with an enclosed external boundary. The quality of the exterior boundary has been selected from previous experiment. Variation of the height, dimension and orientation of the internal openings is evaluated in terms of solar radiation and sunlight hours to determine what parameters are more effective to control the environmental performance of the system.
Ambition
The experiment aims to understand which geometrical configurations are more effective to minimize the direct solar radiation and thus the heat gain of the structure. Several parameters are tested to in relation to the environmental performance in order to calibrate a more effective environmental strategy for the system.
Evaluation criteria
Test models are evaluated to achieve minimum displacement. The displacement values which result higher than 2-3 cm are considered not acceptable. In addition the difference between the two load cases is taken into consideration.
Analysis data
The analysis is conducted in the Rhino + Grasshopper environment with the plug-in Ladybug. The environmental data used for the experiment are relative to the area of Bahar-Dar, Ethiopia, in the Sahel region. Test models are evaluated with two different kind of analysis:
1. Direct solar radiation (kWh/m2) on the shell calculated on an annual period.
2. Daily sunlight hours (h) received on the interior floor area calculated in the two peak periods of April 20th (hot season) and August 20th (cool season).
Fixed design parameters
units: 8
unit radius: 4 m
height of the exterior boundary: 6 m
tot. Srf. Area: 175 m2 pattern of exterior bound. : 60% on the ground
pattern C - edges on the ground 60%
Test parameters
1 Height of zenithal openings
This parameter affects the whole configuration of the structure determining the inclination of the surface. The experiment tests two heights 3.50 m and 5.00 m.
2 Radius of the zenithal openings
The size of the opening defines the amount of direct solar exposure of the internal floor area. In addition, is expected the parameter to have an impact also on the inclination of the surface. The experiment tests three radius of 30 mm, 60 mm and 90 mm.
3 Inclination of the zenithal openings
Different inclinations of the openings towards the North are tested in order to explore the possibility to decrease the exposure to direct solar radiation in the interior space.
The experiment test three different inclinations of 0°, 30° and 45° . The inclination of the opening results into a deformation of the global geometry, however the maximum inclination is set to 45° in order to reduce the deformation to an acceptable impact on the overall displacement of the structure in terms of structural behaviour.
r1 = radius of the opening
h1 = height of the opening
θ°= height of the opening
Surface Inclination (α):
r = radius of the relevant unit
d = r - r1
α = tanˉ¹ d/h1
1.02
Height: 5 m
Radius: 60 cm
Inclination: 0°
Total radiation: 861 801 kWh/m²
Avg. daily sunlight hours: 2.17 h
Solar radiation
Weather file:
Bahar_Dar_Eth
Period: Annual
Sunlight hours
Weather file:
Bahar_Dar_Eth
Period I: 20th April (hot season)
Direct solar radiation on the the exterior shell
Sunlight hours analysis - direct solar exposure on the interior floor area
2.02
Height: 3.5 m
Radius: 60 cm
Inclination: 0°
Total radiation: 904 058 kWh/m² Avg. daily sunlight hours: 2.27 h
Direct solar radiation on the the exterior shell
Sunlight hours analysis - direct solar exposure on the interior floor area
1.01
Height: 5 m
Radius: 30 cm
Inclination: 0°
Total radiation: 887 267 kWh/m²
Avg. daily sunlight hours: 2.10 h
solar radiation on the the exterior shell
Sunlight hours analysis - direct solar exposure on the interior floor area
Solar radiation
Weather file:
Bahar_Dar_Eth
Period: Annual
Sunlight hours
Weather file:
Bahar_Dar_Eth
Period I: 20th April (hot season)
Direct
1.03
Height: 5 m
Radius: 90 cm
Inclination: 0°
Total radiation: 826 961 kWh/m² Avg. daily sunlight hours: 2.39 h
Direct solar radiation on the the exterior shell
Sunlight hours analysis - direct solar exposure on the interior floor area
Direct Solar Radiation on the Exterior Shell
Significant test models have been extracted to discuss about the results of the experiment.
Height of the Zenithal Openings
It is possible to observe that the height of the zenithal openings is the parameter which has the most significant impact on the direct solar exposure of the exterior shell. Higher openings increase the curvature on the upper area of the structure generating larger corrugation in the geometry and provide a mechanism of selfshading in the shell.
The difference in height tested in the experiment reduces the solar radiation from 4 to 6 %. For example, the results of the test models 1.01 and 2.01, with same opening size and inclination and different heights, are significant: the percentage of the surface characterized by lower exposure of less than 1180 kWh/m2 is 42% in 1.01 with a height of 5 m, whereas it decreases to 20% in 1.02 when the height is 3.5 m.
In addition, the position of the opening contributes to the definition of the overall geometry of the structure and affects its curvature and surface inclination. A small change in height from 5 m to 3.5 m results in a different surface inclination of 2° -5°. The size of the opening contributes to increase the inclination of additional 3 – 5°. A more vertical geometry allows minimizing the amount of direct radiation.
Overall it is possible to reduce the impact of the solar radiation on the exterior up to 10% coupling the effects of self-shading and surface inclination. The difference is remarkable between models 1.03: 826961 kWh/m2 and 2.01: 920936 kWh/m2.
On the contrary the height variable does not have a strong impact on the solar exposure of the interior surface and the different in the results can be considered as negligible.
Right
Fig. 4.14 The graphs show the solar radiation in relation to the radius of the openings for heights 5 m and 3.5 m
Size of the Openings
In relation to the other test parameter, the size of the opening has effect on the solar exposure of the interior floor area and it is possible to observe that a larger opening contributes to increase the solar radiation on the inside space.
In particular, larger difference is observed only in the openings of 90 cm radius when the surface perforation is brought to 7.10% and the increment in the exposure is the double of the models with 30 cm opening radius when the perforation correspond to the 2.65% of the surface area.
However, it is possible to conclude that the size of the openings has a small contribution on the environmental performance of the structure and the major contribution of solar exposure of the interior floor area is due to the lateral openings, responsible for all the areas with direct sun exposure of more than 3 hours daily.
Therefore, all the results can be considered acceptable in relation to the selected environmental target of reducing the direct exposure in order to minimize the total heat gain of the configurations. An average of 73.3% of the interior surface receives less than 1.20 hours of direct sunlight in all the test models. For this reason, other alternatives need to be explored to increase the luminance of the spaces and the light quality of the interior.
Left
Fig. 4.15 The table shows the results of the experiment in relation to the direct solar radiation on the exterior shell.
Fig. 4.16 The table shows the results of the experiment in relation to solar exposure in the interior floor area.
Due to the latitude, the difference between the direct sunlight exposure of the internal space on April the hottest month and August the coolest month is irrelevant. For further explorations only the values achieved on April will be taken into consideration.
In relation to the inclination of the openings the models do not show significant differences in the results and the variable is considered not relevant for the design of the system. In further experimentation all the openings are assumed with an inclination of 0° in order to reduce possible complication in the construction process of the formwork.
Right
Perforation System
Diffused Lighting Design
In relation to previous experimentation concerning direct solar exposure, The design structures resulted successful in reducing the direct sunlight with a solar exposure of less than two hours per day on the interior floor area. However, a perforation pattern is introduced in the design process in order to enhance diffused lighting. Different perforation configurations can be applied to the structure in order to better characterize the spatial qualities of the architecture and define a variation of micro-climatic light conditions.
The process is based on the introduction of standardized cylindrical elements to be anchored on the formwork before the application of the material. These elements can be removed with the formwork when the earth has dried.
The elements are conceived as prefabricated pieces with the fixed dimension of 10 cm diameter which are always placed in the direction perpendicular to the surface. Since the structures are characterized by continuous changes in curvature at the local scale the inclination of these elements is assumed as not relevant because it would increase significantly the complexity of the construction process.
However, assuming a thickness of 15 cm for the cross section of the earthen shell, a small inclination is sufficient to provide sheltering from direct sunlight.
A set of parameters defines the design of the perforation pattern.
Left Fig. 4.17 The digram collects the essential dimensions of the elements used for the perforations.
1 Organization Pattern
The elements are placed on a radial or a triangular grid configuration. The triangular grid is preferred in order to maximize the distance between the perforations and reduce their impact on the structural efficiency of the shell.
2 Distribution
Groups of perforations are distributed uniformly among the surface or can be localized in specific areas to concentrate light and to allow for exterior views.
3 Density
Variation in density is controlled by the spacing of the elements which is defined in the range from 30 cm distance to 1 m distance. Different densities enable variation in the perceived luminance of the interior space.
The following images show different perforation configurations which have been applied to a test model derived from previous experimentation.
In relation to the complexity of diffused light analysis it has not been possible to define a quantitative evaluation of the different light conditions achieved. However, the iterations proposed demonstrate the effects of the perforations in the interior space in relation to the consequential spatial identity. The changes in the average luminosity intensity of the images has been recorded.
Different design have been explored further on in the case study project to test the different architectural qualities induced by the perforations.
Right
Fig. 4.18
Left above
Fig. 4.19
Organization Pattern:
Triangular grid
Distribution:
Uniform
Density:
Spacing 1 m
Luminosity Intensity Avg. : 65.67
Left below
Fig. 4.20
Organization Pattern:
Radial grid
Distribution:
Uniform
Density: Spacing 50 cm
Luminosity Intensity Avg. : 65.42
Organization Pattern:
Triangular grid
Distribution:
Localized
Density:
Spacing 30 cm
Luminosity Intensity Avg. : 65.52
Organization Pattern:
Triangular grid
Distribution:
Localized
Density:
Spacing 50 cm
Luminosity Intensity Avg. : 66.10
Right above
Fig. 4.21
Right below
Fig. 4.22
Design Proposal
Right
Fig. 5.1 Satellite view of the Lake Chad in 2001, highly used of irrigation the image shows its previous surface area.
The previous exploration enabled to identify the interrelation of the variables of the system and its structural and environmental behaviour. This interaction between the components of the systems has proven to have some effective results. Properties emerged, such as the structural contribution of the single units enabling a larger span when aggregated. However, some of the parameters are conflicting, for instance, while augmenting the radius of the inner rings decreases the incidence of direct solar radiation the displacement of certain areas of the structure is higher. Thus the ambition of the following experiment is to evaluate the system’s ability to provide differentiation and respond to a spatial organisation with distinct requirements.
The systems is tested through the development of a 1000 m² Learning Centre, which has a fair level of complexity in terms of spatial needs. The experiment is set in the Sahel region, on the one hand the material properties should enable to
build resilience to the harsh climatic conditions, on the other resource availability is taken into account and should allow for a valid low carbon solution. The programmatic definition of the building is also pertinent in the Sahelian context, since it is conceived as a place to promote social interaction as well as provide access to information. Considerations have been made through out the exploration to rely on local available materials and minimise the need for refined infrastructure.
The experiment carried out approaches the building as a case study to determine the efficiency of the material system. It is important to state that for the purpose of this research only the environmental conditions of the Sahel are taken into account (solar radiation, temperature, predominant wind direction and speed). No specific site has been established and the experiment is not accompanied by an urban study of an exact location.
Learning Centre in the Sahel
Program Definition and Spatial Requirements
In order to test the system’s capacity to provide differentiation in terms of spatial qualities, requirements have been specifically set for each one the programs of the Learning Centre. The aim of the experiment is to evaluate if gradients in terms of light, spatial fluidity and relation with the external context are achievable.
The Learning Centre is intended for 250 regular users, that can frequent the multimedia library, the e-hub, the classrooms and the workshop. These learning spaces are used during the day time and should have a good natural lighting condition. Whereas both the classrooms and the workshop are set as enclosed light singular spaces, the library is established as more fragmented configuration with a direct visual and physical relation with the exterior. Additionally, the lighting condition varies from the collection area to the reading spaces.
The foyer is the principal connector between these different programs, and it is conceived as a multifunctional space that can stimulate the encounter of people from different social and cultural backgrounds. Thus, in this flexible space public events, ceremonies, exhibitions or cultural
events can take place for up to 100 transient users. The cafe is connected to the foyer and should be a supporting infrastructure for the events that will take place in the foyer. These spaces have a lower lighting requirement than the learning area, allowing for some darkness. Moreover, both the foyer and the cafe are transitional spaces between the exterior and the interior.
These requirements inform the spatial organisation as they set up its body plan and the domain of the variables of the system for each area. The fluidity is correlated with the number of radial units that generate one program. The level of connection with the exterior is set by the number of supports on the ground of the external boundary as well as by the frequency of the corrugation. The permeability of the spatial configuration informs the cell’s boundary between adjacent programs. The intersection points between two programs become either supports on the ground or elevated restrain points to direct the circulation. The lighting requirements determines the type and location of the perforations of the shell.
(Fig 5.2)
collection & reading room
200m²
storage 50m²
e-hub 50m² foyer & multiple use
200m² cafe
luminance (lux)
high (500)
reading classroom foyer cafe
low (100)
adm workshop foyer cafe
classroom e-hub
n° users 250 n° transient 100 area 1000m²
storage storage circulation e-hub
height (m) 8 3
location orientation boundary condition
reading circulation workshop adm
80m² learning
classrooms
150m² workshop
80m² adm
50m² circulation & wc 90m²
solar exposure admittance more less permeability more less
reading circulation workshop
cafe classroom adm storage e-hub
type of natural light diffuse direct
reading classroom foyer cafe
storage circulation e-hub workshop adm foyer cafe
reading
classroom circulation workshop foyer
storage e-hub adm
radius of the unit radius of zenithal opening clearance
type of perforation
height of intersection points
5.2 Program, spatial requirements and system parameters.
In addition to the programmatic specific environmental requirements, other main basic considerations apply in the Sahelian context. First, in terms of the orientation the longer facades should face north and south to reduce exposed surfaces. Secondly, because of the sun path in this latitude lateral openings located on the north and the south facade have a low impact on the solar incidence on the ground plane. Last, internal enclosed courtyards can contribute in the thermal performance of the building by acting as a storage of cool air. (Fig. 5.3)
Strategies
The design operations combine structural and environmental strategies derived from the results of the previous experiments.
Structural strategy:
To minimise the displacement of the structure by
Orientation longer facade north/ south
Orientation longer facade north/ south
Spatial configuration
Spatial configuration
definition and location of sub-programs according to structural and environmental requirements
definition and location of sub-programs according to structural and environmental requirements
guaranteeing a minimal percentage of supports on the ground and promoting corrugation of the surface controlling the frequency and the amplitude.
Environmental strategies:
To reduce the heat gain minimising the solar radiation on both the external and the internal surfaces through inducing self shading on the external surface and minimising lateral openings to the East and the West.
Two natural ventilation strategies have to be set for different times of the day to dissipate the heat inside the building. In day time ventilation relies on the stack effect because of the temperature difference between the indoors and the outdoors while in night time other techniques have to be instated to cool down the effects of thermal mass. To provide air flow by inducing stack effect while preventing the formation of wind corridors .
To provide diffuse light by lateral perforations of the surface.
Fig. 5.4 Programmatic, spatial requirements and system parameters.
5.5 Initial layout of spatial configuration of the project with radial units per program.
Multiple use
Foyer 200 m2
Storage 50 m2 Legend
Circulation 90 m2
Cafe 80 m2
Learning
Classrooms 150 m2
Workshop 80 m2
Aministration 50 m2
Library
Reading room 200 m2
E-hub 50 m2
Right
Fig.
Top Down Approach
Through a top down approach the principle guidelines of spatial organisation of the building are set in terms of: orientation the building, topological relations between the programs and permeability of the configuration.
The design process initiates with the location of the programs considering their orientation and the influence of the predominant wind (North-South). Additionally, the topological relation between the programs is translated into the layout: the foyer is placed on the centre
of the configuration directly linked to the cafe, the learning area is located to the west with classrooms and workshop adjacent to each other, the library is placed at the north and east and the e-hub at the south.
Accounting for different levels of spatial fluidity the number of units that configure each program, their geometry (radius and height) and the pattern of distribution of internal supports is established.
Below left
Fig. 5.6 Sun path diagram Latitude:11.6 showing the global horizontal radiation in Bahar-Dar Ethiopia.
Below right Fig. 5.7 Wind rose of the site showing predominant wind North South in Bahar-Dar Ethiopia.
Right
Fig. 5.8 Layout input for the multi objective optimisation.
Height Radial Units Intersection Points
0: h 4 m 1: h 5 m 2: ground 3: h 6 m 4: h 6 m
h 5 m 6: h 5 m
ground 8: h 8 m 9: ground
h 5 m
h 4 m 12: h 6 m 13: ground 14: h 4 m 15: h 5 m 16: ground 17: h 4 m 18: h 4 m 19: h 4 m
20: h 5 m 21: ground 22: h 6 m 23: h 6 m 24: ground 25: h 4 m 26: h 4 m
h 3 m
h 4 m
h 3 m
ground
h 3 m
h 4 m
ground
h 4 m
h 3 m
h 3 m
ground
ground
h 6m 40: ground 41: h 4 m 42: h 4 m 43: h 4 m 44: h 6 m 46: ground 47: h 6 m 48: h 6 m 49: h 7 m 50: h 7 m
h 6 m
h 8 m
Multi-Objective Optimisation
Based on the resulting programmatic layout, different spatial configurations are generated through multi-objective optimisation using evolutionary algorithms. (Fig 5.8)
Ambition
The aim of this experiments is to find the most balanced configurations in relation to selected conflicting parameters. Therefore the analysis was done among the individuals on the pareto front.
Evaluation criteria
1. Minimum displacement, 2. Minimal direct solar radiation (kWh/m²) on the shell calculated on an annual period, 3. minimal direct solar radiation on the internal ground surface. An additional criteria to maximize internal volume was also applied.
Analysis data
The analysis is conducted in the Rhino + Grasshopper environment with the plug-in Octopus together with Karamba for structural analysis and Ladybug for environmental analysis.
Structural performance
As in the previous experiments, the test models are evaluated under self weight plus an area load of 1 kN/m² and material properties are assumed as linear elastic isotropic behaviour.
Cross section thickness: 15 cm
E = 0.20 GPa
ν = 0.3
Tensile strength fy = 1.40 GPa
Environmental performance
The environmental data used for the experiment are relative to the area of Bahar-Dar, Ethiopia, in the Sahel region. Test models are evaluated with two different kind of analysis:
1. Direct solar radiation (kWh/m² ) on the shell calculated on an annual period.
2. Direct solar radiation (kWh/m² ) on the internal ground surface calculated on an annual period.
Genetic Algorithm
Software: Octopus (GH)
The spatial configurations were generated through 30 generations of 20 individuals. The total number of genes was 604
Elitism: 0.5
Mutation probability: 0.1
Cross over rate: 0.80
Optimisation variables
Since the general guidelines of the layout were previously set in order to decrease the number of variables.
Therefore the variable parameters were:
1. The lateral openings and supporting points on the ground (minimum 50% of total points on the ground)
2. The corrugation frequency and amplitude (height between 0.0 m and 8.0 m)
3. The zenithal openings radius and height (radius between 0.50 m and 0.90 m and height between 6 and 10% lower than the higher point of the radial unit)
Above
Fig. 5.9 Isometric views of the individuals with lowest displacement (left) and lowest radiation on the shell. (right).
Below Fig. 5.10 Diagrams showing the values for the three fitness criteria.
Fittest individual: displacement
Maximum displacement: 2 mm
Max. direct radiation on the shell: 790 kWh/m²
Max. direct radiation on ground: 240 kWh/m²
Results
External boundary
Support condition: 57.48% on the ground
Average length lateral openings: 2.94 m
Zenithal openings
Average radius: 0.44 m
Average height: 4.91 m
Usable ground surface: 69.14%
Maximum displacement: 6 mm
Max. direct radiation on the shell: 777 kWh/m²
Max. direct radiation on ground: 330 kWh/m²
Results
External boundary Support condition: 55.10% on the ground
Average length lateral openings: 3.54 m
Zenithal openings
Average radius: 0.45 m
Average height: 4.61 m
Usable ground surface: 72.23%
Fittest individual: radiation ground
Average individual: selected
(mm)
Above Fig. 5.11 Isometric views of the individuals with radiation on the ground surface (left) and one average individual (right).
Below Fig. 5.12 Diagrams showing the values for the three fitness criteria.
Max. displacement: 31 mm
Max. direct radiation on the shell: 785 kWh/m²
Max. direct radiation on ground: 213 kWh/m²
Results
External boundary
Support condition: 65.31% on the ground
Average length lateral openings: 2.85 m
Zenithal openings
Average radius: 0.44 m
Average height: 4.52 m
Usable ground surface: 67.70%
Max. displacement: 36 mm
Max. direct radiation on the shell: 785 kWh/m²
Max. direct radiation on ground: 216 kWh/m²
Results
External boundary
Support condition: 60.54% on the ground
Average length lateral openings: 2.97 m
Zenithal openings
Average radius: 0.44 m
Average height: 4.69 m
Usable ground surface: 69.92%
Conclusions
Overall, it can be said that the strategies applied in this experiment were successful in relation to all three criteria. For instance, in relation to the structure the fittest individual presents a maximum displacement of only 2 mm. (Fig 5.9; 5.10) As predicted this results is linked to the high percentage of supports, 57.48% as well as to the frequency of the corrugation, since the maximum distance between supports on the external boundary is lower than 3 m.
Separately, the fittest individual for the direct solar radiation on the shell presents a higher frequency of corrugation enhancing its selfshading. Its average radiation value per square meter (777 kWh/m²) is 64% lower than a flat roof at the same geographical location (2,140 kWh/m²). Additionally, the fittest individual for direct radiation on the internal ground surface presents an average 10 times lower than a surface covered by a flat roof.
In detail, the comparison between the individuals from generations 1, 15 and 30 shows that there was a gradual improvement of the
average value of the Volume which contributed into having a lower max. value for displacement on generation 30. However the minimum value achieved had only a small improvement through out the experiment. Besides, the results after 30 generations do not present any sign of convergence. (Fig 5.12 ; 5.13) For both the radiation on the shell and the radiation on the ground the standard deviation graphs shows that the mean has been shifted towards a lower value in generation 30. (Fig 5.14 ; 5.15) It can be said that the final outcomes of the experiment represent a fitter population in terms of radiation.
Nonetheless, there is also no sign of convergence for the radiation results either. Thus, even though the experiment was able to generate fitter individuals in all three criteria, the high number of genes would require a much larger number of iterations to have more accurate results. A restriction was imposed in the number of generations that were run since the complexity of the definition was high and each generation took approximately 2 hours. Therefore in the given time scale it was not possible to run more generations.
Disp - Normal Distribution
Volume - Normal Distribution
Above
Fig. 5.12 Standard Deviation graph for the displacement comparing generations 1, 15 and 30.
Below
Fig. 5.13 Standard Deviation graph for the Volume comparing generations 1, 15 and 30.
G1 G15 G30
G1 G15 G30
Rad. 1 -
2 -
Above
Fig. 5.14 Standard Deviation graph for the direct solar radiation on the Shell comparing generations 1, 15 and 30.
Below
Fig. 5.15 Standard Deviation graph for the direct solar radiation on the internal ground surface comparing generations 1, 15 and 30.
G1 G15 G30
G1 G15 G30
Case Study Project
From the previous experiment, an average individual in the three criteria was selected amongst the individuals for further development. The output is already informed in its generative logic by the design inputs concerning the spatial requirements developed in the top down stage.
On this next stage modifications on the levels of the ground plane are inserted in order to make a clear division between circulation and usable spaces. These excavated platforms on hard packed earth also allow to increase the usable area of the building.
Additionally, perforations are introduced in the surface to provide the correct minimum natural light conditions for each one of the programs. A series of considerations are made for the
distribution of the perforations. First, in order not to weaken the structure they are located respecting a minimum distance of 0.60 to the edge of the radial units. Secondly, for their feasibility they are always the same radius (5 cm) and at least 30 cm apart so that the strips of jute fibre can be applied around these elements during the construction. Thus, the parameters that vary on the distribution of the perforations are density and location.
In the case of spaces with a high requirement for natural light, such as the library or the classrooms, the perforations are dense and localised. In the case of spaces with lower requirements, for instance in the foyer, they are scattered and less dense.
Left
Fig. 5.16 Rendered view of the southern facade of the selected individual
Right
Fig. 5.16 Plan view of the selected individual.
Right
Fig. 5.17 Section through the foyer and the cafe.
+8.00
Foyer Cafe
Right
Fig. 5.18 Section through the foyer and the courtyard, showing the transition between the exterior and the interior. +8.00
Foyer
Classrooms
+6.00
+4.00
5.19 Section through the library showing how the high level of corrugation creates smaller enclosed spaces highlighted by ground level.
+0.00 - 0.65 - 0.15
Right
Fig.
Right
Fig. 5.20 Internal view from the foyer towards the classroom showing a gradient of light conditions from darker to well light.
Right
Fig. 5.21 Internal view from the library showing the localised perforation to improve lighting conditions.
Right
Fig. 5.22 Internal view from the classrooms with a denser grid of perforations to provide diffuse light.
Design Evaluations
The design test project has been evaluated in relation to its structural and environmental performance, according to the experimentation which has been conducted in the previous stages of the research.
In this chapter, the results of the analysis are evaluated to understand the potential of the material system at the scale of a building as in the case study project.
Overall, it is possible to observe that the generative logic of the system allows for successful spatial differentiation and the system
demonstrate the potential to accommodate effective design strategies. The results derive from a combination of design choices, which are input in the parametric engine as generative fixed parameters and evolutionary processes.
However, it is possible to observe that the set of fixed design inputs has limited the optimisation process to a relatively small domain of variation. Explorations of a different balance between these two approaches should be further investigated in order to enhance the possibilities of the system to adapt to the environment and achieve responsiveness to the context.
Evaluation of the Structural Performance
Displacement Analysis
On the basis of previous experimentations, It has been observed that complex configurations with multiple centres are able to cover spans up to 10 - 12 m without compromising the overall structural performance, when they are designed to generate high corrugation in the upper areas of the structure. This has allowed to test the system at the scale of the building of the case study project.
In this analysis, the shell has been loaded under its self weight plus an area load of 1 kN/m². With these settings, the resulting maximum displacement is 31 mm and it is possible to conclude that the results are admissible according to the material properties of the earthen composite.
In detail, the larger deformations occur in those areas which are characterized by larger spans of more than 10 m and lower corrugation. It can be observed that the spaces of the foyer and the cafe are the areas of the structure with less corrugation in relation to the dimensions of the generative units input in the script. Here, units of 8 m radius have been selected in order
to ensure the necessary surface area and the level of permeability for the relative program functions. However, this dimensions result in more flat geometries in comparison to other areas of the project as the library, where the smaller dimension of the units provides higher corrugation in the structure. In fact, it is known from previous investigation that high surface curvature can reduce the displacement up to 40%. In addition, it is possible to notice as a result of the optimisation of the evolutionary process that alternate heights in the openings are preferred in order to increase the corrugation on the upper areas of the shell.
In conclusion, the results show the potential for the system to be developed at the building scale and demonstrate the efficiency of an optimized geometry in relation to the overall structural performance. A lower performance is expected in a structure of this scale with the actual non-linear behaviour of the material. Further experimentation is needed to investigate if the real limitations of the material system are the ones obtained with this simulation.
Analysis Settings
Software: CSI Sap2000
Material Properties
Specific weight: 14 kN/m²
Cross section thickness: 15 cm
Elastic modulus: 0.20 GPa
Tensile strength: 1.40 MPa
Load case: Self weight + 1.0 kN/m²
Material behaviour: elastic linear
Results
Max. Displacement: 31mm
Left Fig. 6.1 Structural analysis, displacement.
Classrooms
Evaluation of the Environmental Performance I
Direct Solar Radiation Analysis
In order to increase the comfort of the interior space, the environmental strategy which has been applied has focused on minimising the heat gain of the structure. It is important to state that since the thickness of the shell is at the most 15 cm the benefits of the thermal mass of the loam are lower than in traditional compression only structures with higher thickness. This is why in the Sahel context it is important that the geometry of the proposed shell is optimised to decrease the impact of the solar incidence.
For this reason, the design has been directed to enhance the self shading of the geometry by increasing the corrugation and the inclination of the surface. From the initial input in the design formation, the different functions have been distributed according to their light requirements in relation to their main usage in a specific time of the day.
In addition, the optimization process has been directed to minimize the exposed internal
surface to East/West. This resulted in a significantly closed external boundary in this directions. In the Sahel, the high inclination of the sun rays results in higher solar exposure on the top and the Eastern and Western façades of a structure.
The results show that the shell receives a solar radiation of 785 kWh/m2, which corresponds to more than 60% less than the radiation on a flat surface. The interior floor area, with a value of 216 kWh/m2 has an incidence of only 20% in relation to a surface of the same dimensions which is covered by a flat roof.
In conclusion, It can be observed that the geometry of the system provides a great resource to reduce the impact of the sun on the structure. The results show potential for passive environmental design in order to minimise the use of external mechanic devices to control the indoor micro-climate of the space.
Analysis Settings
Software: Ladybug (Grasshopper)
Direct solar radiation
ladybug WF: Bahir_Dar_Eth
Period: Annual
Results
Average Ext. Surface: 785 kWh/m²
Ref. flat surface: 2,140 kWh/m²
Average Int. Surface: 216 kWh/m²
Ref. covered by flat surface: 909 kWh/m²
Left Fig. 6.2 Direct solar radiation analysis.
Evaluation of the Environmental Performance II
Wind Tunnel Simulation
In the Sub-Saharan region the wind constitutes a complex factor. In general, primary target of the design in relation to its environmental response, has been to develop multiple strategies for heat dissipation. However, the significant difference in temperature characteristic of the area requires a relative flexibility in the design: in fact, during the day natural ventilation results not advisable because of the hot temperature of the air. On the contrary, when the temperature decreases in the night time, natural ventilation can be largely beneficial for heat dissipation.
Several considerations have been applied in the design process in relation to cross-ventilation and stack-effect dynamics in the structures.
Essential principles of the functioning of s tack-effect have been studied in order to enhance vertical natural ventilation by the geometry of the design. The zenithal openings in the structure are conceived as a potential effective outlet for natural ventilation. The difference in temperature and pressure generated between the air at
the top and the bottom of the inner space is favourable to induce ventilation through the openings. However, in this research it has not been possible to quantify its effects. In fact, CFD Analysis is not accurate in relation to the impossibility of imputing data such as temperature, humidity and material physical properties, which are necessary to assess the specificity of the material system.
Furthermore, cross ventilation has been evaluated as beneficial to provide nigh flush. However, a mechanism of control is required to provide the possibility to prevent ventilation in the warmest hours of the day. From the analysis, the alignment of inlet and outlets produces a internal velocity of up to 5 m/s. Wind corridors are generated by aligned openings towards the prevalent wind direction.
Alternate openings should be considered preferable to induce cross ventilation and at the same time to avoid such high velocity of the airflow which will result in a relative discomfort of the interior space.
Analysis Settings
Software: Autodesk Flowdesign
Wind direction N/S
Wind velocity: 2.5 m/s
Results
Max internal velocity: 5.08 m/s
Max pressure surface: 10 Pa
Left
Fig. 6.3 Wind tunnel simulation.
Evaluation of the Feasibility of the Construction
In relation to construction process, it is important to understand the challenge of the time factor for a project at this scale. Taking into account that the total surface area of the shell is 2518 m² and that the labour input of the system is around 9 hours/m² per person, with a regular team of 20 construction workers it would be necessary 141 working days to build this structure (around seven months).
Further research is needed to evaluate if a more efficient technique for material application could reduce the construction time. Spraying has been investigated as a possible technique, however, it would be possible to spray only the latest layers of earth, after the first ones are already dry and can collaborate to the stiffness of the structure in order to guarantee that the fabric formwork does not deform.
According to the conducted research, part of the success of the PISE (Pneumatically Impacted Stabilised Earth) relies on the presence of cement so that the high water content on the
mixture does not lead to cracking. Thus, to preserve the validity of the system in terms of sustainability experiments are necessary to evaluate the performance without cement.
Moreover, it is important to state in the subject of waterproofing the intention to maintain the sustainability of the developed system. The research for alternative stabilisers identifies linseed oil as a possible addictive. The natural oil has water absorption of 0.54 ml/min if applied on raw soil and is widely used in Australia and New Zealand. Even though this value is lower in comparison to other stabilisers it is sufficient to reduce the water erosion that can jeopardise the mechanical properties of the system.
This strategy can be coupled to the fact that the system allows to be repaired over time. Training of the community on repairing techniques can be implemented in order to tackle the durability issue of earthen constructions.
Conclusions
Conclusions
In this dissertation, new design strategies have been investigated to understand the potential of computational technologies, simulation and analysis to inform earth construction in order increase to its overall performance as a sustainable building technique. As an ambition, the research has focused on the exploration of the material behaviour to unveil the natural properties of the material and develop new design opportunities which are directly related to the material performance.
The system has proofed to be capable to achieve self-supporting structures at the building scale entirely in earth and natural fibres. In addition, the construction process can be considered economically efficient and with a very low impact in terms of resource consumption. The actual verification of the process has been conducted through the design of prototypical structure through which it has been possible to refine the whole design logic and construction process. The physical tests have enabled the calibration of digital analysis and substantiated the following design experimentation. However, it is necessary to consider that the assumed linear elastic isotropic behaviour between thickness and scale does not correspond to the actual properties of the composite at larger scales.
Further development shall focus on building a second structure on the basis of the latest experimentation in the last stages of the research to integrate the complexity of the new logic of formation for configurations with multiple centres. In this context, the aspects to be developed will need to explore the detailing
for the construction of the perforations and the design of more performative geometries for the ground supports, in order to increase the corrugation in the lower part of the structure.
Separately, water resistance was not part of this investigation and even though the curved geometry facilitates water drainage, a waterproof finishing is required. As mentioned, linseed oil should be tested in order to protect the structure from water erosion.
In terms of its environmental performance, the system demonstrates potential to reduce the heat impact with self-shading. It is important to consider that the material itself has a high thermal mass but that its effectiveness on a 15 cm shell needs to be quantified. In relation to wind instead, the geometry results sensible to lateral loads. However, it is expected that the weight of a relatively large structure with a cross section of 15 cm will have enough mass to preserve its stability.
The general design logic of the system allows for successful spatial differentiation through gradients of size and light as well as different relations between interior and exterior. The possibility of partially closing the external boundary and the internal support points provides several solution to design the interior space of the structure. Overall, at the current stage of development, the system can provide efficient solutions for sustainable medium scale constructions which have potential for adaptive response to the environment.
Appendix
Appendix I
Material Tests
The appendix reports the data from the physical tests through which Elastic Modulus and Tensile strength of the material have been derived. Four test models have been evaluated.
Elastic Modulus (GPa)
Graph Load - Displacement and Elastic ModulusDisplacement, Specimen 1.
Displacement (mm)
Right
Elastic Modulus (GPa)
Displacement (mm)
Left
Graph Load - Displacement and Elastic ModulusDisplacement, Specimen 2.
Elastic Modulus (GPa)
Graph Load - Displacement and Elastic ModulusDisplacement, Specimen 3.
Displacement (mm)
Right
Elastic Modulus (GPa)
Displacement (mm)
Left
Graph Load - Displacement and Elastic ModulusDisplacement, Specimen 4.
Appendix II
Scripting
The appendix reports significant parts of the parametric code used to generate the design of the structures. The following Python scripts concern the generation of different design options for the points where the fabric is pulled. A different formation logic is introduced in
relation to the input conditions for: 1. Points which belong to the exterior boundary. 2. Points at the unit intersections which can function as interior support points . This second category includes the division of the support in parts to allow its construction from multiple formworks.
//Points of the exterior boundary
import rhinoscriptsyntax as rs import math as math
if Pt <> None: if Loc <> None:
C = rs.AddPoint (Pt)
CLoc = rs.AddPoint (Loc)
Co = rs.PointCoordinates (CLoc)
PL = rs.AddPolyline (Pl)
Vz = rs.VectorCreate ((0,0,Co[2]), (0,0,0))
Circle = rs.AddCircle (C,0.1)
IPts = rs.CurveCurveIntersection (PL, Circle)
Pt1 = rs.AddPoint (IPts[0][1])
Pt2 = rs.AddPoint (IPts[1][1])
Angle = rs.Angle2 ((Pt1, C), (Pt2, C))
A1 = min (Angle[0], Angle[1])
AR = math.radians(A1)
RUp = (ABUp)/(2*(math.sin((AR)/2)))
RDw = (ABDw)/(2*(math.sin((AR)/2)))
if Co[2] > 0.1:
UpCircle = rs.AddCircle (C,0.2)
IPtsUp = rs.CurveCurveIntersection (PL, UpCircle)
UpPt1xy = rs.AddPoint (IPtsUp[0][1])
UpPt2xy = rs.AddPoint (IPtsUp[1][1])
UpPt1 = rs.MoveObject (UpPt1xy, Vz)
UpPt2 = rs.MoveObject (UpPt2xy, Vz)
UpLn = rs.AddLine (UpPt1, UpPt2)
UpPtC = rs.CurveMidPoint (UpLn)
else:
DwCircle = rs.AddCircle (C,0.2)
IPtsDw = rs.CurveCurveIntersection (PL, DwCircle)
DwPt1 = rs.AddPoint (IPtsDw[0][1])
DwPt2 = rs.AddPoint (IPtsDw[1][1])
LDw = rs.AddLine (DwPt1, DwPt2)
DwPtC0 = rs.CurveMidPoint (LDw)
DwPtC1 = rs.AddPoint (DwPtC0)
VDw = rs.VectorCreate(DwPtC1, C)
UVDw = rs.VectorUnitize (VDw)
SVDw = rs.VectorScale (VDw, SV)
DwPtC = rs.MoveObject (DwPtC1, SVDw)
//Points at unit intersection (interior ground supports)
import rhinoscriptsyntax as rs
Pts = rs.AddPoints (PtsI)
CAB = rs.AddPoint (PtsCAB)
CBC = rs.AddPoint (PtsCBC)
CAC = rs.AddPoint (PtsCAC)
CCD = rs.AddPoint (PtsCCD)
CAD = rs.AddPoint (PtsCAD)
if len (Pts) == 3:
PtA = Pts[0]
PtB = Pts[1]
PtC = Pts[2]
LnAB = rs.AddLine (PtA, PtB)
MPtAB = rs.CurveMidPoint (LnAB)
VCMAB = rs.VectorCreate (MPtAB, CAB)
UVCMAB = rs.VectorUnitize (VCMAB)
VAB = rs.VectorScale (UVCMAB, R)
CMAB = rs.MoveObject (CAB, VAB)
ArcAB = rs.AddArc3Pt (PtA, PtB, CMAB)
PtsAB = rs.DivideCurve (ArcAB, D)
#BC
LnBC = rs.AddLine (PtB, PtC)
MPtBC = rs.CurveMidPoint (LnBC)
VCMBC = rs.VectorCreate (MPtBC, CBC)
UVCMBC = rs.VectorUnitize (VCMBC)
VBC = rs.VectorScale (UVCMBC, R)
CMBC = rs.MoveObject (CBC, VBC)
ArcBC = rs.AddArc3Pt (PtB, PtC, CMBC)
PtsBC = rs.DivideCurve (ArcBC, D)
#AC
LnAC = rs.AddLine (PtA, PtC)
MPtAC = rs.CurveMidPoint (LnAC)
VCMAC = rs.VectorCreate (MPtAC, CAC)
UVCMAC = rs.VectorUnitize (VCMAC)
VAC = rs.VectorScale (UVCMAC, R)
CMAC = rs.MoveObject (CAC, VAC)
ArcAC = rs.AddArc3Pt (PtA, PtC, CMAC)
PtsAC = rs.DivideCurve (ArcAC, D)
Appendix III
Structural Performance and Geometry
Structural Performance and Geometry
Pattern A
A.01
pattern A
boundary on the ground: 5% n. of exterior supports: 12 span lateral opening: 7.8m n. interior supports: 2 max. span: 8 m
LC1
max. displacement: 13 cm utilization: 26.9%, -73.4%
LC2
max. displacement: 20 cm utilization: 33.1%, -67.7%
A.02
pattern A
boundary on the ground: 5% n. of exterior supports: 12 span lateral opening: 7.8m n. interior supports: 1 max. span: 10 m
LC1
max. displacement: 11.4 cm utilization: 23.5%, -67.9%
LC2
max. displacement: 16.9 cm utilization: 32.3%, -69.2%
A.03
pattern A
boundary on the ground: 5%
n. of exterior supports: 12
span lateral opening: 7.8m
n. interior supports: 4
max. span: 12.5 m
LC1
max. displacement: 13 cm
utilization: 45.3%, -66.6%
LC2
max. displacement: 16.6 cm
utilization: 60%, -77.1%
A.04
pattern A
boundary on the ground: 5%
n. of exterior supports: 12
span lateral opening: 7.8m
n. interior supports: 0
max. span: 14 m
LC1
max. displacement: 45.9cm
utilization: 36.6%, -70.5%
LC2
max. displacement: 46.2 cm
utilization: 43.6%, -103.2%
A.05
pattern A
boundary on the ground: 5%
n. of exterior supports: 24
span lateral opening: 6.5 m
n. interior supports: 2
max. span: 8 m
LC1
max. displacement: 2.69 cm
utilization: 5.7%, -18.5%
LC2
max. displacement: 3.42 cm
utilization: 6.5%, -35.6%
A.06
pattern A boundary on the ground: 5% n. of exterior supports: 24
span lateral opening: 6.5 m n. interior supports: 1 max. span: 10 m
LC1
max. displacement: 3.23 cm utilization: 5.5%, -21.6%
LC2
max. displacement: 3.81 cm utilization: 8.5%, -42%
A.07
pattern A boundary on the ground: 5% n. of exterior supports: 24 span lateral opening: 6.5 m n. interior supports: 4
max. span: 12.5 m
LC1
max. displacement: 1.89 cm utilization: 6.1%, -23.6%
LC2
max. displacement: 3.34 cm utilization: 7.3%, -43.8%
A.08
pattern A boundary on the ground: 5% n. of exterior supports: 24 span lateral opening: 6.5 m n. interior supports: 0 max. span: 14 m
LC1
max. displacement: 29.1 cm utilization: 29.2%, -32.5%
Baiche, B., Osmani, M., Hadjri, K. (2008) Attitudes towards earth construction in the developing world: a case study from Zambia. CIB W107 Construction in Developing World Countries International Symposium.
Block, P., Knippers, J ., Mitra, N., Wang, W. (2014) Advances in Architectural Geometry 2014. Springer.
Brennan, J. & Pedreschi, R. (2013) The potential of advanced textiles for fabric formwork. Construction Materials Volume 166 Issue CM4.
Brouwer, R. (2001) Natural Fibre Composites in Structural Components: Alternative Applications for Sisal. Delft University.
Carroll, S.B. (2005) Endless Forms Most Beautiful: The New Science of Evo Devo and the Making of the Animal Kingdom. New York: W. W. Norton & Company.
Chandler, A. & Keable, R. (2009) Achieving carbon neutral structures through pure tension: using a fabric formwork to construct rammed earth columns and walls. Proceedings of the 11th International Conference on Non-conventional Materials and Technologies. (NOCMAT2009)
Chandler, A., Pedreschi,R. (2007) Fabric Formwork. Riba Publishing
Ciancio, D. & Becke, C. (2015) Rammed Earth Construction: Cutting-Edge Research on Traditional and Modern Rammed Earth. CRC Press.
Eyring, G. & Bull, T. (1988) Advanced Materials by Design; Energy and Materials Program. DIANE Publishing.
Hall, M. , Krayenhoff, M. & Lindsay,R. (2012 ) Modern Earth Buildings: Materials, Engineering, Constructions and Applications. Woodhead Publishing.
Hensel, M. & Menges, A. (2008) Versatility and Vicissitude An Introduction to Performance in MorphoEcological Design. AD Magazine Versatility and Vicissitude Profile No.192, Vol.78 No.2. John Wiley & Sons
Kuijvenhoven, M., Hoogenboom, P.C.J. (2012) Particle-Spring Method for Form Finding Grid Shell Structures Consisting of Flexible Members. Journal of the international association for shell and spatial structures: J. IASS, Vol.53, No.1.
Lyamuya, P. & Nurul, A. (2013) Earth Construction in Botswana: Reviving and Improving the Tradition. CAA DHAKA 20th General Assembly and Conference.
Minke, G. (2007) Building with earth: design and technology of a sustainable architecture. Birkhauser.
Mitchell, M. (1996) An Introduction to Genetic Algorithms. Cambridge, Massachusetts: MIT Press.
Otto, F. , Rasch, B. (1996) Finding Form: Towards an Architecture of the Minimal. Munich: Edition Axel Menges.
Otto, F. (1969) Tensile structures vol.2 : cables, nets and membranes. Cambridge: MIT Press.
Pacheco Torgal, F. & Jalali, S. (2011) Eco-efficient Construction and Building Materials. Springer.
Rael, R. (2009) Earth architecture. New York : Princeton Architectural Press.
Tedeschi, A. (2014) AAD_Algorithms Aided Design, Parametric Strategies Using Grasshopper. Le Penseur.
Veenendaal, D. & Block, P. (2014) Design process for a prototype concrete shells using a hybrid cable-net and fabric formwork. ETH Zurich.
Veenendaal, D. & Block, P. (2012) Computational form-finding of fabric formworks: an overview and discussion. 2nd International Conference on Flexible Formworks (icff).
Web References
Auroville Earth Institute http://www..earth-auroville.com
The Block Research Group http://www.block.arch.ethz.ch/brg/
The Centre for the Research and Application of Earth Architecture http://craterre.org/