

The project team would like to extend acknowledgements and special thanks to the following people and organizations:
Atlanta Regional Commission
Airport South Community Improvement District (Part of the ATL Airport Community Improvement Districts)
Shannon James, Aerotropolis Atlanta
Brian Dorelus, Aerotropolis Atlanta
Brian Hebert, Arts Clayton
Lauren Blaszyk, Atlanta Regional Commission (ARC)
Amy Goodwin, ARC
Scott Haggard, Atlanta-Region Transit Link Authority
Emmanuel Adediran, City of College Park
Deborah Rogoff-Ezra, City of College Park
Tasha Hall Garrison, City of College Park
William Moore, City of College Park
LaShawn Gardiner, City of Forest Park
Erica Rocker, Clayton County Chamber of Commerce
Valencia Williams, Clayton County Chamber of Commerce
De-Wayne Martin, Clayton County Citizen Advisory Board
Patrick Ejike, Clayton County Development Authority
Dr. Anthony W. Smith, Clayton County Schools
Tori Strawter-Tanks, Clayton County Senior Services
Jeff Metarko, Clayton County
Judy Graham-Weaver, Delta Air Lines, Inc.
Sarah Elizabeth-Langford, Fulton County Development
Authority Daniella Gutierrez, Fulton County Development Authority
Paul Denard, Georgia Department of Transportation (GDOT)
Connor Booth, GDOT
Daniel Dolder, GDOT
Benjamin Kane, GDOT
Ronald Knezevich, GDOT
Pedro Ortiz, GDOT
Phillip Peevy, GDOT
Landon Perry, GDOT
Jomar Pastorelle, GDOT
Megan Weiss, GDOT
Marie Gordon, Georgia Department of Economic Development
Andy Gobeil, Hartsfield-Jackson Atlanta International Airport
Sidney Douse, Metropolitan Atlanta Rapid Transit Authority (MARTA)
Debbie Frank, MARTA
Greg Floyd, MARTA
Shelley Peart, MARTA
Corentin Auguin, MARTA
Karin Smoot, MARTA
Clayton County Board of Commissioners, Chairman Dr. Alieka Anderson-Henry Forest Park – Ward 5, Councilman Allan Mears
Forest Park – Ward 3, Councilman Hector Gutierrez
Forest Park Council Aide, Tenisha Dixon
AECOM Contente Consulting
This study was prepared in cooperation with the Department of Transportation, State of Georgia, and the Federal Highway Administration. The opinions, findings, and conclusions in this publication are those of the author(s) and do not necessarily reflect the official views or policies of those of the Department of Transportation, State of Georgia, or the Federal Highway Administration. This publication does not constitute a standard, specification, or regulation.

AACIDs ATL Airport Community Improvement District
AADT Average Annual Daily Traffic
AASHTO American Association of State Highway and Transportation Officials
ACS American Community Survey
ADA Americans with Disabilities Act
ARC Atlanta Regional Commission
ASCID Airport South Community Improvement District
ATL Atlanta
AWCID Airport West Community Improvement District
BMP Best Management Practices
BP Business Park
BRT Bus Rapid Transit
C1 Neighborhood Business
C2 Community Business
CID Community Improvement District
DCA Department of Community Affairs
ED Economic Development
FHWA Federal Highway Administration
FLU Future Land Uses
FTA Federal Transit Administration
GB General Business
GDOT Georgia Department of Transportation
GICC Georgia International Convention Center
GIS Geographic Information System
HI Heavy Industrial
HJAIA Hartsfield-Jackson Atlanta International Airport
HUD Housing and Urban Development
ID Identification
LCI Livable Centers Initiative
MARTA Metropolitan Atlanta Rapid Transit Authority
MSA Metropolitan Statistical Area
MXI Mixed Use Commercial Industrial
NW Northwest
OI Office Institutional
OP Office Professional
PAC Project Advisory Committee
PD-C Planned Development Commercial
PM Placemaking
PPS Project for Public Spaces
PUD Planned Unit Development
R3 High Density Residential
RM Multiple Family Residential
RRFB Rectangular Rapid Flashing Beacons
SF Square Feet
SR State Route
T Transportation
TAD Tax Allocation District
TADA Traffic Analysis and Data Application
TOD Transit-Oriented Development
TSP Transit Signal Priority
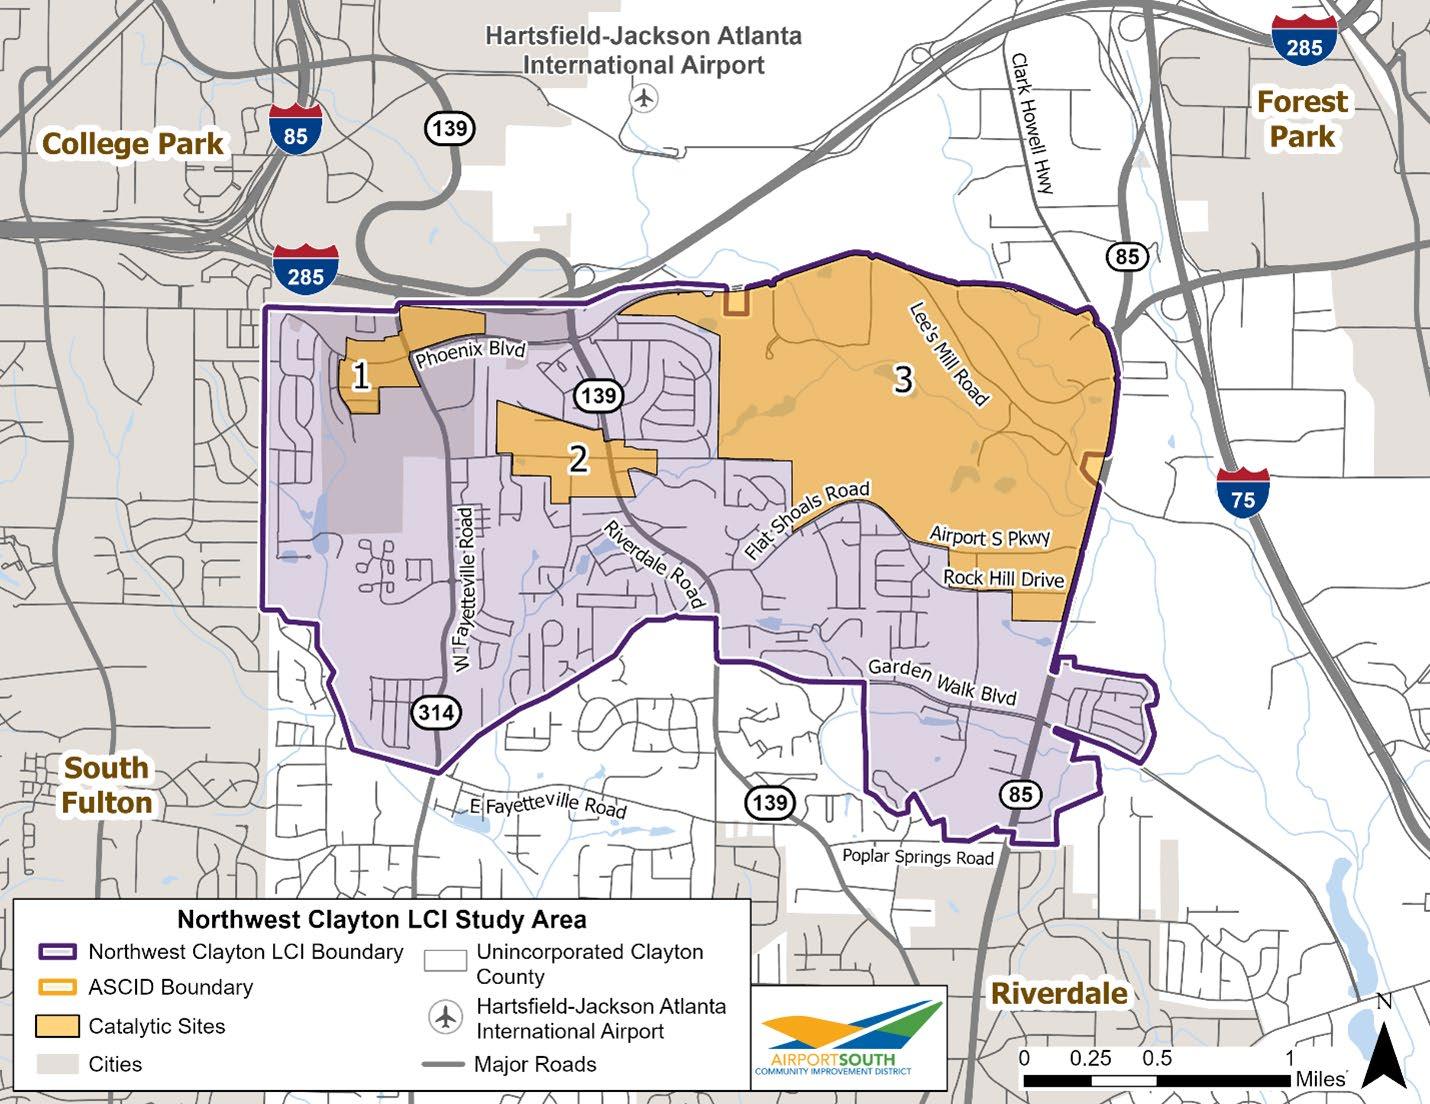
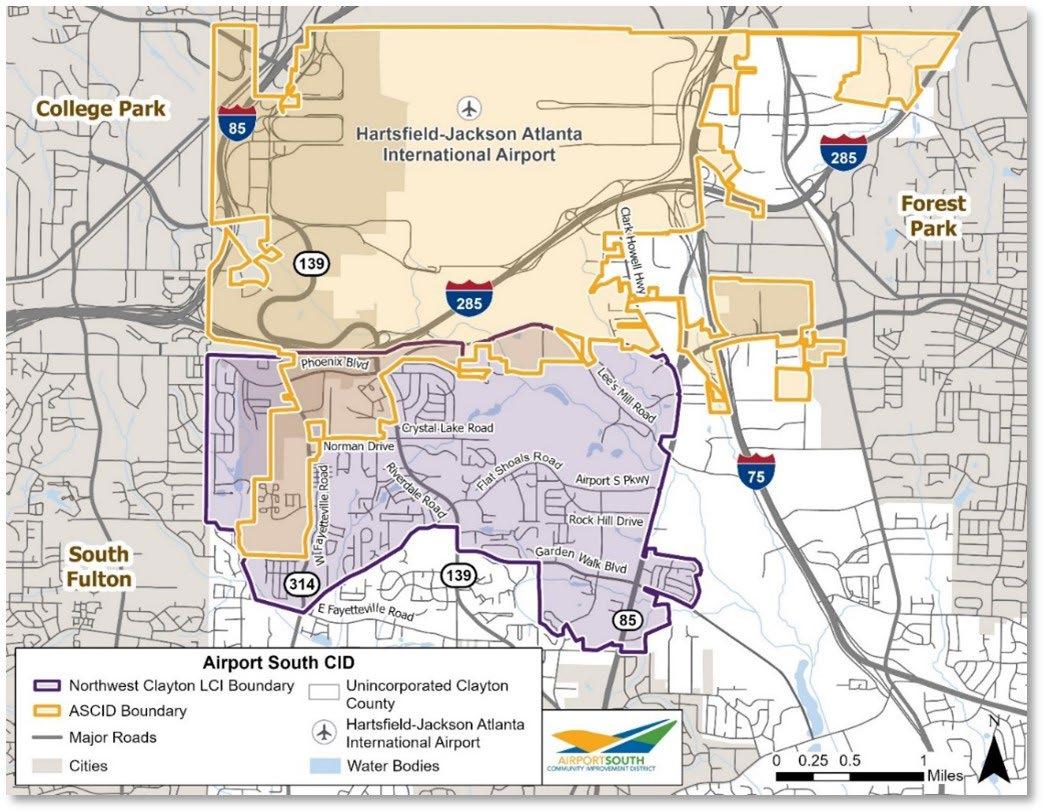
The 2025 Northwest (NW) Clayton Livable Centers Initiative (LCI) Study, henceforth referred to as the “Study,” is a refresh of the 2004 Northwest Clayton LCI Plan and the Northwest Clayton LCI Five-Year Update. The purpose of the initial study was to build a set of recommendations for northwest Clayton County aimed at increasing transportation options in conjunction with targeted efforts to build out nonmotorized infrastructure, increase available affordable housing stock, and amend the zoning code to allow for the mixing of land uses where appropriate. The 2025 NW Clayton LCI Study will enhance and rejuvenate these previous studies, reflecting changes that have occurred since 2004 and 2011. The Study is sponsored by the Airport South Community Improvement District (ASCID). Figure 1-1 shows the NW Clayton LCI Study area.
The purpose of the Study is to build a set of recommendations that:
• Enhance multimodal access, safety, and infrastructure,
• Promote workforce housing and transitoriented development,
• Expand multimodal and transit connections to the area’s largest employers, and
• Establish a regional identity and sense of place and community through art and placemaking.
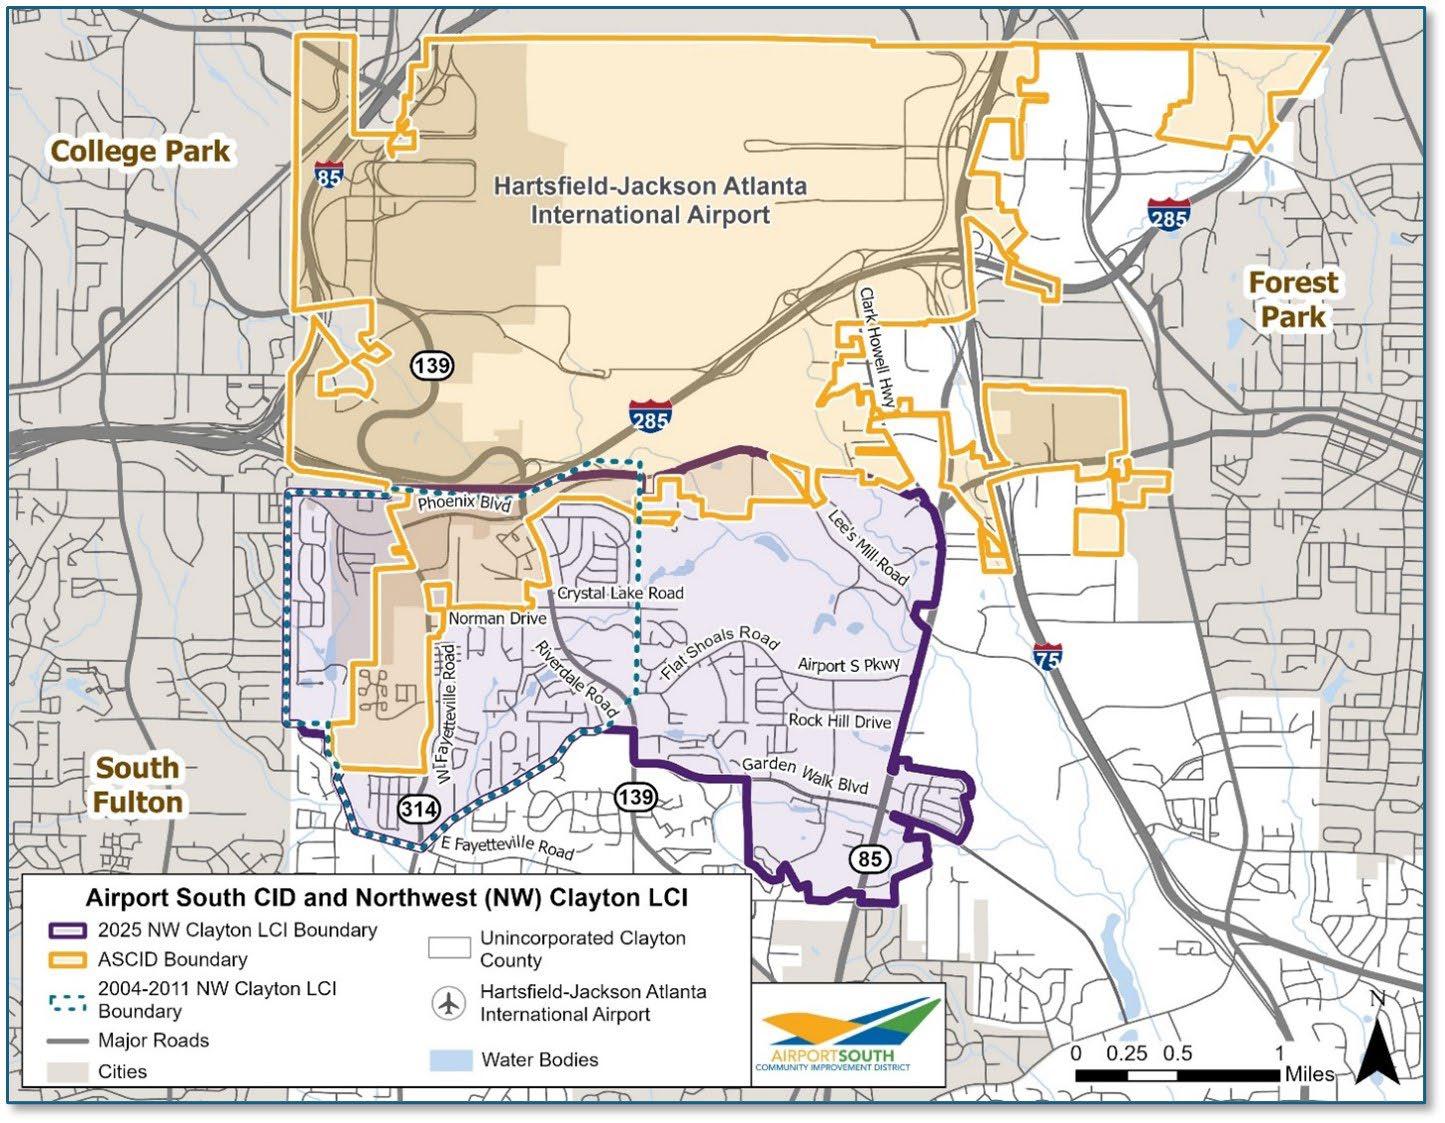
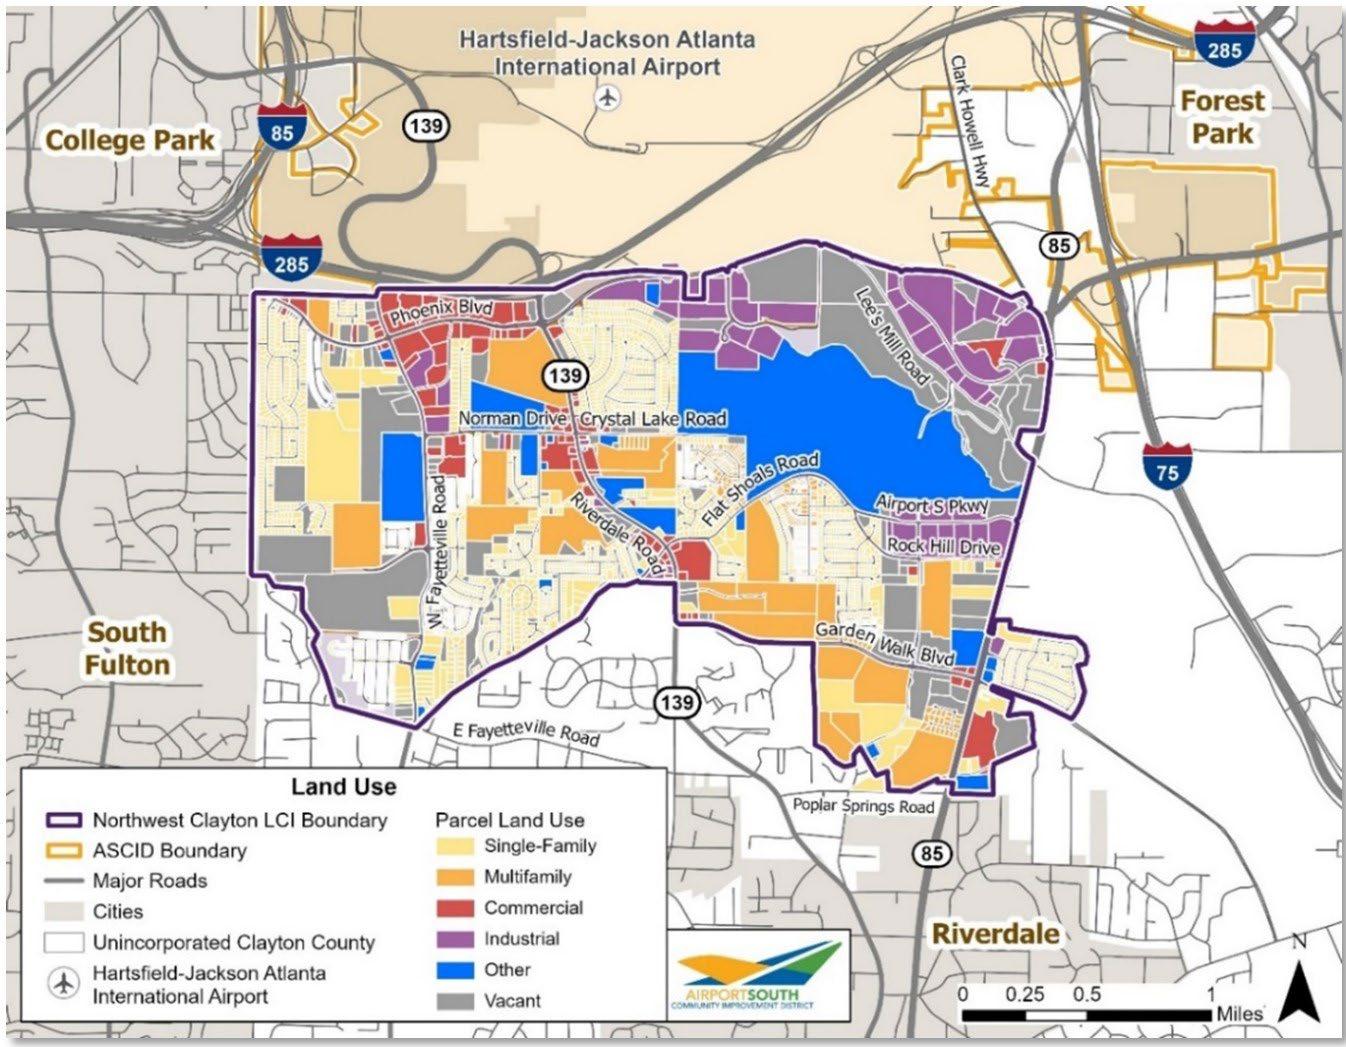
The NW Clayton LCI Study area, displayed in Figure 1-2, is located in the northwest corner of Clayton County, south of Hartsfield-Jackson Atlanta International Airport (HJAIA). It is bordered by the cities of College Park, South Fulton, and Riverdale as well as by Fulton County. The Study area measures approximately five square miles, with 92 percent of the Study area falling within unincorporated Clayton County and the remaining 8 percent of the Study area falling within the City of College Park.
Almost half of the study area is residential, with single-family homes (27 percent) and multi-family
(17 percent) homes. Industrial (10 percent) and Commercial (7 percent) uses make up less than 20 percent of the Study area. Commercial uses flank Riverdale Road in the center and industrial uses are located north of Flat Shoals Road in the east of the Study area.
As compared to the previous LCI plans, the study area is larger; the eastern border expands beyond Riverdale Road and extends to State Route (SR) 85. The 20042011 NW Clayton LCI Study area, shown in Figure 1-2, is approximately 2.5 square miles, half the size of the new Study area. Over 30 percent of the previous study area is in the City of College Park, with 70 percent in incorporated Clayton County.
Source: ASCID
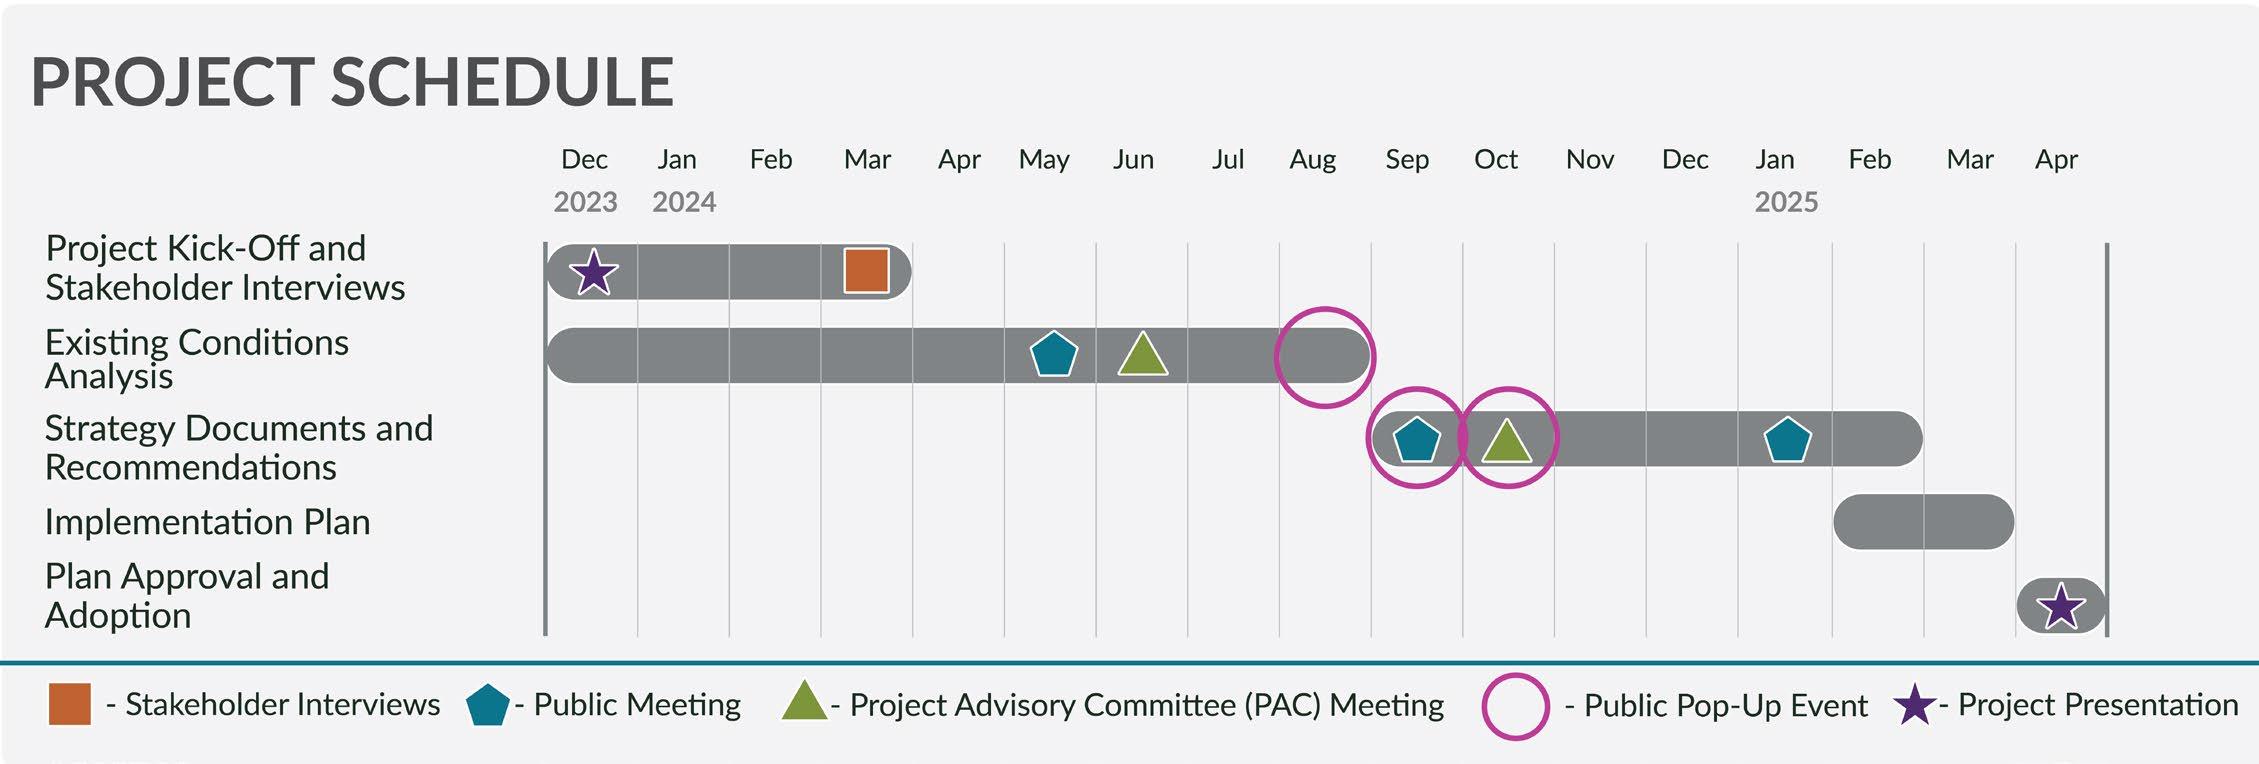
The LCI Study process consists of components: the assessment of the Existing Conditions, and the development of three Strategy Documents for Transportation, Placemaking, and Economic Development, and a robust public engagement process. Each of these components culminates in recommendations for the Implementation Plan. The Study had a 17-month schedule from December 2023 to April 2025, as indicated by the schedule in Figure 1-3.
The process started in December 2023 with a kickoff meeting and a Study area tour to get an understanding of the existing state of the Study area. Afterwards, data collection and analysis began for the existing conditions. Stakeholder interviews were conducted in March 2024 with specific topics for each interview: Economic Development, Placemaking, Safety and Access, Transportation, and Transit. The Project Advisory Committee (PAC) was developed, a group of representatives from key stakeholder organizations serving in an advisory role to provide expertise and area knowledge to ensure that the Study meets the needs of the constituents with implementable recommendations. The existing conditions were presented at a PAC meeting in May 2024 and a public meeting in June 2024 to confirm conditions in the Study area and choose locations and types of improvements for the Study area. The existing conditions assessment was finalized in August 2024.
Before developing recommendations, the consulting team attended four pop-up events to inform the public of the Study and collect feedback on potential placemaking tools, as shown in Figure 1-4. Draft recommendations were developed from feedback provided by the PAC and public, previous study area plans, and the existing conditions analysis. Recommendations were presented at a September 2024 public meeting and October PAC meeting. Feedback from the public meeting yielded additional recommendations, while the PAC meeting provided insight on potential funding opportunities to implement recommendations. Recommendations were detailed in three strategy documents: Transportation, Placemaking, and Economic Development. A combined PAC and public meeting was held in January 2025 to present the recommendations and next steps for implementation of the recommendations. Final documents were compiled, and the plan was presented to transportation stakeholders and the ATL (Atlanta) Airport Community Improvement Districts (AACIDs) board.

The Study focuses on three strategy areas, as indicated in Figure 1-5: transportation, economic development, and placemaking.
Transportation includes building upon the existing transportation network and public and stakeholder feedback to provide recommendations that will increase safety, mobility, and connectivity through roadway, bicycle and pedestrian, and transit improvements.
Recommendations focus on key corridors: Godby Road/Phoenix Boulevard, SR 314/W. Fayetteville Road, SR 139/Riverdale Road, and Garden Walk Boulevard.
Economic development considers current housing stock and parcel usage to develop recommendations to enhance existing multi-family housing, add and diversify housing, and amend land use and zoning to maximize building and parcel use.
Recommendations are anchored by three catalytic sites within the study area: Godby Road, Riverdale Road/Norman Drive, and The Quarry. Sites should be designed to spur reinvestment and new transitoriented development (TOD) attributes at Site Two: Riverdale Road/Norman Drive, to support the future Metropolitan Atlanta Rapid Transit Authority (MARTA) RAPID Southlake Bus Rapid Transit (BRT) Norman Drive station.
Placemaking provides a sense of community with recommendations for wayfinding, beautification, landscape, public art, green infrastructure, and greenspace. Recommendations should aim to identify the NW Clayton LCI Study Area with cohesive and eye-catching designs for streetscape and landscape. Opportunities should be provided to local artists to display public art, with input from the public on the style of beautification improvements.
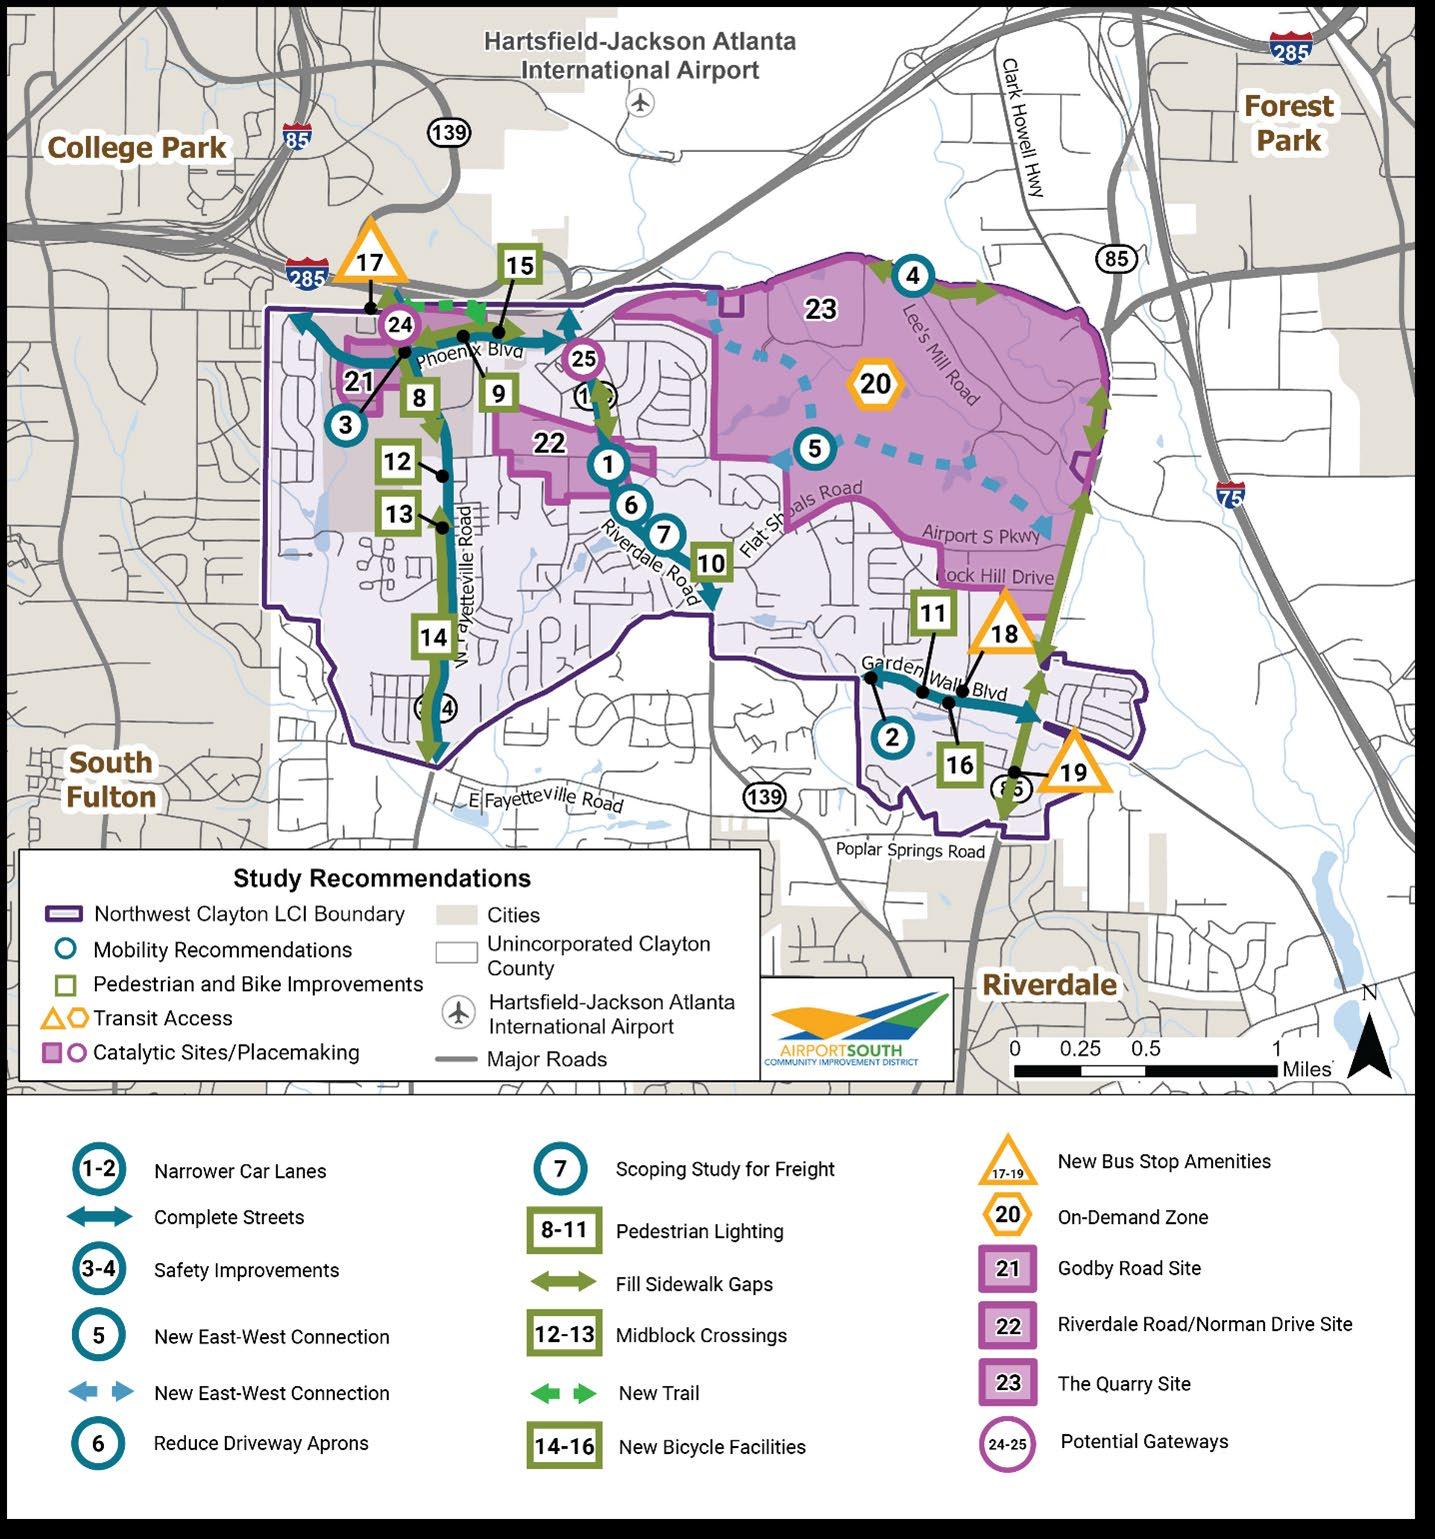
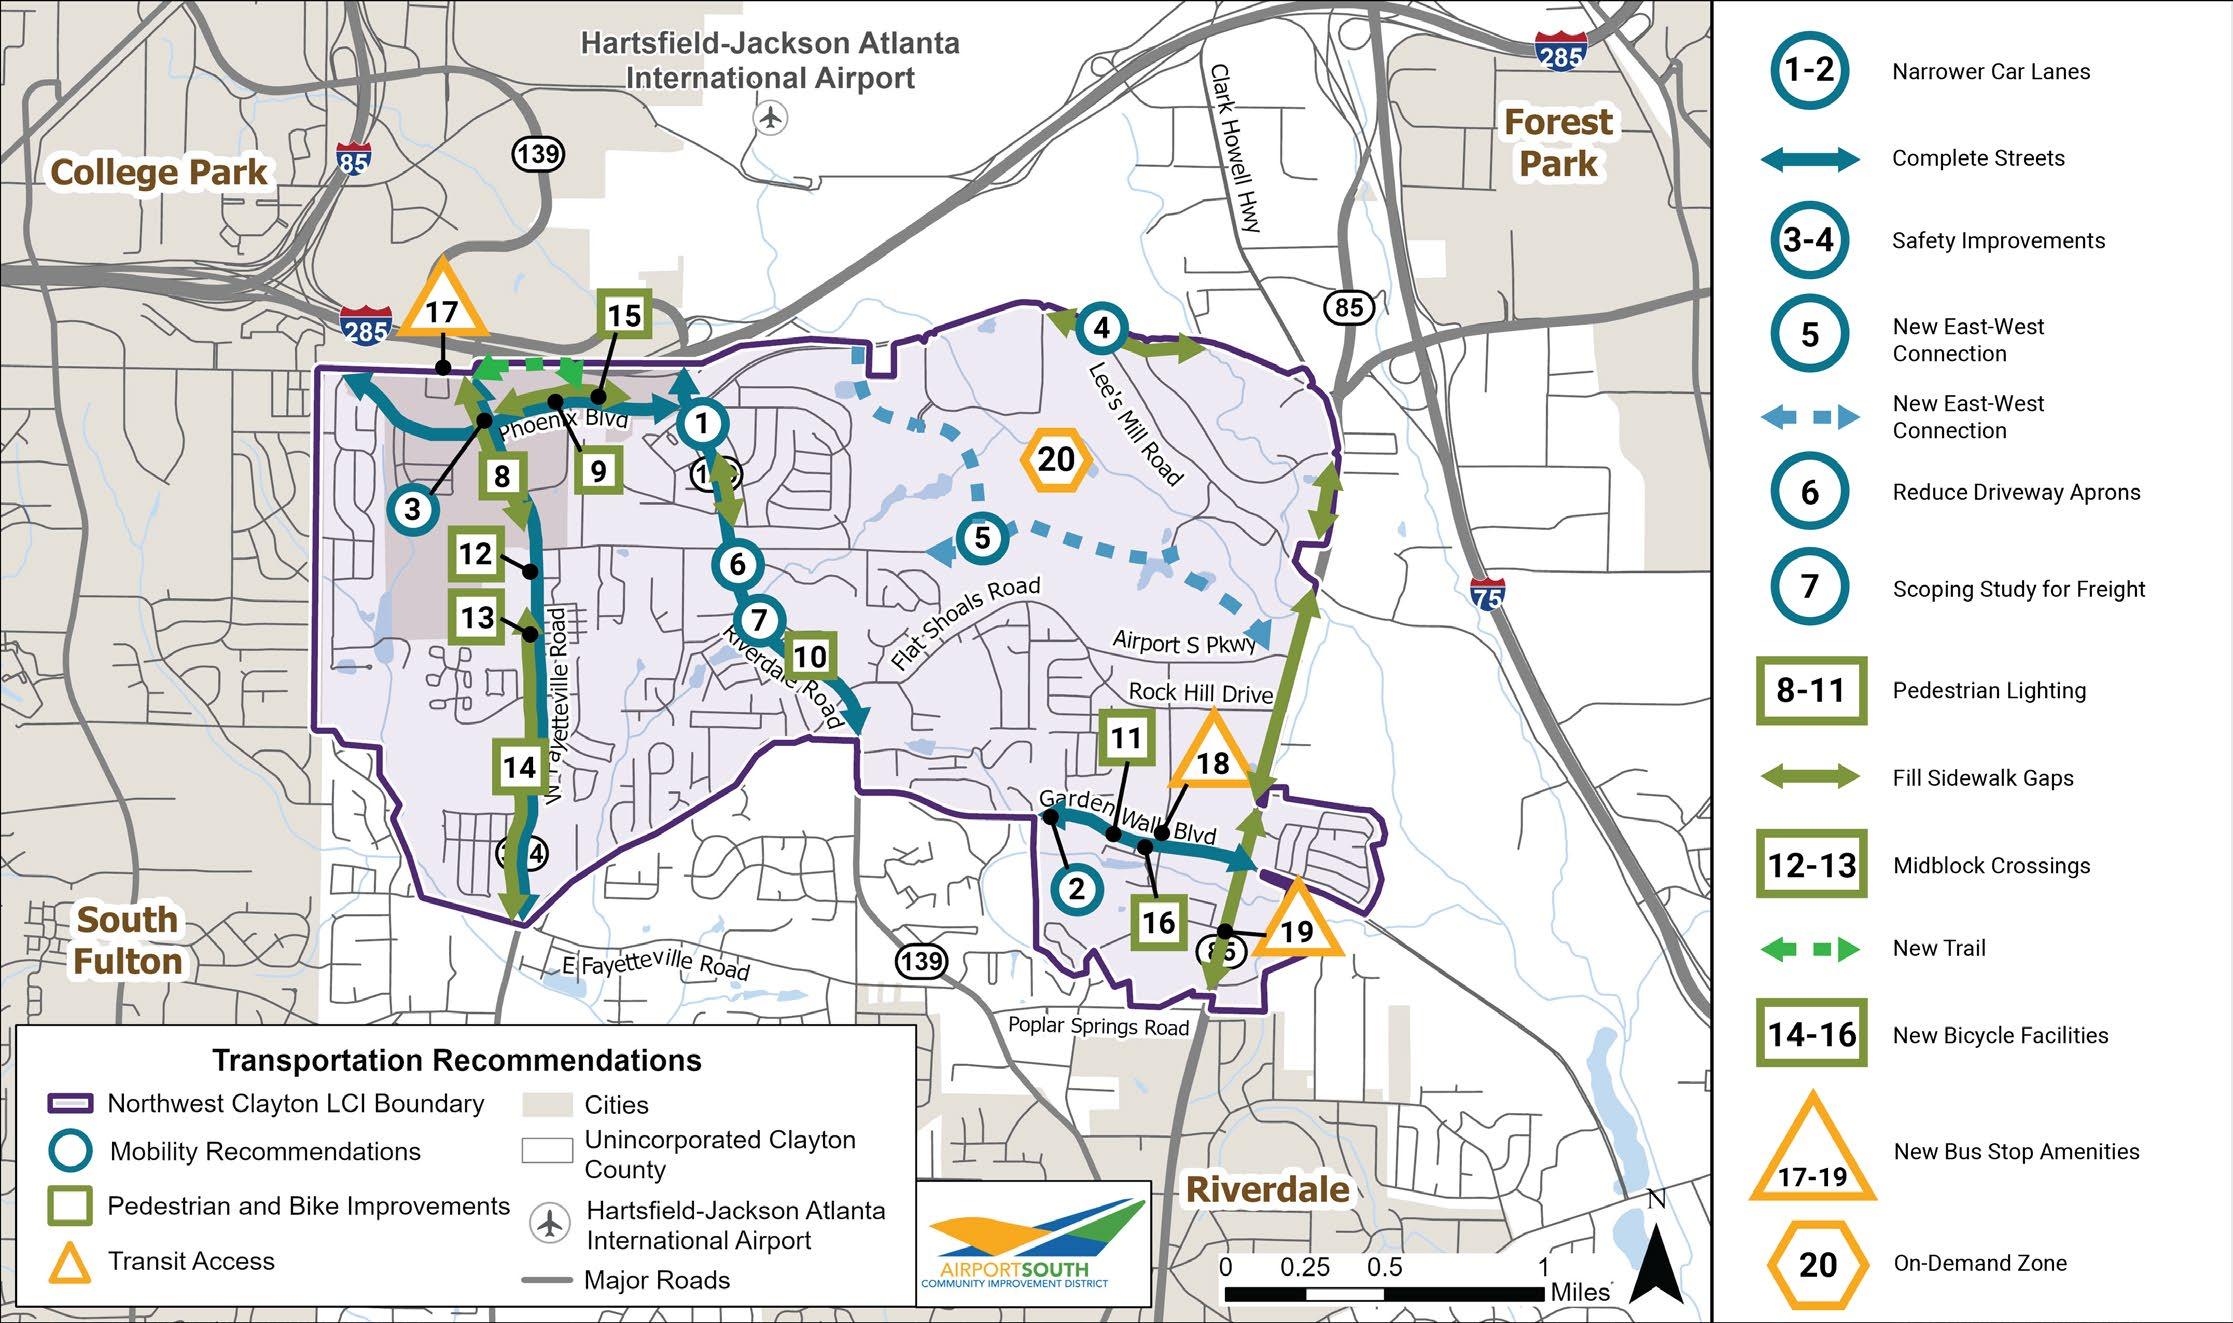
Recommendations are shown in Figure 1-6. These recommendations are also delineated in separate plans: The Priority Project List, 100-Day Action, Five-Year Implementation Plan, and Long-Term Implementation Plan, in Table 1-1 through Table 1-4
Figure 1-6: Recommendations in the Study Area
T-4 N/A
T-5 12-13
T-6 14-16
Multimondal Network Plan
Multimodal Safety Improvement
Multimodal Network Plan
T-12 N/A Transit Study
ED-2 21-23 Catalytic Sites
PM-1 N/A Placemaking Study
Recommendations in the Priority Project List, Five-Year and Long-Term Implementation Plans are numbered based on strategy type: Transportation (T), Economic Development (ED), and Placemaking (PM). #
4 N/A Litter Management Coordination
Adopt a complete streets approach for key corridors
Add midblock crossings at schools on W. Fayetteville Road
Conduct Multimodal Network Plan to fill in missing sidewalk gaps along key corridors, connect roadwayadjacent pedestrian and bicycle infrastructure to existing and planned trail networks, new bicycle facilities
More transit connectivity options
Rezone parcels in catalytic sites to support transitoriented development and higher density uses
Develop a system for wayfinding, streetscape enhancements, green infrastructure, and placemaking opportunities
Coordinate with Clayton County for enhanced trash management and to reinstate the Keep Clayton Clean & Beautiful Program
Catalytic sites are parcels clustered together, chosen based on location, existing properties, and potential synergy with the surrounding area. Based on this criteria, three catalytic sites were developed: 1) Godby Road, 2) Riverdale Road/Norman Drive, 3) The Quarry. The recommendation is that the sites foster redevelopment and transit-oriented development investments through new land use and zoning policies. These catalytic sites should address many of the needs expressed in the Study area by providing more of:
• Daycares
• Office space
• Restaurants
• Housing Options
• Greenspace
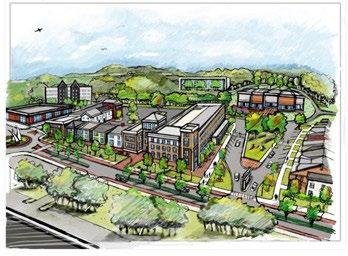
Figure 1-7 shows a concept of what Site One could look like with new development encouraged by zoning and land use changes in the Study area. Figure 1-8 displays where the catalytic sites are in relation to the Study area.
Figure 1-7: Catalytic Site One Concept Rendering
T-1 1-2
T-2 4
T-3 6
Safety Riverdale Rd/ Garden Walk Blvd Narrower car lanes
Safety
Safety
T-4 N/A Multimodal
Forest Pkwy/Lee's Mill Rd
Riverdale Rd
Godby Rd/ Phoenix Blvd, Riverdale Rd, W. Fayetteville Rd, and Garden Walk Blvd
Safety improvements at Forest Parkway at Lee's Mill Road
Conduct Access Management Study to minimize and consolidate driveway aprons and right turn lanes on Riverdale Road
Adopt a complete streets approach for key corridors
T-5 12-13 Multimodal W. Fayetteville Rd Add midblock crossings at schools on W. Fayetteville Road
T-6 14-16 Multimodal
Study Area; Key Corridors: Godby Rd/Phoenix Blvd, Riverdale Rd, W. Fayetteville Rd, and Garden Walk Blvd
Conduct Multimodal Network Plan to fill in missing sidewalk gaps along key corridors, connect roadway-adjacent pedestrian and bicycle infrastructure to existing and planned trail networks, new bicycle facilities
T-7 N/A Multimodal Walker Creek Road New trail – Walker Creek Road Trail - .40 miles
T-8 7 Freight
PM-1 N/A Placemaking
Riverdale Rd Support a State Route (SR) 139/Riverdale Road scoping study for freight
Study Area
PM-2 8-11 Beautification
Godby Rd/ Phoenix Blvd, Riverdale Rd, W. Fayetteville Rd, and Garden Walk Blvd
PM-3 N/A Placemaking Study Area
Develop guidelines for wayfinding, streetscape enhancements, green infrastructure, and placemaking opportunities
Develop a beautification and placemaking plan to add street trees and landscaping on selected corridors, provide street furniture and pedestrian-scale lighting
Create an Art’s Framework Master Plan to incorporate public art
T-11 5 Study Area
ED-1 21-23 Zoning
Add new street connections and intersections where possible
Catalytic Sites Foster redevelopment and TOD investments through new land use and zoning policies at catalytic sites
ED-2 N/A Zoning Catalytic Sites Rezone parcels in catalytic sites to support transit-oriented development and higher density uses
LU-1 N/A Zoning
Catalytic Sites/ Study Area
H-1 N/A New Program Study Area
PM-4
Study Area
PM-6 N/A Study Area
Provide a variety of land uses within the study area, including greenspace where appropriate
Develop Housing Task Force to incorporate a mixture of housing types into the study area, encourage multi-family housing to increase density in the study area, add workforce housing to provide affordable housing in the study area
Establish gateway features in study area for two gateways
Incorporate additional greenspace, pocket parks and playgrounds

The Study is sponsored by ASCID. A CID is an association of property owners in a defined area that utilizes self-imposed tax revenues from commercial districts to fund improvements within the district’s boundaries. CIDs seek to improve business development opportunities and enhance property values by funding:
• Street and road construction and maintenance,
• Parks and recreational areas and facilities,
• Stormwater and sewage collection and disposal systems,
• Systems for the development, storage, treatment, purification, and distribution of water,
• Public transportation, and
• Terminal, dock, and parking facilities.
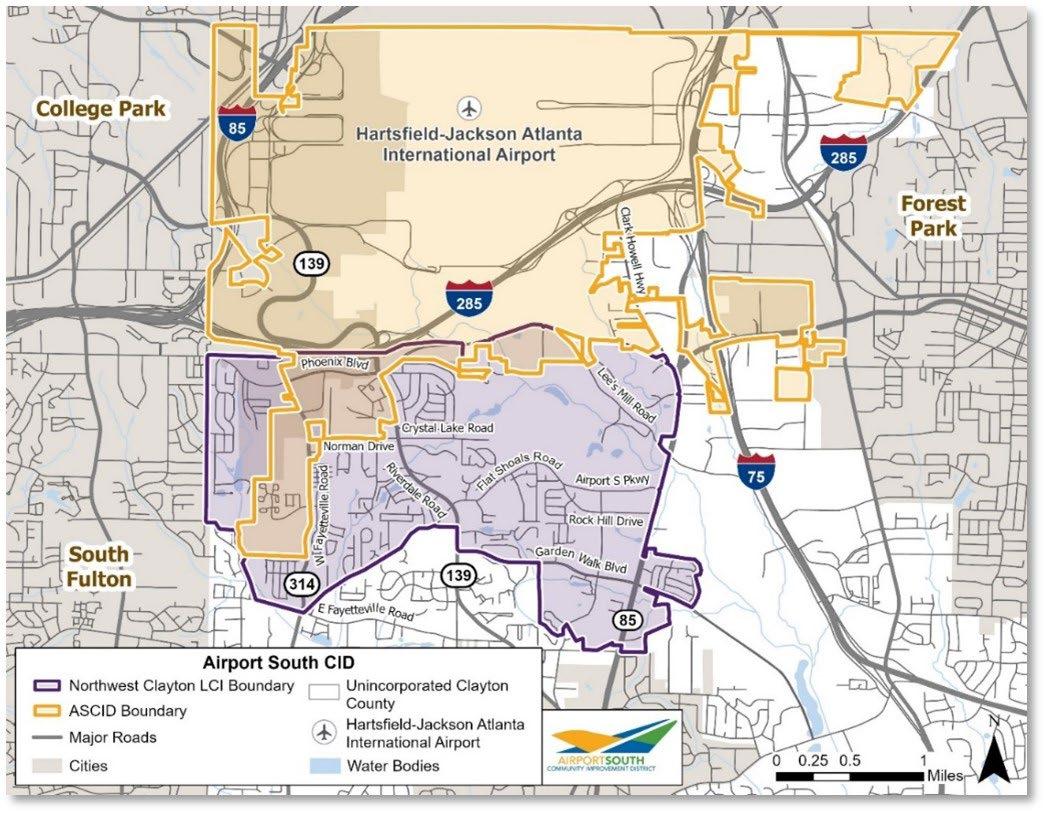
AACIDs is comprised of Airport West CID (AWCID) and Airport South CID (ASCID), collectively encompassing approximately 15.5 square miles. AWCID, which is located in Fulton County, includes portions of the cities of Atlanta, College Park, East Point, Hapeville, and South Fulton. Airport South CID is located in Clayton County and includes portions of the cities of College Park and Forest Park. Together, both AWCID and ASCID are committed to creating economically strong, safe, attractive, and vibrant communities surrounding HJAIA. Under AACIDs, beautification, public safety, transportation infrastructure, technology, transit, and signage and wayfinding projects are prioritized. Figure 2-1 displays the ASCID boundary.
The LCI is a grant program established in 2000 by the Atlanta Regional Commission (ARC). The LCI program was established as a means to reduce the overall vehicle miles traveled and improve air quality within the 11-county Atlanta Metro region. The LCI program supports re-envisioning communities as vibrant, walkable places that offer increased mobility options, encourage healthy lifestyles, and provide improved access to jobs and services. ARC’s LCI program provides funding for planning studies as well
as implementation projects, allocating federal funds to cover 80 percent of project costs with a 20 percent required local match.
The LCI program has three main goals:
1
1. Encourage the co-location of diverse housing, employment, recreational, and cultural amenities at major transit, local, and regional centers for people of all ages, abilities, and income levels.
2 3
2. Enhance access to a range of travel modes including transit, roadways, walking, and biking and increase connectivity and improve access for all users.
3. Foster public-private partnerships and sustained community support through an outreach process that promotes the involvement of all stakeholders, including community-based organizations and those who are historically underserved or underrepresented.
Northwest Clayton LCI
The Northwest Clayton LCI Plan (2004) by Clayton County, was the first LCI plan for NW Clayton County. At the time, the area was faced with challenges, such as the construction of the fifth runway at HJAIA and traffic congestion. The plan also considered the largescale redevelopment of the Cherry Hills subdivision. The goal of the 2004 NW Clayton LCI Plan was the implementation of a plan that would aid in the redevelopment of this changing area and support a community where individuals can live, work and play. The plan made a number of recommendations including:
• Transportation projects including the traffic signal feasibility study at the intersection of SR 314/West Fayetteville Road and Pleasant Hill Road,
• Updates to the Clayton County Zoning Ordinance to support mixed-use development, multi-family housing, and other zoning amendments,
• Parks and trails master plan, a county-wide planning effort including the Study area,
• Landscape design standards and a tree protection ordinance,
• Policies to require utilities to be placed underground in specific areas, and
• Tax allocation districts and Enterprise Zones to attract new development and investments.
The Northwest Clayton LCI Five-Year Plan Update (2011) by Clayton County continued the direction of the 2004 plan to implement some of the recommendations not yet actualized in the Study area. The area (and country) faced an economic downturn in 2008, preventing many recommendations from the previous plan from taking shape. The plan developed a five-year work program including recommendations from the previous plan and additional projects and initiatives to be implemented in the future:
• Sidewalk and streetscape projects on Riverdale Road, Phoenix Boulevard, and Flat Shoals Road,
• Study of the I-285 interchange in the Cherry Hills area,
• Extending Pleasant Hill Road to SR 314/W. Fayetteville Road,
• Need for transit service in the area,
• Completion of trails from Clayton County’s Greenway Trail Master Plan,
• Creation of Cherry Hills Redevelopment Task Force, and
• Adjustments to the future land use map.
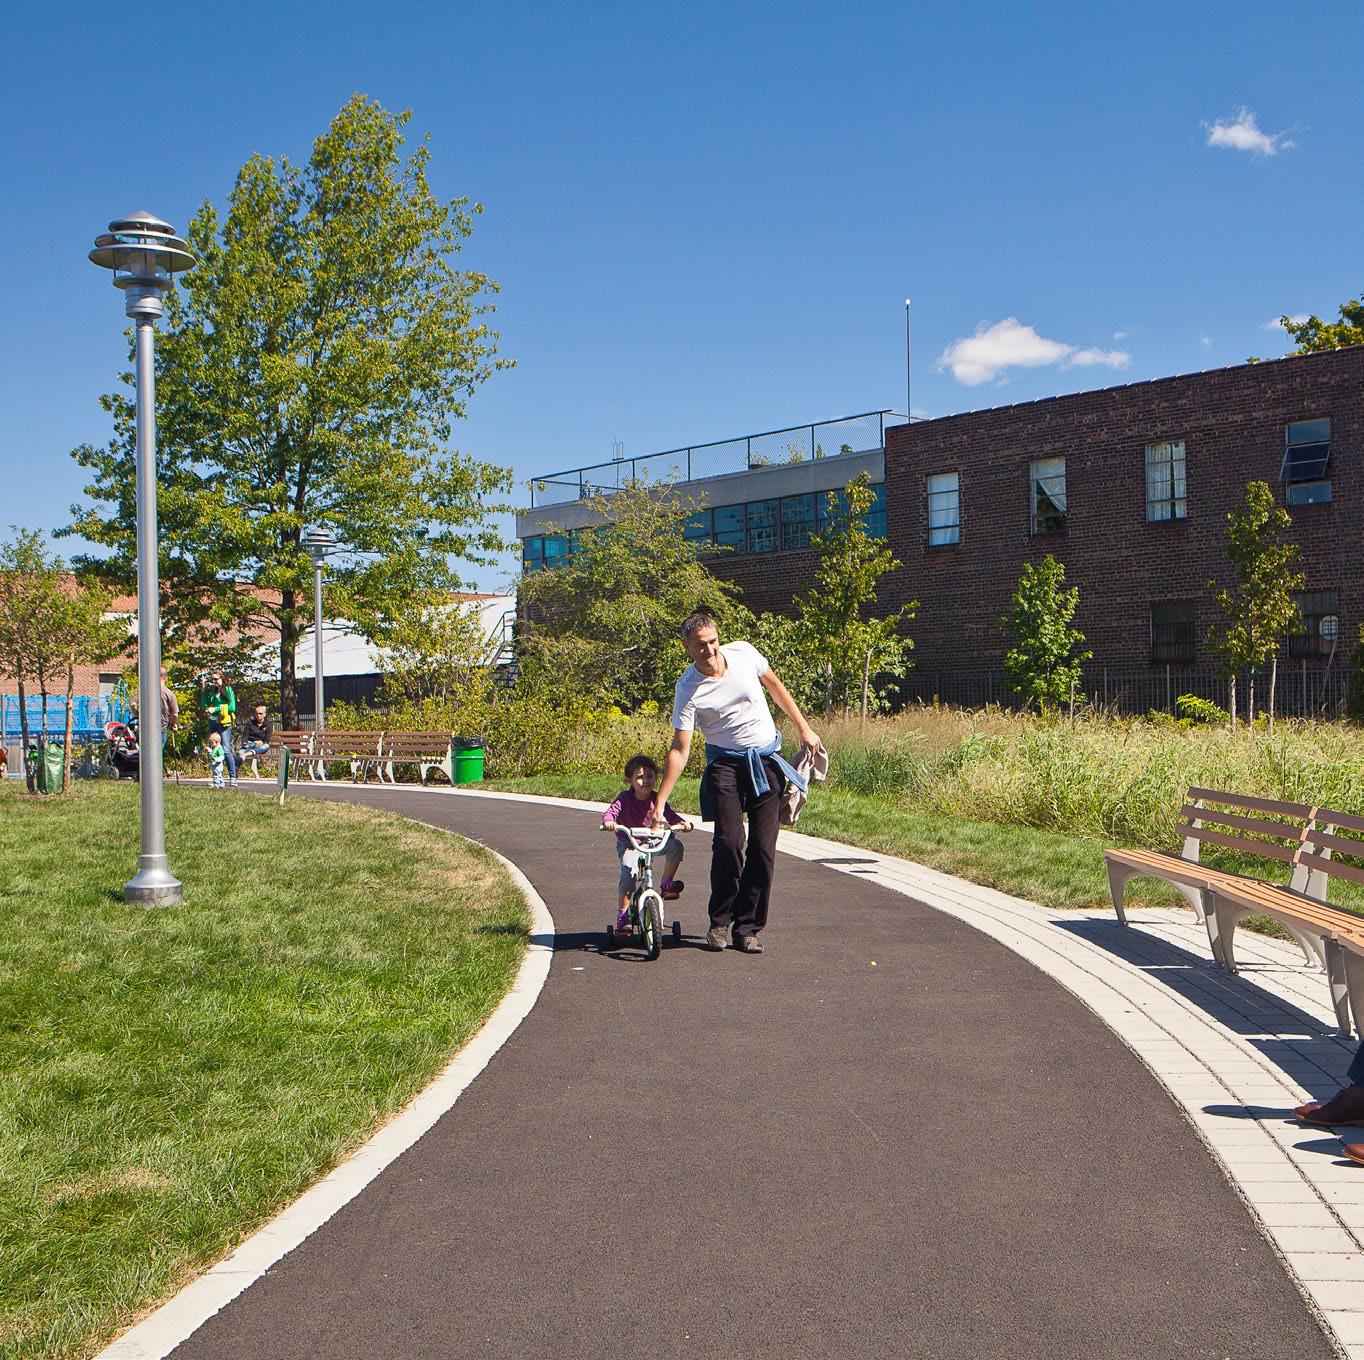
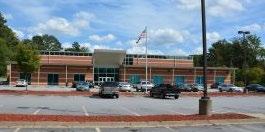
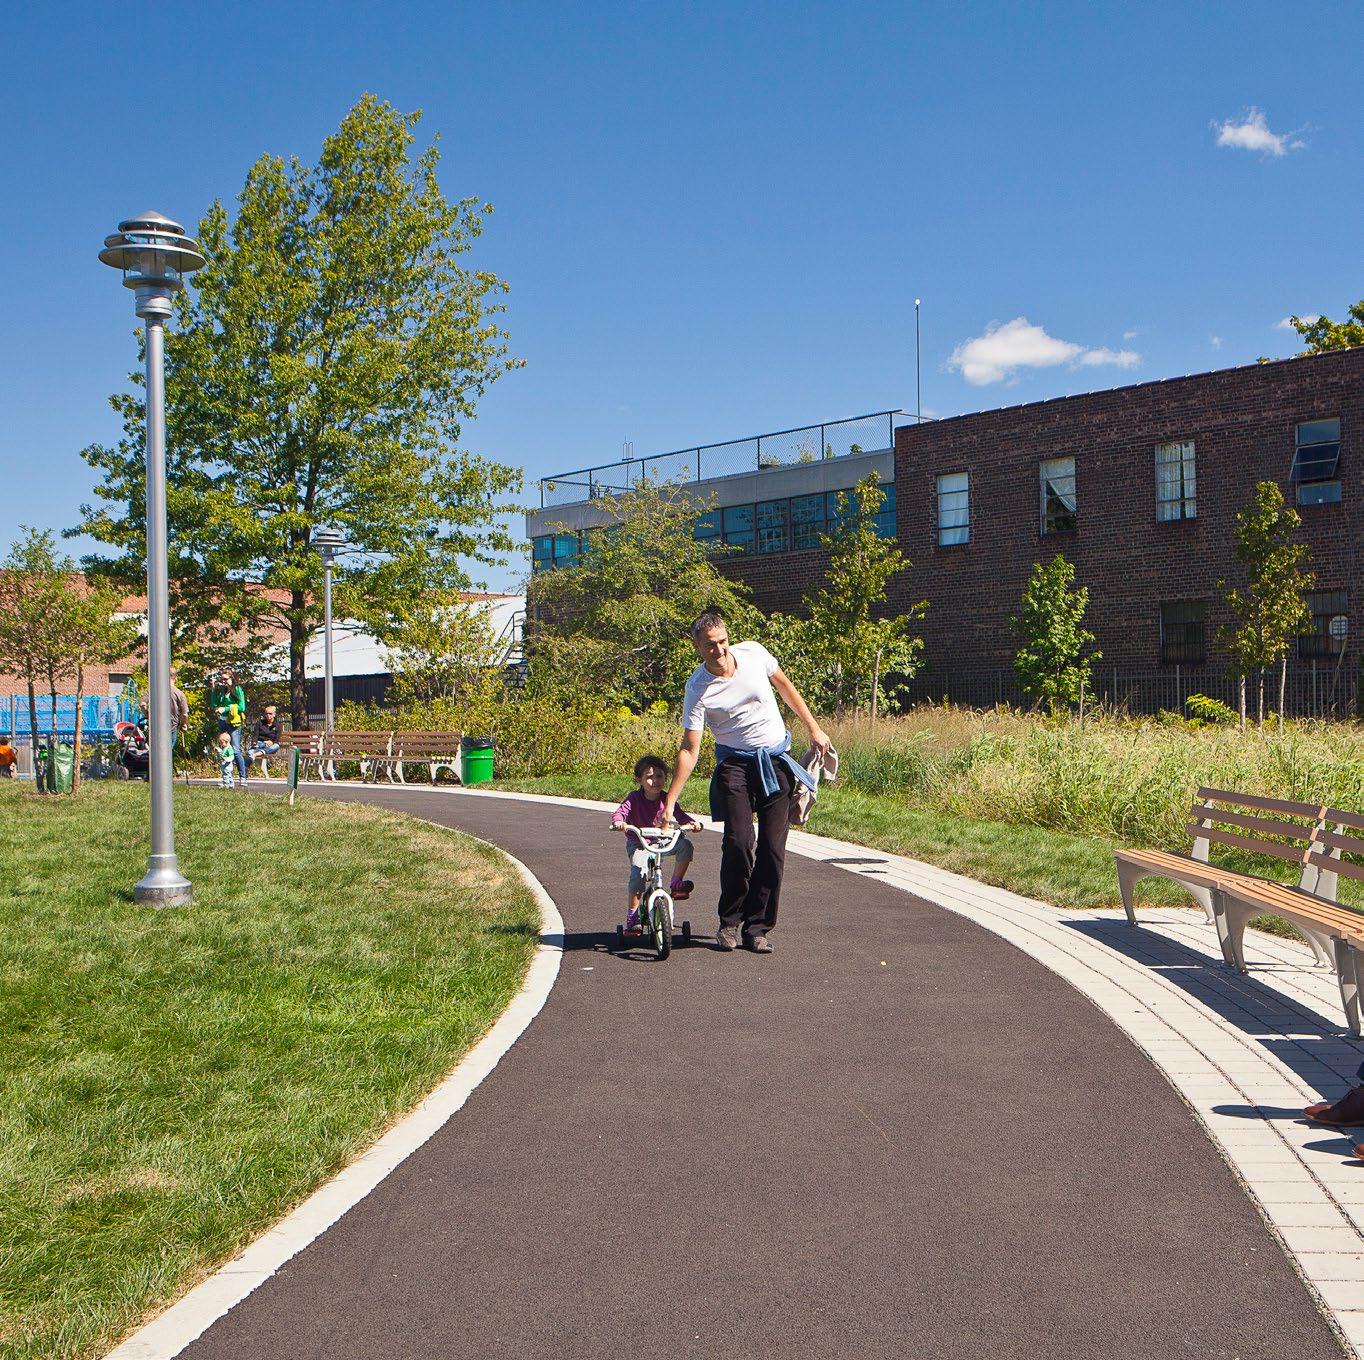
Several actions were completed from the previous LCI plans, as indicated in Table 2-1. One transportation action was completed with the construction of the Virginia Burton Gray Recreation Center, shown in Figure 2-2. which is less than a half mile away outside the Study area. Also, one housing initiative was completed when two changes to the Zoning Ordinance for Clayton County were made in July 2008: (1) to allow mixed use developments; and (2) creation of construction and design standards for new and redeveloped multi-family housing. Additionally, other types of actions were also completed, such as a Parks and Trails Master Plan in 2008 and 2015, landscape design standards, an underground utilities policy, zoning amendments, and Tax Allocation Districts (TAD) and Enterprise Zones in the Study area.
County
Adopt city and county policies requiring utilities serving new development and redevelopment within the study area by located underground
Develop an Urban Redevelopment Plan for the Cherry Hills area consistent with this plan
Implement TAD and Enterprise Zones within the Study Area to help entice redevelopment in the Study Area
Rezone the area south of North Clayton Middle School on W. Fayetteville Road and the area near the intersection of W. Fayetteville and E. Pleasant Hill Roads from light industrial to an appropriate residential zoning classification
Rezone the land at the southwest corner of the intersection of W. Fayetteville and E. Pleasant Hill Roads from light industrial to neighborhood commercial
Tax Allocation District 2006
Zoning 2005-2006
Zoning 2005-2006
Source: 2004-2011 LCI Plan
Transportation
Economic Development
The NW Clayton LCI Study area is located in the northwest corner of Clayton County, south of HJAIA. It is bordered by the cities of College Park, South Fulton, and Riverdale as well as by Fulton County. The Study area measures approximately five square miles, with 92 percent of the Study area falling within unincorporated Clayton County and the remaining eight percent of the Study area falling within the City of College Park. The following sections provide insight into the Study area with key demographics and destinations. This section also analyzes the study area’s urban design elements including land use, pedestrian/bicycle facilities, roadway network, transit, economic development, and community development and placemaking.
Several demographic data were collected for the Study area including population, employment, and commuting statistics. Categories for which the Study area is higher than Clayton County include minority population (97.9 percent compared to 91.4 percent); low-income individuals (23.0 percent compared to 16.9 percent); zero-car households (13.8 percent compared to 7.4 percent); unemployed population (5.9 percent compared to 4.5 percent); and populations that commute by transit (10.9 percent compared to 3.2 percent). These statistics are shown in Table 3-1.
Source: United States (U.S.) Census Bureau 2022 American Community Survey (ACS) 5-Year Data
The top industries in the Study area are displayed in Table 3-2. Approximately 66 percent of the Study area’s employed population ages 16 and over are employed in the top five industries: educational services, and health care and social assistance (17.5 percent); arts, entertainment, and recreation, and accommodation and food services (14.5 percent); transportation and warehousing, and utilities (13.8 percent); retail trade (10.4 percent); and professional, scientific, and management, and administrative and waste management services (10.0 percent).
The Other Services (except Public Administration) sector comprises establishments engaged in providing services not specifically provided for elsewhere in the classification system. Establishments in this sector are primarily engaged in activities, such as equipment and machinery repairing, promoting or administering religious activities, grantmaking, advocacy, and providing drycleaning and laundry services, personal care services, death care services, pet care services, photofinishing services, temporary parking services, and dating services.1
Source: U.S. Census Bureau 2022 ACS 5-Year Data and Bureau of Labor Statistics
1 Bureau of Labor Statistics, Other Services (except Public Administration): NAICS 81. https://www.bls.gov/iag/tgs/iag81.htm
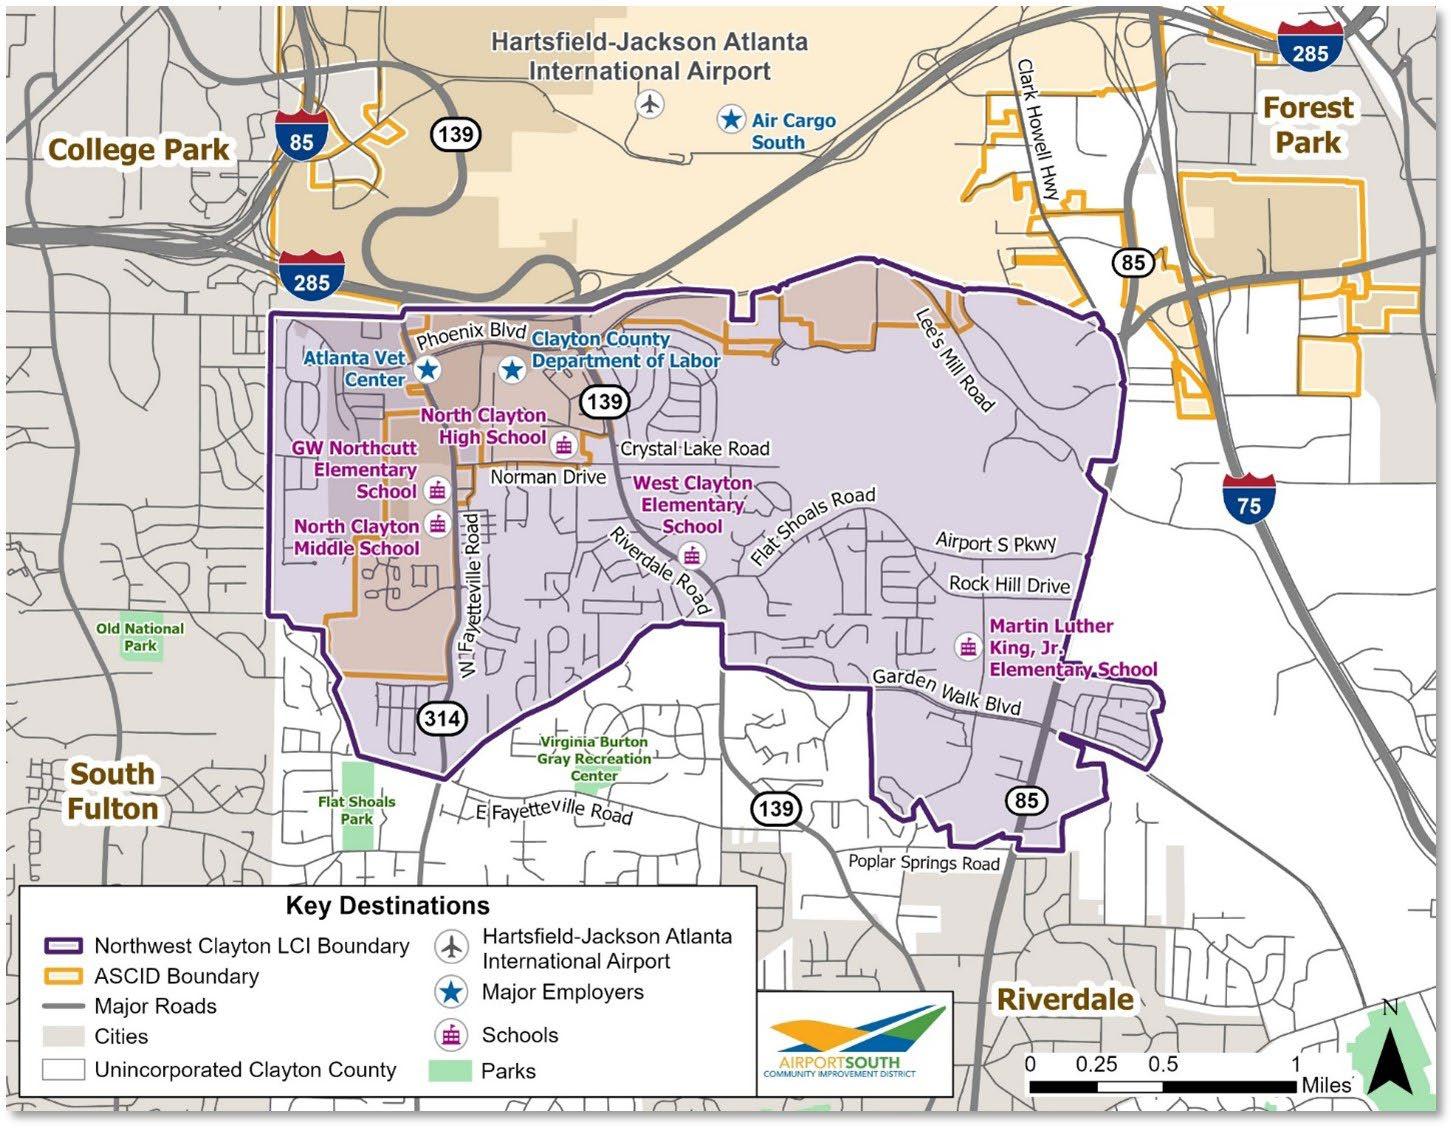
Key destinations in the Study area, presented in Figure 3-1, include major employers, the Atlanta Vet Center, and the Clayton County Department of Labor. The Atlanta Vet Center is one of Atlanta Metro’s Veterans Affairs centers, providing veterans, service members, and their families with counseling for various needs.2 The Clayton County Department of Labor serves as a career center for Clayton, Fayette, and Henry Counties.3 Air Cargo South is a significant major employer located just north of the Study area.
Air Cargo South is one of three cargo facilities at HJAIA that handles cargo, complete with its own bays for loading and unloading the aircraft, refueling and support systems, and dockside access to the surrounding interstates.4 Other key destinations are public schools. Within the five-mile study area, there are five public schools: GW Northcutt Elementary School, Martin Luther King, Jr. Elementary School, West Clayton Elementary School, North Clayton Middle School, and North Clayton High School.
2 U.S. Department of Veterans Affairs, Atlanta Vet Center. https://www.va.gov/atlanta-vet-center/
3 Georgia Department of Labor, Find a Career Center. https://dol.georgia.gov/locations/career-center
4 South Fulton Chamber of Commerce, Hartsfield-Jackson Gateway to Global Commerce. https://www.southfultonchamber.com/economicdevelopment/hartsfield-jackson-air-cargo
The following section details the existing transportation network in the Study area. These include roadways, pedestrian and bicycle facilities, and public transportation. The full transportation assessment is located in Appendix B.
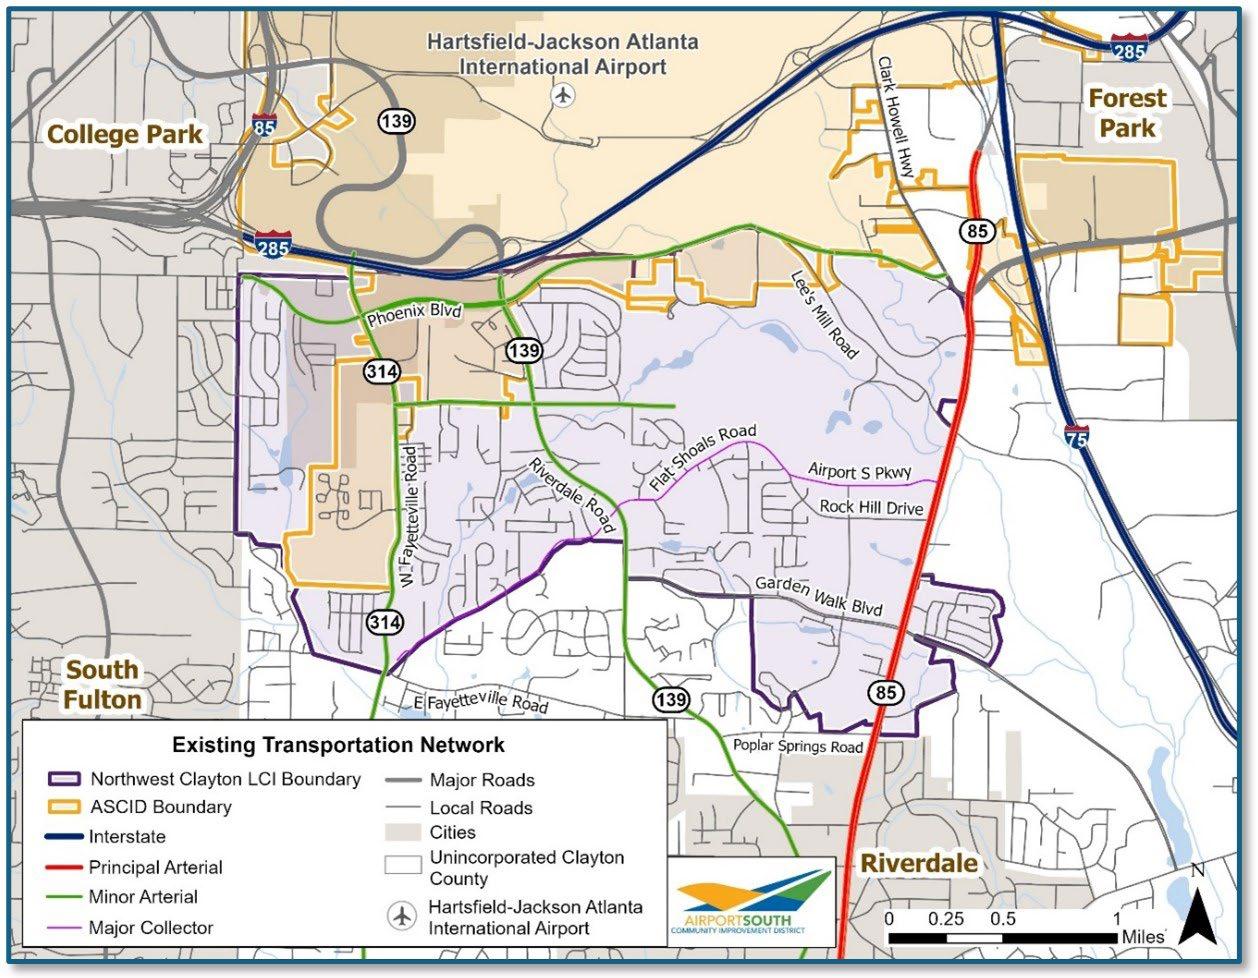
The existing road network system in the Livable Communities Initiative (LCI) Study area has a variety of roads including arterials, collectors, and locals, as shown in Figure 3-2. Table 3-2 lists the current roadway facilities in the Study area and indicates their functional class, directions, and number of travel lanes. The Study area has three state routes, which
are also major north/south roadways: State Route (SR) 314/W. Fayetteville Road, SR 139/Riverdale Road, and SR 85. The east/west roadways consist of Phoenix Boulevard, Norman Drive, Flat Shoals Road, and Garden Walk Boulevard. According to the Georgia Department of Transportation (GDOT) Traffic Analysis and Data Application (TADA), the state routes also had the highest Average Annual Daily Traffic (AADT): SR 314/W. Fayetteville Road (18,800), SR 139/Riverdale Road (34,300), and SR 85 (43,800), compared to Phoenix Boulevard (9,930) and Flat Shoals Road (5,080). The AADT was not counted for Norman Drive and Garden Walk Boulevard. State routes are also the major truck routes in the Study area with AADTs consisting of: SR 314/W. Fayetteville Road (504), SR 139/Riverdale Road (934), and SR 85 (2,617).
Source: ASCID
Crash density data, obtained from Numetric American Association of State Highway and Transportation Officials (AASHTO) AASHTOWare Safety, was also analyzed as a part of the study. The crash density analysis looked at vehicle and pedestrian crash incident data between the years of 2018 and 2020. Figure 3-3 shows that most vehicle crashes occurred on SR 139/Riverdale Road and SR 85 where most vehicle traffic is present. Top vehicle crash intersections between 2018 and 20205 are listed below:
• SR 139/Riverdale Road and Flat Shoals Road (217 crashes in total)
• SR 85 and Forest Parkway (192 crashes)
• SR 139/Riverdale Road and Norman Drive/ Crystal Lake Road (194 crashes)
• SR 139/Riverdale Road and SR 331/Forest Parkway/Phoenix Boulevard (172 crashes)
• SR 139/Riverdale Road and Garden Walk Boulevard (171 crashes)
• SR 85 and Garden Walk Boulevard (167 crashes)
An analysis of pedestrian crash density for the same time period revealed that these state routes also have the highest pedestrian crash density. Figure 3-4 provides the location and density of pedestrian crashes for the period of 2018 to 2020 at intersections and midblock sections in the Study area. More detailed information on the vehicle and pedestrian crashes is available in Appendix E.
• SR 139/Riverdale Road and Garden Walk Boulevard (9 crashes)
• SR 85 and Garden Walk Boulevard (8 crashes)
• SR 139/Riverdale Road (12 crashes)
• Garden Walk Boulevard (3 crashes)
5 The number of crashes at the intersections were estimated based on a clustering of individual incident records happened from 2018 to 2020.
3-3: Vehicle Crash Density in the Study Area
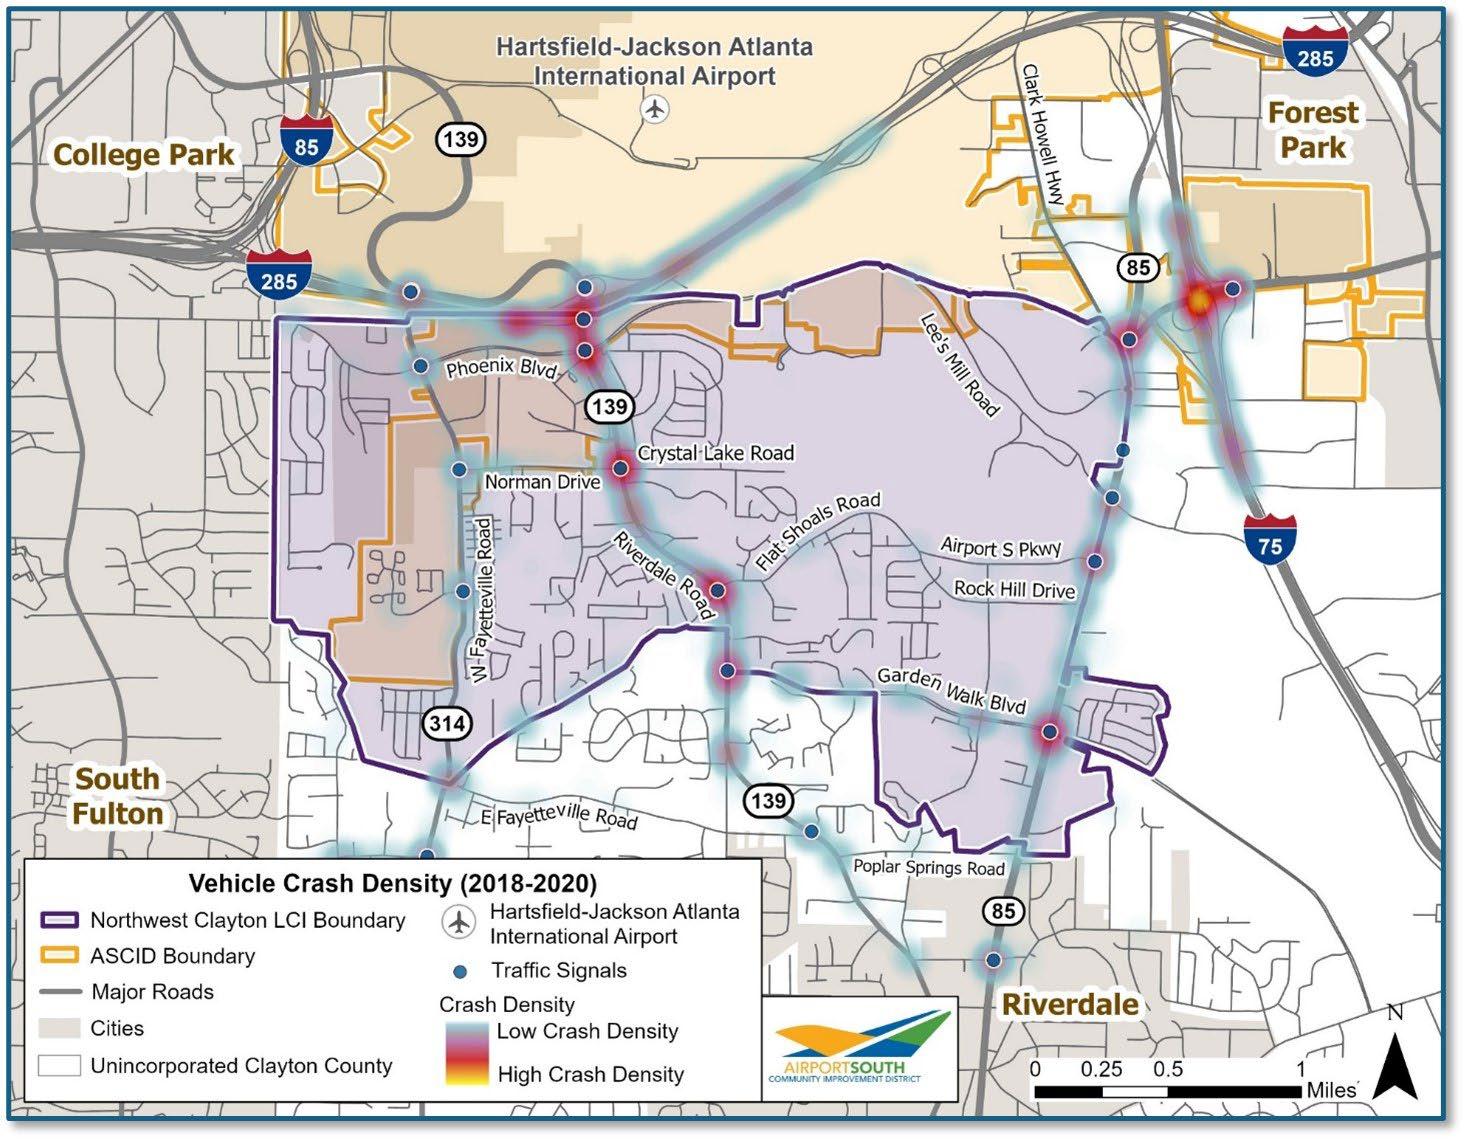
Source: Numetric AASHTOWare Safety
3-4: Pedestrian Crash Density in the Study Area
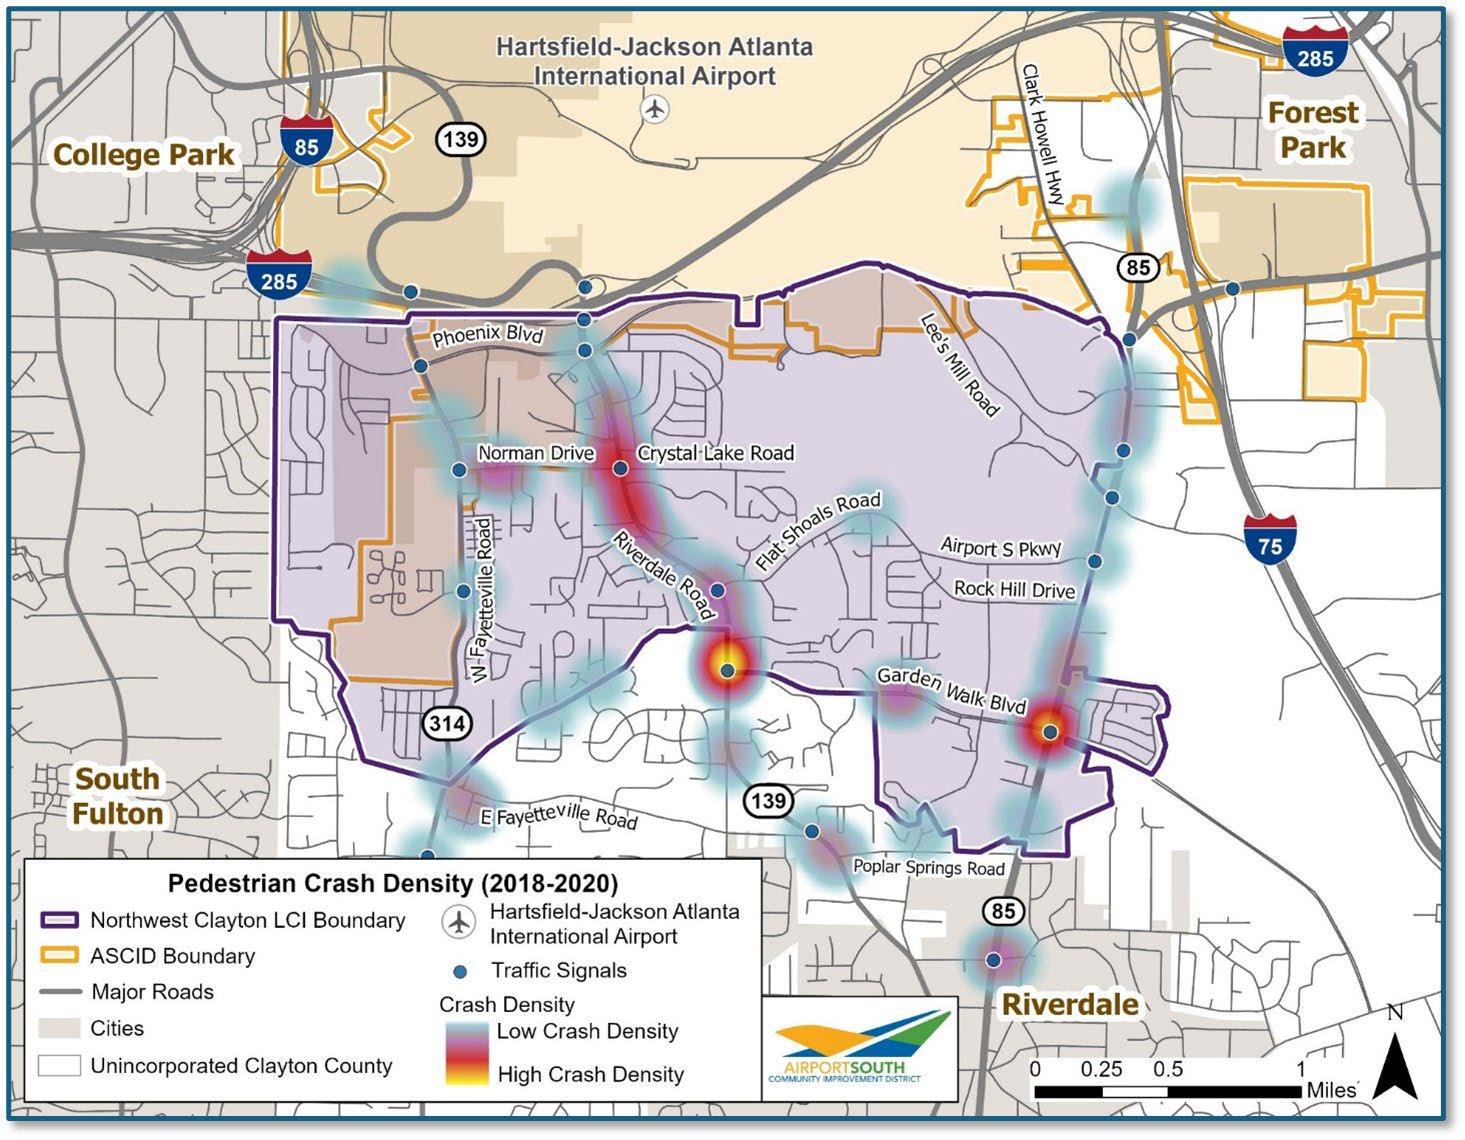
Source: Numetric AASHTOWare Safety
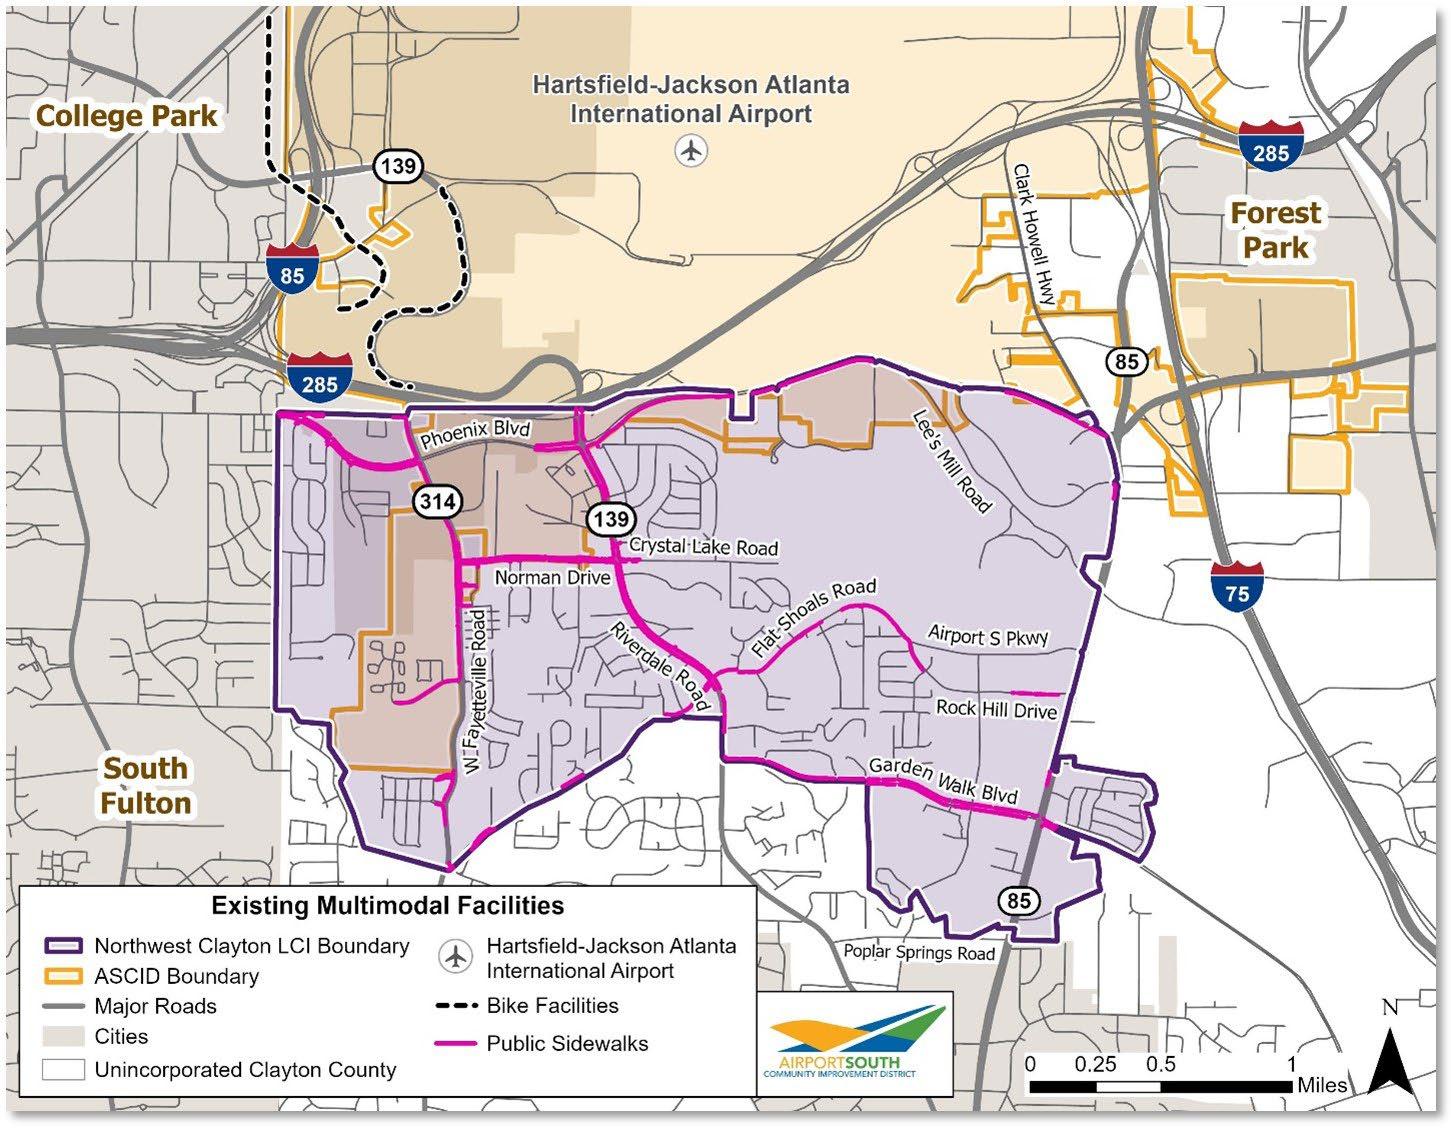
Currently, there are no bicycle facilities in the Study area; the closest are bicycle lanes on SR 139/ Riverdale Road and Phoenix Trail crossing SR 139/ Riverdale Road, as shown in Figure 3-5. There are approximately 11 miles of public sidewalk in the Study area. According to the AeroATL Greenway Plan, Southern Fulton Comprehensive Transportation Plan, Clayton County’s Greenway Trail Master Plan, and the Regional Trail Vision, there will be approximately 38 miles of trail added to the Study area in the future. These improvements to the multimodal network also include bicycle and pedestrian improvements
on SR 139/Riverdale Road. More information on these improvements is available in Section 5.3 and Appendix B.

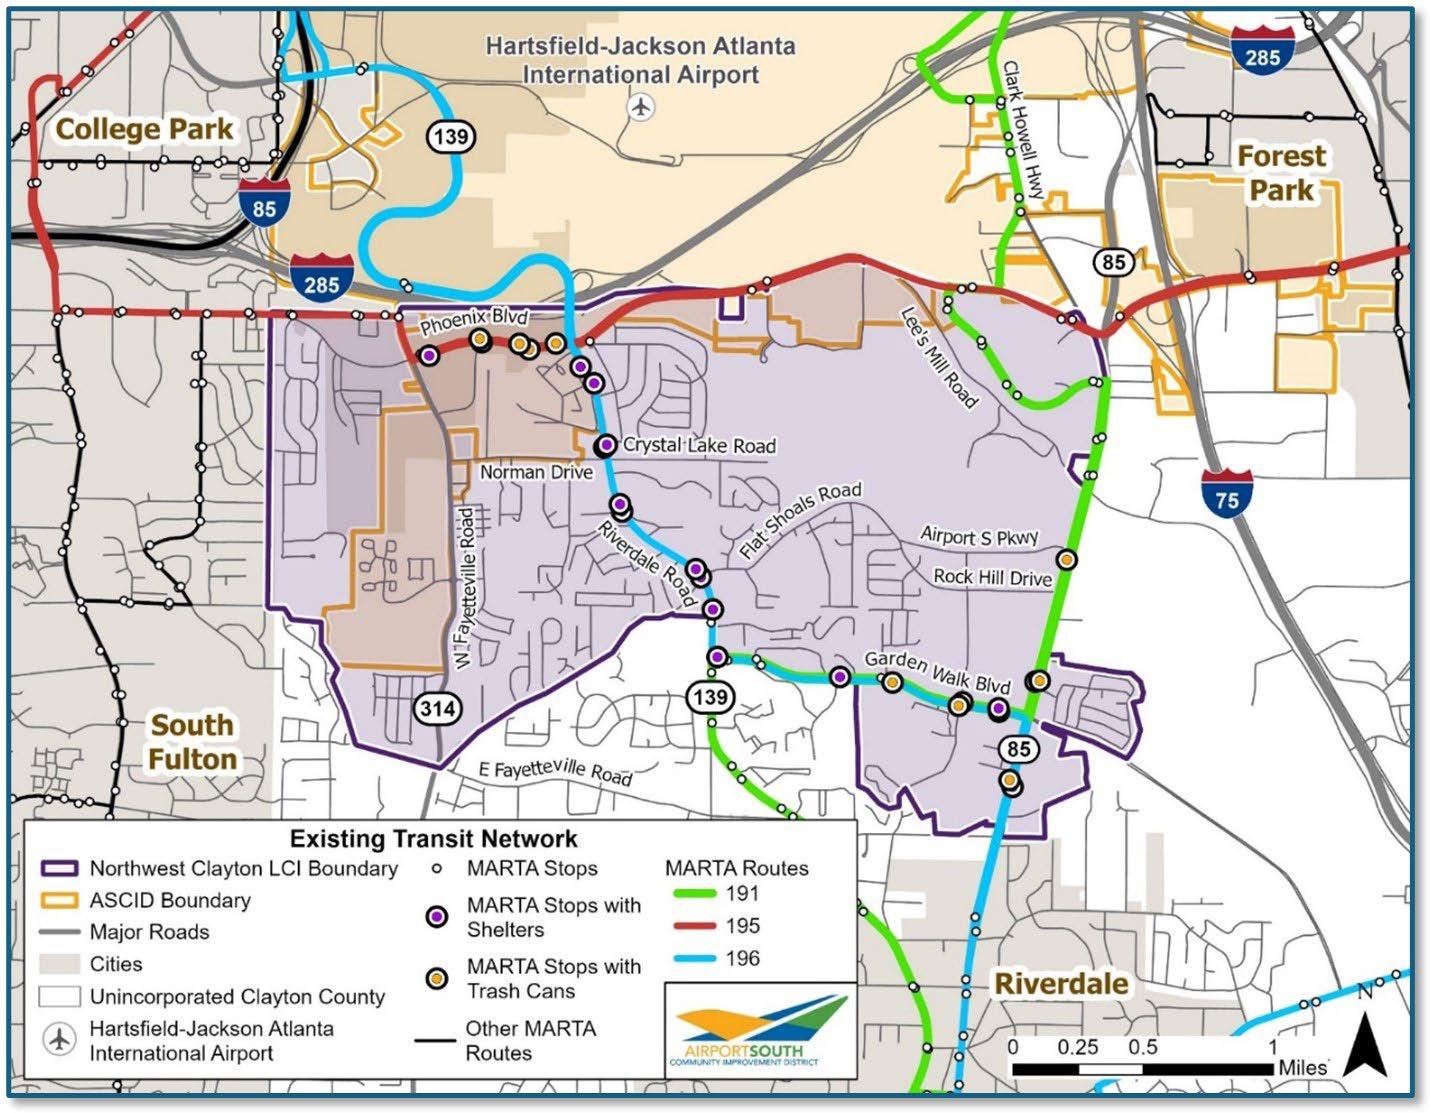
Existing transit in the Study area consists of MARTA’s three bus routes and 49 bus stops, as shown in Figure 3-6. The bus routes are as follows:
• Route 191 (Riverdale/HJAIA International Terminal) – Route 191 starts at Lakewood MARTA Station and runs north/south, ending at the Justice Center in Jonesboro on Tara Boulevard.
• Route 195 (Forest Parkway) – Route 195 begins at College Park MARTA Station and travels east/ west to loop around SR 331/Forest Parkway and Anvil Block Road.
• Route 196 (Upper Riverdale) – Route 196, starts at College Park MARTA Station and runs east/ west to Southlake Mall.
Future transit improvements within the Study area include RAPID Southlake, BRT route by MARTA traveling through the Study area on SR 139/Riverdale Road, Garden Walk Boulevard, and SR 85. The BRT will have six stations in the Study area: Riverwalk Lane, Norman Drive, Flat Shoals Road, Riverdale Road and Garden Walk Boulevard, Garden Ridge Drive, and Garden Walk Boulevard and SR 85.
Existing land use data for the Study area was gathered from the Clayton County Tax Assessor. The Study area contains about 3,000 acres of land, of which almost half is designated as residential (27 percent single-family and 17 percent multi-family) as shown in Table 3-4. Industrial and commercial land make up 10 percent and 7 percent of total land area, respectively. While residential land is spread out across the Study area, commercial land tends to cluster along major arteries such as Phoenix Boulevard, SR 139/Riverdale Road, and SR 314/W. Fayetteville Road, and industrial land is mostly located in the northern portion of the Study area closer to HJAIA (Figure 3-7). A significant portion of the land in the Study area, approximately 23 percent or 700 acres, remains vacant. Some of this
vacant land has topographic challenges preventing its development, such as creek corridors, floodplains, and uneven topography.
Source: Clayton County Tax Assessor
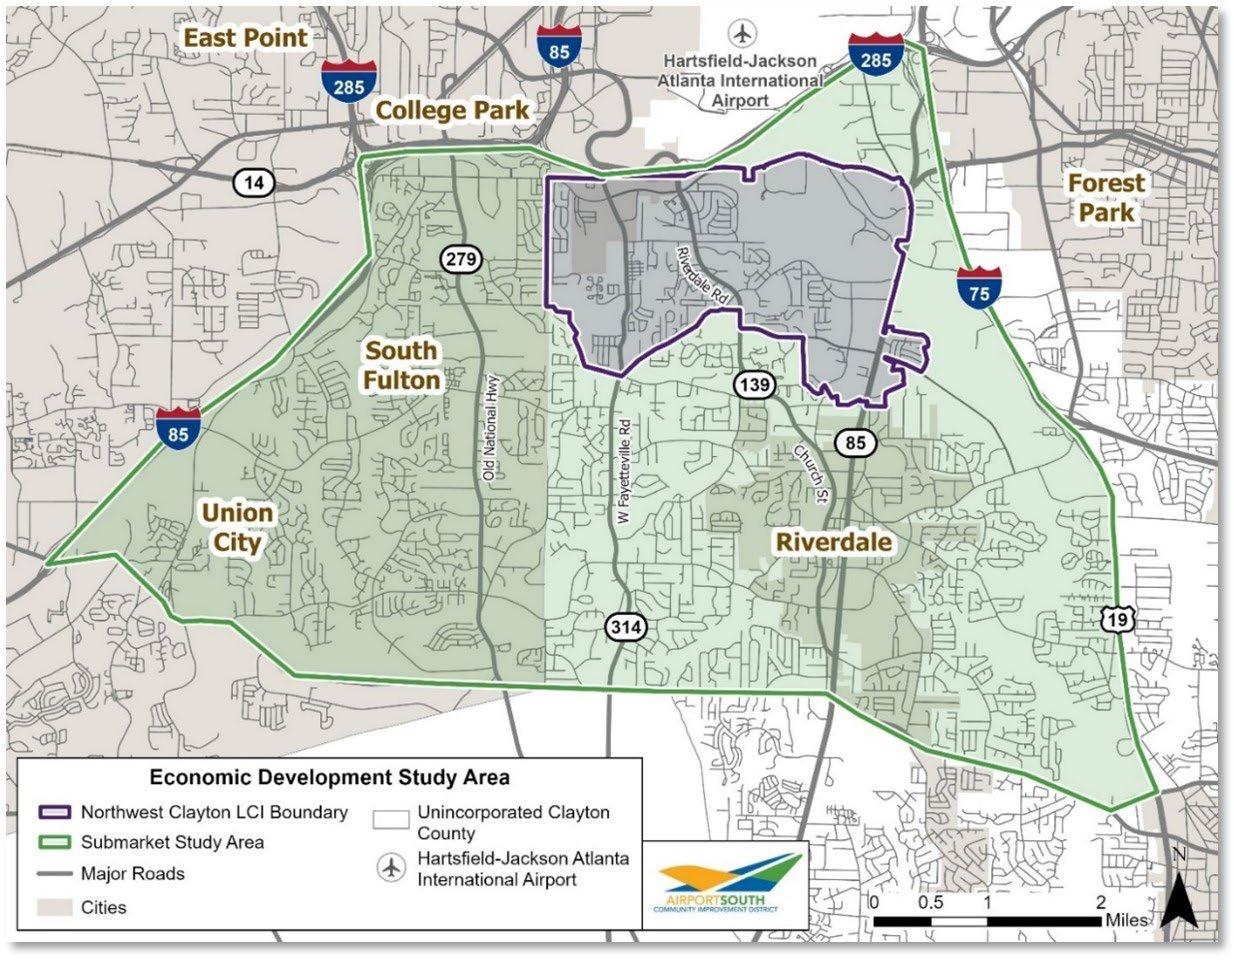
The project team conducted a real estate market analysis for a larger Submarket Study area, which surrounds the Northwest Clayton Livable Centers Initiative (LCI) boundary, displayed in Figure 3-8. This market analysis aimed to examine demographic, employment, and real estate trends across this larger Study area to identify opportunities for revitalization and reinvestment within the LCI boundary. The analysis also considered additional geographies as benchmarks to provide context for the analysis.
These additional geographies include:
• Clayton County
• The Atlanta-Sandy Springs-Roswell Metropolitan Statistical Area (MSA)
• A five-mile radius from the centroid of HJAIA to provide context regarding broader trends in play around the airport.
The analysis incorporated data from sources such as EMSI/Lightcast (employment), CoStar (real estate), and the U.S. Census Bureau (demographics) and integrated them into a Geographic Information Systems (GIS) framework to ensure that tract, point, or block-grouplevel data aligned closely with the Submarket Study area boundary. The full market analysis is located in Appendix C.
Source: EMSI/Lightcast, CoStar, and the U.S. Census Bureau
The market analysis concluded the following:
• While the Study area only represents 9 percent of Clayton County’s population; a quarter of the population increase since 2010 in the county occurred in the Study area.
• Median household income between 2010 (adjusted for inflation) and 2022 in the Submarket Study area and Clayton County remained flat over the 12-year period, while median household income in the MSA increased.
• Of the 22,000 jobs added in Clayton County between 2010 and 2022, the Submarket Study area accounted for 32 percent of these jobs.
• Real estate inventory, shown in Figure 3-9, is relatively older compared to noted benchmarks, with a majority of space having been built before 2000 across all product types: hospitality, multi-family, office, retail, and industrial. Over 50 percent of total inventory square footage belongs to multi-family in the Study area with more than four million square feet (SF) or 4,500 units.

The existing conditions analysis is to provide context to discussion of opportunity areas and catalytic sites, leveraged by the project team’s understanding of broader issues that will influence revitalization. Our national experience highlights a host of practical challenges to encouraging infill redevelopment along older commercial corridors which are found within the LCI study area. Long-standing challenges that have been in place well before the impact of the “great recession” include:
• Constraints created by smaller parcel sizes and older, obsolete buildings
• Unique challenges with commercial corridors in unincorporated areas, linked to limited / old infrastructure, extensive curb cuts, and inconsistent zoning.
• Older shopping centers with weak / vacant anchor tenants, excessive parking, and stores generally pushed back from streets, limiting visibility.
• Suburban communities familiar with the simplicity of greenfield development find that, as they approach build-out, existing entitlement and development review policies can actually make infill development more complex, and therefore more “risky”, as delays tend to impact pursuit of project financing.
Between 2010 and 2019, additional variables have come into play for these corridors:
• Retail markets have been uniquely challenged with the pre-Covid “retail apocalypse” linked to growth in online sales and a pivot from traditional brick and mortar to “omni-channel”, the significance of private equity ownership of retail, and a general oversupply of retail space. Covid has dramatically increased pressure on traditional retailers and accelerated the demise of department stores.
• Residential markets have struggled to recover from the recession, linked in part to sustained Millennial demand for apartments rather than single-family homes and condominiums. Post-Covid, there are clear expectations for a return to debate about access to reasonably priced housing in support of workforce development, with strategies specifically keying in on addressing “missing middle” gaps in local markets.
• While manufacturing activity has recovered strongly since 2010, the nature of manufacturing has changed (pivot toward advanced manufacturing and e-commerce linked warehouses), with companies favoring dedicated industrial areas to limit conflicts with residential uses. Covid is also expected to accelerate building trends that would favor accelerated reshoring of manufacturing back to the US.
Reflective of the real challenges of effecting change in these areas, a number of successful policy responses have emerged for consideration:
• Build public consensus on intended reuse options for strategic infill sites in advance of developer interest. “Consensus” can range from just establishing public support for density, mix of uses, building height, and construction materials / design, to securing preliminary entitlements for reuse.
• Engage with owners of vacant / underutilized buildings to ascertain their plans for repositioning and capacity / need for resources to support reinvestment.
• Improve the appeal of infill sites with targeted infrastructure and access improvements, and support marketing efforts for these sites. Marketing materials need to include identification of competitive vacant sites, such that local offerings are properly positioned in the market.
• Consider selective site acquisition and building demolition
• Understand plans of transit agencies to support future enhancements to existing corridor transit capacity.
• The underlying theme in this discussion is the potential need for a more aggressive public sector role in redevelopment, with the end goal of reducing the front-end time required to effect infill site redevelopment.
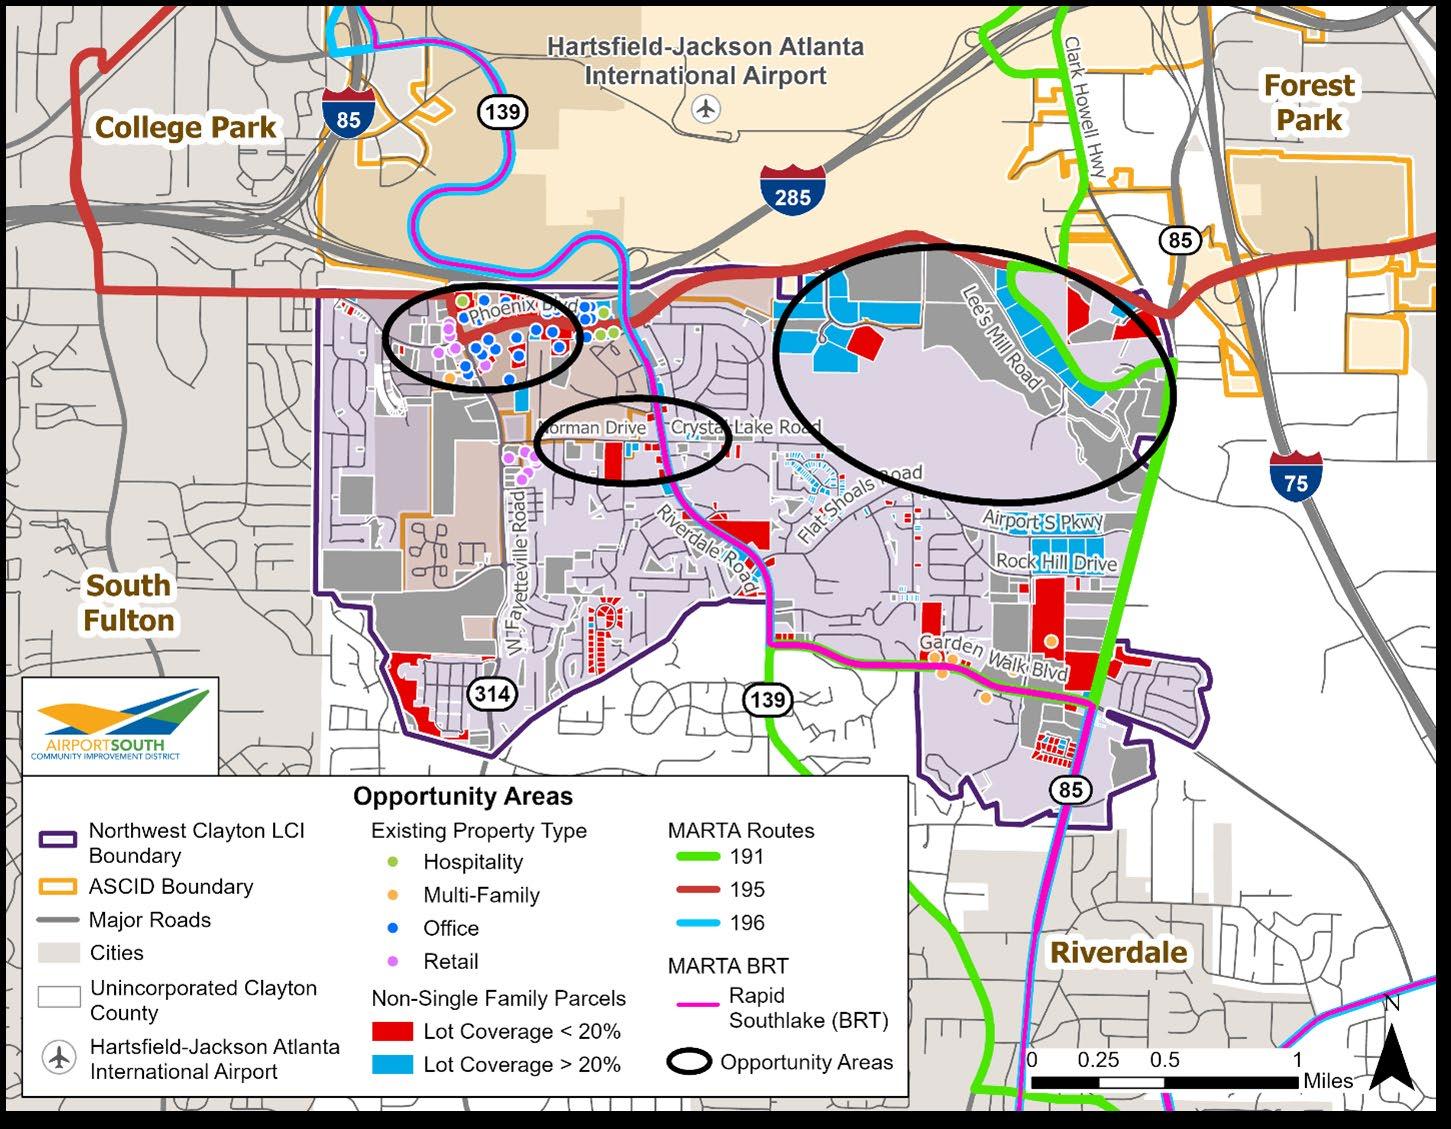
Three general opportunity areas have been determined for the Study area (Figure 3-10):
1. Godby Road
2. Riverdale Road/Norman Drive
3. The Quarry
These areas were selected based on the market analysis performed to benchmark the study area’s real estate in relation to the airport radius and the MSA, factoring in the age of buildings and occupancy trends, as well as proximity to major transportation corridors such as major roads or the BRT line. The analysis also leveraged tools such as GIS to evaluate lot coverage ratios; if less than 20 percent of a parcel is built upon, while the rest of the parcel is either empty or used as surface parking, the parcel would be considered “underutilized”. The combination of these general considerations are used to identify potential opportunity areas within which catalytic sites can be identified and selected.
The Godby Road site a is a commercial area with older office buildings built prior to 1990. According to the market analysis, existing office buildings within the study area perform at a discount relative to the wider region, and as such represents an opportunity for redevelopment. The area also consists of parcels with low lot coverage (less than 20 percent of the lot) and vacant parcels at the intersection of Phoenix Boulevard and Riverdale Road.
The Riverdale Road/Norman Drive site is a mix of generally older neighborhood shopping centers and commercial buildings as well as the North Clayton High School. The third opportunity area, The Quarry, is generally focused south and west of Lee’s Mill Road and is defined by a number of gravel and stone mining operations, interspersed with active industrial / warehouse buildings.
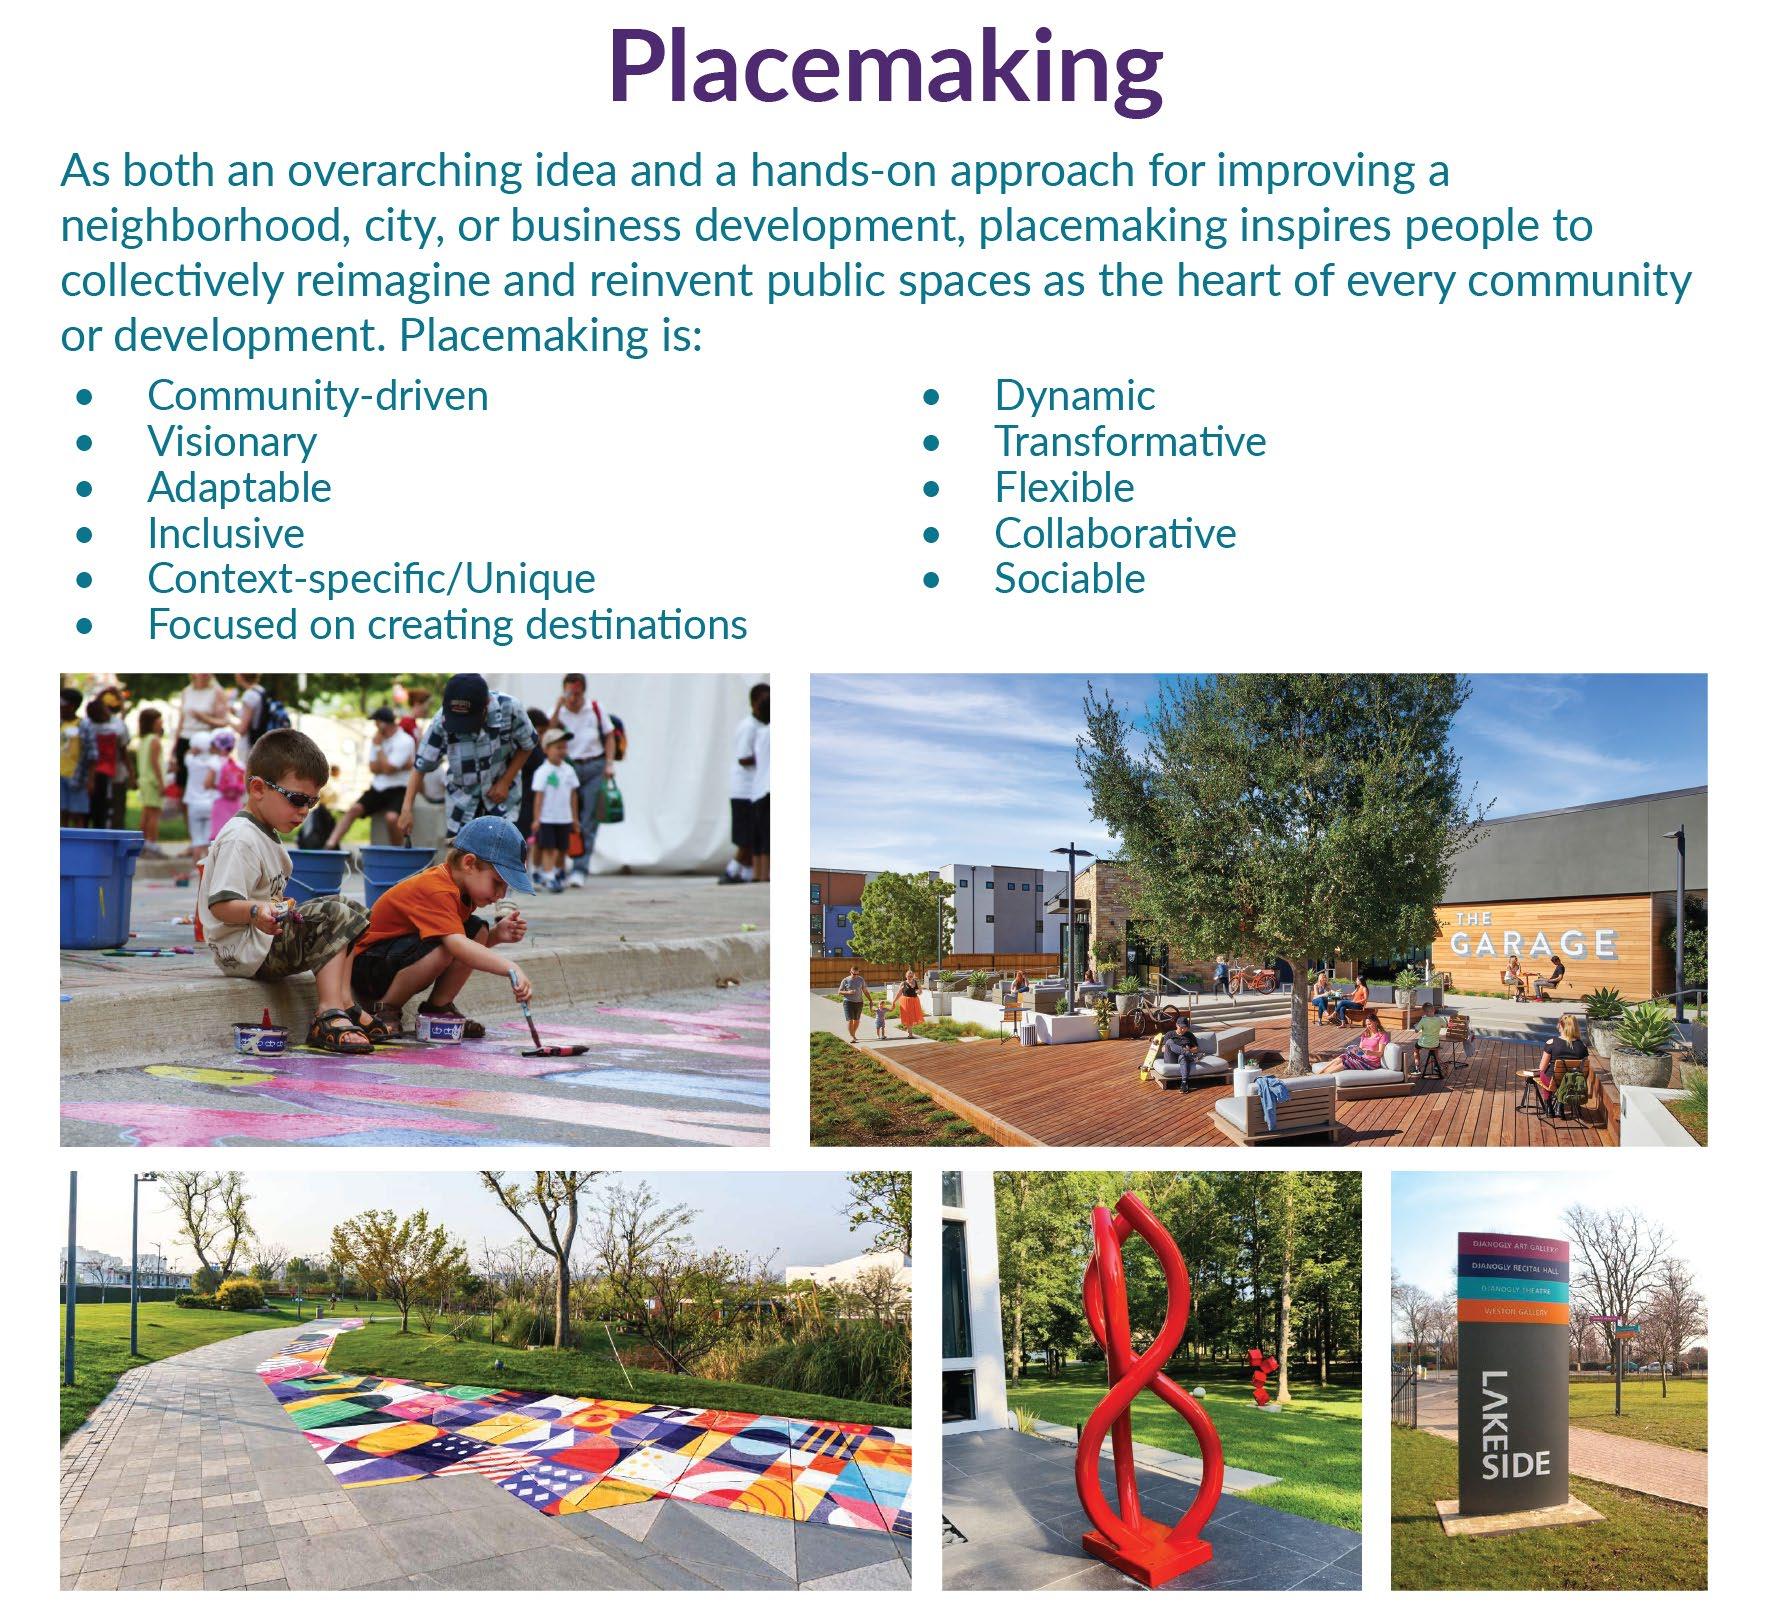
Placemaking is a collaborative process that considers physical, cultural, and social aspects to maximize shared value and create quality public spaces. The visual aspects of a community or city establish initial perceptions about a place. Therefore, it is essential those first impressions are visually attractive as they create lasting memories. When executed successfully, visual attributes of placemaking can foster job creation and civic pride and enhance the overall quality of employees’ and residents’ lives.
Project for Public Spaces (PPS), a non-profit multidiscipline organization with over 40 years’ experience in developing processes for placemaking within cities
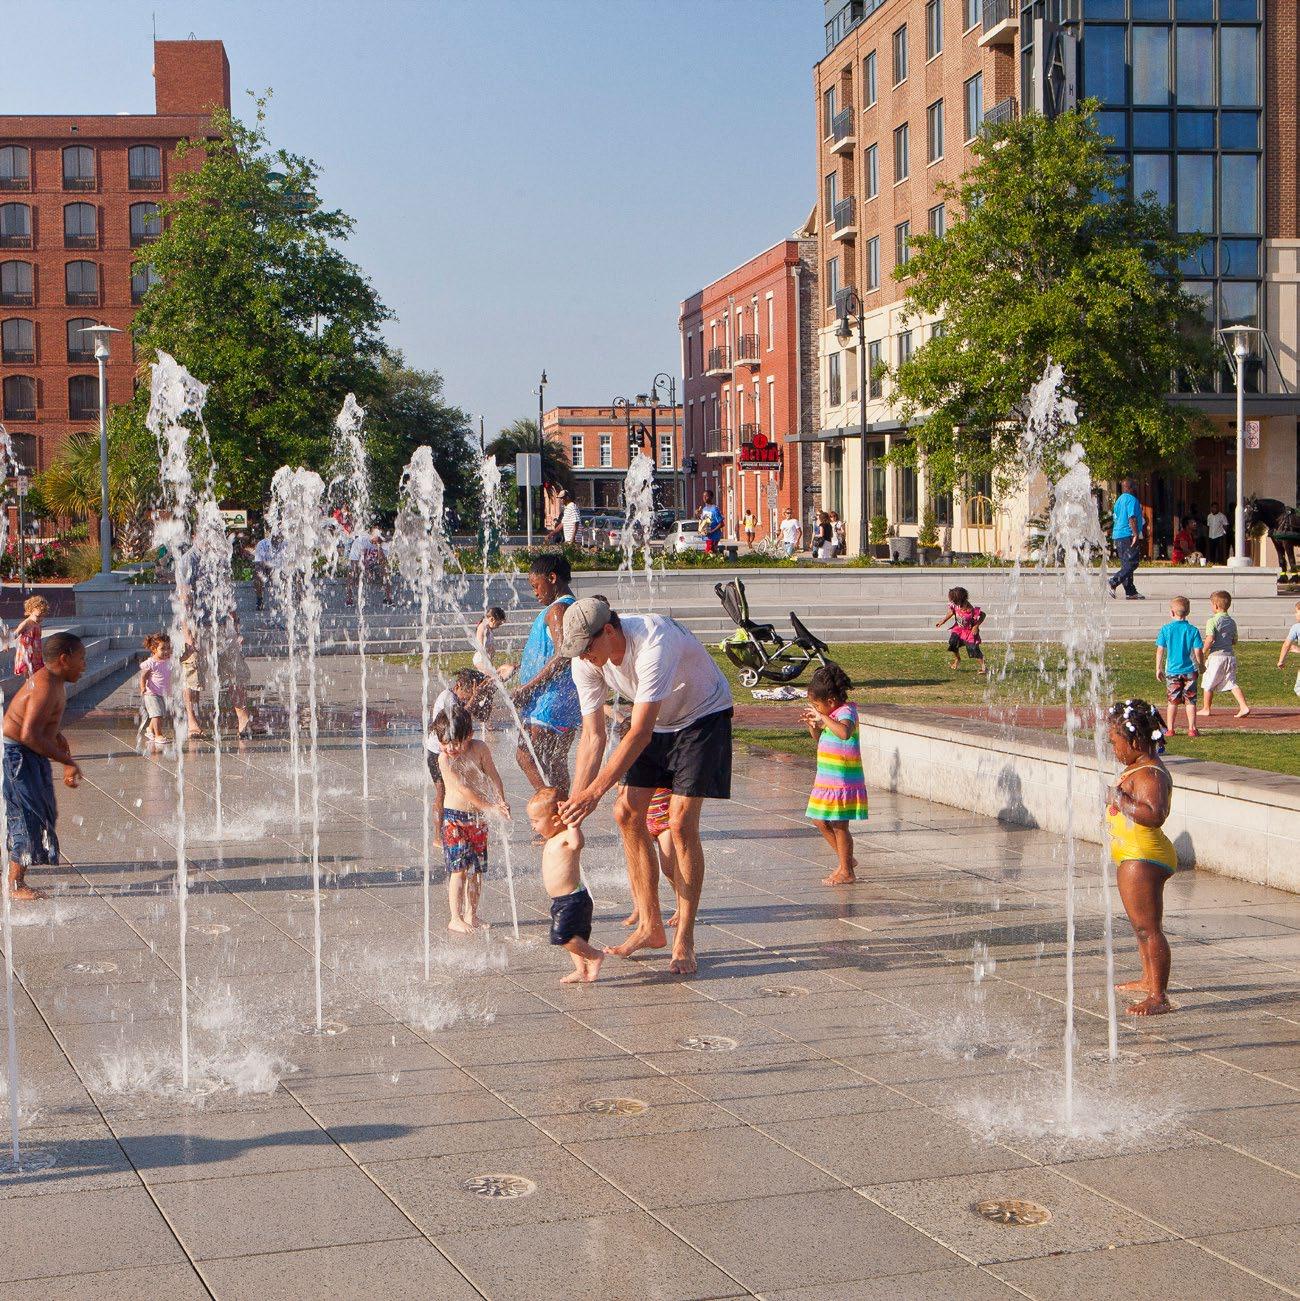
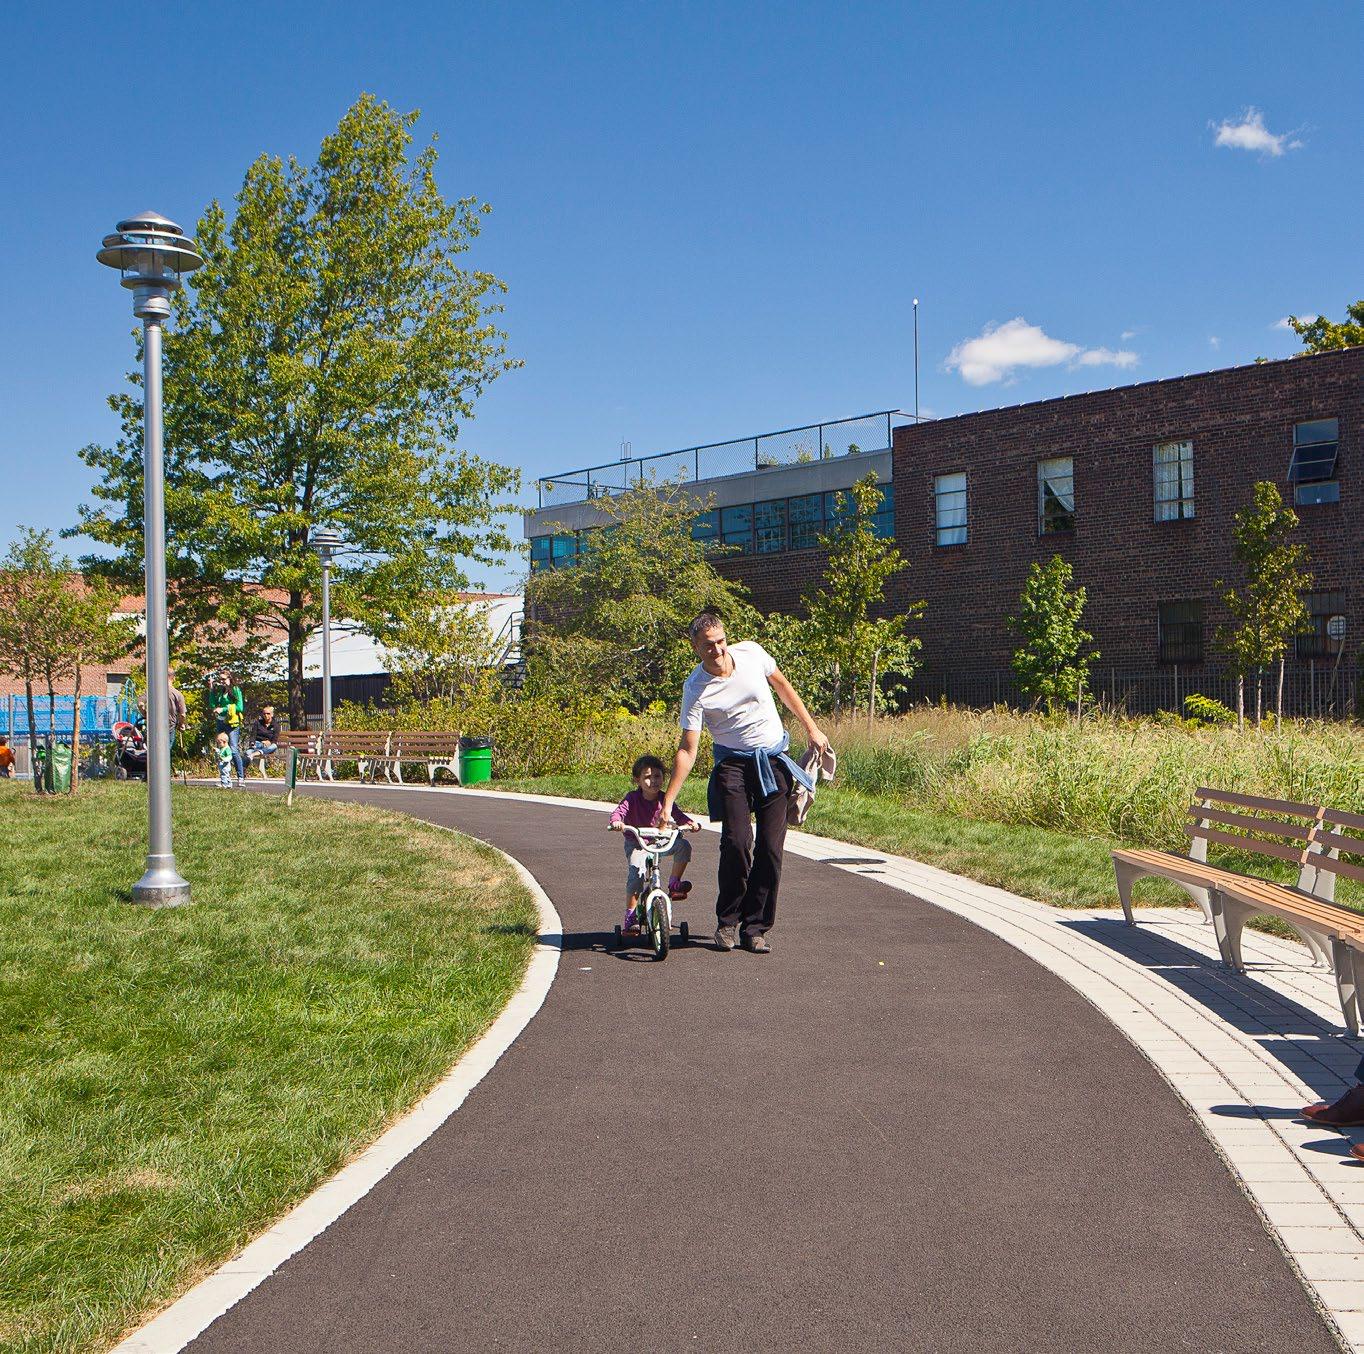
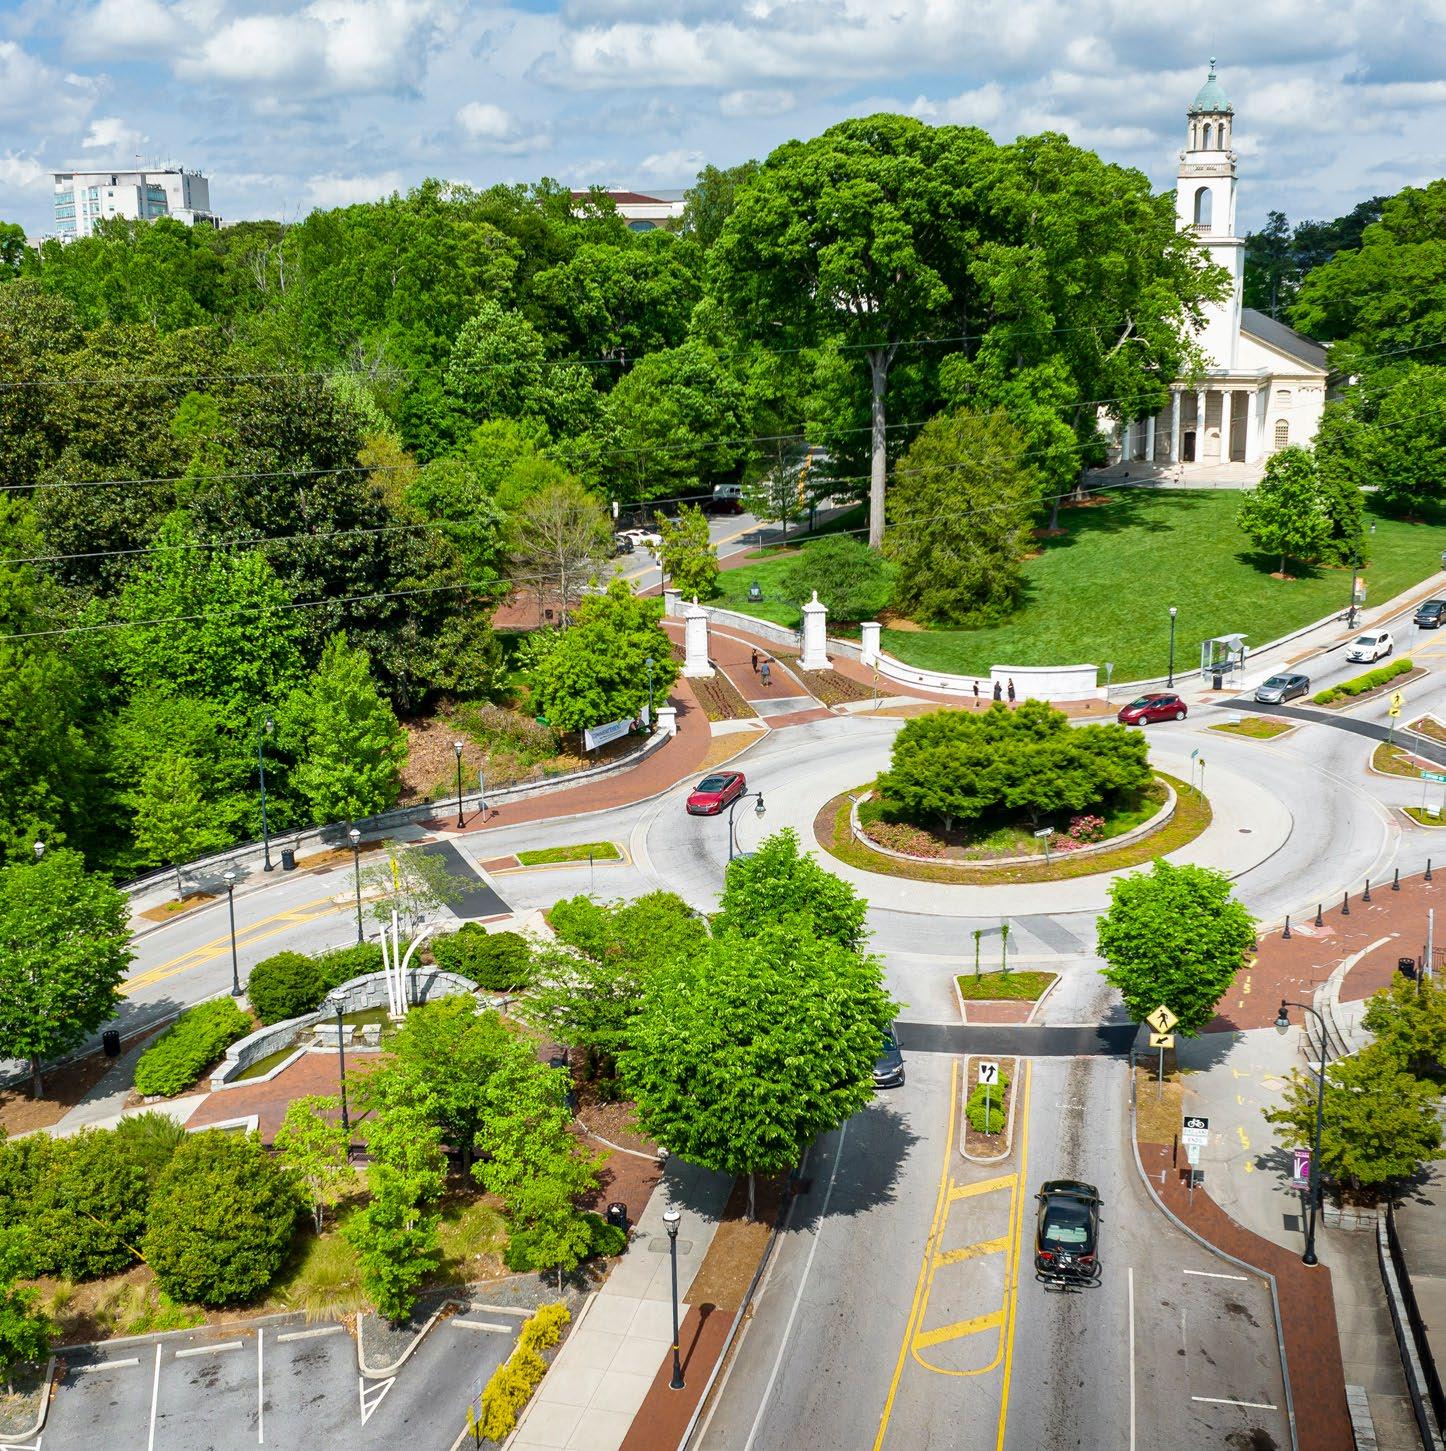
and communities, defines placemaking as “both an overarching idea and a hands-on approach for improving a neighborhood, city, or region. Placemaking inspires people to collectively reimagine and reinvent public spaces as the heart of every community. Strengthening the connection between people and the places they share, placemaking refers to a collaborative process by which we can shape our public realm to maximize shared value. More than just promoting better urban design, placemaking facilitates creative patterns of use, paying particular attention to the physical, cultural, and social identities that define a place and support its ongoing evolution.” Examples of Placemaking tools are also shown in Figure 3-11.
The majority of the Study area is in unincorporated Clayton County, which lacks community public spaces, public art, consistent signage and materials, streetscape enhancements, and proper pedestrianscale lighting. Other observations identified during site visits include:
• A lack of street trees (other than Phoenix Boulevard within the business district)
• A lack of sidewalks, pedestrian scaled lighting and effective and consistent wayfinding signage).
• A lack of unique hardscape materials such as at intersection corner treatments
• A lack of decorative pedestrian-scaled lighting that is of a consistent style
• A lack of sidewalks and associated Americans with Disabilities Act (ADA) facilities (e.g., bus access and ramps)
• A lack of a large-scale gateway monument and entry feature into the Study area
• A lack of overall effective wayfinding signage and continuity of materials
• A lack of art and cultural representation
• A lack of common open space
To fill in these gaps, a placemaking strategy could be used to incorporate community and public spaces into the Study area. The overall goal of the placemaking strategy is to establish a sense of place unique to the NW Clayton LCI Study area, establishing shared, activated spaces that are more vibrant and accessible for employers, employees, residents, and visitors to the area.
Some benefits of successful creative placemaking in a CID are developing vibrant, people-centered spaces that enhance community well-being, rejuvenate infrastructure, improve public safety, and serve as a catalyst for development or redevelopment, creating employment opportunities. Creative placemaking efforts can also bring a community together to celebrate attributes that are unique to the area. One of the first steps regarding placemaking within the study area is to create design guidelines. Design guidelines establish the characteristics of the Study area and help to maintain continuity throughout a given area. Design guidelines can include, but are not limited to, minimum sidewalk widths, hardscape materials, site furniture,
signage, landscape species, and pedestrian-scaled lighting.
By establishing and implementing design guidelines, the NW Clayton LCI Study area has tremendous potential to further enhance the sense of place. The design guidelines maintain material continuity over time and provide a playbook for future developments to follow, creating a unique sense of place. Below are some general topics the design guidelines can reinforce for the Study area.
• Identity and Theme: ASCID has developed a brand and associated logo which can serve as a starting point for further placemaking enhancements to the district by incorporating the brand into gateway monuments, wayfinding signage, and streetscapes.
• Safe Access and Circulation for All Users: Efficient pathways and accommodations ensure safe movement within the area for all modes of transportation. Streets should accommodate equitable forms of transportation such as safe sidewalks with upgraded ADA accommodations, bike facilities, and transit stations that are inviting, pleasant, and utilize proper lighting, seating, and shade. A sidewalk network with proper widths should be established within the Study area.
• Gateway Features and Signage: Clear markers define spaces and guide visitors to key destinations.
• Green Infrastructure: Green infrastructure can provide the dual benefits of improved water quality and enhanced visual appeal.
• User Amenities: Providing seating, outdoor dining, playgrounds, public art, trails, and other amenities draws people to public places and promotes both social and physical health and wellness.
• Aesthetically Appealing Streetscapes and Infrastructure: Creating a unique setting for all significant streets within the Study area.
A review of the existing conditions and existing plans for the Study area resulted in the following key findings:
1. Investing in transit access and transit stop improvements is supported by the larger percentage of zero-vehicle households and commute-by-transit populations within the Study area relative to Clayton County as a whole.
2. Five public schools sit within the Study area, which results in a large number of students without means to a vehicle and who would benefit from a safe routes to school program and pedestrian and bicycle infrastructure improvements providing alternative transportation access to the schools.
3. The 2025 NW Clayton LCI Study should evaluate and include recommendations from previous plans that are still applicable to the Study area and have not yet been prioritized, programmed, or implemented.
4. Large gaps in sidewalks are present on the east side of SR 314/W. Fayetteville Road, both sides of Phoenix Boulevard, both sides of Flat Shoals Road, the south side of SR 331/Forest Parkway, and the west side of SR 85. These sidewalk gaps should be prioritized for pedestrian connectivity.
5. Partnership opportunities exist for ASCID and the ARC, Clayton County and the cities of College Park, East Point and Hapeville to support the Clayton-Fayette-Coweta Corridor trail.
6. Improvements at the top vehicle and pedestrian crash locations should be prioritized, especially where transit stops exist without adequate pedestrian infrastructure.
7. Six MARTA Rapid Southlake stations are proposed within the Study area. Transit oriented development and infrastructure improvements around these stations should be prioritized as a part of this study.
8. Although the proportion of households in the Study area with annual incomes below $50k decreased over time, incomes did not increase fast enough to keep pace with the increase in housing costs in the Study area; alternatives to support these residents and protect against rising housing costs will be considered.
9. Industrial rents within the airport radius have been trending positively since 2014, increasing from $3.40/SF in 2014 to $6.20/SF in 2020, indicating that the wider airport-related industrial market has been increasing in value.
10. Three opportunity areas have been identified and will be prioritized for catalytic sites and improvements: Site 1 is located at the intersection of Phoenix Boulevard and W. Fayetteville Road, Site 2 is located at the Riverdale Road and Norman Drive Intersection and Site 3 which falls between Forest Parkway to the north and Flat Shoals Road to the south and Highway 85 to the east.
11. The majority of the Study area is in unincorporated Clayton County, which lacks community public spaces, public art, consistent signage and materials, streetscape enhancements, and proper pedestrian-scale lighting.
12. Gateway features will establish a sense of place and notify visitors they are within the NW Clayton LCI Study area.
The AACIDs developed a project study team, including consulting firms AECOM and Contente Consulting, to lead the 2025 Northwest Clayton LCI Study. In March of 2024, the Consulting Team began the process of public outreach and engagement with community members to review comprehensive recommendations to enhance the livability, sustainability, and accessibility of the Northwest Clayton LCI Study area.
The goal of the public outreach process was to provide multiple meaningful engagement opportunities for all stakeholders in the LCI Study Area while capturing essential input on their diverse needs and vision for the future. The project schedule including events in the public engagement process is shown, Figure 4-1. The public engagement process included:
• Establishing a project timeline, including phasing
• Identifying creative methods for engaging key groups
• Hosting five Stakeholder Focus Group Interview meetings
• Hosting two Public Advisory Committee (PAC) meetings
• Hosting three Virtual Public meetings
• Participating in four Community Pop-Up Events
• Distributing two Public Surveys
A variety of communication strategy tools were used to provide multiple opportunities for meaningful engagement with all stakeholders and community members. Copies of materials utilized throughout the project can be found in Section 4.5 and Appendix D These approaches included:
• A Project Website - AACIDs.govocal.com/en/ projects/nw-clayton-lci-1
• Digital and Traditional Print Flyers
• Postcards
• Yard Signs
• Stakeholder Email Blasts
• Social Media Advertisements and Schedule
• Media Advisories
• Partner Toolkits

4.4.1.
The Consulting Team first kicked off engagement efforts by identifying a list of key stakeholders and inviting them to participate in Virtual Focus Group interview meetings held during the third week of March 2024. The Stakeholder Focus Group meetings were utilized to review and discuss existing conditions in the areas of Transit, Safety/ Accessibility, Transportation, Economic Development, and Placemaking. Feedback from the focus group interviews was utilized to begin establishing initial draft recommendations to review with the public.
A Project Advisory Committee (PAC) was also established with subject matter experts from the community to serve as a sounding board, review documents, and provide guidance on delivery to the general public. PAC members were also provided with a Partner Toolkit that included draft social media and email advertisements to help spread the word about upcoming public meetings to maximize attendance. Two PAC meetings were held in 2024, in June and October each. Those in attendance represented the following organizations:
• Atlanta Airport
• Aerotropolis ATL Alliance
• City of College Park
• Metro Atlanta Rapid Transportation Authority (MARTA) Transit Oriented Development
• Georgia Department of Transportation (GDOT) District 7
• Atlanta Regional Commission
• GDOT Traffic Management Center
• GDOT Office of Planning
• Arts Clayton
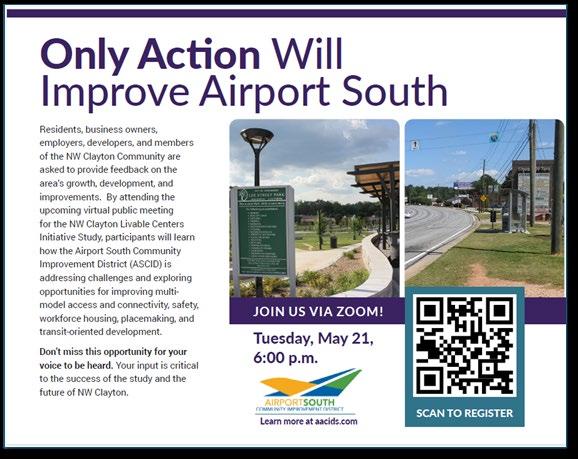
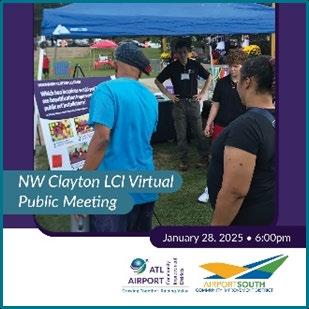
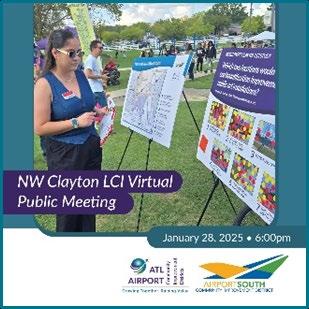
Three virtual public meetings were held between March 2024 through January 2025. The public meetings were conducted virtually for ease of participation. The meetings were a formalized method to share information gathered and compiled by the
consultants and offered an opportunity for the public to communicate their preferences for the future of the Northwest Clayton study area. Attendees were encouraged to share questions and provide feedback to support guiding the community driven project. Feedback from each meeting was documented and utilized to update recommendations continuously as more details evolved throughout the project. Meetings were advertised through digital flyers, like the flyer presented in Figure 4-2.
During the first public meeting held in May 2024, project team members were introduced, an overview of the purpose of the 2025 Northwest Clayton LCI Study was given, a visual map of the study area was shared, and an explanation of the project timeline and goals was provided. At this stage in the project schedule, the team was in the process of conducting an existing conditions assessment. After the overview and introductions, the team provided an explanation of what a CID and a LCI is and what the ASCID consists of. Afterwards, details about the previous 2004 and 2011 studies were provided. The 2025 Northwest Clayton LCI Study is an update to the previous studies with the goal of building a set of recommendations that:
• Enhance multimodal access, safety, and infrastructure
• Promote workforce housing and transit-oriented development
• Expand multimodal and transit connections to the area’s largest employers
• Establish a regional identity and sense of place and community through art and placemaking
To prepare for future state planning, the team reviewed existing conditions to consider. Conditions included current study area demographics, land use, key destinations, transportation network, planned multimodal improvements, transit network, planned transit improvements, vehicle crash density, pedestrian crash density, opportunity areas, market and real estate.
The Consulting Team utilized existing conditions and feedback from previous Focus Group interviews, to present potential opportunities and questions for consideration like the ones on the next page.
• What transportation corridors, intersections, or other concerns within the study area should be addressed to improve safety and access for pedestrians, cyclists, and motorists?
• What types of multimodal enhancements should be prioritized within the study area?
• What type of economic development or redevelopment do you wish to see more or less of?
• What type of economic development or redevelopment do you wish to see more or less of?
• What housing needs currently exist and what housing do you wish to see preserved and/or invested in?
• What corridors or sites do you wish to see public art, placemaking, or community gathering/public space improvements?
At the conclusion of the meeting, the team gave participants an opportunity to ask questions and presented a survey QR code for them to complete for continued feedback.
The second public meeting in September 2024, was held in a virtual engagement style that covered the following agenda items: review of the current project schedule, an overview of the map of the study area, and recommendations for community improvements.
After initial presentation details, the team reviewed recommendations for community improvements in the following areas: (1) Transportation, (2) Transit Infrastructure, (3) Multimodal Enhancements, (4) Economic Development, (5) Land Uses, (6) Housing, (7) Placemaking, and (8) Community and Gathering Spaces.
The recommendations were established by gathering feedback from the public during previous Stakeholder
Interviews, the first Public Meeting and from the project’s Public Advisory Committee (PAC) member’s feedback. The insight was then utilized to create recommendations in an intentional and thoughtful way for ideal improvements within the community.
Throughout the presentation, participants were encouraged to interact with the team by sharing their questions, thoughts, and concerns while discussing each key element. Participants had three ways to interact. They were given the option to place questions in the comment chat, raise hands in the virtual team meeting and/or verbally ask their questions as the team asked for their feedback throughout the meeting. Participants were engaged, interactive and shared some valuable feedback for the team to take into consideration. Feedback included the following desires and concerns:
• More restaurants needed on Riverdale Road
• W. Fayetteville Road has a lot of traffic and many accidents
• Need to rehabilitate old housing in study area
• Need more greenspace in the study area
• Lots of litter on Riverdale Road and Garden Walk Boulevard near bus stops
At the conclusion of the meeting, the team thanked participants for attending and presented a survey QR code for use in providing continued feedback.
During the third and last public meeting held in January 2025, the consultant team provided initial project overview and an update on the project schedule. The purpose of this stage in the project schedule was to review strategy documents for transportation, economic development and placemaking. The consultant team then presented established recommendations from the stakeholder involvement process and public feedback received from the two previous public engagement meetings.
Following the stakeholder involvement process, a list of key potential partners was shared to give attendees an understanding of who the team could be coordinating with to bring additional investment into the study area to support implementation. The following table, Table 4-1, is the list of key partners identified.
The meeting then moved into review of strategy draft recommendations and details regarding the basis for how the recommendations were established. After review of potential partnerships, the team provided insight about how the following activities contributed to the basis for the study’s recommendations:
• Existing Conditions
• Public and Stakeholder Feedback
• Previous Plans Reviewed:
c Northwest Clayton LCI Study (2004)
{ Northwest Clayton LCI Study (2011)
{ Clayton Moving Forward: 2024 Comprehensive Plan – A Vision for the Future (2024)
{ Clayton County Comprehensive Plan (2019)
{ Freight Cluster Plan (2020)
{ Clayton County Comprehensive Transportation Plan Update (2018)
{ The Aerotropolis Atlanta Blueprint (2016)
{ AeroATL Greenway Plan (2018)
{ Clayton Connects Trail Master Plan (2015)
The project team utilized feedback from all previous public engagement activities and diverse communication channels to create recommendations in an intentional and thoughtful way for ideal improvements. Next step recommendations for community improvements were created in the following key areas: (1) Transportation, (2) Multimodal Enhancements, (3) Transit Infrastructure, (4) Economic Development, (5) Land Uses and Housing, and (6) Placemaking and Community/Gathering Spaces.
While reviewing recommendations, the team also presented slides with concept images to help attendees visualize potential improvements for each of the key elements. Participants were given the opportunity to share their thoughts and ask questions about each concept. For more information on the recommendations presented, see Sections 5, 6, and 7.
The meeting was concluded with an explanation of recommendation outcomes and final project details for next steps to move forward with implementation. Attendees were given an additional opportunity to ask any final questions and encouraged to take the digital public survey to provide input.
Federal State Local
• Housing and Urban Development (HUD)
• Federal Highway Administration (FHWA)
• Federal Transit Administration (FTA)
• Department of Community Affairs (DCA)
• Georgia Department of Transportation (GDOT)
• City of College Park
• Clayton County MARTA
• Private Developers

Physical and digital communication tools were used to advertise the public meetings and project updates. Public meetings had multiple social media postings to inform the public, such as the social media graphics to the left. Also, physical yard signs, like the ones above, were posted throughout the Study area. The signs had QR codes leading to the Study’s website.
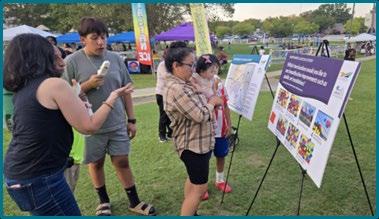
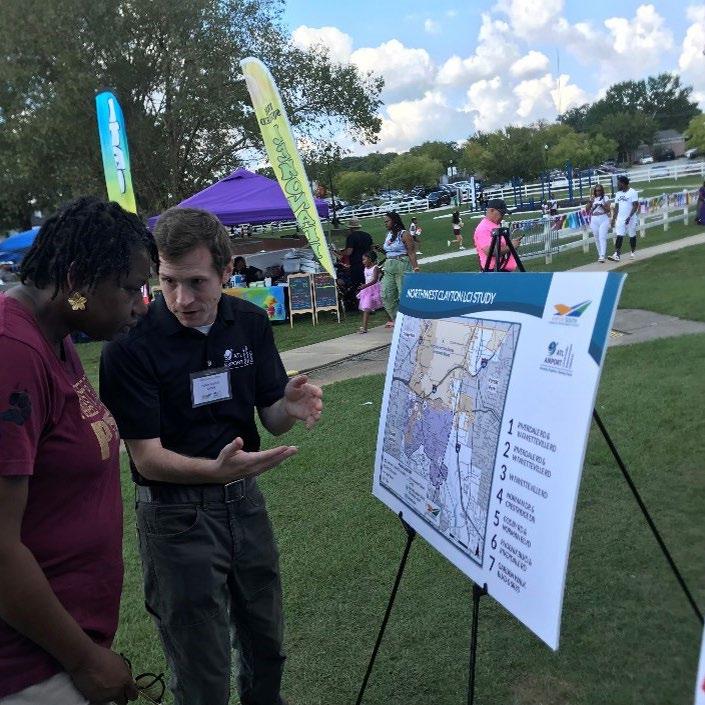
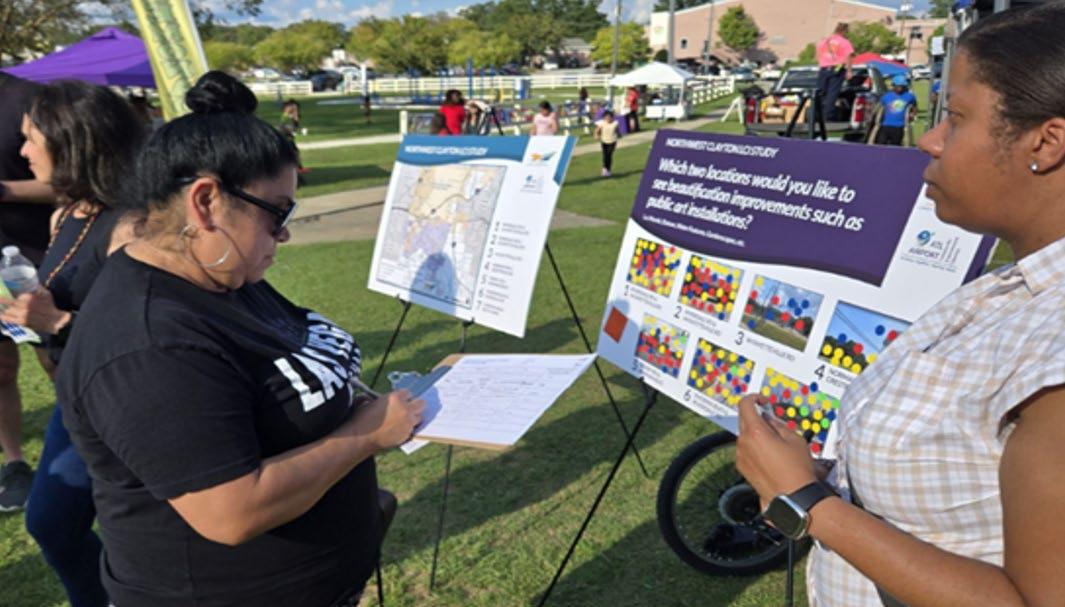
To maximize community involvement, the Consulting Team attended four public community events to engage with residents within the project study area. The four events were hosted by community elected officials. Through partnership with elected officials, the project team was granted permission to attend the four events and collectively was able to engage with over 210 members of the community. The Consulting Team gave out flyers, discussed the project details and encouraged community members to complete the Northwest Clayton LCI public survey. Visual Boards were created and displayed on easels at each popup event. The visual boards are described below and displayed in Appendix D.
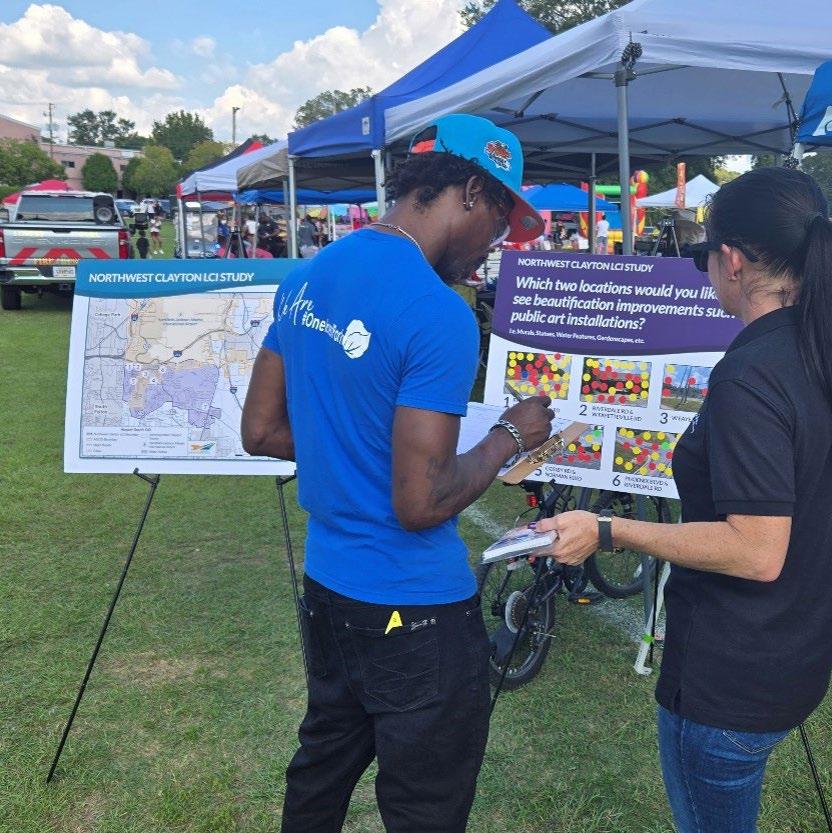
The first board displayed the overview of the study, an explanation of a Livable Centers Initiative, and the project schedule. The second board provided an overview map to show the borders of the study area, and the communities involved in the study. The third board was a visual board of areas within the study area that could potentially benefit from placemaking and beautification. Community members were asked to vote by using stickers to identify two locations
that they would prefer to see more beautification, like in Figure 4-3. Lastly, four additional boards were provided as interactive visual boards that provided example locations where the public would like to see more beautification through placemaking. Participants were given two colored dot stickers and asked to vote on their two top locations for placemaking. Examples of what placemaking options could consist of were potential murals, fountains, statues or green landscaping. The project team collected the participants’ votes and summarized results.
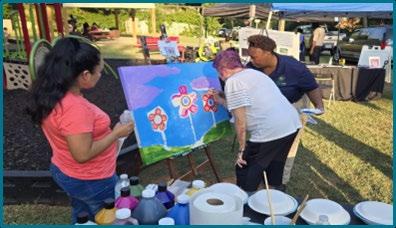
The Consultant team also provided community members with two creative art projects to encourage engagement and promote the value of beautification through Placemaking. The first activity was coloring sheets of an overpass located at the intersection of Riverdale Road and West Fayetteville Road, as shown in Figure 4-4. Participants were asked to use colors, markers and/or crayons to color what placemaking they would like to see on the retainer wall for beautification. Some participants drew images. Others chose to write colorful words to express their preference for the area. Residents’ children especially enjoyed this activity, and it gave the project team the opportunity to gain insight from youth within the
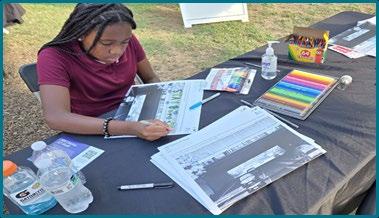
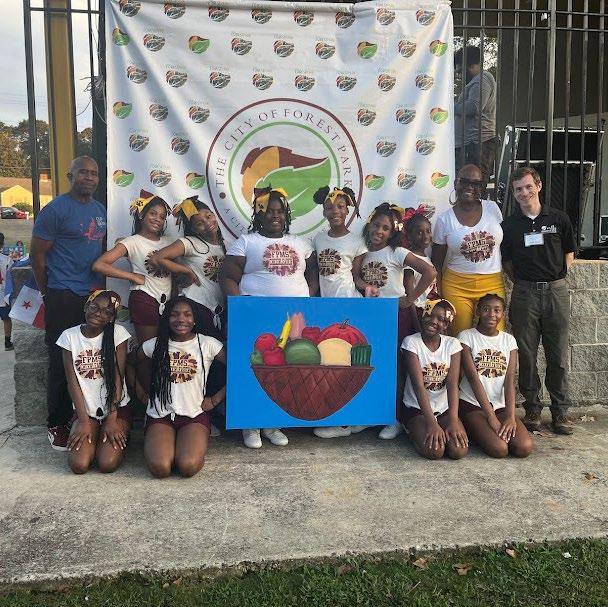
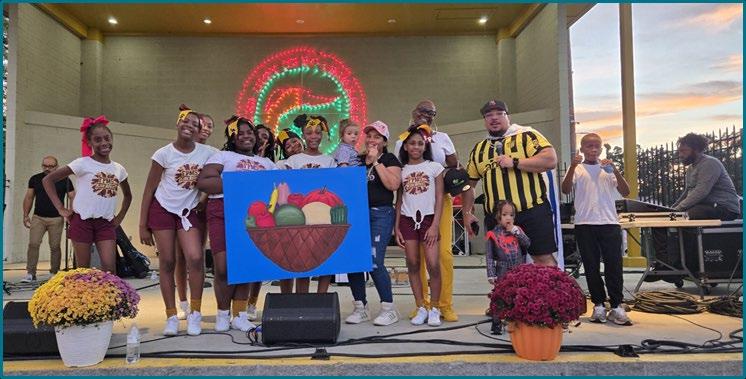
study area. The second activity was a large canvas with a sketch drawn by a local Artist. Figure 4-5 shows community members participating in the communityled paint by numbers art piece. The paintings were completed by the end of each event and later donated to each of the Councilmembers hosting the public events, as presented in Figure 4-6.
4.5.5.
The public survey was created in both English and Spanish versions. In addition to sharing the survey at Pop-Up events, it was also distributed digitally via email to the Stakeholder database. The feedback and results for the top recommendations for the
community are discussed by focus area in Sections 5, 6, and 7.
The Consulting Team utilized multiple creative channels to create effective and overall positive engagement opportunities. Intentional efforts were made to ensure there was representation from diverse Stakeholders of all demographics for their voice to be heard. The Consultant team analyzed the feedback and results from all efforts to develop the final recommendation plan for presenting the plan forward.
The strategies are based on the existing conditions, public and stakeholder feedback, and previous plans (relating to the Study area) reviewed. For more information on previous plans, see Appendix A. The project team reviewed the following plans relating to transportation:
• AeroATL Greenway Plan
• Clayton County’s Greenway Trail Master Plan
• Regional Trail Vision
• Clayton County Comprehensive Transportation Plan
• Road Safety Audit – SR 139 Riverdale Road from Riverwalk Lane to Garden Walk Boulevard
• Aerotropolis Transit Feasibility Study
• Freight Cluster Plan
The project team met with the PAC and the public on several occasions. The PAC consists of representatives from key stakeholders serving in an advisory capacity on the project. Table 5-1 displays
5-1: Concerns and Desires from PAC and Public
the top transportation concerns, desired multimodal enhancements, and transportation corridors for safety improvements made by the PAC and public in the first round of public/stakeholder involvement meetings.
These concerns and enhancements were echoed during other public and stakeholder engagements. During stakeholder interviews, stakeholders commented that local governments were interested in first-mile and last-mile connectivity. This connectivity is part of a larger effort to increase connectivity south of the airport. Stakeholders mentioned potential demand from cyclists in the Study area at the College Park MARTA station. There were also mentions of high volumes of truck traffic on SR 139/Riverdale Road at Forest Parkway. Stakeholders want more transit stop amenities, sidewalks, pedestrian infrastructure near transit stops, and more bicycle infrastructure. This infrastructure will improve safety and accessibility issues and would help to attract more transit riders. In addition, the public expressed their concern with a lot of traffic on SR 314/W. Fayetteville Road and frequent accidents. The public stated that the road is not safe for children due to drivers exceeding the speed limits and want drivers to slow down.
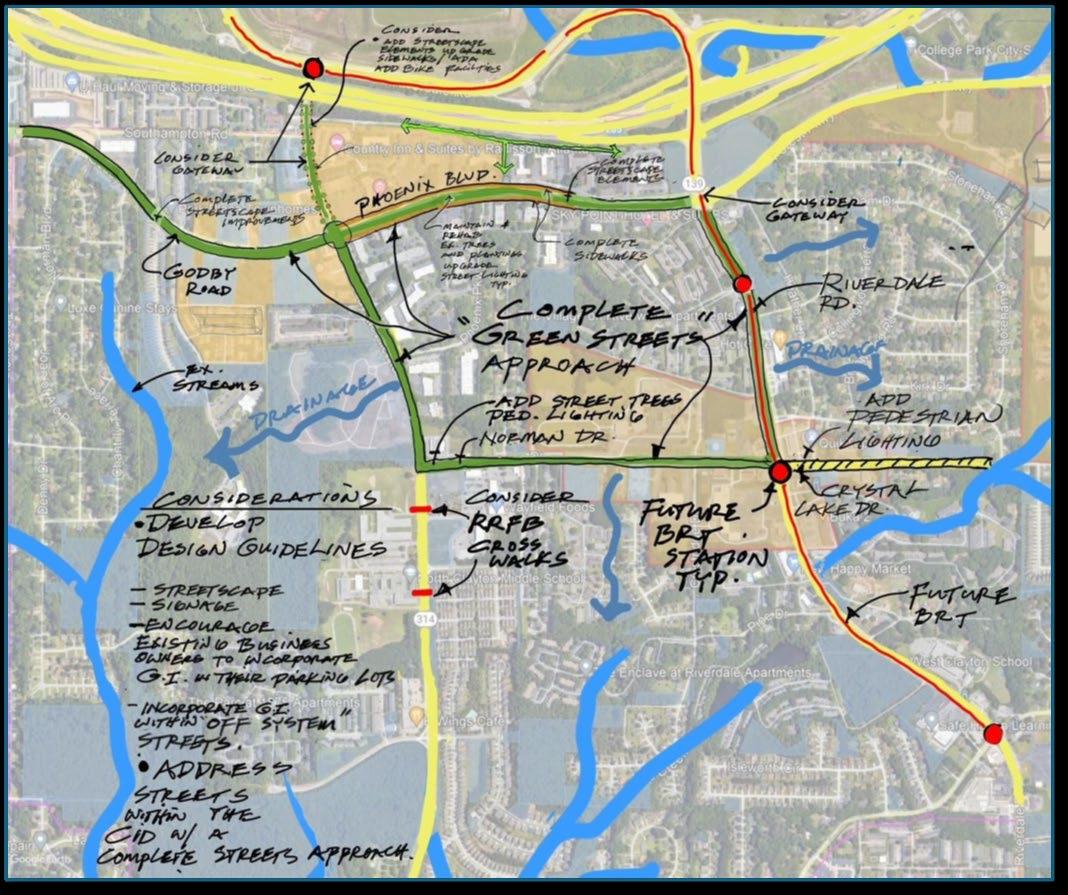
After developing the existing conditions and conducting stakeholder and public meetings, the project team created a series of strategies for transportation including mobility improvements, street network improvements, smart community elements, and green infrastructure strategies. Figure 5-1 above shows the transportation street concept for the Study area. This concept includes complete streets, traffic calming strategies, and considerations for green infrastructure. These concepts were developed into strategies and recommendations, displayed in Figure 5-2, and discussed in the subsequent sections.
Recommendations for mobility improvements are split into the following categories: traffic calming,
pedestrian and bicycle improvements, and transit access.
5.3.1.
Calm traffic speeds with narrower car lanes
Slower traffic speeds may decrease the number of vehicle and pedestrian crashes in high density crash areas like SR 139/Riverdale Road and Garden Walk Boulevard. Table 5-2 shows the lane widths, speed limits, and class for the roadways. Most roadway widths are between 11 and 12 feet wide. SR 139/ Riverdale Road has a school zone for West Clayton Elementary School, so the speed limit in the zone is 25 miles per hour (mph) from 7:00am – 8:00am and 1:45pm – 2:45pm on school days; otherwise, the speed limit is 45 mph.
Source: GDOT TADA
According to the GDOT Design Policy Manual, the design criteria allows lane widths of 10-12 feet for local roadways with AADT of greater than 2,000 and 11-12 feet for arterial roads with AADT of greater than 2,000. Garden Walk Boulevard could be reduced from 11.5 feet in lane width to 10 feet. SR 139/Riverdale Road could be reduced from 12 feet to 11 feet. With the design criteria, the speed limits can remain the same. The narrowing of car lanes should not result in the reduction of car lanes, but could make lanes seem narrower through widening the lane striping.
In addition to reducing speeds, narrowing lane widths for multiple car lanes could accommodate bicycle lanes on the roadway. Depending on the number of lanes and the width of the right-of-way, a travel car lane
may or may not have to be removed to accommodate bicycle lanes. GDOT may consider a request from local governments to narrow travel lanes to add a bike lane during a resurfacing project. The request will need to consider: (1) if there is space available for a bike lane; and (2) where the motor vehicle crash rate for sideswipe crashes does not exceed the statewide average for the same functional classification.6 A request, with Clayton County, should be sent to GDOT for consideration of narrowing travel lane widths to accommodate a bike lane for SR 139/Riverdale Road.
RAPID Southlake will also occupy SR 139/Riverdale Road in the future. MARTA could consider the narrowing of car travel lanes and bicycle lanes in the design of RAPID Southlake on Riverdale Road.
6 GDOT. Design Policy Manual. Warrants for Accommodation: Bicycle Warrants. https://www.dot.ga.gov/PartnerSmart/DesignManuals/DesignPolicy/ GDOT-DPM.pdf
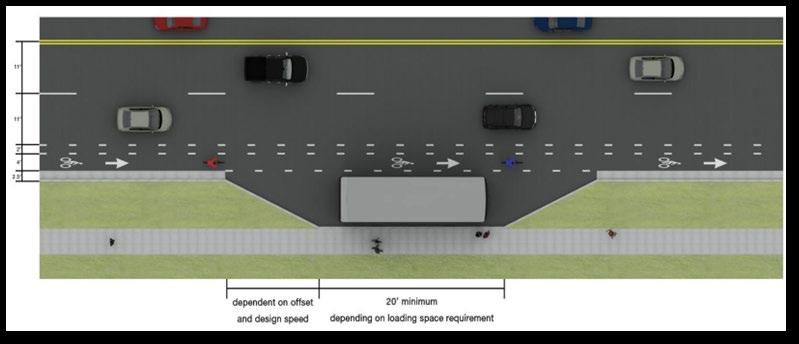
Figure 5-3, shows a bus pullout7 and bicycle lanes to safely facilitate dropping bus passengers off while not disturbing the bicycle lane. MARTA will ultimately make the decision on enhancements to Riverdale Road while planning for RAPID Southlake.
Adopt a complete streets approach for key corridors
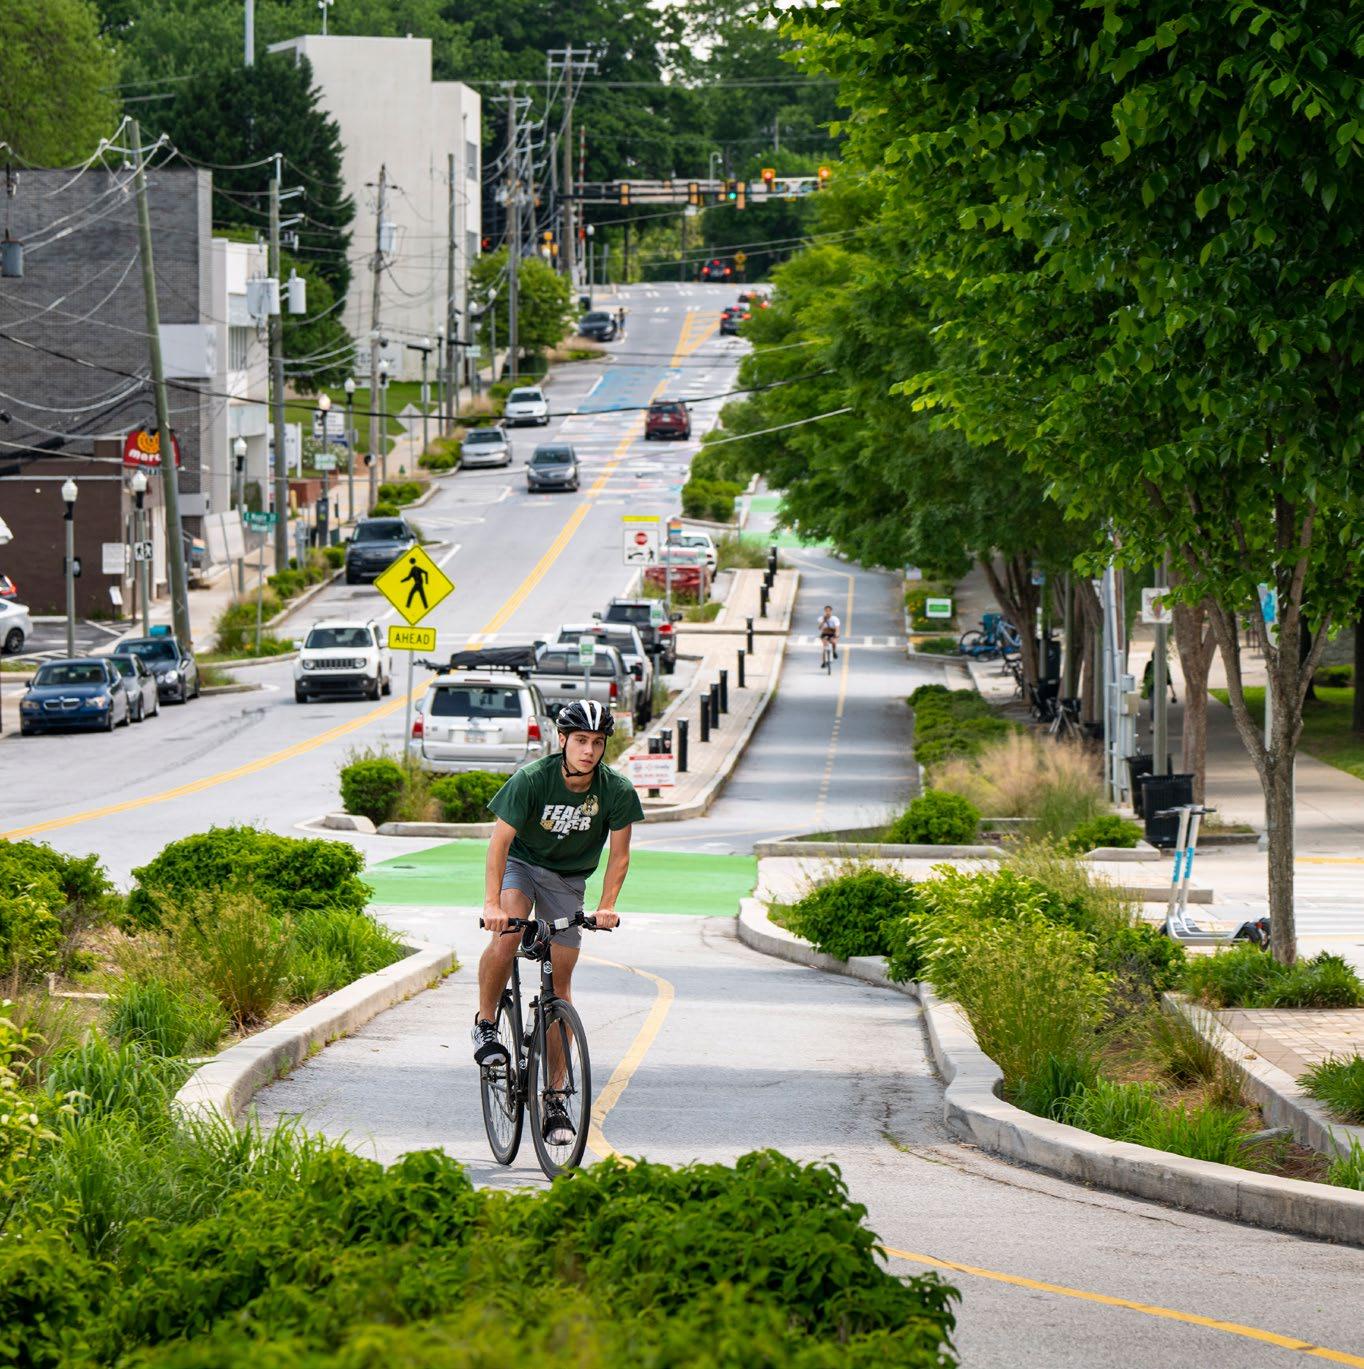
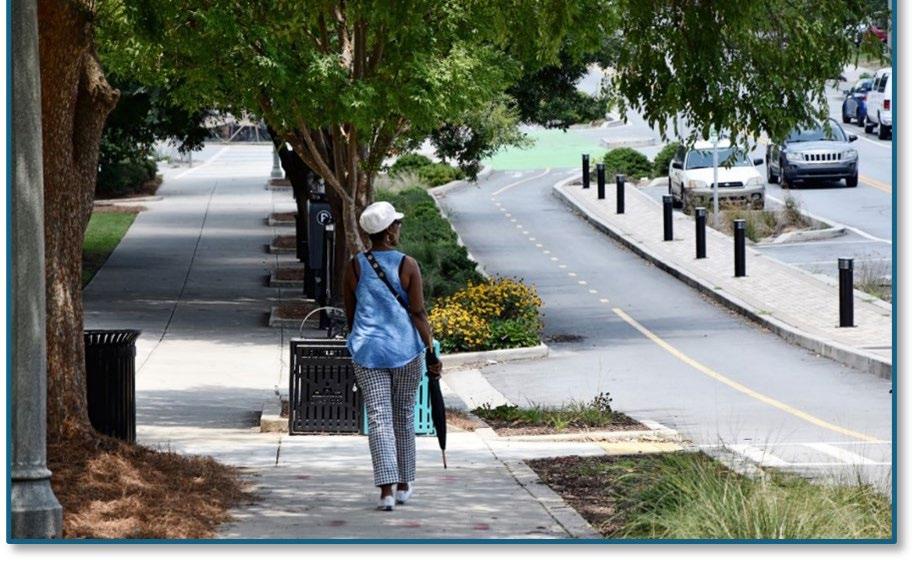
Complete streets include accommodations for bicycle, pedestrian, and transit riders to improve mobility, access, and safety on the roadways. Implementing complete streets in the Study area will improve travel for individuals of all ages and abilities.8 Complete streets can help address several issues in the Study area: sidewalk gaps, lack of bicycle infrastructure, and considerations for local bus and the future RAPID Southlake. Key corridors for consideration for complete streets should include: Godby Road/Phoenix Boulevard, SR 139/Riverdale Road, SR 314/W. Fayetteville Road, and Garden Walk Boulevard. To implement a complete street, local governments and planning agencies can partner with GDOT. A partnership with GDOT is recommended for the planning, design, and construction of the complete streets. Figure 5-4 displays an example of a complete street with wide sidewalks and protected bike lanes.
Crash data, see Section 3.3, shows that intersections along SR 139/Riverdale Road and Garden Walk Boulevard have both high vehicle and pedestrian crash density. Upon further analysis, it was determined that the intersections of Godby Road/Phoenix Boulevard and SR 314/W. Fayetteville Road and Forest Parkway and Lee’s Mill Road could benefit from safety improvements. Additional analysis would be needed to evaluate intersections within the Study area and determine what safety improvements are best. All streets within the study area that are not dedicated to primarily industrial truck traffic should safely accommodate pedestrians and cyclists.
7 GDOT. Design Policy Manual. Warrants for Accommodation: Bicycle Warrants. https://www.dot.ga.gov/PartnerSmart/DesignManuals/DesignPolicy/ GDOT-DPM.pdf
8 GDOT. Design Policy Manual. Transit Accommodation Design. https://www.dot.ga.gov/PartnerSmart/DesignManuals/DesignPolicy/GDOT-DPM.pdf
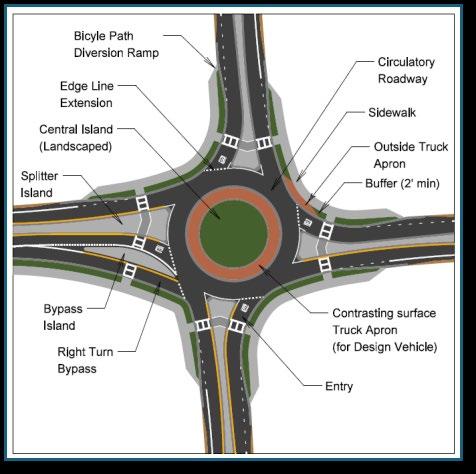
Roundabout at Godby Road/Phoenix Boulevard and W. Fayetteville Road
A roundabout is defined as a circular intersection with channelized approaches, yield control at entry, and counterclockwise circulation to foster a lowspeed environment.9 Speed limits approaching the intersection are 35 mph on Godby Road/Phoenix Boulevard and 40 mph on SR 314/W. Fayetteville Road. A roundabout at this intersection could slow down vehicle speeds upon approaching the schools on SR 314/W. Fayetteville Road, the business district on Phoenix Boulevard, and multi-family buildings on Godby Road. Lower speeds help provide a safer environment for vehicles, cyclists, and pedestrians alike to promote alternative travel methods along these roads. An intersection control evaluation is needed for consideration of a roundabout at an intersection to begin the proposal process with GDOT. Figure 5-5 shows an example of a roundabout and its potential design features including the central island, the outside contrasting surface, the circulatory roadway, and sidewalk.
Forest Parkway and Lee’s Mill Road Intersection
At this intersection, displayed in Figure 5-6, Lee’s Mill Road is surrounded by trees, providing drivers with limited to no visibility to the right as they approach this intersection. Also, drivers have to make a sharp turn to approach the intersection from the south. This intersection could benefit from a realignment of Lee’s Mill Road to eliminate the sharp turn onto Forest Parkway. A study of the intersection would be needed for realignment and additional safety improvements for the intersection, including adding sidewalks. Add new street connections and intersections where possible
The LCI study is proposing three new catalytic sites throughout the Study area. As a result of these catalytic sites, new connections and intersections may be developed. Also, in the public involvement process, it was noted that the Study area should increase east-west connections where possible. Further investigation and analysis are needed to determine where additional new roadways and intersections can be located to improve east-west connectivity in the Study area.

9 GDOT. Design Policy Manual. Roundabouts. https://www.dot.ga.gov/PartnerSmart/DesignManuals/DesignPolicy/GDOT-DPM.pdf
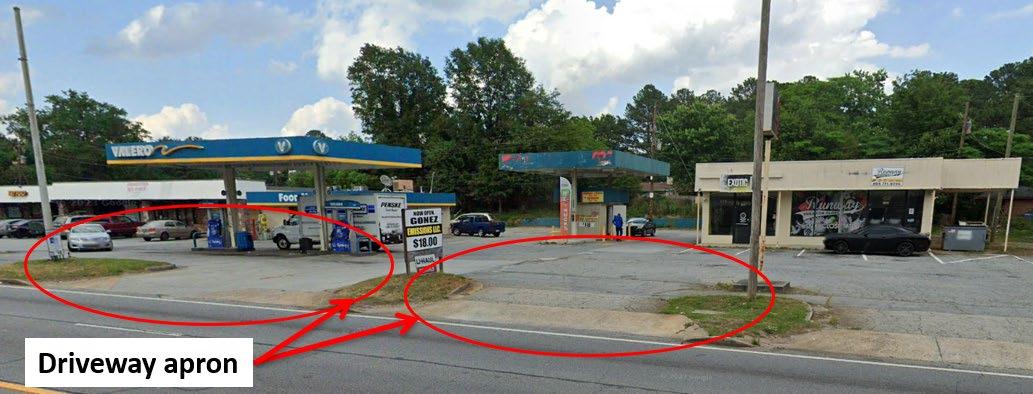
A “driveway apron” is defined as any paved roadway between the curb line of any street and the adjacent property line or the parkway side of the edge of the sidewalk, whichever is less.10 Driveway aprons require drivers to slow down and turn to approach the driveway to access an establishment.
Riverdale Road has many driveway aprons and right turn lanes, as indicated by Figure 5-7. The GDOT Regulations for Driveway and Encroachment Control states that driveway aprons should be spaced to allow drivers time to react at the conditions at each intersection. Having multiple driveway aprons and right turn lanes for businesses can cause confusion, increasing the reaction time at intersections. Spacing should also be, “at least equal to the distance travelled, at the posted speed limit, during the normal perception and reaction time plus the distance traveled as the vehicle decelerates to a stop.”11 Spacing should also allow for the storage of vehicles waiting to enter. A study should be conducted for SR 139/ Riverdale Road to determine the design of the road with the appropriate driveway and right turn lane spacing according to GDOT’s standards.
Support a State Route (SR) 139/Riverdale Road scoping study for freight
The Freight Cluster Plan (2020) by Aerotropolis Atlanta CIDs and consultants suggested a freight scoping study for SR 139/Riverdale Road. Their daily volume analysis found that SR 139/Riverdale Road, between I-285 and Garden Walk Boulevard, carried
41,200 vehicles per day, while operating at a levelof-service at F. The scoping study would identify any improvement projects to address capacity and access issues for SR 139/Riverdale Road. Below in Table 5-3 are the potential project details provided by the Freight Cluster Plan. The scoping study has not started; coordination with the potential partners is needed to start the study.
Timeframe 1-5 years
Cost Estimate
$300,000
Location I-285 to Main Street
Potential Partners
Clayton County, College Park, GDOT, City of Riverdale
State Route? Yes
Funding Considerations
In Other Plan? Yes. (2018 Clayton County Comprehensive Transportation Plan)
Level of Effort - Low
Anticipation Coordination - Low
Source: Freight Cluster Plan (2020) by Aerotropolis Atlanta CIDs
10 Western Springs, IL. Western Springs, IL. Code of Ordinances. Driveway Aprons. https://codelibrary.amlegal.com/codes/westernspringsil/latest/ westernsprings_il/0-0-0-5112
11 GDOT. Regulations for Driveway and Encroachment Control. Spacing of Driveways. https://www.dot.ga.gov/partnersmart/designmanuals/ encroachment/driveway.pdf
The following section presents various strategies for pedestrian and bicycle improvements. These strategies should be explored through a multimodal network plan for the Study area.
Add pedestrian lighting along key corridors
Lighting is important to improve the visibility and safety of an area. To help ensure safety for pedestrian activity after dark, pedestrian lighting should be provided in the Study area. The following roadways should be proposed for pedestrian lighting: Phoenix Boulevard, SR 139/Riverdale Road, SR 314/W. Fayetteville Road, and Garden Walk Boulevard. There are a few ways that lighting can be initiated: coordination with GDOT, a local government, or a private developer to explore the different ways to implement pedestrian lighting on the major roadways in the Study area.
Fill in missing sidewalk gaps along key corridors
Analysis of sidewalk coverage revealed that sidewalks are missing along key corridors: Forest Parkway, Phoenix Boulevard, SR 139/Riverdale Road, SR 314/W. Fayetteville Road, and SR 85. These roads
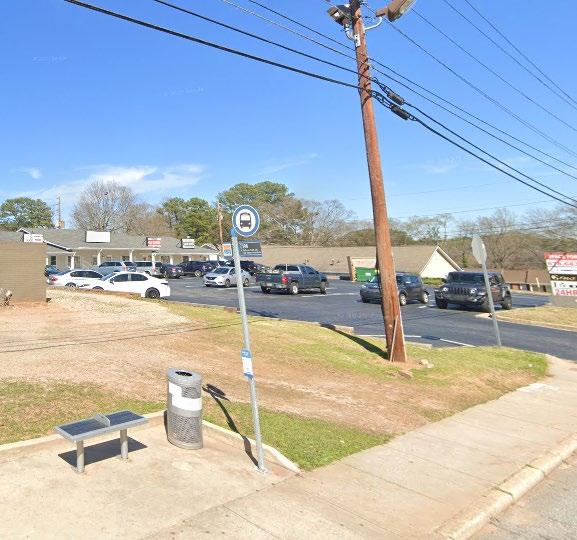
have land uses and mobility factors that are conducive to walking and could benefit from pedestrian access. New multi-use paths are planned for Forest Parkway; closing the gap could jumpstart the process for the new paths. Phoenix Boulevard has a business complex at the corner of Phoenix Boulevard and SR 314/W. Fayetteville Road. SR 139/Riverdale Road has a bus route with bus stops that need to be accessed through sidewalks, which will eventually be replaced with RAPID Southlake, with a station at SR 139/Riverdale Road and Flat Shoals Road. SR 314/W. Fayetteville Road has residential uses and two schools, G.W. Northcutt Elementary School and North Clayton Middle School, plus the future site of the North Clayton High School, all of which encourage high levels of pedestrian activity. MARTA’s bus route 191 travels down SR 85 and multiple stops are missing pedestrian access. Filling in the gaps on SR 85 would increase pedestrian access to businesses and bus stops.
Table 5-4 presents the missing sidewalk gaps on those key corridors in the Study area. Filling in these gaps could bring nearly three more miles of sidewalk in the Study area. Coordination with Clayton County is needed to develop a project list to prioritize sidewalk gaps to fill in the Study area.
Add midblock crossings at schools and key destinations
Source: Google Earth
Two schools are present along SR 314/W. Fayetteville Road: GW Northcutt Elementary School and North Clayton Middle School. Currently, there are no opportunities for students to safely cross the street. Both schools have one separate entrance, and two entrances shared with a parking lot, all without traffic lights.
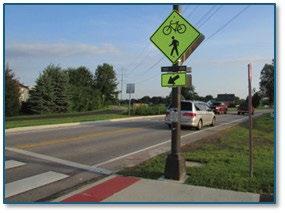
The project team proposes adding crosswalks at two of these entrances to improve pedestrian and bicycle safety near the school. In addition, these crosswalks could include Rectangular Rapid Flashing Beacons (RRFB), as shown in Figure 5-8, and a pedestrian warning sign. RRFBs have two, rectangular-shaped yellow indicators, with a light-emitting diode-arraybased light source to flash when pedestrians are about to cross the street.12
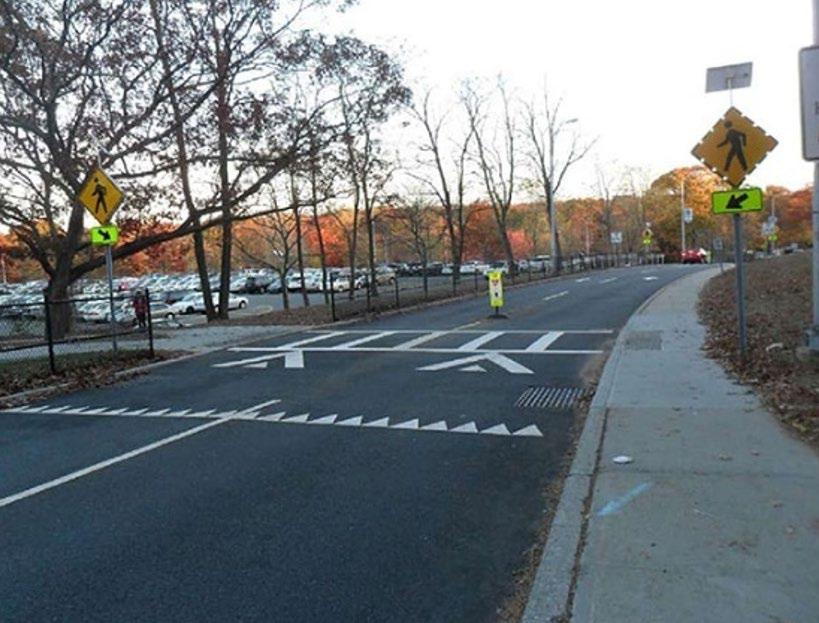
12 Federal Highway Administration (FHWA). Rectangular Rapid Flashing Beacons. https://highways.dot.gov/safety/proven-safety-countermeasures/ rectangular-rapid-flashing-beacons-rrfb
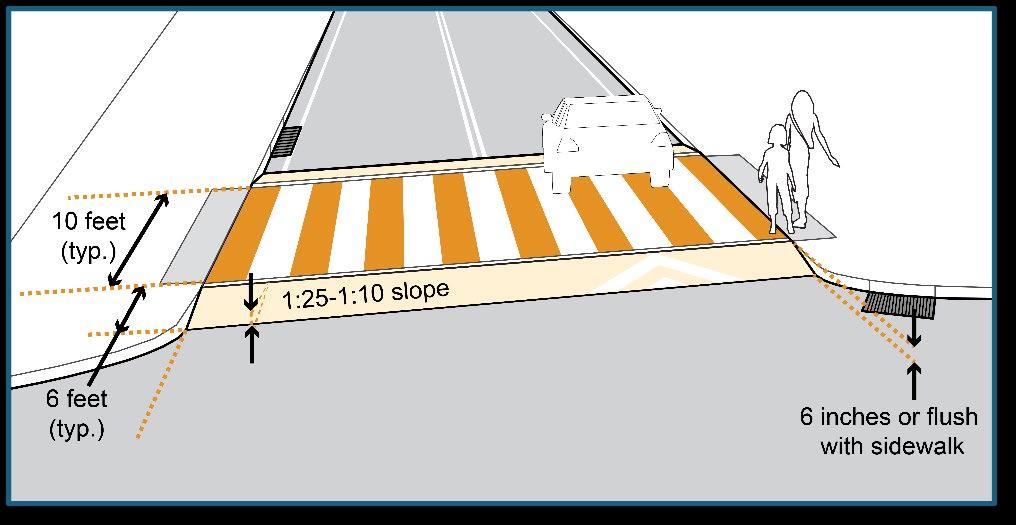
In addition to the flashing beacons, the crosswalks can also be raised for better visibility of pedestrians, as shown in Figure 5-9. Raised crosswalks are ramped speed tables that allow pedestrians to cross at grade with sidewalks.13 The raised crosswalks can be used in conjunction with the RRFBs to reduce vehicle speed and alert drivers that a pedestrian is approaching the crosswalk for safe crossing of the street. Coordination with GDOT would be required on the location and the appropriate technologies to use for the midblock crossings on SR 314/W. Fayetteville Road.
Connect roadway-adjacent pedestrian and bicycle infrastructure to trail networks
Approximately 38 miles of pedestrian and bicycle infrastructure/trails are planned for the study area according to various trail plans; not all planned trails have access to the pedestrian or bicycle infrastructure on main roadways in the Study area. Filling in missing sidewalk gaps would help connections to future shared-use trails in the Study area. A separate study may be needed to determine where additional bicycle facilities, such as lanes, cycle tracks, or sharrows can be prioritized and built.
In the northwest corner of the Study area between Phoenix Boulevard and Interstate 285, is Walker Creek Road, a partially paved road accessible from
SR 314/W. Fayetteville Road. Walker Creek Road is currently owned by the city of College Park. The road is paved for 0.18 miles, connecting to roads leading to the Country Inn & Suites by Radisson, Atlanta Airport South, and The Foster Firm. It is recommended to evaluate a possible continuation of the path as a multiuse trail to end on the right side of Brandywine Homes USA – Atlanta at Phoenix Boulevard, wrapping around the business complex.
Currently, there are no bicycle facilities in the Study area. These facilities could be in the following forms: bicycle lanes, buffered bike lanes, shared lanes, shared-use paths, and protected bike lanes. This LCI study proposes reducing the width of travel lanes on SR 139/Riverdale Road and Garden Walk Boulevard; these reductions could potentially accommodate bicycle lanes on SR 139/Riverdale Road or shared lanes on Garden Walk Boulevard. Additionally, Godby Road/Phoenix Boulevard and SR 314/W. Fayetteville Road should be considered for additional bicycle facilities. A study, in addition to coordination with GDOT, should be conducted to determine the location and type of bicycle facilities to place in the Study area.
13 FHWA. Raised Crosswalk. https://safety.fhwa.dot.gov/ped_bike/step/docs/techSheet_RaisedCW2018.pdf
Expand the transit network to support RAPID Southlake with transit options and on-demand zone
RAPID Southlake by MARTA, as shown in Figure 5-10, will eventually replace Route 196 along SR 139/ Riverdale Road. The BRT service will operate in both dedicated right-of-way and mixed traffic lanes to improve reliability and frequency of transit service. The BRT route will have three stops along Riverdale Road in the Study area: Riverwalk Lane, Norman Drive, and Flat Shoals Road. Because of the new addition of the BRT route, more transit options should be explored through a study to support and expand the transit network in the Study area.
To further expand the transit network in the Study area, MARTA could implement an on-demand zone. MARTA’s recent (2025) draft bus network redesign14 includes several on-demand zones, which will provide more flexible service than fixed route service. This service could be similar MARTA Reach15, a 6-month pilot in 2022 for on-demand shuttles in three metro Atlanta neighborhoods. The Study area could be considered as an on-demand zone to supplement RAPID Southlake; coordination with MARTA would be required to suggest the Study area as an on-demand zone.
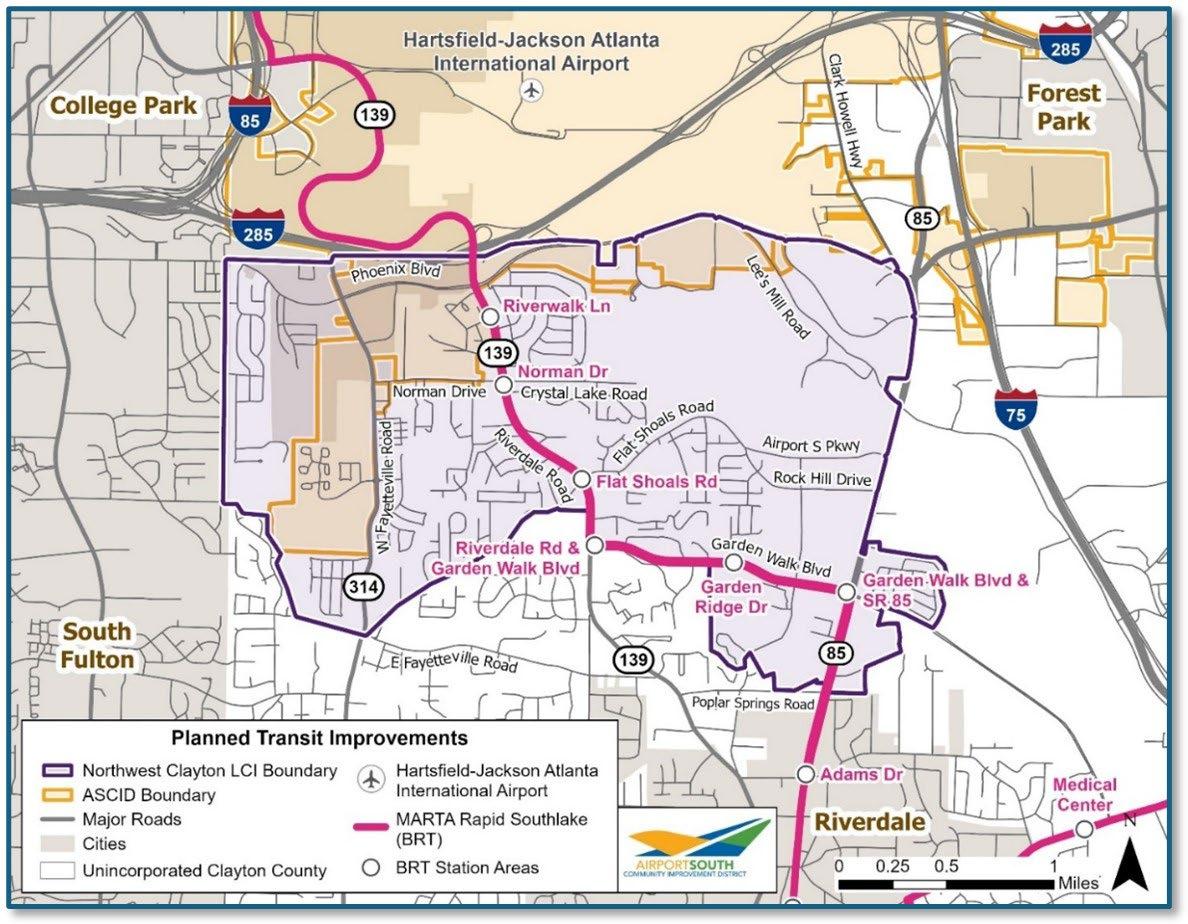
Implement amenities at bus stops according to MARTA’s Amenities Plan
MARTA has a plan to place 150 bus transit amenities across Clayton County. These amenities will include shelters, benches, mini-seats, etc. The type of amenity provided depends on the ridership of the bus stop. The plan includes benches being added to three bus stops in the Study area, which are in addition to the 17 stops with shelters and 10 stops with trash cans currently in the Study area. Figure 5-11 shows a bench and trash can at a MARTA bus stop. This recommendation would require coordination with MARTA and Clayton County on the maintenance and additional needs of the bus stops. The following amenities will be placed at different bus stops in the Study area:
• Southampton Road at Jones Circle – Bench
• Garden Walk Boulevard at W. Lees Mill Road –Bench
• SR 85 at Briar Hill Lane – Bench
Technology has become an integral part of transportation. It has been used to help people and goods move faster and safer. Some technologies should be used to improve transportation in the Study area. These smart community elements will include RRFBs (as discussed in Section 5.3.2) and transit signal priority.
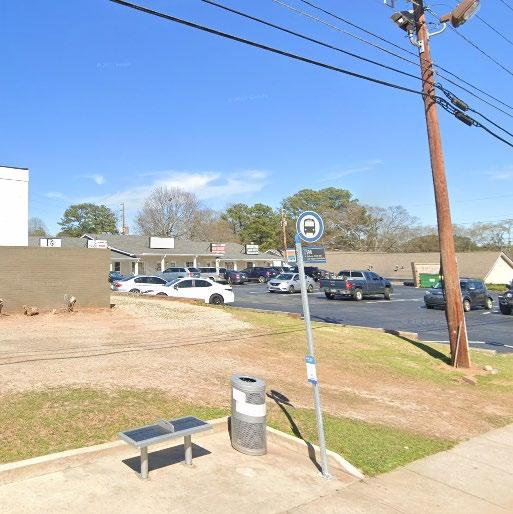
As part of RAPID Southlake, the BRT will utilize transit signal priority (TSP), displayed in Figure 5-12. This technology will prioritize transit vehicles at traffic lights. Depending on the technology used, the system could also work with emergency vehicles. Broadband access will be needed for TSP. MARTA will decide the type of transit signal priority technology to use for RAPID Southlake in the Study area.
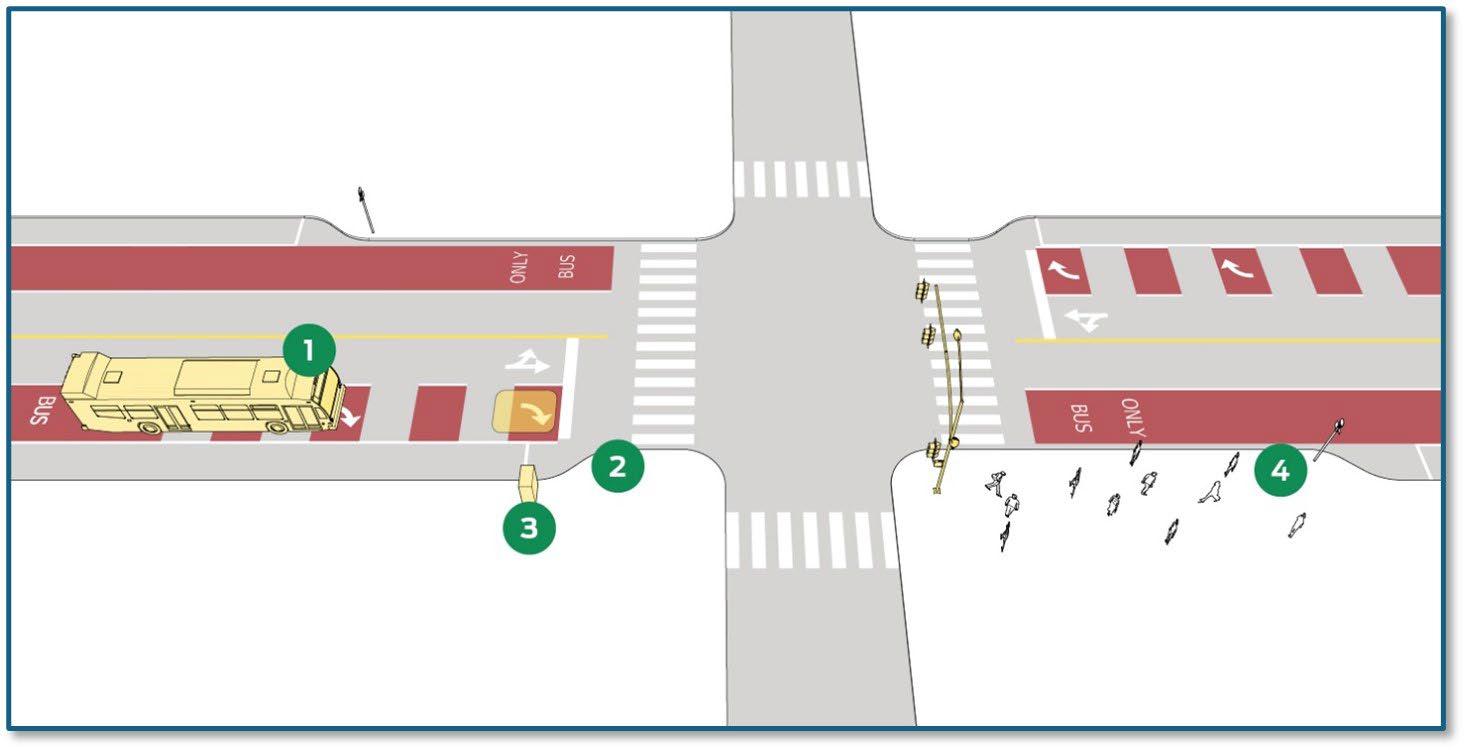
Source: National Association of City Transportation Officials
Note :16
1. On-board and wayside technology for TSP
2. In-ground loop detectors to identify transit vehicles (or other authorized vehicles)
3. Intersection signal controllers and centralized traffic signal management
4. Mobile Wi-Fi to allow transit vehicles to communicate a variety of information like real-time bus information
16 National Association of City Transportation Officials. Active Transit Signal Priority. https://nacto.org/publication/transit-street-design-guide/ intersections/signals-operations/active-transit-signal-priority/
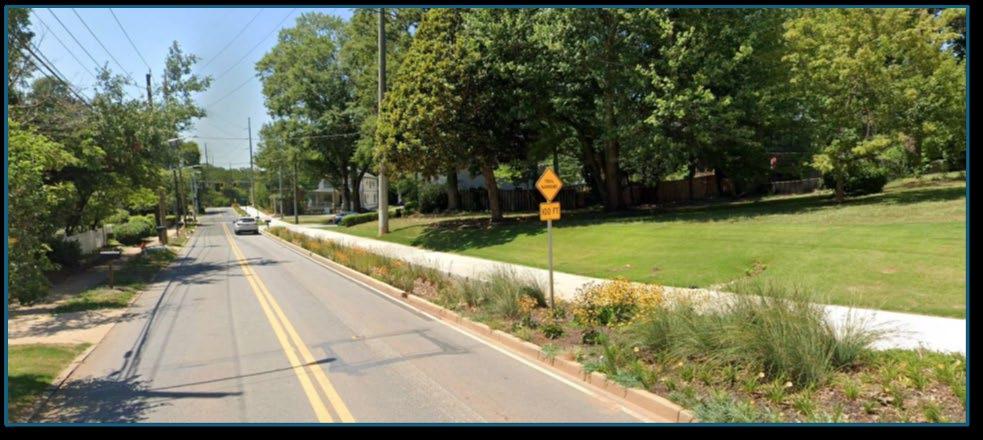
With Hartsfield-Jackson Atlanta International Airport (HJAIA) to the north of ASCID, with approximately 3,000 acres of impervious surface, the CID has the opportunity to be a leader in enhancing water quality within the Flint River Drainage Basin by incorporating Green Infrastructure Best Management Practices (BMPs) within the local streets as well as within surface parking lots. Green Infrastructure BMPs come in many forms: water quality basins, see Figure 5-13, as well as filter strips, permeable pavers, and other proprietary products. Further stormwater analysis will be needed to determine where Green Infrastructure BMPs could be utilized in the Study area.
The following images are conceptual sections of major roadways in the study area. These concepts are designed to illustrate different strategies
simultaneously on the roadway. Each section considers the length of the right-of-way in the roadway. Further design and studies will be needed for implementation of these strategies.
Godby Road/Phoenix Boulevard currently has a 100foot right-of-way. It has two car travel lanes in both east/west directions, separated by a grass median. MARTA Route 195 travels down the road along with shelter bus stops along the north side of the road and bus stops with trash cans on the south side of the road. Business and commercial properties are separated from the roadway by parking lots. Strategies include filling in the missing sidewalk gaps, adding pedestrian lighting, and adding a five-foot protected bike lane and a three-foot buffer with bollards. These strategies, displayed in Figure 5-14, aim to make the roadway more pedestrian and bicycle friendly.
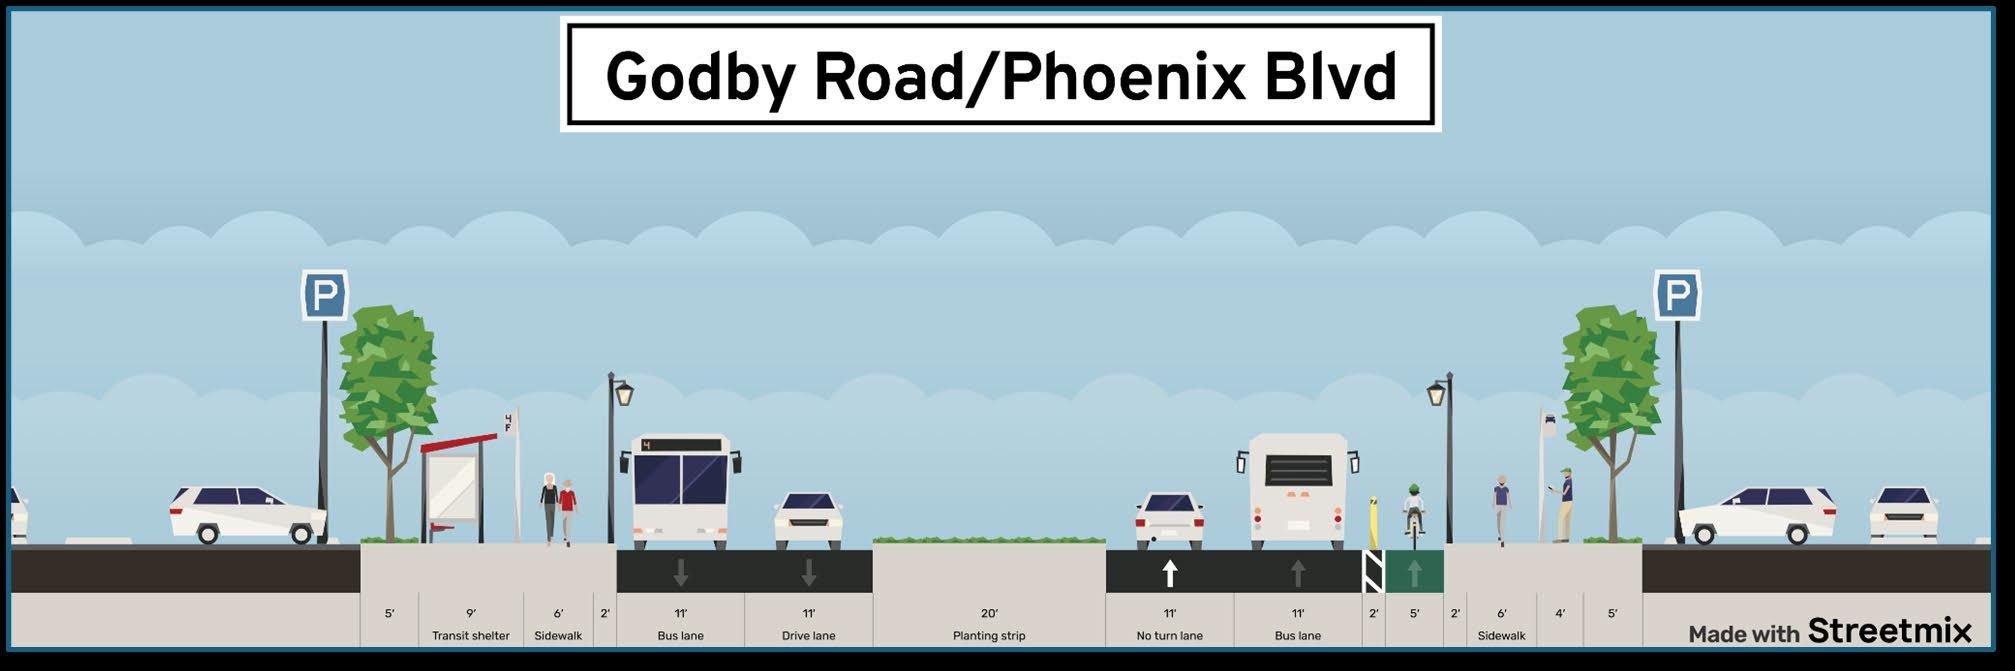
SR 314/W. Fayetteville Road is a two-lane road with 80-foot right-of-way and additional turn lanes at various points. There is no public transit operating on this road. Land use along the road consists of schools, commercial retail, and residential developments. The strategies, as shown in Figure 5-15, for this
roadway are adding a five-foot protected bike lane, a three-foot buffer with bollards, and pedestrian scale lighting. These strategies could reduce vehicle speeds, accommodate existing sidewalks, and add bicycle facilities to provide multiple ways of travel along the roadway.
In addition to the strategies listed above for SR
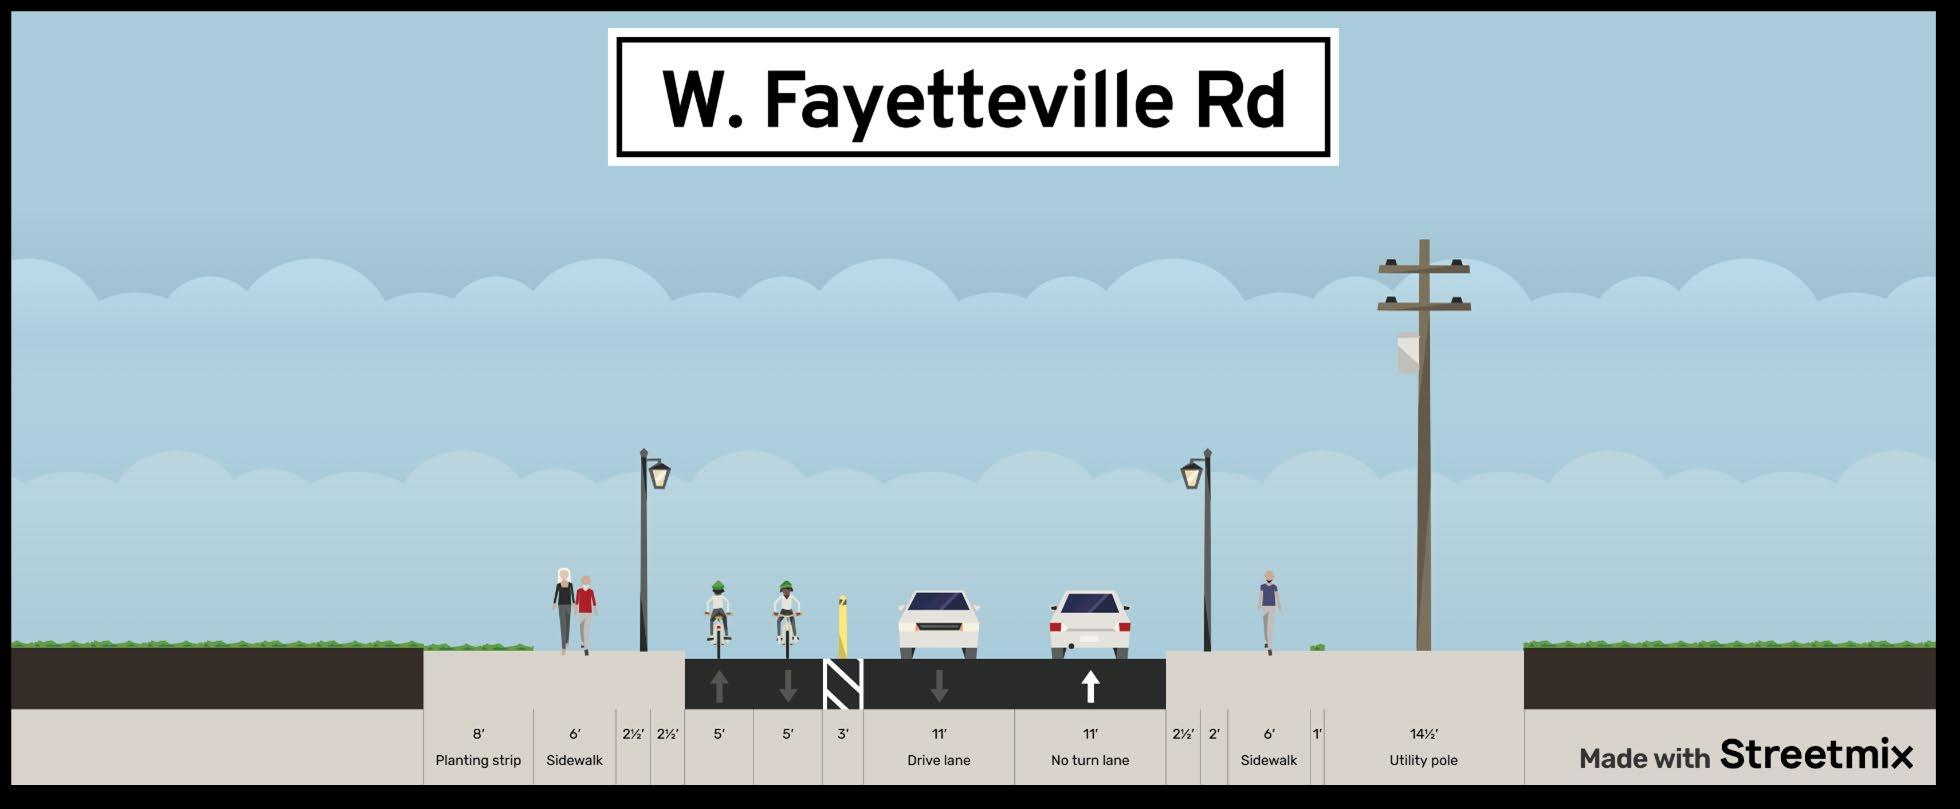
314/W. Fayetteville Road, midblock raised crosswalks with RRFBs (as shown in Figure 5-16 below) are another strategy to be implemented. These crosswalks should be placed near the schools so that students and non-students alike can cross the street safely to
enter school grounds. These crosswalks would alert drivers to the potential high-pedestrian activity in area, indicating that they should slow down while school is in session.
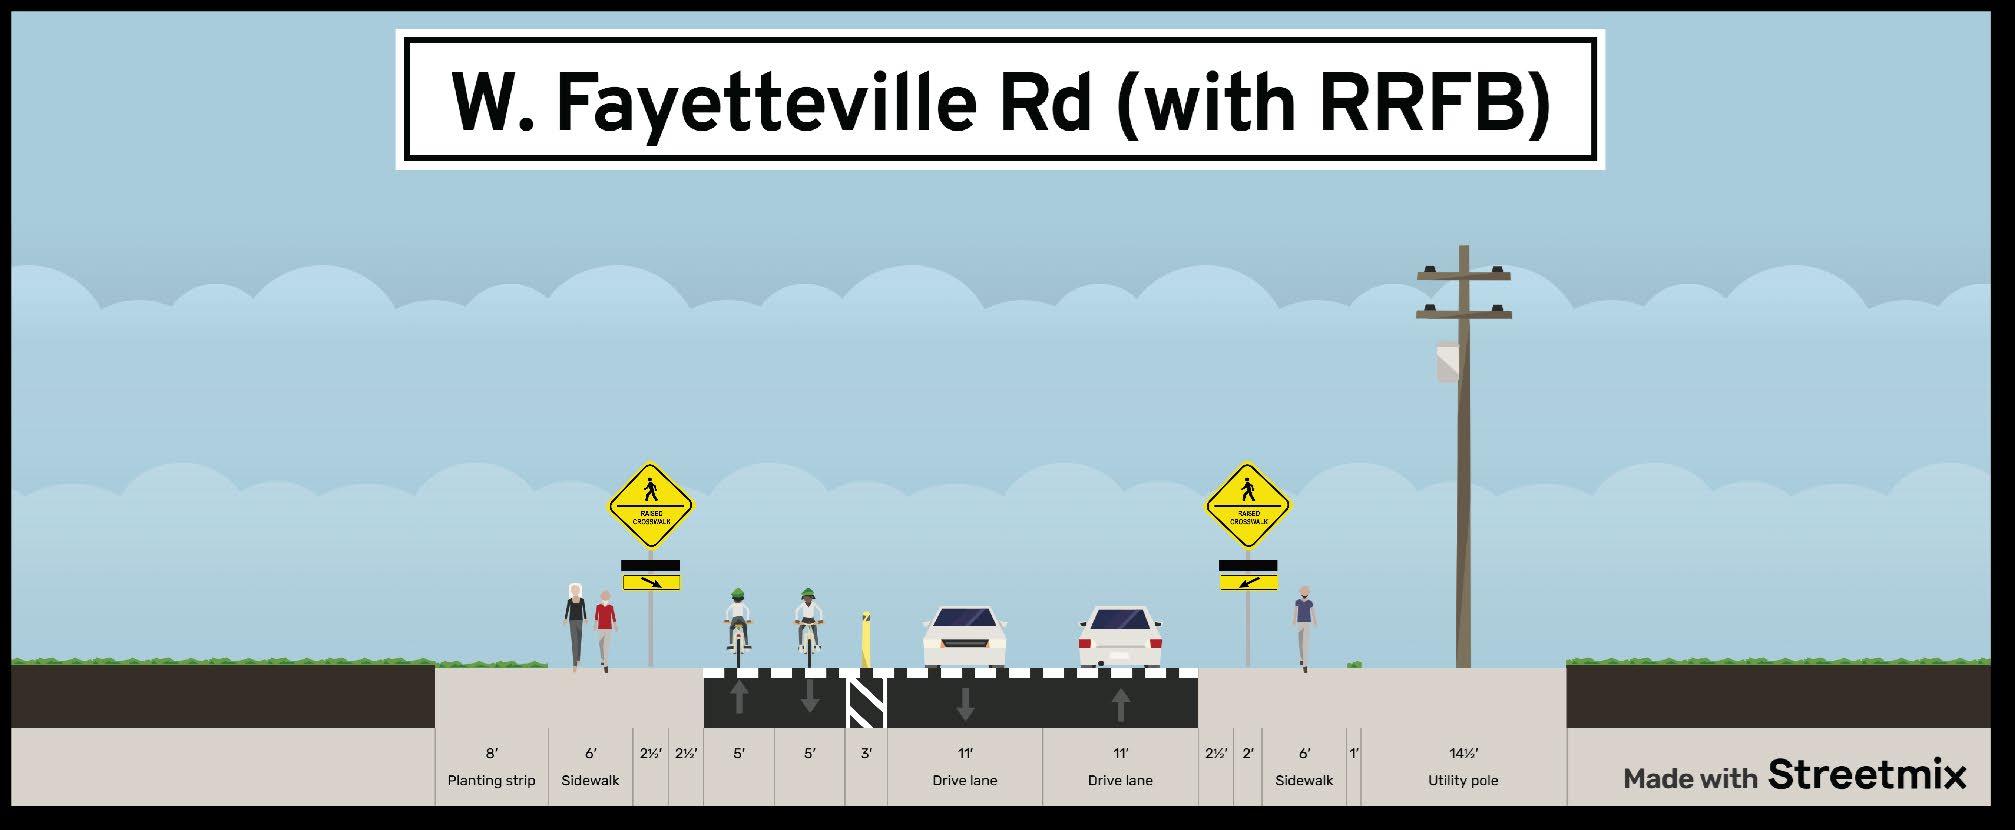
As a multi-lane road, SR 139/Riverdale Road is a major commercial corridor in the Study area with 92 feet of right-of-way. It has four-travel lanes, two in either north/south directions, and a central turn lane. Currently, MARTA Route 191 travels along the road, but RAPID Southlake will be operating on the road in the future. The roadway provides access to multiple businesses, neighborhoods, and a school in the
Study area. Figure 5-17 shows a concept for SR 139/ Riverdale Road as a suggestion to add bicycle facilities. Planning for the bicycle facilities will have to be considered by MARTA as a part of RAPID Southlake’s planning and design process. Additional strategies include reducing car travel-lanes to 11-feet widths, a five-foot protected bike lane, a three-foot buffer with bollards, and pedestrian scale lighting within the rightof-way.
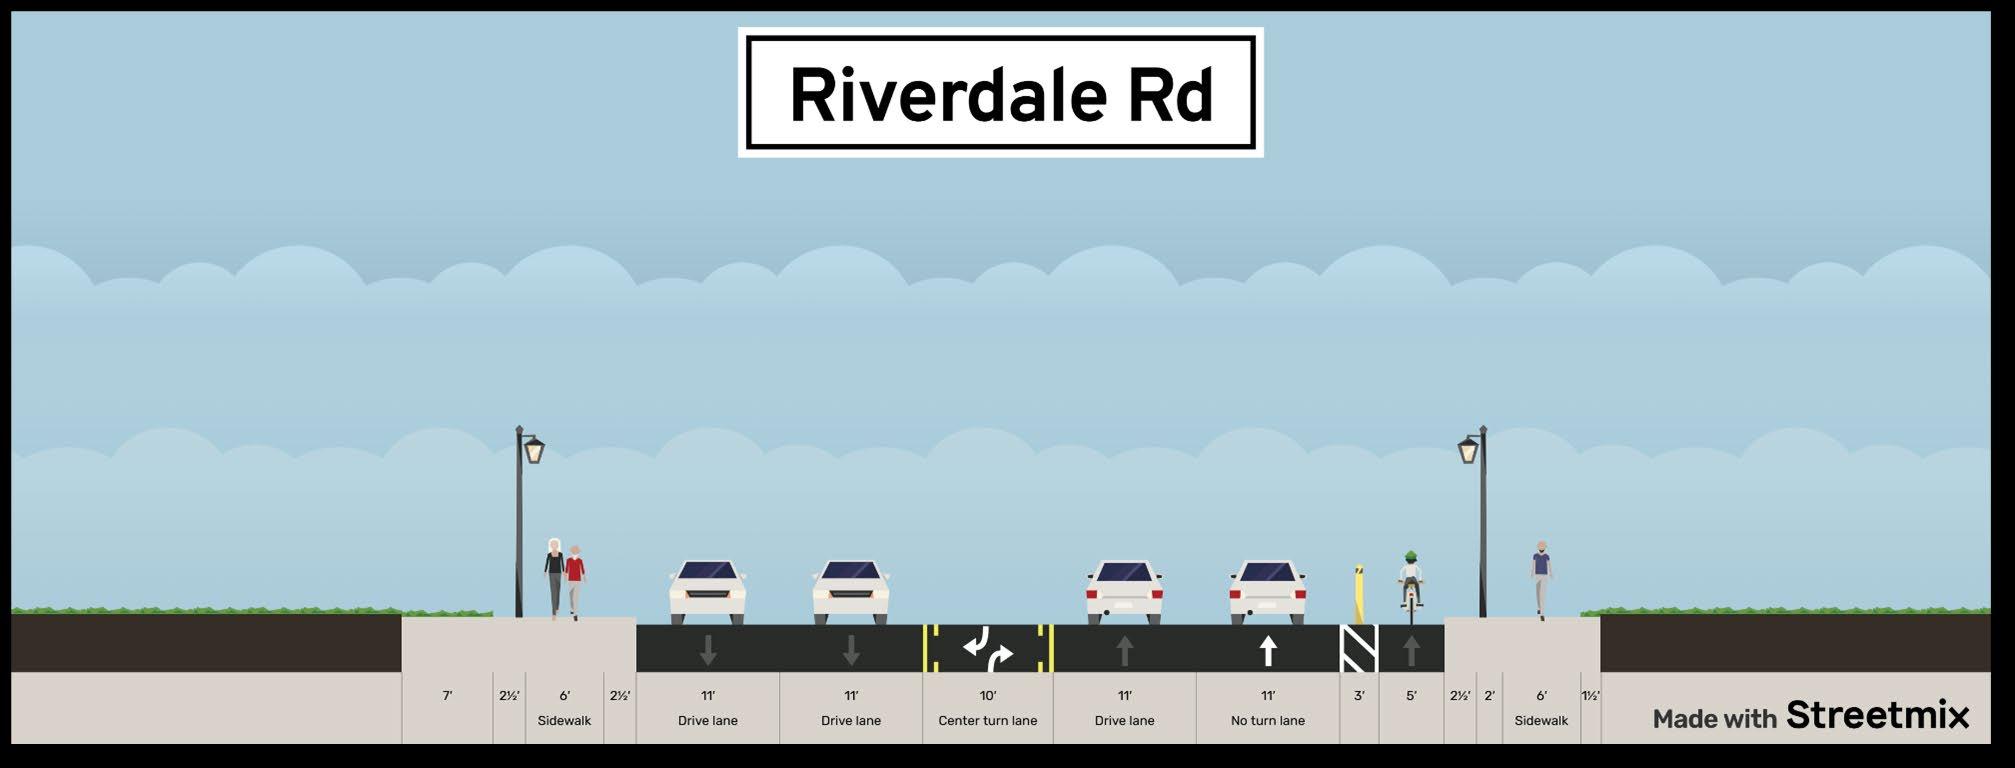
5.6.4.
Garden Walk Boulevard is a four-lane road with a 100foot right-of-way. There are two MARTA bus routes on this road: Route 191 and 196. Multi-family residential complexes are separated by tree buffers on either side of the road. Figure 5-18 displays multiple strategies, including reducing car travel-lanes to 10-feet widths, adding sharrows, and adding pedestrian scale lighting.
Incorporating these strategies should enable MARTA riders and residents to feel safer when walking and biking along Garden Walk Boulevard. Ultimately, any improvements to Garden Walk Boulevard should mimic the changes to the boulevard outside of the Study area due to the Flint River Gateway Trails Project (2024). This project calls for a 10-foot wide path along Garden Walk Boulevard.
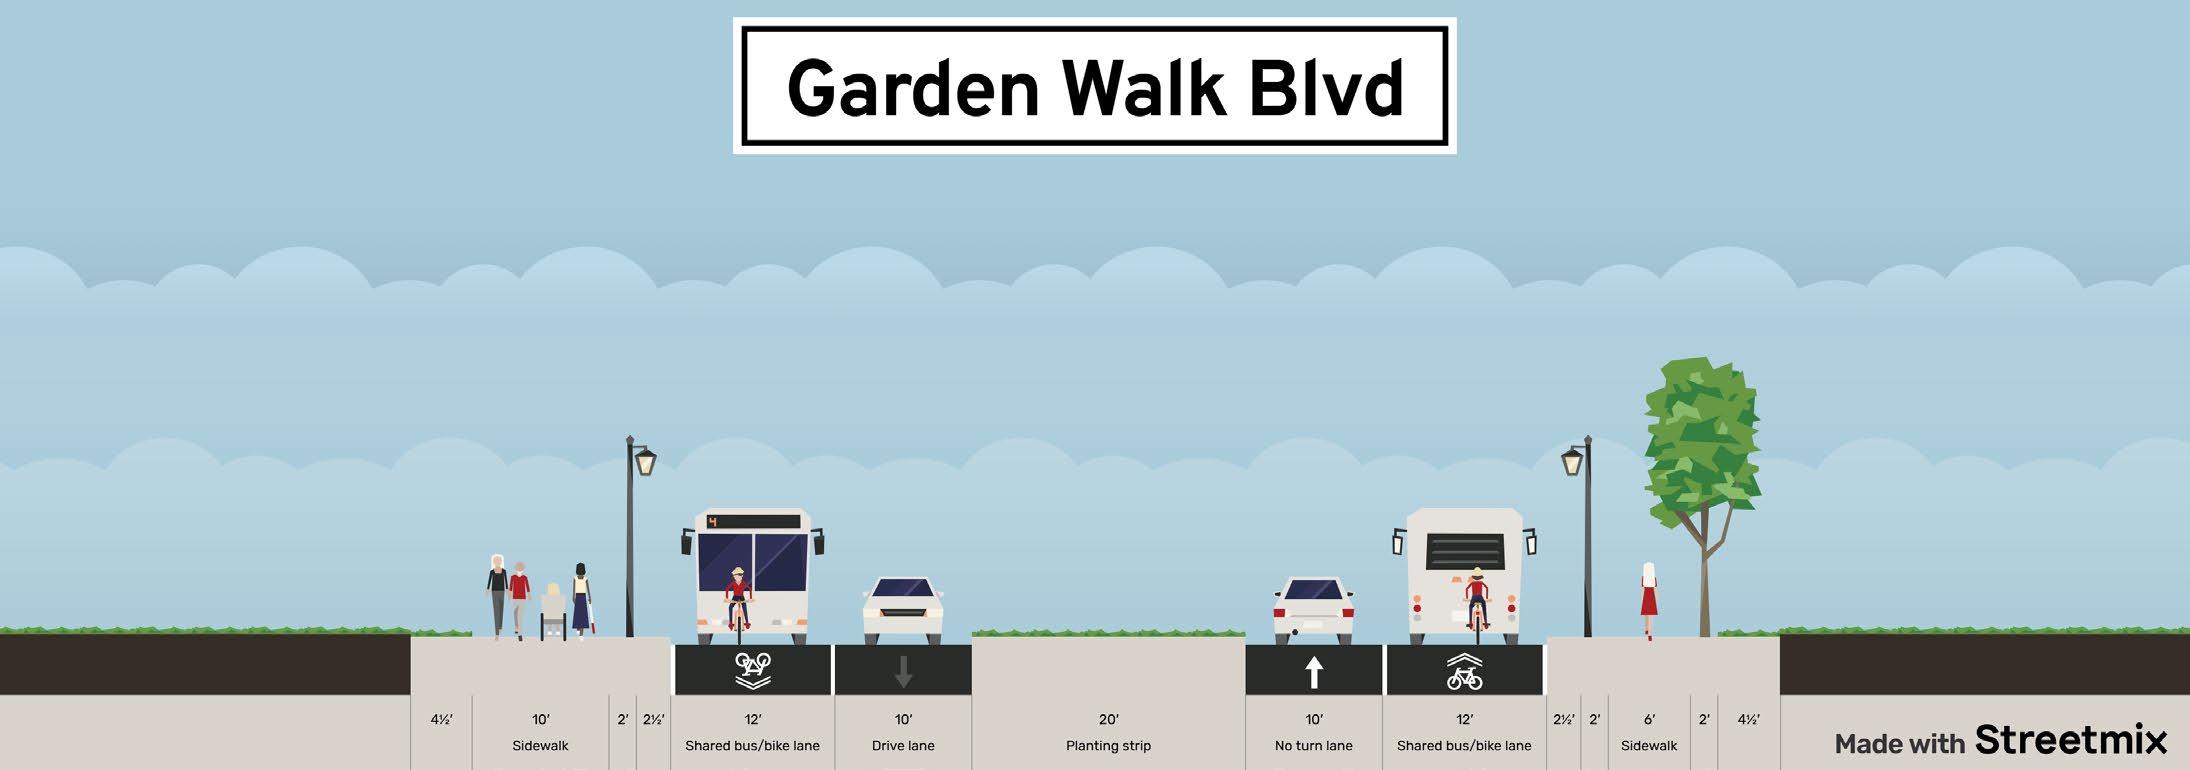
The transportation strategies were developed to achieve two of the four goals of this LCI Study:
1. Enhance multimodal access, safety, and infrastructure; and
2. Expand multimodal and transit connections to the area’s largest employers.
The process of implementing these strategies will consist of coordination between major partners and planning and evaluation studies to further determine pathways forward. Collaboration must be with federal partners: the Federal Highway Administration and Federal Transit Administration; state partner: GDOT;
and local partners: Clayton County, City of College Park, and MARTA. These partners must be involved in the planning, evaluation, and development of mentioned studies to determine if the strategies will meet the needs of the LCI study area, its residents, employees, and business owners. More details on how these strategies could be implemented will be documented in the implementation plan
The strategies in Section 6 stem from the Market Analysis results and policy responses from the existing conditions, review of previous plans (relating to the Study area), coordination with the Clayton County Comprehensive Plan Team, and public and stakeholder feedback.
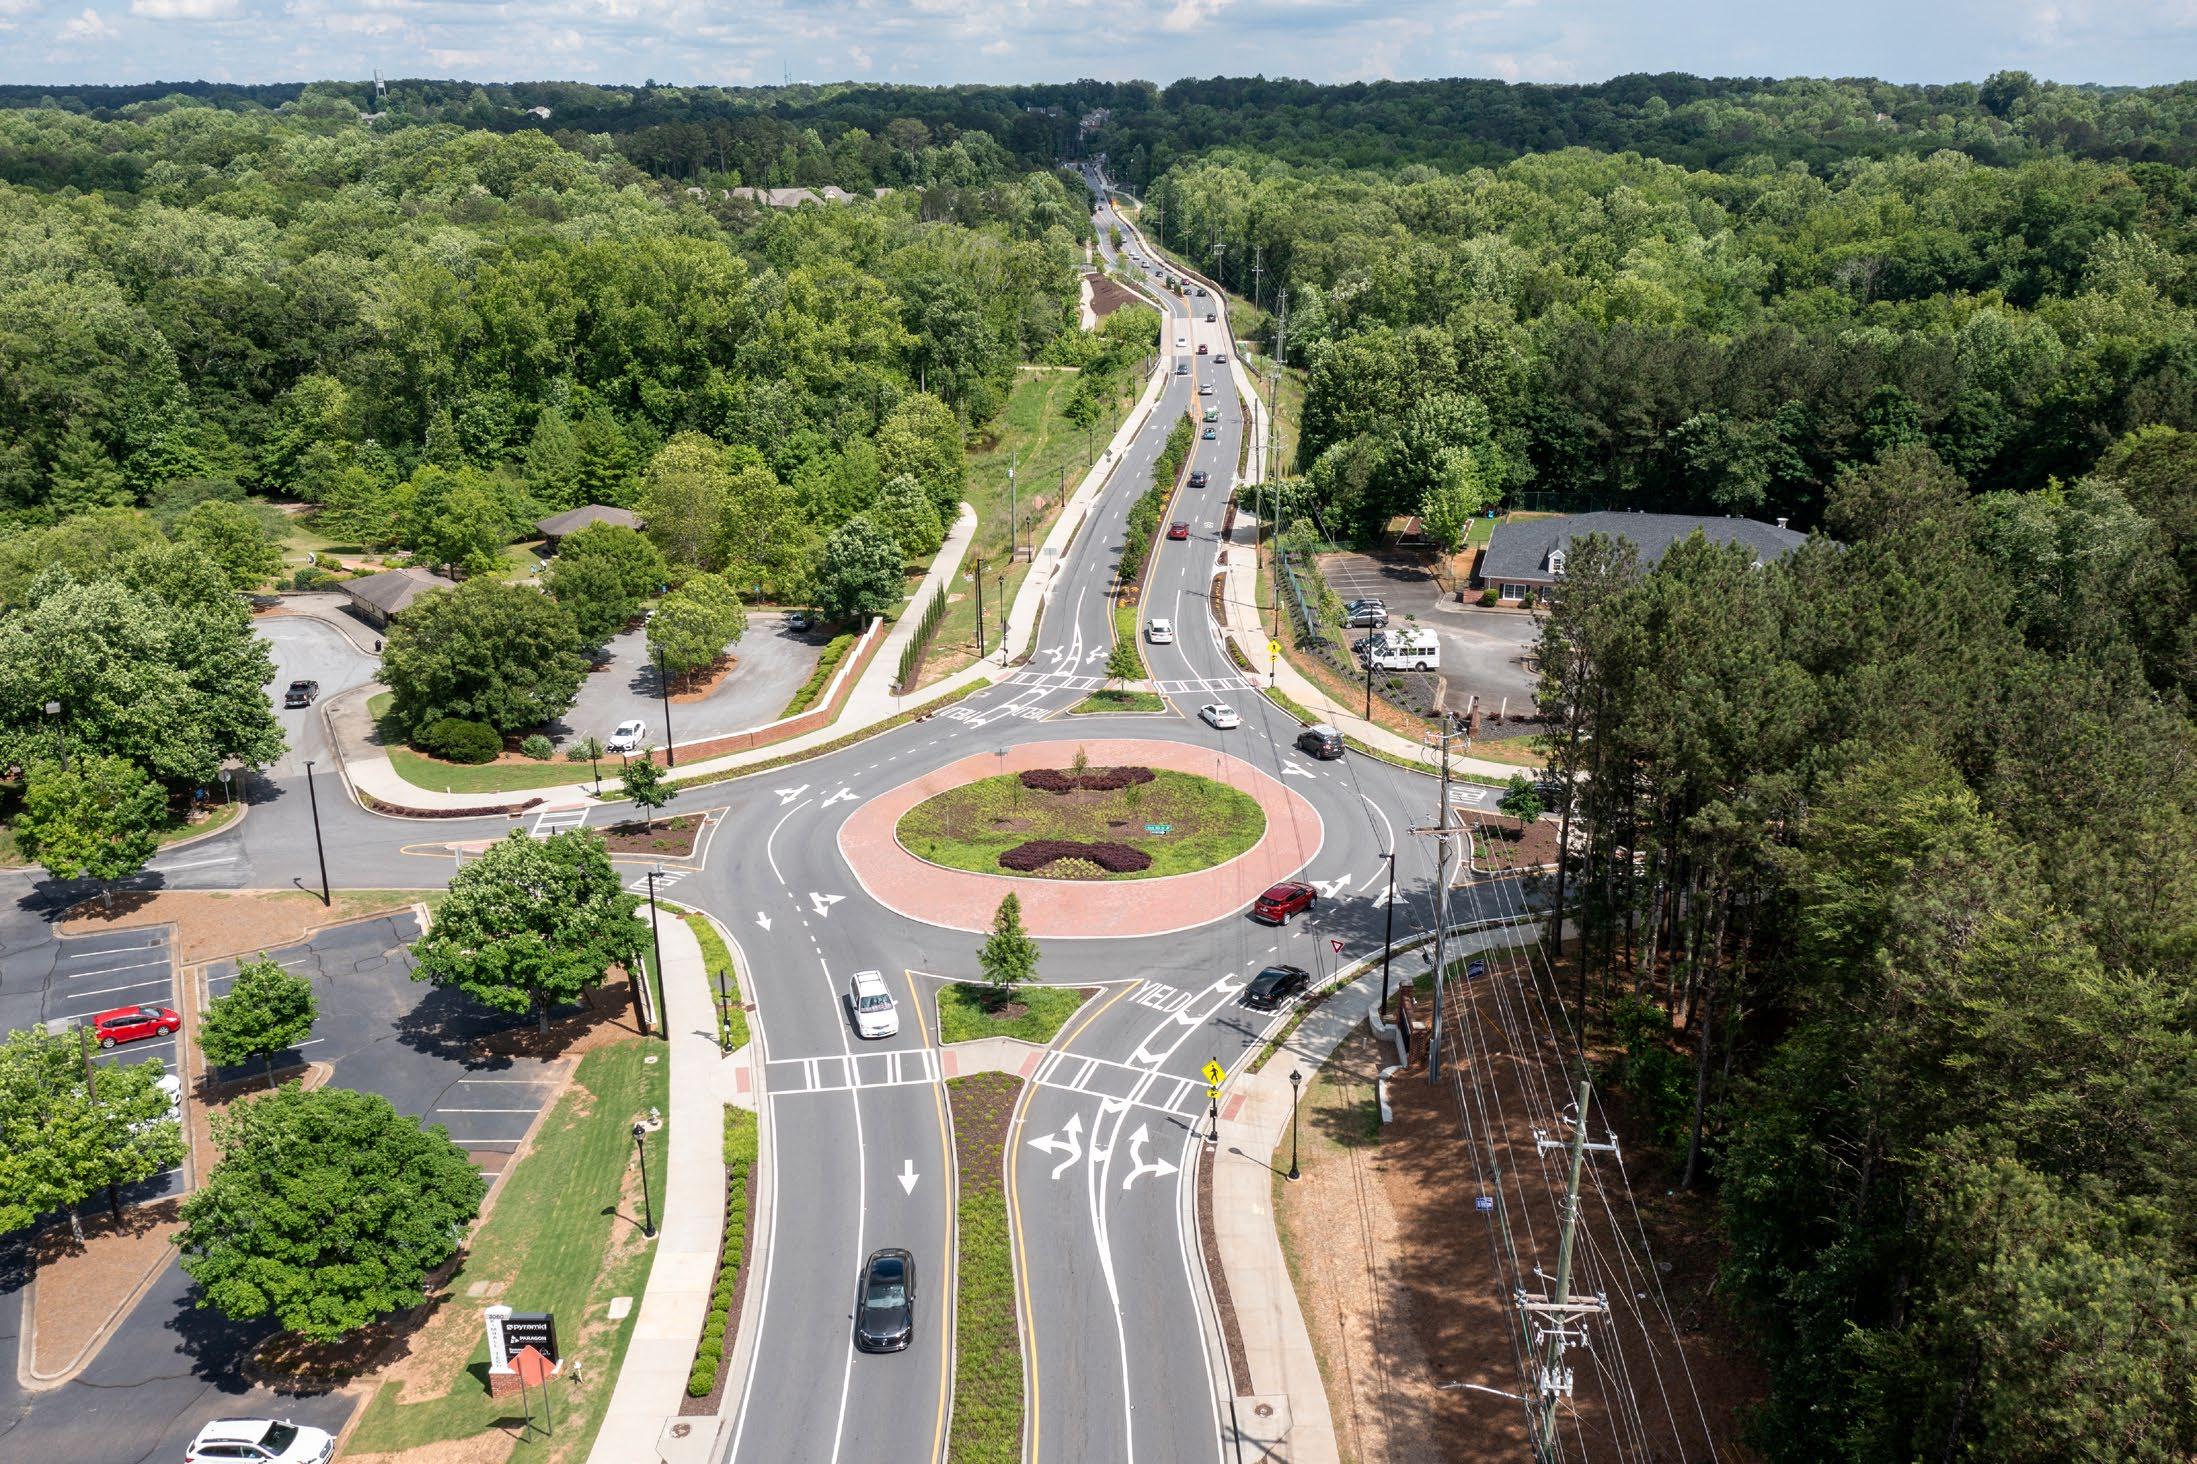
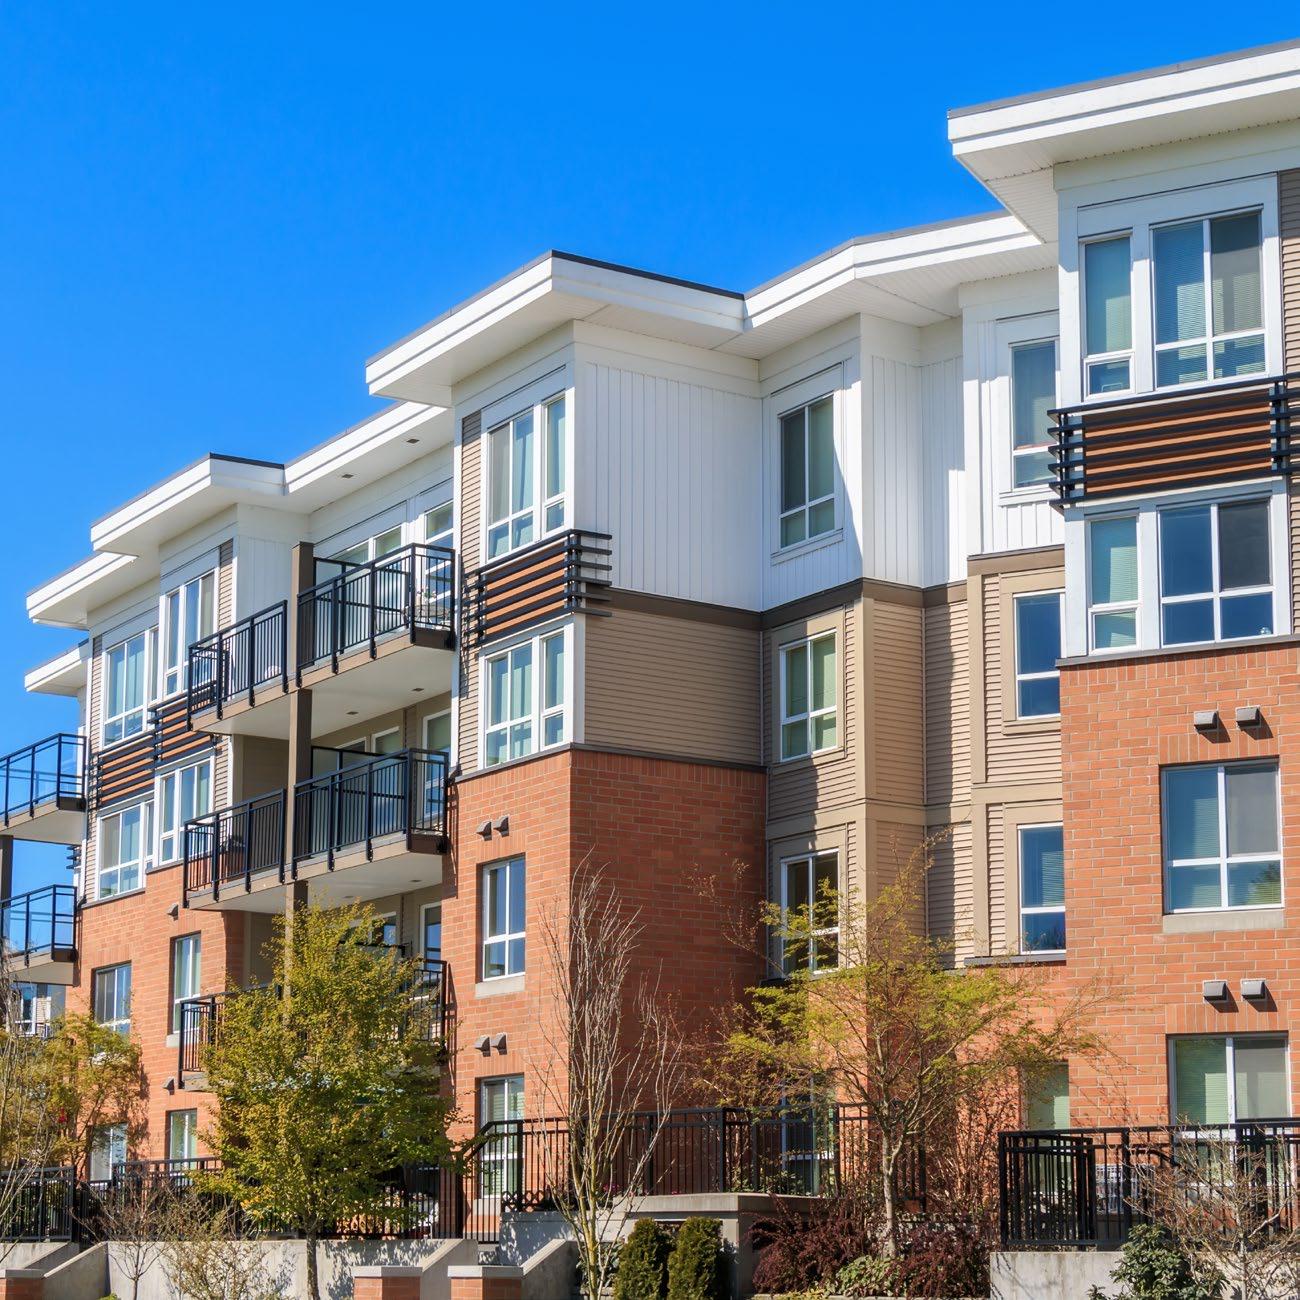
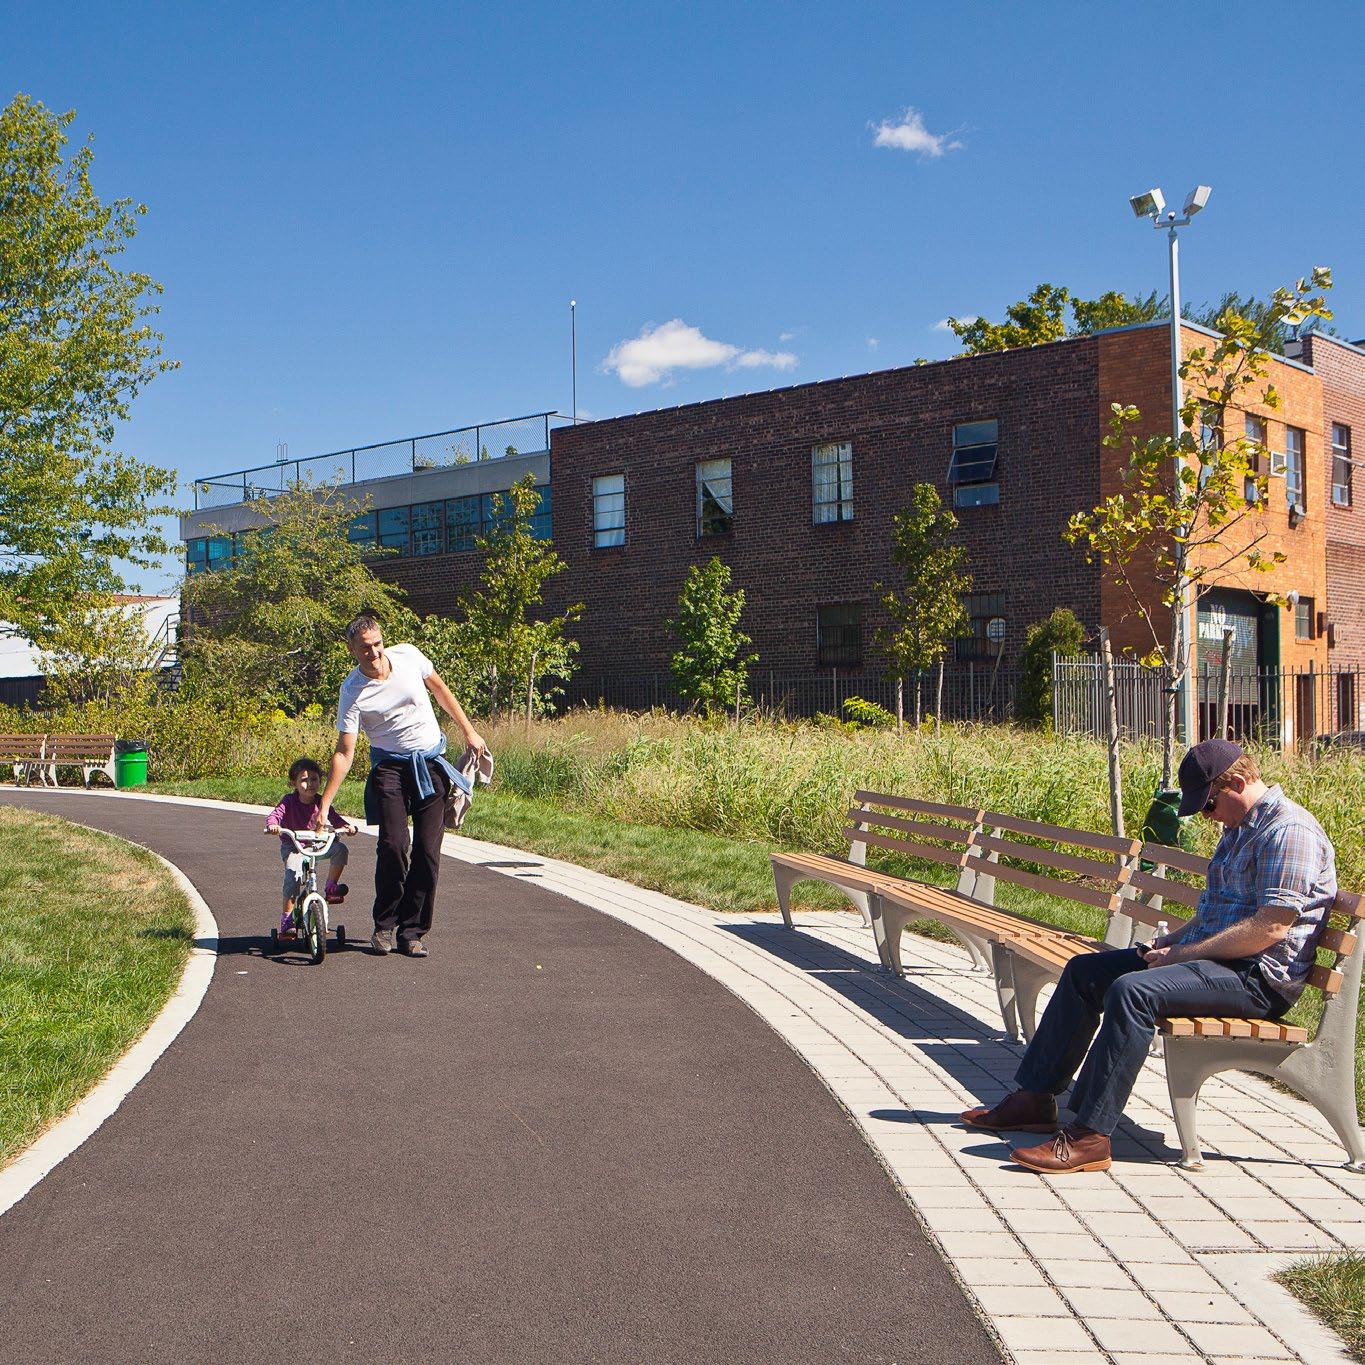
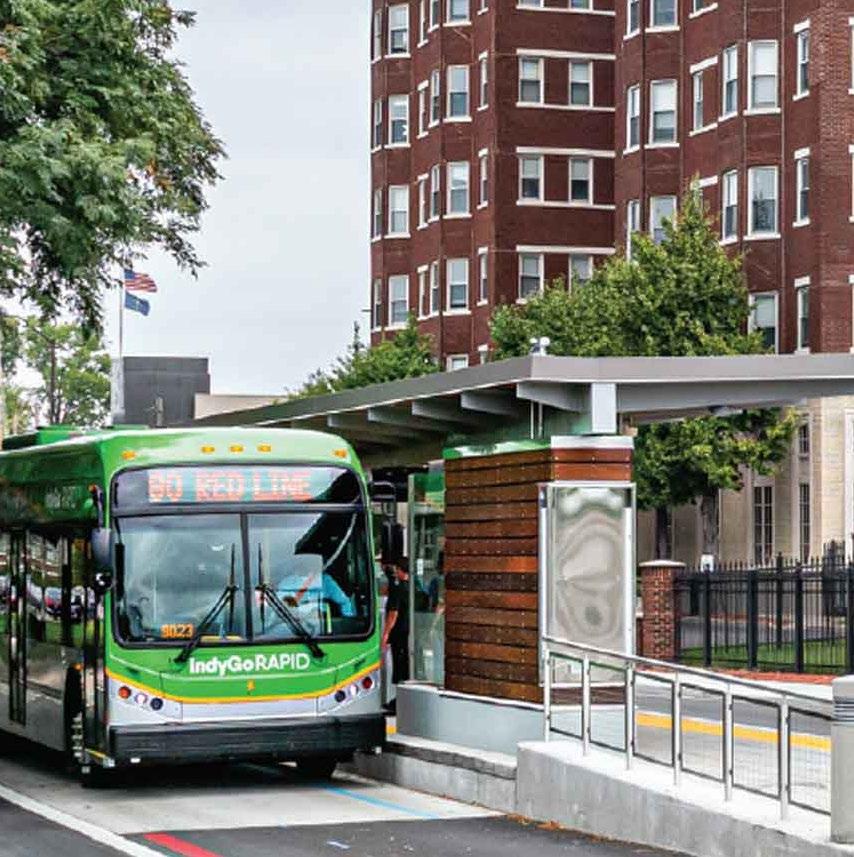
The project team met with the PAC and public on several occasions. The PAC consists of representatives from key stakeholders serving in an advisory capacity on the project. Table 6-1 displays the top economic development, land uses, and housing desires made by the PAC and public in the first round of public/ stakeholder involvement meetings.
Additional comments from the public involved needing fuel stations and/or travel plazas around the State Route (SR) 139/Riverdale Road and Interstate 285 area and needing more restaurants on SR 139/Riverdale Road and Garden Walk Boulevard. The public was also concerned about old housing and wanted the project team to prioritize redevelopment over new development.
On November 1, 2024, the project team met with the Clayton County Comprehensive Plan Team to discuss the catalytic sites and the comprehensive plan update
land uses. Three catalytic sites were presented with their future land uses (FLUs) along with recommended facilities and building uses. The land use analysis and the meeting determined that there were no conflicts between the catalytic sites’ FLUs and the project team’s recommendations. More information on the catalytic sites, land uses, and strategies are provided below.
Previous plans were reviewed as part of the existing conditions report and this report regarding housing, land use, and economic development. Clayton Moving Forward: 2024 Comprehensive Plan – A Vision for the Future (2024) by Clayton County, Sizemore Group, Kimley Horn and Sycamore Consulting, Inc. and the City of College Park 2021 Comprehensive Plan (2021) by Atlanta Regional Commission (ARC), were researched for the land use analysis described above. Other plans reviewed include: Clayton County 2019 Comprehensive Plan (2019) by ARC, Aerotropolis Atlanta Blueprint (2016) for Aerotropolis Atlanta, by Jacobs, MXD Development Strategists, GLDPartners, Jones Worley, and Populous; Northwest Clayton Tax Redevelopment Area and Tax Allocation District Plan (2008) by Huntley Partners, Inc., and Metro Atlanta Housing Strategies Toolkit by ARC. Brief reviews of these plans can be found Appendix A.
The Northwest Clayton Redevelopment Area and Tax Allocation District Plan
The Northwest Clayton TAD Plan identified key development nodes in the Study area: Cherry Hills Subdivision Redevelopment, Godby Road Corridor Redevelopment, and Norman Drive/West Fayetteville Road.
The TAD plan does not have a map that shows all of the nodes; the map, as shown in Figure 6-1, comes from the Northwest Clayton LCI Plan, December 2004. Two of the nodes, Godby Road and Norman Drive/ West Fayetteville Road, are a part of the catalytic sites (Site One and Site Two) to be recommended in this plan. The Cherry Hills Subdivision Redevelopment currently consists of single-family houses with very little vacancies. The Cherry Hills Subdivision Redevelopment was not explored as a key development node because this LCI Study wanted to focus on areas with vacant land to better utilize space in the Study area.
The Godby Road Corridor Redevelopment node was suggested to have a master planned business district, intersection improvements at Phoenix Boulevard, SR 314/W. Fayetteville Road and Godby Road, streetscape improvements, and construction of sidewalks on Phoenix Boulevard. All of these recommendations are included in the strategies for Site One. Additionally, the master-planned business district will also include mixed uses of commercial, office, and residential to provide more variety in land uses.
Most of the recommendations for the Norman Drive/ West Fayetteville Road node have been implemented. Since the TAD Plan, the parcels in the area have been rezoned from light industrial to residential, and neighborhood commercial zoning was added for more housing and more appropriate land uses near North Clayton Middle School. It was redeveloped in 2010 to include a grocery store, retail, and singlefamily houses. More residential spaces flank each of the schools and a traffic light was installed at the intersection of SR 314/W. Fayetteville Road and East Pleasant Hill Road. Other recommendations include extending East Pleasant Hill Road to the Clayton/ Fulton County line and expanding transit to SR 314/W. Fayetteville Road.
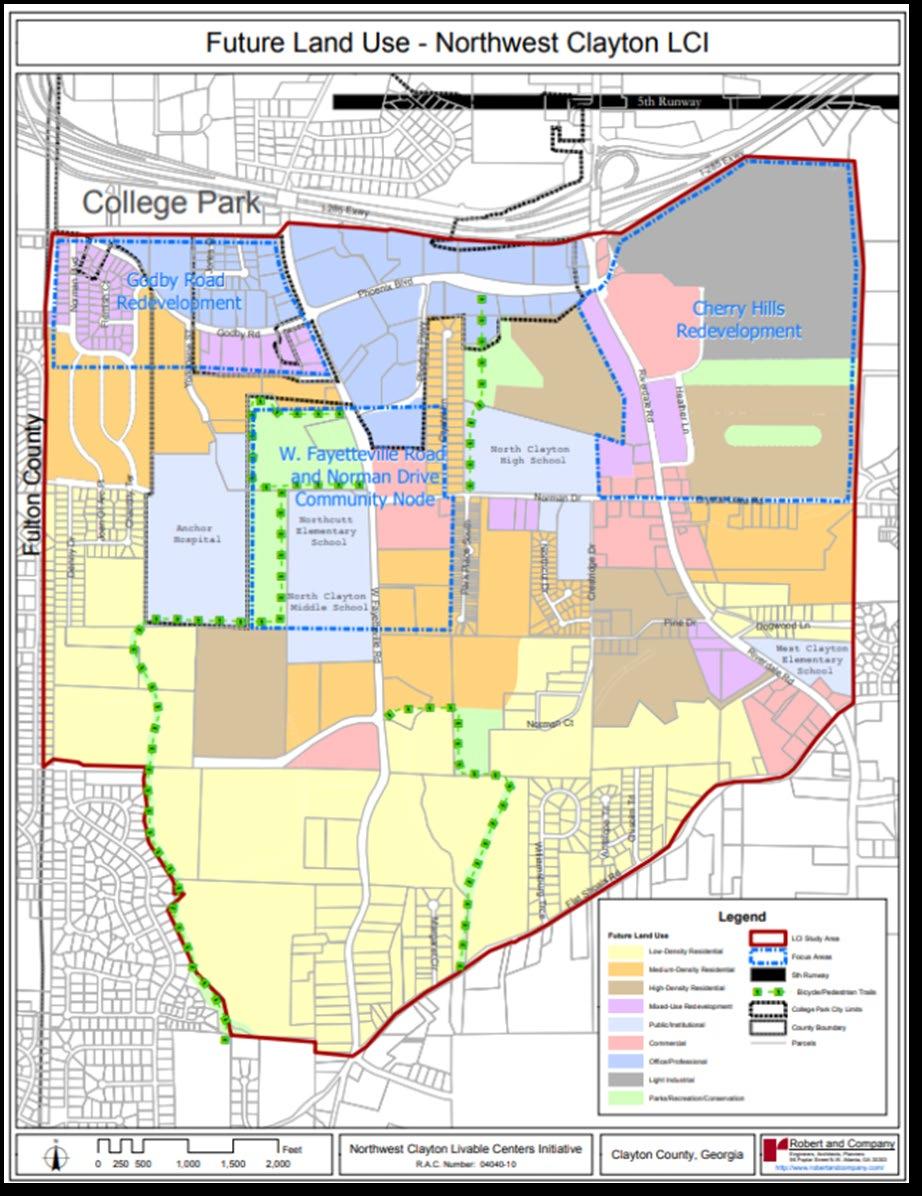
Source: Northwest Clayton LCI Plan. December 2004
Figure 6-2 shows the potential development nodes that make up the vision in the Study area. These development nodes serve as the purpose for each of the catalytic sites and how they would function in the Study area.
There are four development nodes and two gateways that comprise the vision in the Study area:
• Gateways – at the SR 139/Riverdale Road/SR 314/W. Fayetteville Intersection and Phoenix Boulevard and SR 139/Riverdale Road to provide a great first impression of the Study area.
• Local “Village” Node - should have a neighborhood feel with land uses and work opportunities to serve the local community.
• Regional Node - should focus on land uses for the community, Clayton County, and the Atlanta region, as it will include a BRT stop from MARTA RAPID Southlake, a BRT route.
• National Node - should focus on greenspace and limited development. It has the potential to utilize the Flint River and connect to the Atlanta Beltline through trails.
• Community Node - should serve as an educational zone and focus on safe access to the schools for students, staff, and the community.
The nodes derived from policy responses and the results of the market analysis, which led to the initial concepts layouts in Figure 6-3. The initial concept layouts introduce potential land uses and spacing for buildings, landscaping, and infrastructure improvements as the nodes evolve into catalytic sites. More refined layouts of the sites are presented in Sections 6.6.1 - 6.6.3. This report will focus largely on the local “village”, regional, and national nodes. The gateways are discussed in the Placemaking report; the community node has strategies relating to transportation in the Transportation Strategy report.
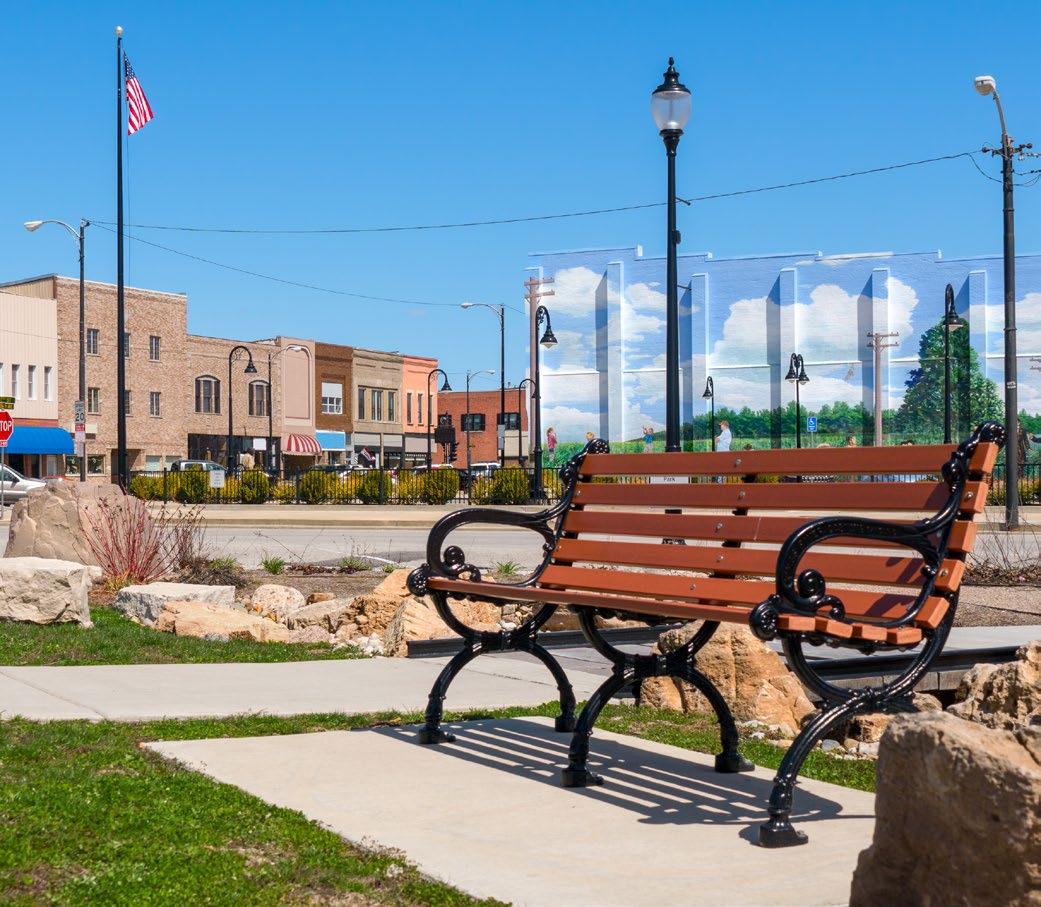
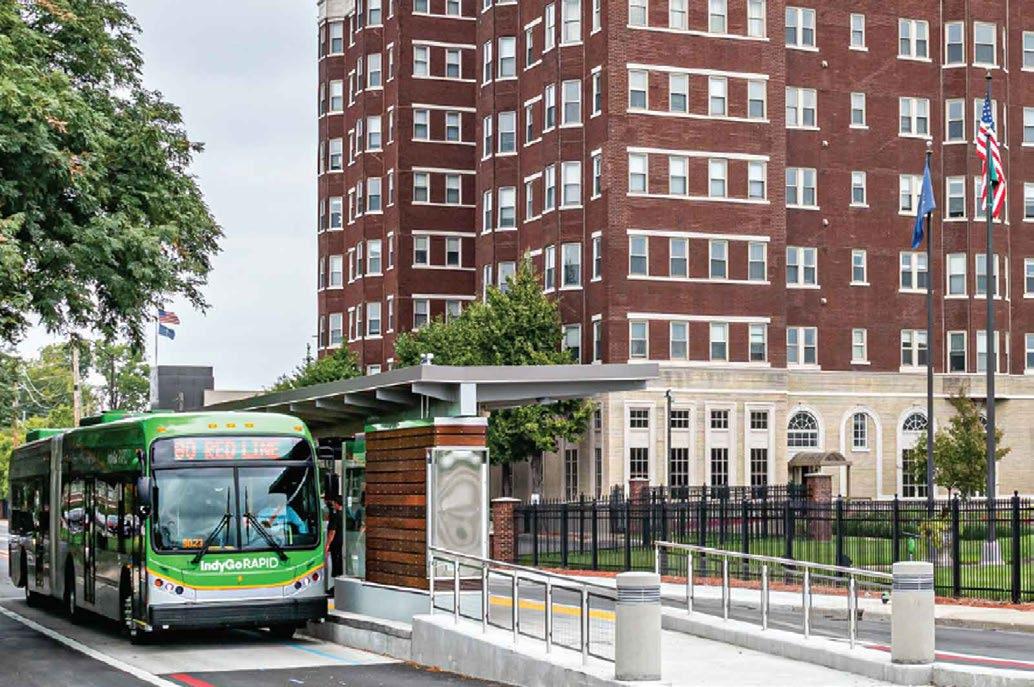
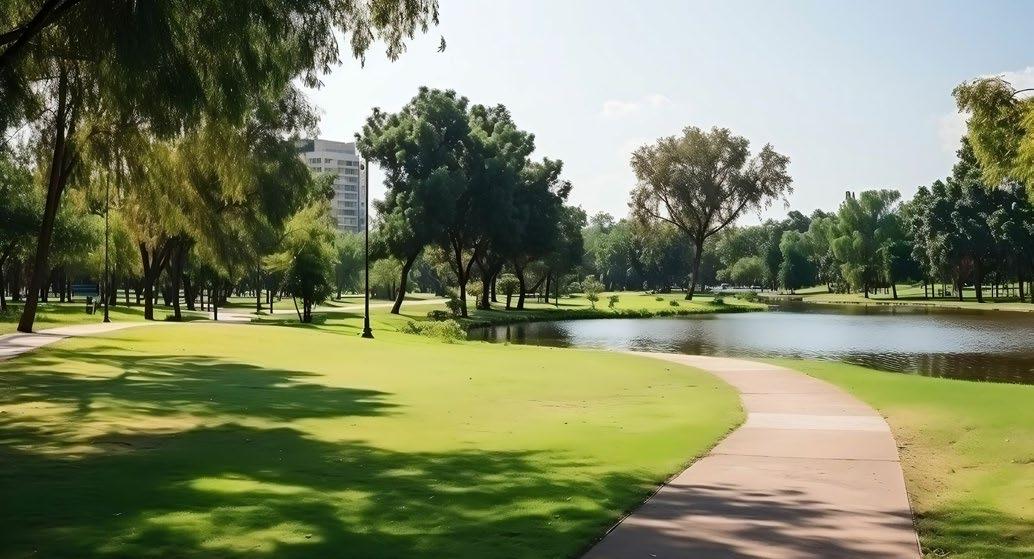
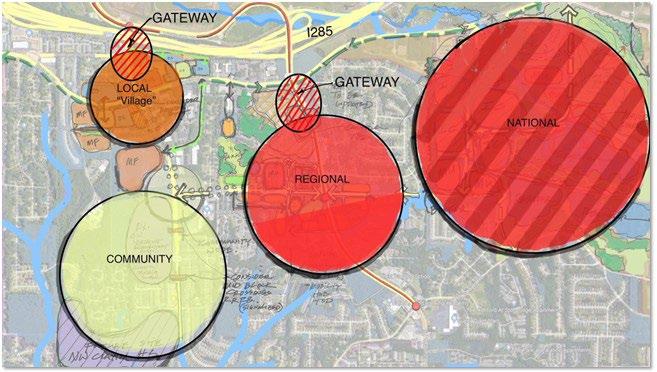
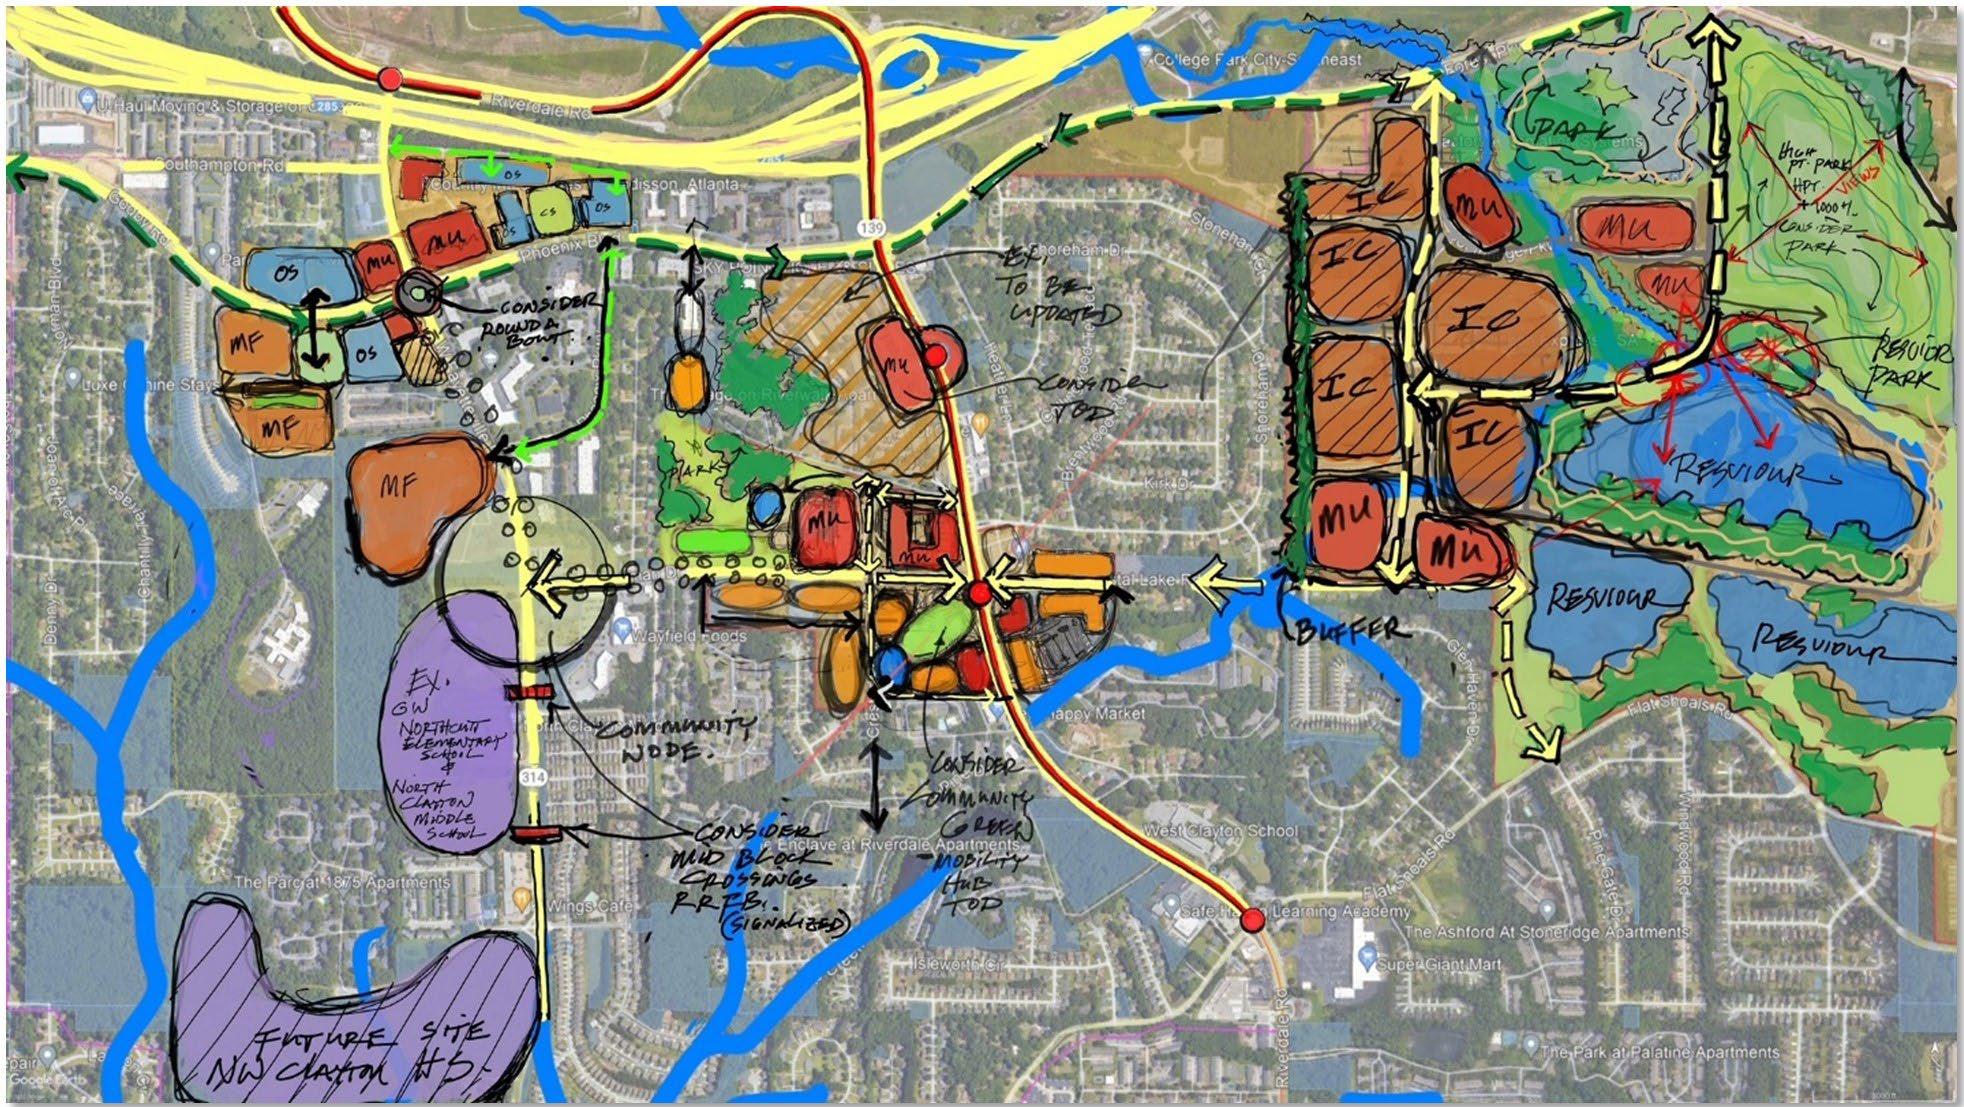
Strategies for economic development revolve around the catalytic sites, land use, and housing. This section will provide more detailed existing conditions and the proposed land uses for each of the catalytic sites. It will also provide specify zoning recommendations to accommodate the proposed land uses. Housing strategies will revolve around improving existing housing and diversifying housing in the Study area.
The project team recommends three catalytic sites, see Figure 6-4, for redevelopment in the Study area: (1) Godby Road, (2) Riverdale Road/Norman Drive, (3) The Quarry. Catalytic sites are parcels clustered together, chosen based on location, existing properties, and potential synergy with surrounding area. The catalytic sites should foster redevelopment and TOD investments through new land use and zoning policies.
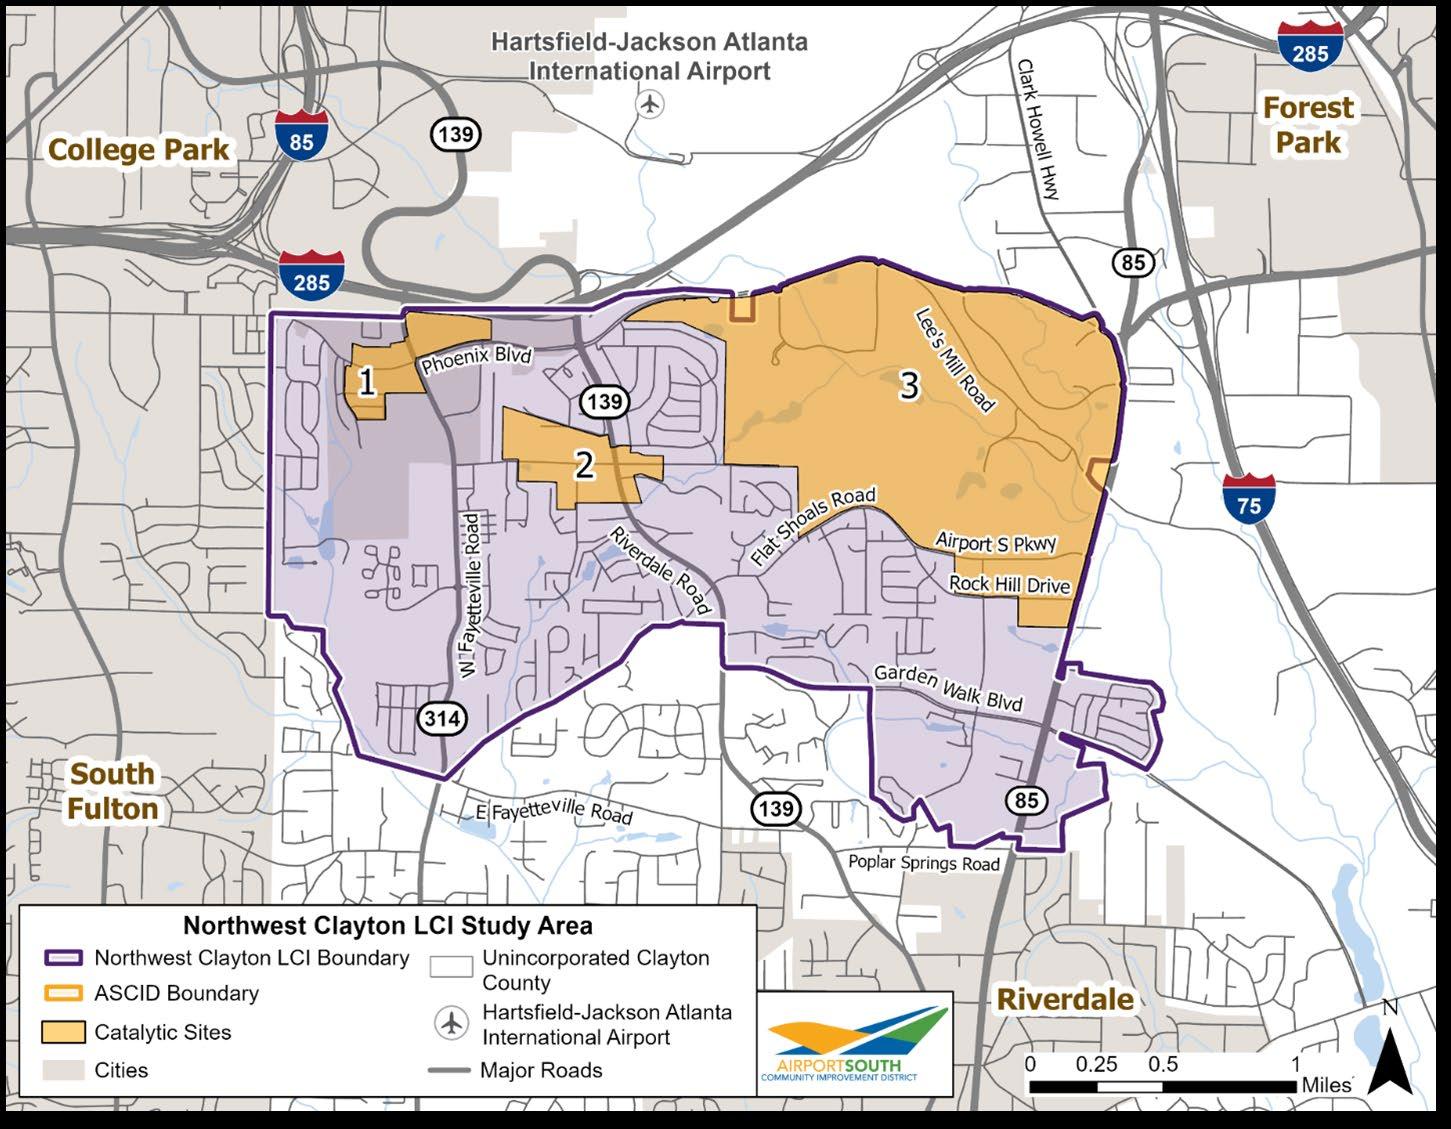
The Godby Road area (Site One), located in the City of College Park, spans Godby Road and Phoenix Boulevard. This cluster is a commercial area with older office buildings that were built prior to 1990. According to the market analysis results, existing office buildings within the larger Study area generate lower financial returns relative to Clayton County and the Atlanta-Sandy Springs-Roswell MSA. The area also consists of parcels with low lot coverage (less than 20 percent of the lot) and vacant parcels at the intersection of Phoenix Boulevard and SR 139/ Riverdale Road. These factors collectively represent an opportunity for redevelopment.
For this site, it is recommended to add office space and daycare facilities. FLUs, for Site One are displayed in Figure 6-5, which according to the 2021 College Park Comprehensive Plan, include:
• High Density Residential - reserved for singleand multiple-family dwellings, public (e.g., government or institutional) buildings, and passive and active recreational areas, with the opportunity for some other residential uses (e.g., personal care home).
• Suburban Office - Reserved for mixed use business developments (e.g., office, research, sales) to serve as a transitional area between residential and commercial districts).
• Suburban Commercial - Reserved for commercial uses that are appropriately located along a
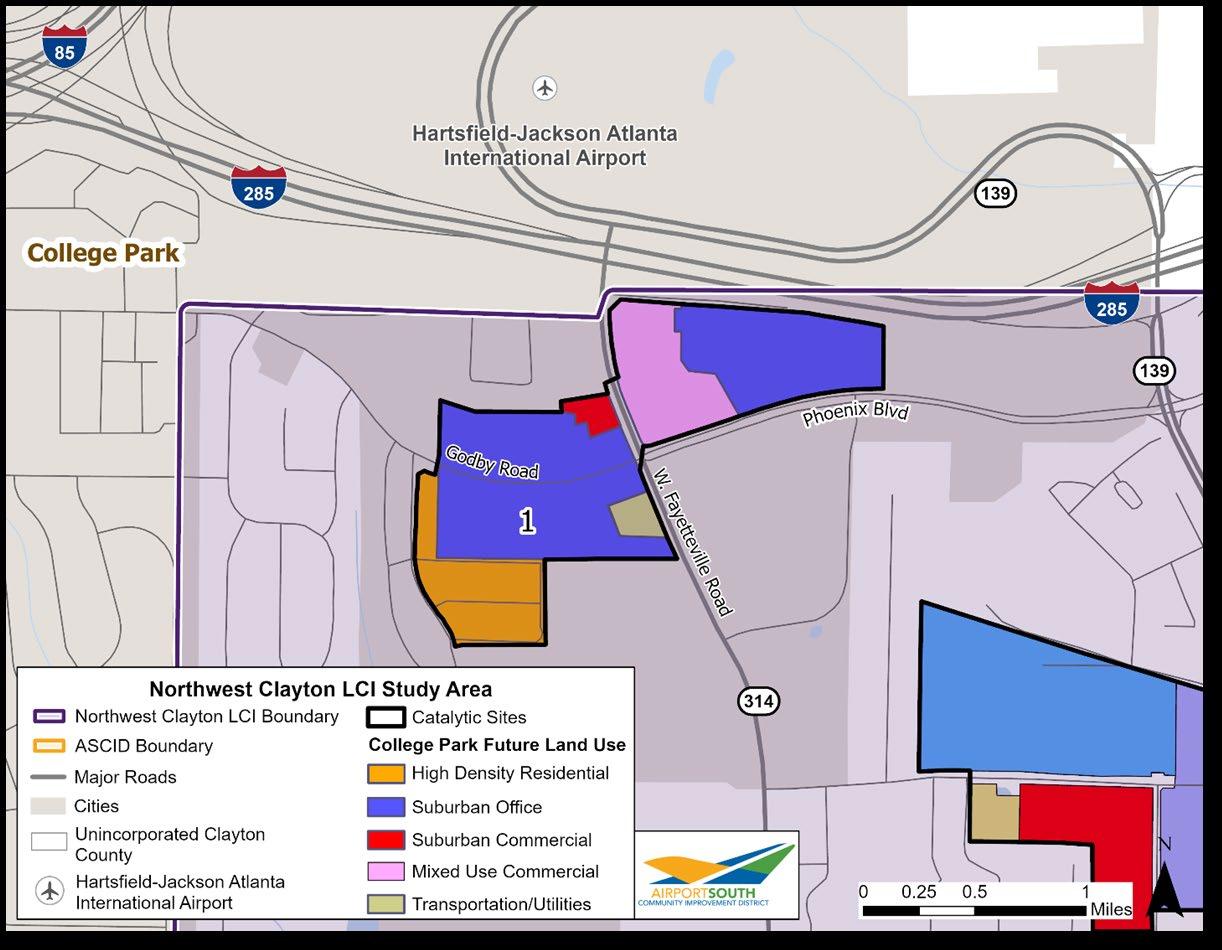
corridor (e.g., retail uses (large scale)) and compatible with the Georgia International Convention Center (GICC) and downtown business district. Office Professional (OP) may be expanded in this character area.
• Mixed use Commercial - Reserved for smallscale commercial uses that provide products and services to surrounding neighborhoods (e.g., beauty parlors) and larger-scale commercial uses (e.g., retail uses (large scale)) that are appropriately located along a corridor.
• Transportation Utilities – Primarily reserved for automobile and transportation-orientated uses (e.g., airport parking and shuttle service).
The proposed uses for this site do not conflict with the FLUs as Office Space complies with Suburban Office while Daycare Facilities complies with Mixed Use Commercial.
A potential concept of the site is featured in Figure 6-6. Site One, the local village, could feature multi-family residential, the current hotel, office/ daycare space, mixed use, and greenspace. The PAC emphasized the lack of affordable daycare facilities
by employees and a demand for Class A office space in the Study area. This site would also feature more street trees, a roundabout at SR 314/W. Fayetteville Road and Phoenix Boulevard, and the Walker Creek Road Trail, shown in Figure 6-7. These streetscape and pedestrian improvements could increase walkability by providing more mobility options.
This site will need the housing to be rezoned from single-family to multi-family to allow for townhomes, apartments, and condominiums. Multi-family housing will increase the density in the area, bringing more people in to utilize the services nearby. The existing office structures in the site are older than 1990; redevelopment could present an opportunity for developers to reinvigorate the area through renovation. The redevelopment process should also aim to reduce the number of vacant parcels in the site.
The Walker Creek Road Trail is a new, proposed trail in the northwest corner of the Study area between Phoenix Boulevard and Interstate 285. The road, Walker Creek Road, is partially paved and is accessible from SR 314/W. Fayetteville Road. The road is paved for 0.18 miles and should continue from the paved portion to Phoenix Boulevard, wrapping around the business complex. The proposed trail is shown in Figure 6-7, on the following page.
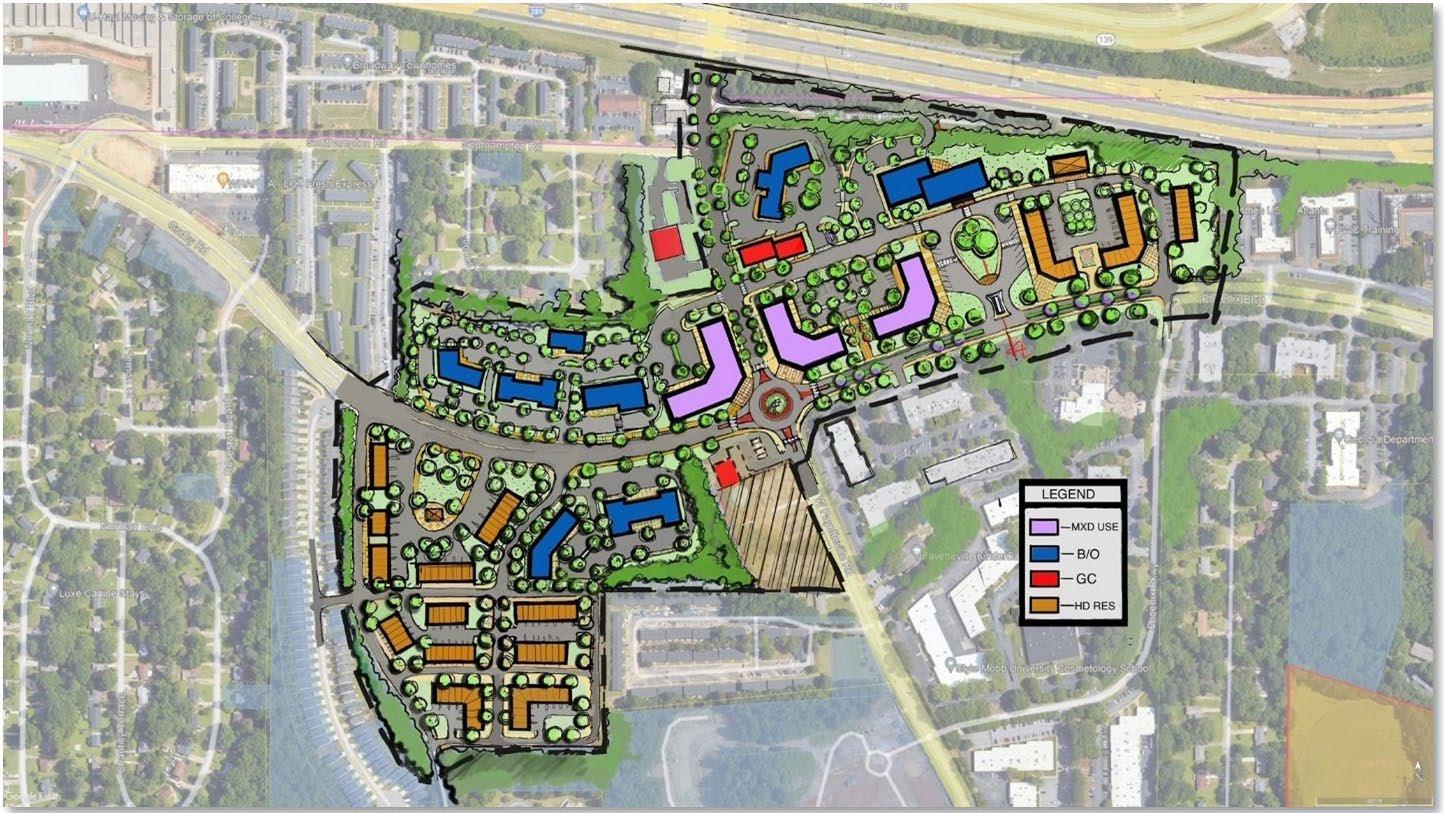
A rendering of Site One, as shown in Figure 6-8, is a view from a building across Phoenix Boulevard, showing the roundabout at SR 314/W. Fayetteville Road and Phoenix Boulevard to the left. Notably, all parking in this concept is away from the street to highlight the aesthetics of the buildings and promote walking along Phoenix Boulevard. The additional street trees will also provide shade to people walking or waiting at bus stops.
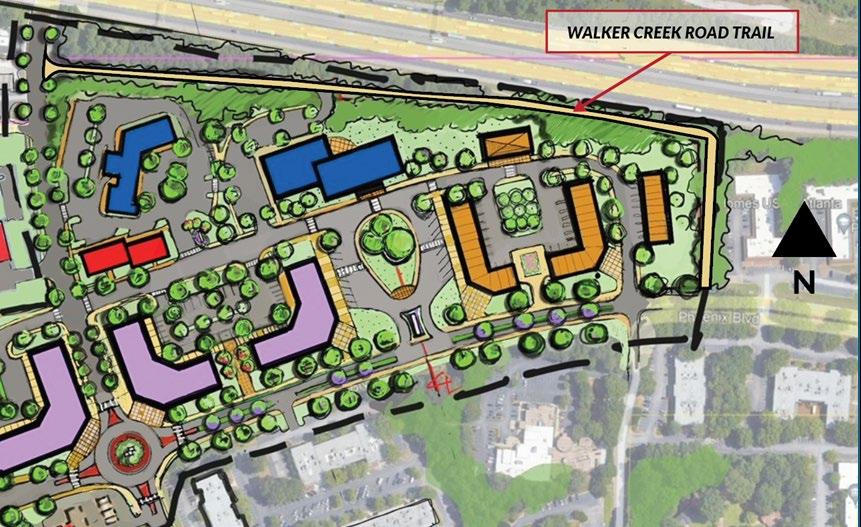
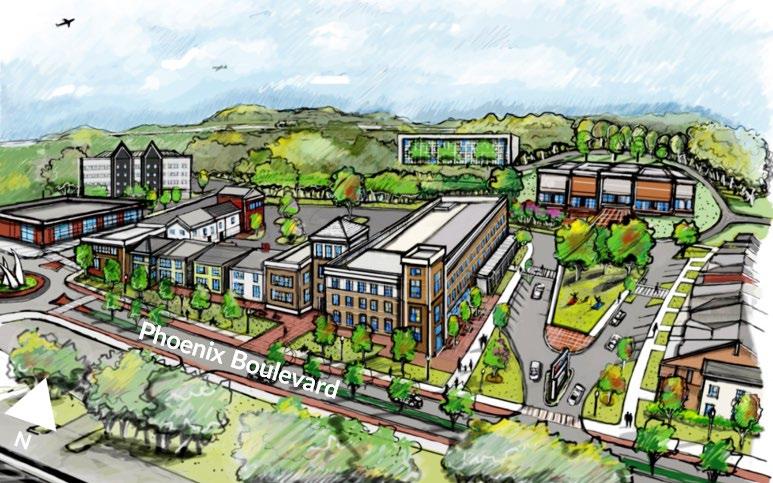
The Riverdale Road/Norman Drive (Site Two) includes a mix of generally older strip shopping centers, commercial buildings, light industrial uses such as auto body and auto repair shops as well as the North Clayton High School. This site has parcels with low lot coverage and vacant parcels along Norman Drive extending to the west of SR 139/Riverdale Road.
The proposed uses for this site are community space and commercial space. Figure 6-9 displays the FLU in the area from the 2024 Clayton County Comprehensive Plan. FLUs in this area include:
• Office-Business – Dedicated to office, banking, or other personal business services and not focused on retail uses.
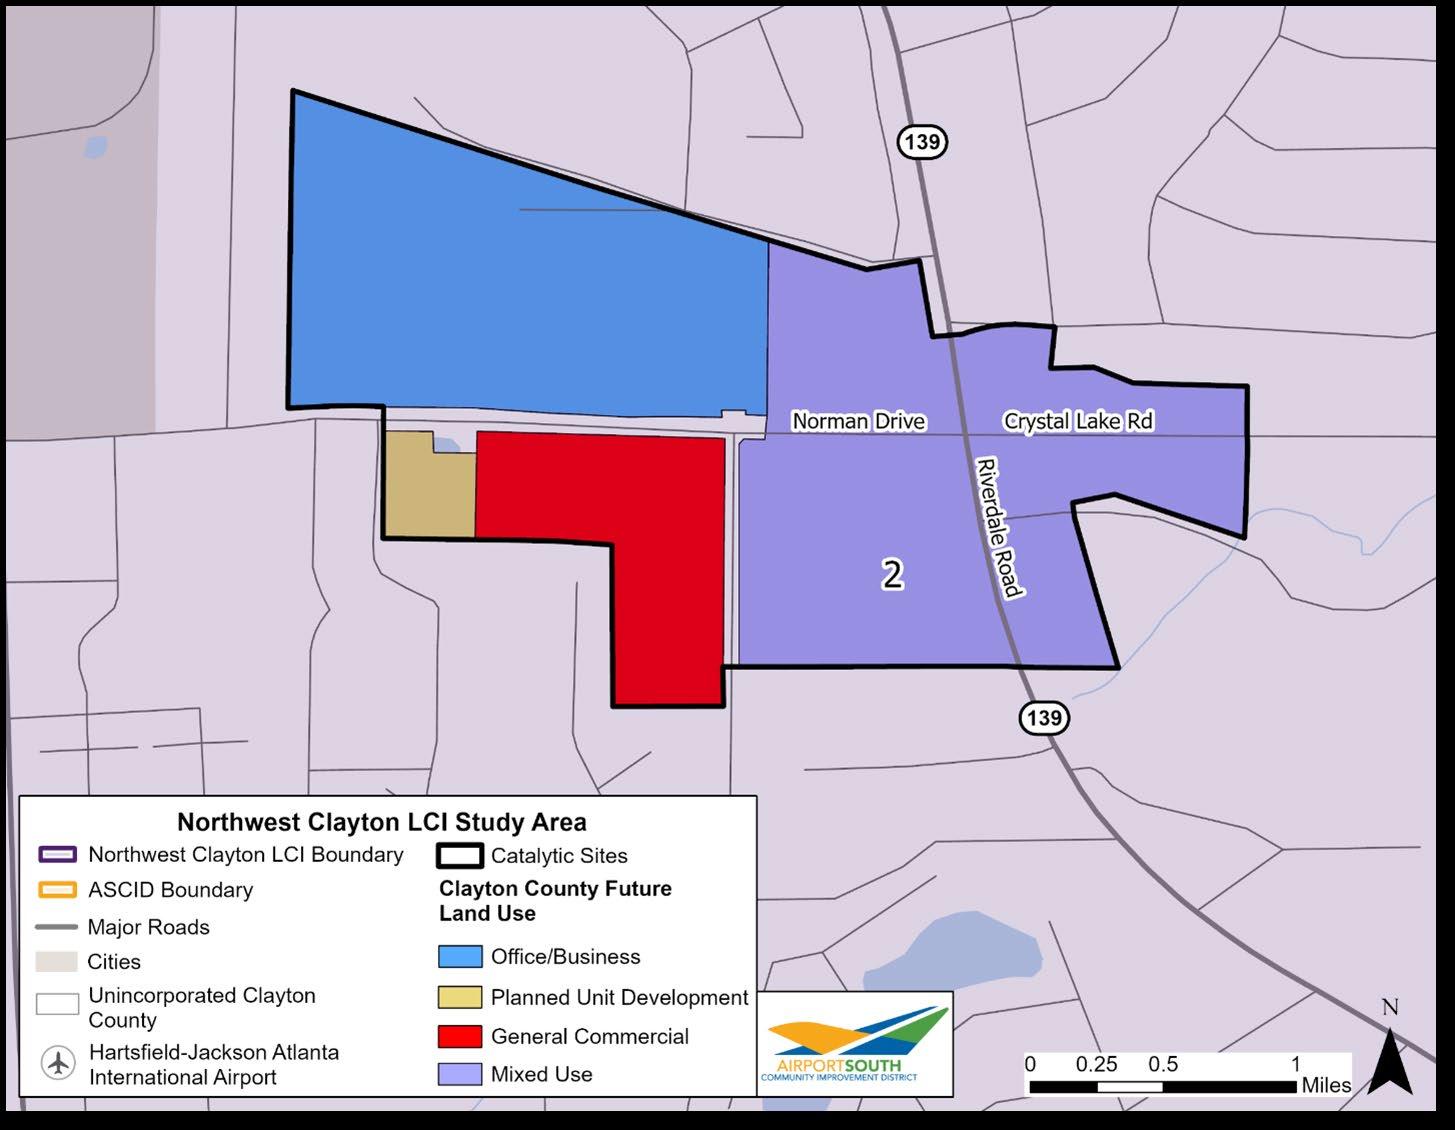
• Planned Unit Development – Provides flexibility in the regulation of land development and encourages innovation in land use in terms of variety, design, layout, and type of structures. It allows for the preservation and protection of natural features and open space; it promotes the efficient provision of public services and utilities; and it minimizes adverse traffic and environmental impacts.
• Mixed use – Allows a mixture of retail, residential, and office uses in a town center style. Uses may include residentially compatible retail uses such as grocery stores, drugstores, banks on ground floors, or fronting on commercial streets. There may also be a residential component including lofts, condominiums, apartments, townhomes, and smaller single-family houses located above commercial uses or in other portions of the development.
Mixed use development must be designed to encourage walking and bicycling as well as be designed to be transit ready. A transit-ready development is a mixed-use development that is planned and implemented in concert with, and in anticipation of, future rail stations and implemented before the station is constructed.17
• General Commercial – Intended for land dedicated to non-industrial business uses including retail sales, service, and entertainment facilities. General commercial is the most intense, allowing facilities that may target larger businesses.
The proposed uses do not conflict with the FLU because commercial space complies with both general commercial and mixed use.
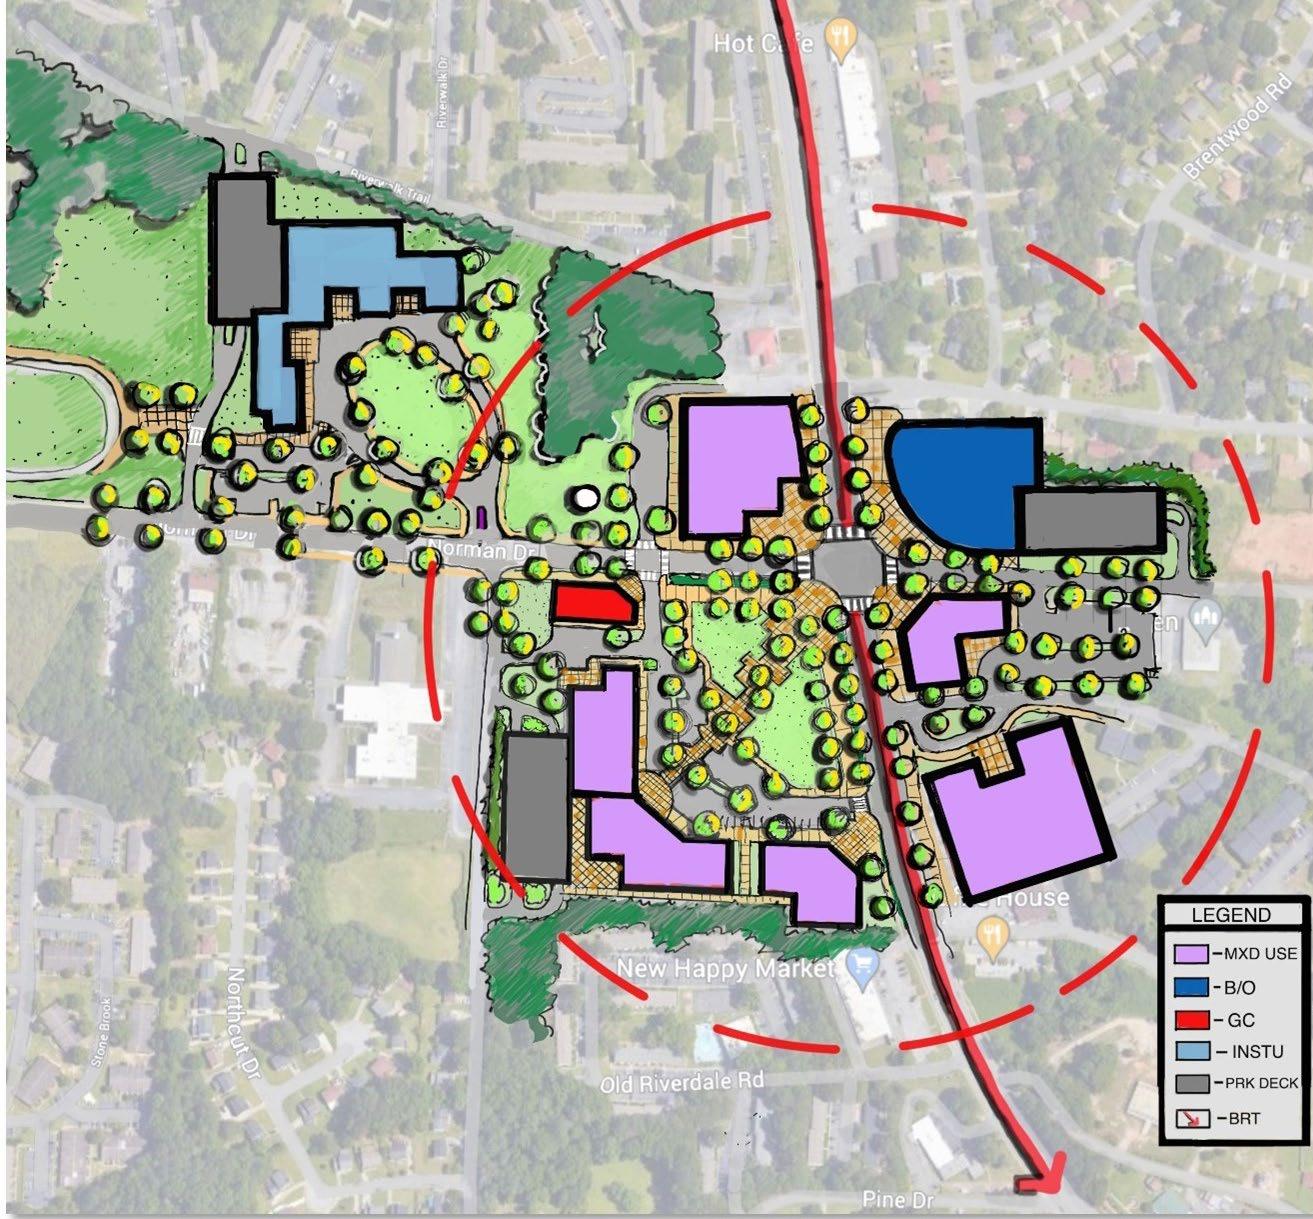
17 Planned for Transit-Supportive Development: A Practitioner’s Guide. Federal Transit Administration. https://www.transit.dot.gov/sites/fta.dot.gov/ files/FTA_Report_No._0057.pdf
Site Two, the regional node, presented in Figure 6-10, could have public/institutional uses, mixed use, parking structures, and greenspace. The public/ institutional uses are to provide services to the community while also being accessible to the riders of the RAPID Southlake. Mixed use allows for retail, residential, and office uses. Commuters could park in the parking structures at the future Norman Drive BRT station to access RAPID Southlake or other uses at the site. Part of the community space will be greenspace, which can be accommodated in mixed use because the development in this category must encourage walking and bicycling and be transit ready.
Because of the low lot coverage and vacant parcels, the area within the site is not being utilized to its full potential. Redevelopment of this site will increase lot coverage and reduce vacancies among parcels. Adding a proposed RAPID Southlake station, will incentivize transit riders and people in the community to use spaces around the station. It is imperative that the
development cater to the needs of transit riders, as well as the community surrounding the station.
The third catalytic site, The Quarry, is generally focused south and west of Lee’s Mill Road and is defined by a number of gravel and stone mining operations, interspersed with active industrial and warehouse buildings. To its south, Site Three is bounded by the Flat Shoals corridor providing access to residential developments that are primarily singlefamily housing.
Mixed Use and Park/Recreation are proposed for this catalytic site. FLU in the 2024 Clayton County Comprehensive Plan for this area, as displayed in Figure 6-11, is:
• Mixed use Commercial-Industrial – Allows a
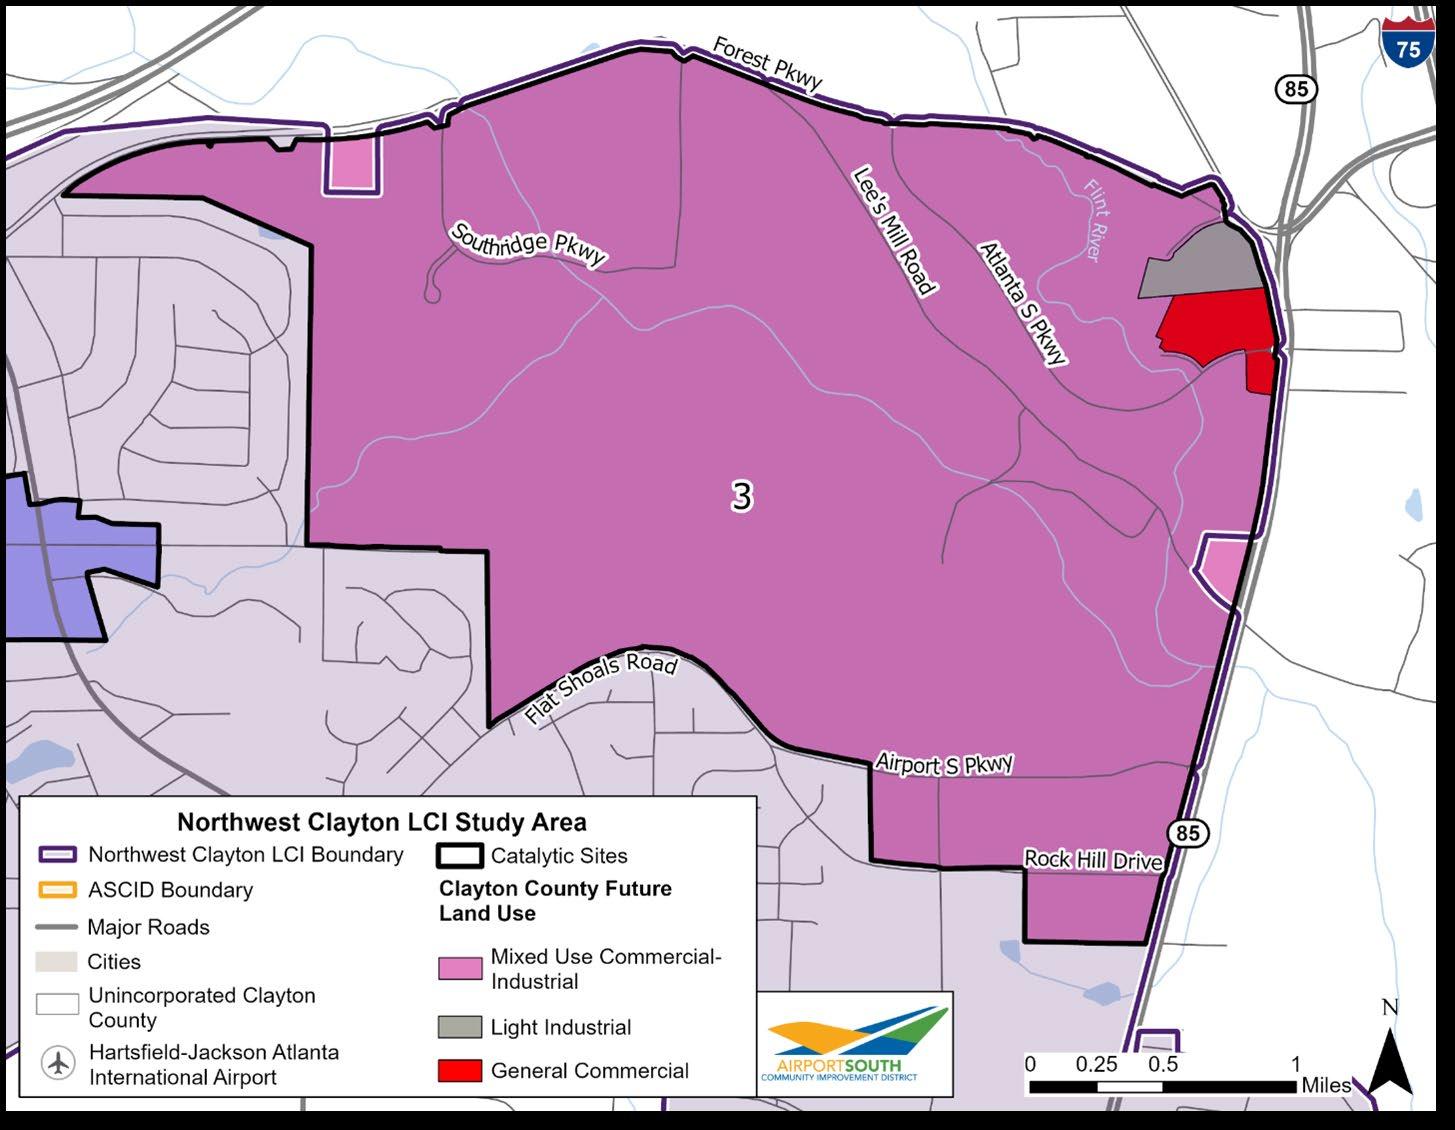
mixture of office, commercial, and light industrial uses as well as possible recreational uses. Industrial uses should be oriented towards producing value rather than extracting it, and industrial uses that undermine office uses such adult-oriented businesses, landfills, etc. should look elsewhere. Mixed-Use CommercialIndustrial development must be designed to encourage walking and bicycling between uses as well as be designed to be transit-ready. Open space and green space areas, should be networked to create corridors of recreational areas, further layering the allowed uses.
• Light Industrial – Dedicated to assembly, warehousing, wholesale trade facilities, and other industrial uses that could coexist with some business uses.
• General Commercial – Intended for land dedicated to non-industrial business uses including retail sales, service, and entertainment facilities. General commercial is the most intense, allowing facilities that may target larger businesses.
The recommended use for this area does not conflict with the FLU; Mixed use and park/recreation complies with mixed use commercial-industrial.
Site Three, the national site, (shown in Figure 6-12) could have light industrial, mixed use/commercial, parks/recreation, and greenspace. There is an opportunity to decommission the landfill and create water features surrounded by greenspace at the site. Light industrial facilities, such as assembly, warehousing, and wholesale trade facilities, are recommended as to not distribute the recreational uses with pollution.
The project team was made aware by the Clayton County Comprehensive Plan team, that proposed redevelopment of the area has been the topic of conversation for years. Additional industrial and office space is currently in development at the intersection of Lee’s Mill Road and Forest Parkway after a variance hearing in July 2023 with the Clayton County Board of Zoning Appeals. This development will not greatly impact the proposed site concept because it is a small parcel in comparison to the rest of the site. Coordination with Clayton County should be continued to keep abreast of development progress in the site.
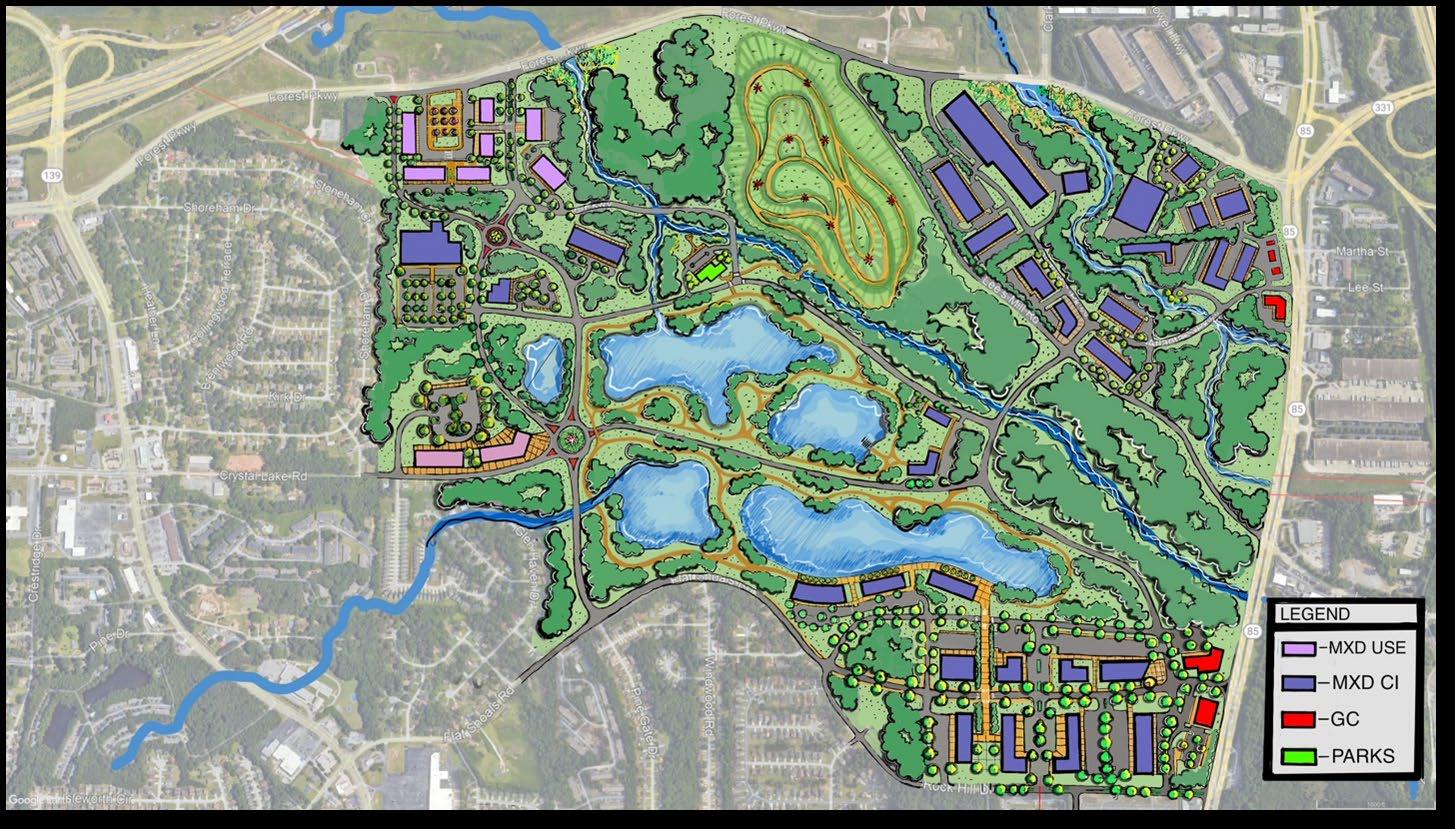
This section describes the land use strategies as part of the catalytic sites. Land use indicates the purposes for the structure(s) on a parcel, such as residential, public/institutional, and commercial. Zoning is the legal designation of uses for land/parcels in an area, and any zoning changes must be amended and presented to the Board of Clayton County Commissioners for approval.
The existing land use in the Study area, across approximately 3,000 acres, mostly consists of singlefamily (27.0 percent), multi-family (17.0 percent), industrial (10.0 percent), commercial (6.8 percent), and other uses (16.9 percent). Also, Table 6-2 indicates that 22.3 percent of the land is vacant in the Study area. Some vacant land remains vacant because of topographic challenges preventing its development, such as creek corridors, floodplains, and uneven topography. Other uses in the Study area are comprised of schools and the quarry, which is the large blue parcel in the northeast corner of the Study area as shown in Figure 6-13.
Garden Walk Boulevard Local Road East/West
Source: Clayton County Tax Assessor

Source: Clayton County Tax Assessor
The project team proposes adding/repurposing the following land uses for the catalytic sites in the Study area:
• Daycare Facilities - Adding daycare facilities will support working families in providing childcare for small children while the parents are at work.
• Office Space - Office space will provide companies the space to host meetings and support staff space. Additionally, these areas can be used for coworking spaces if people want to work outside of their office or home or want space to collaborate with others.
• Community Space – Whether outside through greenspace or inside with a community center, community spaces allow residents and visitors to gather for various activities. Depending on the scale of the space, these activities could include community meetings, farmers markets, group exercise, or shows and performances (see Figure 6-14).
• Commercial Space – Providing spaces for business, especially local businesses, can build community wealth and offer employment
opportunities. The increase in local taxes could also be used to pay for more community improvements like placemaking.
• Mixed Use – This land use allows for multiple uses on one parcel, like commercial, residential, and office. Mixed use is designed to enable people to live, work, and play all in the same place. When located next to transit, especially multi-family housing, it can encourage ridership and spur more development.
• Park/Recreation – The public emphasized the lack of park and recreation space in the Study area. Increased greenspace comes with many benefits such as more physical activity, reduced stress, better air quality, and more social capital according to a study by North Carolina State University Professors.18
These land uses support residents, businesses, and the community as a whole. They will also encourage transit-oriented development at Site Two. With these land uses, residents and visitors could see more social interaction, sense of community, better use of spaces, and more services that people will use.
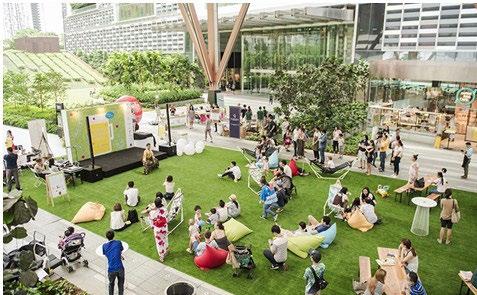
https://cnr.ncsu.edu/news/2022/04/parks-green-spaces-
To increase development in an area, municipalities, counties, or states provide tax credits or incentives. These incentives can cover part of the cost of a development if it meets certain criteria. Below are incentives to build daycare facilities; more information on incentives to build affordable housing are described in Section 6.3.
To add affordable daycare to the Study area, developers can take advantage of the Child Care Tax Credit. This tax credit is for employers who purchase or build qualified childcare facilities, or who provide or sponsor childcare for employees. The credit for those that choose to build is as follows: “For employers who purchase or build a state-licensed facility, the credit is equal to 100 percent of the cost of purchase or construction which is earned over 10 years (10 percent each year). Unused credits can be carried forward for three years.”19
Rezone parcels in catalytic sites to support TOD and higher density uses
The proposed land uses for Site One include daycares and office space. To support a number of strategies, housing is encouraged for the site as well. The current zoning for College Park of Site One, presented in Figure 6-15, consists of:
• BP-Business Park: to provide a land use category for business where office, research, sales, service, and distribution needs can be met.
• C1-Neighborhood Business: for small-scale commercial uses that provide products and services to neighborhoods.
• C2-Community Business: for commercial uses along a corridor.
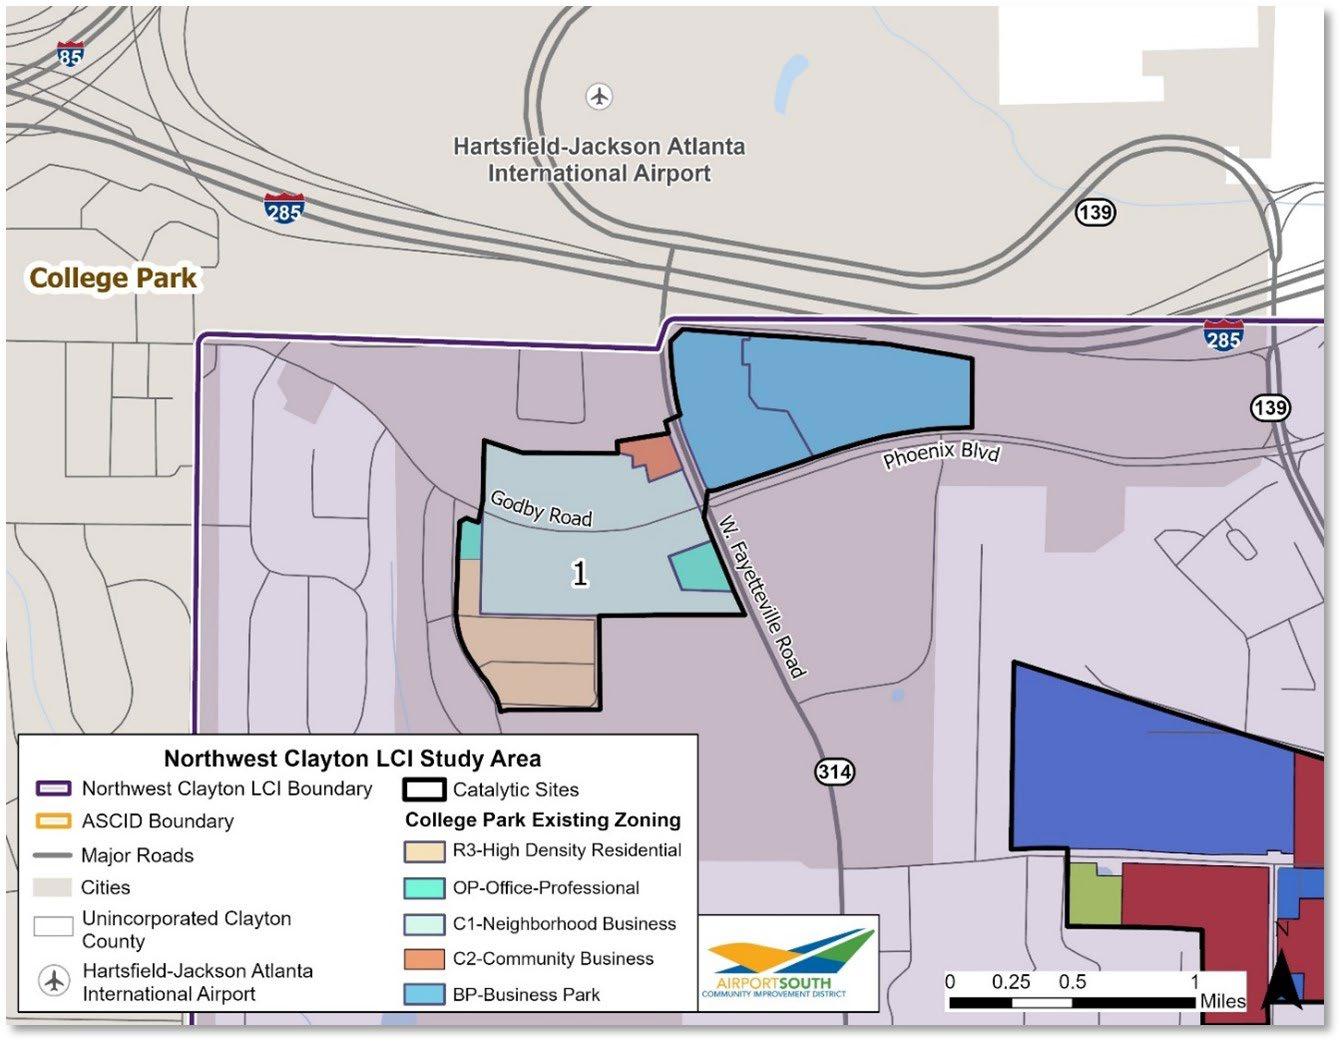
19 Business Incentives 2021. Child Care Tax Credit. https://georgia.org/sites/default/files/2021-03/jan2021_business_incentives.pdf
• OP-Office Professional: for offices, banks, and personal business services, which can serve as a transitional area between residential and commercial districts.
• R3-High Density Residential: to provide the development of single-family dwellings served by public water and sewer systems and promote an average net density of 4.0 to 5.5 dwelling units per acre. Source: College Park Zoning
To reconcile the proposed land uses with the zoning, a special overlay district should be proposed, as shown in Figure 6-16. This special overlay district will come with certain changes to the zoning. First, BPBusiness Park should be changed to PD-C Planned Development Commercial. PD-C is closest in the zoning to mixed use, allowing multi-family housing,
business park, and office professional district zoning. This change could potentially provide housing within walking distance to jobs in the commercial areas nearby. C1-Neighborhood Business District should allow child daycares as a permitted use, instead of a conditional use. This zoning change only applies to the parcels zoned for C1 in the overlay district. Last, R3-High Density Residential should be changed to RM-Multiple Family Residential District. RM-Multiple Family Residential District allows for row homes and townhouses, a type of single-family housing that is attached.
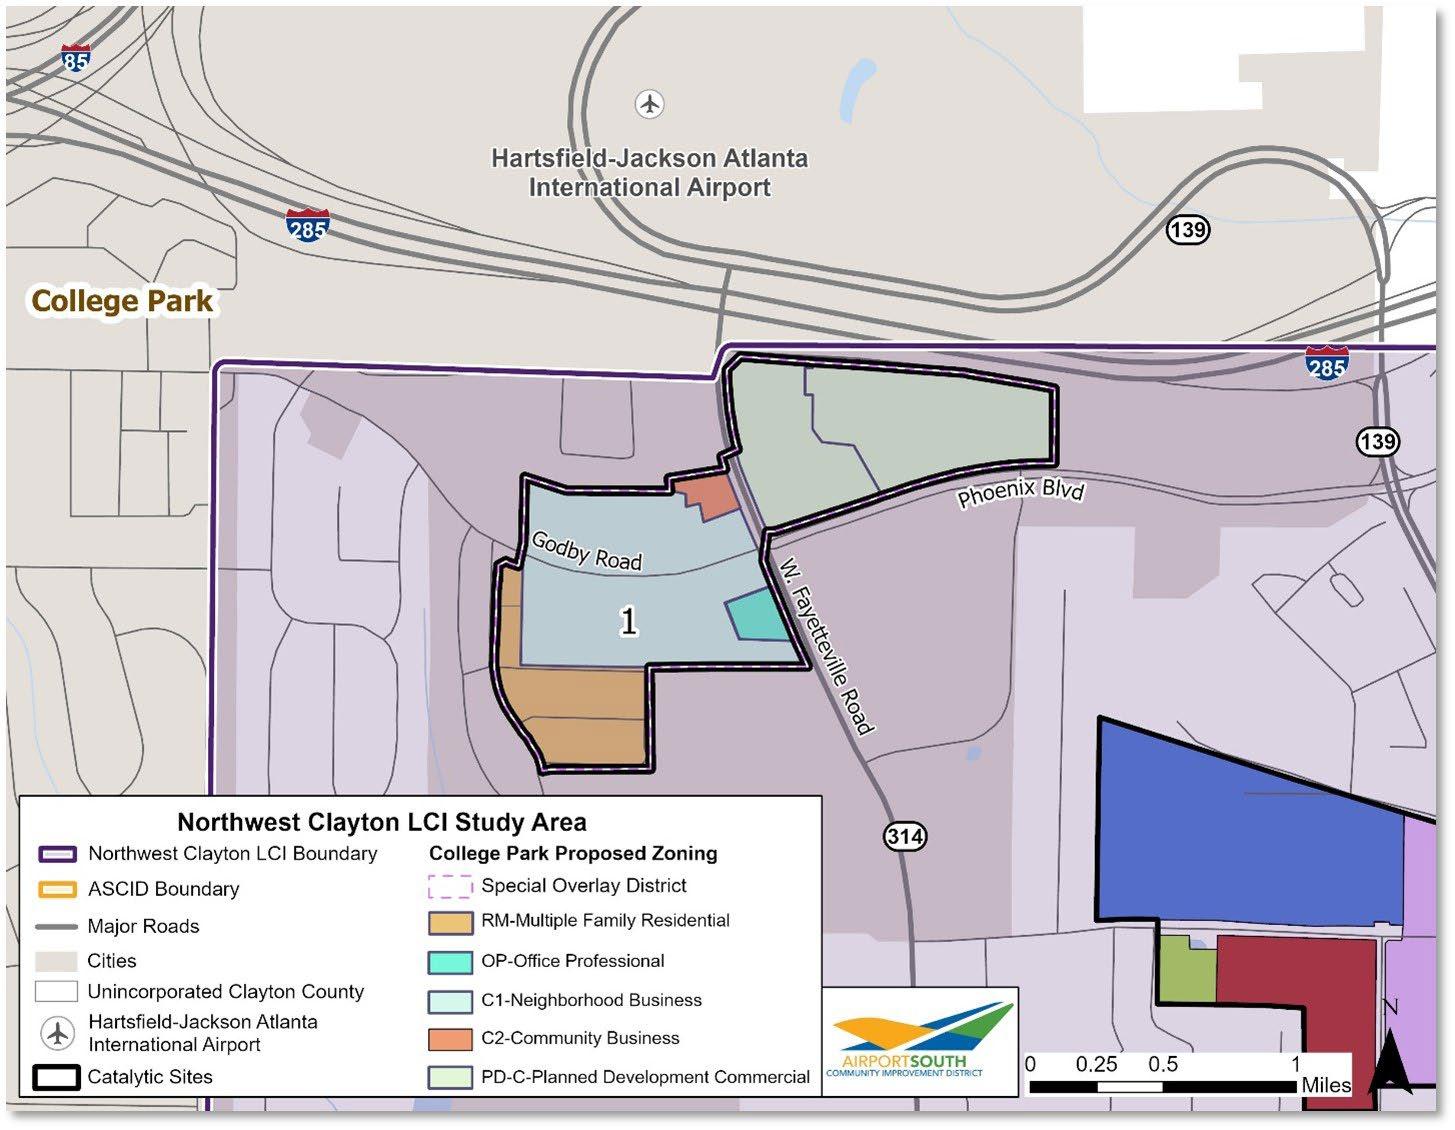
Two: Riverdale Road/Norman Drive
Site Two, Riverdale Road/Norman Drive, is along the RAPID Southlake BRT route, with a stop south of Norman Drive/Crystal Lake Road called Norman Drive. Figure 6-17 indicates that the parcels in this same area are currently zoned for OI-Office Institutional, PUDPlanned Unit Development, and GB-General Business. The parcels at the intersection of Norman Drive and SR 139/Riverdale Road are deemed as Mixed Use for FLU for Clayton County. Mixed use allows retail, residential, and offices uses and encourages development to be transit-ready. Mixed use also supports high density uses in terms of residential uses, which includes lofts, condominiums, apartments, townhomes, and smaller single-family houses located above commercial uses or in other portions of the development.
The 2024 Clayton County Comprehensive Plan acknowledges the current zoning and the needed change to mixed use to support TOD and higher density uses. Figure 6-18 shows that zoning will remain the same for parcels on the west side of the site, as those parcels contain North Clayton High School in OI and the Christian Fellowship Baptist Church in GB. Coordination is needed to support the Clayton County Planning team in the proposed parcel changes and needed zoning amendments.
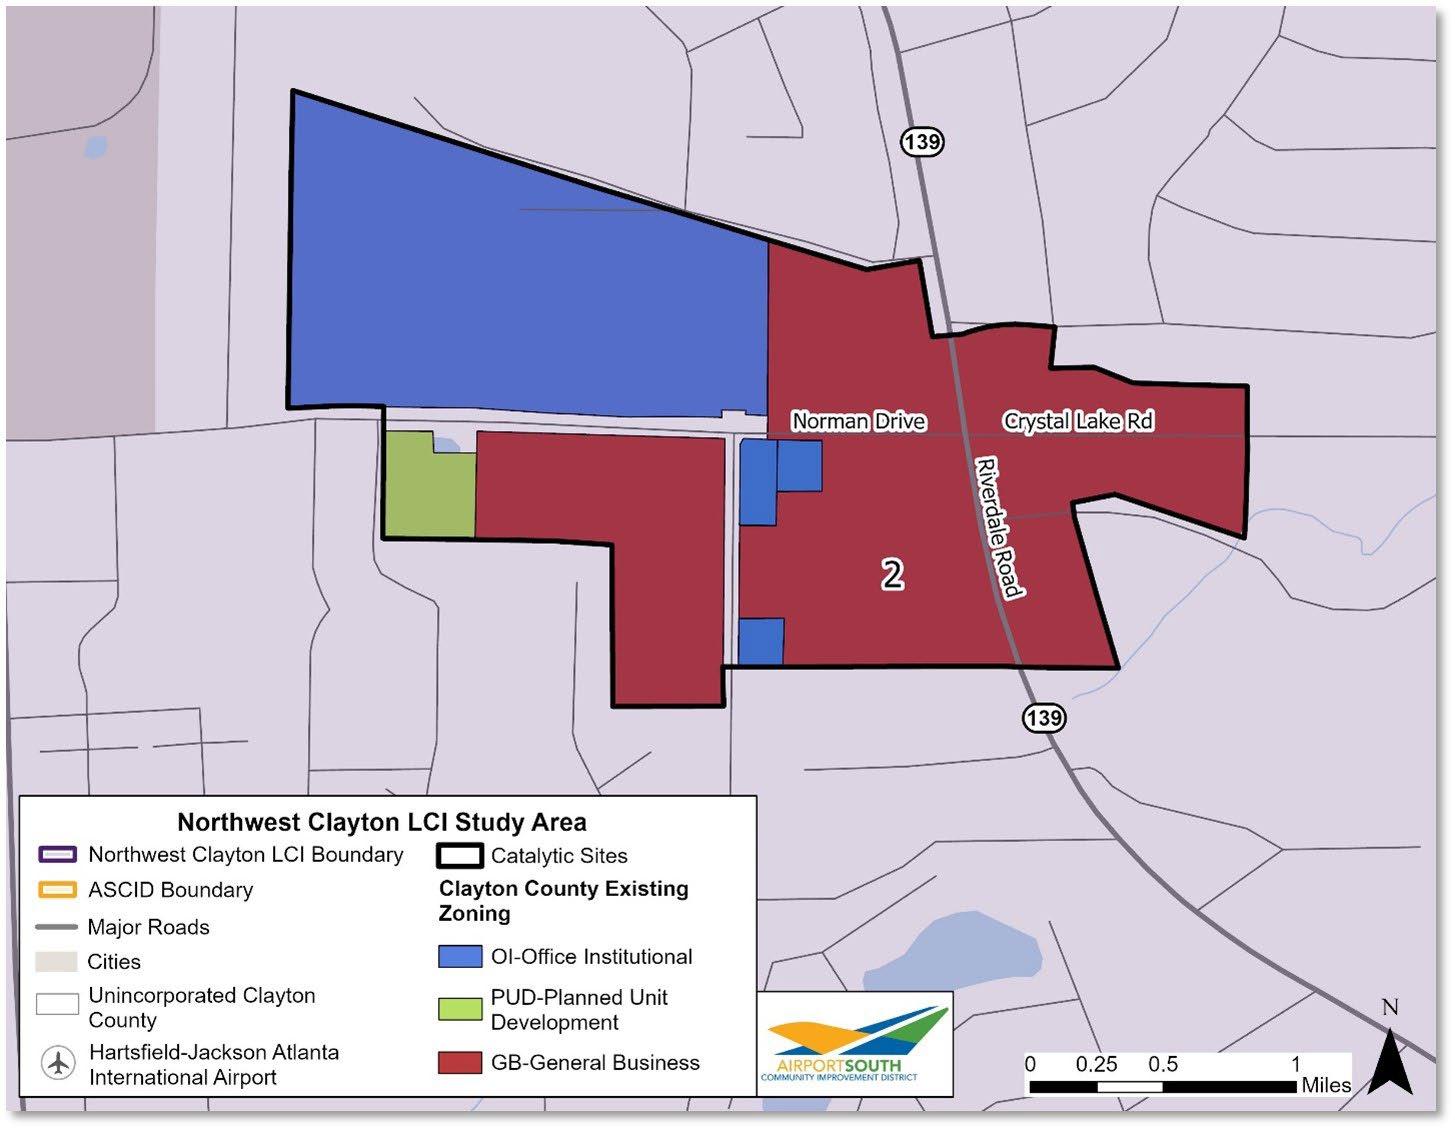
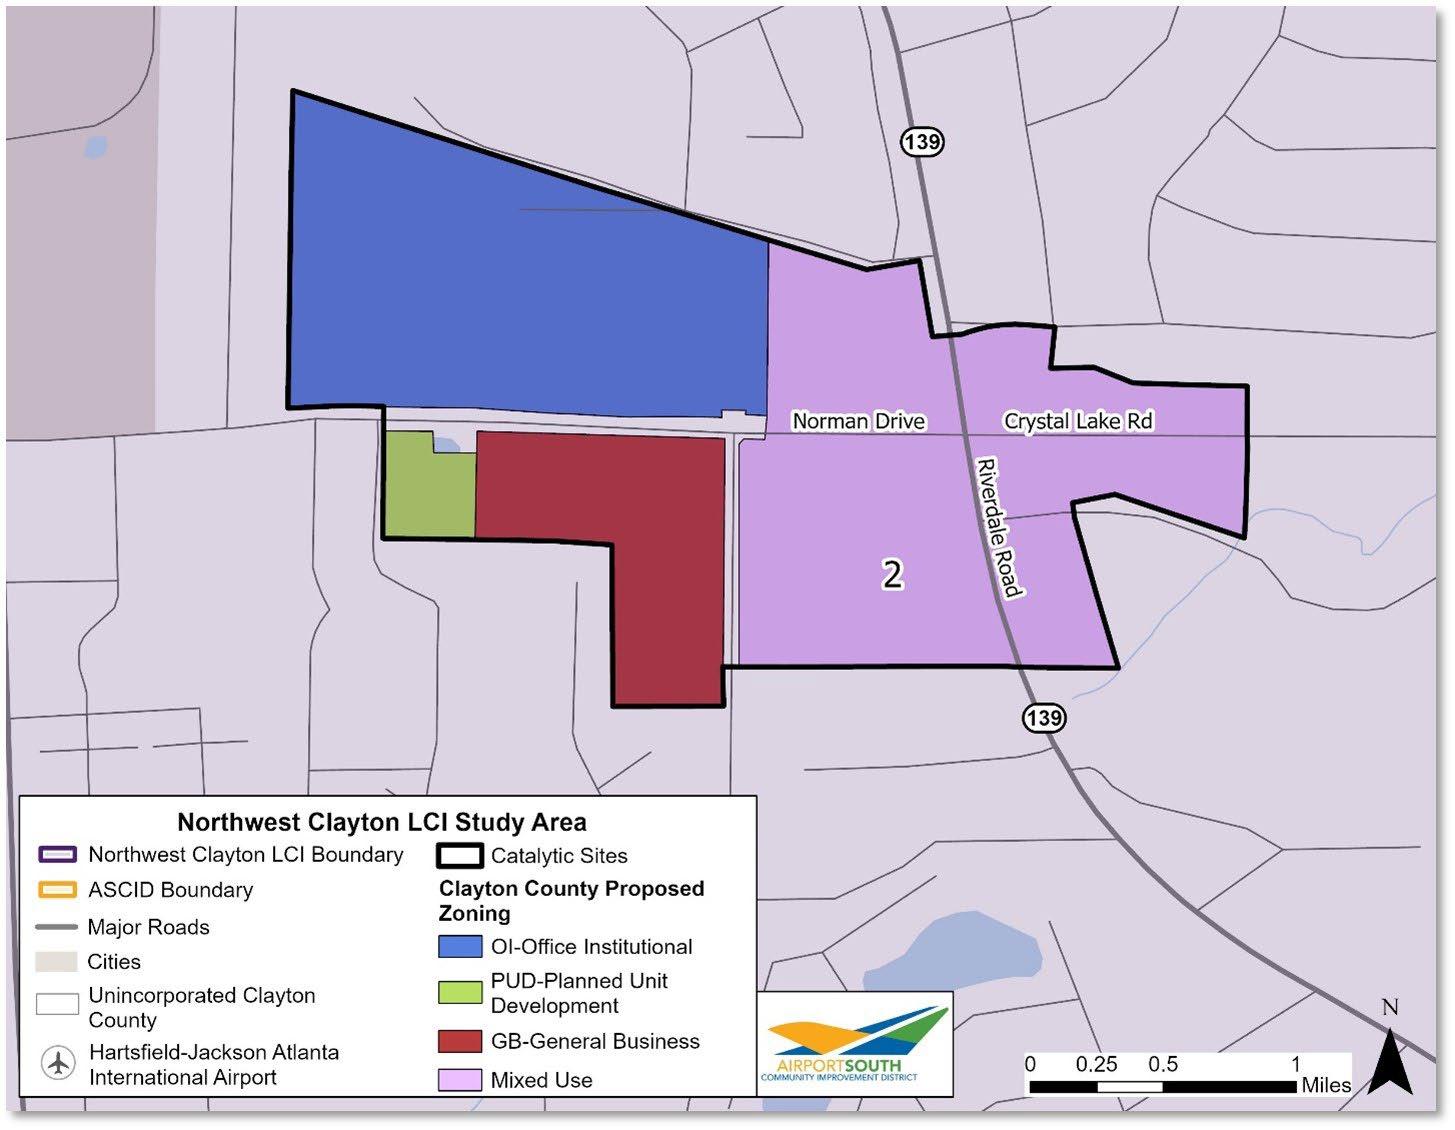
Once the Quarry is inactive, this project envisions Site Three to be a major park and recreational center. The proposed uses are mixed use with commercial and light industrial uses and parks/recreation. Now, the site is largely zoned for HI–Heavy Industrial for manufacturing, assembling, and fabrication activities including large scale or specialized industrial operations, as indicated in Figure 6-19 20 It is recommended to rezone this area to MXI–Mixed Use Commercial-Industrial, shown in Figure 6-20, to permit office, commercial, light industrial, and recreational uses.

20 Clayton County Zoning Ordinance. Heavy Industrial District Intent, Permitted Uses and Conditional Uses. https://library.municode.com/ga/clayton_ county/codes/code_of_ordinances?nodeId=PTIICOCLCOGE_APXAZO_ART3ZODIINUSST_S3.31HIHEINDIINPEUSCOUS
6-19: Existing Zoning in Site Three
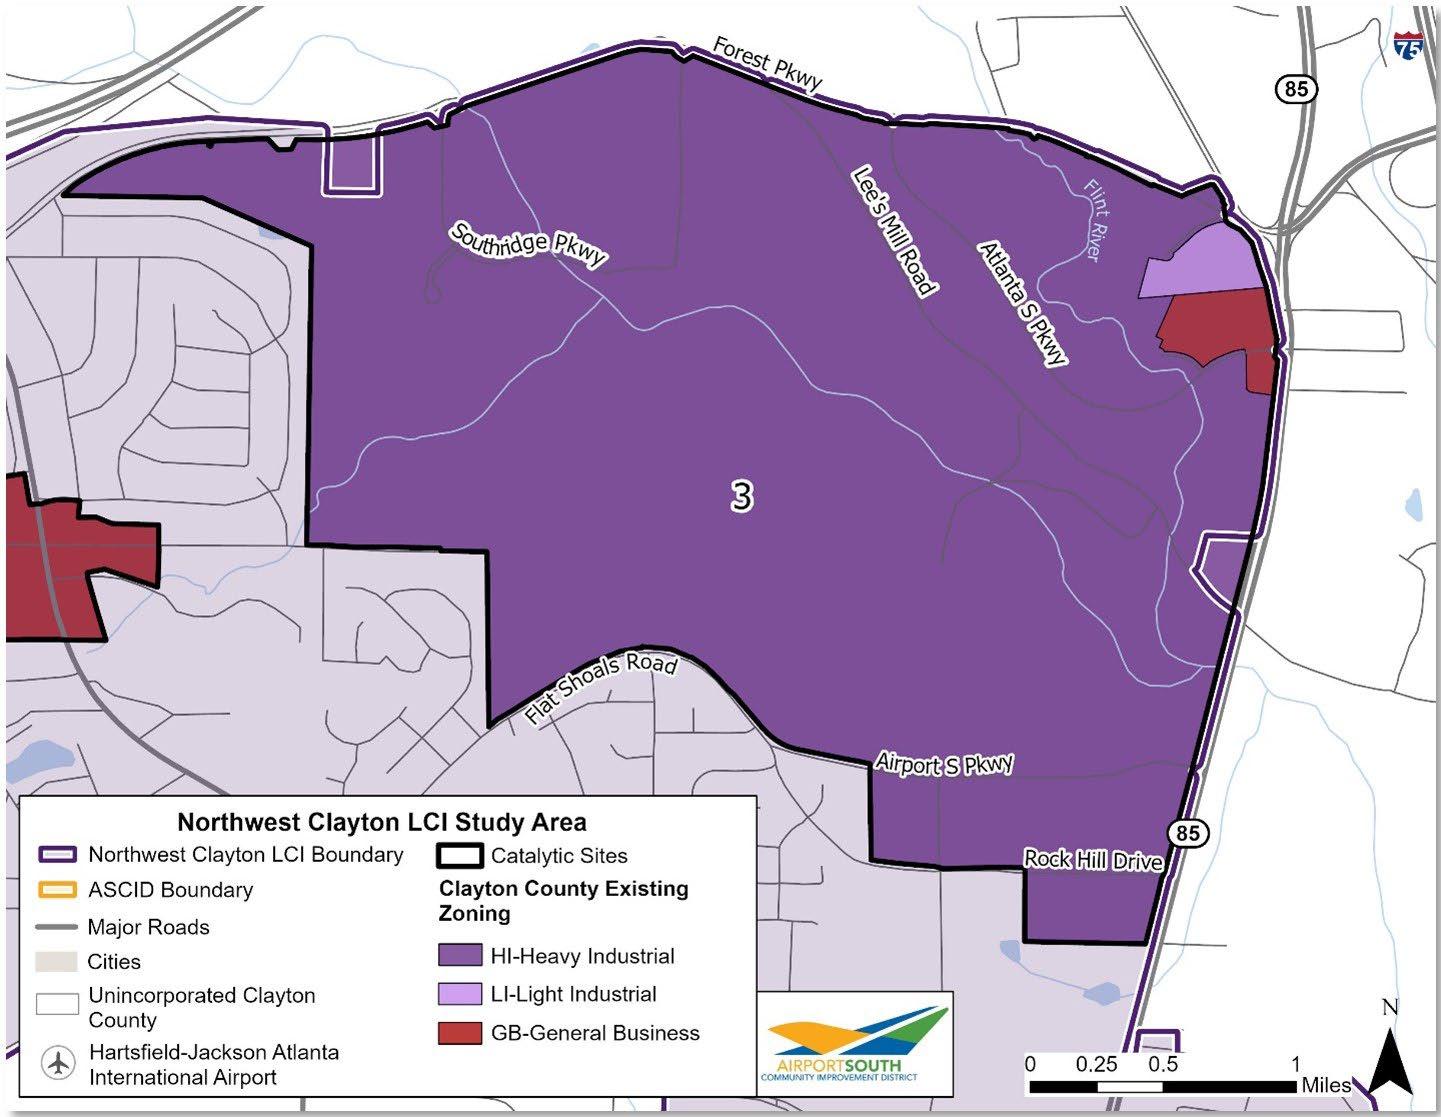
6-20: Proposed Zoning in Site Three
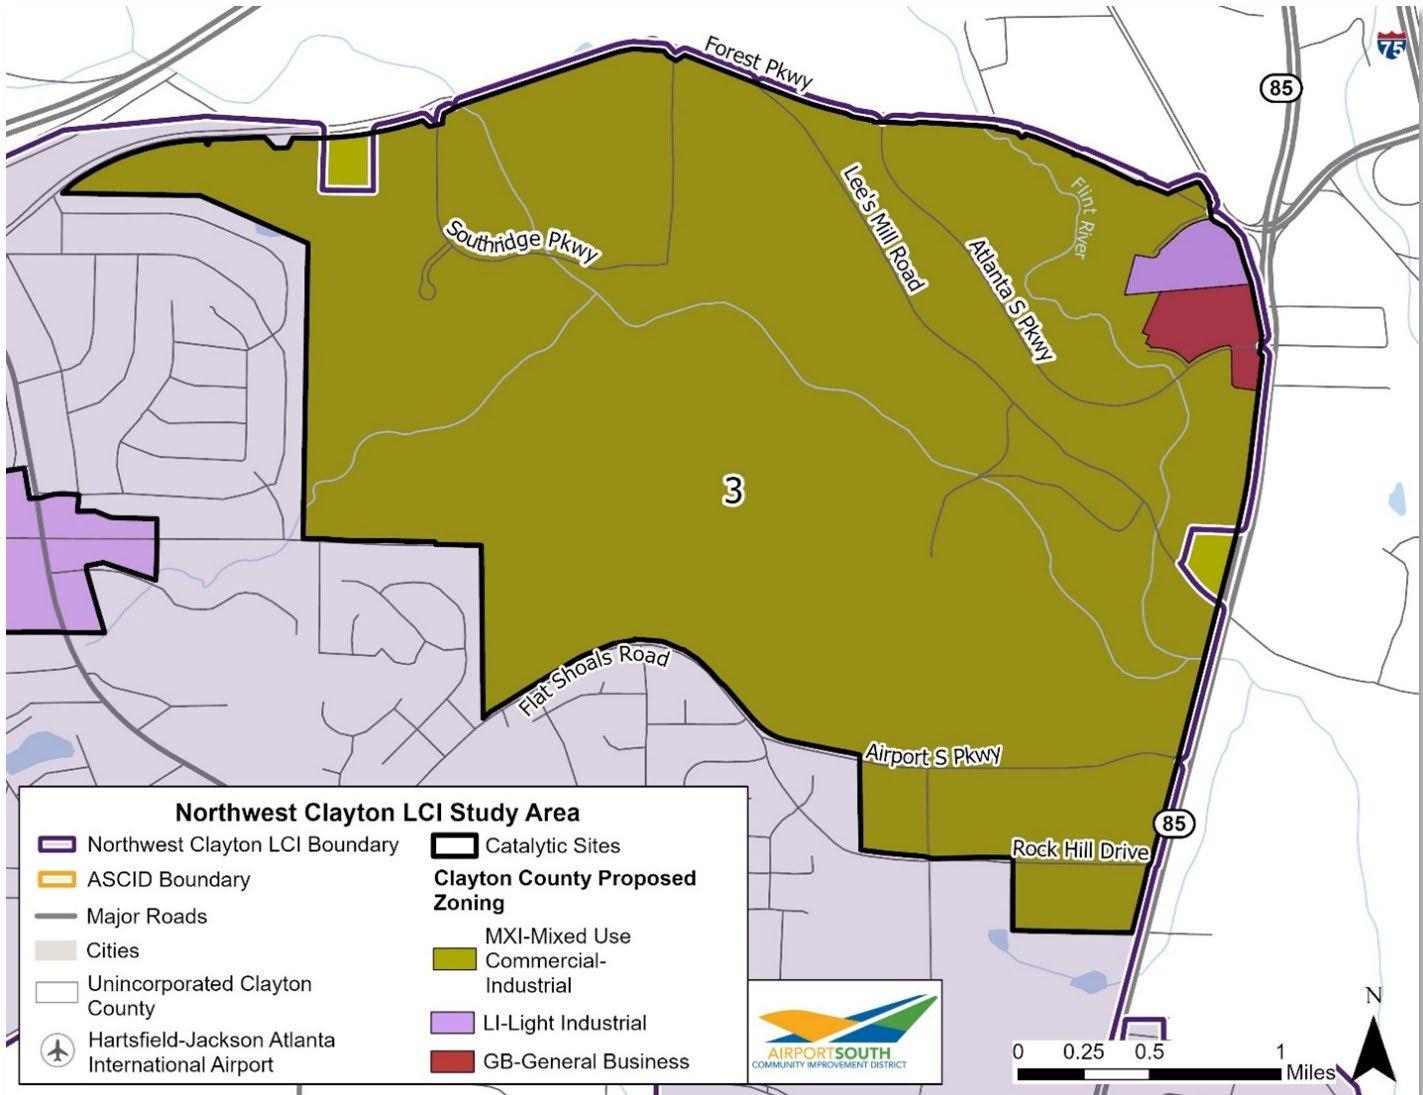
Source: Clayton County Zoning
As a part of the market study, multifamily housing was examined. The study concluded that the Study area’s multifamily inventory was mostly built either before the 1990s or after 2010. Older housing was also a major topic of the September 23rd public meeting, where residents expressed wanting to improve existing housing over redevelopment. Housing strategies presented here aim to meet that goal, while adding housing to diversify the housing stock in the Study area. Many of these strategies can be addressed through a housing task force to discuss current housing and the future of housing in the Study area.
Improve existing housing in the Study area by investing in multi-family properties
A little less than half (46.7 percent) of the Study area’s multi-family housing was built pre-1990, over 35 years ago. The public would like to see older housing in the Study area improved, more than focusing on redevelopment. To fund these improvements, partnership with multiple partners is suggested to support maintenance and repairs for low-income homeowners. The Housing Authority of Clayton County has a bond program that considers applications for tax-exempt financing needed to acquire land and/ or improve, construct, or rehabilitate proposed or
existing multifamily housing developments.21 The application should be made by the developer, who must arrange financing, approvals for site concepts, and abide by zoning ordinances.
Incorporate a mixture of housing types
Figure 6-21 indicates that over a third of the approximately 15,000 housing units in the Study area are one-unit detached or single-family homes (38.8 percent). Another 36.3 percent of housing units contain between 5 to 19 units. The percent of row homes, townhomes, or one-unit attached housing units in the Study area is 4.5 percent. The mixture of housing types in the Study area should accommodate various income levels and family types, including single-family, which was mentioned by the public during the June 5th public meeting.
To incorporate various housing types into the Study area, a couple recommendations could be made such as zoning amendments and coordination with mixedincome housing developers. Zoning amendments are discussed in Section 6.7 for the catalytic sites, in which it is recommended for Site One and Site Two to have higher density housing. Another recommendation for those sites is zoning that allows for row homes and townhouses, one of the less common housing types in Study area. Townhomes are single-family, attached
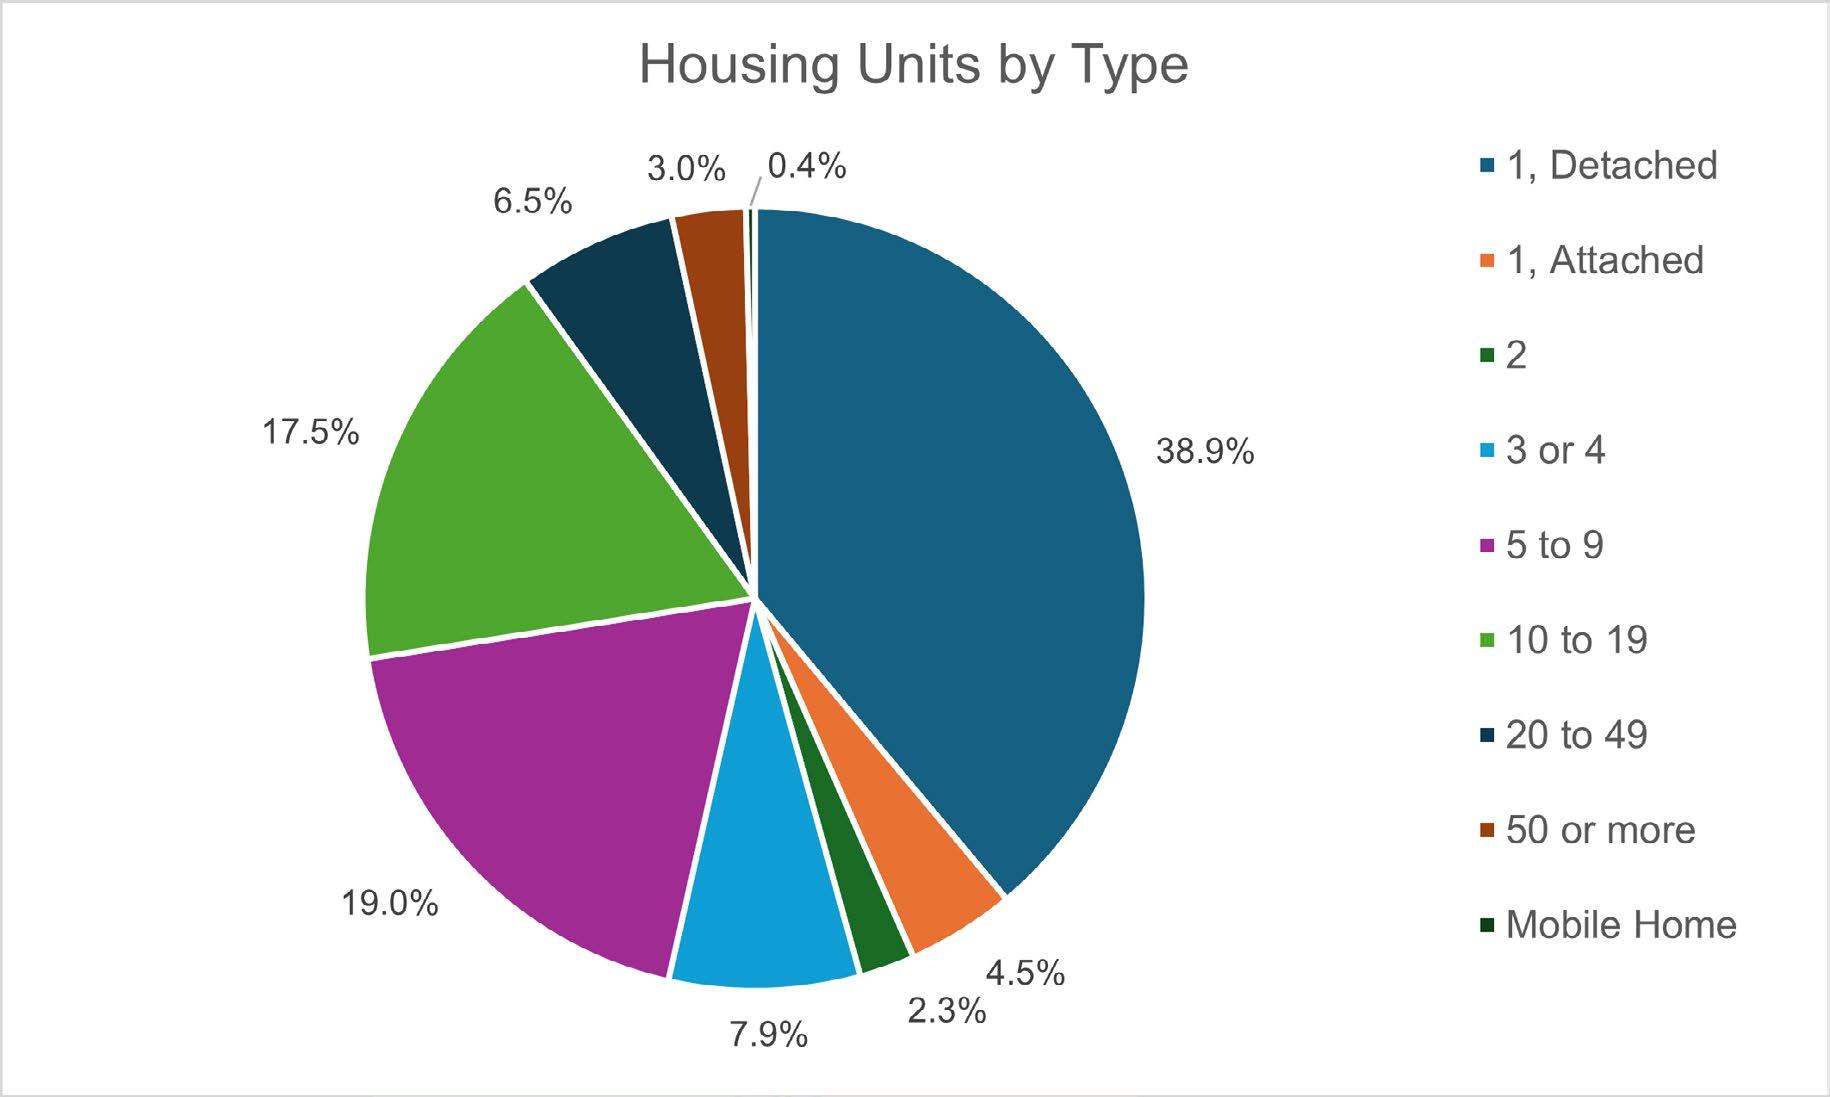
Source: U.S. Census Bureau 2022 5-Year American Community Survey
21 Housing Authority of Clayton County. Development. https://www.haccgeorgia.org/development
homes, sharing at least one wall with a neighboring home. Townhomes are compact, taking up less space than a single-family home because developers can build upward for multiple stories, instead of outward. Townhomes also require less maintenance, because they are smaller than single-family homes and have less landscaping.22
Mixed-income housing developers ensure that developments have units with varying prices; some being market-rate and others being more affordable. Developers can get these financial incentives through programs like the Housing Tax Credit Program, detailed in below in the workforce housing strategy. Mixedincome developments are attractive because marketrate units and financial incentives to provide affordable units can cover the cost of building the development. Having mixed-income developments can also create a safe, healthy, and sustainable living environment for families.23
Encourage multi-family housing to increase density
Site Two will contain the Norman Drive BRT station, on the RAPID Southlake route. To increase the possibility of ridership for the BRT, Site Two could be transformed into a transit-oriented development. This will entail zoning for mixed use, including highdensity residential housing. Because the zoning will be mixed use, the housing can occur on the second level and upward of the building, while the first level can house businesses or restaurants. The appropriate housing type for this type of development should be apartments or condominiums. These types of multi-family housing can increase density, housing more people to walk to and utilize services in the community, including RAPID Southlake. As stated above, multi-family housing can also increase affordability of an area, especially with developments by mixed-income housing developers.
Add workforce housing to provide affordable housing
Workforce housing is defined as housing that is affordable for those earning between 80 percent and 120 percent of the area median income.24 This housing is designed to support those in the public sector like teachers, police officers, and healthcare workers. These employees could benefit from living near their
service area, but sometimes cannot afford to because of rising housing costs. Workforce housing could be provided in either Site One or Site Two with the proper zoning for multi-family housing.
One program in Georgia that can support workforce housing is the Housing Tax Credit Program. This program produces rental housing for households with incomes between 20 percent to 80 percent of the Area Median Income. The housing credit reduces a taxpayer’s income tax liability if they make a long-term investment in affordable rental housing.25 The credits are awarded to development teams through the Georgia Department of Community Affairs.
As stated in Section 6.7, using greenspace benefits people both physically and mentally. Greenspace gives people a chance to connect with nature and each other. For these reasons, and because the public noted a lack of greenspace in the Study area, greenspace has been factored in the catalytic site designs.
In Site One, it is recommended to extend Walker Creek Road from SR 314/W. Fayetteville Road to Phoenix Boulevard and convert it into a multi-use trail. This trail could encourage walking or biking around the business park at the corner of SR 314/W. Fayetteville Road and Phoenix Boulevard. While working in an office setting, people are also encouraged to stand up and take breaks to prevent eyestrain and give the brain some rest from work.
In Site Two, greenspace surrounds the North Clayton High School building and replaces asphalt in front of the shopping center on the southwest corner of SR 139/Riverdale Road and Norman Drive intersection. Additional greenspace could be created a part of the mixed-use developments at Site Two.
Site Three’s main focus is greenspace. Once the Quarry is inactive, the landfill could be turned into a park per this Study’s recommendation. Trails, water features, and park land will fill most of the site, leaving some room for mixed use, commercial, and industrial developments. The quarry could be filled with water, creating water features as seen in Figure 6-22. The
22 Architectural Digest. What is a Townhouse? https://www.architecturaldigest.com/story/what-is-a-townhouse
23 National Housing Conference. Common Incentives and Offsets in Mixed-Income Housing. https://nhc.org/policy-guide/mixed-income-housing-thebasics/common-incentives-and-offsets-in-mixed-income-housing/
24 https://www.hud.loans/hud-loans-blog/workforce-housing-why-is-it-so-important/
25 https://dca.georgia.gov/affordable-housing/housing-development/housing-tax-credit-program
concept features a plaza with large trees and a wide walkway to view the water feature. There is also an opportunity for more trails with the Flint River connecting to the Atlanta Beltline. Part of the Flint River is in the northeast corner of the Study area in Site Three. The multi-use trail would connect the Flint River to the Atlanta Beltline and a system of trails around the Atlanta Region. Site Three has the potential to be a major attraction for the Study area, providing views of the planes taking off from the airport, while immersing people in nature.
Many of the strategies promote growth while reducing blight in the Study area. To achieve both, strong partnerships need to be formed with local partners like the Clayton County Planning and Zoning Department,
the Housing Authority of Clayton County, and the Clayton County Office of Economic Development. Regional and state partners like the Atlanta Regional Commission and the Georgia Department of Community Affairs can also provide resources for making the area attractive to developers. Strategies in the toolkit also recommend different partnerships with non-profit and for-profit developers on housing.
To actualize these recommendations, this LCI Study must receive support from the community, who will ultimately be living and working in the Study area. Community input will be crucial to ensuring the new development and redevelopment will be used and supported by not only the residents of the community, but also visitors to each of the nodes in the Study area. With the Study area being adjacent to the airport, this Study presents an opportunity for a place where people will desire to stay around the airport and pour into the community economically.
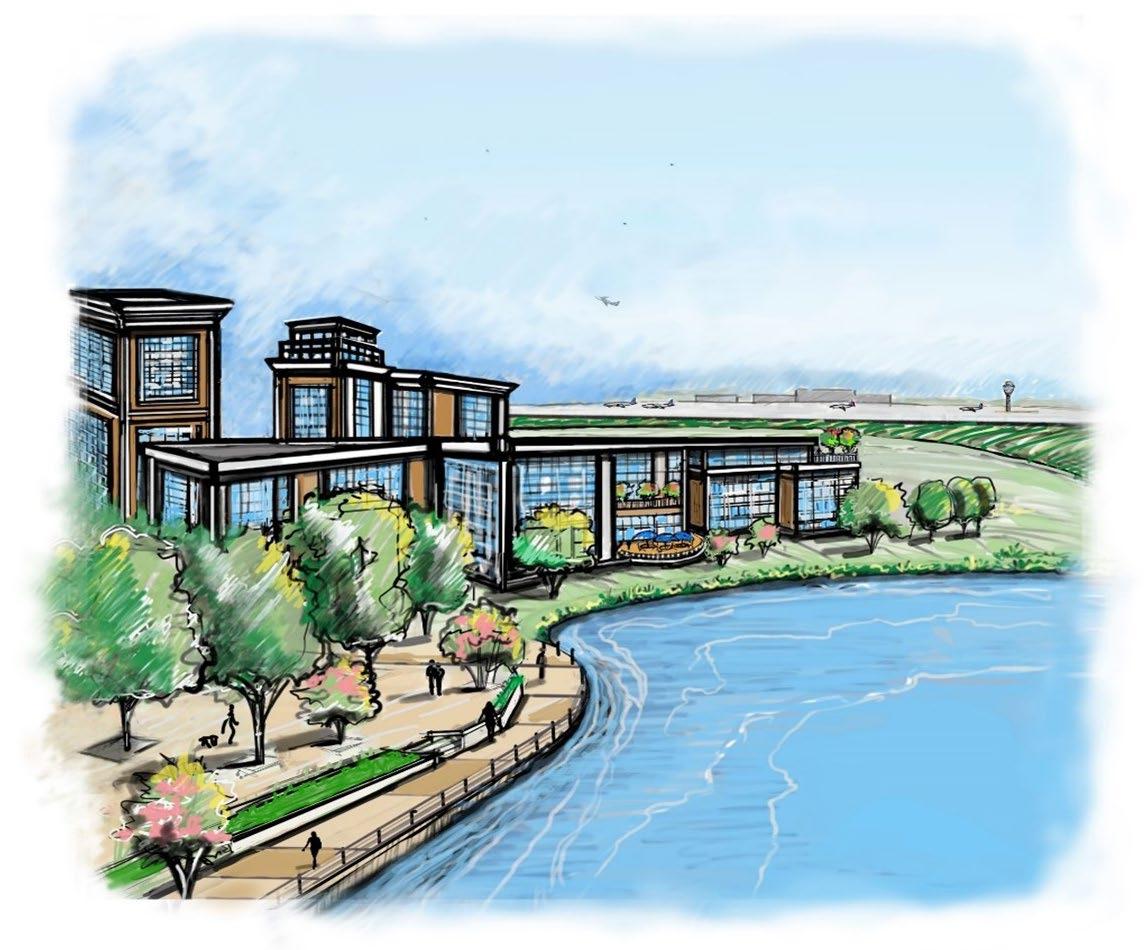
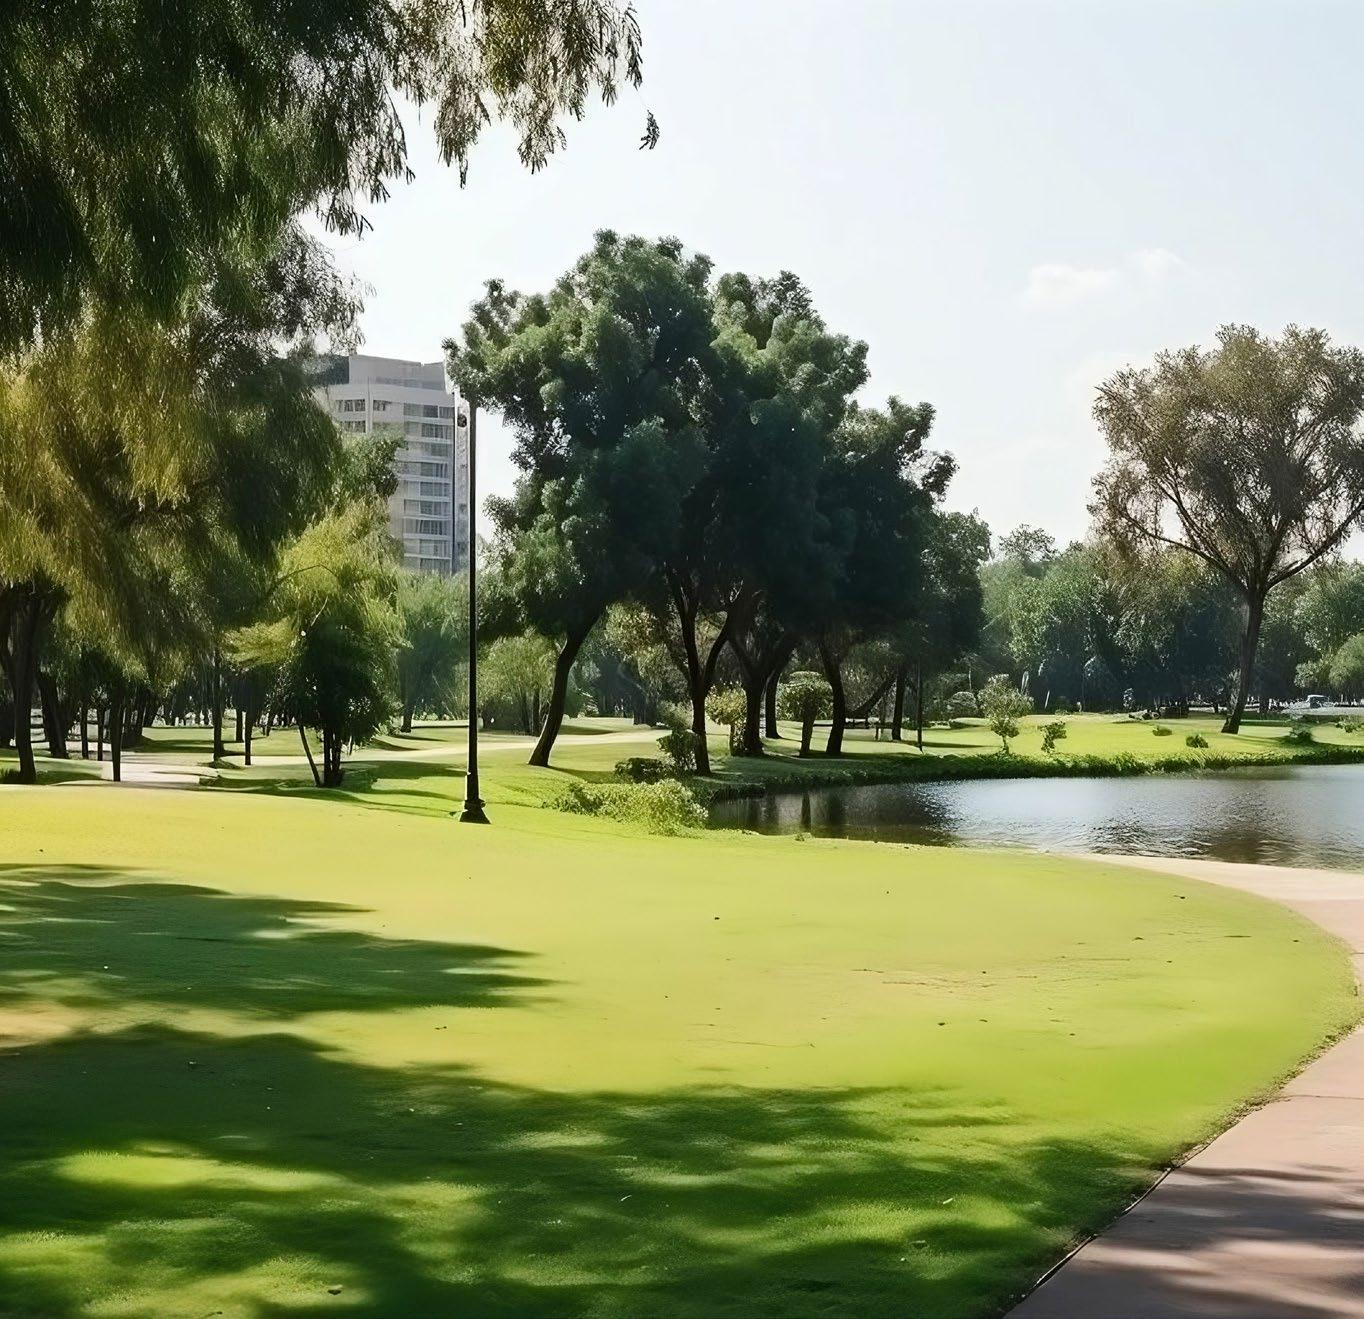
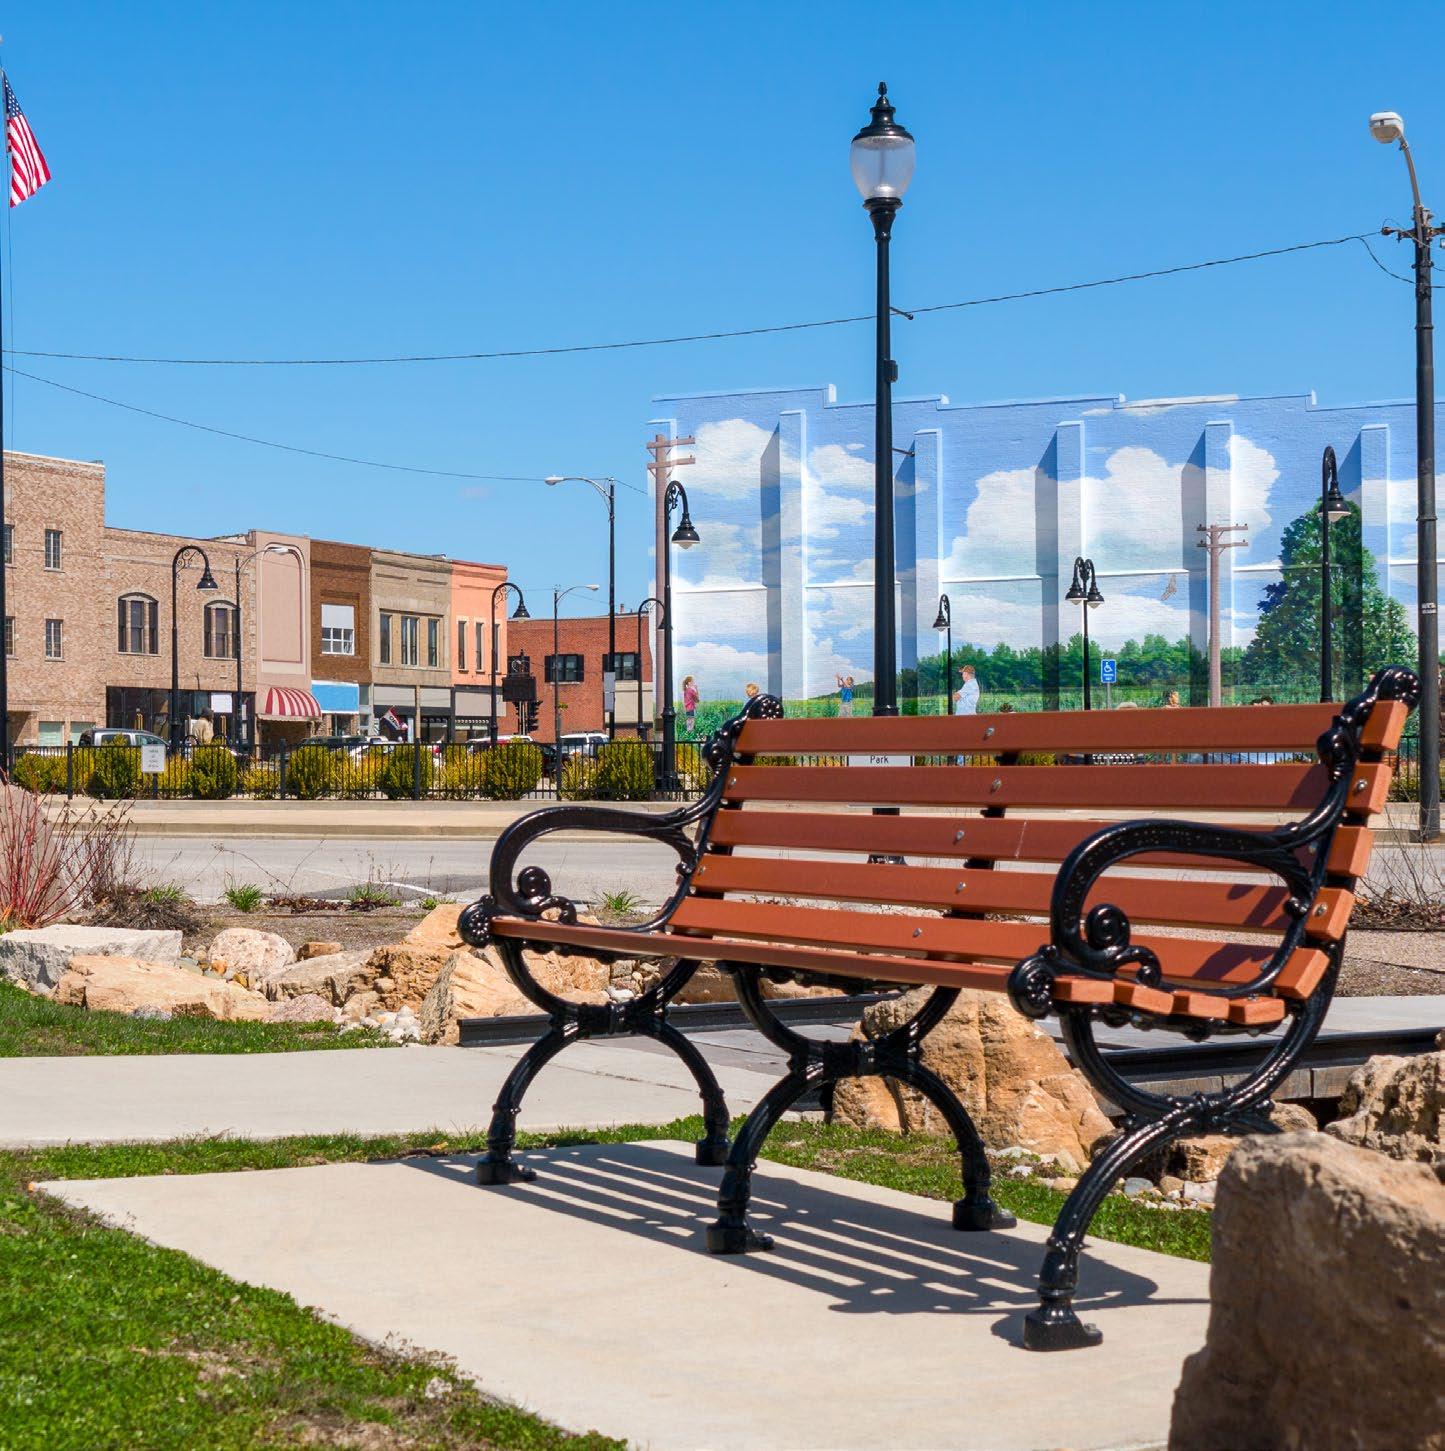
Placemaking can be used to improve all the spaces that comprise the gathering places within a community – its streets, sidewalks, parks, buildings, and other open spaces – so they invite greater interaction between people and foster healthier, more social, and economically viable communities. But placemaking is not just the act of building or fixing up a space; it is a process that fosters the creation of vital public destinations, community programs, pocket parks, art destinations, safe walkable routes for daily exercise –the kind of places where people feel a strong stake in their communities and commitment to making things better. Placemaking capitalizes on a local community’s assets, inspiration, and potential, creating good public spaces that promote people’s health, happiness, and economic well-being.
Listening and supporting the community in creating a unique sense of place is a role the AACIDs has undertaken through this Study, planting the seed for the community to embrace and build upon into the future. During September and October 2024, four pop-ups were held to inform the study area community of placemaking strategies. The public was able to choose locations and types of placemaking from display boards. This community showed an eagerness to bring their ideas to life to create a place that is unique to their places of live, work and play. Two of these events are shown in Figure 7-1.
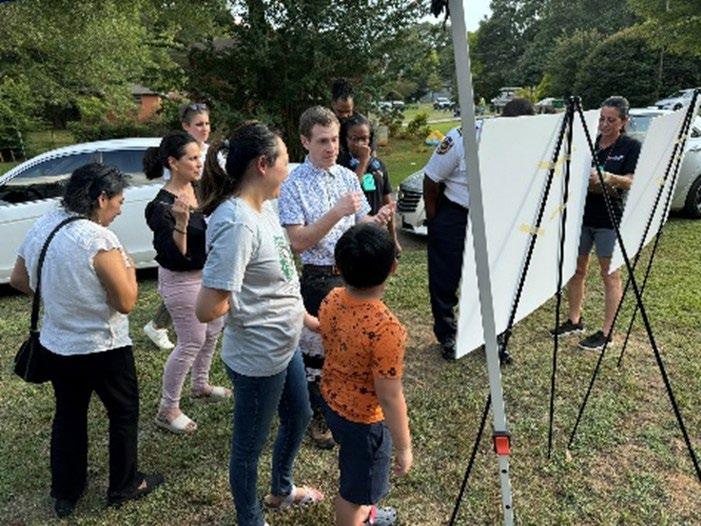
The results of the pop-up events for the top intersections for placemaking tools in the study are presented below. The map of the intersections and their corresponding numbers is shown in Figure 7-2.
1 2 3
State Route (SR) 139/Riverdale Road & SR 314/W. Fayetteville Road (Intersection #1) –
34 votes
SR 139/Riverdale Road & SR 314/W. Fayetteville Road (Intersection #2) –
32 votes
Garden Walk Boulevard & SR 85 (Intersection #7) –
31 votes
4 5
Phoenix Boulevard & SR 139/Riverdale Road (Intersection #6) –
27 votes
Godby Road & Norman Boulevard (Intersection #5) –
24 votes
According to feedback received from the pop-ups, the top placemaking tools desired by the public are presented in Figure 7-3. The placemaking tools were displayed on boards at the pop-ups. The public was asked to rank the tools by placing dots on their preferred tools. The placemaking tools are shown below in the order of most to least preferred.
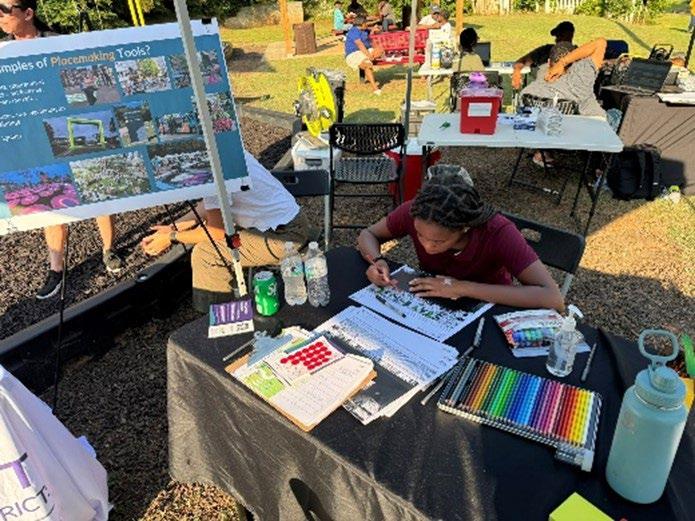
Area for Placemaking


Public engagement meetings were held virtually on May 21, 2024, and September 23, 2024. Placemaking topics were highly valued during these meetings with the general public. The public emphasized the lack of greenspace in the study area. The public also voted on their top placemaking tools for the Study area, as displayed in Table 7-1. A final public meeting was held on January 28, 2025, to provide updated recommendations based on the previous public feedback and to present conceptual visualizations and next steps for recommendations for the Study, including placemaking for the Study area.
A group of key stakeholders, known as the PAC, were engaged in a placemaking interview on March 19, 2024. Feedback and strategies received included:
• The inclusion of arts and culture that highlight the region.
• Mix-use developments near schools.
• Art in parks and playgrounds to motivate/ promote walkability.
• Creation of public spaces with bodies of water to enhance enjoyment and educate users of the natural environment.
Additionally, the PAC was engaged again on June 5, 2024, and October 17, 2024. The PAC voted on their top placemaking tools for the study area; results are shown in Table 7-1. Regarding placemaking in the study area and the key comments, opportunities and strategies received were:
• Creation of an arts and culture sub-committee dedicated to placemaking.
• Focus on incorporating multimedia production and potential opportunities from the Film Tax Credit into the study area promoting creativity.
• Develop ways to incorporate the physical landscape between community development and film industry professionals.
• Invest in parks, playgrounds, and community gardens.
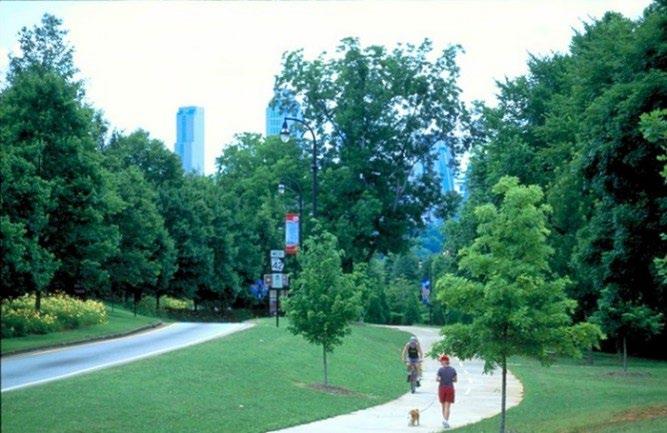
Additionally, during the stakeholder interview, the PAC also identified challenges to placemaking. These challenges were funding, marketing, and promotion of placemaking activities and improvements. They mentioned that there are a lot of murals throughout Clayton County, but from a marketing standpoint there is no advertisement about where the murals are located for community awareness.
In conjunction with the input received, the next steps are recommended for advancing placemaking within the ASCID area.
• Create a unified set of Design Guidelines with community and stakeholder support which create standards for the public realm as related to elements such as functional landscapes, e.g.; street trees, green infrastructure, permeable pavers, lighting and site furniture and signage. This would be an independent document that would guide future development and the
associated right-of-way treatment.
• Create an Art Framework Master Plan for the district. This plan identifies specific locations and the types of art to be developed along with associated programs. Developing this tool will be a great opportunity for AACIDs to partner with the schools and institutions within the study area and county to foster community engagement related to the Arts and Culture of the study area and will help to strengthen AACIDs’s relationships with the community.
There are many opportunities within the Study area to create unified streetscapes which accommodate all users such as open space, pocket parks, and trails, all considered short and mid-term projects. Figure 7-4 displays the NW Clayton LCI Study area and three catalytic sites that could benefit from placemaking. Further information specific to the catalytic sites can be found in the Northwest Clayton LCI Economic Development Strategy Document.
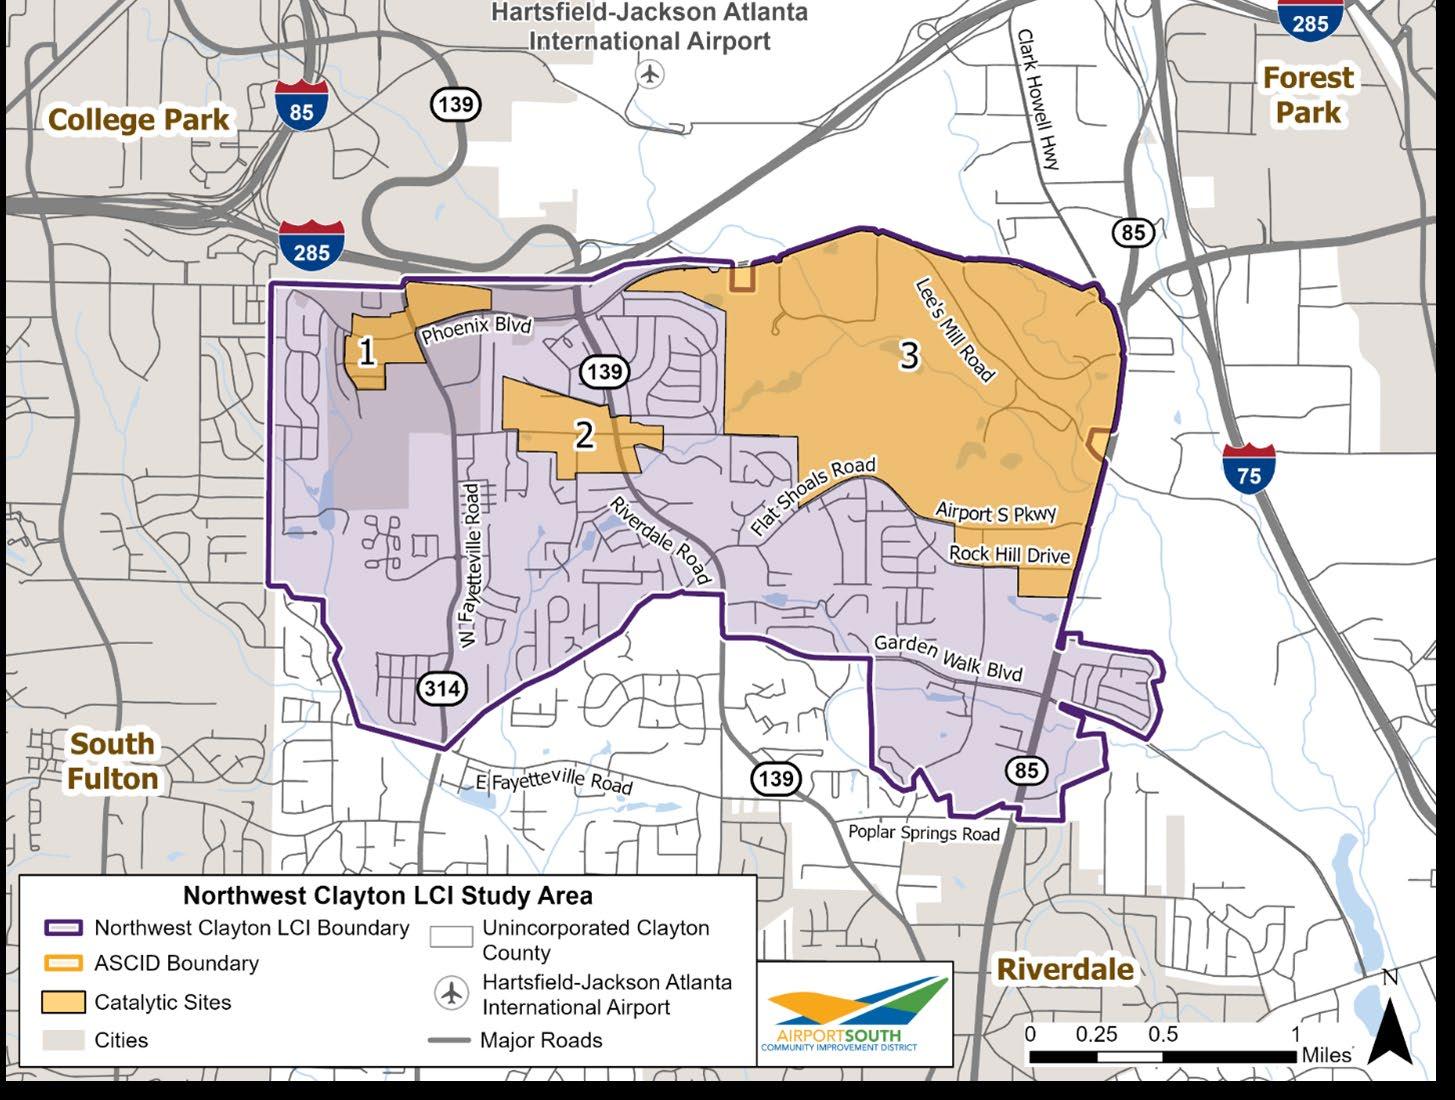
Across the country, many transit stations have public art. Public art at transit stations can add uniqueness, brightness, and a sense of community to a station. The MARTA RAPID Southlake route is a BRT line, that once complete, will travel down SR 139/Riverdale Road in catalytic Site Two. The site will also have a BRT station at the intersection of SR 139/Riverdale Road and Norman Drive. This station presents an opportunity to incorporate public art and wayfinding into Site Two. Once design guidelines are set for the LCI, with community input, local artists can be commissioned to create custom artwork into the station.
This artwork could also expand into unique wayfinding to help people find their way to the station. AACIDs would have to coordinate with MARTA and local artists to develop the appropriate art medium and wayfinding designs for a cohesive look for the Norman Drive BRT station. Wayfinding guidelines could be inspired by the designs in The Signage and Wayfinding Phase 1: Concept Design (2018) for Aerotropolis Atlanta CIDs, by Kimley Horn and Huie Design (see Appendix A). The concept design provides renderings for potential signage along interstates and highways. Figure 7-5, depicting decorative glass art installed by the Pinellas Suncoast Transit Authority, is an example of how art can be incorporated directly into the design of BRT stations.
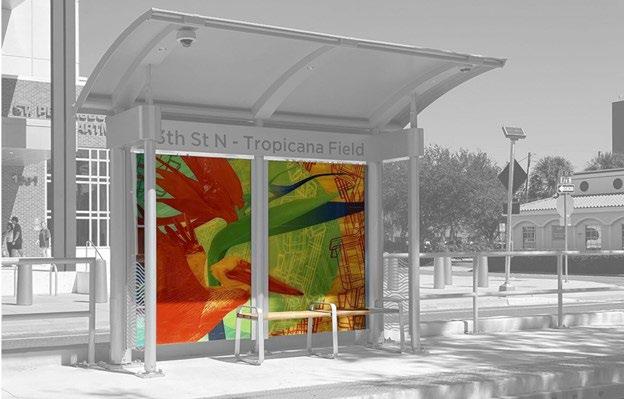
Source: https://www.generalglass.com/projects/sunrunner-bus-rapid-transit-public-art/
Long term, there is a huge opportunity within the Study area to re-envision catalytic site three and to leverage, embrace, clean, and educate the importance of the Flint River to Georgia’s ecosystem. Catalytic Site Three is approximately 850 acres in size, including approximately 300 acres of gravel and aggregate mining operations, 80 acres of a former decommissioned landfill, and approximately 470 acres currently devoted to industrial uses are sitting as undeveloped sites. Based on the feedback received from both the public and stakeholders, there is a strong desire for more open space and trails in the Study area, and the project team saw a unique opportunity with this desire and the catalytic site characteristics to also provide an educational opportunity for the Flint River and its many benefits.
The Flint River, shown in Figure 7-6, is long overdue for attention in improving the water quality and celebrating it as a natural resources and amenity. The headwaters of the Flint River originate just northwest of Hartsfield-Jackson Atlanta International Airport (HJAIA) in East Point, Georgia. From there, the Flint River travels under HJAIA and day lights just southeast of the airport runways. The Flint River traverses the Study Area and sits just west of the ASCID boundary.
A world class Flint River Ecological Center could be considered for this area as an asset and destination to educate and inform the public on the importance
of water quality and environmental stewardship. Northern Georgia currently does not have a Flint River Educational Facility, although a Flint River educational facility exists in Albany, Georgia. Knowing this and hearing from the public’s desires for more open space, common space and trails, this location provides a unique opportunity of transforming existing utilitarian uses to a world class destination providing recreational and educational facilities for the many schools in the area. Additionally, the existing quarry in Site Three could be filled with water, further providing unique amenities for the area attracting national attention in ecological restoration, as shown in Figure 7-7.
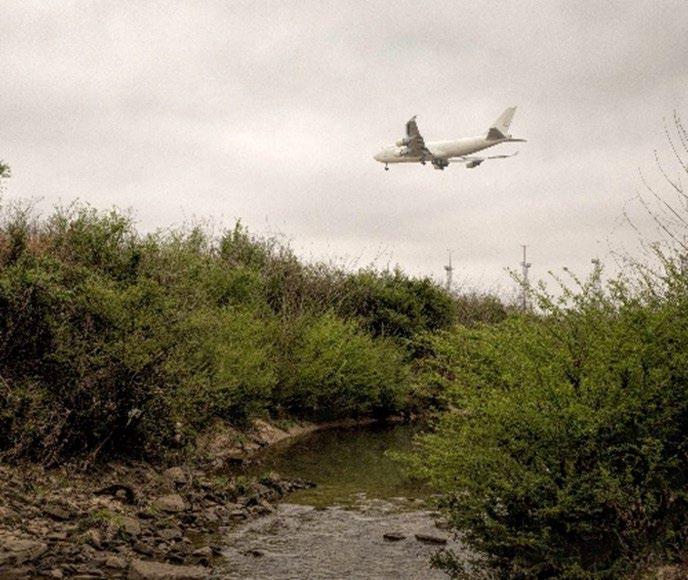
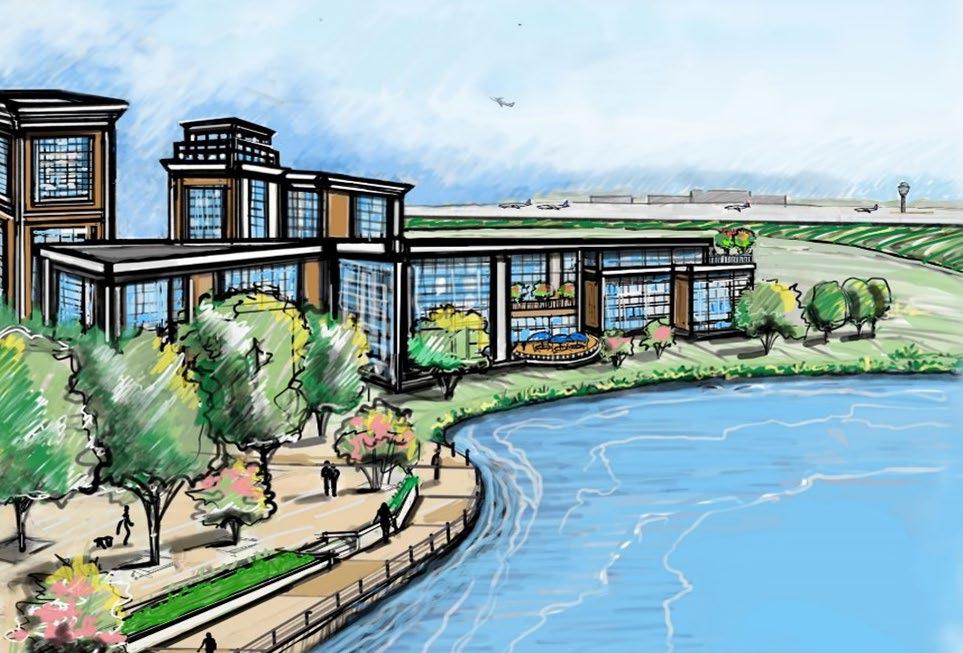
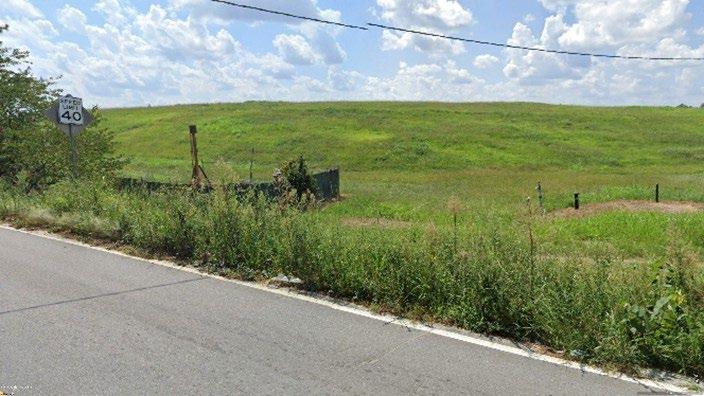
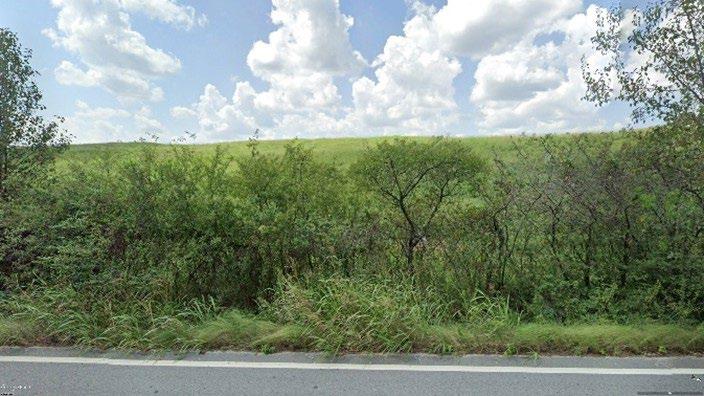
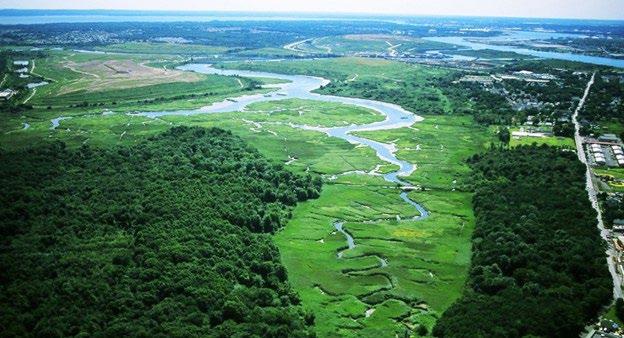
Another unique opportunity adjacent to a portion of the Flint River within the Study area is a non-operating landfill, shown in Figure 7-8. Many great parks across the country have been developed on decommissioned landfills, such as Freshkills Park in Staten Island, New York, presented in Figure 7-9. Table 7-2 provides a list of decommission landfills transformed into successful parks. The former landfill located in catalytic Site Three could be converted into a “High Point or Sculpture Park.”
Another example of a landfill-turned-park is Mount Trashmore Park in Virginia Beach, Virginia. Presented in Figure 7-10, the park measures 165 acres and is the nation’s first landfill park. The park boasts a number of amenities, including two man-made mountains, two lakes, a skate park, a water-wise garden, and two playgrounds such as Kids Cove presented in Figure 7-11. Ultimately, a study would need to be conducted to determine if this and other land in the study area can become parks.
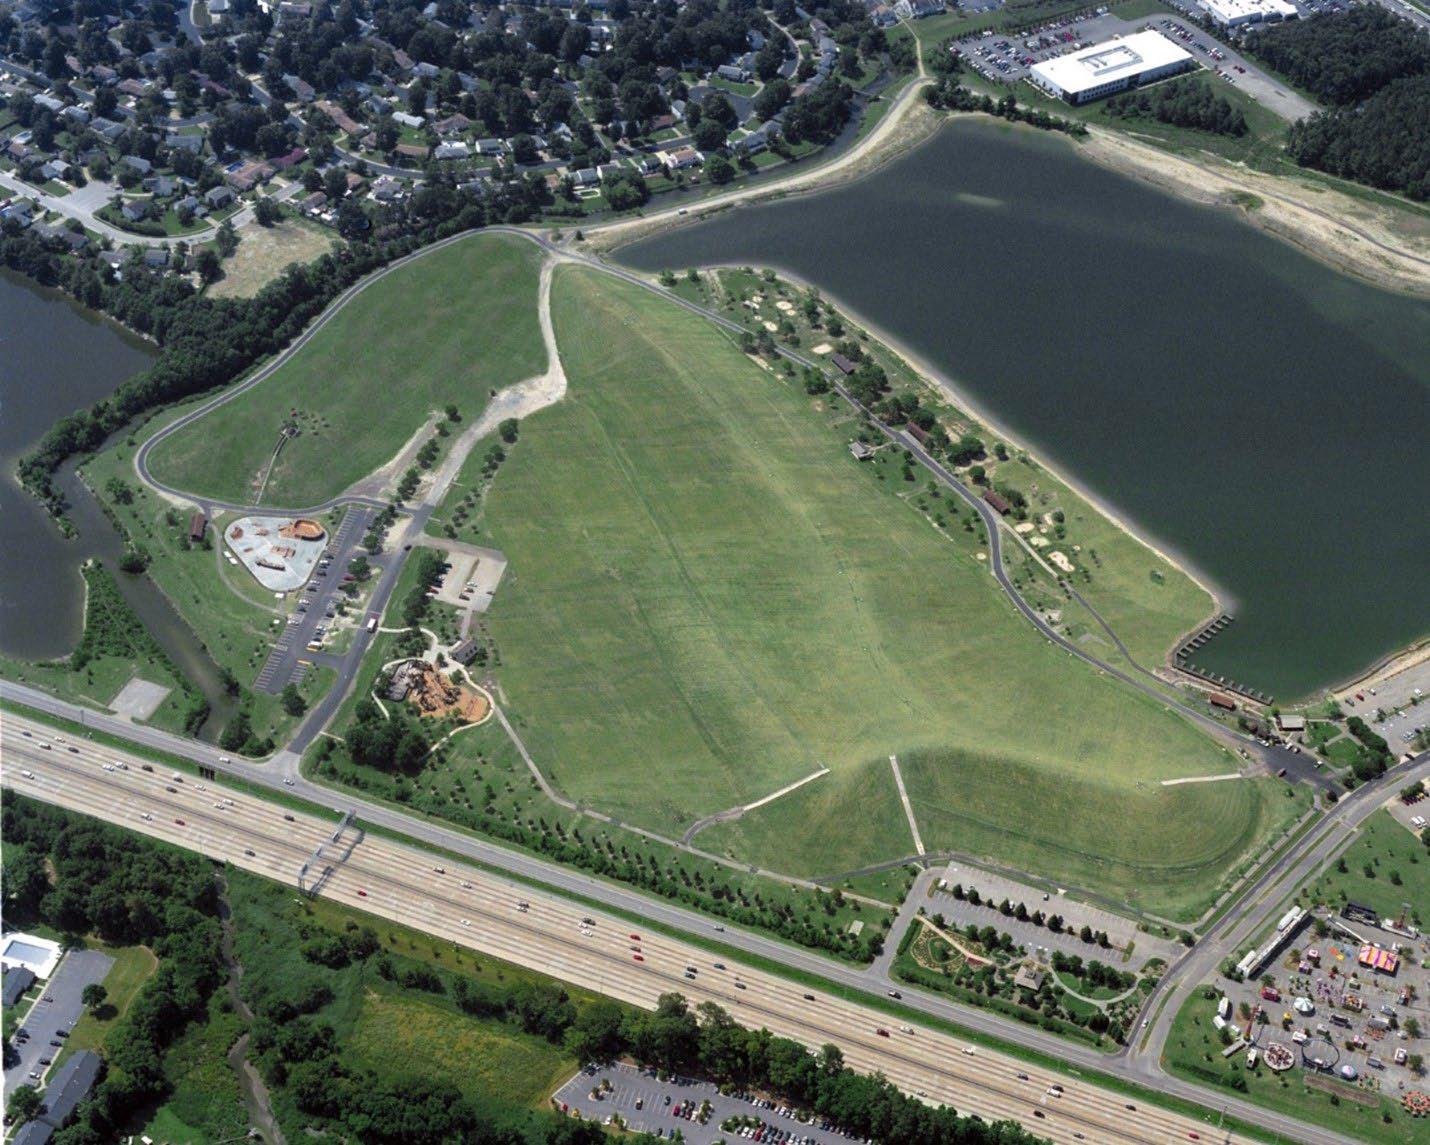
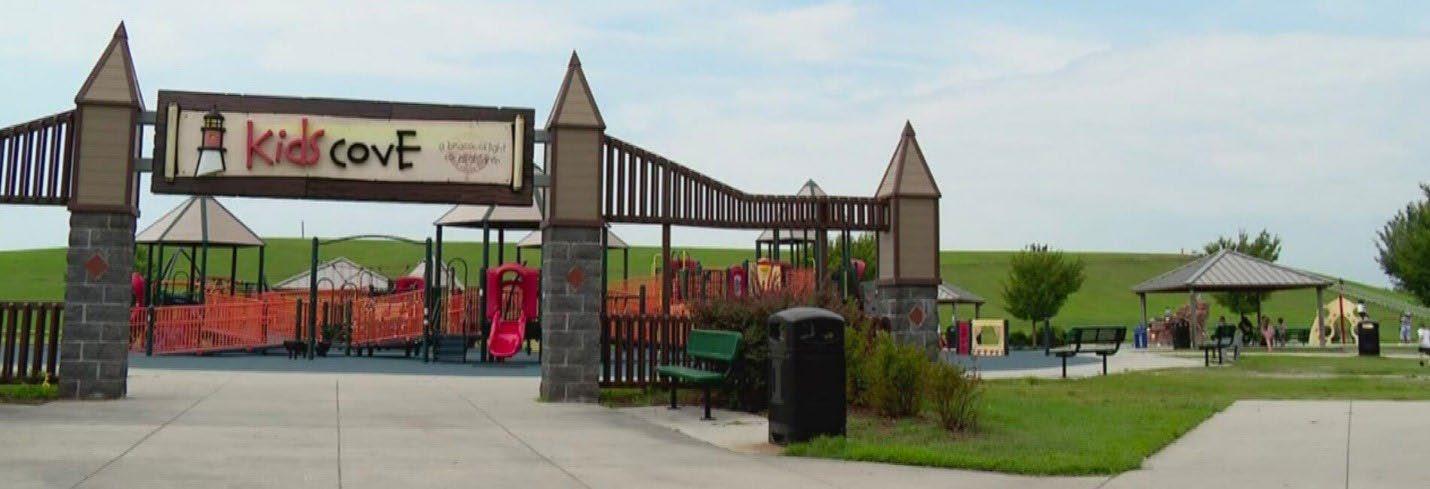
During the public meeting held on September 23, 2024, the public expressed the need for trash removal along major corridors in the Study area. Trash removal can be tackled in two different ways: AACIDs can coordinate with Clayton County on ways to improve trash removal; or Clayton County can reinstate the Keep Clayton Clean and Beautiful Program. This program allowed citizens and community organization opportunities to volunteer to help with litter clean up. The program consisted of three adoption programs:
• Adopt a Spot – Adopt an area less than a mile.
• Adopt a Road – Adopt a mile or more of a road.
• Adopt a Bus Stop – Adopt a MARTA Bus stop.
Reinstating this program or coordinating with Clayton County would increase cleanliness and help beautify the Study area.
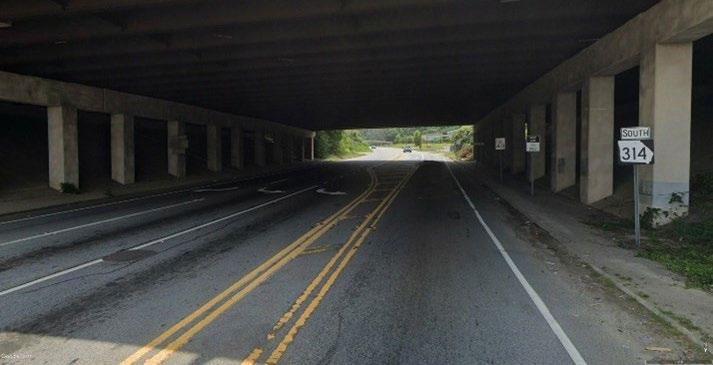
A gateway opportunity was identified within the Study area at the existing retaining wall and underpass approaching SR 314/W. Fayetteville Road, displayed in Figure 7-12. Figure 7-13 demonstrates what the concept for Interstate 285/SR 314/W. Fayetteville Road underpass would look like at night. Another gateway opportunity was identified at the intersection of Phoenix Boulevard and SR139/Riverdale Road, which is a candidate location for a mural installation, similar to the example in Figure 7-14. As these are both main entries into the Study area and first impressions are lasting, community-based quality design should be incorporated.
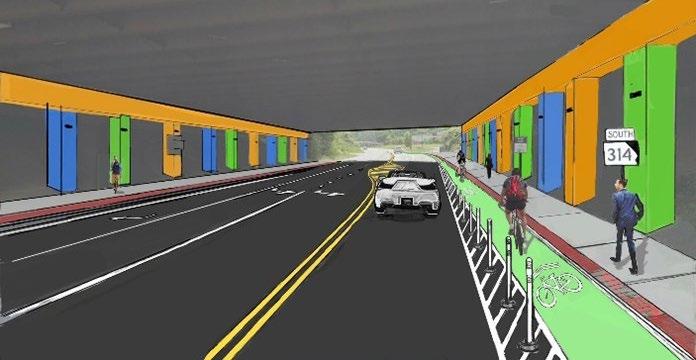
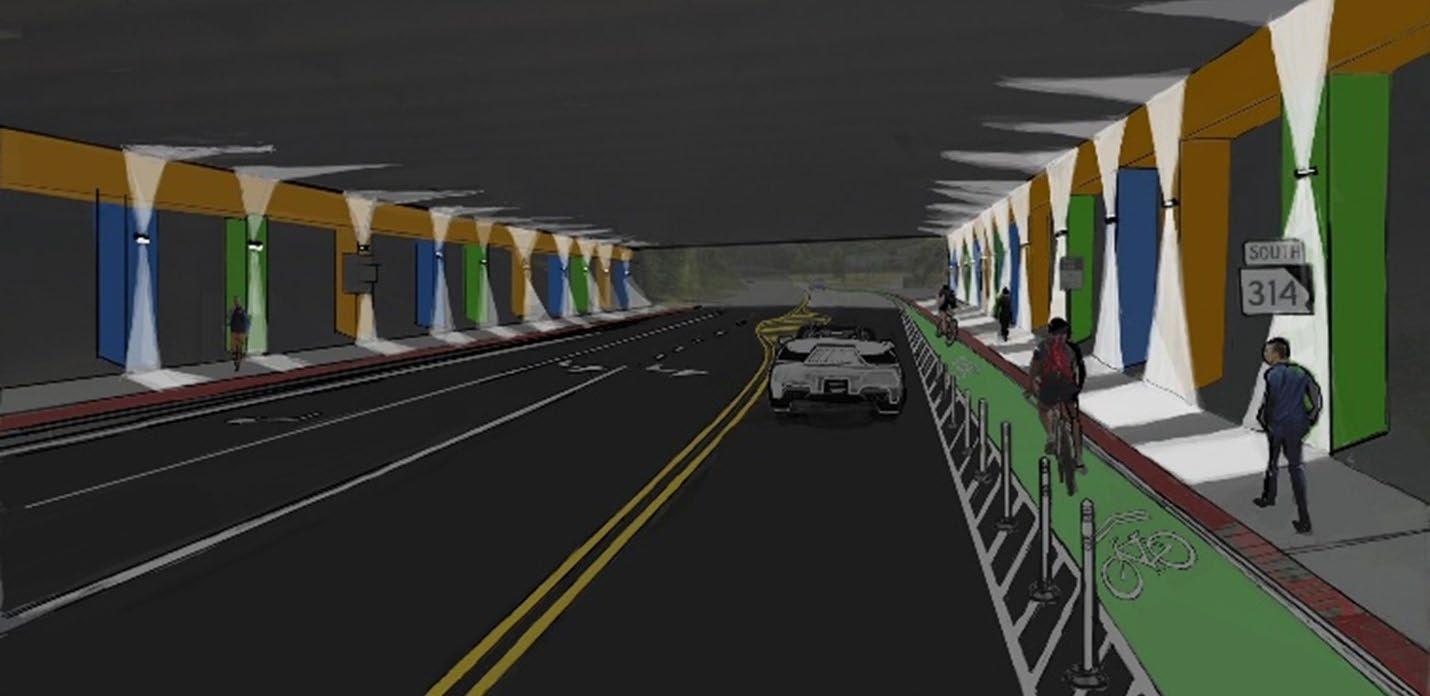
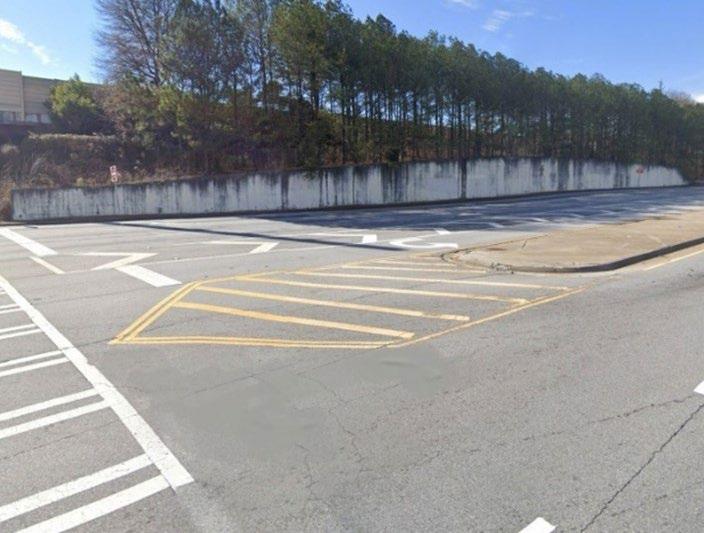
Improvements within the right-of-way and enhancements to the aesthetics of an area are one of the most powerful tools the CID can employ to attract and retain new businesses, improve the quality of life of the residents and provide a unique but consistent look for the district. Private investment typically follows public infrastructure investments, therefore the ASCID has an opportunity to improve not only the transportation facilities of user groups but also to create parks, destinations, and an appealing appearance. This will also promote civic pride for the residents and impress visitors who are visiting the area; first impressions are lasting.
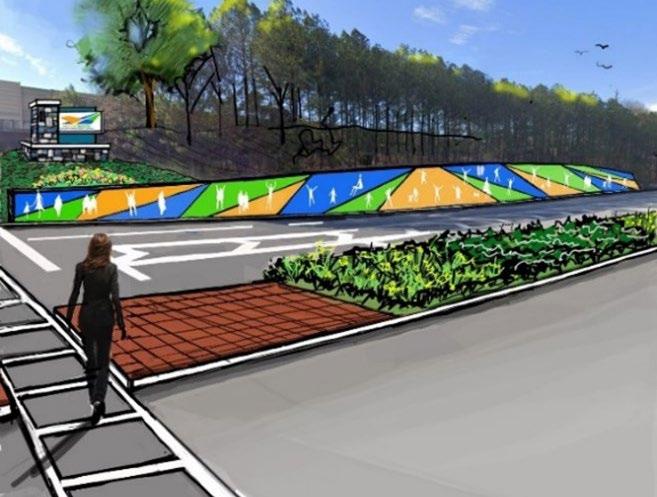
Within the process of developing these guidelines, identifying community champions that take leadership roles in leading community-based efforts to implement and engage the citizens is key. Once these standards and guidance documents are created, ASCID can set the stage for action. These efforts should not be overwhelming but consistent as opportunities arise. As these placemaking improvements become reality, typically the people who live, work, and play within the area will garner improved civic pride and passion for their community while improving their health and welfare and overall quality of life.
To move towards implementation, two steps must be taken: (1) consider incomplete actions from the previous Livable Centers Initiative (LCI) Studies and (2) form partnerships to collaborate on implementing recommendations. The next two sections will examine these steps and their role in implementation.
Before developing recommendations, the Study team reviewed the work plans from the previous 2004-2011 LCI Studies to determine which actions had been completed. Incomplete actions were considered in the new set of recommendations for
this Study and are listed below in Table 8-1. Most incomplete actions are part of new recommendations, except for certain actions pertaining to the Cherry Hills Subdivision Area. As of 2025, the Cherry Hills Subdivision redevelopment has not been completed. The development was slated to be a light industrial, commercial, and high-density residential complex south of Interstate 285 and Riverdale Road. When developing catalytic sites, commercial areas and areas surrounding the future RAPID Southlake BRT stations were considered. The recommendations at catalytic Site Two: Riverdale Road/Norman Drive will positively impact the Cherry Hills Subdivision, which is in close proximity to the site.
Transportation
Riverdale Road: Construct sidewalk/streetscape on the east side from Kingswood to Crystal Lake
Construct sidewalk/ streetscape on Phoenix Blvd from West Fayetteville to Riverdale
Construct sidewalk along Flat Shoals from West Fayetteville to Riverdale
I-285 Interchange Study for Redeveloped area (Cherry Hills Area)
Improve traffic capacity, safety and operations
Intersection Improvement (W. Fayetteville and Pleasant Hill)
Extend East Pleasant Hill Road to Fulton County Line Roadways
Extend Denny Drive to Pleas-ant Hill Road Roadways
New Roads to support mixed use development area along Godby Road & W. Fayetteville Road Roadways 2014-2016
New roads to support redevelopment area along Godby Road Roadways 2014-2016
None – I-285 interchange not in study area
in multiple new recommendations
east/west connections
east/west connections
New recommendation for Catalytic Site 1: Godby Road
New recommendation for Catalytic Site 1: Godby Road
Construct covered bus stops along transit routes (to include expanded routes)
Expand transit routes to in-clude Godby Road, W. Fayetteville Road and Pleasant Hill Road
Construct an off-road Greenway Trail System
Housing
Coordinate with Cherry Hills Task Force to develop new higher density residential housing in this area
Encourage conversion of rental multi-family property to condominium ownership where appropriate
Develop construction and design standards for new and redeveloped multi-family housing in the study area
Develop Design Guidelines to supplement the Cherry Hills Overlay District
Other
Establish and Coordinate a Cherry Hills Task Force Task Force
Establish and Coordinate a Transit Focus Group Focus Group
Purchase property for parks and trails as identified in the master plan
Bus stop amenities will be con-structed according to MARTA’s Amenities Plan; New recommendation for study of new bus routes
Connect roadwayadjacent pedestrian and bicycle infrastructure to existing and planned trail networks
Incorporate a mixture of housing types into the study area; Encourage multi-family housing to increase density in the study area
Incorporate a mixture of housing types into the study area
Incorporate a mixture of housing types into the study area; Encourage multi-family housing to increase density in the study area
New recommendation to develop a system for wayfinding, streetscape enhancements, green infrastructure, and placemaking opportunities
Not applicable
Potential as a part of a future study for expanded bus routes
Incorporate additional greenspace, pocket parks and playgrounds
Amend the County's Future land use map to reflect the recommendation land changes included in the LCI Plan
Develop landscape design standards for the Study Area
Conduct a transportation study to determine the preferred route from the recommended industrial redevelopment in Cherry Hills to the airport's planned air cargo facilities
Develop a marketing plan for the LCI Study Area, including a database of available land and buildings
Rezone the Cherry Hills Subdivision area to conform to the recommendations of the LCI Plan
Source: NW Clayton LCI Study 2023 Record of Accomplishments
No inconsistencies with Future Land Use; New recommendation to rezone parcels in catalytic sites to support transitoriented development and higher density uses
Develop a system for wayfinding, streetscape enhancements, green infrastructure, and placemaking opportunities
New recommendation to support a State Route (SR) 139/Riverdale Road scoping study for freight
Addressed in multiple new recommendations
For implementation of the recommendations, this Study needs partnerships with various partners. Figure 8-1 shows the potential partners that could help with funding and oversight of the processes for transportation, land use, housing, economic development, and placemaking for projects from the Study. These partners can help ASCID make the recommendations of this Study a reality; additional studies or applications for funding may be needed for these partnerships.
Figure 8-1:Potential Partnerships for Implementation
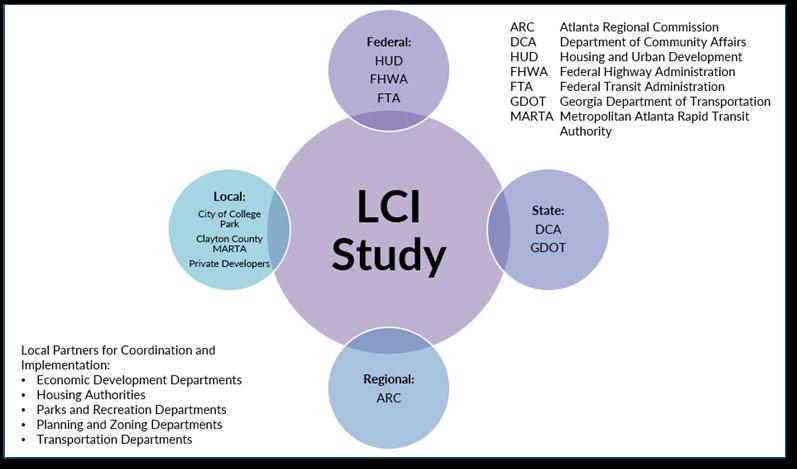
Once partnerships are established and incomplete actions are considered, recommendations can be developed. The recommendations for implementation are split into four plans: Priority Project List, 100-Day Action, 5-Year Implementation Plan, and Long-Term Implementation Plan. The map below, Figure 8-2, displays where the recommendations could take place within the Study area. The plans are detailed in subsequent sections, Sections 8.3.1 through 8.3.4.
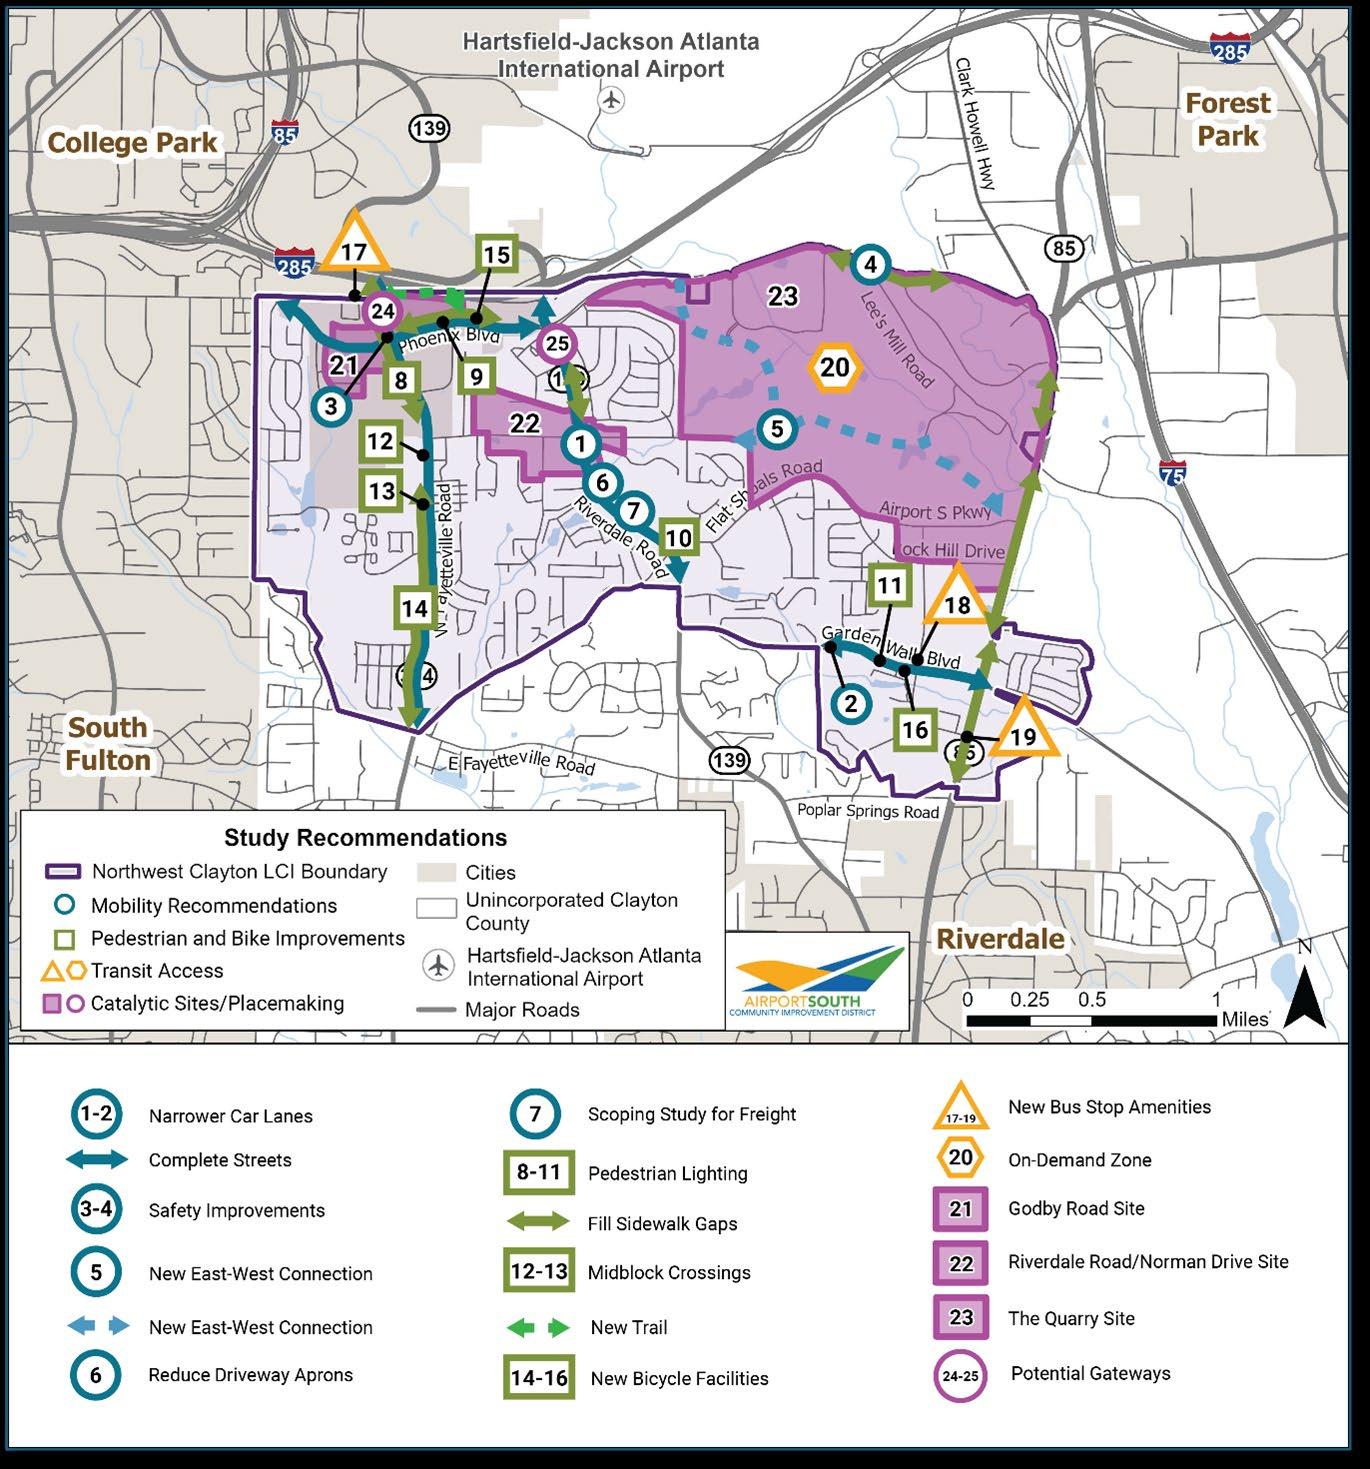
These recommendations are the starting point for change in the Study area because of the LCI Study. Over time, each recommendation should be further evaluated for feasibility and refined during the process of implementation, from planning to construction. The Priority Project List, 100-Day Action, 5-Year Implementation Plan, and Long-Term Implementation Plan should be reviewed annually for complete projects to track progress towards the LCI Study’s goals. Typically, LCI Plans are updated every five years.
Priority projects are the top projects to be addressed as a result of this Study. Part of the prioritization process involved analyzing the relationship between the LCI Study goals and the recommendations. Table 8-2 shows how many of the goals each recommendation will achieve. Four recommendations achieve multiple goals: (1) Adopt a key street approach, (2) Conduct a multi-modal network plan, (3) More transit connectivity options, and (4) Foster redevelopment and TOD investments through new land use and zoning policies at catalytic sites. Each of these recommendations were added to the priority list in Table 8-3.
Conduct Multimodal Network Plan to fill in missing sidewalk gaps along key corridors, connect roadway-adjacent pedestrian and bicycle infrastructure to existing and planned trail networks, new bicycle facilities
Land Use/ Economic Development Catalytic Sites
LU-1 Land Use Catalytic Sites/ Study Area
Foster redevelopment and TOD investments through new land use and zoning policies at catalytic sites
Rezone parcels in catalytic sites to support transit-oriented development and higher density uses
Provide a variety of land uses within the study area, including greenspace where appropriate
Develop Housing Task Force to incorporate a mixture of housing types into the study area, encourage multifamily housing to increase density in the study area, add workforce housing to provide affordable housing in the study area
Develop guidelines for wayfinding, streetscape enhancements, green infrastructure, and placemaking opportunities
Placemaking Beautification
PM-5 Placemaking Community Space
PM-6 Placemaking Greenspace
Develop a beautification and placemaking plan to add street trees and landscaping on selected corridors, provide street furniture and pedestrianscale lighting
Create an Art’s Framework Master Plan to incorporate public art
Establish gateway features in study area for two gateways
Include space for community events in the study area
Incorporate additional greenspace, pocket parks and playgrounds
Expand multimodal and transit connections to the area’s largest employers
Establish a regional identity and sense of place and community through art and placemaking
These projects were chosen based on public feedback, ability to achieve multiple LCI Study goals, and vitality to the Study area according to AACIDs. Priority projects are detailed in Table 8-3.
Table 8-3: List of Priority Projects with Timelines
T-4 N /A Transportation Multimodal Network Plan Adopt a complete streets approach for key corridors
T-5 12-13 Transportation Multimodal Safety Improvement Add midblock crossings at schools on W. Fayetteville Road
T-6 14-16 Transportation Multimodal Network Plan
Conduct Multimodal Network Plan to fill in missing sidewalk gaps along key corridors, connect roadway-adjacent pedestrian and bicycle infrastructure to existing and planned trail networks, new bicycle facilities
T-12 N/A Transportation Transit Study More transit connectivity options
ED-2 21-23 Land Use/ Economic Development Catalytic Sites
N/A Placemaking Placemaking Study
Rezone parcels in catalytic sites to support transitoriented development and higher density uses Zoning Amendments 1-5 years
Develop a system for wayfinding, streetscape enhance-ments, green infrastructure, and placemaking opportunities
Coordinate with Clayton County for enhanced trash man-agement and to reinstate the Keep Clayton Clean & Beautiful Program
Recommendations in the 100-Day Action Plan, shown below in Table 8-4, are low-cost actions to be started within 100 days of plan adoption. Within this time, connections can be made to start studies and design guidelines for various transportation, economic development, and placemaking needs in the Study area.
Table 8-4: 100-Day Action Plan
Coordinate with MARTA to implement amenities at bus stops according to MARTA’s Amenities Plan
Coordinate with Clayton County to rezone parcels in catalytic sites to support transit-oriented development and higher density uses
Coordinate with Clayton County for enhanced trash management and to reinstate the Keep Clayton Clean & Beautiful Program
The Five-Year Implementation Plan includes recommendations with a longer timeframe of 1-5 years. Table 8-5 shows the recommendations with more project detail, such as responsible entities, cost estimates, timelines, and funding sources.
8-5:
T-4 N/A
T-7 N/A Transportation Multimodal
Godby Rd/ Phoenix Blvd, Riverdale Rd, W. Fayetteville Rd, and Garden Walk Blvd
Conduct Access Management Study to minimize and consolidate driveway aprons and right turn lanes on Riverdale Road
Adopt a complete streets approach for key corridors
W. Fayetteville Rd Add midblock crossings at schools on W. Fayetteville Road
Study Area; Key Corridors: Godby Rd/Phoenix Blvd, Riverdale Rd, W. Fayetteville Rd, and Garden Walk Blvd
Conduct Multimodal Network Plan to fill in miss-ing sidewalk gaps along key corridors, connect roadwayadjacent pedestrian and bicycle infrastructure to existing and planned trail networks, new bicycle facilities Study
Walker Creek Road New trail – Walker Creek Road Trail - .40 miles Study and De-sign
T-8 7 Transportation Freight Riverdale Rd
Support a State Route (SR) 139/Riverdale Road scoping study for freight Study Clayton County, Col-lege Park, GDOT, City of Riverdale $300,000 1-5 years
Transportation Block Grant/ Reconnecting Communities and Neighbor-hoods Grant
GDOT Study Funds/ARC Freight Cluster Funds
PM-1 N/A
Placemaking Placemaking Study Area
PM-2 8-11
Placemaking Beautification
Godby Rd/ Phoenix Blvd, Riverdale Rd, W. Fayetteville Rd, and Garden Walk Blvd
PM-3 N/A
Placemaking Placemaking Study Area
Develop guidelines for wayfinding, streetscape enhancements, green infrastructure, and placemaking opportunities
Develop a beautification and placemaking plan to add street trees and landscaping on selected corridors, provide street furniture and pedestrianscale lighting
Create an Art’s Framework Master Plan to in-corporate public art
The Long-Term Implementation Plan details recommendations with timelines of 5-10 years. These recommendations, shown in Table 8-6, may require longer planning, engineering, and construction to implement or longer times to gather the necessary funding and coordination for projects.
This section presents the proposed zoning changes in the Study area for the City of College Park and Clayton County. There were no conflicts with Future Land Use (FLU) in the Study area for parcels within the three catalytic sites, as displayed in Figure 8-3
Figure 8-3: Future Land Use in Catalytic Sites
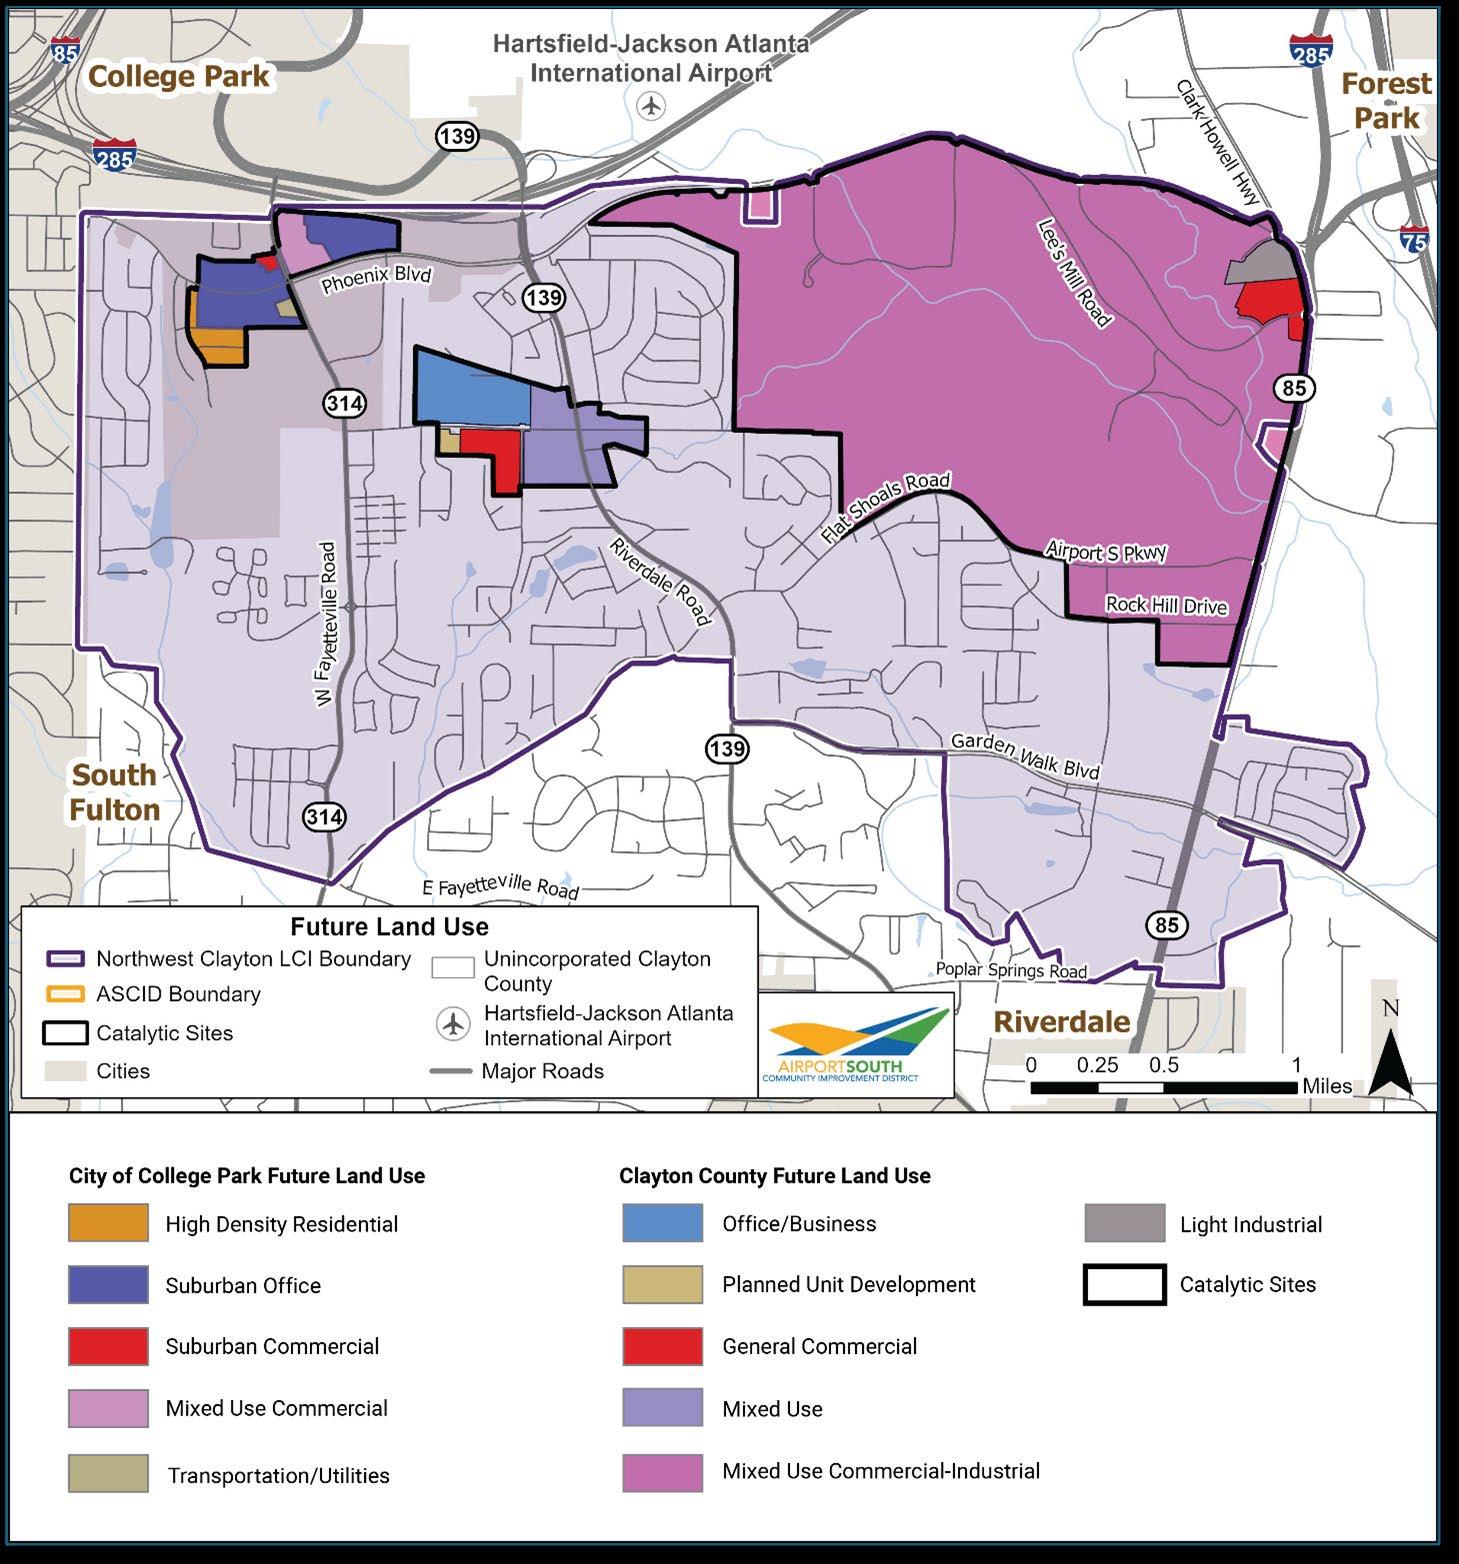
Source: City of College Park and Clayton County Future Land Use
Existing zoning for parcels in each of the catalytic sites are displayed in Figure 8-4. Proposed zoning changes are shown in Figure 8-5, and more detail is provided in Table 8-1. To summarize, in Site One, R3-High Density Residential should change to RM-Multiple Family Residential; BP-Business Park should change to PD-C Planned Development Commercial; in Site Two, GB-General Business should change to Mixed Use; and in Site Three, HIHeavy Industrial should change to MXI-Mixed Use Commercial-Industrial.
Figure 8-4: Existing Zoning in Catalytic Sites
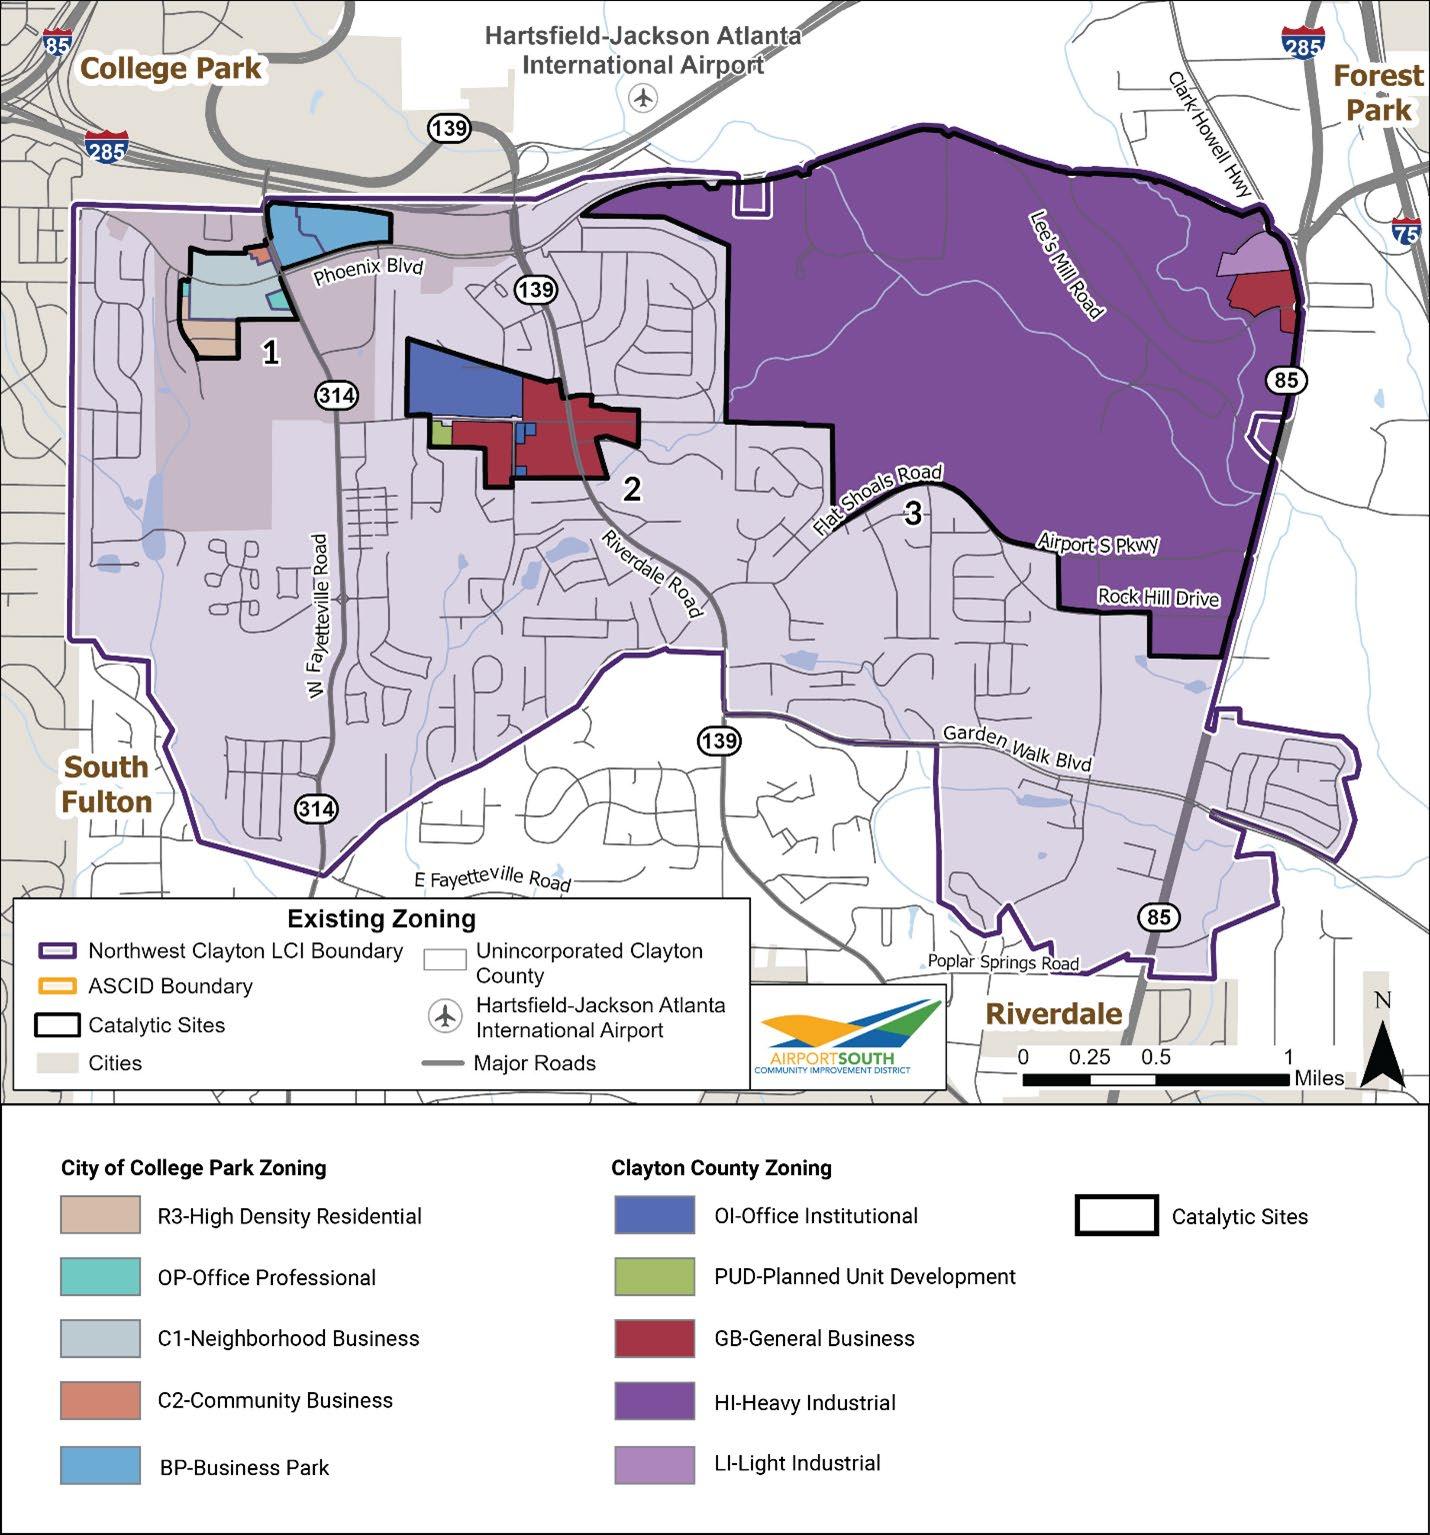
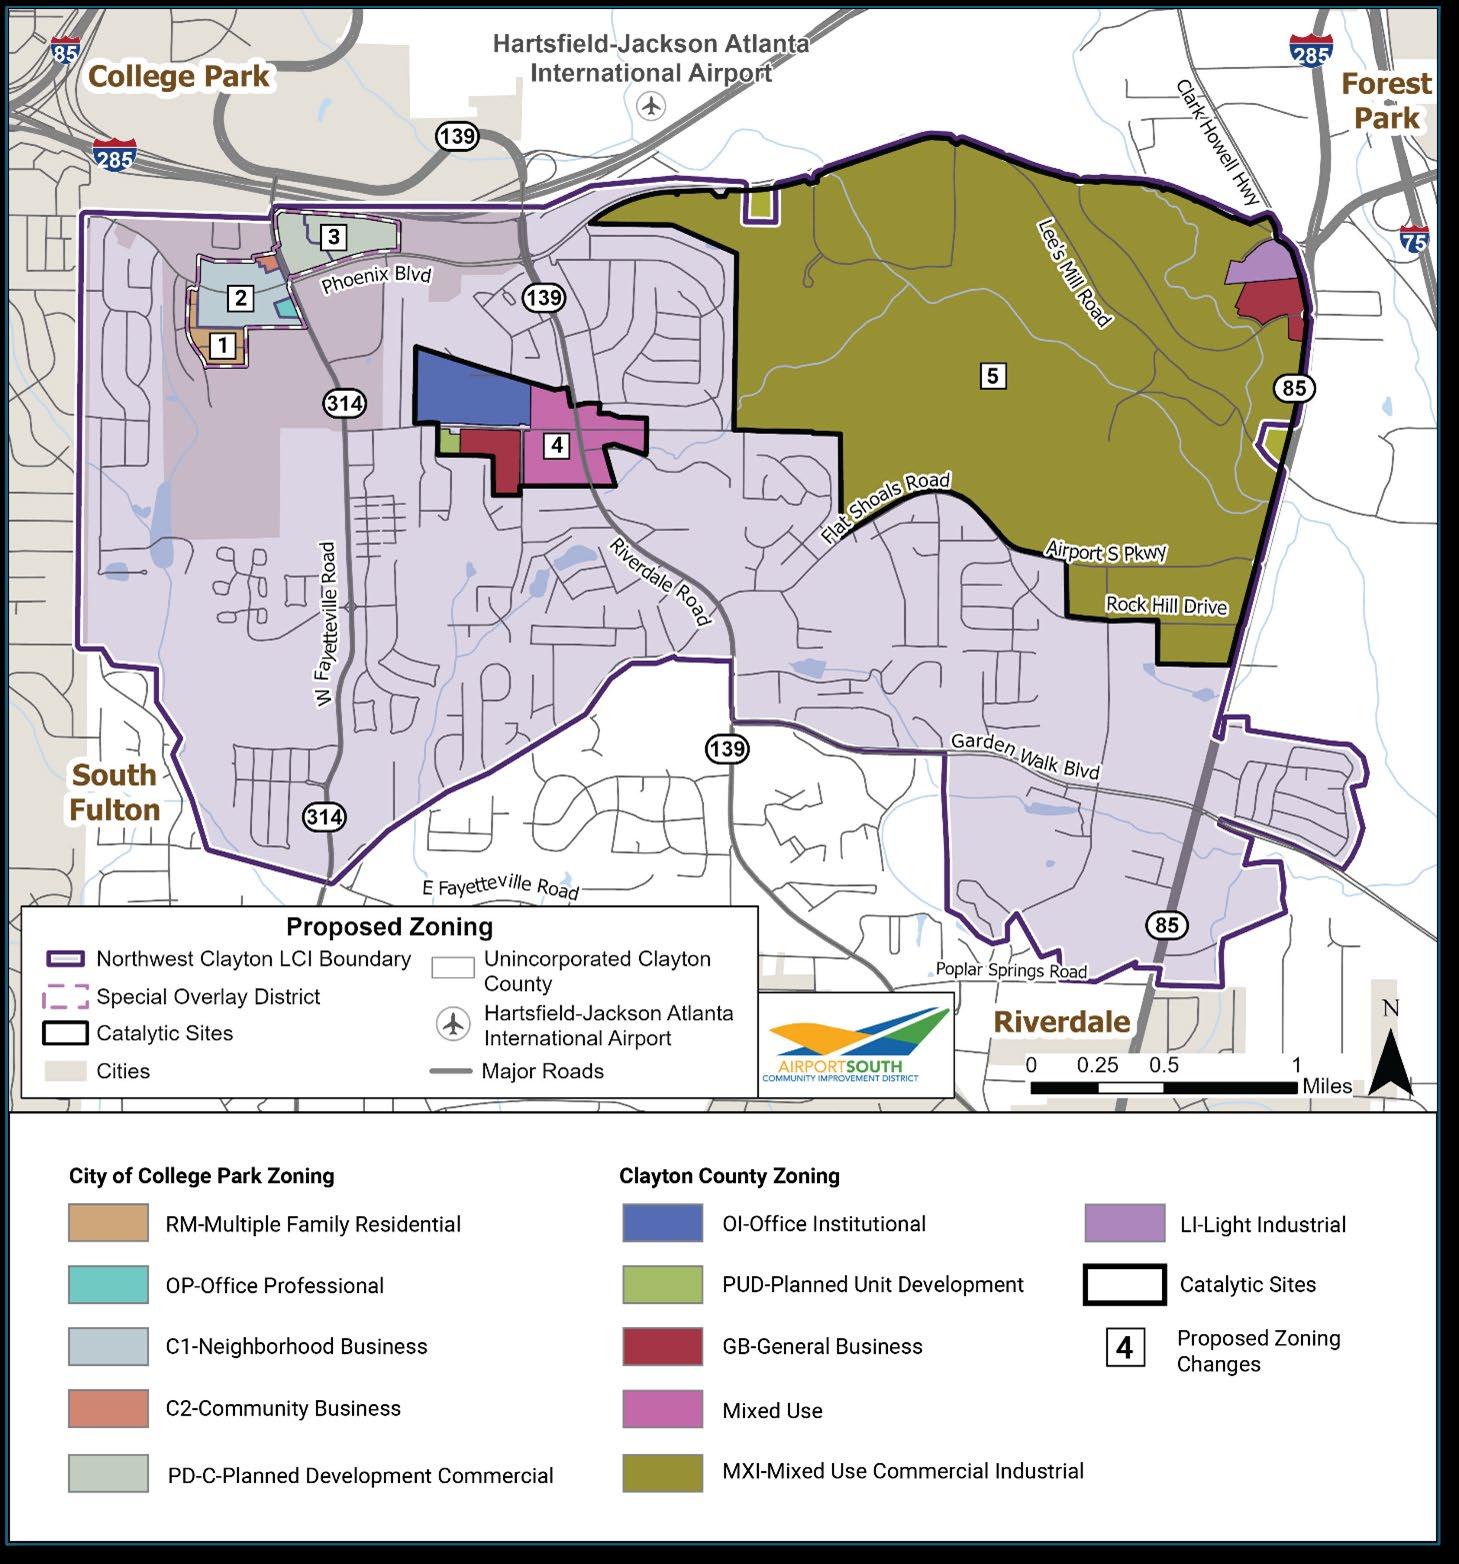
1 0 Godby Road College Park
allow for a variety of housing types including row homes and townhouses 1
2 1846, 1855, 1860, 1864, 1883, 1897, 1902, 1905, 1930, 1935, 1944, 1945 Godby Road College Park C1-Neighborhood Business
2 5181, 5209, 5237 W. Fayetteville Road College Park
3 5100 W. Fayetteville Road College Park
3 1691, 1745, 1895, and 1901 Phoenix Boulevard College Park
4 1488 and 1474 Norman Drive
4 5466 Crestridge Drive
County
County
4 5349, 5361, 5390, 5391, 5404, 5407, 5416, 5436, 5431, 5469, 5471 Riverdale Road Clayton County
4 1448, 1475, Norman Drive
4 0, 1350, 1359 Crystal Lake Road
County
County
Business
Special Overlay District - Allow daycares as a permitted use.
To encourage a mix of uses allowing multi-family housing, business park, and office professional district zoning.
To encourage a mix of uses: retail, residential, and offices to support the future MARTA RAPID Southlake Station. Also to diversify housing stock.
5 518, 1060, 1264 Forest Parkway
5
5
5
0, 5136, 5139, 5149, 5156, 5169, 5192, 5195 Southridge Parkway
0, 5159, 5169, 5176 Pelican Drive
0, 447, 502, 521, 664 Lee’s Mill Road
5 5349, 5455 W. Lee’s Mill Road
5
Clayton County
Clayton County
County
Clayton County
Clayton County
0, 450, 560, 565, 600, 650, 683, 760, 770, 775, 790, 800 Atlanta South Parkway Clayton County
5 5125, 5150 Blalock Industrial Boulevard
5 503 Oak Place
5
5
0, 5281, 5323, 5375, 5647 Highway 85
0, 480, 540, 561, 574, 610, 635, 640, 690, 691 Air-port South Parkway
5 550 Rock Hill Drive
County
County
Clayton County
Clayton County
County
Industrial MXI-Mixed Use Commercial-Industrial
Use
Industrial
Use
Industrial
Industrial
Industrial
Industrial
Use Commercial-Industrial
Use
Use
To permit office, commercial, light industrial, and recreational uses. Will increase greenspace and recreational activity, while keeping industrial uses.
Use
Industrial
Industrial
Use Commercial-Industrial
Industrial MXI-Mixed Use Commercial-Industrial
Use
Industrial
Industrial
Use
Source: City of College Park and Clayton County Zoning

AACIDs ATL Airport Community Improvement Districts
AADT Average Annual Daily Traffic
AASHTO American Association of State Highway and Transportation Officials
ADU Accessory Dwelling Unit
ARC Atlanta Regional Commission
ASCID Airport South Community Improvement District
ATL Atlanta
AWCID Airport West Community Improvement District
BRT Bus Rapid Transit
CID Community Improvement District
CTP Comprehensive Transportation Plan
GICC Georgia International Convention Center
GIS Geographic Information System
HJAIA Hartsfield-Jackson Atlanta International Airport
LCI Livable Centers Initiative
MARTA Metropolitan Atlanta Rapid Transit Authority
MSA Metropolitan Statistical Area
NW Northwest
PAC Project Advisory Committee
RSA Road Safety Audit
SF Square Feet
SR State Route
TAD Tax Allocation District
TOD Transit-Oriented Development
YTD Year to Date
The following sections summarize plans that contain recommendations relevant to the Study area. These plans focus on topics such as transportation, land use, and transit.
The Clayton County 2019 Comprehensive Plan (2019) by ARC is a long-range plan to guide investment and development in Clayton County. The comprehensive plan discusses a variety of topics pertaining to areas such as land use, transportation, transit, and housing. The future land use designation for a large portion of the Study area between State Route (SR) 314/W. Fayetteville Road and SR 85 is Mixed Use Commercial Industrial. This area is part of the Airport South node, which will allow for commercial and industrial uses that support the airport. Other uses in the study area consist of medium-density residential, highdensity residential, general commercial, neighborhood commercial, and mixed use. Study area transportationspecific recommendations were consistent with the Comprehensive Transportation Plan (2018) discussed in Section A.3.1. The community work program provides additional projects pertaining to the Study area, as seen in Table A-1
The Clayton Moving Forward: 2024 Comprehensive Plan – A Vision for the Future (2024) by Clayton County is an update to the 2019 Comprehensive Plan. The future land use was the same in the study area as before. Additional projects from the updated community work program are as follows in Table A-2.
The Clayton County 2034 Comprehensive Plan: Plan Amended 2019 by ARC included an amendment in 2022 for transit-oriented development (TOD). For future TOD, the plan recommended two station areas on the MARTA Rapid Southlake Bus Rapid Transit (BRT) line: Norman Drive and Lee’s Mill. The Norman Drive area consists of the commercial areas along SR 139/Riverdale Road from Phoenix Boulevard to Flat Shoals Road, Norman Drive, and Crystal Lake Road. Development ideas for this station area include a multi-family residential development with concentrated parking as well as the allowance of accessory dwelling units (ADUs) to increase the density and diversity of housing. An ADU is a smaller, independent residential dwelling unit located on the same lot as a stand-alone (or detached) single-family
Category Program Action
Develop and implement incentives and programs to encourage redevelopment of vacant and underutilized commercial properties.
Economic Development
Community Development
Transportation
Library
Encourage establishment of businesses and activities that will provide for activity in the evening hours, particularly entertainment, shopping, and dining options.
Determine land use requirements that would support the concept of Aerotropolis. Pursue funding for streetscape improvements to enhance the visual quality of Clayton County’s major roadways.
Roadway Capacity Improvements – Godby Road from Southampton Road to SR 314/ W. Fayetteville Road.
Godby Road – Pedestrian improvements to fill gaps in system from Southampton Road to Phoenix Parkway.
Construct 20,000 square foot library in NW Clayton County (land acquisition, new books, design, and construction).
Source: Clayton County 2019 Comprehensive Plan
home.1 The Lee’s Mill station area is located along Garden Walk Boulevard and SR 85 from Garden Walk Boulevard to Mize Drive. Development ideas for this area consist of increasing multi-family housing, adding senior housing, and allowing ADUs.
Develop and implement incentives and programs to encourage redevelopment of vacant and underutilized commercial properties.
Economic Development
Community Development
Encourage establishment of businesses and activities that will provide for activity in the evening hours, particularly entertainment, shopping, and dining options.
Continue to partner with MARTA during the design phase of the Southlake Rapid and State Route 54 Rapid BRT lines - align with land use and economic development efforts
Determine land use requirements that would support the concept of Aerotropolis.
Pursue funding for streetscape improvements to enhance the visual quality of Clayton County’s major roadways.
Consider development of a mixed-use industrial zoning category that includes residential uses
Update land use and zoning to support community greenspace policies
Create TOD regulations/standards unique to Clayton County
Create multi-family design guidelines to ensure quality of multi-family housing is achieved
Identify strategies to deal with investor properties that are mismanaged/blighted, beginning with identifying and cataloging blighted properties in need of maintenance and inventorying investor-owned properties throughout the county.
County-wide sidewalk construction
Transportation
Transit
Parks and Recreation
Landscaping/Lighting
Assist, as needed, with MARTA improvements to high ridership bus stop locations
Identify missing sidewalk infrastructure in high pedestrian locations, high ridership bus stops, and planned MARTA Bus Rapid stops
Participate in the development of Flint River trails with adjacent cities, counties, and the Atlanta Regional Commission
Source: Clayton Moving Forward: 2024 Comprehensive Plan – A Vision for the Future
1 Accessory Dwelling Units. American Planning Association. https://www.planning.org/knowledgebase/accessorydwellings/
This section provides highlights of plans for trails in the Atlanta region and Clayton County.
The executive summary of the AeroATL Greenway Plan (2018) for the Aerotropolis Atlanta CID, by Sizemore Group, CDM Smith, CRJA-IBI Group, Perez Planning + Design, Planning-4Health Solutions, Sycamore Consulting, Vaughn & Melton, proposed over 350 miles of trails in the area surrounding HJAIA. These trails, shown in Figure A-1 would connect several areas including East Point, College Park, Hapeville, Forest Park, Six West, the Georgia International Convention Center (GICC), Mountain View, Old National Highway, Phoenix Boulevard, and the City of Atlanta.
The purpose of the plan is to support the ability to bike to school or jobs, walk to downtown College Park, Forest Park or Hapeville restaurants and shops, and— most uniquely—bike directly to HJAIA for a trip to simply watch the planes.2
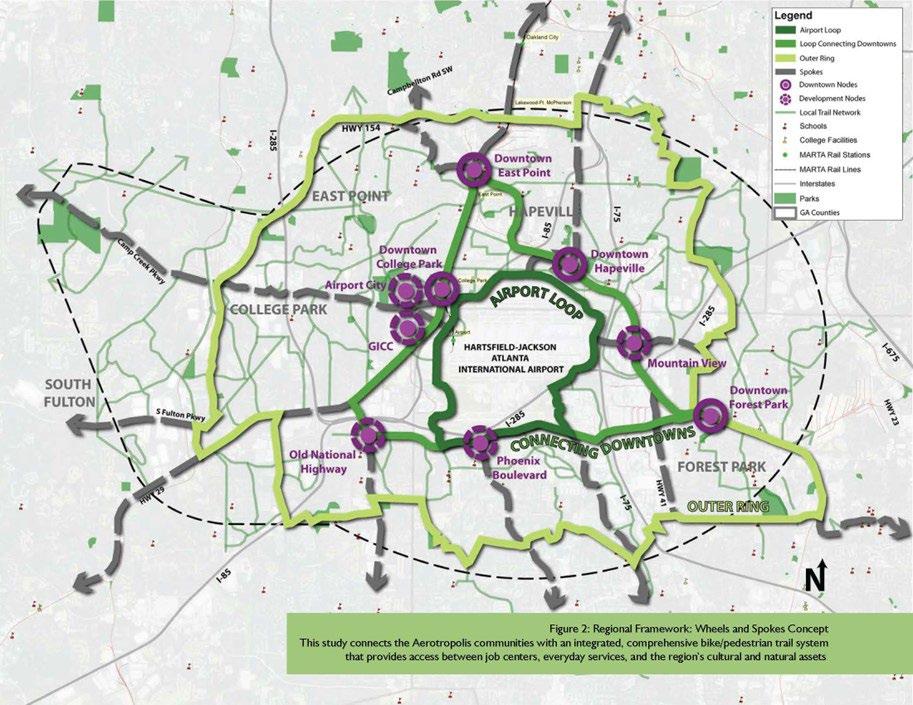
2 AeroATL Greenway Plan. Aerotropolis. https://aeroatl.org/wp-content/uploads/2020/03/AeroATL-Greenway_Exec-Summ-Final.pdf
Clayton County’s Greenway Trail Master Plan (2015) by the PATH Foundation and KAIZEN Collaborative, recommended over 160 miles of trails throughout Clayton County. This trail network would connect neighborhoods to schools, shopping, employment centers, and parks to promote car-free travel. The District 2 portion of the report, displayed in Figure A-2, proposed trails in the Study area that will connect to HJAIA and the existing trail system in College Park, with eventual connections to the Atlanta Beltline trails.
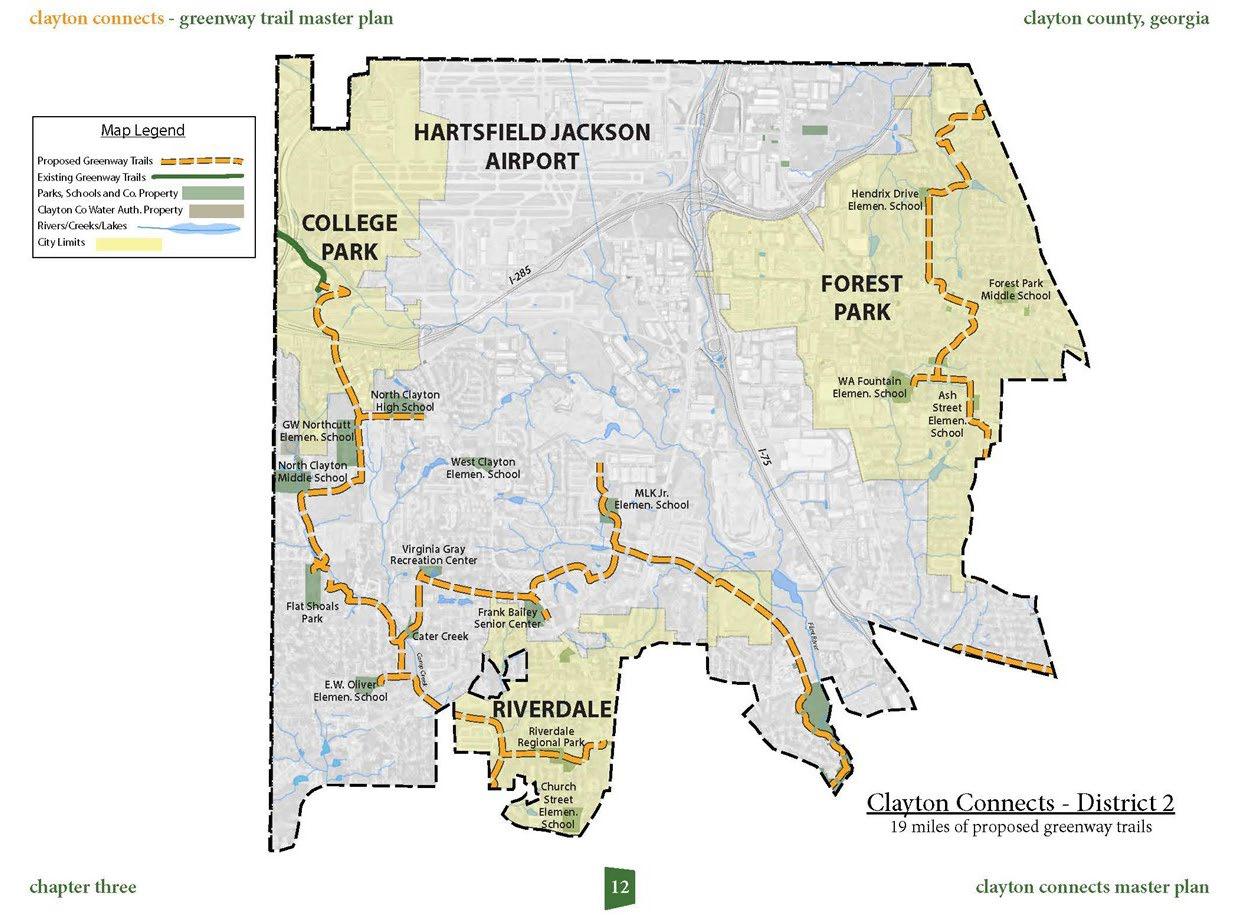
The Regional Trail Vision (2020) is an addition to Walk. Bike. Thrive! by ARC, the Atlanta region’s bicycle and walking plan. The vision consisted of a system of trails across the Atlanta region to promote regional connectivity. Part of this system is regionally significant trails, essential for connecting cities, regional activity centers, and parks. These trails are also highly considered by ARC for the metropolitan Atlanta’s Transportation Alternatives Program funding and other funding sources for transportation. For more information on these trails, presented in Figure A-3, please see Table A-3
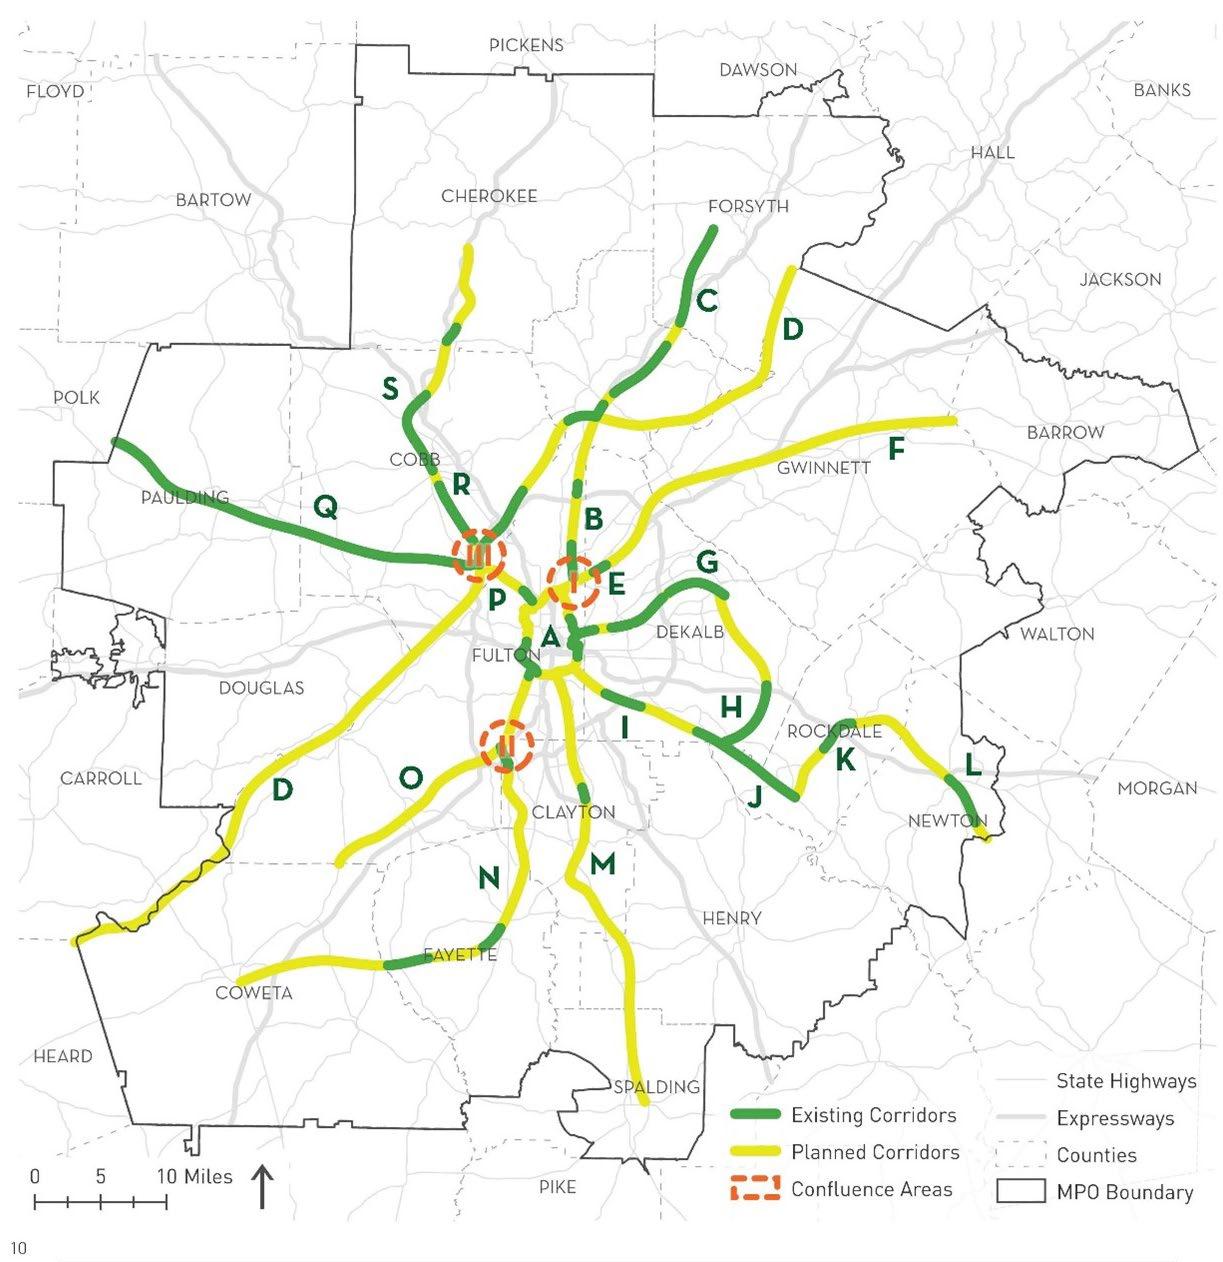
ID Corridor Name Jurisdictions Source
A Atlanta Beltline City of Atlanta Atlanta Beltline Trail Map
B PATH 400
Atlanta, Sandy Springs
Atlanta Transportation Plan North Fulton Comprehensive Trans-portation Plan (CTP)
C Big Creek Greenway Alpharetta; Fulton and Forsyth Counties Big Creek Greenway Map
D Chattahoochee RiverLands Forsyth, Gwinnett, Fulton, Cobb, Douglas, Coweta Chattahoochee River Greenway Study
E Peachtree Creek Greenway
Atlanta, Brookhaven, Chamblee; DeKalb County
Atlanta Transportation Plan DeKalb County CTP
F Piedmont Pathway Gwinnett County Gwinnett County Trails Plan
G Stone Mountain Trail Decatur; DeKalb County DeKalb County CTP
H Arabia & Panola Trails DeKalb County DeKalb County CTP
I South River DeKalb County DeKalb County CTP
J Rockdale River Trail Rockdale County Rockdale County CTP
K Conyers Trail Conyers; Rockdale County Rockdale County CTP
L Cricket Frog Trail Rockdale, Newton Counties Rockdale County CTP Newton County CTP
M Clayton-HenrySpalding
N Clayton-FayetteCoweta Corridor
Clayton, Henry, Spalding Counties
Clayton County Trails Master Plan Henry County CTP Spalding-Griffin CTP
Clayton, Fayette, Coweta Counties Fayette County Transportation Plan Coweta County Greenway Master Plan
O Roosevelt Highway Atlanta; Fulton County
P Connect the Comet Atlanta; Cobb County
Atlanta Transportation Plan South Fulton CTP
Atlanta Transportation Plan Cobb Trails Master Plan
Q Silver Comet Trail Cobb, Paulding Counties Silver Comet Trail Map
R Mountain to River Trail Cobb County Cobb Trails Master Plan
S Noonday Creek Trail Cobb, Cherokee Counties Cobb Trails Master Plan
ID Confluence Areas Jurisdictions Source Documentation
I Lindbergh Area Atlanta, Brookhaven Plan in development
II Aerotropolis Area Clayton, Fulton Counties AeroATL Greenway Plan
III Cumberland Area Cobb County Cobb Trails Master Plan
Source: Regional Trail Vision
The Clayton County Comprehensive Transportation Plan (CTP) Update (2018) by WSP USA, presents Clayton County’s future transportation network based on current and future needs. The plan included recommendations for roadways, bridges, transit, bicycle and pedestrian facilities, and freight. The plan suggested several capacity and operational improvements:
• SR 85 at Garden Walk Boulevard Capacity and Operational Improvement
• Access Management along SR 139/Riverdale Road near I-285 interchange
• Access Management along SR 139/Riverdale Road between Shoreham Drive and Kingswood Circle
• SR 139/Riverdale Road at Flat Shoals Road Operations Improvement
The plan suggested a Road Safety Audit (RSA) for the SR 139/Riverdale Road corridor. In addition, a freight study was suggested for SR 139/Riverdale Road. For pedestrian safety, it was recommended that Clayton County adopt a sidewalk program. That program should also consider the lack of sidewalks on SR 85, preventing safe access to bus stops. For pedestrian and bicycle safety, the plan suggested several Clayton County departments work together to implement some of the sidewalks or trails proposed in Clayton County’s Greenway Trail Master Plan, as well as adopting a Complete Streets approach to consider all users of roadways, including motorists, transit riders, pedestrians, bicyclists, and others. The plan suggested coordinating with CIDs for beautification programs on SR 85 and SR 139/Riverdale Road, particularly recommending the use of gateways to enhance entrances to key areas along the corridors.
139/Riverdale Road from Riverwalk Lane to Garden Walk Boulevard
An RSA by AECOM was conducted in 2020 for SR 139/Riverdale Road between the intersections of Kingswood Circle and Garden Walk Boulevard, a distance of 1.2 miles. This stretch of SR 139/Riverdale Road had a high number of crashes, with 2,254
crashes reported along the corridor between January 2013 and April 2022. The purpose of the RSA was to analyze needs, determine the feasibility of potential intersection improvements, and improve safety by reducing the number of crashes. The RSA provided five recommendations:
• A pedestrian hybrid beacon at the intersection of Kingswood Circle and SR 139/Riverdale Road,
• A midblock crosswalk at Kingswood Circle,
• Crosswalks installed at approaches of Old Riverdale Road,
• A midblock crosswalk at Old Mill Court, and
• A multi-lane roundabout with pedestrian accommodations at the intersection of Garden Walk Boulevard and SR 139/Riverdale Road.
The executive summary of the Aerotropolis Transit Feasibility Study (2019) for Aerotropolis Atlanta, by VHB, Nelson Nygaard, and Nickel Works, recommended several transit projects in the area surrounding HJAIA. A few of the projects are also located in the Study area. First, the study recommended the creation of a mobility district that includes the northern half of the Study area, which would create an on-demand mobility service featuring smart phone and automated routing technology that would support transit rides outside of MARTA operating hours. Second, the study recommended the implementation of MARTA Clayton BRT routes along both SR 139/Riverdale Road and SR 85. Lastly, the study recommended advancing the second phase of the Corporate Crescent Circulator to create a full loop around HJAIA on Godby Road, Phoenix Boulevard, and Forest Parkway in the Study area.
A.5.1.
The executive summary of the Freight Cluster Plan (2020) for Aerotropolis Atlanta CIDs, by Gresham Smith, Modern Mobility Partners, and PEQ, discussed the freight industry in the Aerotropolis area. The plan was developed to improve operations and travel time reliability, maintain the economic competitiveness of the area, educate partners about best practices and
trends, identify strategic investment opportunities, and serve as a foundation for recommendations and proposed improvements. Recommendations in the Study area consist of intersection improvements at SR 139/Riverdale Road at Phoenix Boulevard/SR 331/ Forest Parkway, sidewalks on Phoenix Boulevard and SR 331/Forest Parkway, a SR 139/Riverdale Road scoping study for freight, and SR 139/Riverdale Road truck prohibition signage.
A.6.1.
The Metro Atlanta Housing Strategies Toolkit by ARC was researched for information and resources regionwide on housing. The Metro Atlanta Housing Strategy Toolkit is a part of the 2020 The Atlanta Region’s Plan, a larger plan for the Atlanta Region. This toolkit is a series of strategies that have been placed into six categories for housing:
1. Increase Supply
2. Preserve Affordable Supply
3. Expand Capital Resources
4. Promote Housing Stability
5. Develop Leadership & Collaboration on Affordability
6. Reduce Housing & Transportation Costs
Recommendations in this plan speak to most of the categories to increase the housing supply while also restoring the existing housing. Strategies in the toolkit recommend exploring existing home repair programs, partnering with the housing authority, partnering for workforce housing, and identifying developable land around transit stops. Several of these strategies will be explored later in this document.
A.7.1.
The Aerotropolis Atlanta Blueprint (2016) for Aerotropolis Atlanta, by Jacobs, MXD Development Strategists, GLDPartners, Jones Worley, and Populous, stems from the partnership between the Aerotropolis
Atlanta Alliance and ARC. The Study area is part of the Aerotropolis boundary and within the five-mile radius of the airport. The Blueprint aimed to provide a framework for growth in the area around HJAIA in a five-year timeframe. Considerations in the Study area pertain to Cargo City, HJAIA’s south cargo area, south of the airport and north of the Study area. The key considerations for Cargo City were as follows:
• Study the potential to expand industrial and logistics development on the south side of the airport,
• Conduct a truck/freight study to improve access, and
• Leverage the location of the headwaters of the Flint River to:
{ Encourage new open space,
{ Improve overall mobility, and
{ Increase access to employment opportunities and existing communities.
The Blueprint highlighted the Flint River as a part of Cargo City as an opportunity for improved access to the community, local and regional connections, and greenspace. HJAIA has three cargo complexes, all totaling 1.5 million square feet: north, midfield, and south. Cargo City involves the relocation of HJAIA north cargo and expansion of the south cargo. In addition to handling cargo, HJAIA also handles perishables like produce and pharmaceuticals, and fish and wildlife shipments.3
The Flint River presented an opportunity to incorporate much desired greenspace into the Study area. It is also possible that the Flint River to the Atlanta Beltline Trail project, in tandem with the recommendations from this Study, could increase the Study area’s local and regional transportation connections, while also improving access to the community through a multi-use trail.
The Northwest Clayton Tax Redevelopment Area and Tax Allocation District Plan (2008) by Huntley Partners, Inc., highlighted NW Clayton County’s commercial and residential development potential. A TAD, which uses a financing method typically referred to as tax increment financing, is a tool used to publicly finance
3 South Fulton: Chamber of Commerce. Hartsfield-Jackson: Gateway to Global Commerce. https://www.southfultonchamber.com/economicdevelopment/hartsfield-jackson-air-cargo
certain redevelopment activities in underdeveloped or blighted areas. The plan had five goals and eight principles for redevelopment in NW Clayton County, which are presented in Table A-4
A.8.1. Signage and Wayfinding Phase 1: Concept
The Signage and Wayfinding Phase 1: Concept Design (2018) for Aerotropolis Atlanta CIDs, by Kimley Horn and Huie Design is a unified signage and wayfinding system for the Aerotropolis Atlanta CIDs Master Plan. The system will highlight the Aerotropolis district through unified branding. The plan proposes signage at I-285 and SR 139/Riverdale Road/Phoenix Boulevard. Signs should be placed on either side of the interstate approaching interstate exit ramps. This signage is classified by the plan as regional: large/monumental in
size, used to establish a gateway entrance, and located along major corridors and interstates. The signs could be vertical or horizontal; both types would include a sculpture. The intersection would need landscape and hardscape improvements with consideration for the placement of the signage. Additional signage would be located at Phoenix Boulevard/SR 331/Forest Parkway. This signage would be local: scaled for pedestrians, direct pedestrians to local landmarks, and located along local roadways and high-foot-traffic areas. The signage would include beautification improvements at the intersection and be designed for vehicular direction.
Existing bicycle and pedestrian facilities in or adjacent to the Study area consist of sidewalks and bicycle lanes, as seen in Figure B-1. The nearest bike lanes are outside of the study area on Riverdale Road and Phoenix Trail crossing Riverdale Road. There are approximately 11 miles of public sidewalks in the Study area. Two of three state routes in the Study area have sidewalks, including SR 314/W. Fayetteville Road and SR 139/Riverdale Road. Large gaps in sidewalks are present on the east side of SR 314/W. Fayetteville
Road, both sides of Phoenix Boulevard, both sides of Flat Shoals Road, the south side of SR 331/Forest Parkway, and the west side of SR 85. Some large gaps in sidewalks are due to the presence of wooded areas on W. Fayetteville Road, Flat Shoals Road, and SR 85.
Planned multimodal improvements in the Study area consist of 12 planned trails from three different plans: AeroATL Greenway Plan, Southern Fulton Comprehensive Transportation Plan (CTP), and Clayton County’s Greenway Trail Master Plan. The names and descriptions of these trails are displayed in Table B-1. These trails, presented in Figure B-2, will add
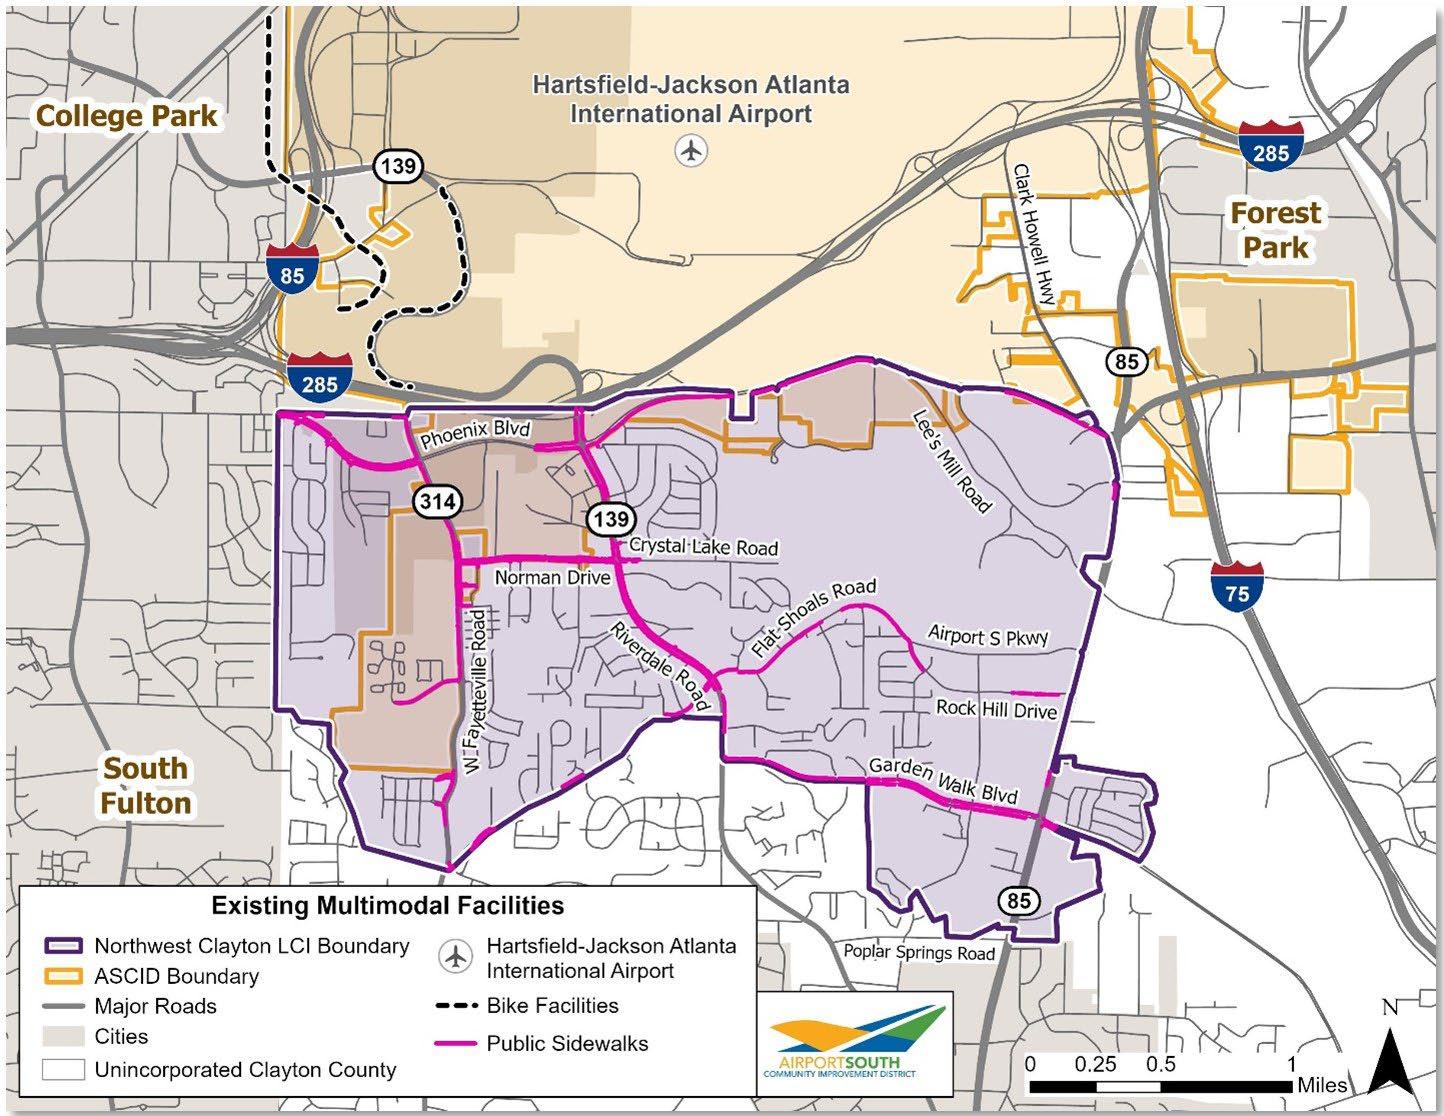
Atlanta Beltline to Flint River Trail
Clayton-FayetteCoweta Corridor
Trail connecting East Point, College Park, Hapeville, Forest Park, Airport City, GICC, Mountain View, Old National Highway, and Phoenix Boulevard.
Trail connecting Clayton, Fayette, and Coweta Counties. Clayton County would contain over five miles of this trail.
connecting East Point, College Park, South Fulton, Flat Shoals Road, Forest Park, Mountain View, Hapeville, and the City of Atlanta.
Connections Trail system connecting residents to schools, parks, retail centers, and more.
connecting the downtowns of East Point, College Park, Hapeville, Forest Park and Mountain View with Airport City, GICC, Old National Highway, and Phoenix Boulevard.
Road
Trail along N. Outer Loop Road, Airport Road, Perry J Hudson Parkway, Inner Loop Road, SR 85, SR 331/Forest Parkway, and
connecting East Point, College Park, Hapeville, Forest Park, Airport City, GICC, Mountain View, Old National Highway, and Phoenix Boulevard.
System of priority trails designated by local partners and stakeholders of Aerotropolis Atlanta, including several municipalities.
Source: ARC Open Data: Atlanta Regional Trail Plan Inventory
approximately 38 miles of trails in the Study area. The AeroATL Greenway Plan recommends five trails in the Study area: Airport Loop, Local Connections, Loop Connecting Downtown, Outer Loop, and Priority Network. Part of the Southern Fulton CTP is to recommend trails separate from the roadway. In the Study area, these trails are along Phoenix Boulevard, SR 331/Forest Parkway, and SR 139/Riverdale Road. The plan also proposes pedestrian and bicycle improvements for SR 139/Riverdale Road. Clayton County’s Greenway Trail Master Plan proposes a system of trails throughout the County; in the Study area, these trails would be located along SR 314/W. Fayetteville Road, Norman Drive, and SR 85.
significant trails throughout the Atlanta region. One of these trails, the Clayton-Fayette-Coweta Corridor, is located in the Study area west of SR 314/W. Fayetteville Road. Recently, ARC, Clayton County, and the cities of College Park, East Point, and Hapeville received a federal grant for a multi-use trail.4 This $50 million grant will connect the Atlanta Beltline and the Flint River, with a one-mile trail segment in Clayton County picked as one of the first segments to be built. Overall, the planned trails in the Study area would contribute to a total of over 560 miles of trails planned in the Atlanta region.
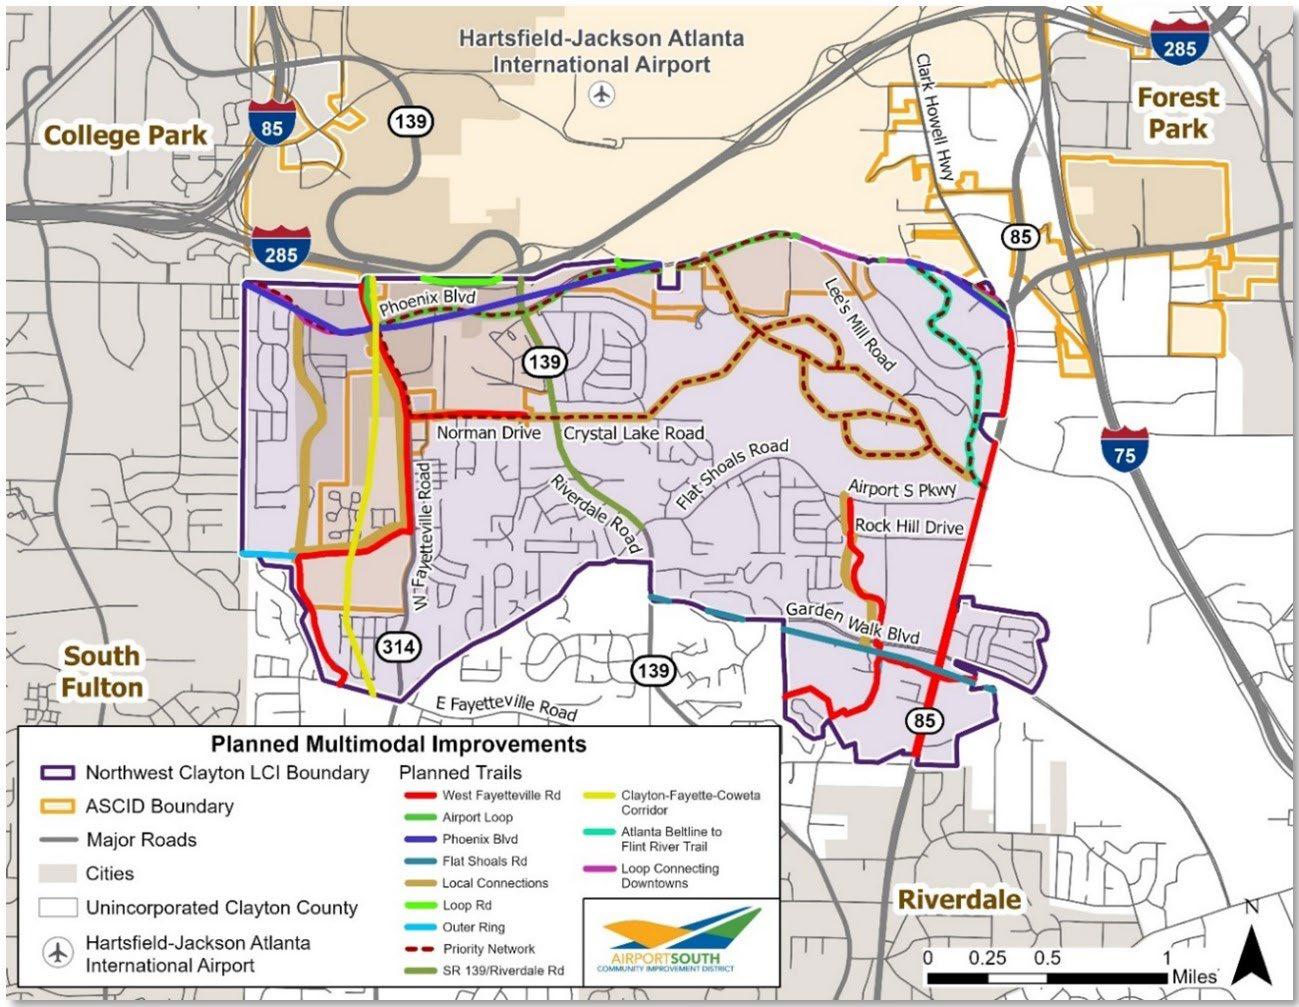
Source: ARC Open Data: Atlanta Regional Trail Plan Inventory
The Regional Trail Vision by ARC suggests regionally
4 ARC and Four Communities Receive $50 M Federal Grant for Multi-use Trail Connecting Atlanta Beltline and Flint River. ARC. https:// atlantaregional.org/news/transportation-mobility/arc-and-four-communities-receive-50m-federal-grant-for-multi-use-trail-connecting-atlanta-Beltlineand-flint-river/
The existing roadway system within the Study area includes a network of state and local roads for a variety of purposes and lengths. The existing roadway network includes arterial roads, which accommodate both long and short trips on an areawide basis, and local roads that provide access to commercial, office, and residential destinations. Table B 3: Major Roadways in Study Area lists the current roadway facilities in the Study area and indicates their functional class, directions, and number of travel lanes.
The Study area includes three state routes: SR 314/W. Fayetteville Road, SR 139/Riverdale Road, and SR 85. These state routes are major north-south thoroughfares running parallel across the Study area.
Functionally classified as minor arterials, SR 314/W. Fayetteville Road and SR 139/Riverdale Road provide existing residential areas with regional access to HJAIA, the City of College Park, and City of Riverdale. SR 314/W. Fayetteville Road is a two-lane roadway, connecting Flat Shoals Road to the south with Phoenix Boulevard and SR 139 in College Park to the north. SR 139/Riverdale Road passes through the heart of Study area and interchanges with I-285 near its northern boundary. South of Norman Drive, SR 139/Riverdale Road has four lanes (two in each direction). North of Norman Drive, SR 139/Riverdale Road widens to five lanes after passing Village Green Drive and then to six lanes after its interchange with Phoenix Boulevard.
SR 85 operates as a principal arterial for the Study area, connecting commuters between HJAIA and the City of Riverdale. It passes through the eastern boundary of the Study area and interchanges with SR 331/Forest Parkway to the north. South of Lee’s Mill Road, SR 85 has four lanes with two in each direction. North of Lee’s Mill Road, SR 85 widens to five lanes.
Source: GDOT Traffic Analysis and Data Application (TADA)
Other Prominent Roads – Major East/West Roadways
In addition to the north/south connectivity, four roads serve east/west traffic in the study area: Phoenix Boulevard acts as a minor arterial, running west from SR 314 to SR 139. Located in the northwest corner of the study area, Phoenix Boulevard provides a four-lane connection for the residential area on Godby Road to the Royal Phoenix Business Park, where office properties are concentrated.
Norman Drive is a two-lane local road running west from SR 314 to SR 139 through the center of the study area. It provides access to a mix of single- and multi-family developments, community facilities (including a school and a church), and strip commercial centers along the SR 139/Riverdale Road corridor.
Flat Shoals Road is a two-lane major collector. Residential developments on Flat Shoals Road are primarily single-family housing. The Flat Shoals corridor also provides access to industrial areas including warehouse distribution and rock quarries. Garden Walk Boulevard is a four-lane local road running west from SR 139 to SR 85 in the southeastern portion of the Study area. It connects a mix of single- and multi-family residential developments, as well as several vacant parcels, to the arterial roadway system.
Average Annual Daily Traffic Volumes and Growth Rates
Historical Average Annual Daily Traffic (AADT) data within the Study area was obtained from the Georgia Department of Transportation (GDOT) database for the time period of 2018 to 2023 (see Table B-3).
Historical traffic counts for all vehicle trips indicate an overall downward trend in traffic volumes within the Study area, with an average AADT decrease of 8 percent from 2018 to 2022. Most major roadways saw declines during this period. Although Phoenix Boulevard had relatively lower traffic volumes compared to other major roadways, it saw the steepest decline at 13 percent, decreasing from an AADT of 11,400 in 2018 to 9,930 in 2023. The busiest roadway in the area, SR 85, recorded an AADT of 43,800 in 2023, reflecting a 10 percent drop from 2018. SR 134 and SR 139 also had decreases of 6 percent and 4 percent, respectively, due to notable declines in traffic
volumes between 2022 and 2023. The exception to this trend over this period was Flat Shoals Road which saw a decrease in traffic volumes from 2018 and 2020 but rebounded after 2021 and then surpassed the 2018 level by 2023.
Historical traffic counts reveal an overall increase in truck traffic volumes from 2021 to 2023 on the major north/south roadways, as depicted in Table B-4. SR 85 had the most truck traffic over the years which comprised 6 percent of all trips on that route by 2023. Truck AADT on SR 85 increased at 9 percent from 2,394 in 2021 to 2,617 in 2023. SR 134, despite having the lowest truck traffic volumes, had the largest growth of 20 percent in truck AADT, reaching 504 in 2023, making up 3 percent of all trips. SR 139 yet showed a decline of 4 percent with a truck AADT of 969 in 2021 to 934 in 2023.
Source: GDOT Traffic Analysis and Data Application (TADA)
Source: GDOT Traffic Analysis and Data Application (TADA)
5
Three years of vehicle and pedestrian crash incident data were obtained from Numetric American Association of State Highway and Transportation Officials (AASHTO) AASHTOWare Safety. Figure B-3 provides the location and density of vehicle crashes for the period of 2018 to 2020 at intersections in the Study area. Top vehicle crash intersections between 2018 and 20205 are listed below:
• SR 139/Riverdale Road and Flat Shoals Road (217 crashes in total)
• SR 139/Riverdale Road and Norman Drive/ Crystal Lake Road (194 crashes)
• SR 139/Riverdale Road and SR 331/Forest Parkway/Phoenix Boulevard (172 crashes)
• SR 85 and Garden Walk Boulevard (167 crashes)
• SR 139/Riverdale Road and Garden Walk Boulevard (148 crashes)
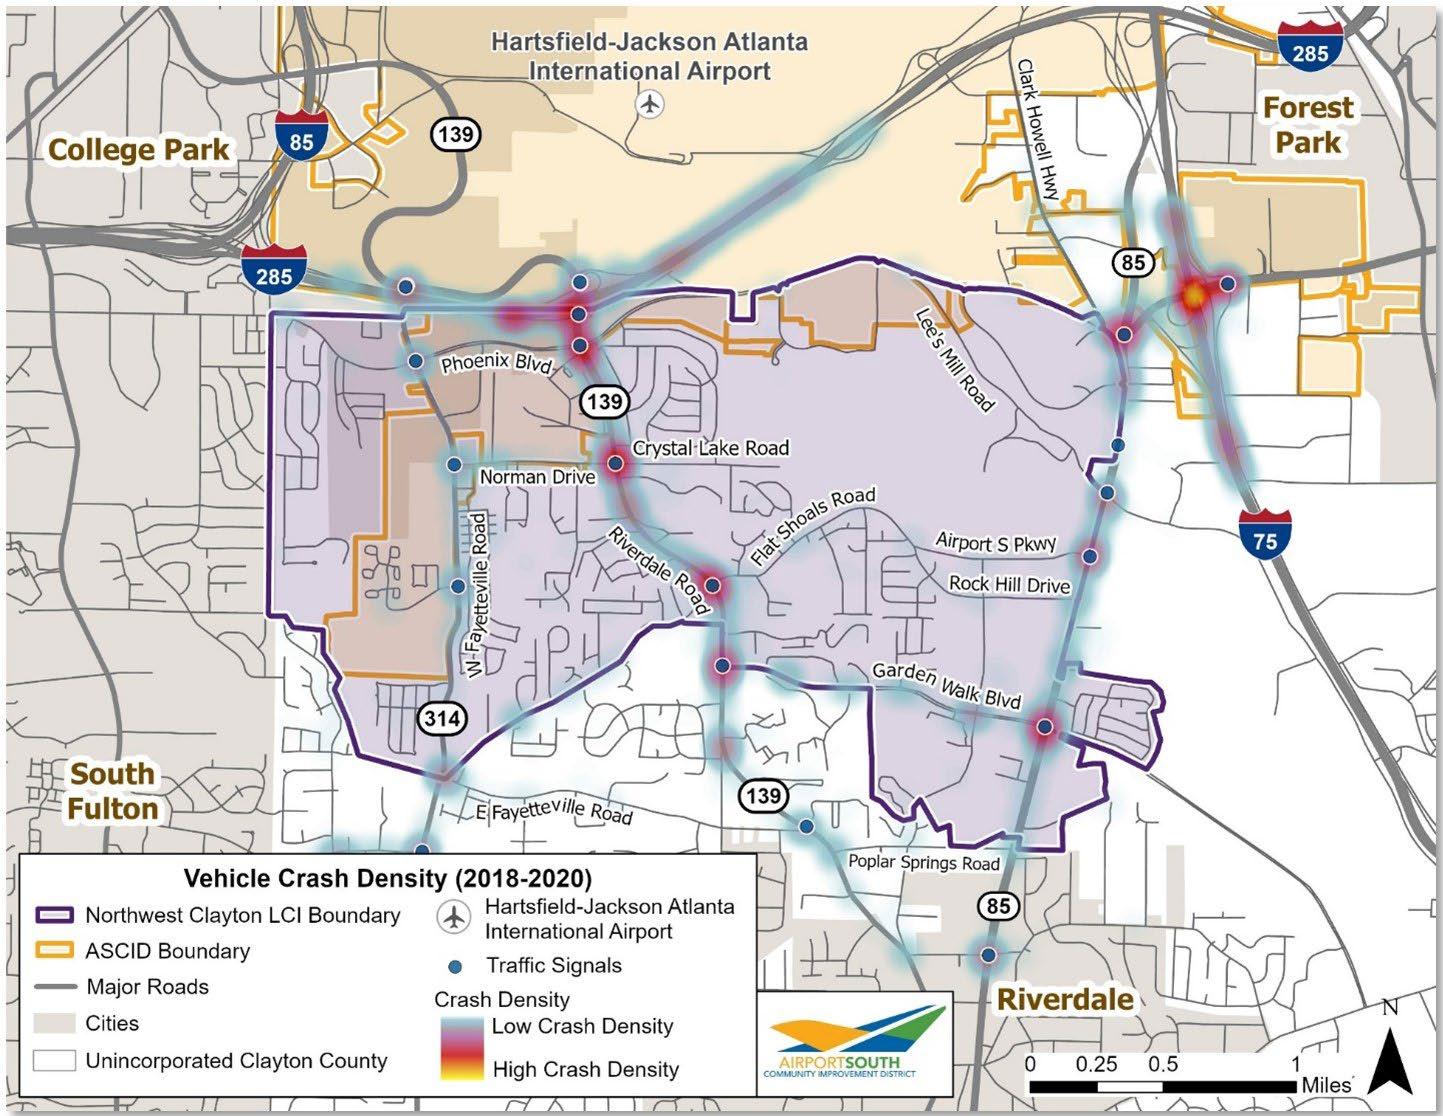
Source: Numetric AASHTOWare Safety
Figure B-4 provides the location and density of pedestrian crashes for the period of 2018 to 2020 at intersections and midblock sections in the Study area.
Top Crash Intersections
• SR 139/Riverdale Road and Garden Walk Boulevard (9 crashes)
• SR 85 and Garden Walk Boulevard (8 crashes)
Midblock Crashes
• SR 139/Riverdale Road (12 crashes)
• Garden Walk Boulevard (3 crashes)
Site visits to these high-incident intersections identified the lack of pedestrian facilities as a significant factor causing pedestrian crashes. For example, transit stops along SR 139 were found to lack nearby pedestrian crossings. Slip lanes at major intersections like SR 139 and Garden Walk Boulevard create dangerous conditions for pedestrians. While the density of pedestrian crashes along SR 314 remains relatively lower than along SR 139, it was also noted that sidewalks were missing throughout the SR 314 corridor and there were large blocks with few safe pedestrian crossings at midblock sections.
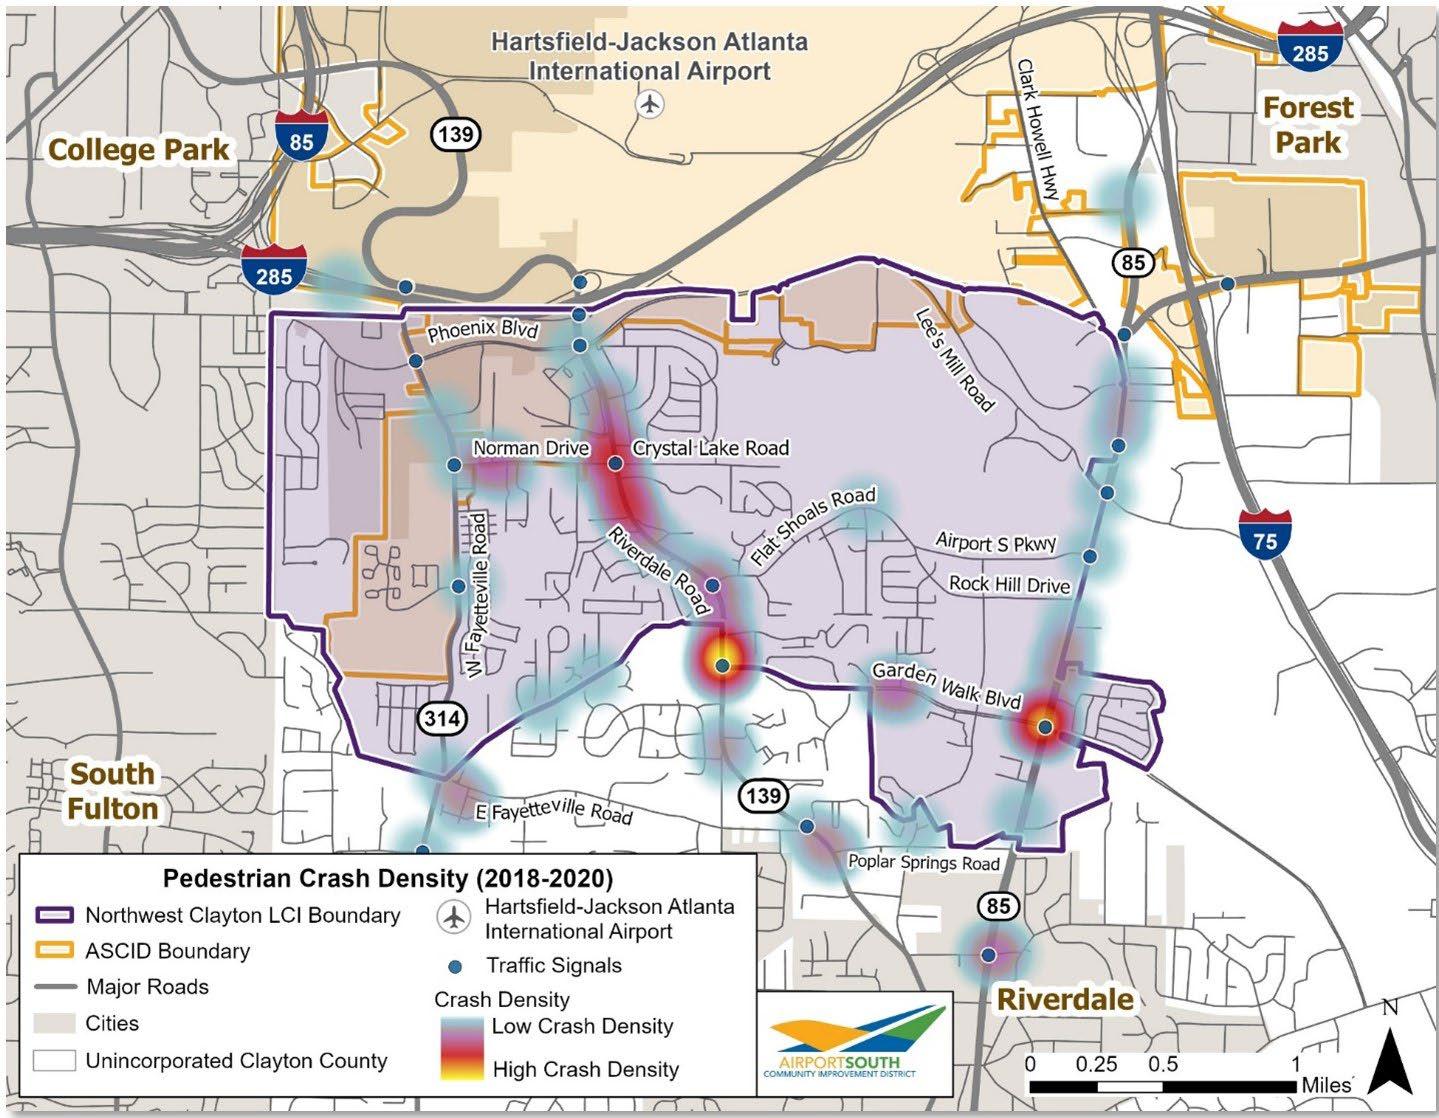
Source: Numetric AASHTOWare Safety
Transit in the Study area consists of bus routes provided by MARTA. The bus routes are 191, 195, and 196 and follow the routes listed below:
• Route 191 (Riverdale/HJAIA International Terminal) – Route 191 starts at Lakewood MARTA Station and runs north/south, ending at the Justice Center in Jonesboro on Tara Boulevard.
• Route 195 (Forest Parkway) – Route 195 begins at College Park MARTA Station and travels east/ west to loop around SR 331/Forest Parkway and Anvil Block Road.
• Route 196 (Upper Riverdale) – Route 196, starts at College Park MARTA Station and runs east/ west to Southlake Mall.
There are 49 bus stops in the Study area (shown in Figure B-5), including stops located along Southampton Road, Phoenix Boulevard/SR 331/Forest Parkway, Riverdale Road, Garden Walk Boulevard, Atlanta S. Parkway, and Highway 85. Of these 49 bus stops, 17 have bus shelters and 10 have trash cans. In the fall of 2019, Route 196 was the top performing bus route in Clayton County, with 31.0 weekly passengers per revenue hour6. Routes 195 and 191 were both considered medium in performance, with 21.7 and 19.2 weekly passengers per revenue hour, respectively.7
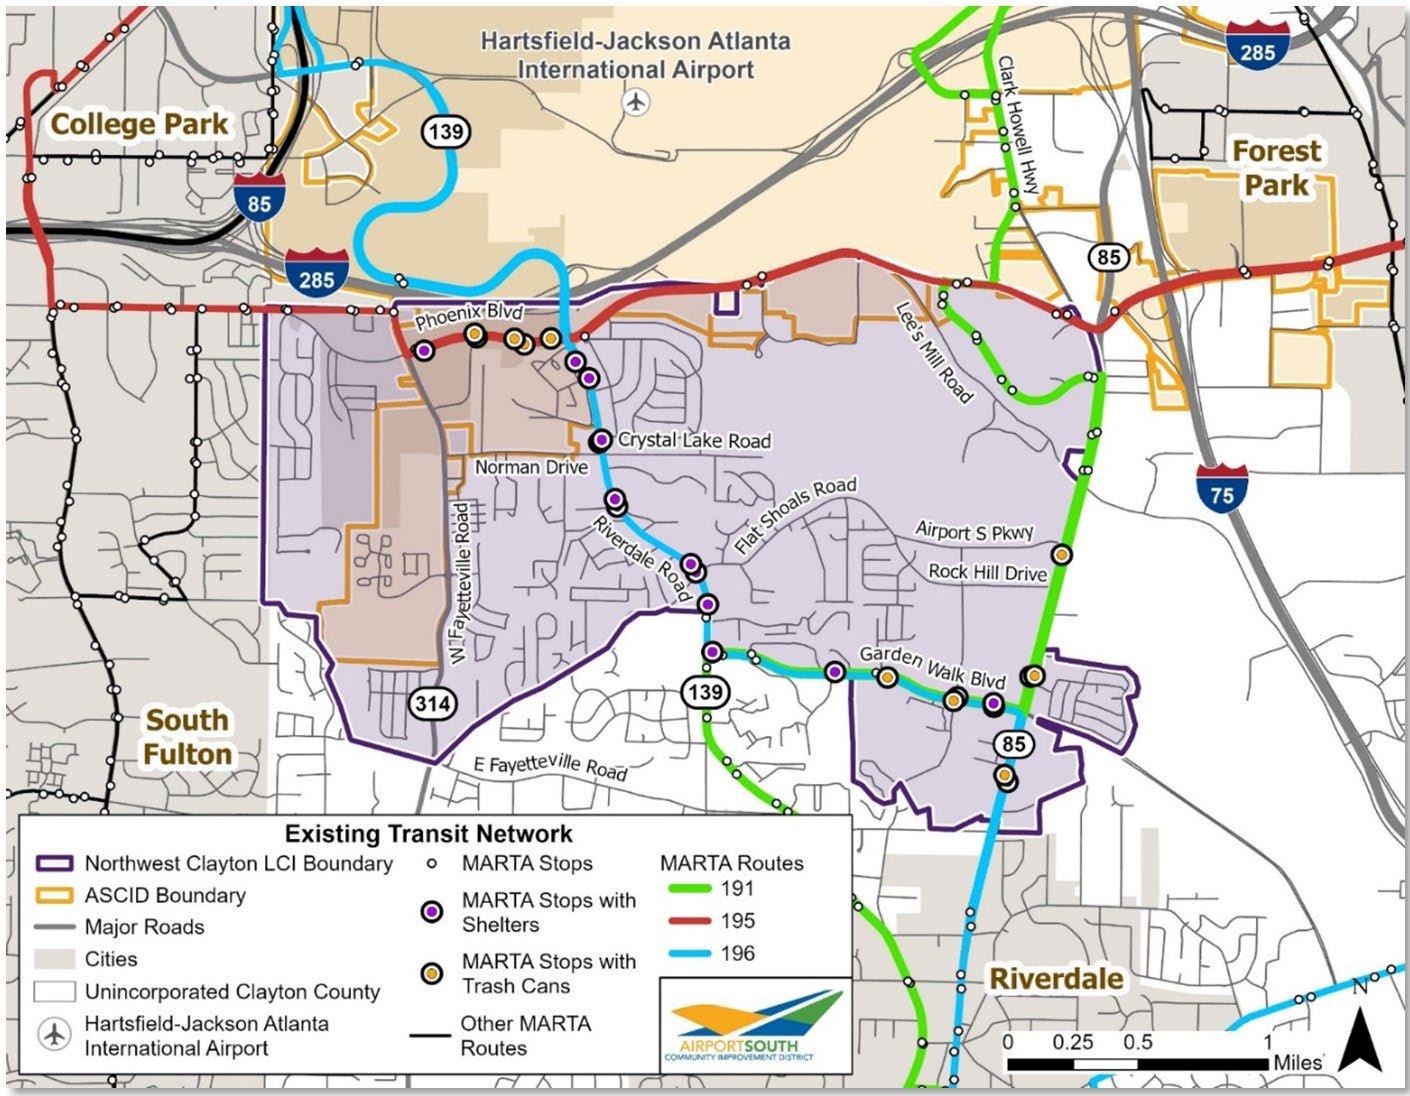
Source: MARTA and Google Earth
6 Weekly passengers per revenue hour pertains to the average of passengers per bus per hour throughout the week. It is calculated by dividing Weekday Unlinked Trips by Weekday Vehicle Revenue Hours.
7 Transit Basics. MARTA Next Gen Bus. Discover | MARTA NextGen Bus (marta2040nextgenbus.com)
MARTA Rapid Southlake, MARTA’s future BRT, will traverse through the Study area on Riverdale Road, Garden Walk Boulevard, and SR 85. The BRT will connect to the MARTA heavy rail system at MARTA Airport Station and end at Southlake Mall in Morrow. It will be approximately 15 miles and length and connect several destinations like the Shops of Riverdale and Southern Regional Medical Center. MARTA Rapid Southlake is slated to begin service in 2030.8 Six stations are proposed within the Study area, as shown in Figure B-6:
• Riverwalk Lane
• Norman Drive
• Flat Shoals Road
• Riverdale Road and Garden Walk Boulevard
• Garden Ridge Drive
• Garden Walk Boulevard and SR 85
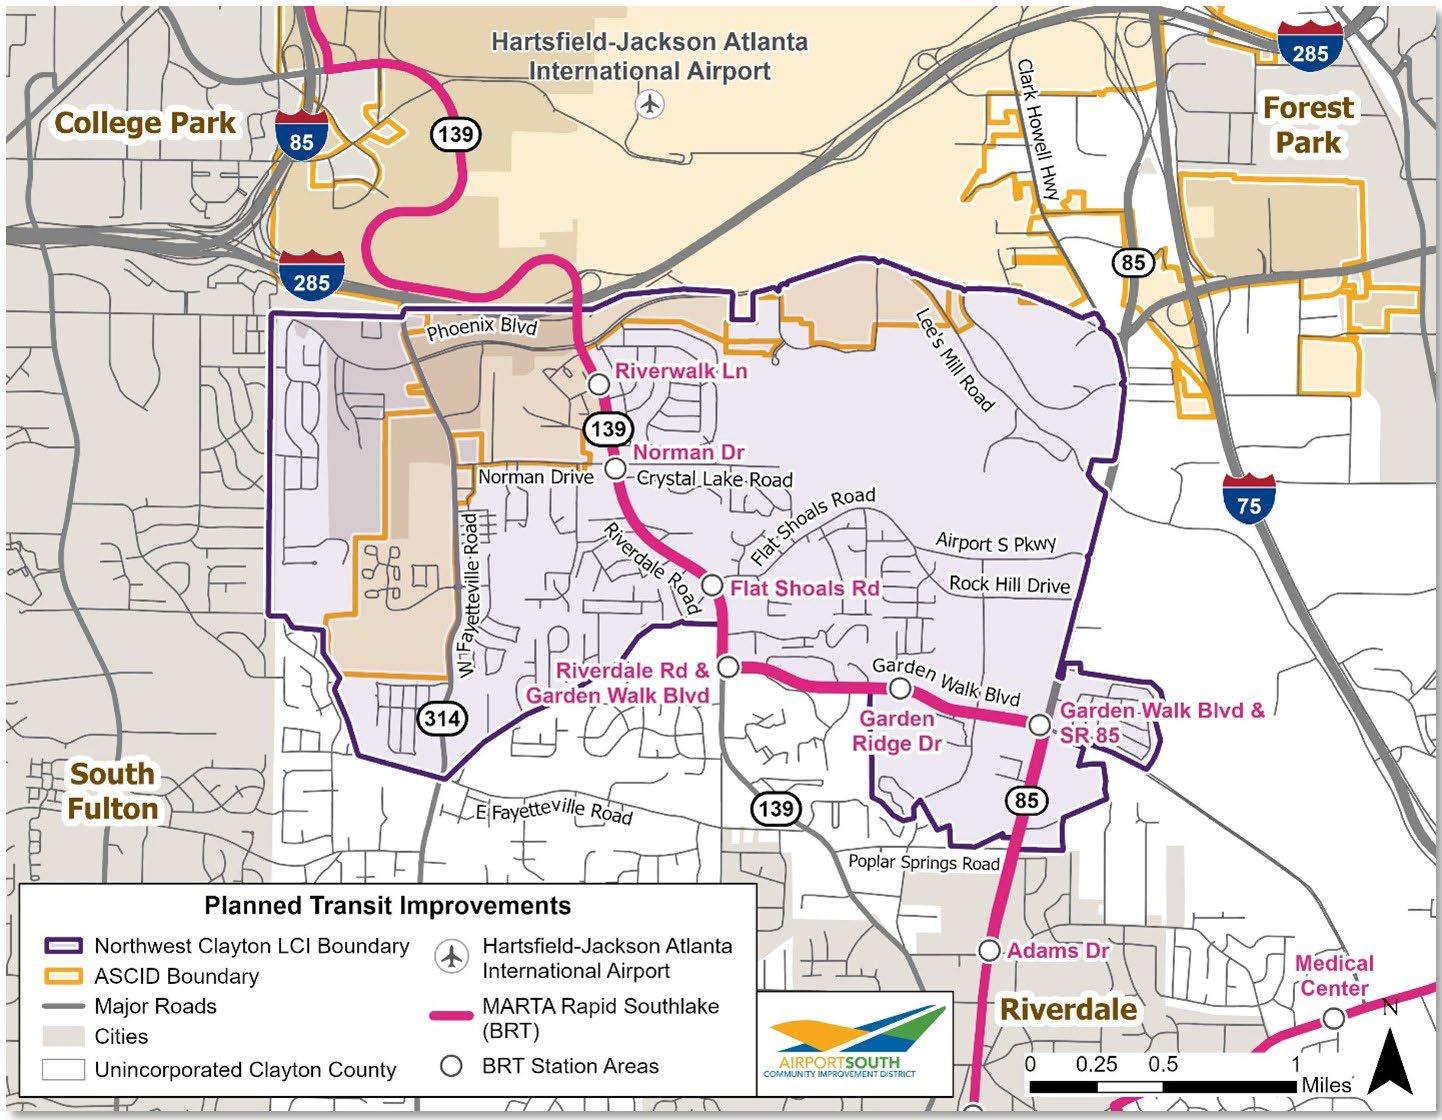
8 MARTA. MARTA Rapid Southlake. https://connectclayton.com/southlake-bus-rapid-transit/
The following section summarizes findings from a real estate market analysis performed for a larger Submarket study area which surrounds the Northwest Clayton LCI boundary (see Figure C-1). The intent of the market analysis is to understand how the confluence of demographic, employment, and real estate trends in play across this larger study area inform opportunities for revitalization and reinvestment within the LCI boundary.
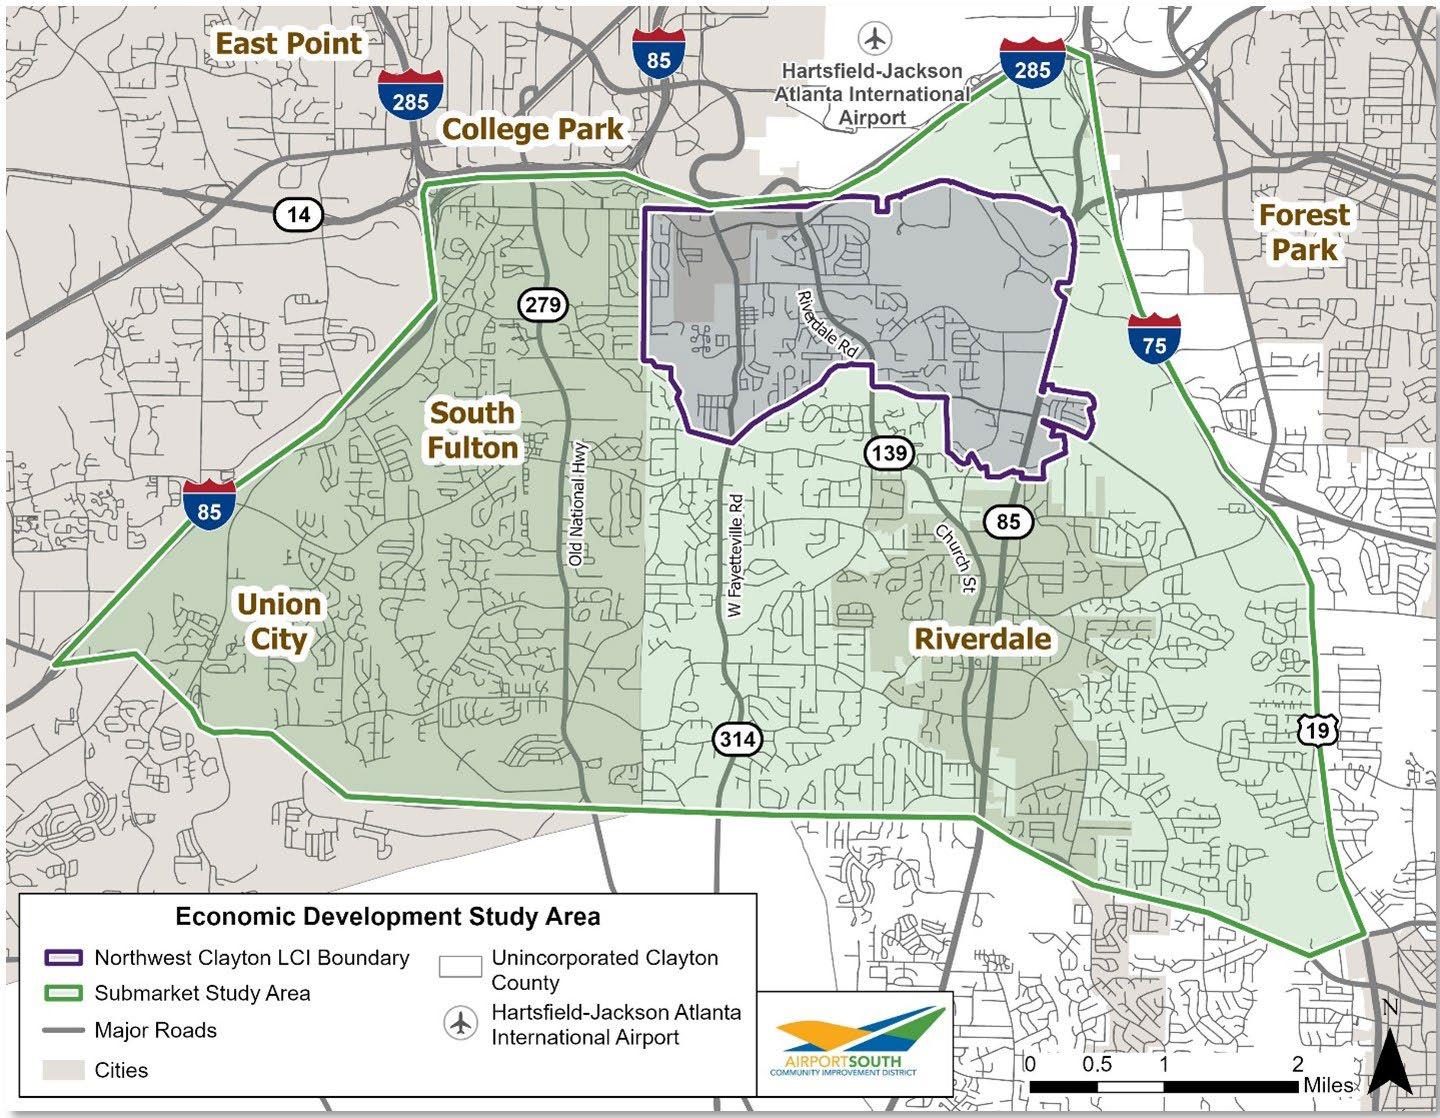
Source: EMSI/Lightcast, CoStar, and the U.S. Census Bureau
The analysis also considers additional geographies to provide context for the analysis. These additional geographies include:
1. Clayton County
2. The Atlanta-Sandy Springs-Roswell Metropolitan Statistical Area (MSA)
3. A five-mile radius from the centroid of HJAIA to provide context regarding broader trends in play around the airport.
The analysis incorporates data from sources such as EMSI / Lightcast (employment), CoStar (real estate), and the U.S. Census Bureau (demographics) in a GIS context to ensure that tract, point, or blockgroup-level data aligned as closely as possible to the Submarket study area boundary.
A comparison of 2010 and 2022 demographic and employment data for the Study area, Clayton County, and the MSA reveal patterns of change and helps to position the Submarket study area within the context of larger regional trends.
Submarket study area population has increased since 2010, having grown at a faster average annual rate compared to Clayton County and the MSA (Table C-1). As of 2022, the Study area population comprised 9 percent of Clayton County’s population. A quarter of the population increase since 2010 in Clayton County occurred in the Study area. In all three geographies, household formation took place at a marginally faster rate compared to population growth between 2010 and 2022.
** In 2022 dollars, adjusted for inflation
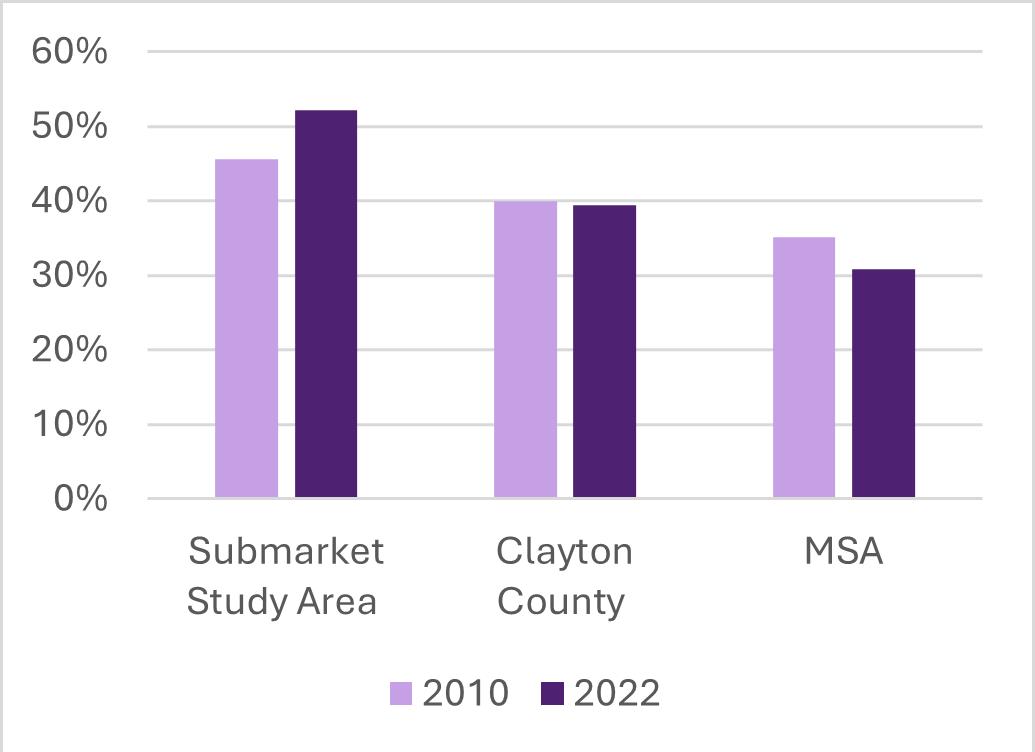
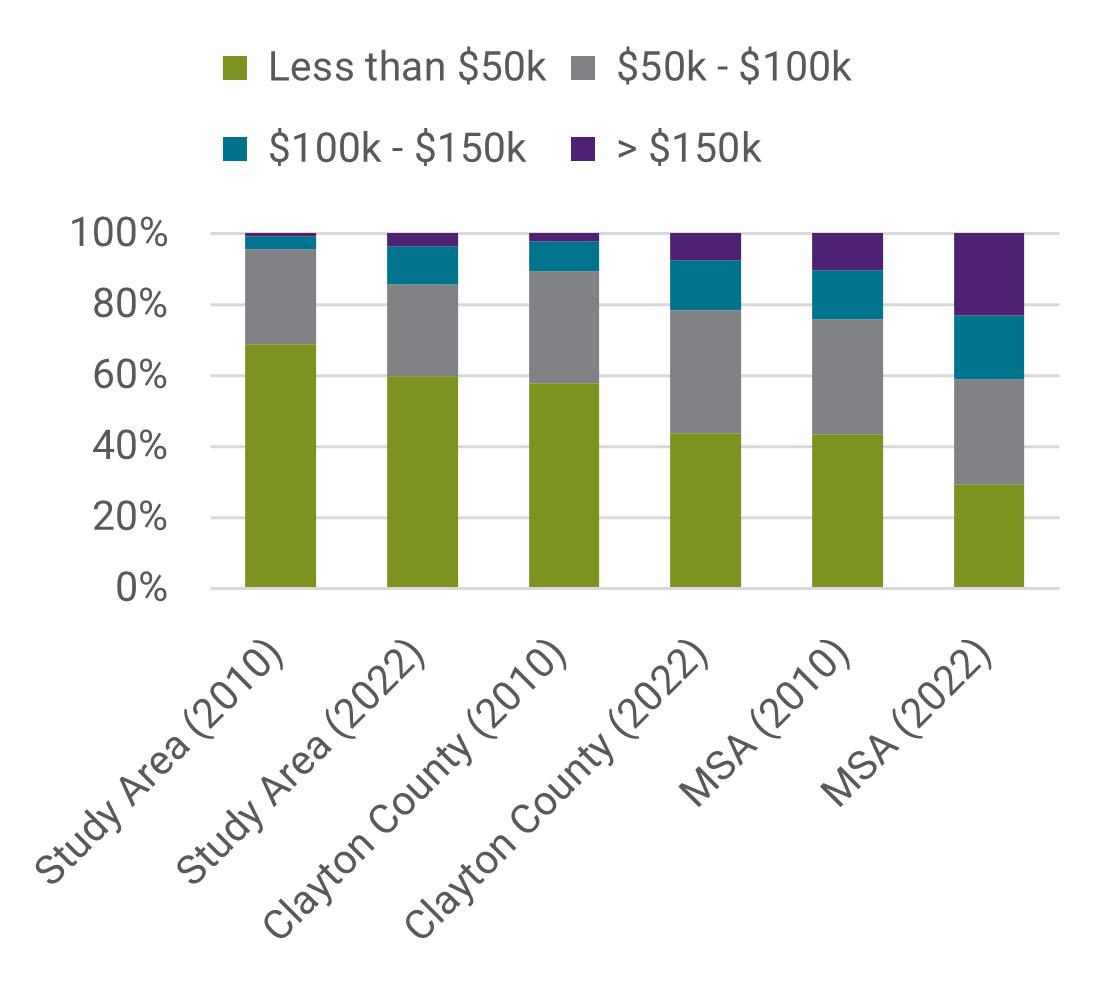
Table C-2 and Figure C-2 provide an overview of household income for the Submarket study area and comparison geographies. As of 2022, the MSA had the highest median household income of the three geographies in context with the Submarket study area which had the lowest at $43,000. Median household income between 2010 (adjusted for inflation) and 2022 in the Submarket study area and Clayton County remained flat over the 12-year period, while median household income in the MSA increased. Limited income growth in the Submarket study area is a concern, which may correlate with constrained resident access to quality jobs as well as other factors.
The change in households by income breaks between 2010 and 2022 shown in Figure 3-9 demonstrates that the number of households earning less than $50k annually has decreased across all analysis geographies and the number of households in higher annual income ranges increased. The MSA’s proportion of households earning more than $100k increased from about 25 percent in 2010 to 40 percent in 2022.
The disparities in income affect housing affordability for lower income households. A cost-burdened household is defined as a household spending over 30 percent of its gross income on rent or mortgage. Figure C-3 shows the cost-burdened household estimates from 2010 and 2022 for the three geographies. Notably, while the percentage of cost-burdened households did not increase in Clayton County and the MSA, it did increase in the Submarket study area from about 47 percent in 2010 to above 50 percent in 2022. This indicates that although the proportion of households in the Study area with annual incomes below $50k decreased during this time period, incomes did not increase fast enough to keep pace with the increase in housing costs.
Employment trends in the Submarket study area saw a sharp increase in jobs between 2011 and 2012, likely in part due to recovery from the “great recession”, after which employment was fairly stable, with marginal increases until a period of decrease from 2018 to 2020 (Figure C-4). Since bottoming out in 2020 at around 22,000 jobs, the Study area recovered jobs throughout 2022. Relative to Clayton County and the MSA, the Submarket study area experienced faster employment growth rate between 2010 and 2022 (Table C-3). Of the 22,000 jobs added in Clayton County between 2010 and 2022, the Submarket study area accounted for 32 percent of these jobs.
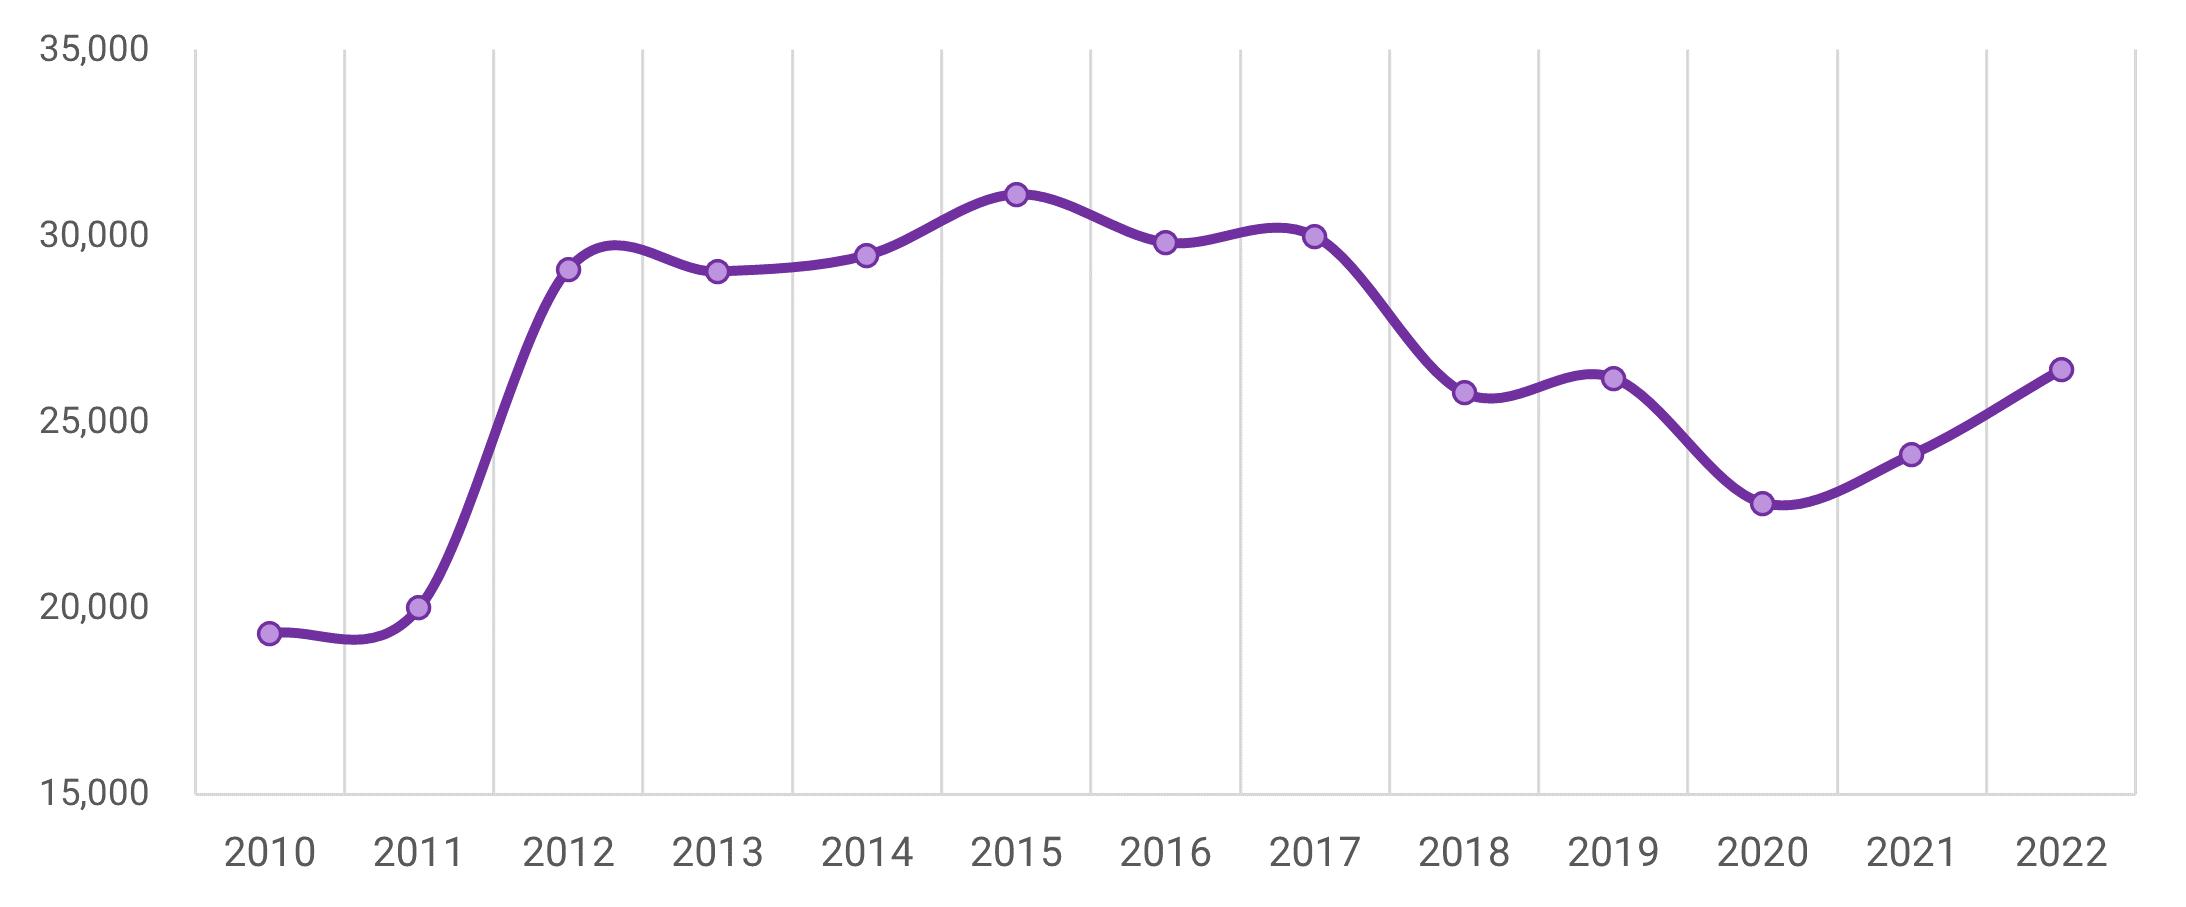
This section provides an assessment of the Submarket study area’s real estate market across different property types. The analysis aims to identify development trends and evaluate market performance relative to a wider airport-related market area (defined as a five-mile radius from the HJAIA centroid and referred to as airport radius for the rest of this section), and the MSA.
Figure C-5 is a map of the existing real estate inventory in the Submarket Study area by property
type and Figure C- 6 shows the inventory square footage by decade built. Multifamily real estate makes up about 51 percent of total inventory square footage in the study area at more than 4 million square feet (SF) or 4,500 units. This is followed by industrial real estate (3 million SF), office (1 million SF), and retail (700,000 SF). Overall, the analysis points to a real estate inventory which is relatively older compared to noted benchmarks, with a majority of space having been built before 2000 across all product types.

Source: EMSI/Lightcast, CoStar, and the U.S. Census Bureau
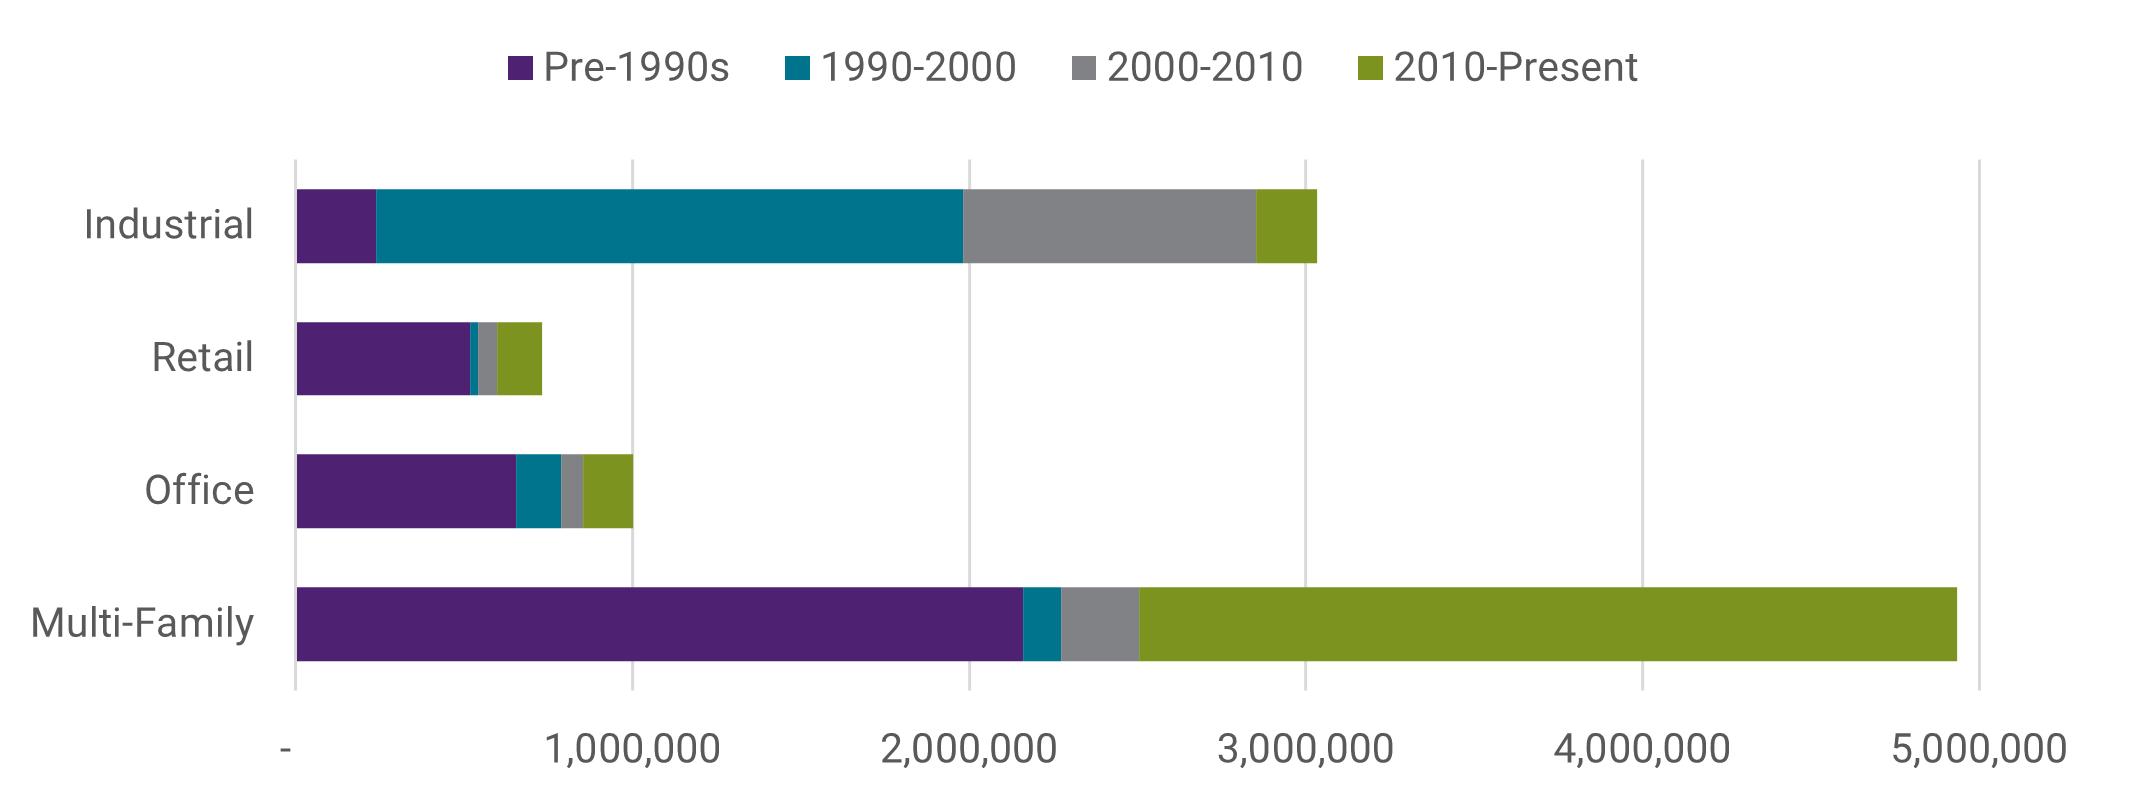
The Submarket study area’s multifamily inventory was mostly built either before the 1990s or after 2010 (Figure C-7). Although about half of the Submarket study area’s multifamily inventory was delivered after 2010, the rate of inventory growth has been slower relative to the MSA (Figure C-8).
Within the MSA, newer multifamily buildings command a rent premium, but this trend is not clearly exhibited in the Submarket study area and airport radius. The airport radius and the Study area also have
lower average multifamily asking rent, both at around $1,200 per unit, relative to the MSA’s $1,600 average rent per unit (Figure C-9), and rent growth has lagged behind the MSA as well (Figure C-10). Since 2021 however, all three geographies have experienced an uptick in vacancies (Figure C-11) as the market adjusts to absorb units delivered during the COVID-19 pandemic. Relative under-performance of existing older apartments within the Submarket study area is a concern, with possible connections to slower rates of income growth for local residents suggested in U.S. Census Data.
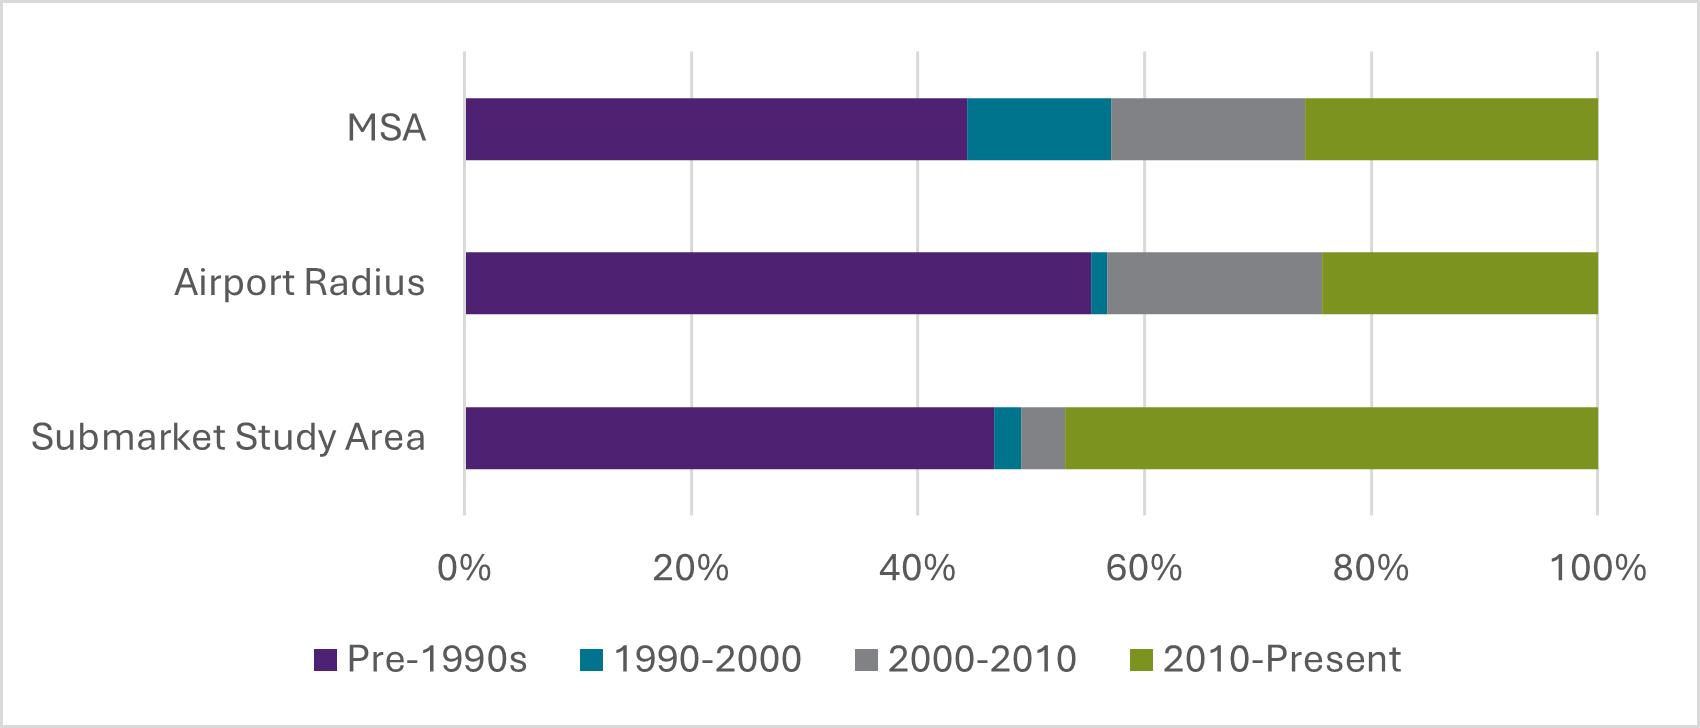
C-8: Multifamily Inventory Growth % Over Baseline (Baseline 100 = 2010) (2010-2024 YTD)
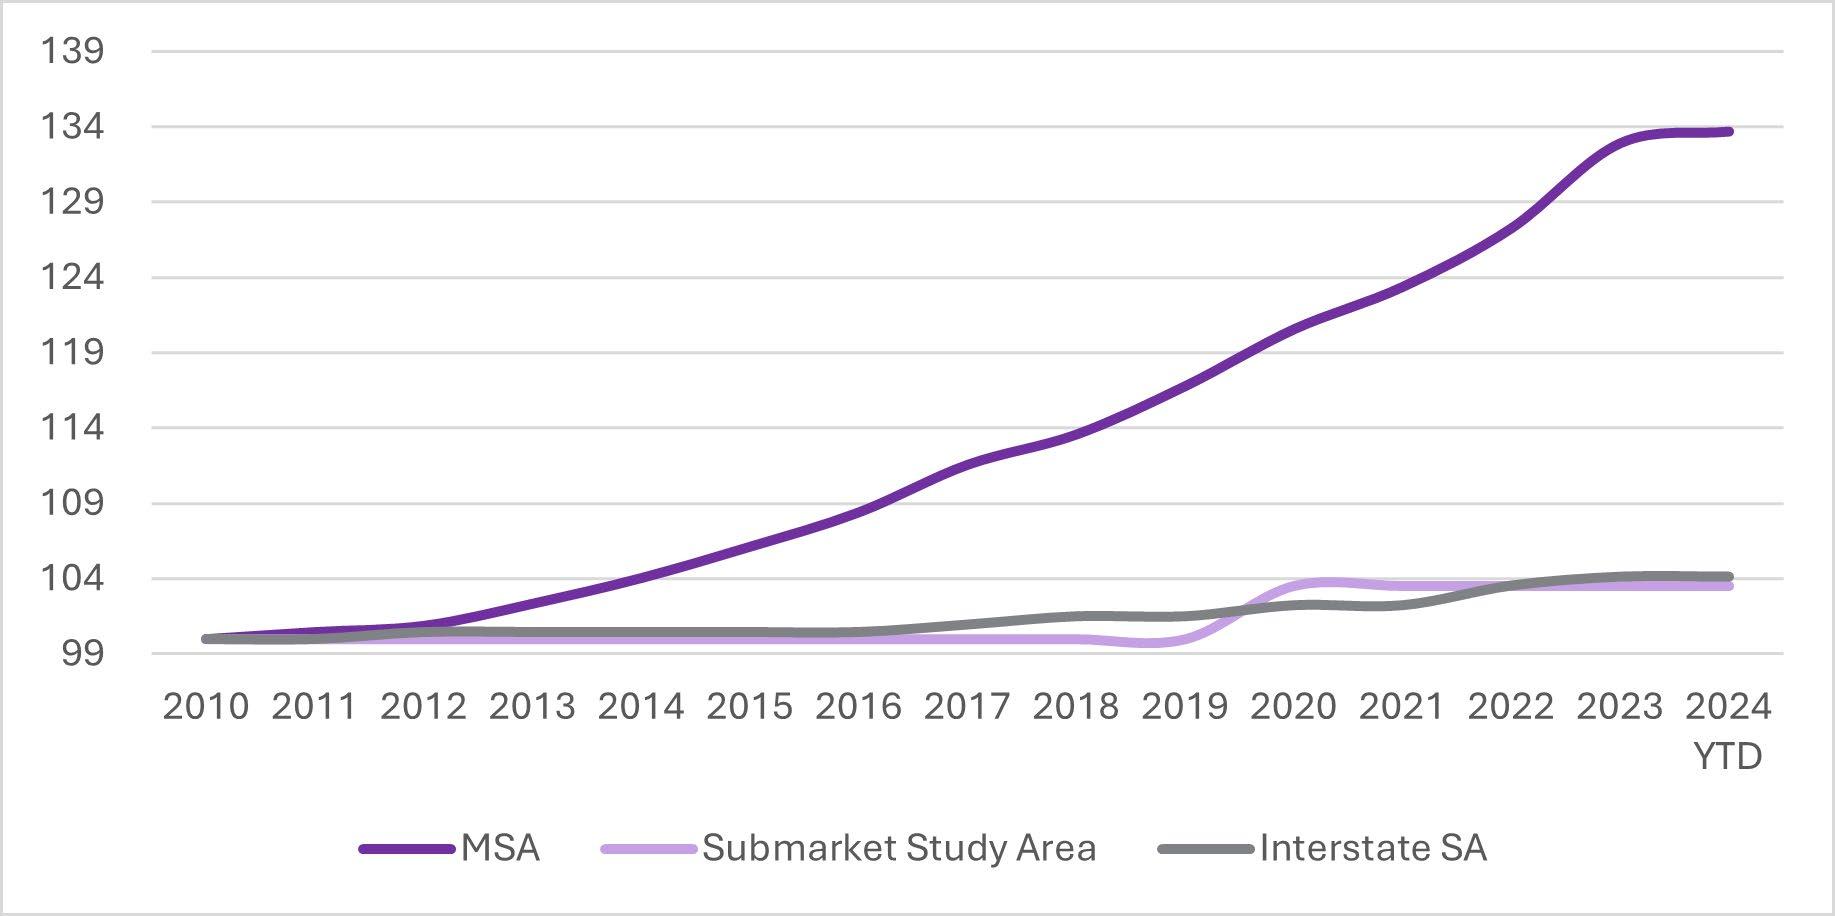
C-9: Multifamily Average Rent/Unit by Decade Built (as of 2024 YTD)
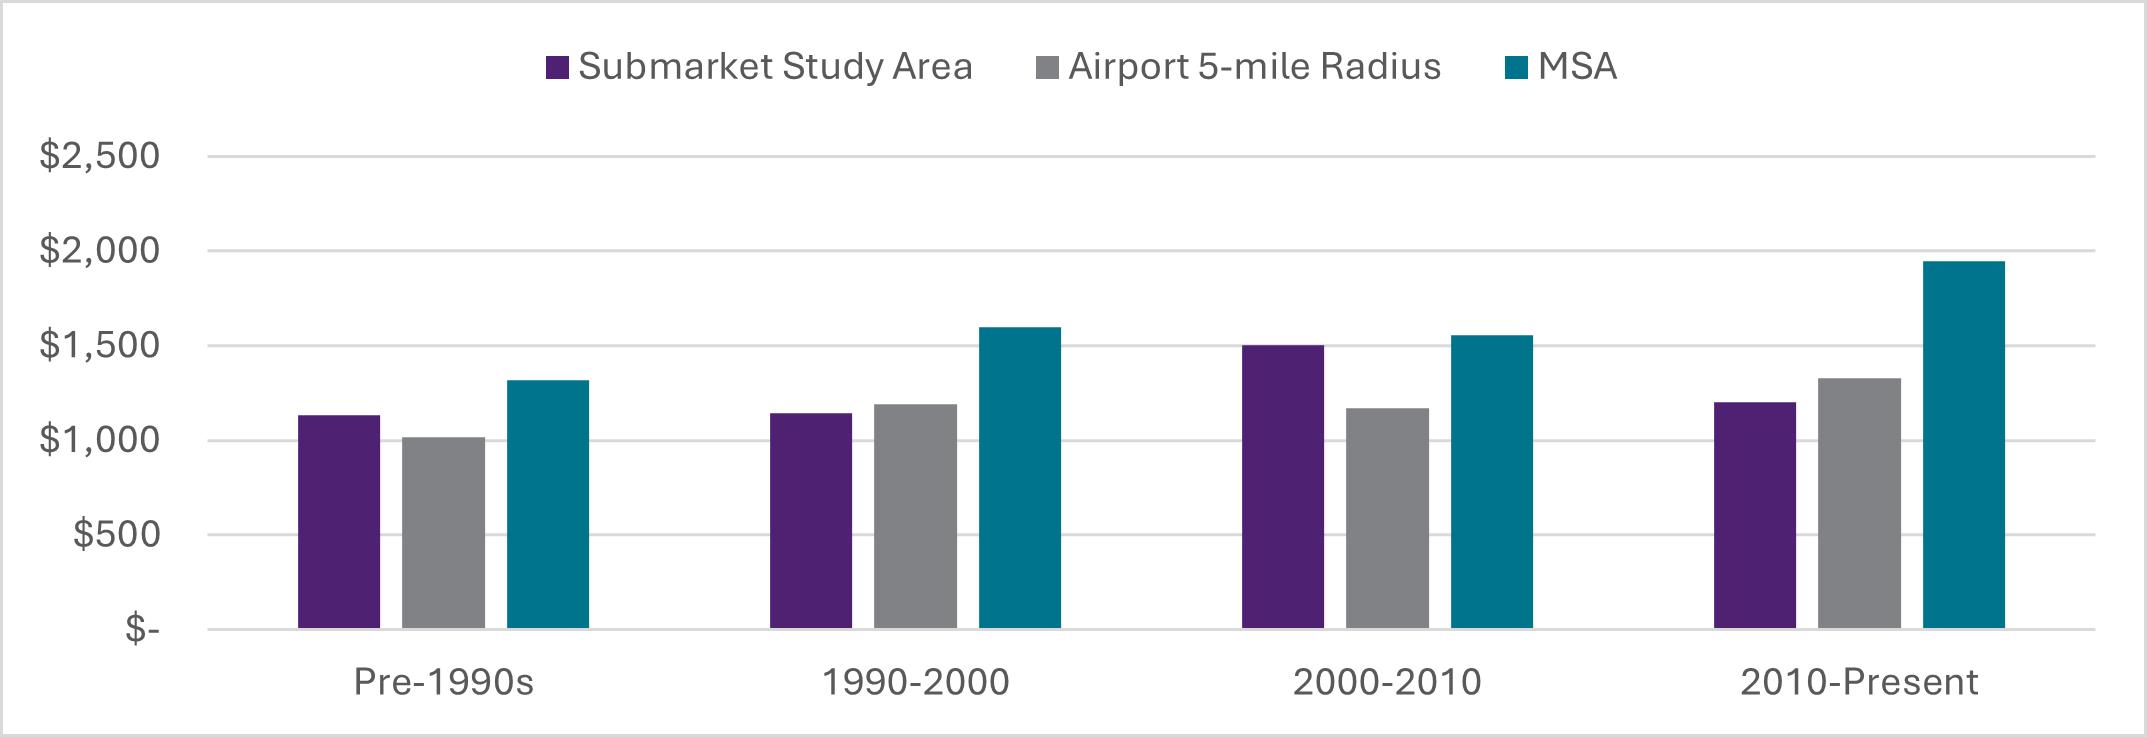
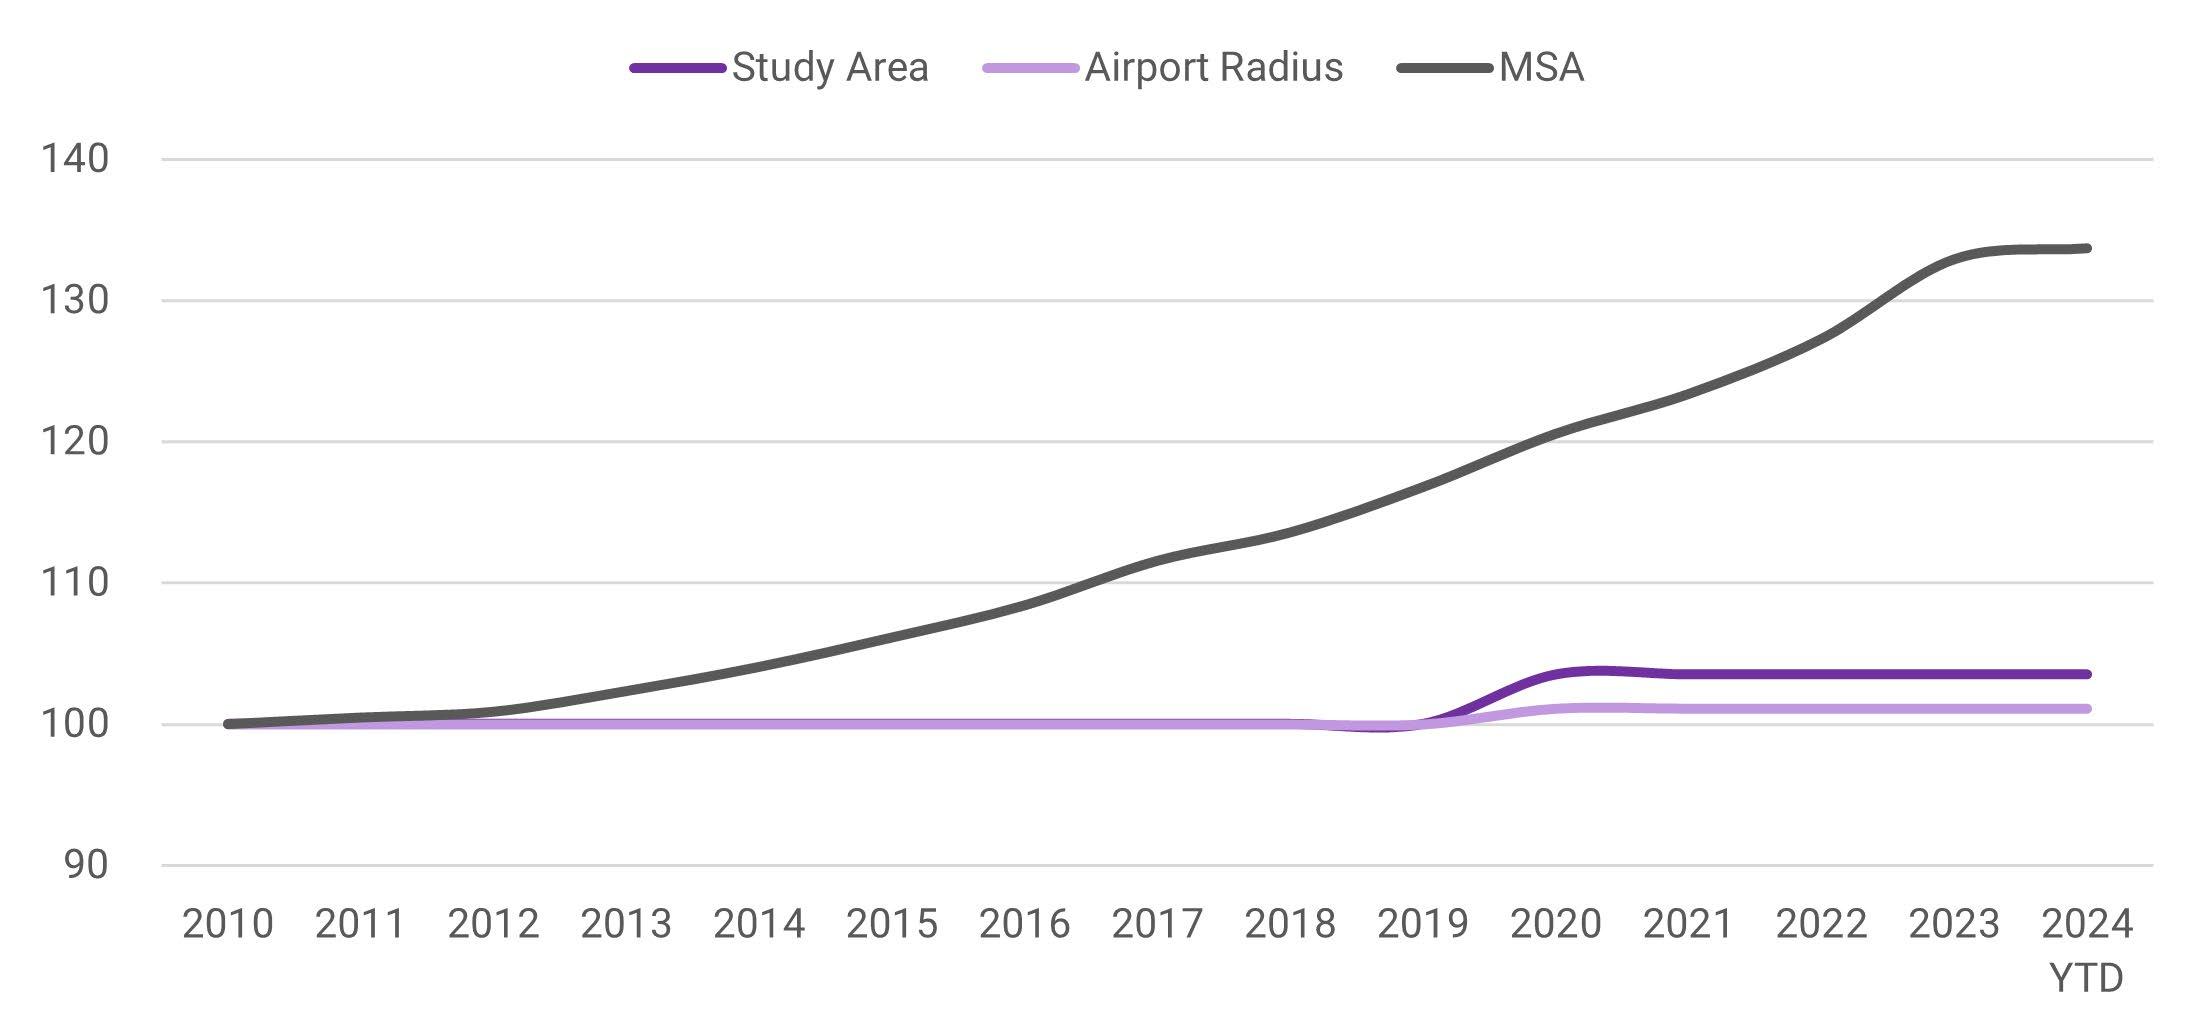
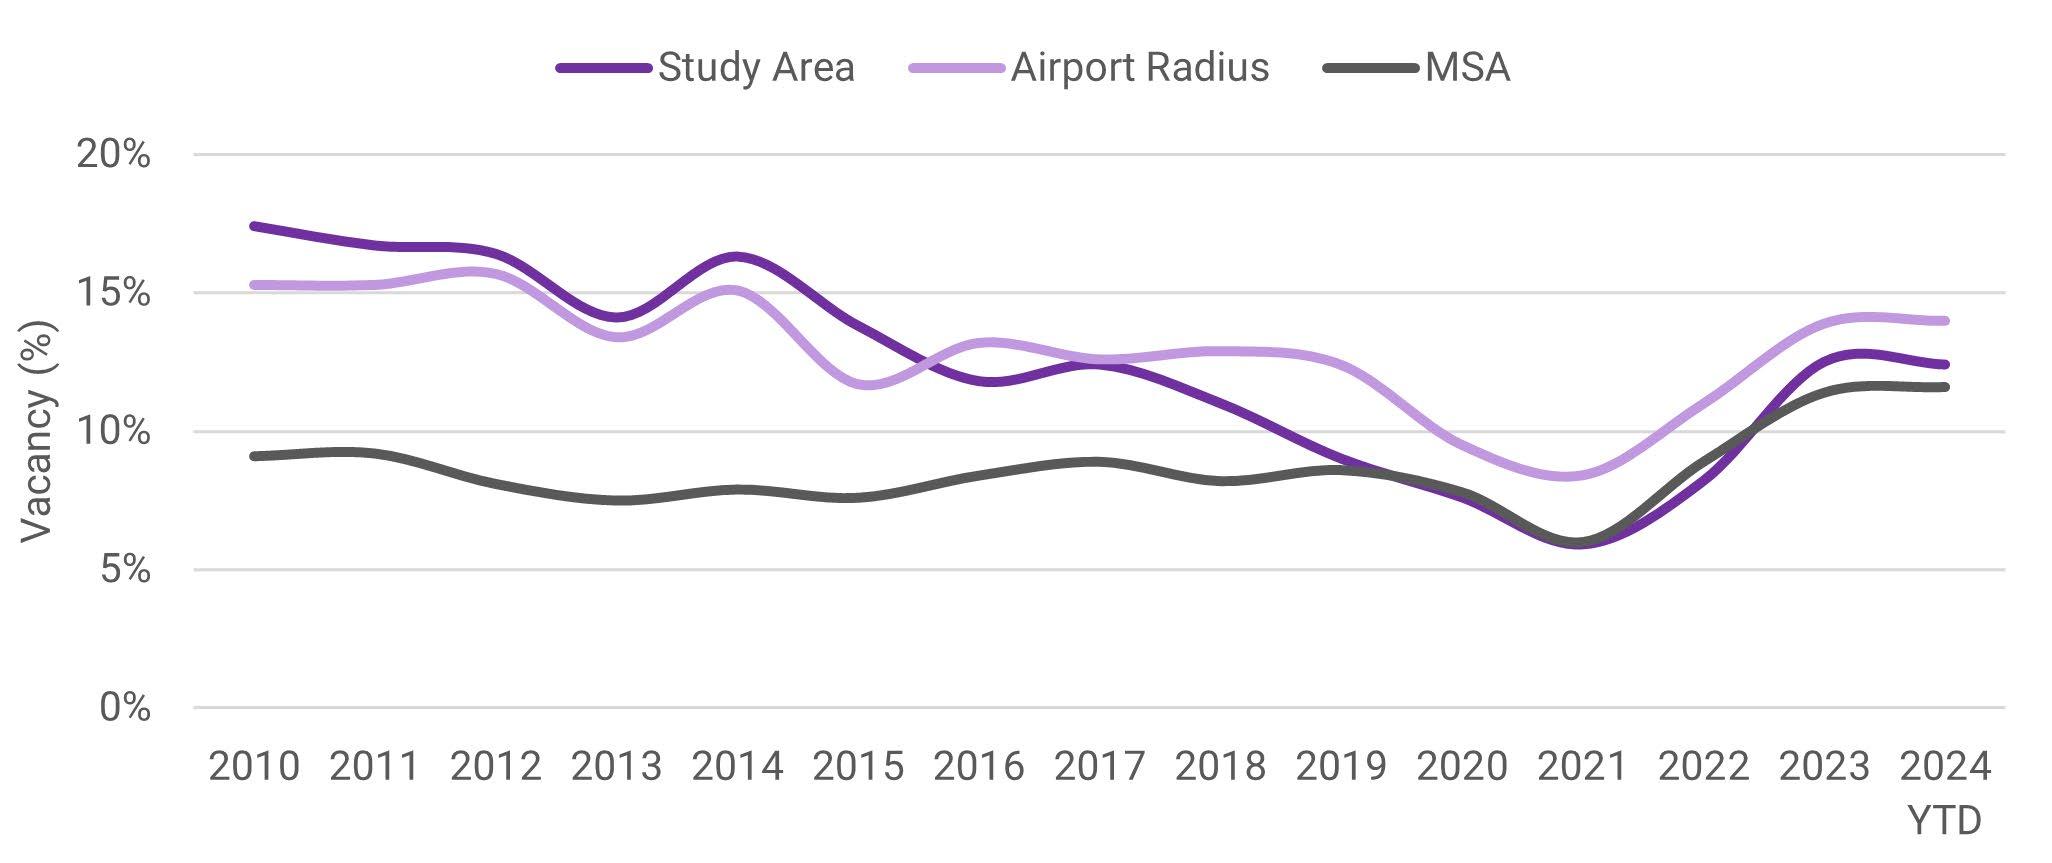
The Submarket study area’s industrial inventory is newer relative to the comparison geographies, as only 8 percent was built before the 1990s whereas more than half of the industrial inventory in the airport radius and the MSA were built before the 1990s (Figure C-12). Since 2010, the Submarket study area’s rate of inventory growth has slowed compared to the MSA (Figure C-13). However, the MSA’s industrial inventory growth since 2010 indicates a positive trend in the sector within the wider region. Stronger performance for industrial since 2010 is generally consistent with national trends and linked in part to growth of e-commerce.
Overall, the Submarket study area has a larger average industrial building size (71,000 SF) compared to the airport radius (64,000 SF) and the MSA (62,000 SF). Across all three geographies, properties constructed before the 1990s have smaller average building sizes, all measuring less than 60,000 SF. Since 2010, industrial properties have become larger on average (Table C-4).
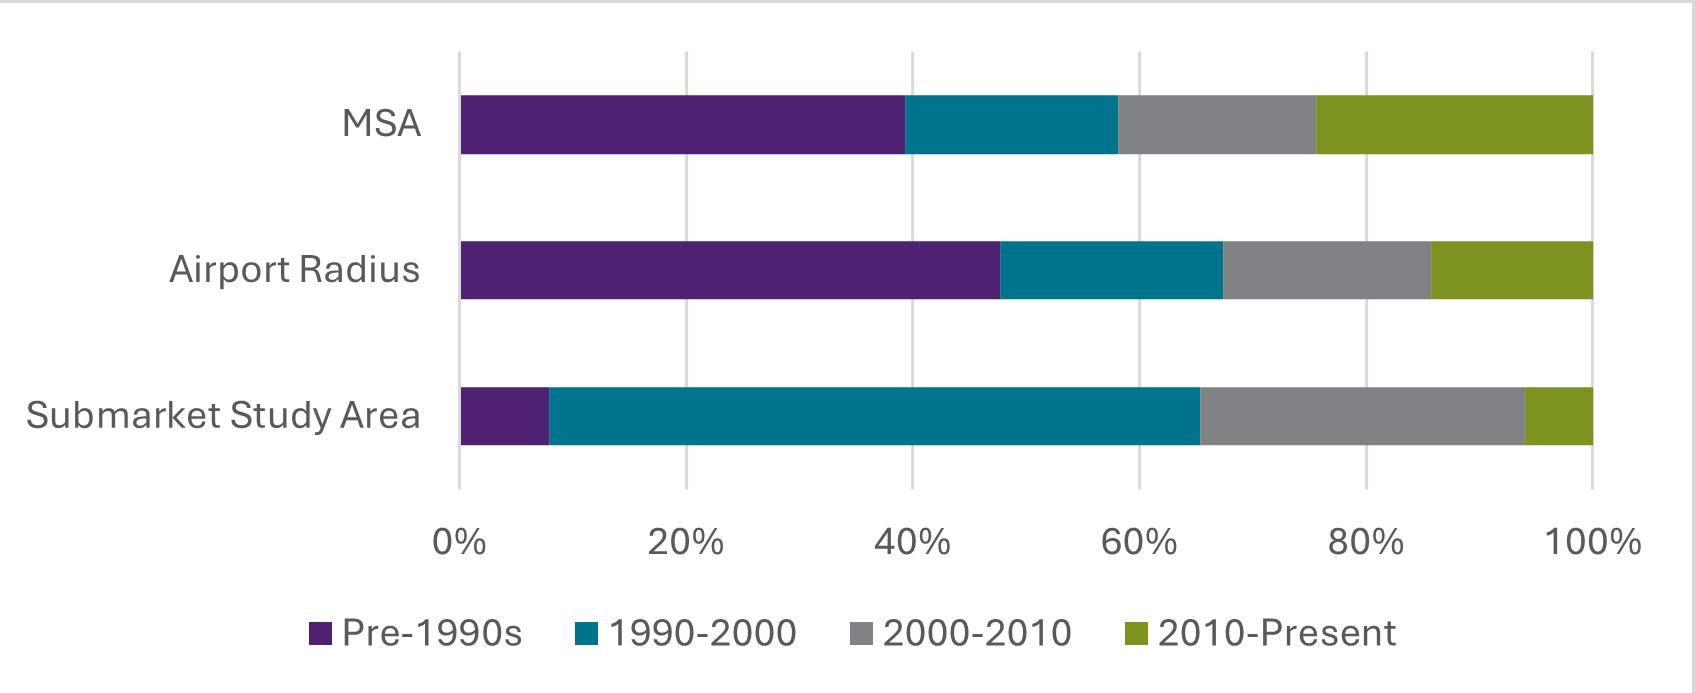
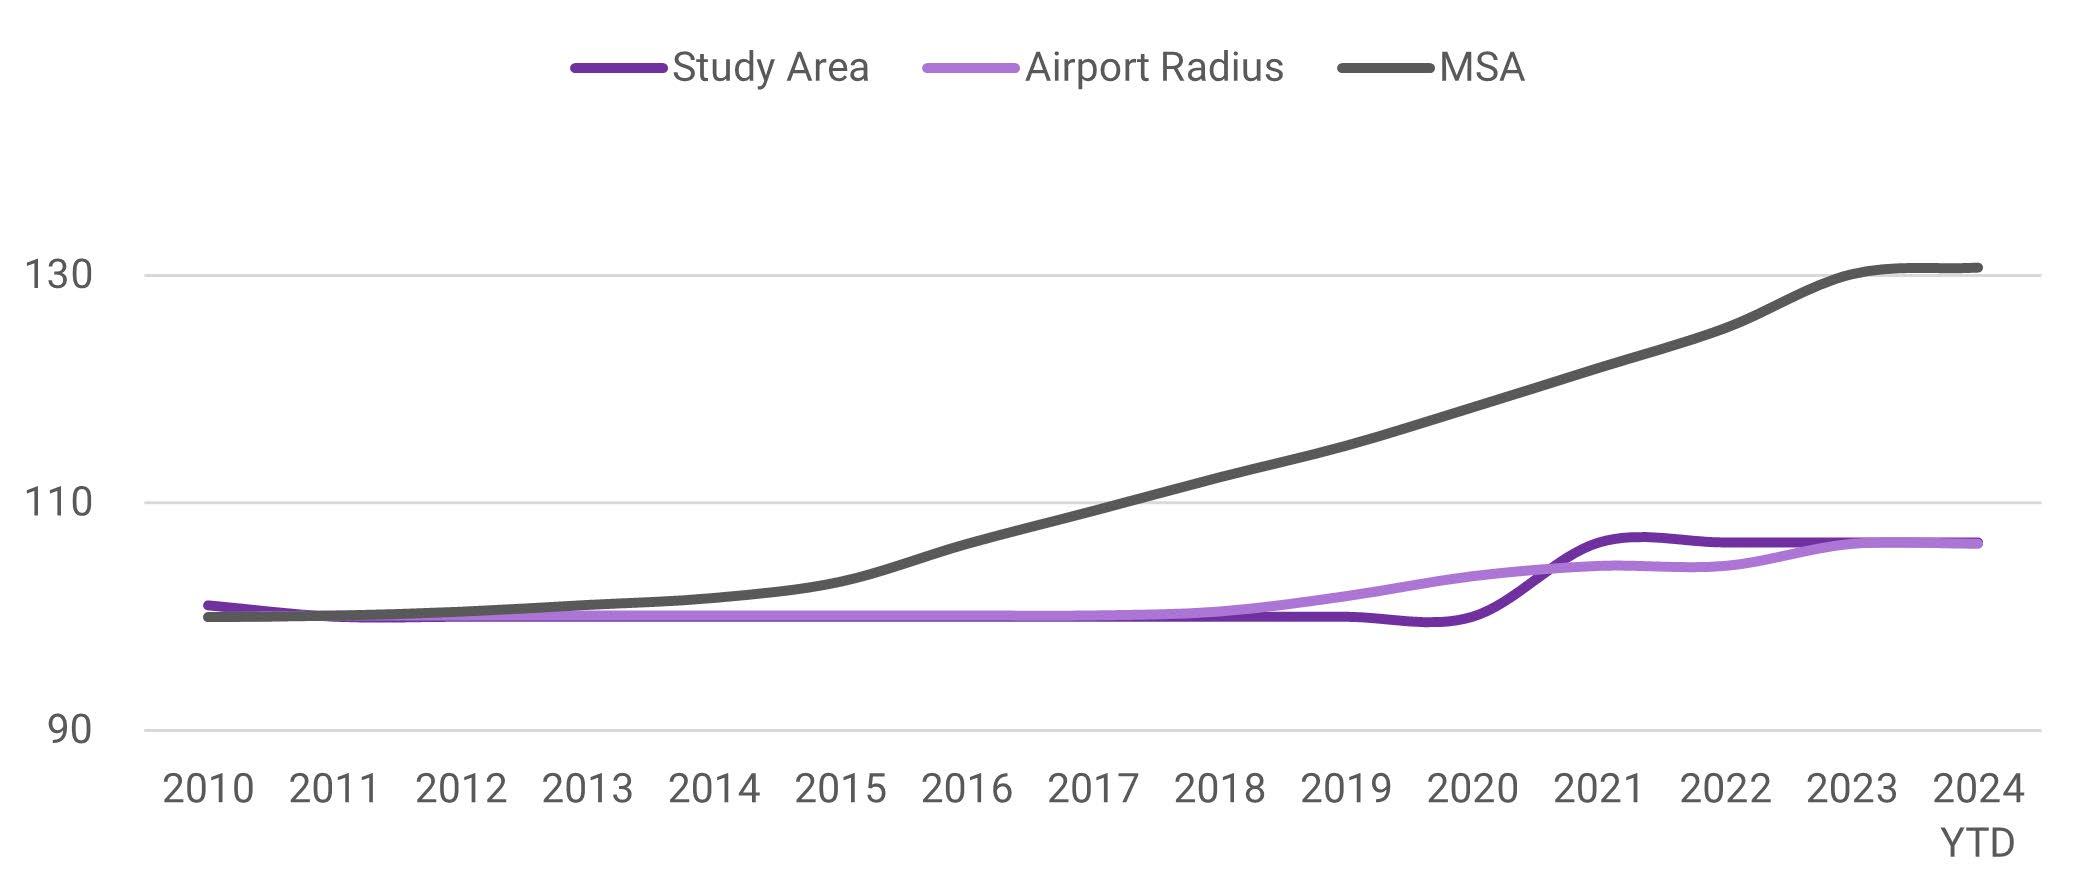
Industrial rents in the Submarket study area experienced slight decreases between 2010 and 2018 before increasing slightly in 2019, industrial rents within the airport radius have been trending positively since 2014, increasing from $3.40/SF in 2014 to $6.20/SF in 2020 (Figure C-14). This indicates that the wider airport-related industrial market has been increasing in value even though rents in this market remain lower than average industrial rents across the
MSA (Figure C-15). Supporting this trend in increasing rents is the decrease in industrial vacancy across all geographies since 2010 (Figure C-16).
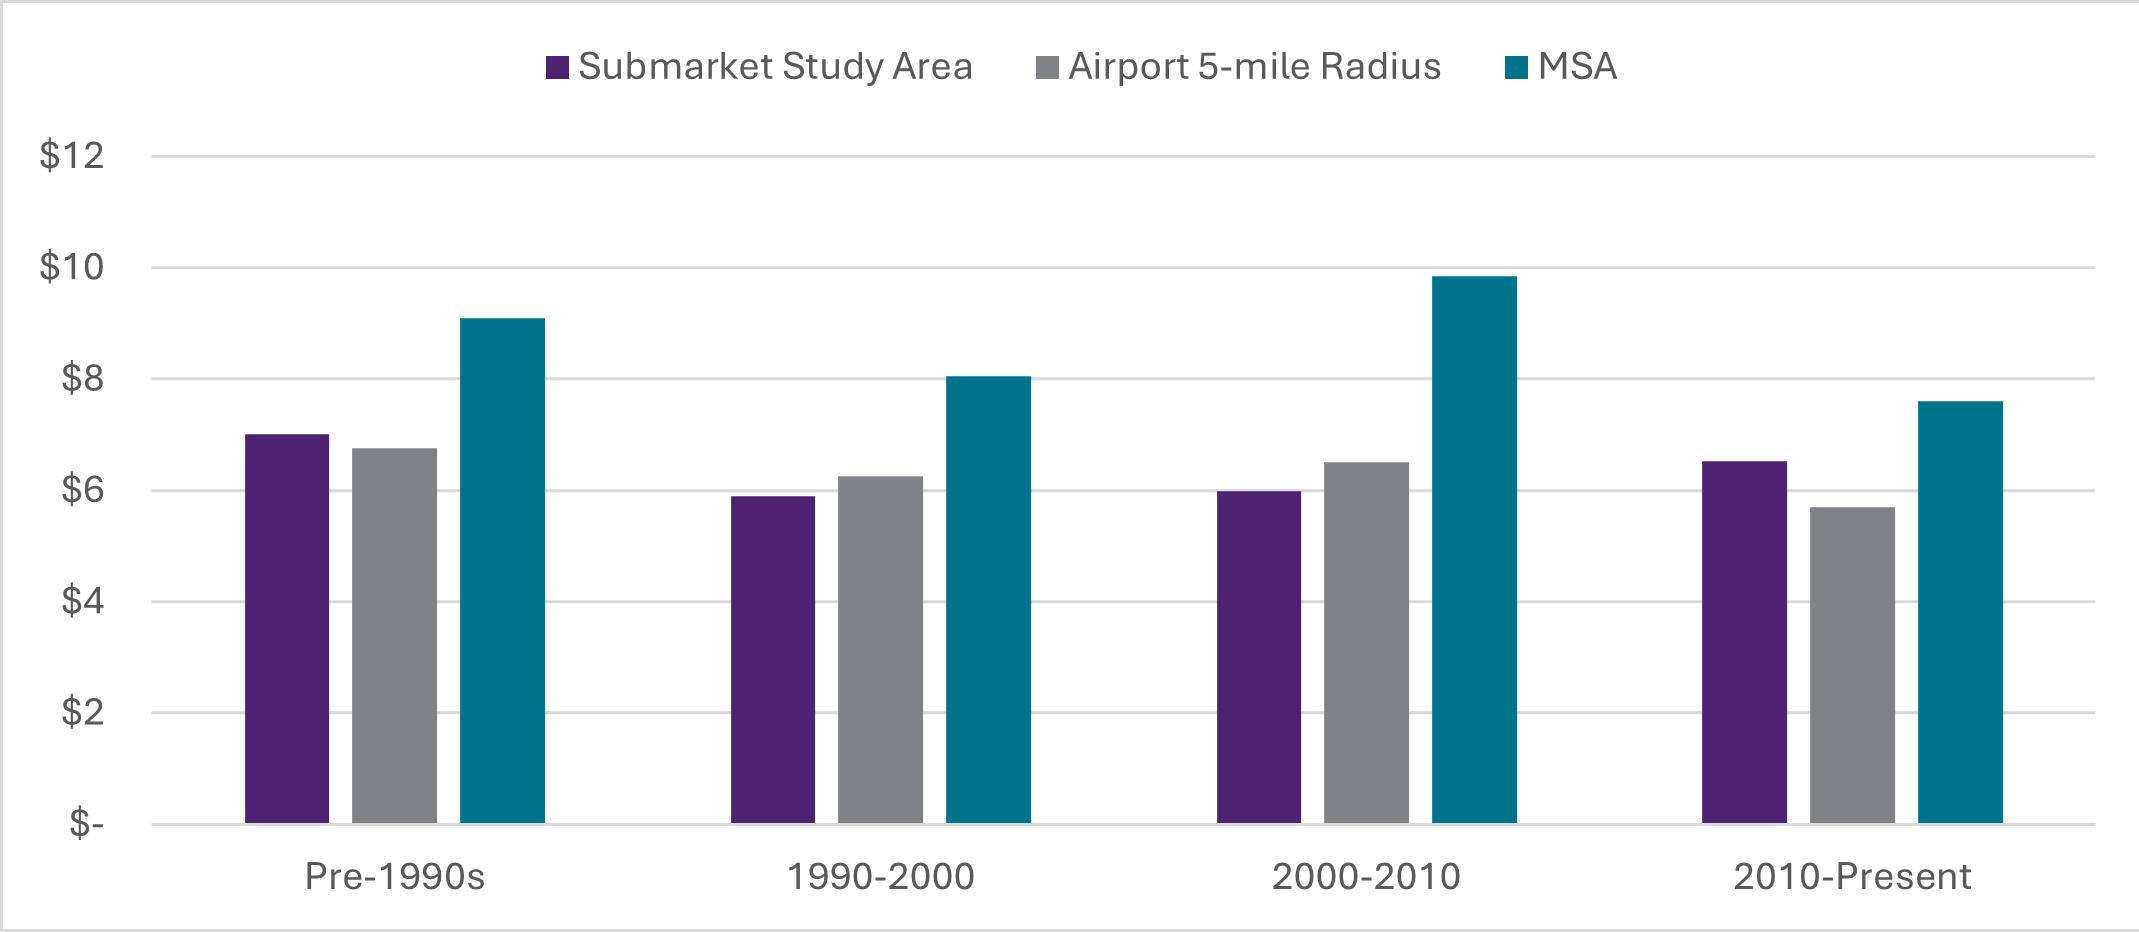
C-15: Industrial Rent Growth % Over Baseline (2010 Baseline = 100)*
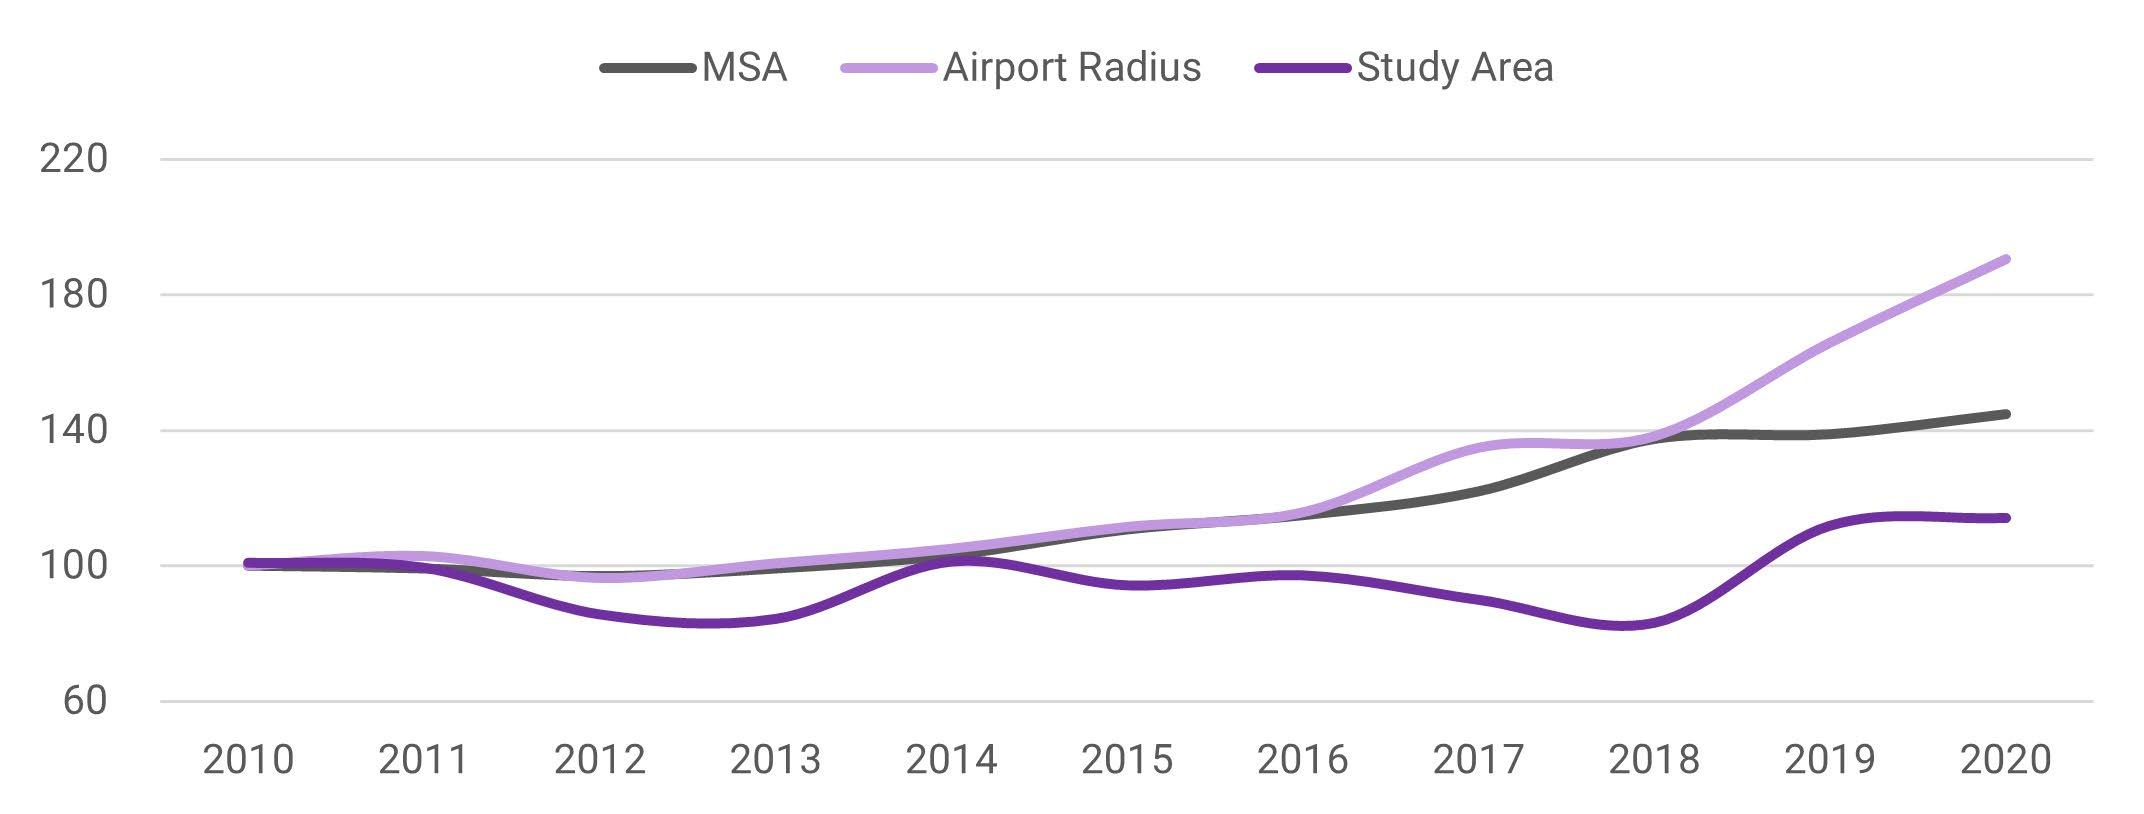
* This chart only shows data up to 2020 due to data limitations on industrial rents in the Study area since 2020.
C-16: Industrial Vacancy % (2010-2024)
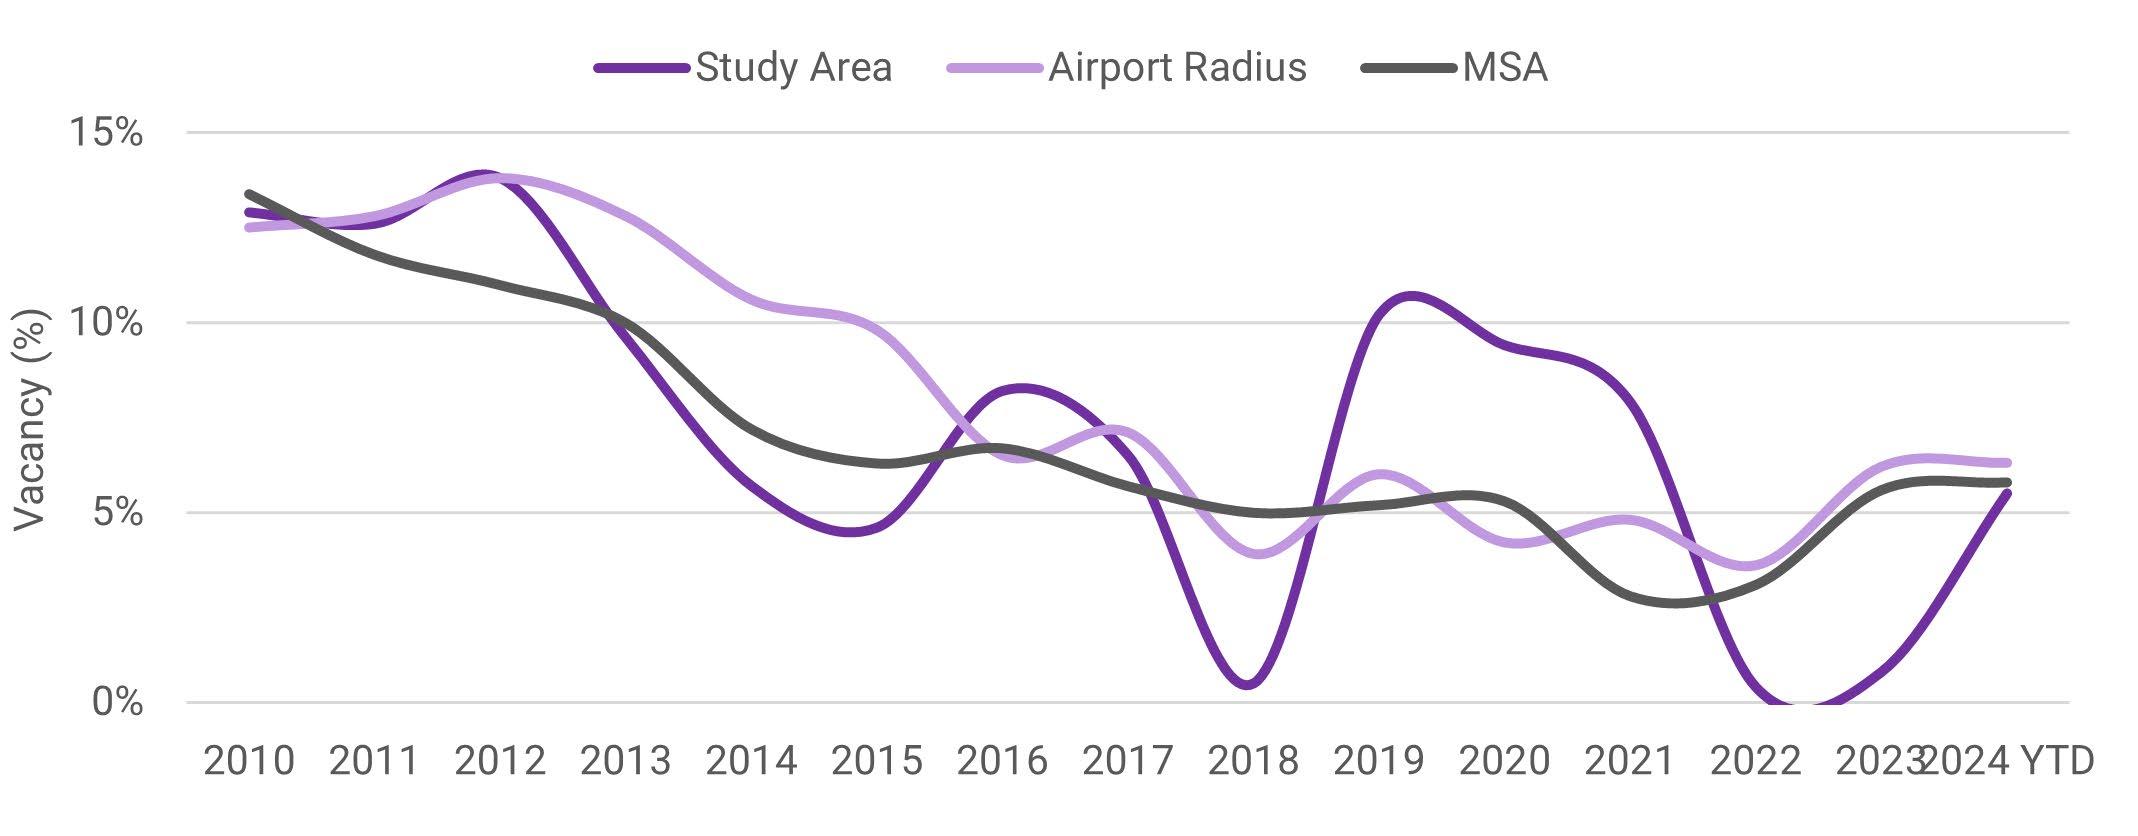
Across the three geographies, existing office inventory is mostly made up of square footage built before 2000 (Figure 3-24). Most prominently, the Submarket study area office inventory is made up of over 60 percent stock that was built before the 1990s. Although the MSA saw the fastest increase in office inventory relative to the airport radius (Figure 3-25), it only saw an 11 percent increase in inventory square footage
between 2010 and 2024 YTD, indicating a regional slowdown in office construction. The older age of existing office stock in the Submarket study area is a concern given broader impacts of remote / hybrid work on office demand. While there are expectations for recovery in office demand into 2025 and beyond, tied to market interest in modern buildings with access to enhanced amenities in mixed use environments, older office buildings with limited mixed-use amenities are increasingly at a competitive disadvantage.
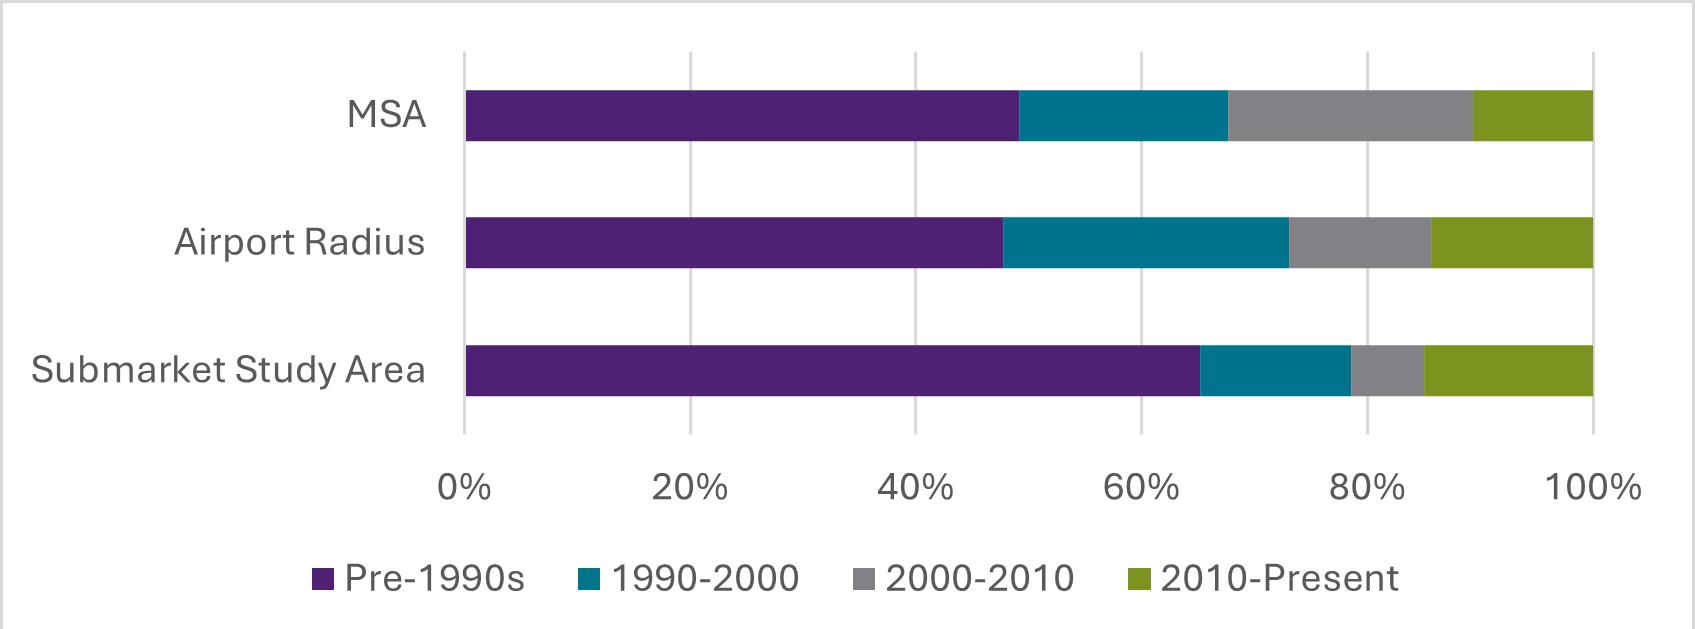
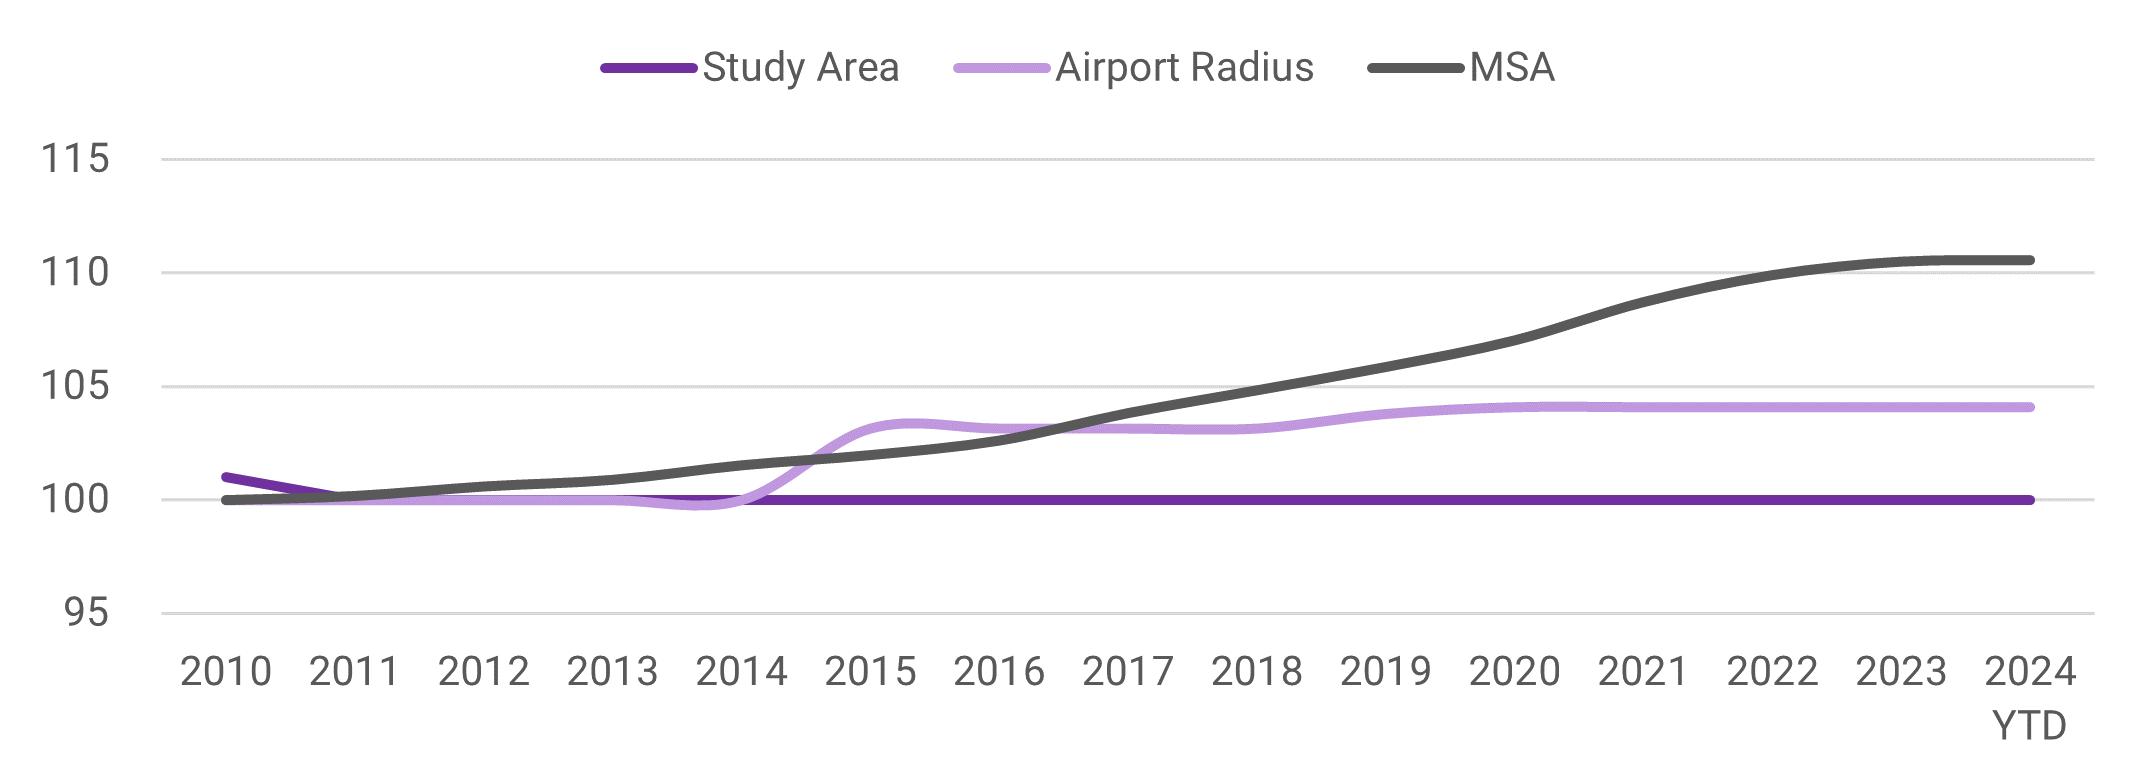
As of 2024, MSA office rents are higher on average at $28.97/SF compared to the airport radius ($21.05/ SF) and the Study area ($13.52/SF). Office rents in the Study area and the airport radius for newer
buildings are only marginally higher than rents in older properties (Figure C-19), despite being larger in size (Table C-5).
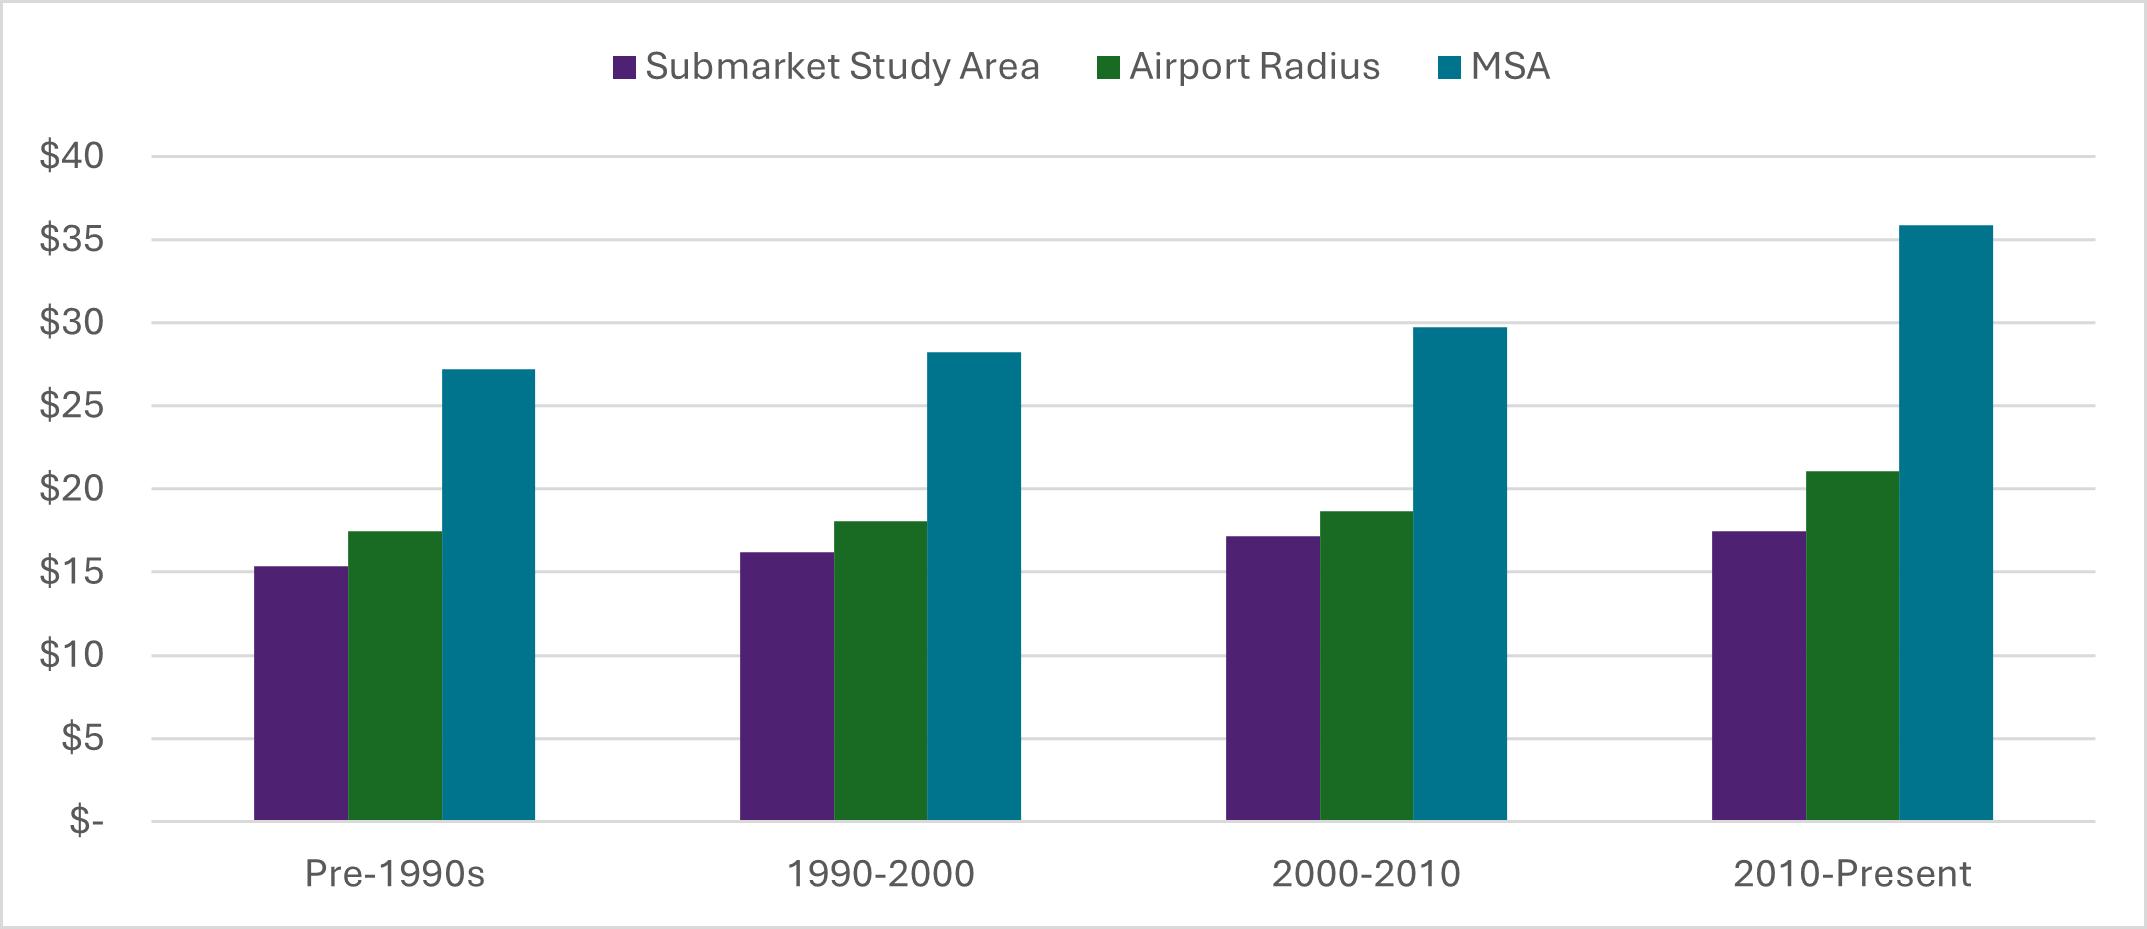
Despite having lower rents compared to the MSA average, both the airport radius and the Submarket study area have experienced steady rent growth since 2019 (Figure C-20) and have low vacancies (Figure C-21).
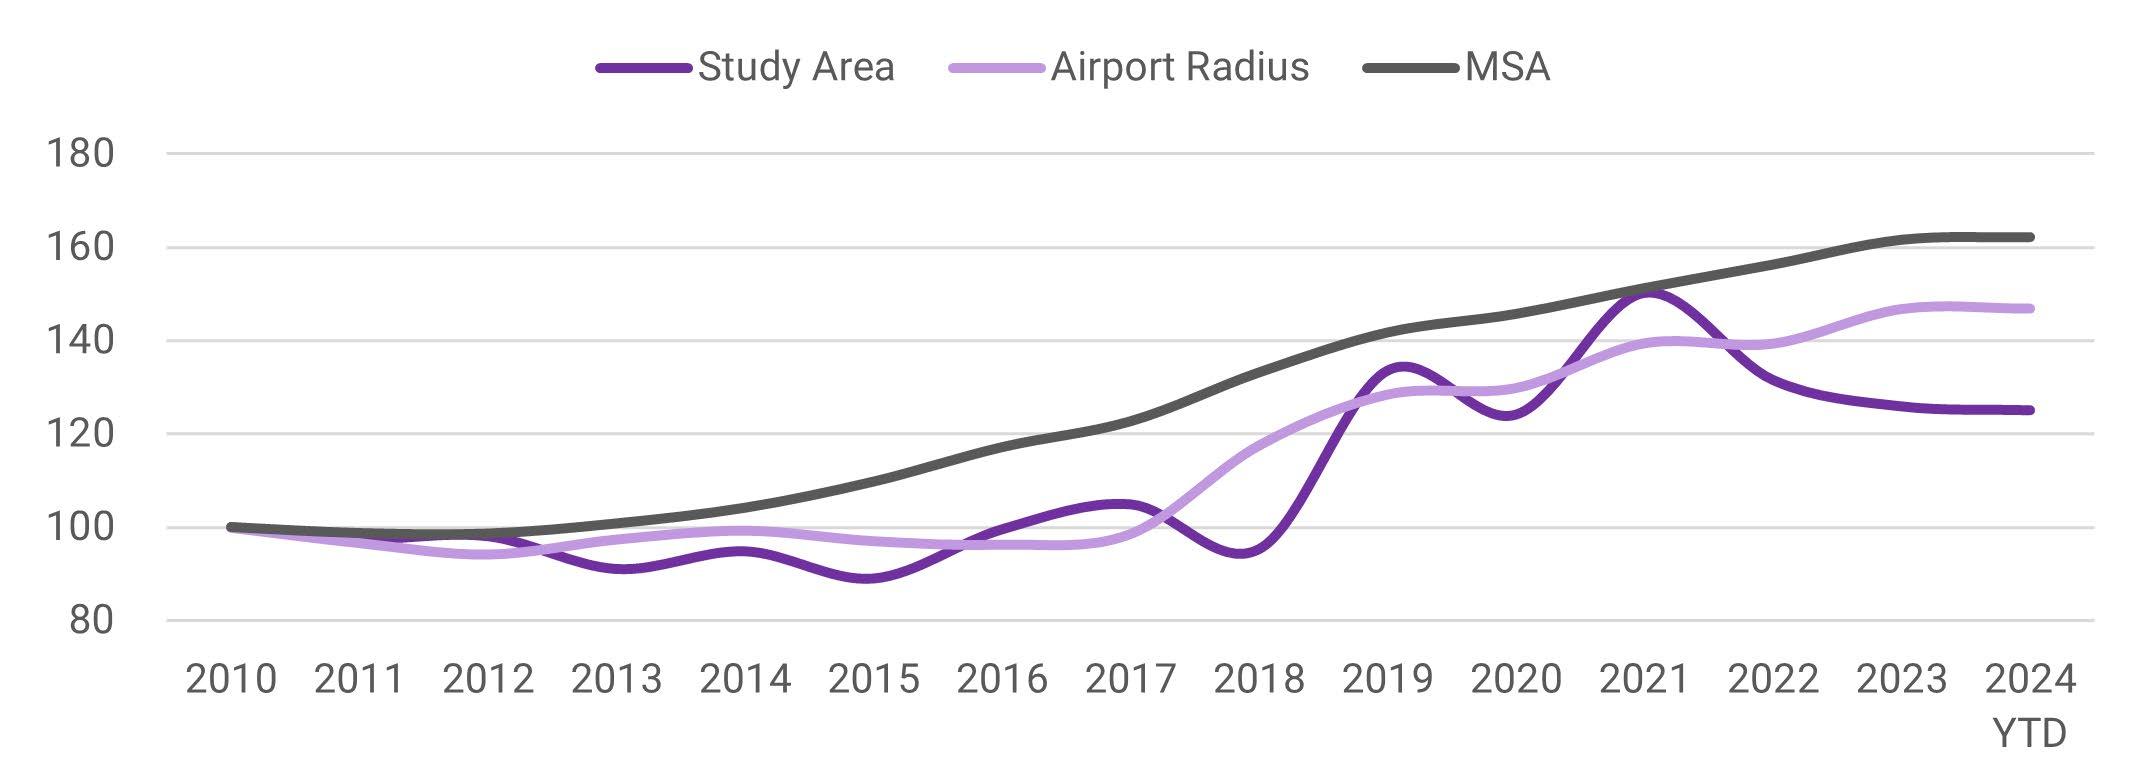
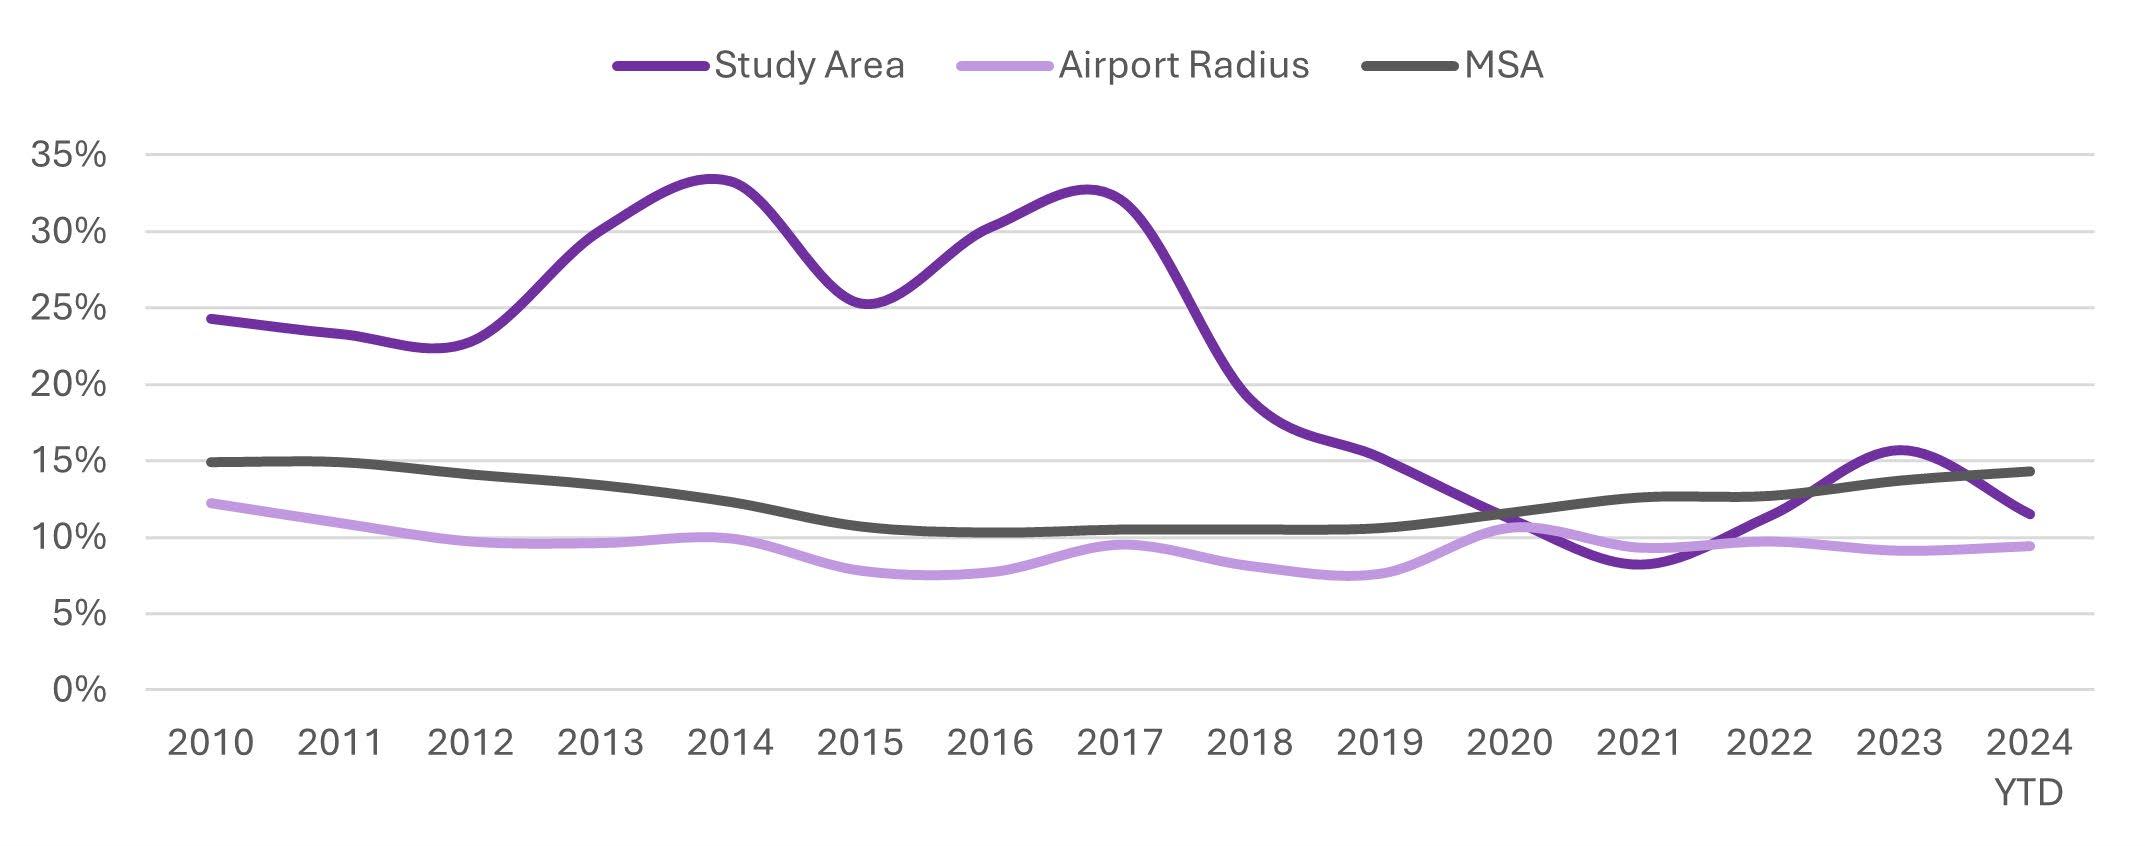
The retail inventory in the Submarket study area and the airport radius are made up of more than 70 percent stock built before the 1990s compared to only 40 percent in the MSA (Figure C-22). This is reflected in stagnant retail inventory growth (Figure C-23) in recent years, a trend which is not inconsistent with national trends, as the retail sector adjusts to the impact of the “retail apocalypse” and e-commerce. Retail rent growth had been subdued across the MSA since 2016 despite being higher on average per SF (Figure C-24) compared to the Study area and the airport radius (Figure C-25). Comparatively, the Study area’s retail rents had increased between 2010 and
2011, this was followed by a slow decline from 2011 to 2018. Between 2018 and 2023, rents experienced two cycles of ups and down. Since 2010, all three geographies experienced decreases in average vacancies (Figure C-26). However, the Study area has experienced an uptick in vacancy since 2021. Looking forward to 2025 and beyond, expectations for recovery and growth in retail are emerging, albeit with a firmer link to growth in rooftops within 3-5 miles. One primary difference moving forward are retailer expectations that 25 percent to 50% of all retail transactions will start electronically.
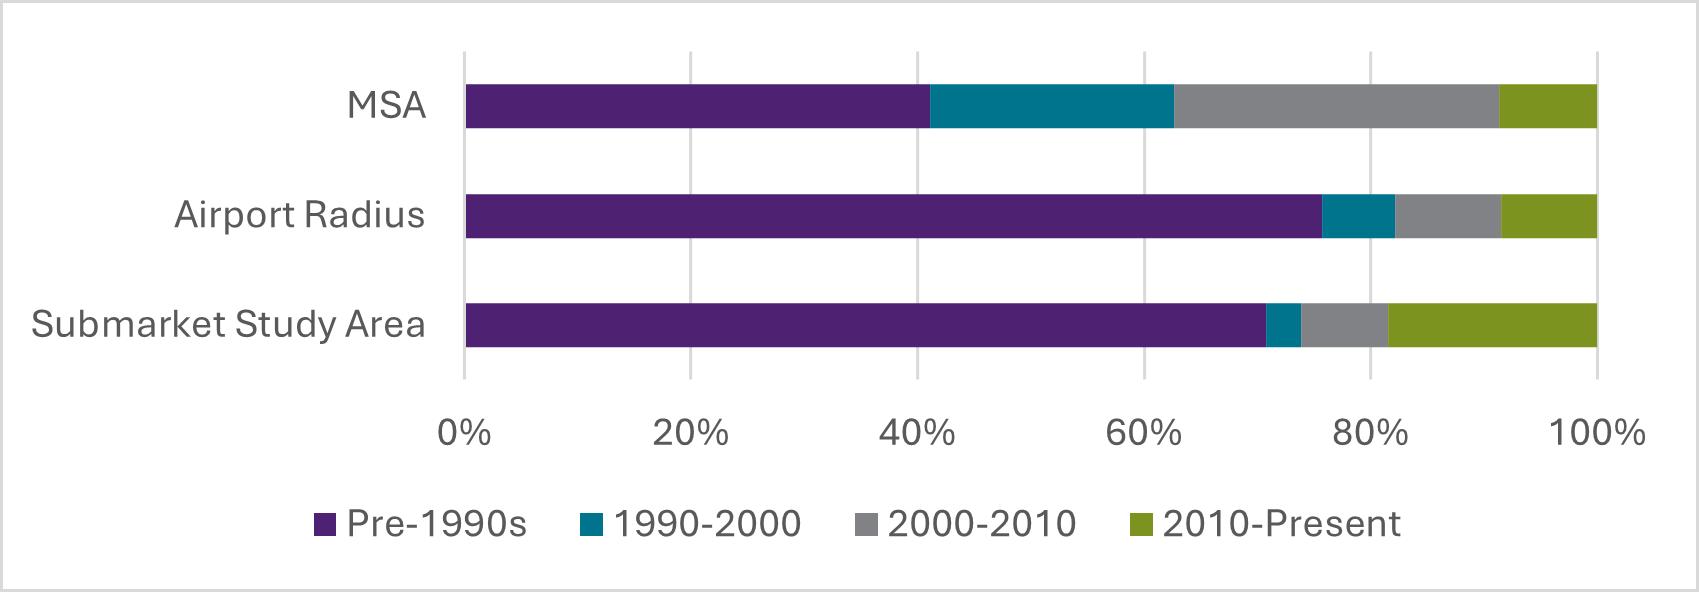
C-23: Retail Inventory Growth % Over Baseline (Baseline = 2010) (2010-2024 YTD)
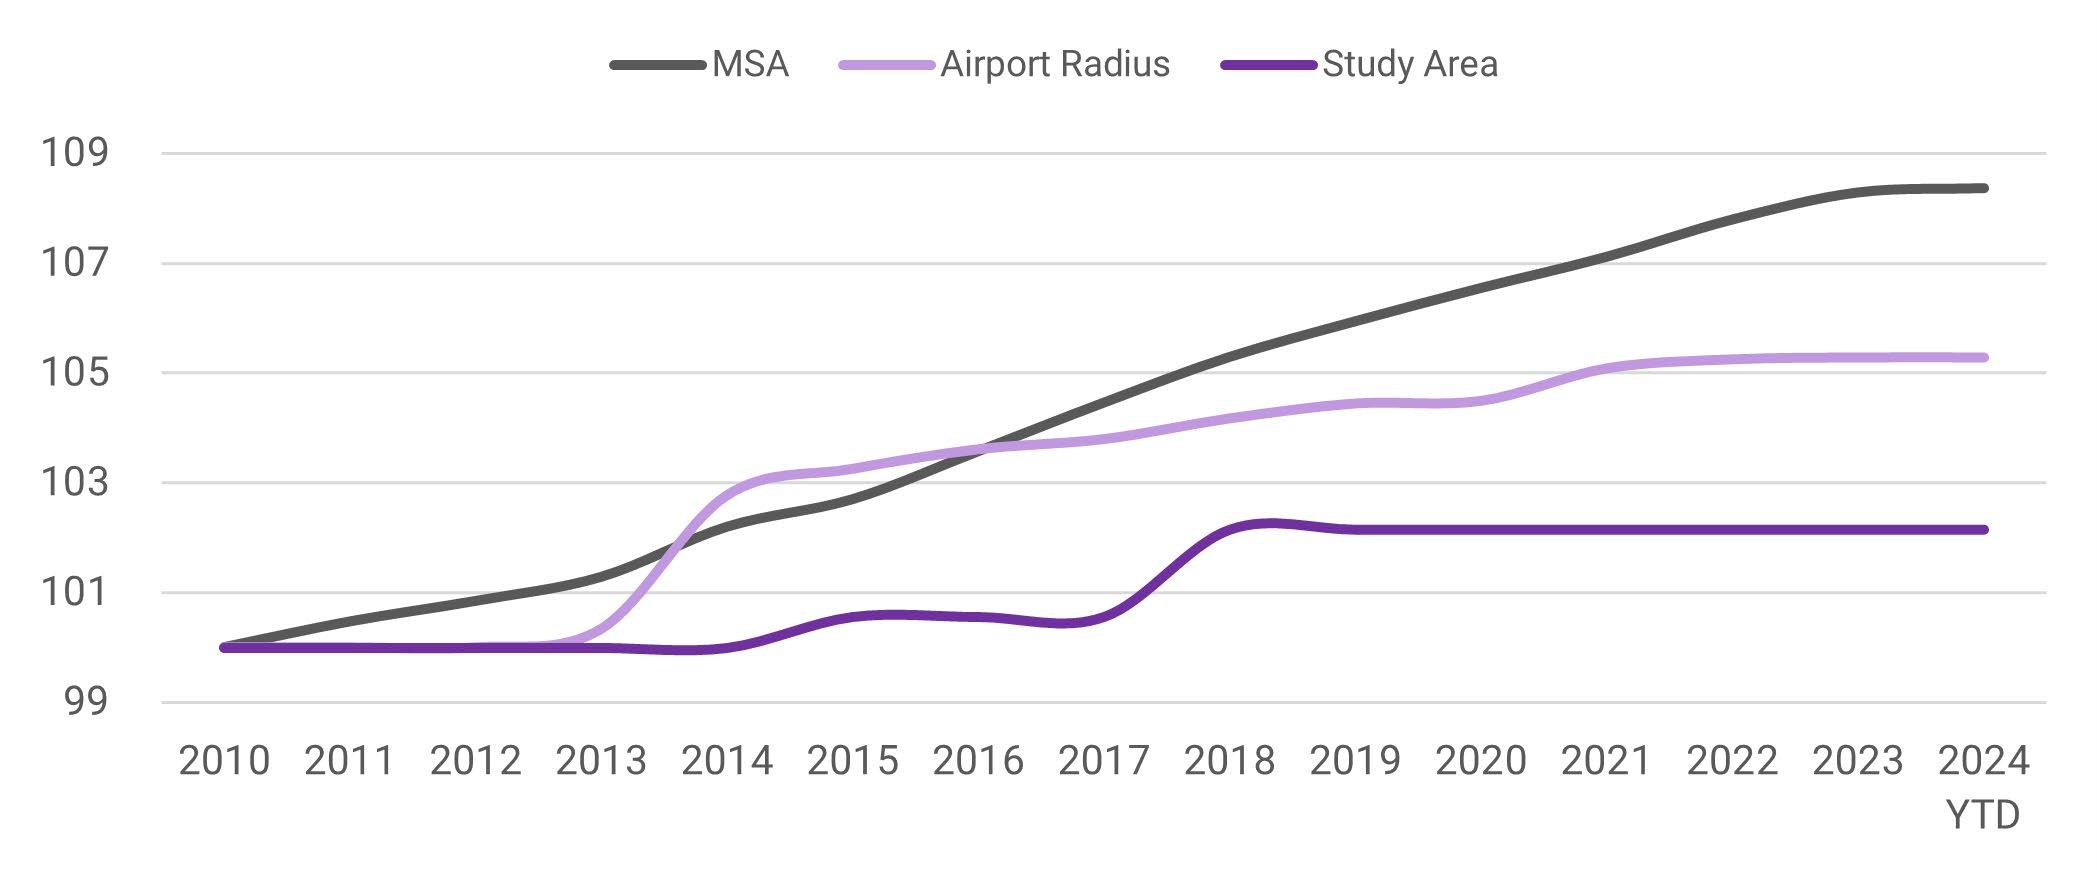
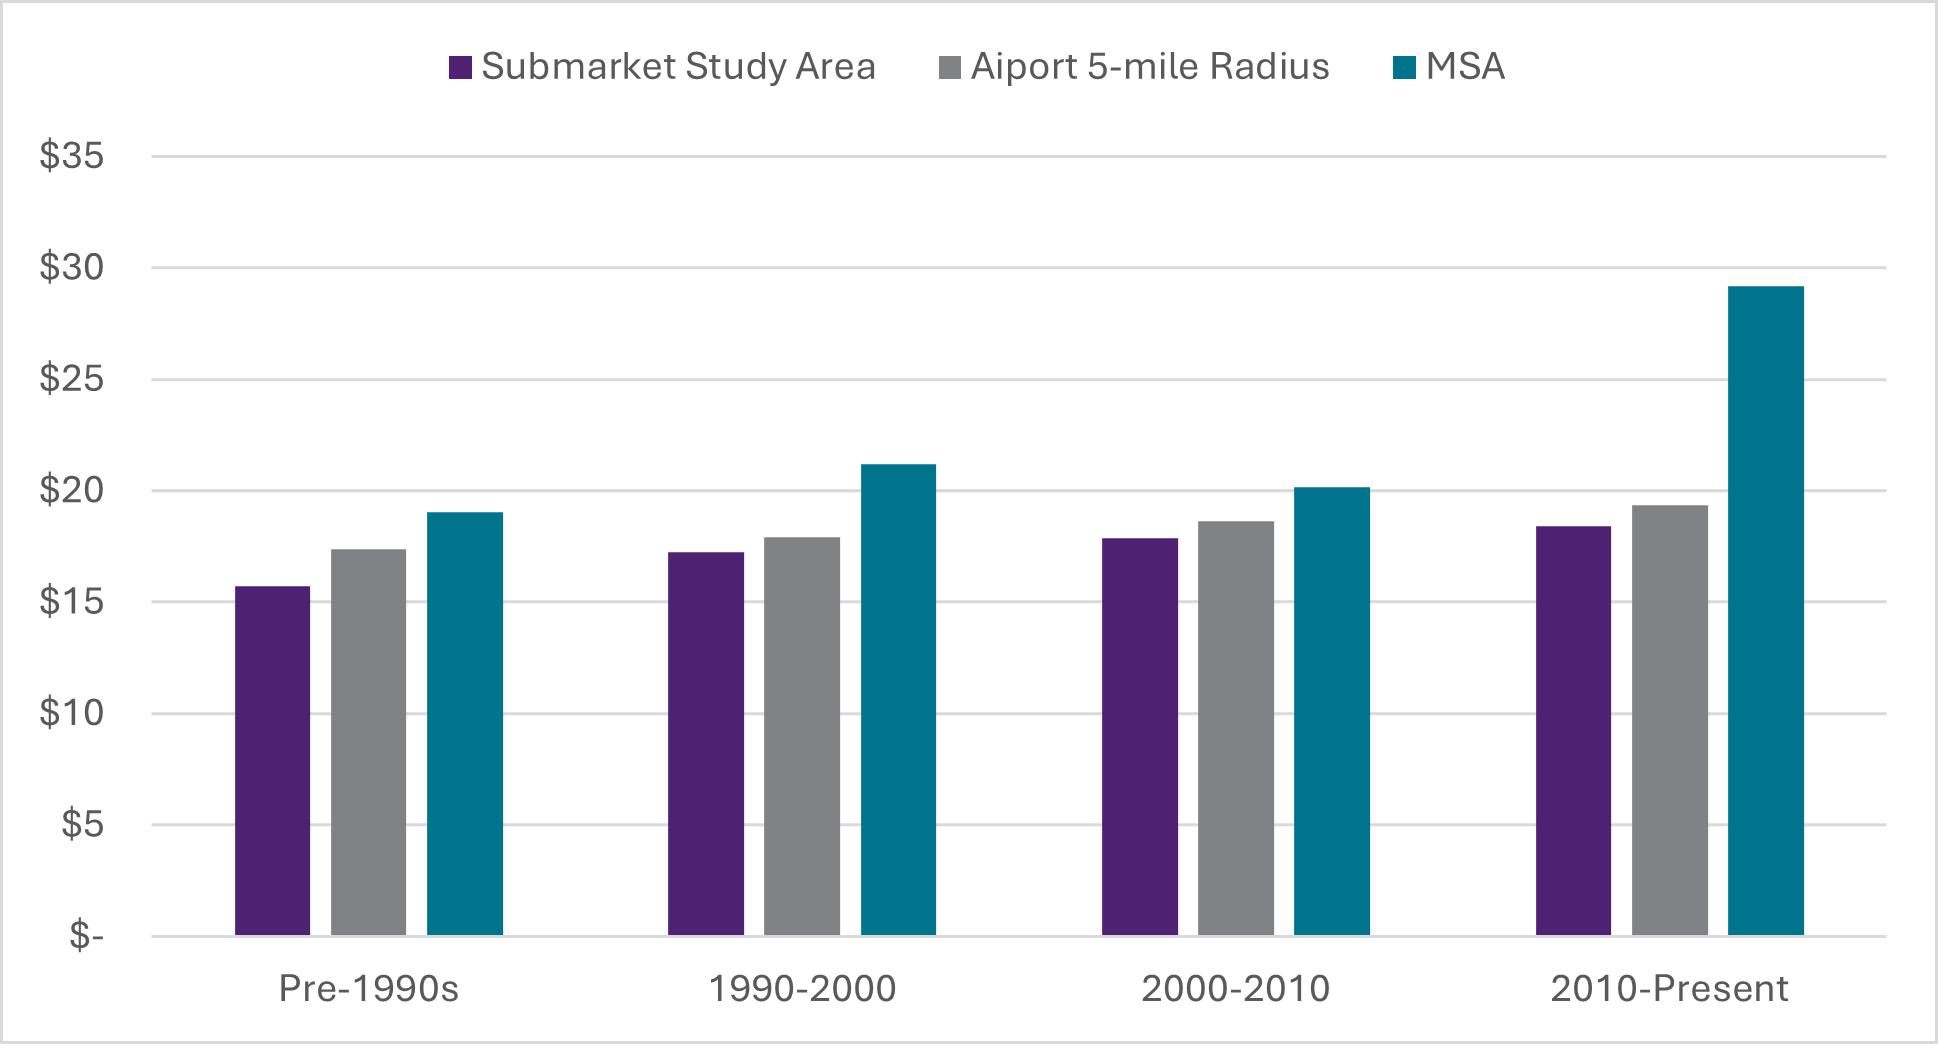
C-25: Retail Rent Growth % Over Baseline (Baseline=2010) (2010-2024 YTD)
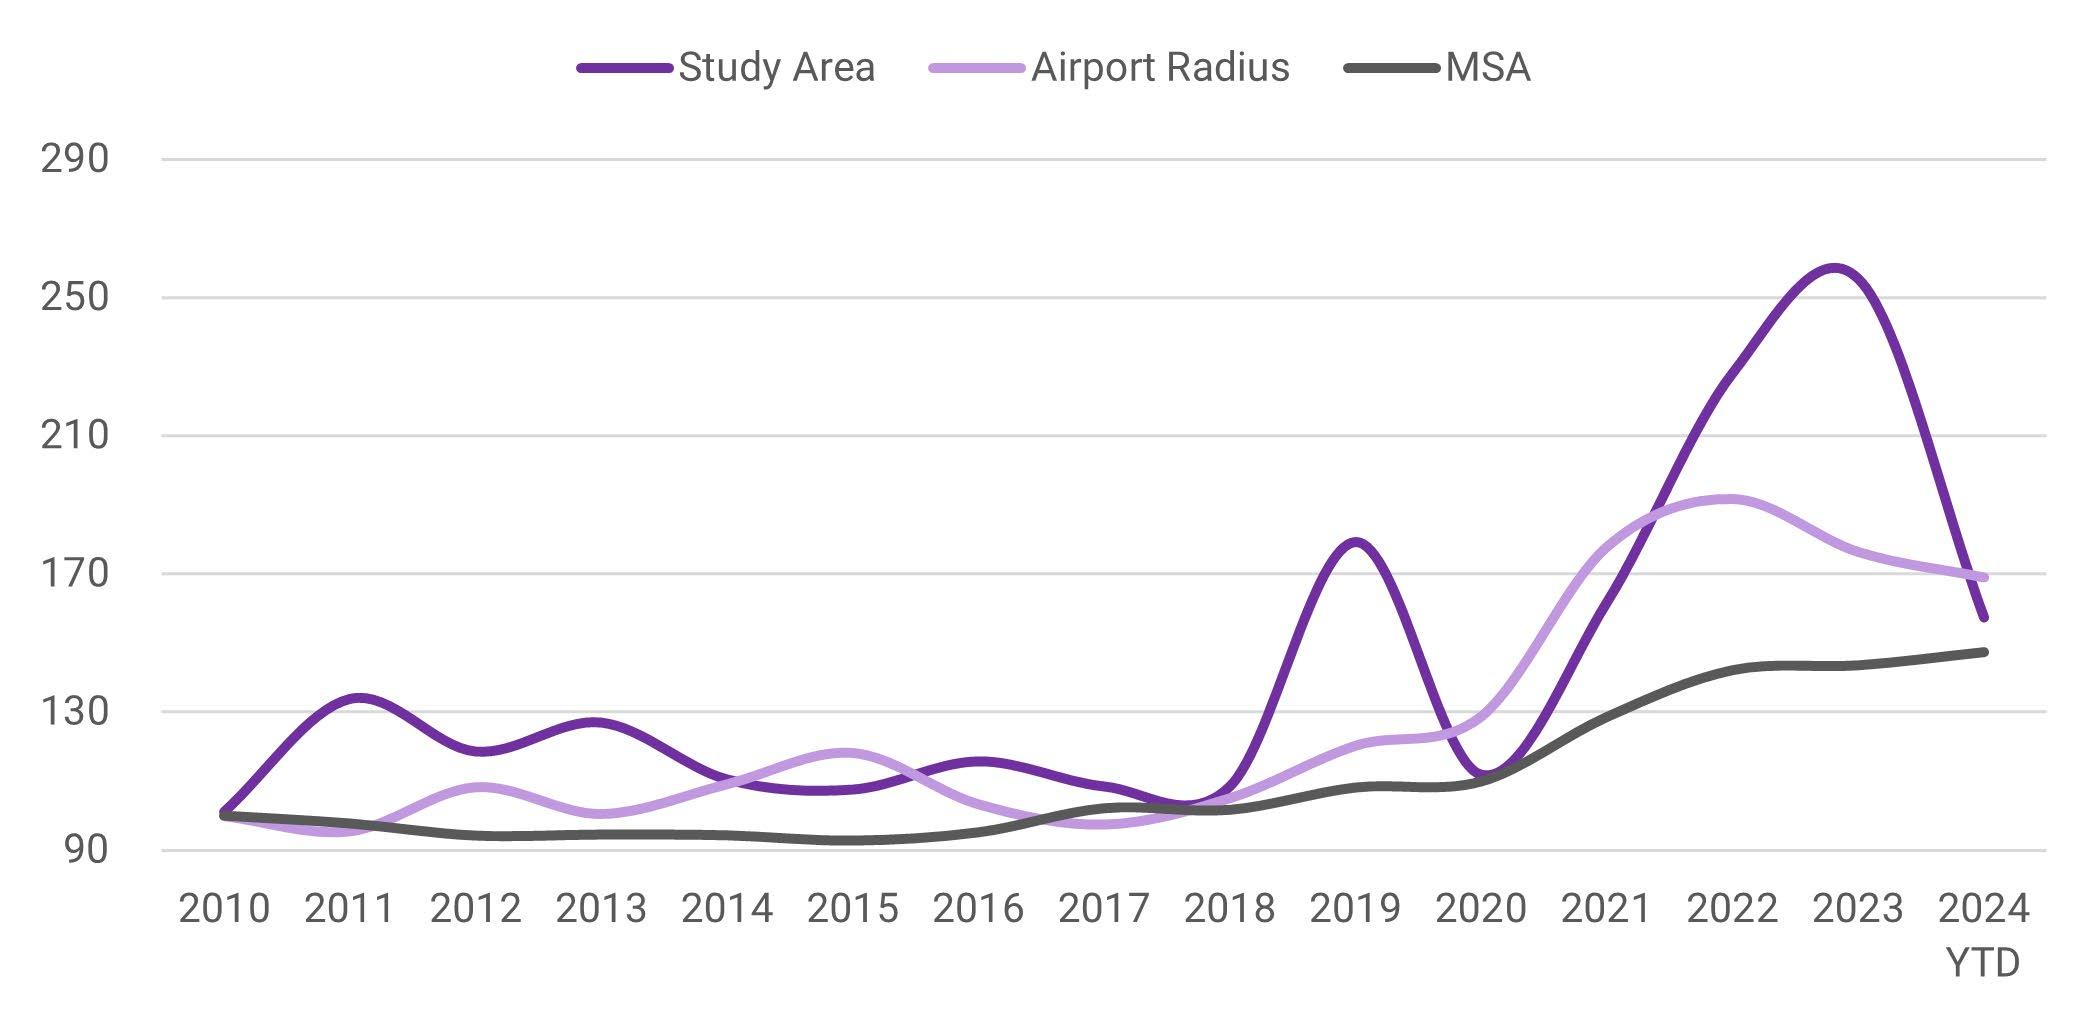
C-26: Retail Vacancy (%) (2010-2024 YTD)
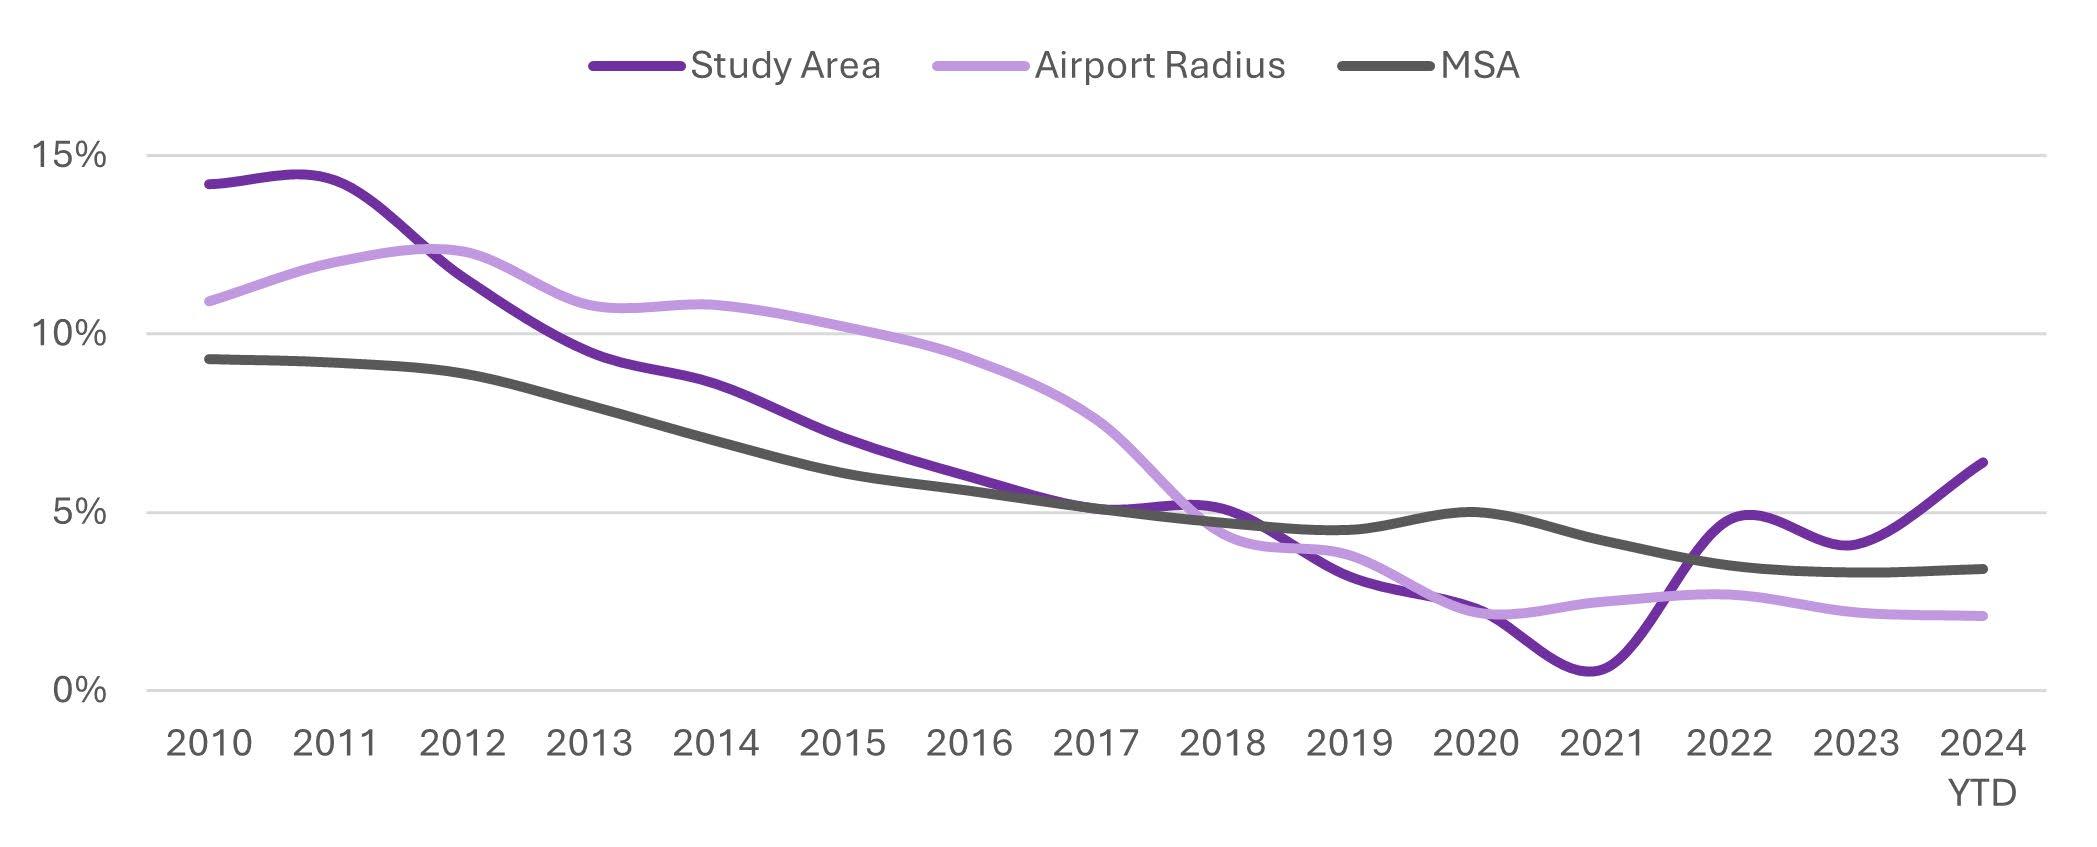
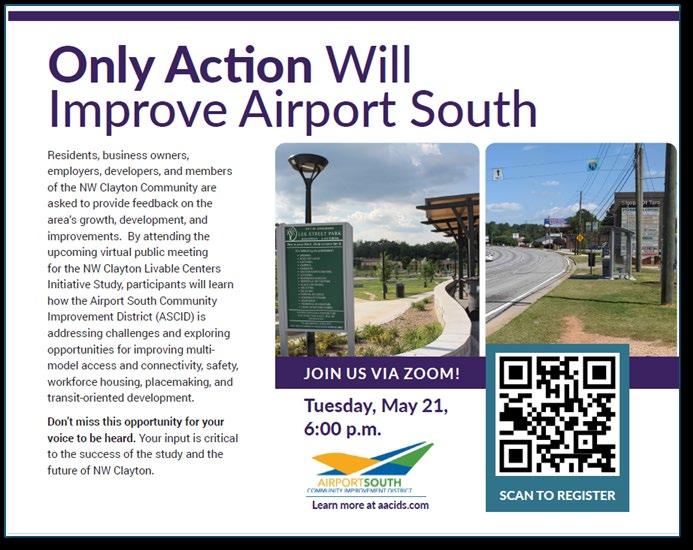
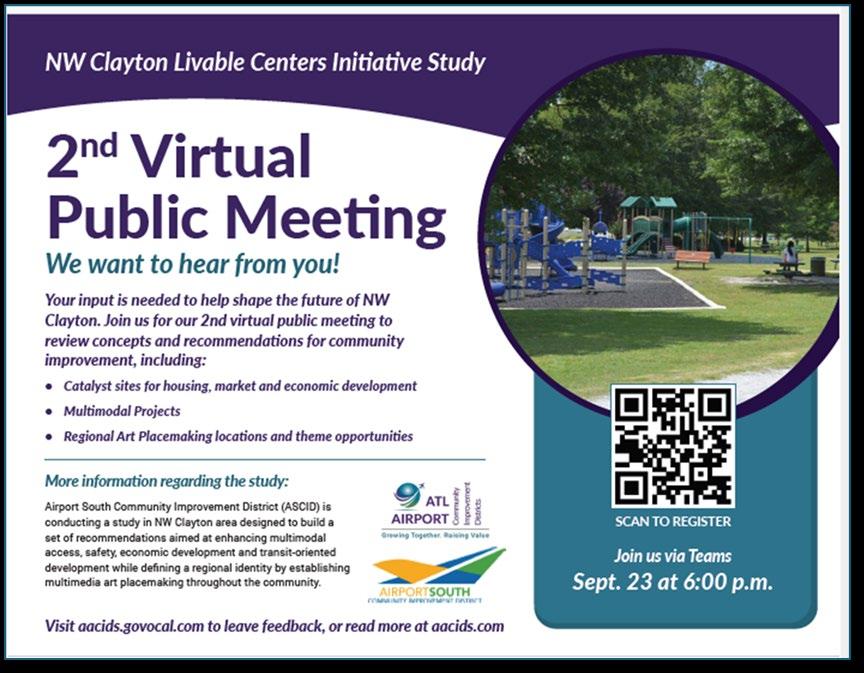
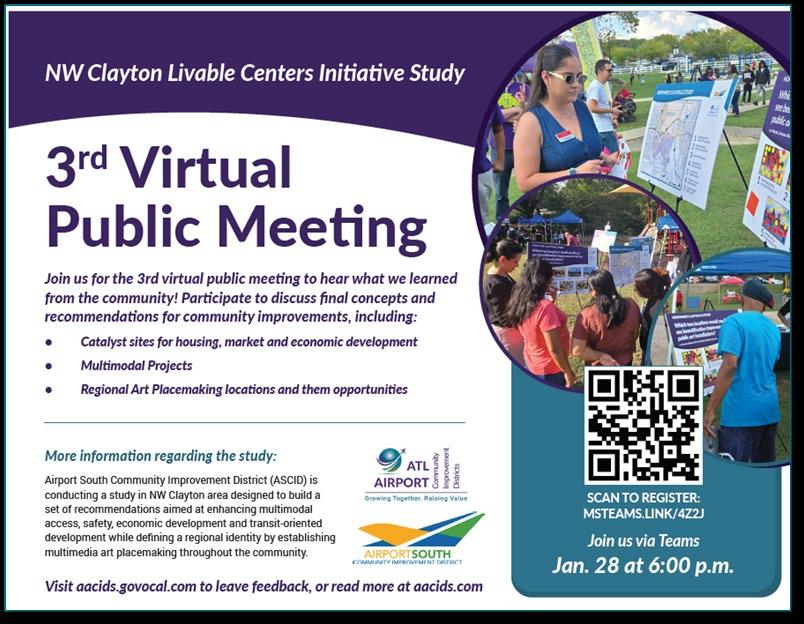
D-7: Social Media Graphics
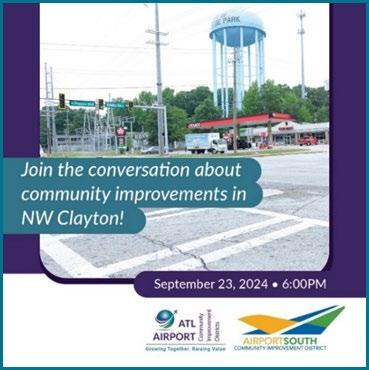
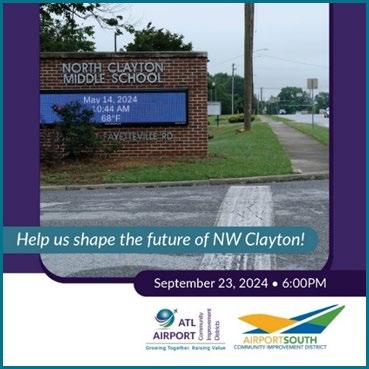
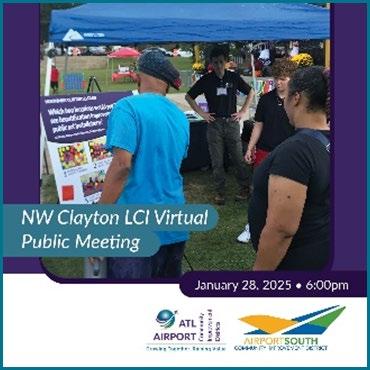
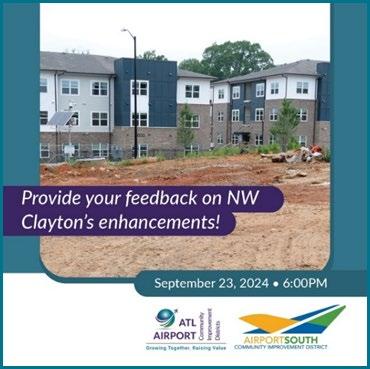
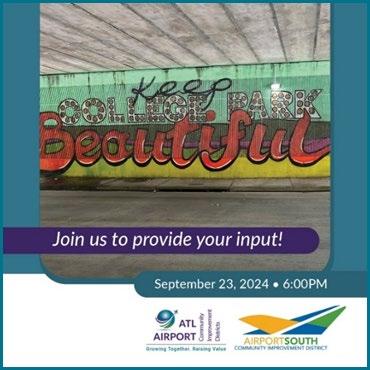
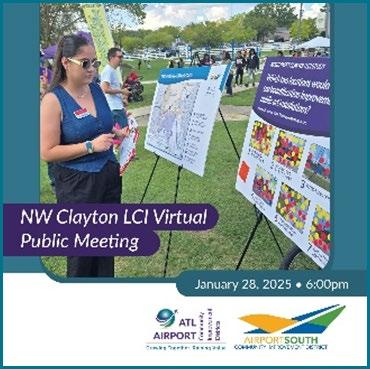
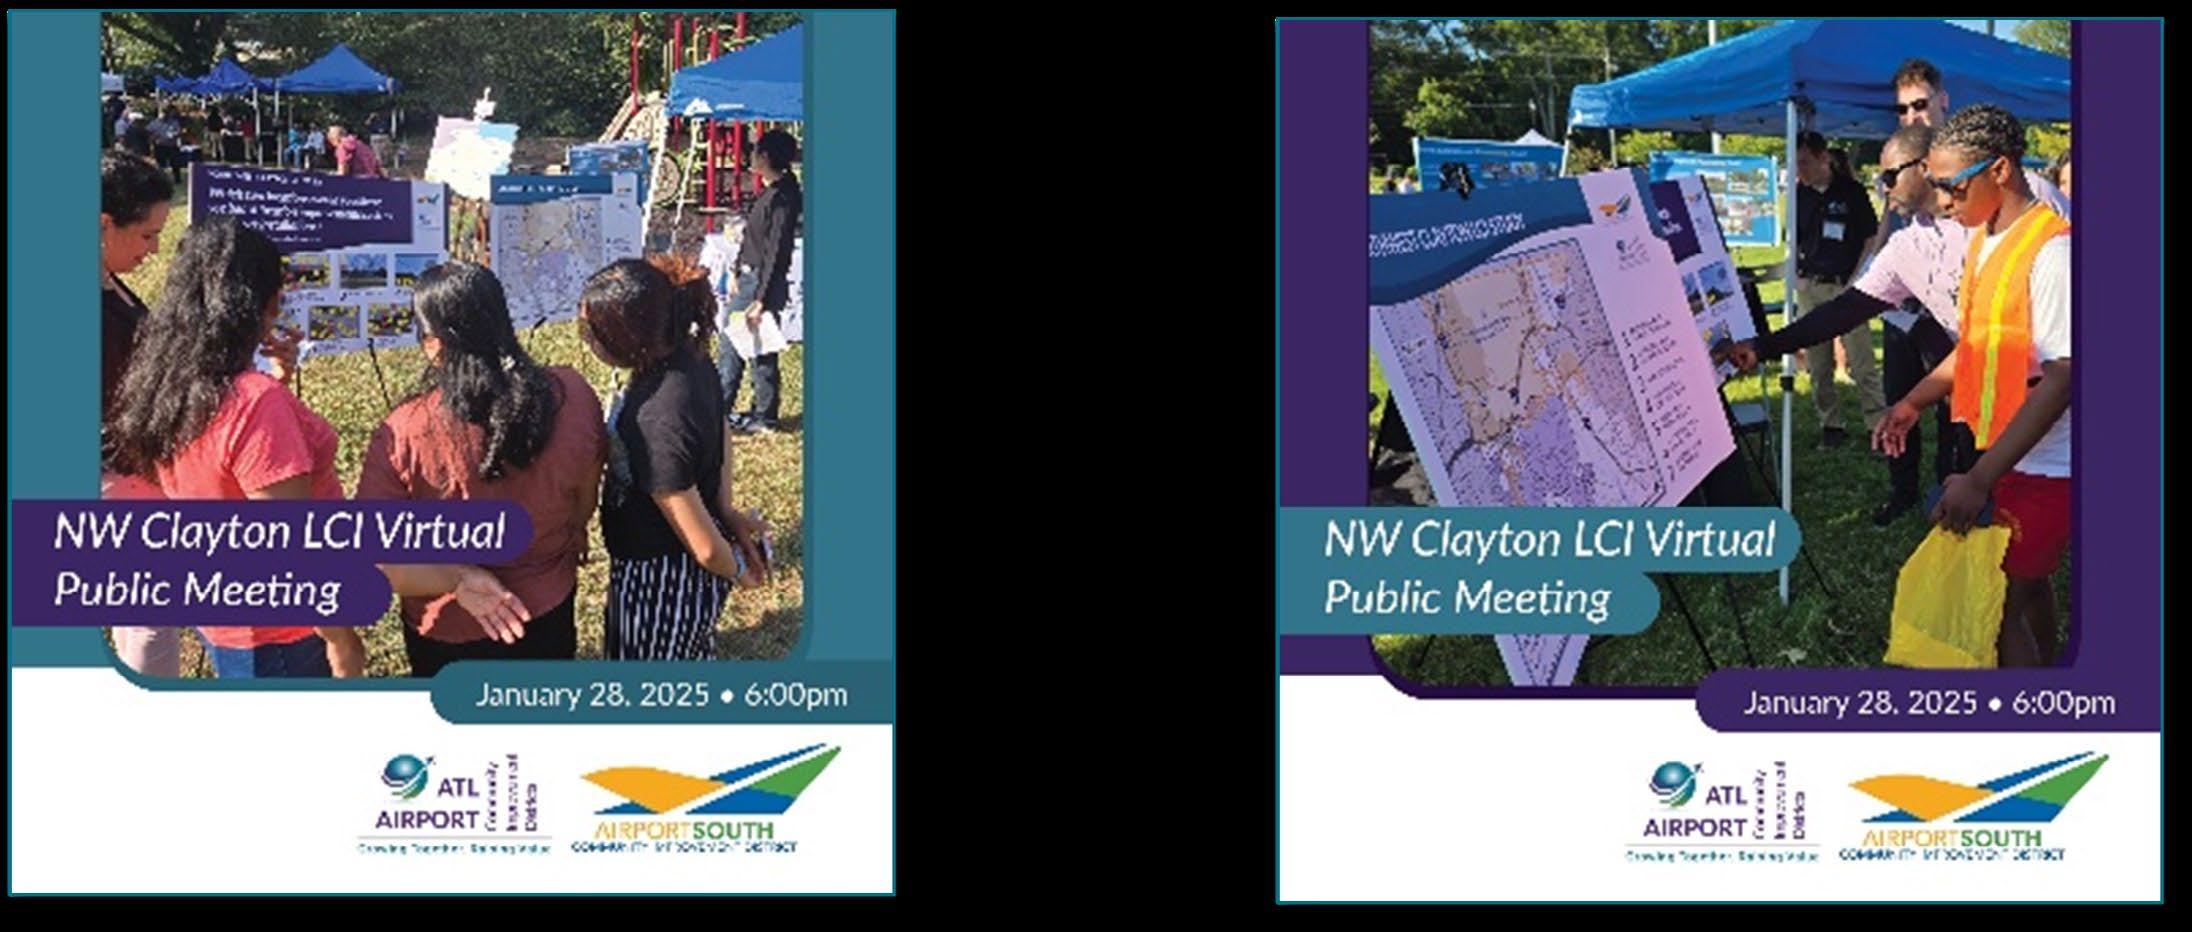
Figure D-9: Media Advisory for Public Meeting
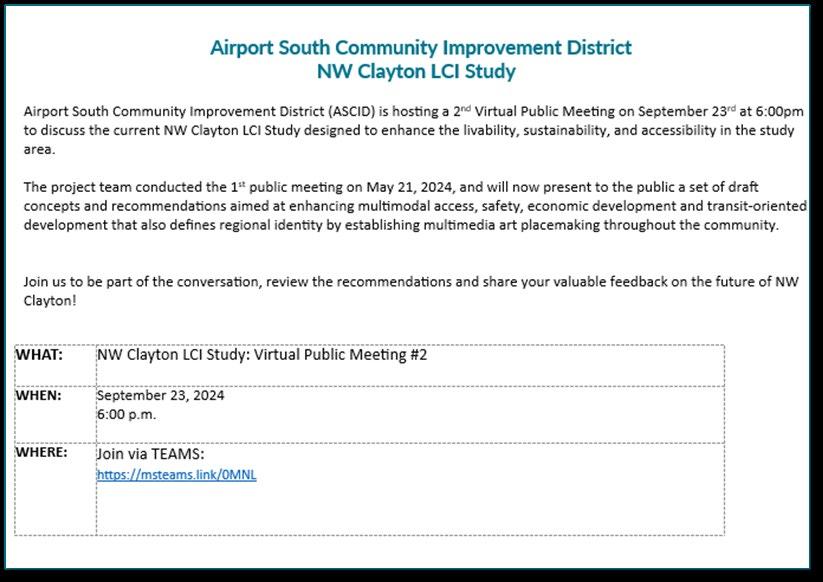
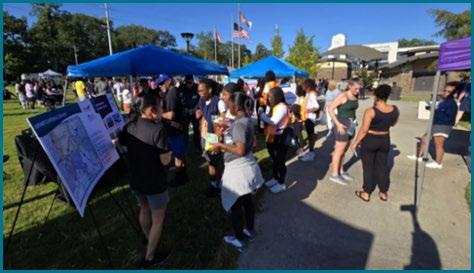
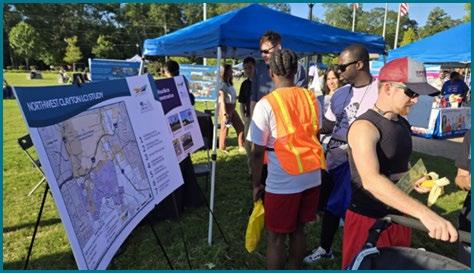
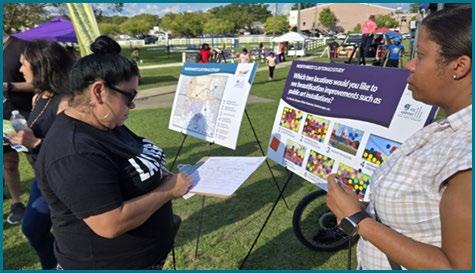
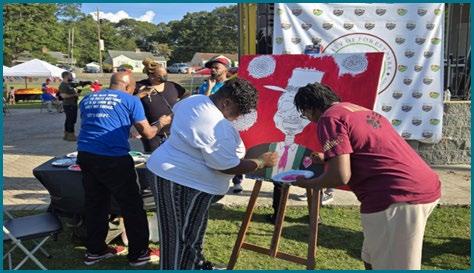
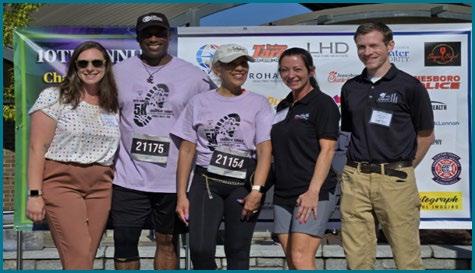
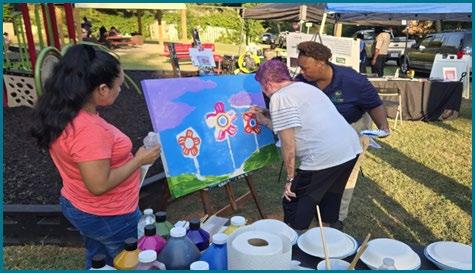
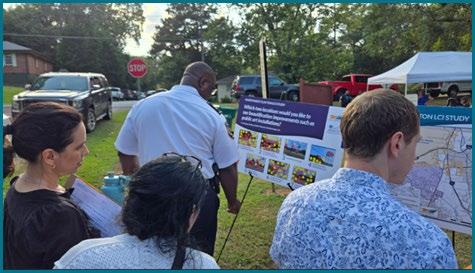
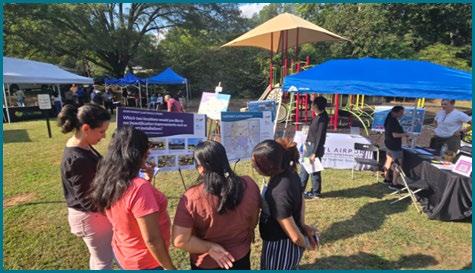
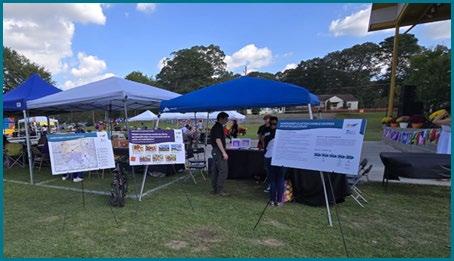

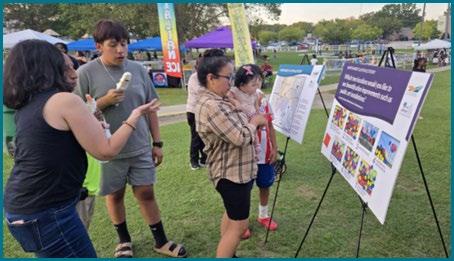
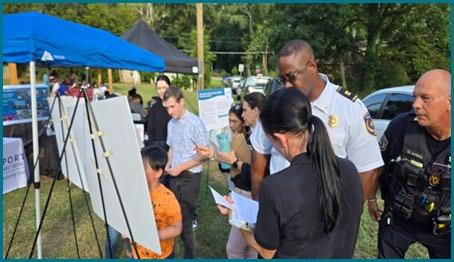
D-12: Project Overview Board
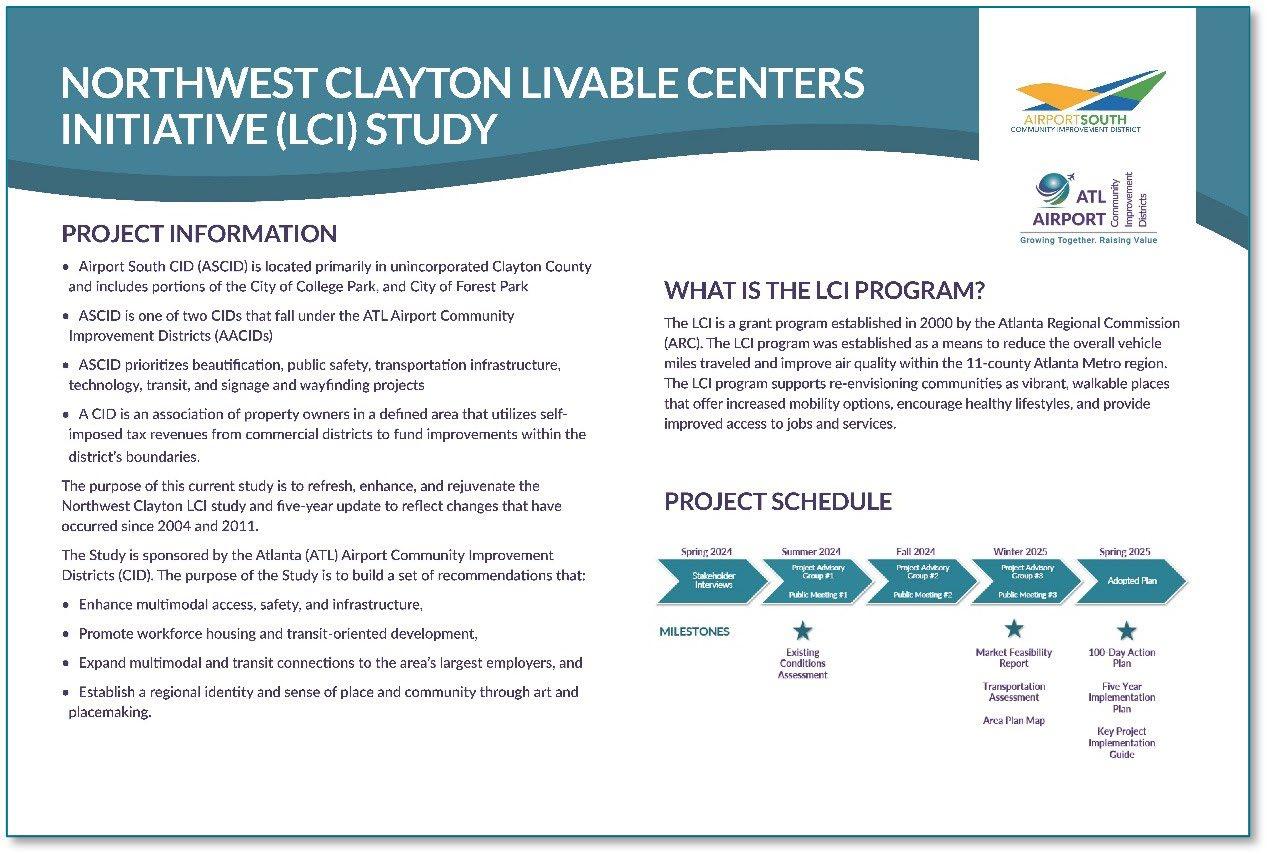
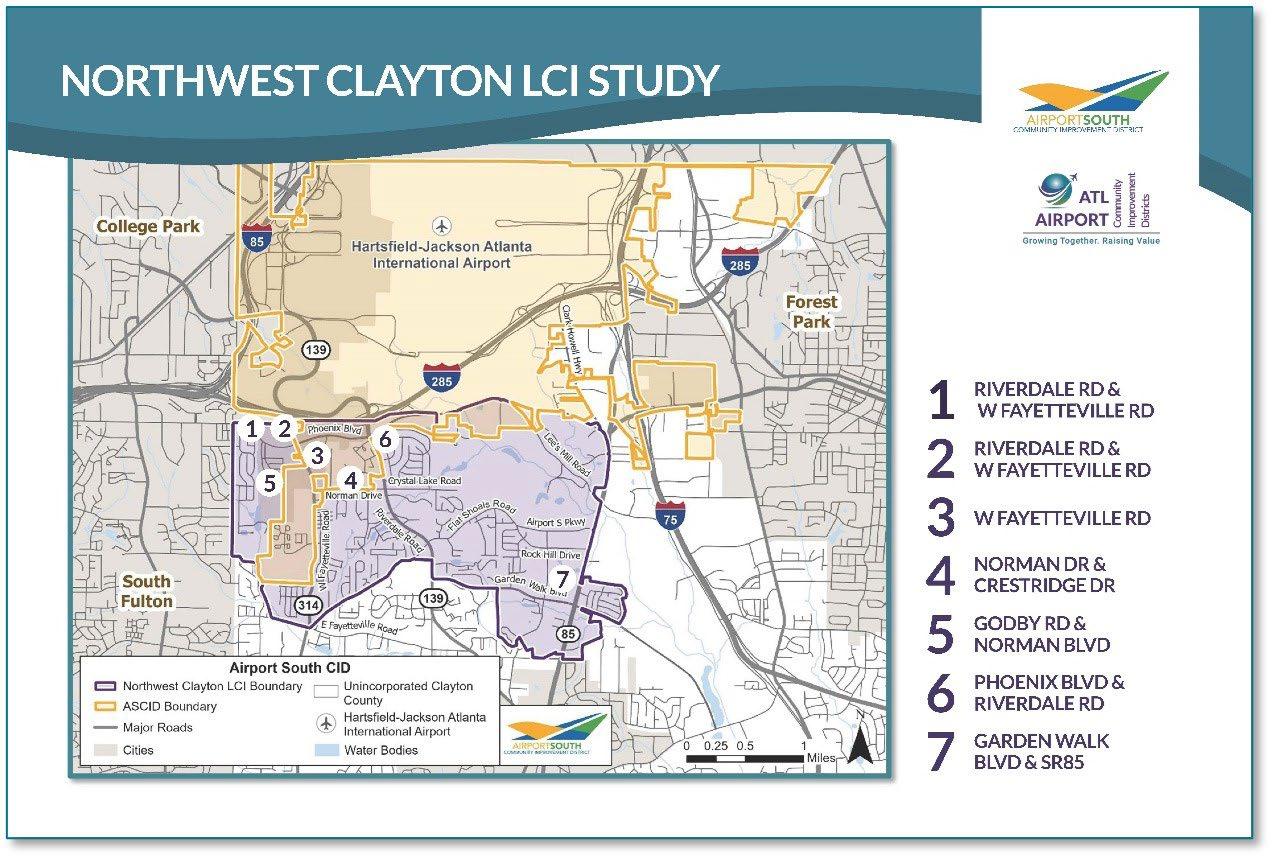
D-14: Intersections for Beautification with Images Board
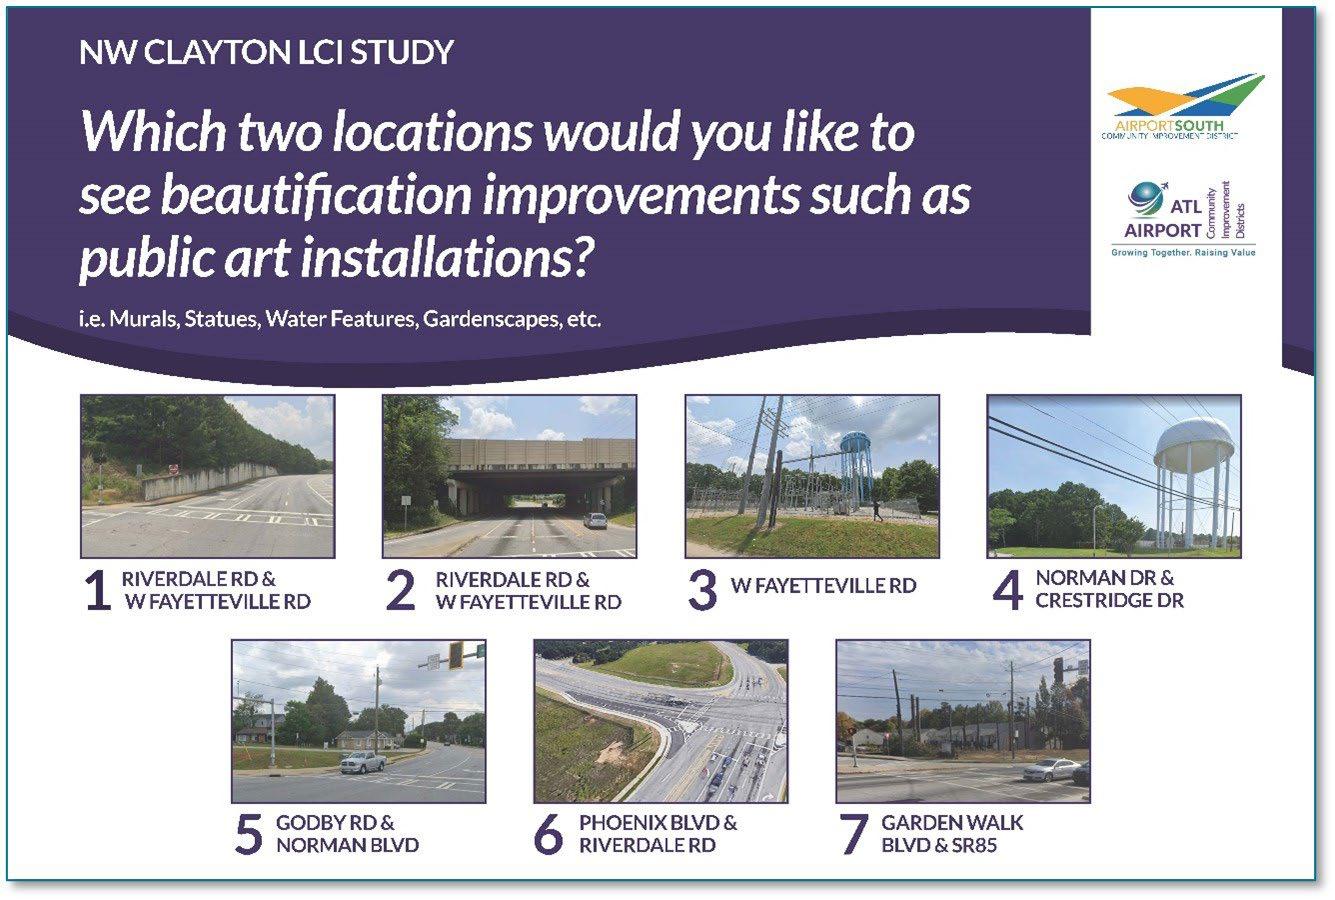
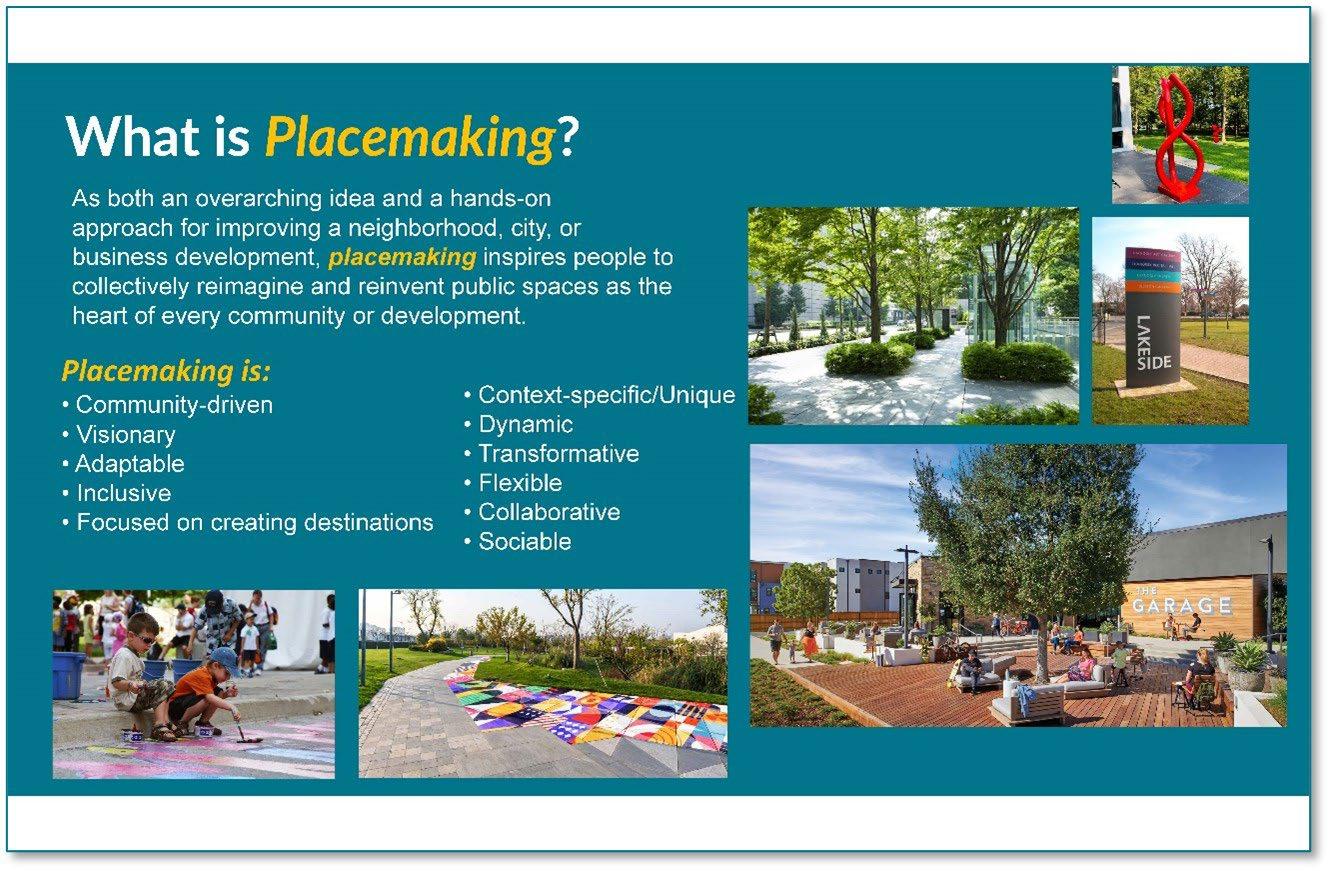
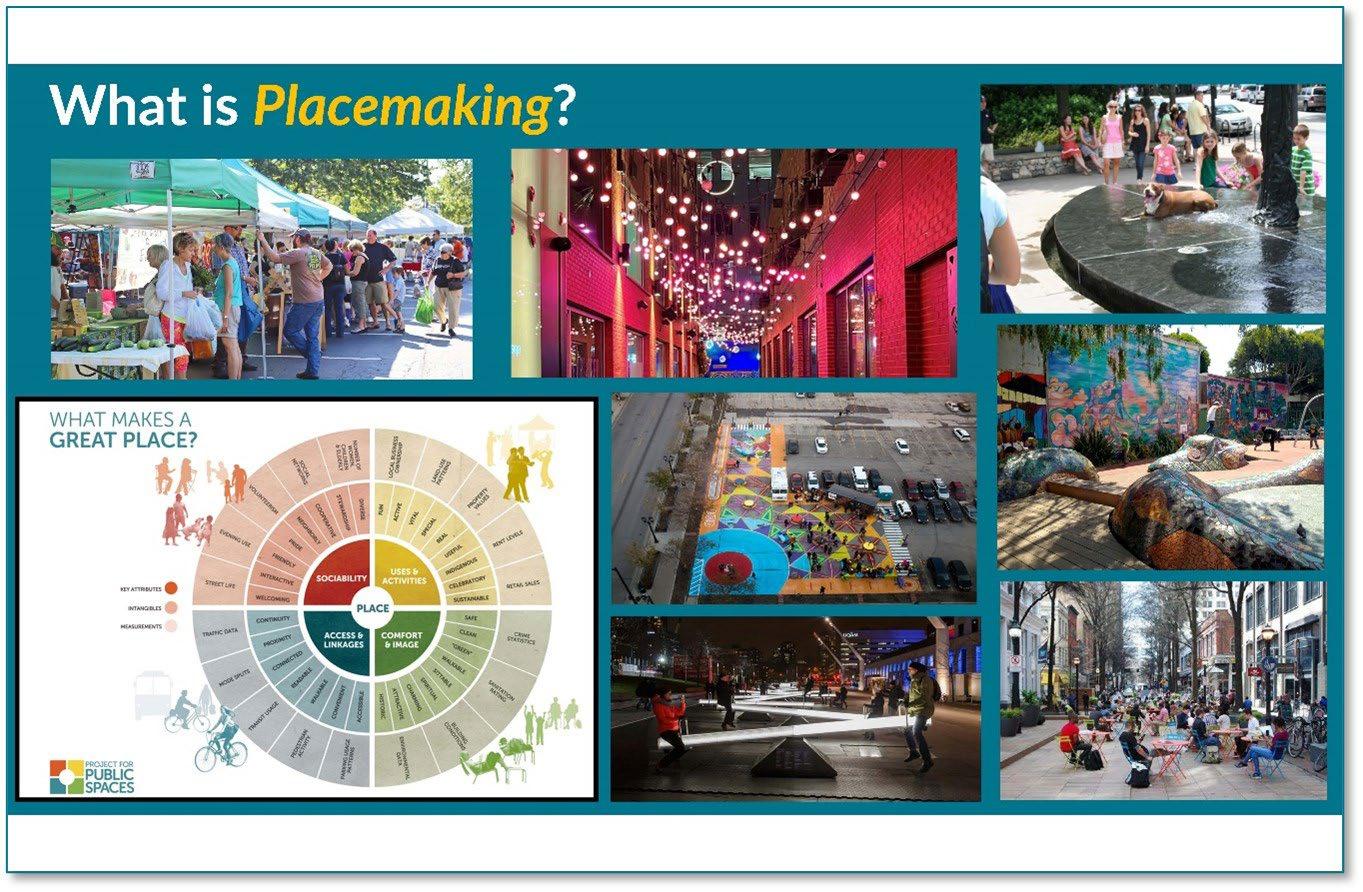
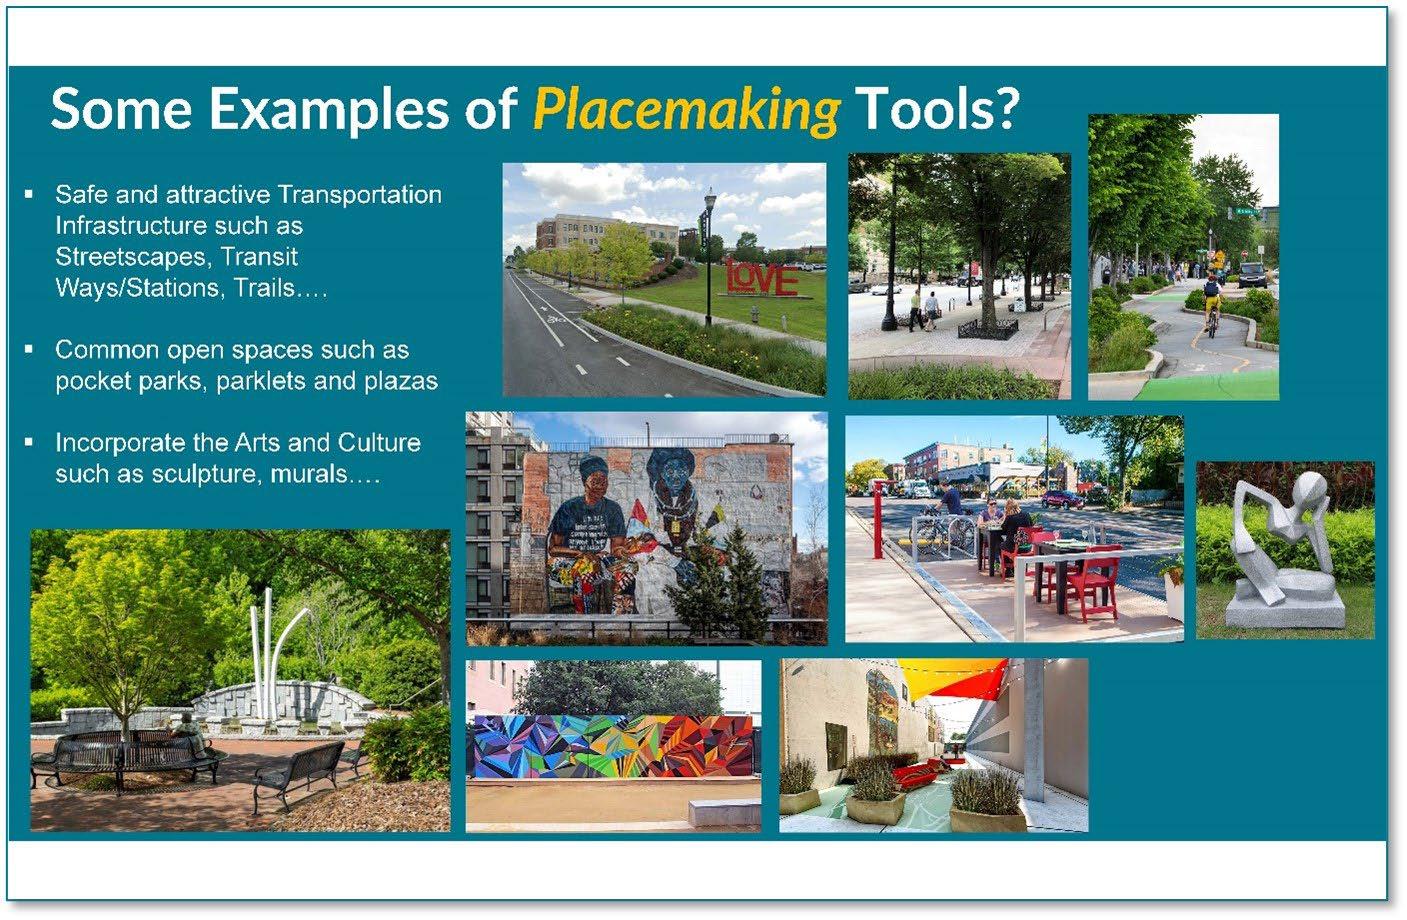
D-18: Additional Pop-Up Board: Some Examples of Placemaking Tools? (Cont.)
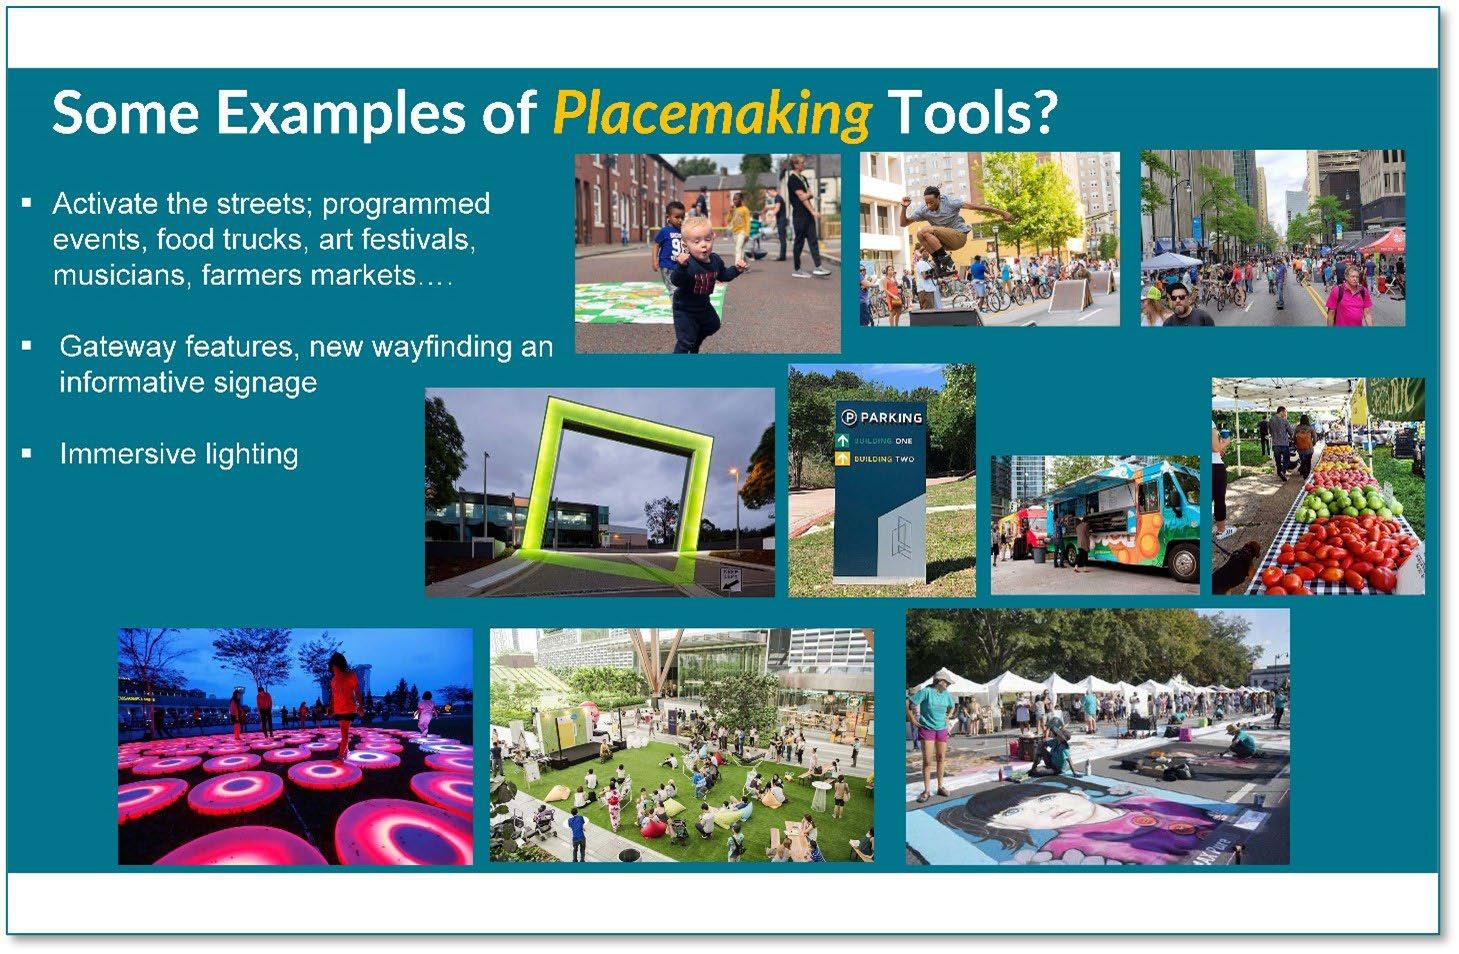
Yard Signs
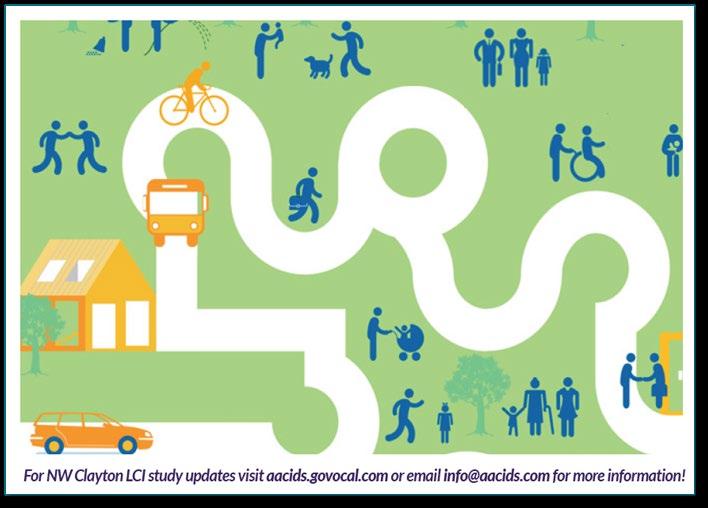
Figure D-22: Screenshot of Online Public Survey
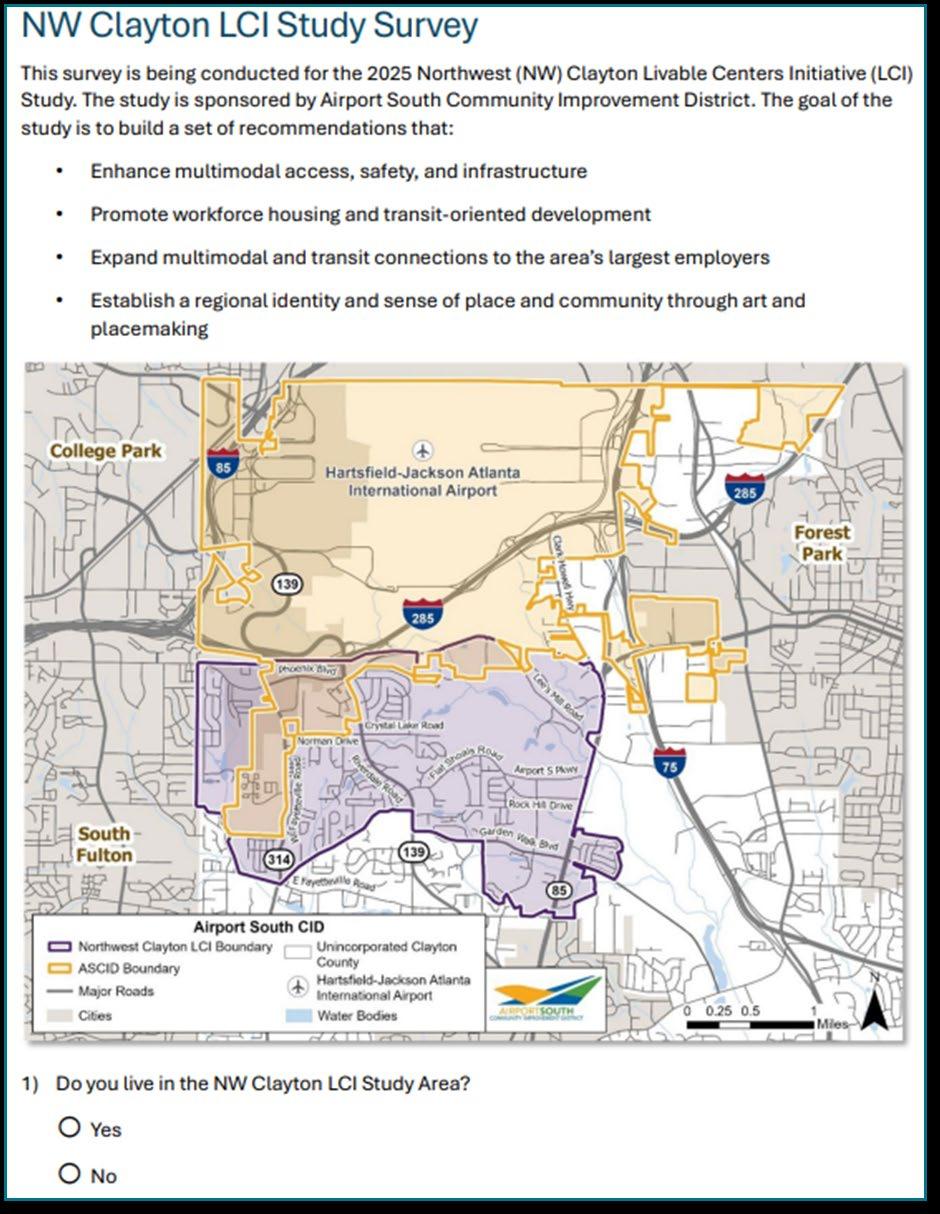
Table E-1: Number of Vehicle Crashes by Route/Intersection and
RAMP FROM I285 (TO SR 139) IR
FROM I285 (TO SR 139) IR W