+1 309 316 7929


+1 309 316 7929
Speak to a Cloud Professional
Many organizations face the challenge of scaling analytics to reach every employee and realize their analytics investments’ full potential and value
Also, the exponential amount of data organizations generate adds complexity for employees to use data in their roles.
According to McKinseyOrganizations these days are making investments of trillions to be more datadriven, but only 8% can successfully scale analytics to derive expected value from their data.
Tableau has been known for its excellent reputation as a flexible front end and intuitive visual interface But with more and more updates, data scientists are actively making the most of Tableau’s powerful tools to enable advanced analytics and predictive modeling.
We have helped our clients to leverage Tableau’s intuitive interface and complete sophisticated analytics projects in a fraction of the time
You can uncover several benefits while using Tableau for analytics and data visualization
Create interactive visualization using drag and drop functions
Handle millions of rows of data with ease and can go live to connect with data sources like SQL

Easily use other scripting languages like R or Python to perform complex calculations while avoiding any performance issues
We are using cookies to give you the best experience on our website. You can 몭nd out more about which cookies we are using or switch them o몭 in settings.
Quickly access the Tableau mobile app to enable mobility and keep statistics at your fingertips
Let’s look at how Tableau can help you level up your analytics game
The application is great to use and it consists of all features that people look for in an eSignature app.
You can combine the flexible front end of Tableau with powerful input capabilities to quickly test different scenarios and modify calculations.
The relevant parameters can help you drive calculations, alter filter thresholds, and select the data that will feed into the dashboard Parameters also help you achieve a smooth mechanism for interactive reporting.
Tableau allows you to access drag and drop segmentation to promote an intuitive flow and conduct rapid and flexible cohort analysis.
For example, some draganddrop operations and just a few calculated fields can allow you to create a dashboard that breaks down a country’s contribution to total sales across different product categories.
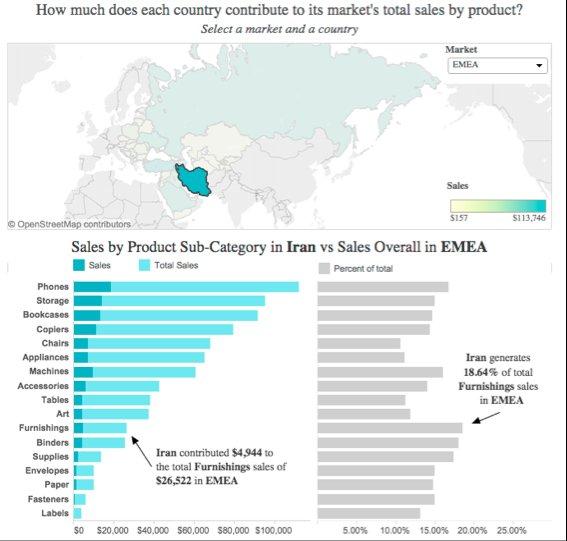
A dashboard that shows sales contribution by country and product
Tableau is so exciting because it contains out of the box predictive and stats technologies to enable experts to codify thesis and discover latent variables
Not only this, but Tableau has many native modeling capabilities like trending and forecasting It enables you to quickly add a trend line or forecast data to any chart and view details describing the fit with just a click
Tableau also allows you to drag and drop to model different groups with a single click. The best part is that these analytics are fully integrated into Tableau’s front end and can be easily segmented
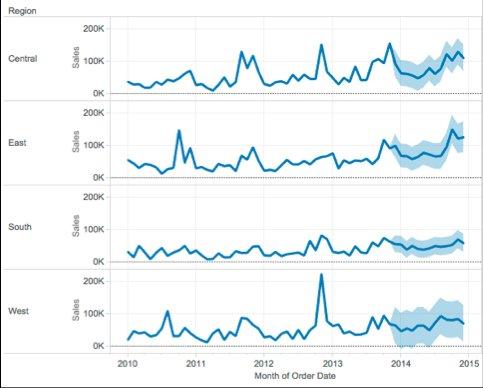
Forecasting predicts sales by region automatically
Tableau supports robust calculation language, making additions to your analysis easier You can do this with arbitrary calculations to perform complex data manipulations with concise expressions
Calculated fields allow you to express conditional logic, perform arithmetic operations, or run specialized operations on specific data types.
There are two key capabilities in Tableau that help to enable advanced analysis:
1. Level of Detail (LOD) Expressions
2 Table Calculations
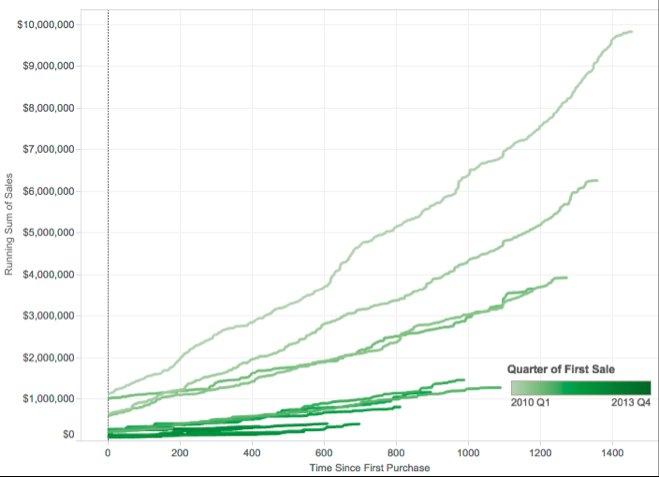
The LOD Expression is used for calculating the running sum of total sales by the 몭rst
quarter of the purchase date.
Tableau natively supports rich timeseries analysis. It allows you to explore seasonality, perform common time series operations, and sample your data within a robust user interface
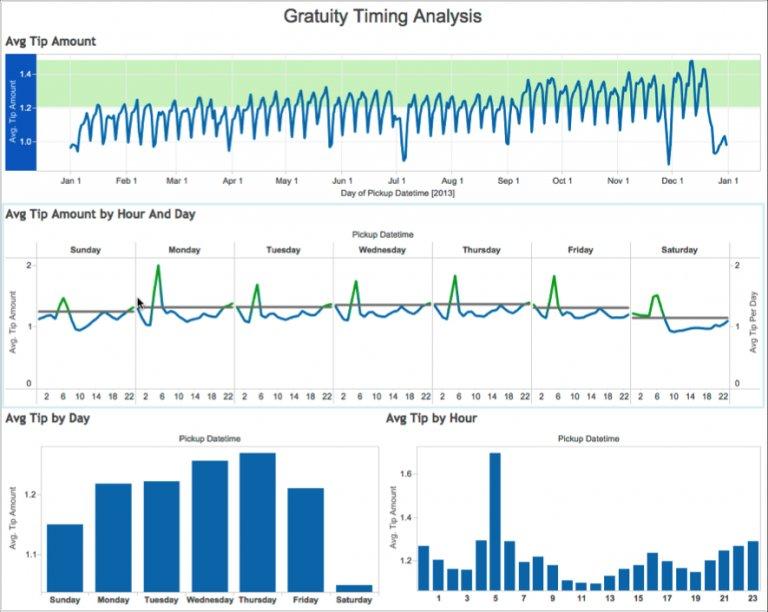
We’ve shared a visualization below showing the tipping patterns from taxi rides in New York City You can easily adjust the sampling and discover interesting patterns within the recorded data
You can view the entire time series sampled by an arbitrary window or disaggregate the data with a single click Tableau also allows you to quickly change aggregation frequencies to find patterns for different timescales or even view quarter over quarter or yearoveryear sales growth.
Down sampling intraday data helps to reveal possible insights about tipping patterns: For this example, it shows drivers should consider working at night!
With the R plugin, you can access the power and ease of using Tableau’s front end while allowing experts to handle nuanced statistical needs and leverage prior work in
while allowing experts to handle nuanced statistical needs and leverage prior work in other platforms
Using web API, Tableau can connect to a Rserve process and send data to R
Tableau visualization engine returns the result to Tableau for use This enables a Tableau user to manipulate models created in R with Tableau or to call any function available in R on data in Tableau
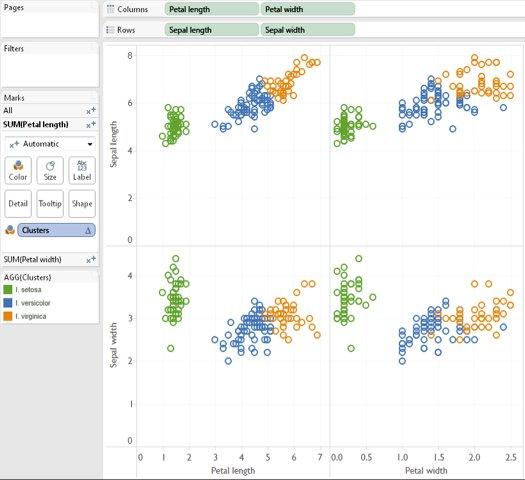
The image shows a class k means clustering example.
Indeed, analytical habits don’t change overnight. It’s natural to want to use traditional methods as a flexible, low cost method for analytics that you have been using for years, but we must recognize their limitations
But suppose you genuinely seek a way to reduce the number of analytic reports you have been creating. In that case, you need to work on building a more robust and flexible analytics environment using Tableau


 Summit (Platinum) Partner