PORTFOLIO
yiming han
URBAN RESEARCH, PLANNING AND DESIGN
07/03/1999
hanym18101963871@gmail.com
+86 18101963871
EDUCATION
The Hong Kong University of Science and Technology (Guangzhou)
Summer Program: Red Bird Challenge Camp Phase Two Camp
The University of Sheffield
Master of Urban Planning and Design
Accumulate score average: 71.9/100, Awarded Victoria Henshaw Prize for Contributions to City Liveability.
Shanghai University
Bachelor of Urban and Rural Planning (城乡规划)
Accumulate score average: 86.15/100, Awarded the Outstanding Graduate.
SKILLS
WORK EXPERIENCE
Homoo Urban Planning and Design Co. Ltd
Planning and Design Assistant
National territory development plan, field research, urban regeneration
China Shanghai Architectural Design & Research Institute Co. Ltd
Intern of Architectural Design
Jul
CONTENTS
"Silver Hair Route" "Celestial Cradle"
Open space design, facade design, urban extension design Jul 2023
PRACTICAL EXPERIENCE
National Innovation and Entrepreneurship Training Projects of China
Research on the impact of the elements of rural characteristics on their featured industries and ecological environment assumptions under the Rural Revitalization Strategy
Research on the Situation and Evaluation of Rural Habitat Environment--Example of the Current Situation in Dongziguan Village, Zhejiang Province, China
Student Responsible Positions
Secretary of the General Branch of the Architectural Department
Deputy Minister of the Human Resources Department of the Student Union
AWARDS
Victoria Henshaw Prize for Contributions to City Liveability
The University of Sheffield
Shanghai University Outstanding Graduates Award

Shanghai University
China Environmental Protection Foundation
TOTO Water Fund University Scholarship
China Environmental Protection Foundation, Shanghai University
Shanghai University Academic Special Scholarship
Shanghai University
Age-friendly Cities and Communities - Designing an Age-friendly Public Realm in Manchester City Centre
2022, SHEFFIELD, UK URBAN RESEARCH, PLANNING AND DESIGN
Gas Factory Renovation & Future Healthy Community Design
2020, SHANGHAI, CHINA URBAN DESIGN
Urban analytics of Chicago and London based on GIS and Python Renovation and upgrade scheme for Suzhou River's north bank in Shanghai
2022, SHEFFIELD, UK URBAN RESEARCH
01 04 02 05 03
Territory development plan of Zhongguan Town, Zhejiang Province
2021, SHANGHAI, CHINA REGIONAL AND URBAN PLANNING
2020, SHANGHAI, CHINA
"Geo-visualisation" "Archipelago"
"Concentrate & Optimise Industries, Build a Literary Water Town"
SILVER HAIR ROUTE
Age-friendly Cities and Communities - Designing an Age-friendly Public Realm in Manchester City Centre
Category: Urban Research, Planning and Deisgn
Site Location: Manchester, UK
Postgraduate Design Dissertation: Individual Work
Instructor: Dr Bobby Nisha (The University of Sheffield)
Award: Victoria Henshaw Prize for Contributions to City Liveability
Duration: 03/2022 - 08/2022
Starting with the literature review, this project examines the characteristics of age-friendly spaces. It then uses primary data collection and site analysis of Manchester city centre to identify the attraction and challenges for older people when using public spaces. The project generated three strategies based on the different roles older people play in the city. After comparing and combining the three strategies, they were used in the planning and design of several public realms in Manchester city centre. The project has designed a "Silver Hair Route" to connect these public spaces, a route that promotes age-friendliness but welcomes all age groups in the city.
Introduction
There has been a positive global trend toward building age-friendly cities and communities(AFCC) since WHO’s 2007 recommendations for guidance on eight urban living areas for building AFCC (Organization, 2007). The research on AFCC in various countries has increased yearly, as reflected in the amount of literature published between 2003 and 2008 (Torku et al., 2021). Around the world, the phenomenon of ageing has become widespread, and its trend continues to deepen. According to the UN Population Profile, the elderly population in high-income countries is expected to increase to over 366 million by 2030 (Dixon, 2021). This is why it is essential to implement and promote the AFCC movement.
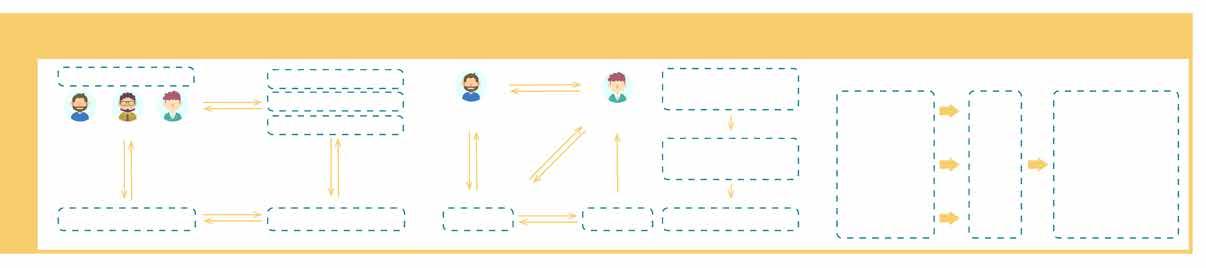
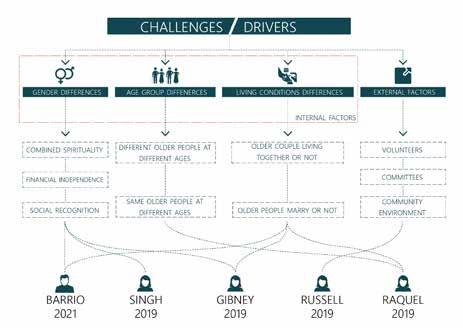
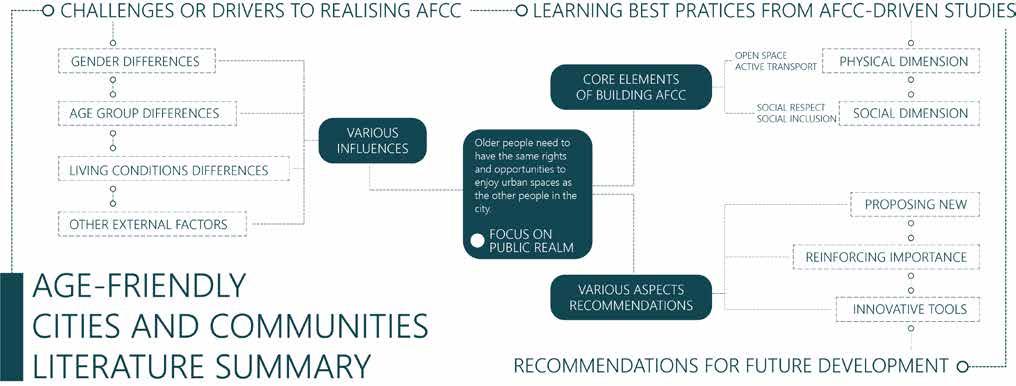
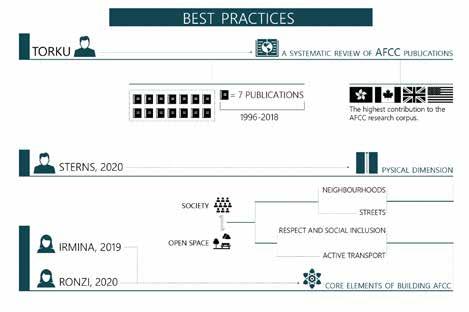
This review analysis summarises some key contemporary literature on the AFCC topic for 2007-2022. In comparing them, these research directions can be broadly divided into three key themes: learning best practices from the post-occupation analysis & AFCC-driven studies (Figure 1.1), mapping challenges to realising AFCC (Figure 1.2) and recommendations for future development in the AFCC research agenda (Figure 1.3). For publications before 2007, they are not considered because WHO has not proposed eight areas for building AFCC.
Conclusion >FOCUS ON THE PUBLIC REALM
In summary, the AFCC topic has been studied to some extent by academics in the context of global ageing and increasing digitalisation. However, promoting AFCC still requires collaboration and efforts from all sectors and the government. Older people need to have the same rights and opportunities to enjoy urban spaces as the other people in the city. While there are systematic recommendations for policy and operational mechanisms in the referenced literature, there is no guiding framework for designing an age-friendly urban public realm. This project will focus on the aspect of the public realm and attempt to offer suggestions for its promotion (Figure 1.4).
References
DIXON, A. 2021. The United Nations decade of healthy ageing requires concerted global action. Nature aging, 1, 2-2.
ORGANIZATION, W. H. 2007. Global age-friendly cities: A guide, World Health Organization.
TORKU, A., CHAN, A. P. C. & YUNG, E. H. K. 2021. Age-friendly cities and communities: A review and future directions. Ageing & Society, 41, 22422279.
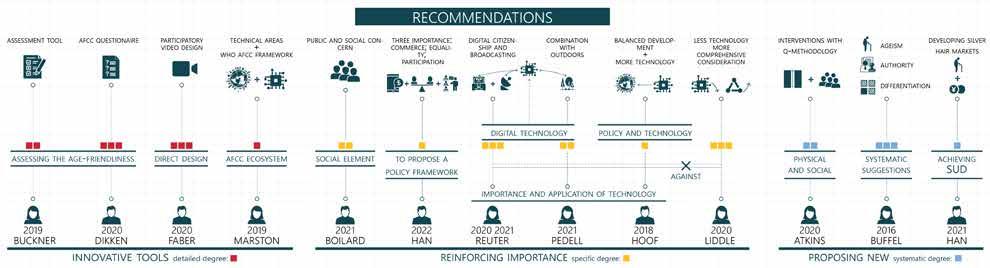 Figure 1.1 Mapping Challenges or Drivers to Realising AFCC Figure 1.2 Learning Best Practices From AFCC-driven Studies
Manchester, as the first UK city to join the global city network of Age-Friendly Cities and Communities established by the WHO, is actively promoting the Active Ageing Model recommended by the WHO. Manchester city centre is an important area for Manchester to achieve AFCC development. As global ageing continues to increase, the proportion of older residents in Manchester’s total population will increase yearly. The focus on AFCC will revitalise Manchester city centre and benefit the economic and social well-be`ing of the city.
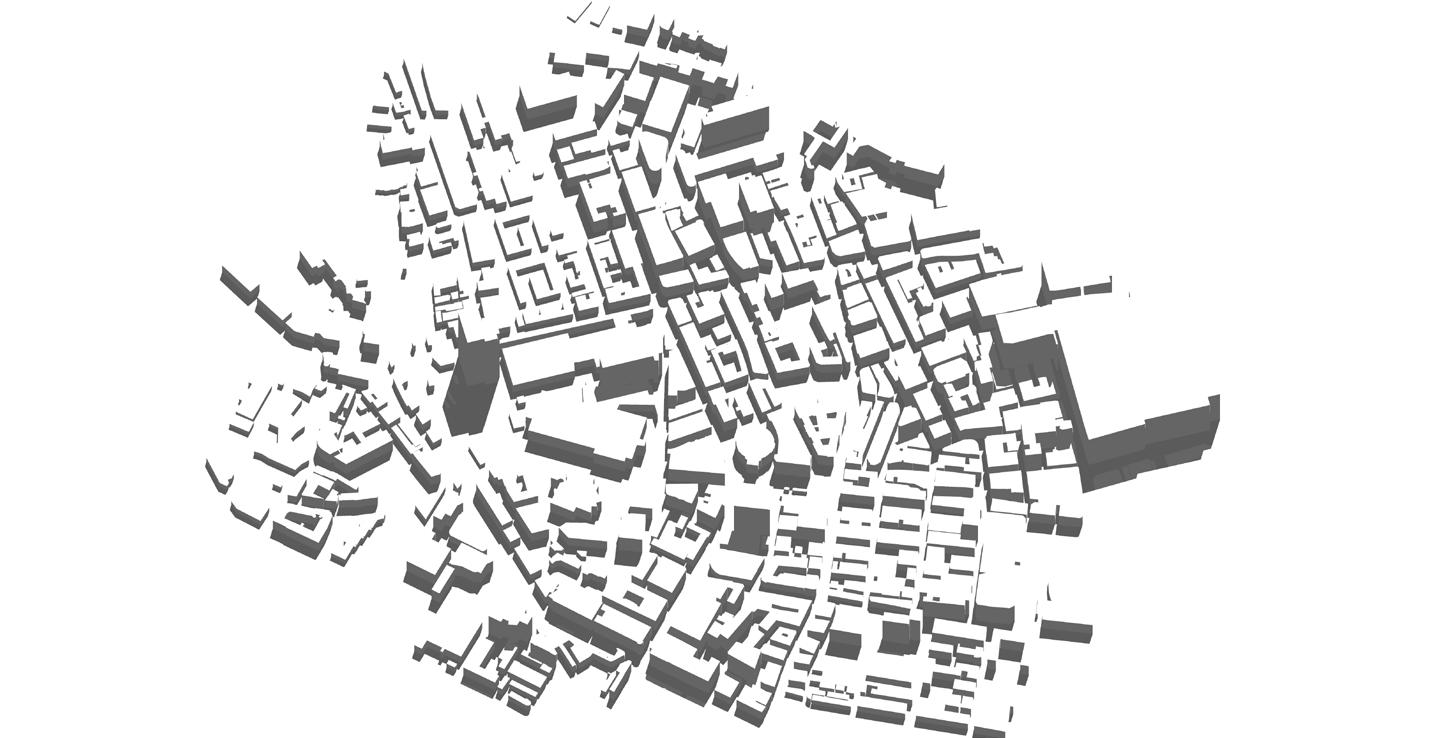
Manchester’s city centre, encircled by a mixed inner ring road, boasts high accessibility but potential congestion. It has high grain density with minimal vacant areas, mostly for transport, ensuring clear neighbourhood demarcation and efficient public space usage.
After the author’s pilot visit and observation, it was found that these neighbourhoods gave the author a very different feeling, and the main activities of the citizens were different. This helps the authors to analyse how Manchester can achieve age-friendly public spaces and streets in urban environments with different characteristics, respectively.
OFFICEBUILDING
older people were more likely to sit in a sunny place to relax than adults.
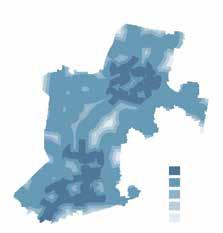
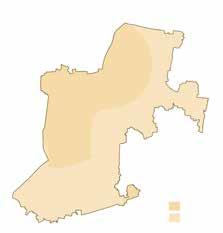
The analysis of urban design elements in Manchester and the evaluation of older people’s public spaces will help us identify problems in the city centre and provide a basis for subsequent urban design. The analysis will be completed through three levels: macro, midi, and micro.


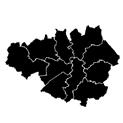
The macro level analyses Manchester city centre, which is the area bounded by the inner ring road. Midi level is an analysis of the main areas of the city centre, which are the Manchester neighbourhoods. Micro level is an analysis of the four neighbourhoods selected for the design section: Spinning fields, Civic Quarter, Chinatown and Petersfield.

Manchester city centre, enclosed by the inner ring road comprising primary roads and a motorway, is well-connected. A and B roads link the city centre to multiple areas and outer Manchester. The city centre offers excellent macro and midi-level accessibility to other Manchester parts, mainly via rail, tram, and train services connected through two major transport hubs, Piccadilly and Victoria. Thus enabling easy transit to other Manchester areas or other cities for older people.
This analysis selects several high-traffic plazas on these sites as the most activity space (MAS). This is because the author has observed that these spaces have the highest activity levels. The author recorded the type and number of activities during the field observations to analyse the behavioural patterns of the elderly and the age-friendliness of these two MAS.
(UNACCESSIBLE)
The proportion of older people in this district is very low compared to the rest of the population.
COMPLEXCONVENTION


MAS C is more vacant because there are few rest facilities and relatively low pedestrian traffic. However, there is a high proportion of older people.
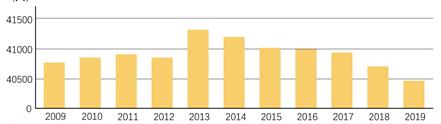
ONS data shows rising elderly population in Manchester, expected to grow possibly 20% in next decade. However, their proportion in total urban population will remain stable with minor increase.
Older people are concentrated in the eastern part of the square, where there is a semi-enclosed public space. Because older people would prefer a quieter location. The pavilion does not look safe and may make the elderly uncomfortable. Some undesirable behaviour, such as smoking marijuana, takes place in the pavilion.
PERMEABILITY AND POROSITY

SEMI-STRUCTURED INTERVIEW
1. HOW OFTEN DO YOU VISIT THIS PLACE? ACCESSIBILITY
2. DO YOU FEEL SAFE IN THIS PLACE?
SECURITY
General Perspectives
Most older people felt that these spaces were safe at all times, with only those in MAS E in Chinatown choosing to avoid the public space at night. Only a small proportion of the older people interviewed visit these MASs frequently.
3. WHAT ARE YOUR FAVOURITE THINGS IN THIS PLACE?
4. WHAT DO YOU THINK YOU DISLIKED THE MOST ABOUT THIS SPACE?
5. WHAT ELEMENTS WOULD YOU LIKE TO SEE ADDED TO THIS SPACE?
STRONG POINT WEAK POINT REQUIREMENT
Interview Questions Information and Point Obtained


FINDINGS AND CONCLUSION
12 FEMALE PARTICIPANTS
12 MALE PARTICIPANTS
5 QUESTIONS IN 5 MAS
Most older people consider benches and greenery (if available) their favourite elements.
Most older people are unable to identify what they dislike most. In general, they do not like staying in too open spaces.
The needs of older people for additional elements are varied, with most wanting more seating, landscaping and commercial services.
LEGEND
City Centre Boundary Sites Red Lines
Tram and Train
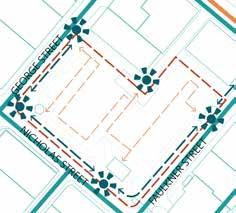
mas a in spinningfields
transport permeability [1]
pedestrian permeability [1]
buildings permeability [3]
Surrounding Blocks Neighbourhoods
total rating [6]
Survey Points/ Public Places
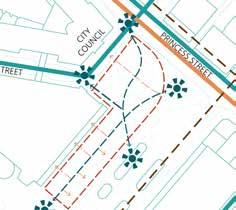
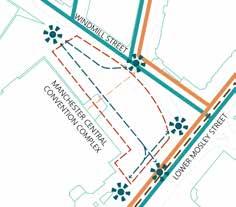
mas c in petersfield mas b in spinningfields mas d in civic quarter mas e in chinatown
vehicle routes permeability [1]
public transport permeability [1]
pedestrian permeability [1]
buildings permeability [3]
total rating [6]
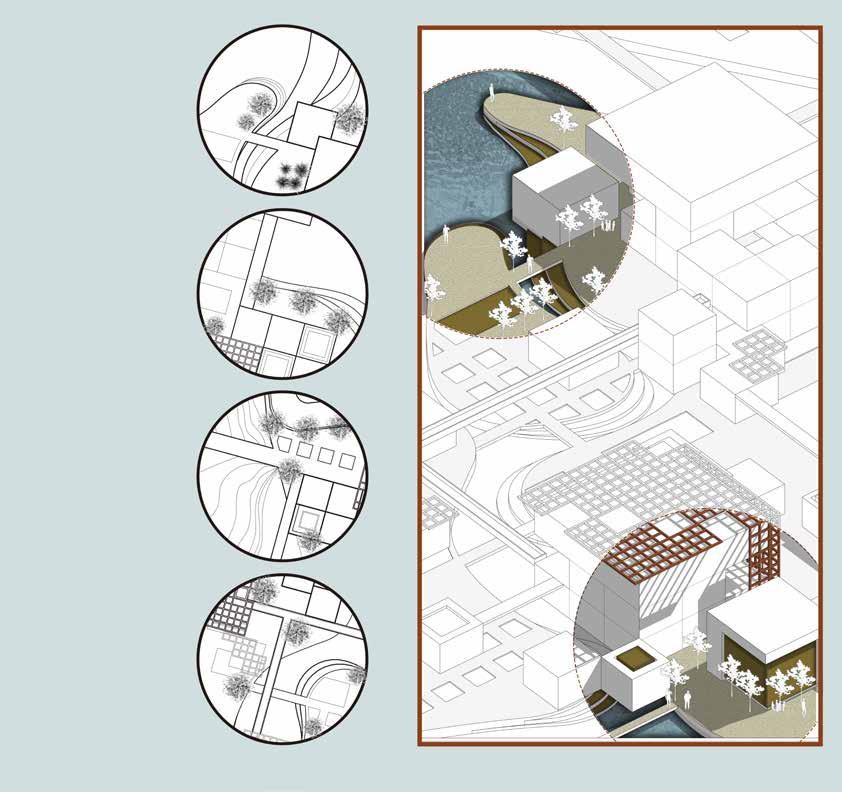
ZOOM IN - MICRO LEVEL
vehicle routes permeability [1]
public transport permeability [1]
pedestrian permeability [1]
buildings permeability [3]
total rating [6]
vehicle routes permeability [1]
public transport permeability [1]
pedestrian permeability [1]
buildings permeability [3]
total rating [6]
vehicle routes permeability [1]

public transport permeability [1]
pedestrian permeability [1]


buildings permeability [3]

total rating [6]
CONTEXT SUMMARY
Population
Manchester: High elderly population, often childless, risks loneliness. High poverty and homelessness among elderly, leading to social isolation.
Land Use and Activities
Some MASs are well designed but do not have the qualities of a age friendly design. Retrofitting on the ground is quite difficult.
Land Use and Activities

1. Spinningfields: high porosity, poor guidance. 2. Civic Qtr: MAS D accessible. 3. MAS

E: uses high porosity. 4. Petersfield: observable, vast. 5. Chinatown: scarce public spaces.
Primary Data Collection
Elderly value greenery, furniture; some MASs lack these. Design needs elderly input, safety consideration, and flexibility due to diverse space evaluations.
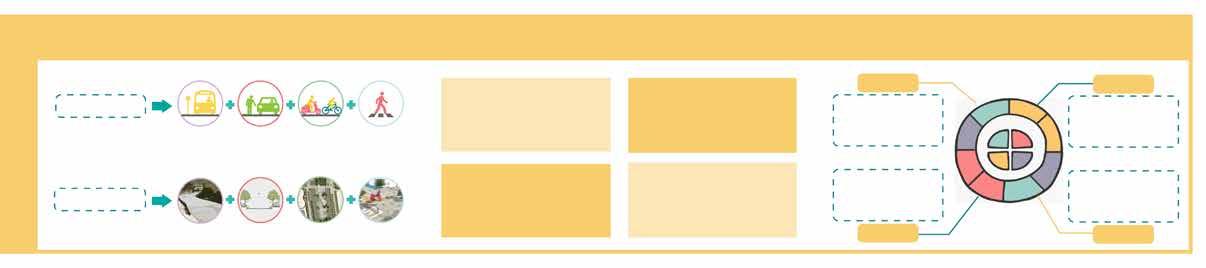
STRATEGY
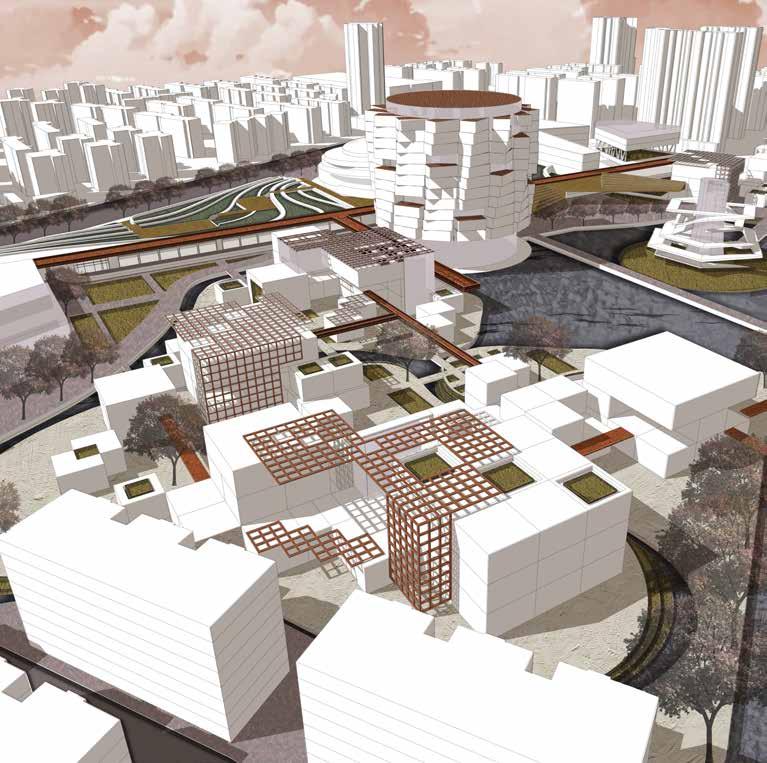
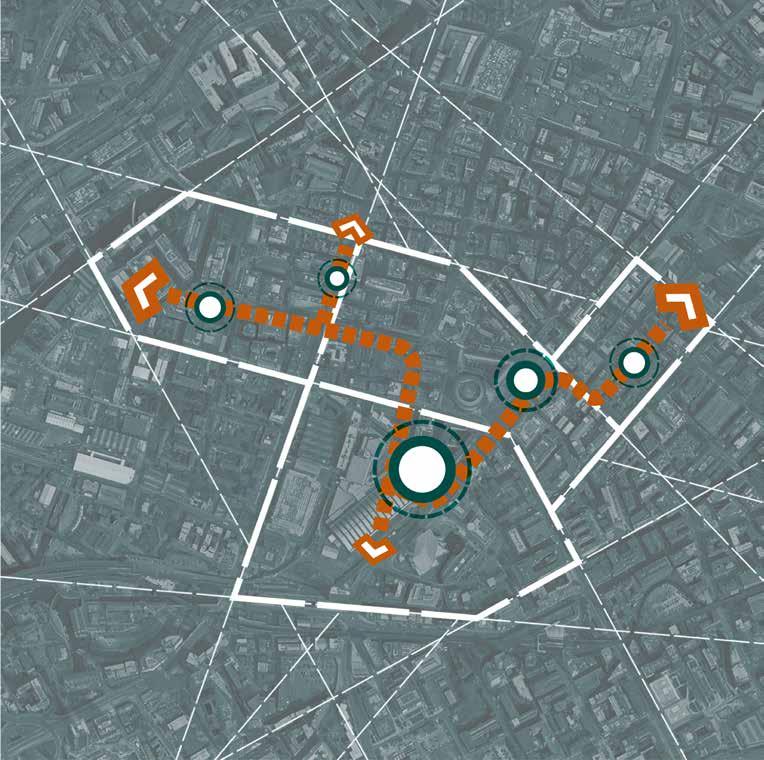
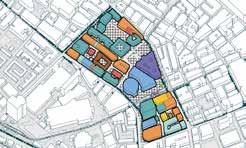
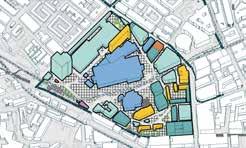
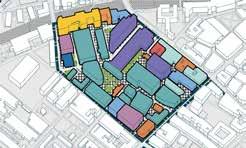
Our VISION is to build a SILVER HAIR ROUTE for older people and anyone else in Manchester City Centre.
What is the Silver Hair Route?
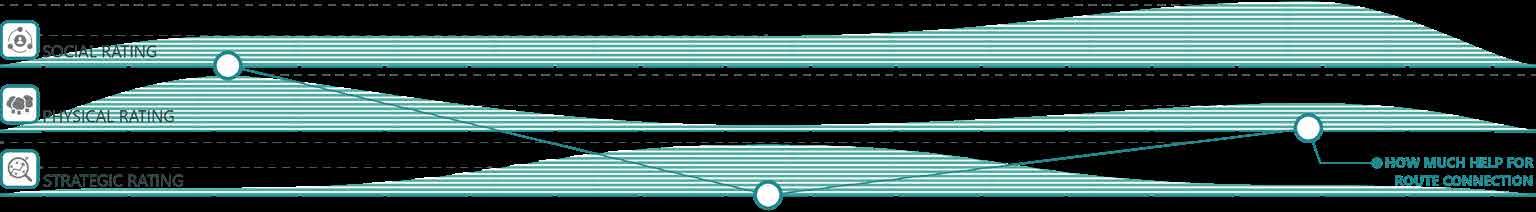
A public space connectivity scheme based on age-friendly design and the needs of local older people, dedicated to designing an age-friendly city centre on a social, physical and strategic scale.
Three Dimensions

SOCIAL PHYSICAL STRATEGIC


AVOID SOCIAL EXCLUSION: Encourage older people to go out and get involved in social activities. Increase the connection between them and society and make them want to go out and use public spaces. Increase interaction between them and different age groups and break down barriers.

STRATEGY B: MAKE OLDER PEOPLE A CITY PARTNE ENHANCE BELONGING


STRATEGY C: MAKE OLDER PEOPLE A CITY ENJOYER BOOST RELATIONSHIP


IMPROVE ACTIVITY CONNECTION: Connecting the spaces with the highest number of people and activities in each area. Making the routes linking them a distinctive feature of the city centre while increasing the accessibility of each site. Allowing older people unhindered access to each public space.
PROVIDE INNOVATUVE STRATEGY: Provide the logic for each age-friendly design to run successfully. Make each design motivated and resourced, and achievable. It also gives the scheme a basis that can be replicated in other cities, and the government has the flexibility to apply the design through complementary strategies.

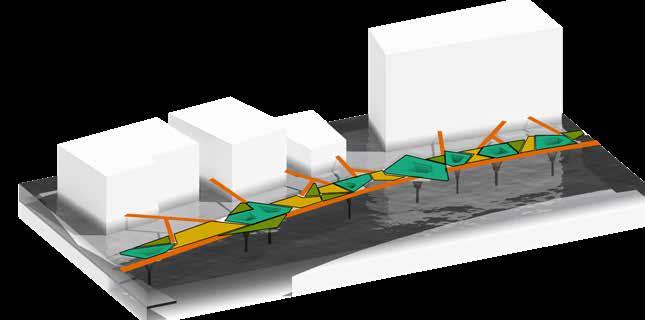
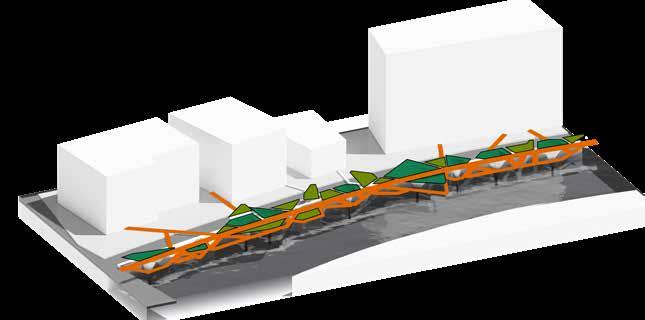
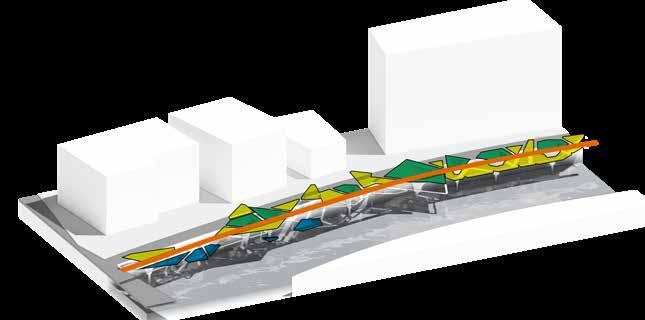
INTERVENTION STRENGTH
make elderly a city joiner - improve inclusive access make elderly a city partner - enhance belonging make elderly a city enjoyer - boost relationship
LEGENDS
1. BAR
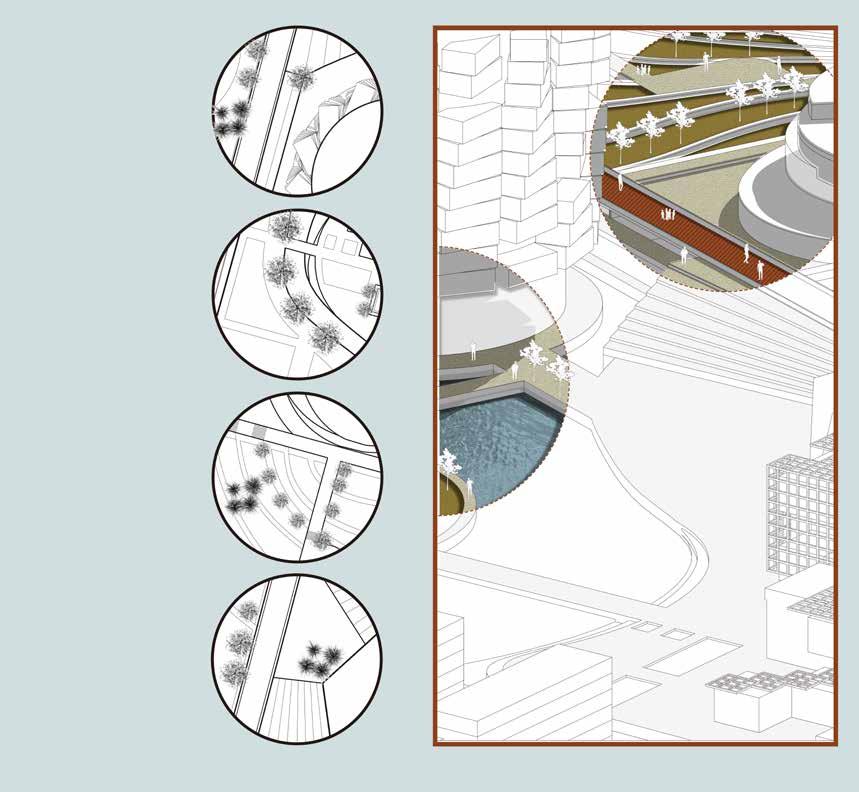
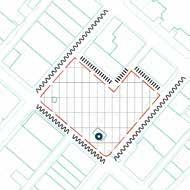
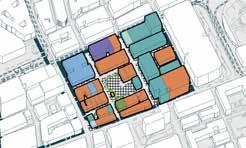
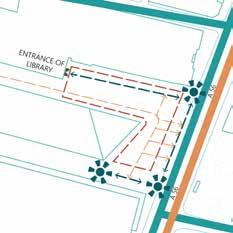
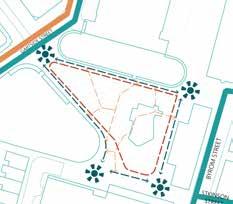
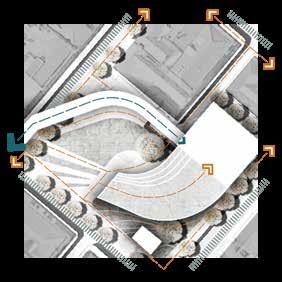
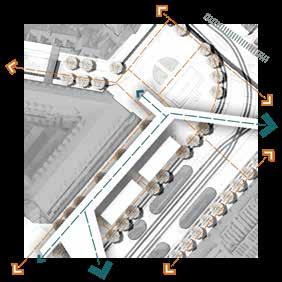
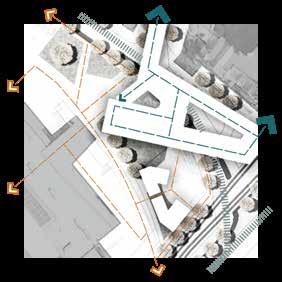
ROUTE CONSTRUCTION
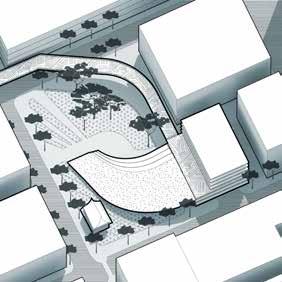
EYE of the route
The node at MAS A, with quality public space and intact greenery, is the enticing starting point or ‘eye’ of the route for the elderly, encouraging further exploration.
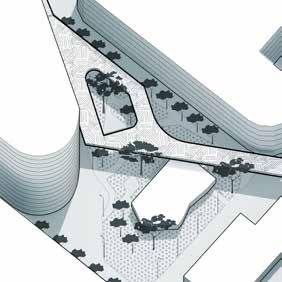
MIND of the route
MAS B, away from the main route, acts as the ‘mind’. Seniors and artists collaborate here, creating and regularly updating art, expressing their thoughts and ideas.
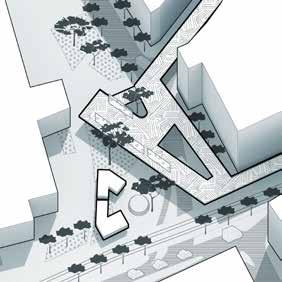
MOUTH of the route
MAS C, the ‘mouth’ of the route and furthest from the main axis, is a platform for seniors to express opinions that influence urban planning.
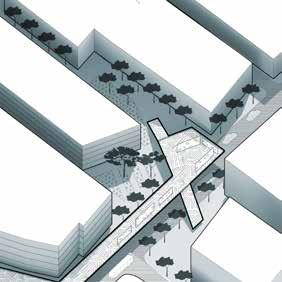
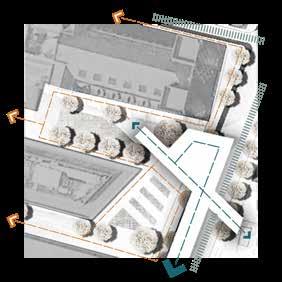
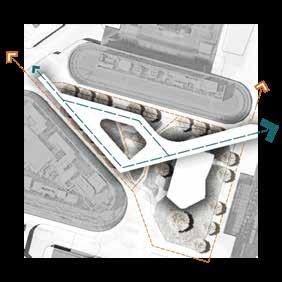
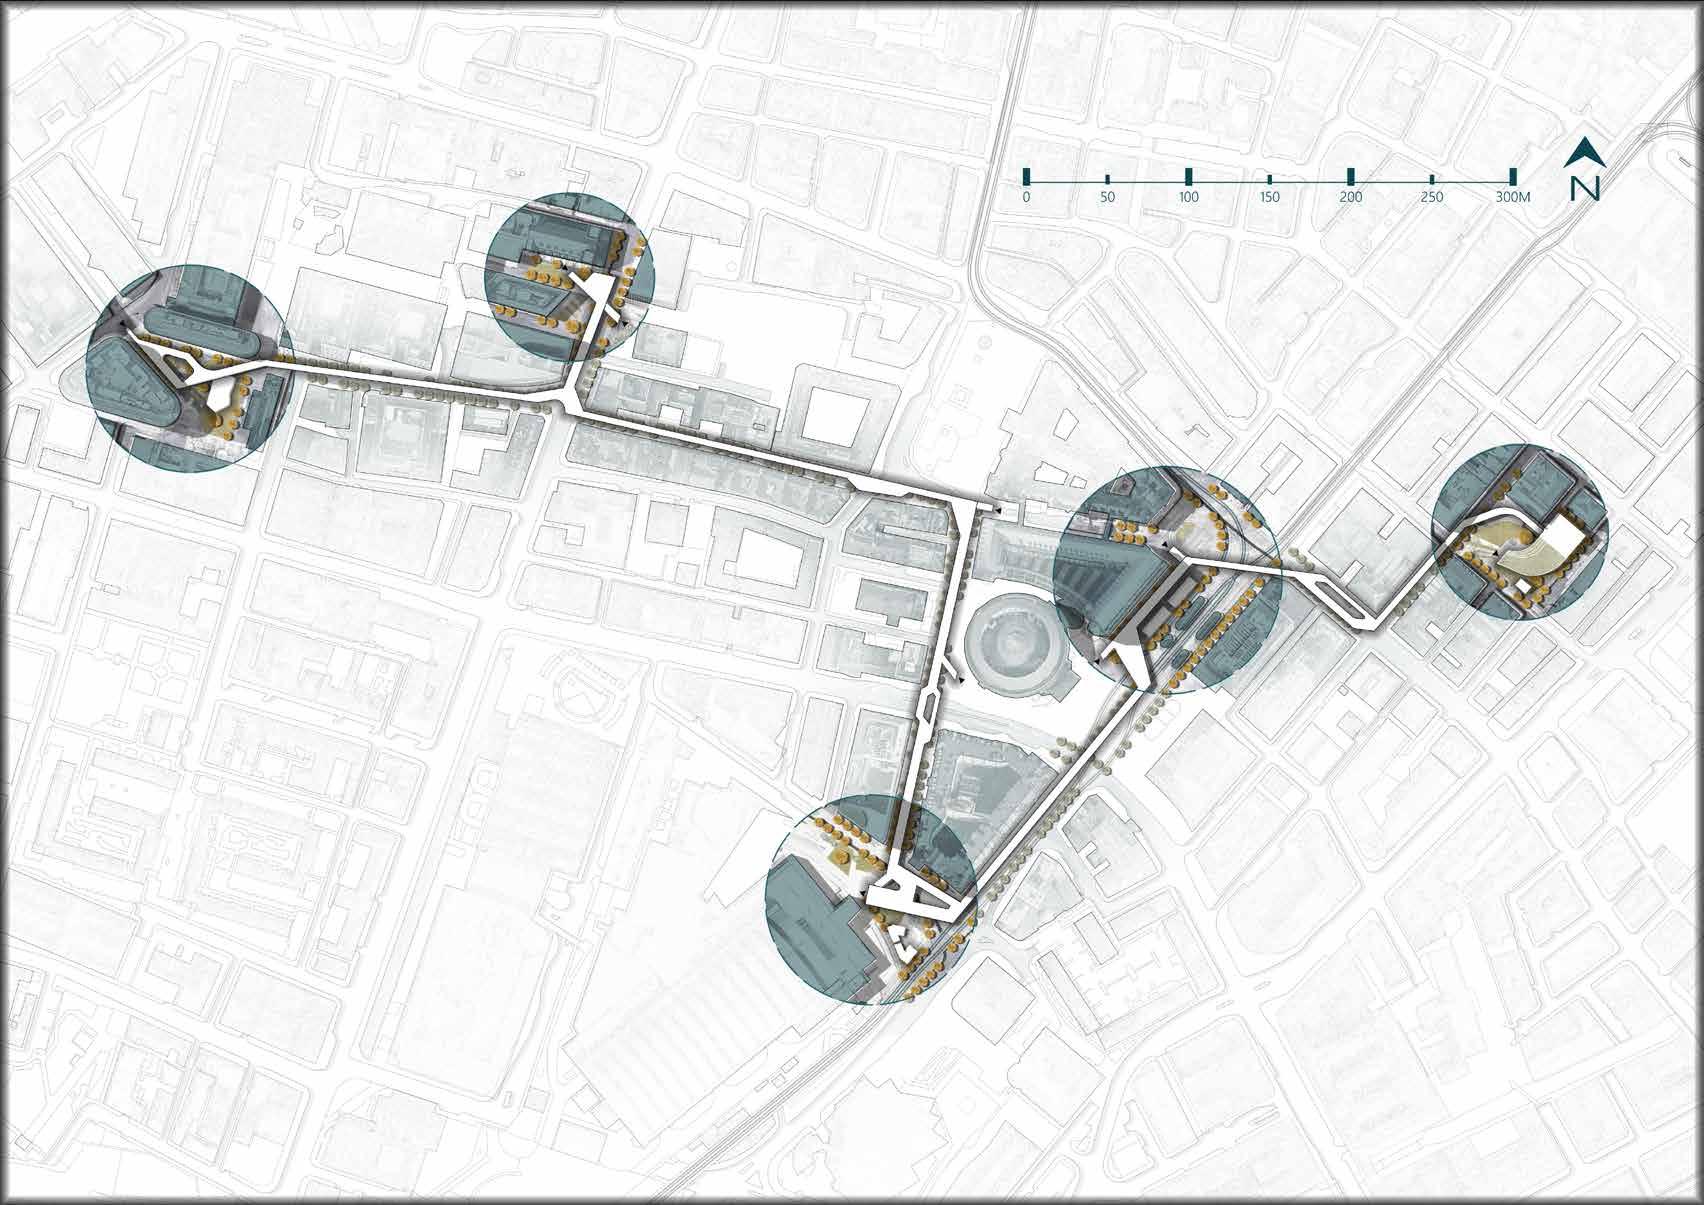
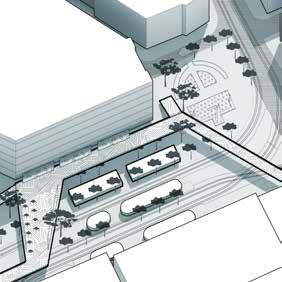
EAR of the route
MAS D, the central ‘ear’ of the route, offers seniors a diverse auditory landscape for gathering varied information about Manchester.
NOSE of the route
MAS E lets seniors interact with urban design through gardening, offering a sensory exploration of the city via an urban farm and aromatic Chinatown.
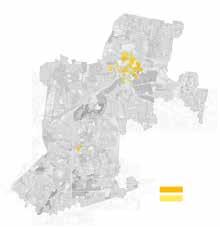
Project 1: Detroit crime analytic
ISSUES
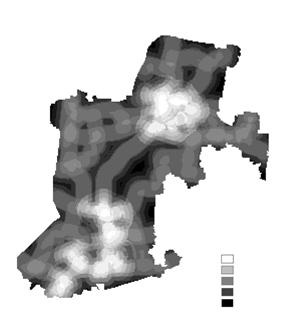
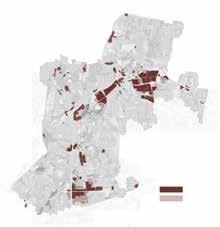
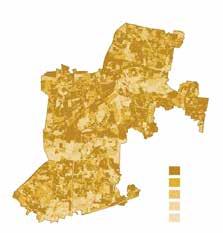
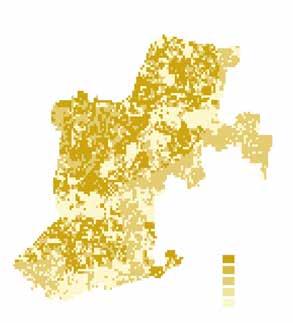
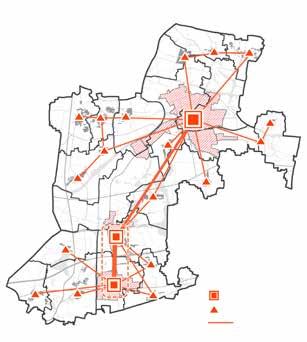
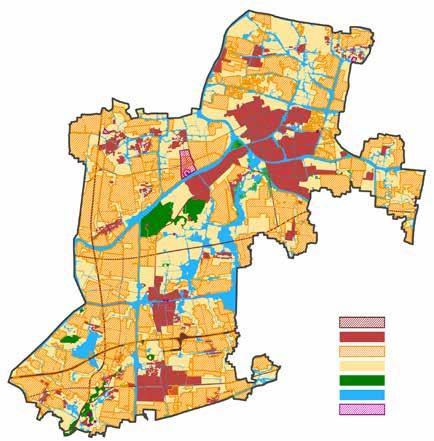
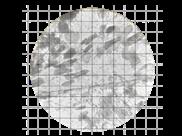
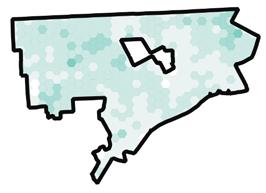
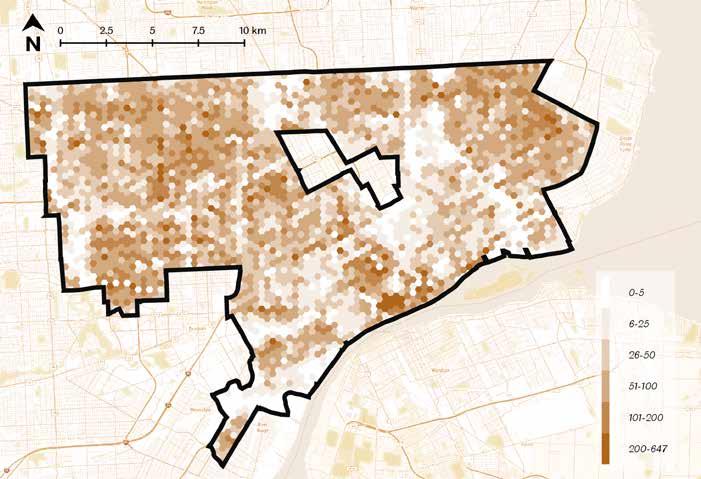
This set of geographic visualisations shows the density distribution of four major crime types and total crime in the city of Detroit for the period 2020-2022. Aggregating crime data for the last three years for a city not only provides insight into how different areas are policed but also helps the community identify aspects of different neighbourhood environments that contribute to crime and eliminate them. Data on small multiples of individual categories of crime, presented in a uniform legend map, can also help to understand which types of crime are the most frequent and, to some extent, beneficial to social security.
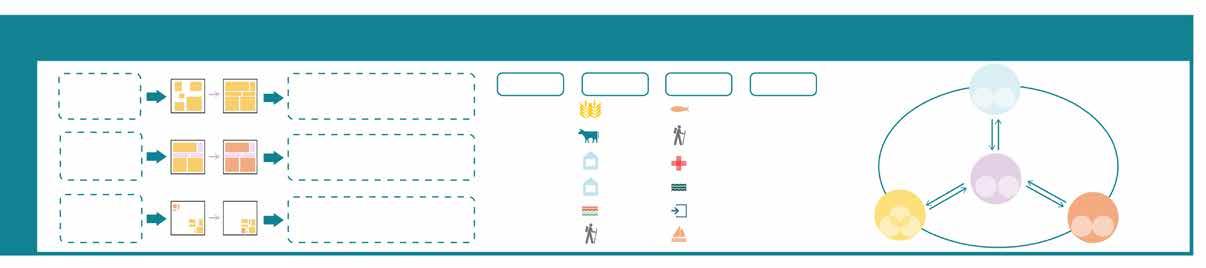
DATA AND METHODS
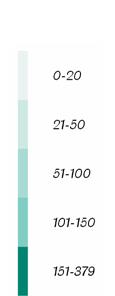
This collection of diagrams uses various types of geographical data and methods of generating visualisations. The authors used Python to design code to obtain a point shapefile of all crimes for the past three years available on the Detroit government website. The geographic information data, defined as the boundaries of the City of Detroit and the 54 neighbourhood areas, were sourced from the Detroit Master Plan polygon shapefile. The data was processed by first creating a Hexagon grid based on the boundaries of the neighbourhood area and then calculating the number of crime incidents contained in each cell of the grid to derive the crime density. For the small multiples of a single crime type at lower scales, the size of the grid is controlled so that it is more clearly represented. For the range of densities in the legend, the number of cells contained in each colour was chosen to be as similar as possible while following the integer partition. Because the attribute table of the point shapefile contains data for all crime types for the past three years, the graphs of small multiples of the four most typical crime types were taken after the main visualisation of the overall crime incident density was completed. Two different sets of legends were used because the range of the two diagrams differed considerably.
GEO-VISUALISATION
Urban analytics of Chicago and London based on GIS and Python

Category: Urban Research

Site Location: London, UK; Detorit, USA
Postgraduate Project: Individual Work
Instructor: Dr Ruth Hamilton(The University of Sheffield)
Duration: 03/2022 - 05/2022
This report presents different types of data from two different cities. The first visualisation shows the density of crime incidents in the city of Detroit for the period 2020-2022, and the second offers a map of the distribution of digital consumer types in Greater London in 2014. Both sets of geographical data are taken from both cities' official government websites, which are authentic and valid. Both groups of visualisations are represented in the form of 'small multiples'. This is mainly because small multiples allow the comparison of different geographical data under the same parameters, reducing the information density of individual maps.
INTERPRETATION
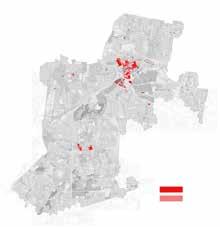
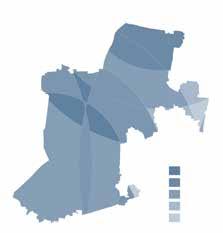
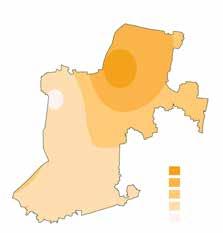
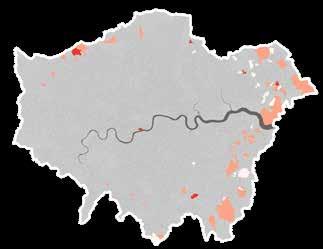
Firstly, The main visualisation shows Detroit’s total density of crime over the last three years. It is clear that most crime is concentrated in three areas: the eastern seaboard, the southeastern riverfront (downtown) and the Midwest. By comparing the legend with the data, it is surprising that despite the public perception of Detroit as a city with a high proportion of immigrants and a high crime rate (Hill and Beaver, 1998), the actual crime density is not so exaggerated. This may be because the public’s fear of crime is as important a social issue as the crime itself (Perry Jr et al., 1994). Fear of crime events can bias society’s assessment of objective public safety risks (Ito, 1993). Neighbourhoods close to city centres have the highest crime densities, which is in line with the pattern in most the cities in developed countries, where there are usually more psychological, temporal and spatial blind spots prone to crime incidents (Wang 2001).
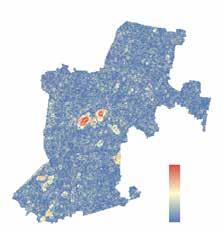
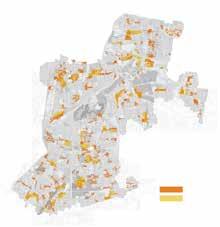
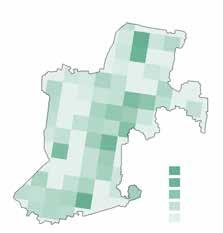
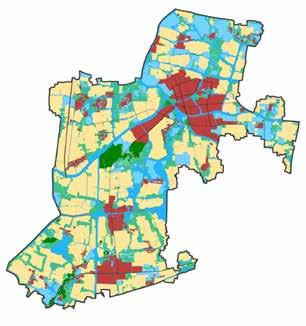
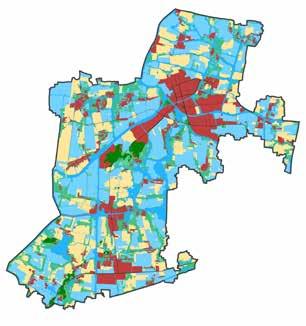
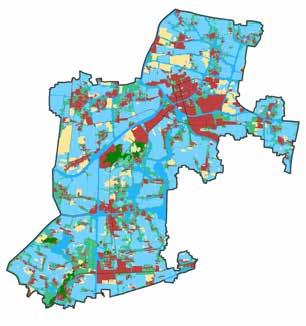
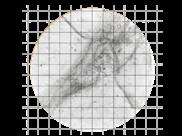
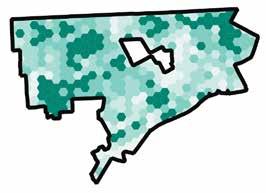
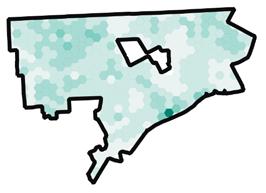
Secondly, By comparing the small multiples visualisation, we can see that the density of assault incidents is the highest and robbery the lowest of the four main crime types. This suggests, to some extent, that the cost of crime fundamentally influences the number. The pattern of density distribution is generally consistent across the four crime types. However, by comparing these four diagrams with the main visualisation, we learn that burglary crime, unlike the other crimes, is not concentrated in downtown areas. This is because high-quality housing is predominantly located in the city’s suburbs, where the probability of burglary occurring is significantly higher than in the ‘slums’ of the city centre. The distribution of Assault density is roughly the same as that of total crime, suggesting that the occurrence of Assault is entirely random and not influenced by geographical and urban characteristics.
 ROBBERY BURGLARY
STOLEN ASSAULT
Unit: Number of crimes incidents contained in each cell.
ROBBERY BURGLARY
STOLEN ASSAULT
Unit: Number of crimes incidents contained in each cell.
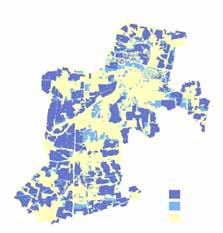
ISSUES
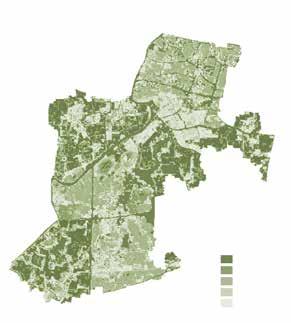
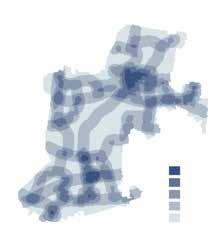
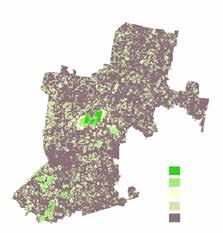
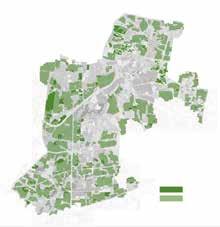
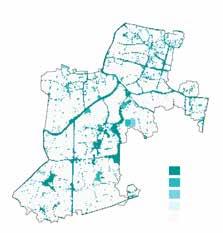
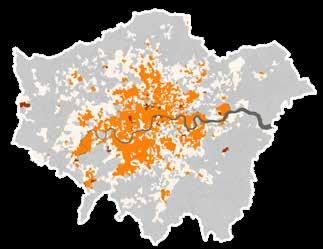
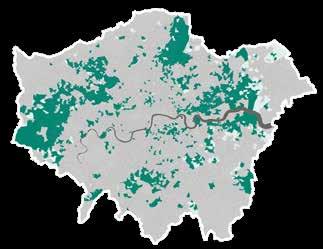
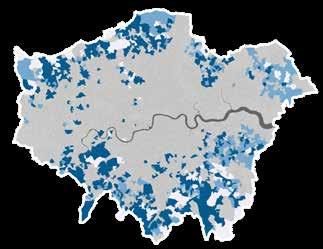
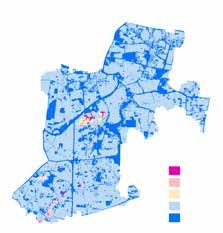
This set of multiple visualisations shows the geographical distribution of digital consumers in Greater London in 2014. Identifying the dominant consumer groups in an area for digital products is essential for marketing. This diagram can analyse consumer and customer demographics for strategic planning and marketing guidelines (Riddlesden, 2014). The visualisation is more intuitive than traditional statistical tables, and the small multiples allow for a more transparent structure of the different levels of consumer classification.
E-UNENGAGED
E-PROFESSIONALS & STUDENTS
This set of small multiples is mainly visualised using a categorical hierarchical representation. Geographic information and consumer distribution data are sourced from the London Councils’ Data Centre 2019. The geographical split on the base map is derived from the Boroughs boundary in the Greater London area. The data was processed by first visualising the consumer data in multiples based on the four supergroups in the consumer data and then classifying the groups they have in each of the smaller multiples. As the consumer data are all character-based, no quantitative analysis was carried out. Instead, use different colours in the legend corresponding to different consumer categories. For data from the same supergroup, the author used blocks of the same Colour Scheme to show the differences between the groups. Different supergroups use different colour schemes. Due to the necessity of obtaining the proportions of different groups in the districts, the author computed the centroids of all polygons using Python. And all the substructures of the data distribution in the administrative boundary map were calculated in multiple iterations.
DATA AND METHODS INTERPRETATION
By comparing the four multiples of visualisation, we can see very few areas in Greater London where consumers do not engage in electronics consumption. Professional product users (including students) are concentrated in and around the city of London, with good economic conditions and educational resources as important reasons. The supergroup also contains the highest level of mobile device ownership of the four groups, and these consumers need wireless devices to be online at all times to be ‘Totally connected’. This suggests that mobile devices are moving the world into a whole new realm of communication, with consumers using them to live and work (Sivanad et al., 2004). Just as the Young and Mobile group occupies most areas in the Typical Trend, young people in this supergroup category are more likely to use mobile devices. Mobile phones are now recognised as an excellent means of interactive marketing (Buellingen and Woerter, 2004), so internet companies should prioritise young people in their marketing operations as they are more willing to try new technologies (Bigne et al., 2005). For rural and fringe areas, consumers, while perhaps limited by the quality of infrastructure, still maintain a high level of connectivity for the most part.
References
ANDRESEN, M. A. & LINNING, S. J. 2012. The (in) appropriateness of aggregating across crime types. Applied Geography, 35, 275-282.
BIGNE, E., RUIZ, C. & SANZ, S. 2005. The impact of internet user shopping patterns and demographics on consumer mobile buying behaviour. Journal of Electronic Commerce Research, 6, 193.
BUELLINGEN, F. & WOERTER, M. 2004. Development perspectives, firm strategies and applications in mobile commerce. Journal of business Research, 57, 1402-1408.
FA CENG, WANG. 2001. The impact of the urban spatial environment on urban crime. Human Geography, 16, 1-6, 11.
HILL, C. E. & BEAVER, P. D. 1998. Cultural diversity in the US South: Anthropological contributions to a region in transition, University of Georgia Press.
E-marginals: Not a Necessity
E-marginals: Opt Out
E-RURAL AND FRINGE
Next Generation Users
Constrained by Infrastructure
E-fringe
Too Old to Engage Low Density but High Connectivity
Totally Connected
E-TYPICAL TRENDS
CONCENTRATE & OPTIMISE INDUSTRIES, BUILD A LITERARY WATER TOWN
Territory development plan of Zhongguan Town, Zhejiang Province
Category: Regional and Urban Planning
Uncommitted and Casual Users
Students Online Young and Mobile
ITO, K. 1993. Research on the fear of crime: Perceptions and realities of crime in Japan. Crime & Delinquency, 39, 385-392.
PERRY JR, J. B., HSIEH, C.-C. & PUGH, M. 1994. Fear of crime and city nightlife. Journal of Crime and Justice, 17, 69-84.
REIMER, A., UNGER, A., MEULEMANS, W. & DRANSCH, D. Schematized small multiples for the visual comparison of geospatial data. IEEE Information Visualization Conference, 2011.
RIDDLESDEN, D. 2014. Internet User Classification (IUC) User Guide. Data. London. gov. uk.
SIVANAD, C., GEETA, M. & SULEP, M. 2004. Barriers to mobile Internet banking services adoption: an empirical study in Klang Valley of Malaysia. Internet Business Review, 1, 1- 17.
Site Location: Zhejiang Province, China


Undergraduate Project: Team Work (Reworked Indivisually in 06/2023)
Instructor: Weili Tian (Shanghai University)


Duration: 10/2020 - 03/2021
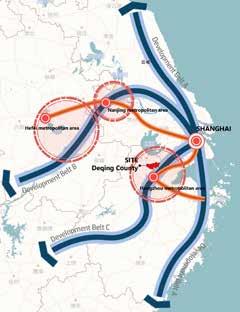
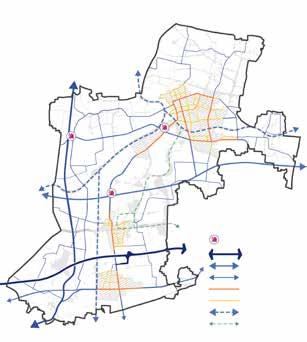
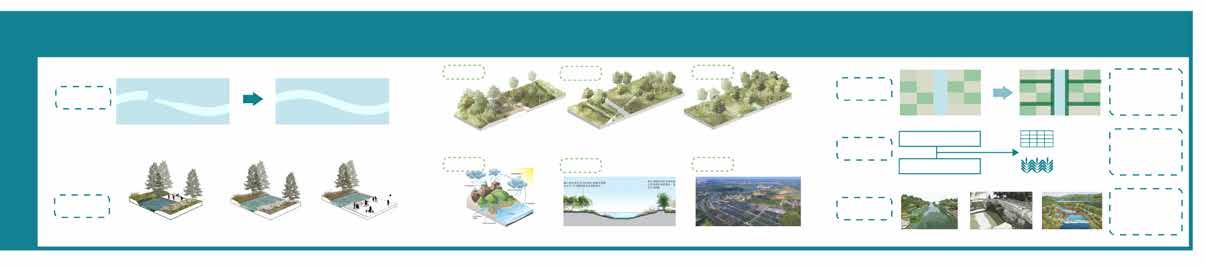
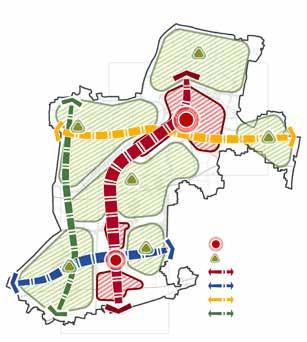
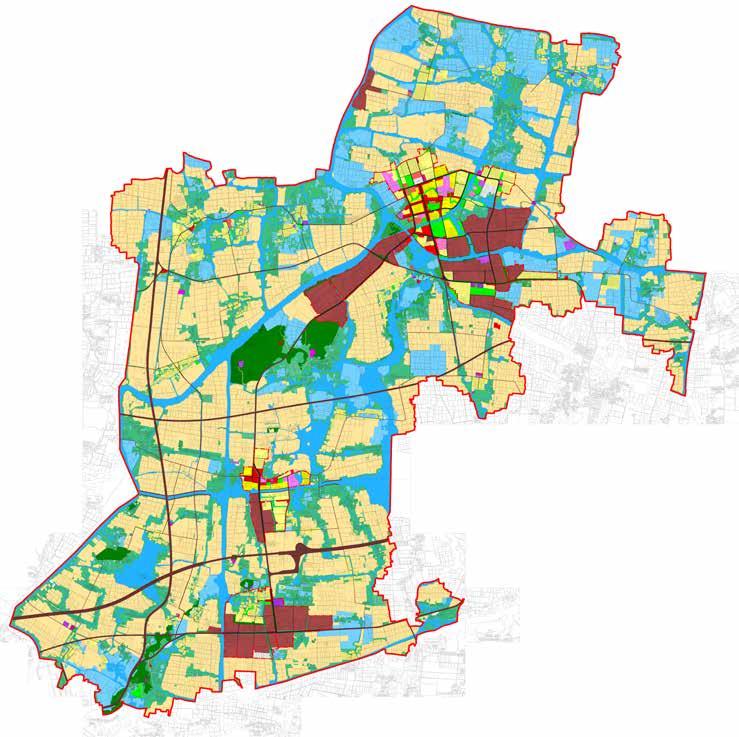
This project is a territorial development plan initiative based in Zhongguan Town, Deqing County, Zhejiang Province, China. The project analyses the current status of the town's land, economy, population, etc. And designs specific development strategies in four aspects: industry optimisation, talent management, ecological protection, and living environment improvement. The project finally produces a detailed land plan for the town and corresponding phase goals for development.

In the Yangtze River Delta Integration Regional Planning, Deqing County is in the Shanghai-Hangzhou-Jinhua Development Belt, in which Zhongguang Town assumes the function of biomedical production.
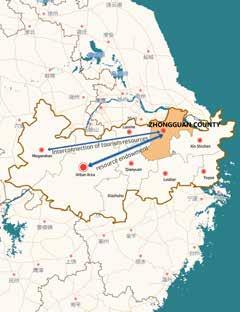
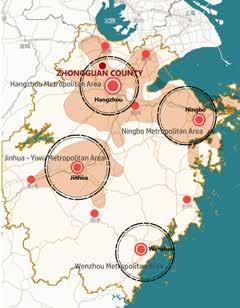
In the regional planning of Zhejiang City Cluster, Zhongguang Town of Deqing County belongs to the scope of Hangzhou Bay City Cluster-Hangzhou Metropolitan Area, and the crowd and industry are closely related to Hangzhou City.
DUAL ASSESSMENT
In the General Plan of Deqing County, Zhongguang Town is positioned as a strong industrial town, and is positioned as: “pleasant to live and work, wealth town”.