DESIGN DISSERTATION
YIMING HAN
SUPERVISOR: BOBBY NISHA
STUDENT ID: 210172357, MASTER OF ARTS URBAN DESIGN AND PLANNING, THE UNIVERSITY OF SHEFFIELD
CITIES AND COMMUNITIES
DESIGNING
AGE-FRIENDLY PUBLIC REALM
AGE-FRIENDLY
-
AN
IN MANCHESTER CITY CENTRE


AGE-FRIENDLY CITIES AND COMMUNITIES - DESIGNING AN AGE-FRIENDLY PUBLIC REALM IN MANCHESTER CITY CENTRE TABLE OF CONTENT 01 16 27 38 49 5 47 0553 0765 1267 17 INTRODUCTIONPRIMARY DATA COLLECTION METHODOLOGYDESIGN PROPOSAL LITERATURE REVIEWCONCLUSION & REFLECTION CASE STUDYREFERENCES & APPENDIX SITE ANALYSIS
INTRODUCTIONSITE ANALYSIS
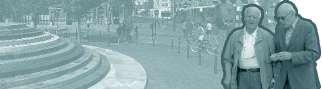
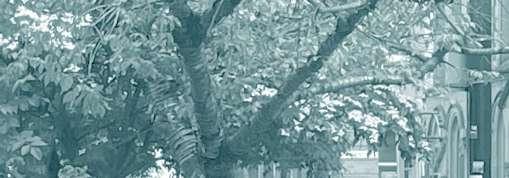
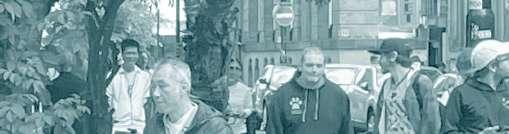
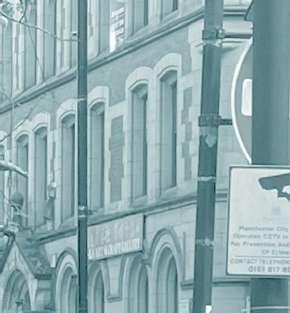
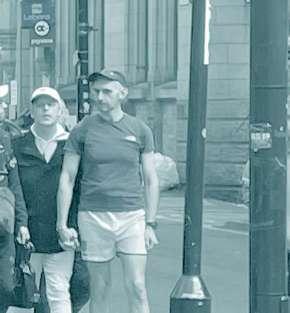
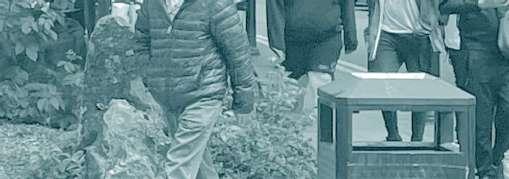
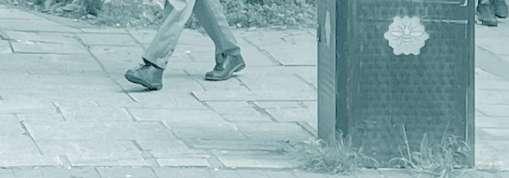
Figure 1.1 Elderly people in the Northern Quarter, Manchester (photo by author)
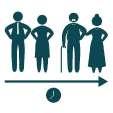
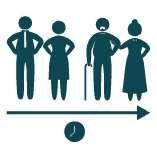
Figure 1.2 Research Questions Diagram
Figure 1.3 Research Maps
Figure 1.4 Research Frameworks Diagram
MRTHODOLOGY
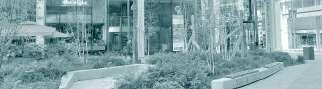
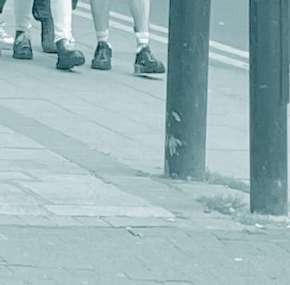
Figure 2.1 Hardman Square in the Spinningfields, Manchester (photo by author)
LIRERATURE REVIEW
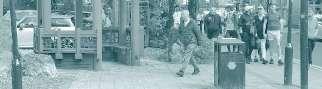
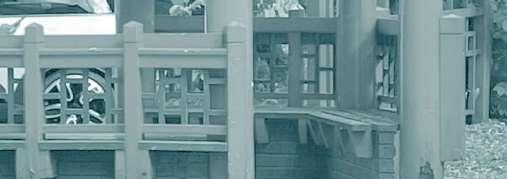
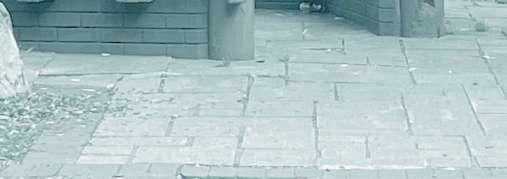
Figure 3.1 Chinatown in Manchester (photo by author)
Figure 3.2 The WHO Age-friendly Cities Framework
Figure 3.3 Mapping Challenges or Drivers to Realising AFCC
Figure 3.4 Learning Best Practives from AFCC-driven Studies
Figure 3.5 Recommendations for Future Development
Figure 3.6 Literature Review Summary Diagram
CASE STUDIES
Figure 4.1 The members of “ The Club of Friendship Between the Generations in Atika”
Figure 4.2 Atika Older People Context
Figure 4.3 Atika One-Coin Bus Service
Figure 4.4 Atika intergenerational friendship club
Figure 4.5 Ottawa Older People Context
Figure 4.6 Ottawa Accessibility Improvement
Figure 4.7 Ottawa Seniors Roundtable
Figure 4.8 Hong Kong Older People Context
Figure 4.9 Hong Kong Age-friendly Accomodation
Figure 4.10 Hong Kong Three-year Plan Action
Figure 4.11 Atika Social Partners Triangular Relationship
Figure 4.12 Ottawa Public Travel and Access Triangular Relationship
Figure 4.13 Hong Kong Intergenerational Connection Triangular Relationship
01 02 03 04 05 07 08 09 09 10 11 12 13 13 13 14 14 14 15 15 15 16 16 16
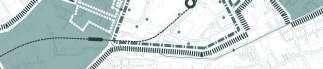
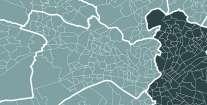
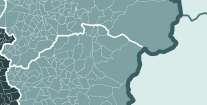
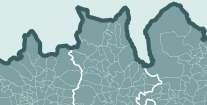
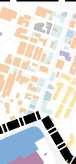
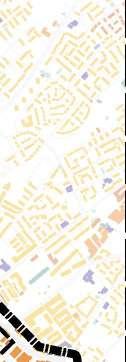
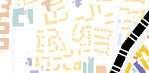
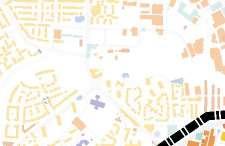
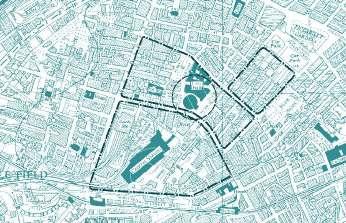
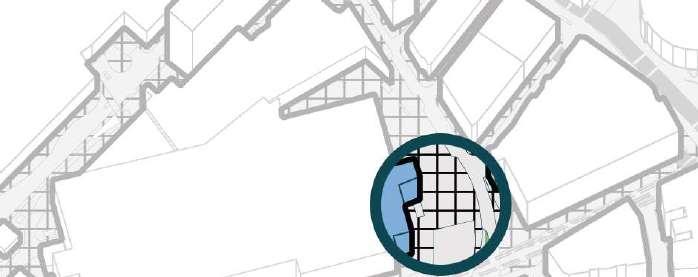
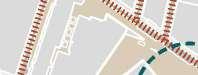
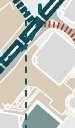
Figure 5.1 Part of Manchester City Centre Permeability and Porosity Analysis Diagram
Figure 5.2 Manchester Location in the UK
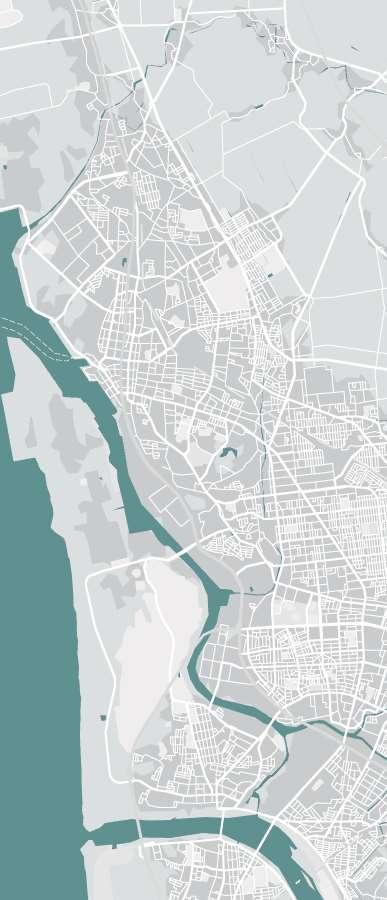
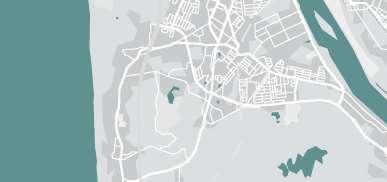
Figure 5.3 Manchester City Centre Location
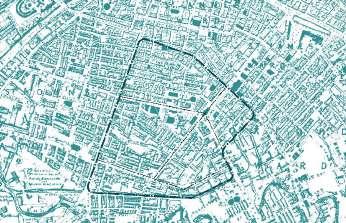
Figure 5.4 Manchester Inner Loop
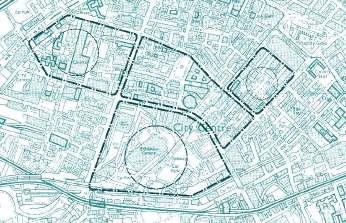
Figure 5.5 Manchester’s City Centre
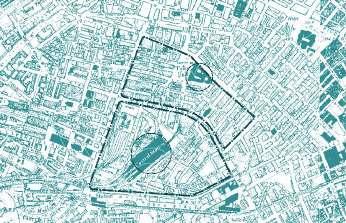
Figure 5.6 Sites Locations in the City Centre
Figure 5.7 Grid and Block of Manchester City Centre
Figure 5.8 Grain of Manchester City Centre
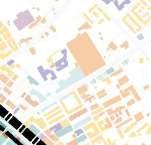
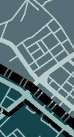
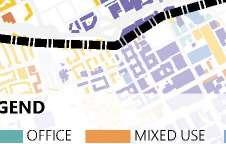
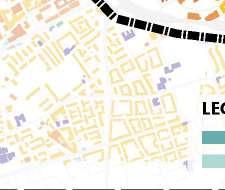
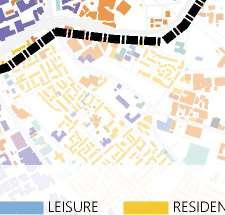
Figure 5.9 Land Use of Manchester City Centre
Figure 5.10 Site History Analysis
Figure 5.11 Older People Population Analysis
Figure 5.12 Older People Proportion Analysis
Figure 5.13 Gender and Life Expectancy Analysis
Figure 5.14 Deprivation and Household of Older People Analysis
Figure 5.15 Policy and Strategy Analysis
Figure 5.16 Land Use of Manchester City Centre Neighbourhoods
Figure 5.17 Features of Sites
Figure 5.18 Land Use of Spinningfields
Figure 5.19 MAS A Frontage and Activity Analysis
Figure 5.20 MAS B Frontage and Activity Analysis
Figure 5.21 Land Use of Petersfield
Figure 5.22 MAS C Frontage and Activity Analysis
Figure 5.23 Land Use of Civic Quarter
Figure 5.24 MAS D Frontage and Activity Analysis
Figure 5.25 Land Use of Chinatown
Figure 5.26 MAS E Frontage and Activity Analysis
Figure 5.27 Movement Analysis
Figure 5.28 Accessibility Analysis
Figure 5.29 Movement Analysis of Spinningfields
Figure 5.30 Gartside Street
Figure 5.31 A56
Figure 5.32 Accessibility Analysis of Spinningfields
Figure 5.33 Bus Station and Stop on A56
17 18 18 18 18 18 19 19 19 20 21 21 21 21 22 23 23 24 24 24 25 25 26 26 27 27 28 28 29 29 29 29 29
AGE-FRIENDLY CITIES AND COMMUNITIES - DESIGNING AN AGE-FRIENDLY PUBLIC REALM IN MANCHESTER CITY CENTRE TABLE OF CONTENT
SITE ANALYSIS
Figure 5.34 Movement Analysis of Petersfield
Figure 5.35 Pedestrian Area and Oxford Street
Figure 5.36 Accessibility Analysis of Petersfield
Figure 5.37 Tram next to MAS C
Figure 5.38 Movement Analysis of Civic Quarter
Figure 5.39 Pedestrian Area in the Civic Quarter
Figure 5.40 Accessibility Analysis of Civic Quarter
Figure 5.41 Tram Station next to the Civic Quarter
Figure 5.42 Movement Analysis of Chinatown
Figure 5.43 The Entrance of MAS E and Nicholas Street next to it
Figure 5.44 Accessibility Analysis of Chinatown
Figure 5.45 China Town Car Park
Figure 5.46 Building Height Analysis of Spinningfields
Figure 5.47 Street, Square and Building Section Analysis of Spinningfields
Figure 5.48 MAS A A-A Section Analysis and Public Realm Assessment
Figure 5.49 MAS B B-B Section Analysis and Public Realm Assessment
Figure 5.50 Building Height Analysis of Petersfield
Figure 5.51 Street, Square and Building Section Analysis of Petersfield
Figure 5.52 MAS C A-A Section Analysis and Public Realm Assessment
Figure 5.53 Building Height Analysis of Civic Quarter
Figure 5.54 Street, Square and Building Section Analysis of Civic Quarter
Figure 5.55 MAS D A-A Section Analysis and Public Realm Assessment
Figure 5.56 Building Height Analysis of Chinatown
Figure 5.57 Street, Square and Building Section Analysis of Chinatown
Figure 5.58 MAS E A-A Section Analysis and Public Realm Assessment
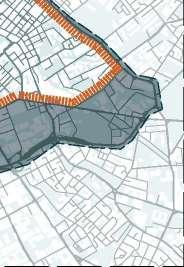
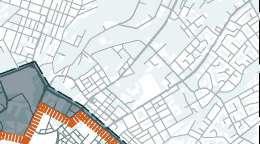
Figure 5.59 Permeability and Porosity Analysis of Manchester City Centre
Figure 5.60 Permeability and Porosity Analysis of Spinningfields
Figure 5.61 MAS A Permeability and Porosity Analysis
Figure 5.62 MAS B Permeability and Porosity Analysis
Figure 5.63 Permeability and Porosity Analysis of Petersfield
Figure 5.64 MAS C Permeability and Porosity Analysis
Figure 5.65 Permeability and Porosity Analysis of Civic Quarter
Figure 5.66 MAS D Permeability and Porosity Analysis
SITE ANALYSIS
30 30 30 30 31 31 31 31 32 32 32 32 33 33 33 33 34 34 34 35 35 35 36 36 36 37 38 38 38 39 39 40 40
Figure 5.67 Permeability and Porosity Analysis of Chinatown
Figure 5.68 MAS E Permeability and Porosity Analysis
Figure 5.69 Legibility Analysis of Spinningfields
Figure 5.70 Landmarks of Spinningfields
Figure 5.71 Legibility Analysis of Petersfield
Figure 5.72 Landmarks of Petersfield
Figure 5.73 Legibility Analysis of Civic Quarter
Figure 5.74 Landmarks of Civic Quarter
Figure 5.75 Legibility Analysis of Chinatown
Figure 5.76 Landmarks of Chinatown
Figure 5.77 Crime and Security Analysis
Figure 5.78 Crime Type Analysis
PRIMARY DATA COLLECTION
Figure 6.1 Part of MAS C P11&12 Interview Transcript Diagram
Figure 6.2 Semi-Structured Interview Diagram
Figure 6.3 Participant Information Diagram
Figure 6.4 MAS C P11&P12 Interview Transcript Diagram
Figure 6.5 MAS D P16&P17 Interview Transcript Diagram
Figure 6.6 MAS E P21 Interview Transcript Diagram
Figure 6.7 Accessibility Survey Analysis
Figure 6.8 Security Survey Analysis
Figure 6.9 MAS A P2 Interview Transcript Diagram
Figure 6.10 MAS B P7&P8 Interview Transcript Diagram
Figure 6.11 MAS D P15 Interview Transcript Diagram
Figure 6.12 Strong Points Survey Analysis
Figure 6.13 Weak Points Survey Analysis
Figure 6.14 Requirements Survey Analysis
Figure 6.15 SWOT Analysis Part 1
Figure 6.16 SWOT Analysis Part 2
41 41 42 42 43 43 44 44 45 45 46 46 47 48 48 49 49 49 49 49 50 50 50 50 50 50 51 52
AGE-FRIENDLY CITIES AND COMMUNITIES - DESIGNING AN AGE-FRIENDLY PUBLIC REALM IN MANCHESTER CITY CENTRE TABLE OF CONTENT
DESIGN PROPOSAL
Figure 7.1 Part of Master Plan
Figure 7.2 Vision Diagram - Design Analysis
Figure 7.3 Strategy A Analysis Diagram
Figure 7.4 Strategy B Analysis Diagram
Figure 7.5 Strategy C Analysis Diagram
Figure 7.6 Strategy A Aggregation Diagram
Figure 7.7 Strategy B Aggregation Diagram
Figure 7.8 Strategy C Aggregation Diagram
Figure 7.9 Intervention Strength Analysis
Figure 7.10 Master Plan
Figure 7.11 MAS A Rendering
Figure 7.12 MAS A Pedestrian Flow Analysis
Figure 7.13 MAS B Rendering
Figure 7.14 MAS B Pedestrian Flow Analysis
Figure 7.15 MAS C Rendering
Figure 7.16 MAS C Pedestrian Flow Analysis
Figure 7.17 MAS D Rendering
Figure 7.18 MAS D Pedestrian Flow Analysis
Figure 7.19 MAS E Rendering
Figure 7.20 MAS E Pedestrian Flow Analysis
CONCLUSION & REFLECTION
Figure 8.1 Part of MAS D Rendering
Figure 8.2 Research Question Recap/ Summary of Conclusion diagram
REFERENCES & APPENDIX
Figure 9.1 Part of MAS E Master Plan
Figure 9.2 Literature Research Matrix Part 1
Figure 9.3 Literature Research Matrix Part 2
Figure 9.4 Literature Research Matrix Part 3
ABSTRACT
Research on how to build Age-Friendly Cities and Communities (AFCC) has been a topic of discussion among scholars around the world since 2007, when the World Health Organisation released eight recommendations for guidelines on building AFCC. To the present day, global ageing continues to increase and with it, health problems for older people and social problems for the general public. One of the most critical causes of these problems is the design of public spaces in cities. As previous literature on AFCC has not presented a systematic solution to the public realm from an age-friendly design perspective, this design paper is dedicated to developing a guideline framework for age-friendly urban public spaces and making a site test in Manchester city centre. Starting with the literature review and case study, this dissertation examines the characteristics of age-friendly spaces and how a guidelines framework can be developed. It then uses primary data collection and site analysis of Manchester city centre to identify the elements of attraction and challenges for older people when using public spaces. During the research process, the dissertation generated three strategies based on the different roles older people play in the city. After comparing and combining the three strategies, they were used in the planning and design of several public realms in Manchester city centre. The research has resulted in an AFCC design guideline framework. An age-friendly public realm should avoid social exclusion of older people, promote active transport for older people and have a set of operational strategies to complement the design.
ACKNOWLEGEMENTS
This design dissertation is the result of the author’s research for the MA in Urban Design and Planning. I would like to thank all the lecturers in the Department of Urban Design and Planning for their guidance and assistance.
Special thanks to Dr Bobby Nisha for her guidance on this dissertation and other modules about urban design. She has given me a lot of useful inspiration and help in completing this dissertation. She has also given me a lot of emotional support.
Finally, I would like to thank my family and friends.
AGE-FRIENDLY CITIES AND COMMUNITIES - DESIGNING AN AGE-FRIENDLY PUBLIC REALM IN MANCHESTER CITY CENTRE TABLE OF CONTENT
54 55 56 57 58 58 58 58 59 60 60
62
63
70
72
53
61 61
62
63 64 64 65 66 67
71
01
1.1 RESEARCH BACKGROUND 1.2 RESEARCH RATIONALE 1.5 RESEARCH MAPS 1.6 RESEARCH FRAMEWORKS 01 INTRODUCTION 1.3 RESEARCH AIM 1.4 RESEARCH QUESTIONS
Figure 1.1 Elderly people in the Northern Quarter, Manchester (photo by author)
1.1 Research Background

Since the WHO’s eight guidelines on building Age-friendly Cities and Communities (AFCC) in 2007 (Organisation, 2007), the amount of research and literature published by scholars worldwide on AFCC has increased year on year. In particular, scholars from the UK, the US, Canada and Hong Kong have contributed the most to the AFCC literature base (Torku et al., 2021). This shows a global trendtowards achievinganage-friendlysocietyandbuildingage-friendly cities.In theUK,Manchester was the first to join the WHO Global Network of Age-friendly Cities and Communities (GNAFCC) in 2010 and developed a vision for an age-friendly city that year. After 12 years of development, Manchester has achieved a certain level of success in age-friendly development.
1.3 Research Aim
The aim of this dissertation is to explore the definition and key characteristics of Age-Friendly Cities and Communities (AFCC) design by investigating public or open space in AFCC and by examining existing findings on AFCC design. In doing so, this dissertation aims to construct guideline for building AFCC public realm, and to explore whether this guideline has the capacity to be extended to global AFCC movement by using Manchester city centre as a test site.
1.4 Research Questions


The GNAFCC currently includes 1,333 cities and communities in 47 countries, reaching over 298 million people worldwide, and 15 cities in the UK have joined the network. However, the task of achieving global age-friendliness is still not over. Ageing is still increasing in most countries, and the proportion of older people in the total population is growing yearly. According to data published on the official website of the WHO, the number of people aged 65 and over in the Western Pacific region is expected to double by 2050. Furthermore, ageing comes with various health problems for older people, the most serious and obvious of which is the loneliness that comes with social isolation. In China, Europe, Latin America and the United States, 20-34% of older people consider themselves lonely (Organisation, 2021).
In addition, the global covid epidemic, which began in 2019, has led governments to impose mandatory quarantine measures, which has exacerbated the problem of social isolation of older people. Although countries began to reduce their isolation policies in 2022, the impact of this problem has not been effectively addressed.
1.2 Research Rationale
Public spaces in cities are widely considered places where social communication and other social activities occur. Improving the general quality of public spaces and certain specific elements could theoretically promote active transport for older people and encourage them to go out and integrate into society, thus reducing social isolation. However, the previous literature on AFCC has only rarely studied and proposed specific ways to improve public squares or streets, and they have not proposed systematic solutions. Therefore, this study will attempt to build an age-friendly guiding framework for cities’ public spaces that are flexible and malleable to adapt to different urban environments and contexts. To verify the feasibility of the framework and strategy, Manchester will be selected as the site for design testing.
1 02 1 INTRODUCTION
AGE-FRIENDLY PUBLIC REALM IN MANCHESTER CITY CENTRE
All figures are author’s own illustration unless stated AGE-FRIENDLY CITIES AND COMMUNITIES - DESIGNING AN
Figure 1.2 Research Questions Diagram
1 03 1 INTRODUCTION All figures are author’s own illustration unless stated AGE-FRIENDLY CITIES AND COMMUNITIES - DESIGNING AN AGE-FRIENDLY PUBLIC REALM IN MANCHESTER CITY CENTRE 1.5 Research Maps Figure 1.3 Research Maps
1 04 1 INTRODUCTION
COMMUNITIES
DESIGNING
AGE-FRIENDLY PUBLIC REALM IN MANCHESTER CITY CENTRE
All figures are author’s own illustration unless stated AGE-FRIENDLY CITIES AND
-
AN
1.6 Research Frameworks Figure 1.4 Research Frameworks diagram
02 METHODOLOGY


05
2.1
2.2
2.4
2.3
Figure 2.1 Hardman square in the Spinningfields, Manchester (photo by author)
RESEARCH METHODS
DESIGN METHODS
CONCLUSION
LIMITATIONS


2 06 2 METHODOLOGY
AGE-FRIENDLY PUBLIC REALM IN MANCHESTER CITY CENTRE
All figures are author’s own illustration unless stated AGE-FRIENDLY CITIES AND COMMUNITIES - DESIGNING AN


07 03 LITERATURE REVIEW
3.1 INTRODUCTION 3.5 CONCLUSION 3.2 MAPPING CHALLENGES OR DRIVERS TO REALISING AFCC 3.3 LEARNING BEST PRACTICES FROM AFCC-DRIVEN STUDIES 3.4 RECOMMENDATIONS FOR FUTURE DEVELOPMENT
Figure 3.1 Chinatown in Manchester (photo by author)
3.1 Introduction


There has been a positive global trend toward building age-friendly cities and communities(AFCC) since WHO’s 2007 recommendations for guidance on eight urban living areas for building AFCC (Organization, 2007). The research on AFCC in various countries has increased yearly, as reflected in the amount of literature published between 2003 and 2008 (Torku et al., 2021). Around the world, the phenomenon of ageing has become widespread, and its trend continues to deepen. According to the UN Population Profile, the elderly population in high-income countries is expected to increase to over 366 million by 2030 (Dixon, 2021). This is why it is essential to implement and promote the AFCC movement.


This review analysis summarises some key contemporary literature on the AFCC topic for 2007-2022. A detailed Research Matrix was produced to guide the review. The matrix is attached in the appendix on page 70. In comparing them, these research directions can be broadly divided into three key themes: learning best practices from the post-occupation analysis & AFCC-driven studies, mapping challenges to realising AFCC and recommendations for future development in the AFCC research agenda. For publications before 2007, they are not considered because WHO has not proposed eight areas for building AFCC.
3.2 Mapping Challenges Or Drivers To Realising AFCC
With respect to the challenges or drivers to realising AFCC, Del Barrio, Ritu Singh and Gibney et al. point to gender differences as an essential aspect. Del Barrio’s research, conducted through face-to-face interviews and the construction of linear regression models, found that in terms of men’s subjective well-being, living together and marriage as a support network were considered the most significant. Conversely, community and attachment to the neighbourhood were critical factors for women (Del Barrio et al., 2021). This may be because women have greater levels of combined spirituality than men in the older age group, so community and neighbourhood are used as virtual platforms for religious engagement and nurturing care. On the other hand, men are more dependent on marriage than women because they are more likely to achieve financial independence and social recognition in a traditionally patriarchal society (Singh and Bisht, 2019). This view is endorsed by Gibney, who found that those who were more socially engaged were more likely to have a better quality of life after assessing groups of older people in four Irish cities. Generally, women are less happy (Gibney et al., 2020). Therefore, we should pay particular attention to the impact of variability on AFCC promotion. In addition to the individual diversity of older people, environmental and socio-demographic differences should also be considered. Flores argues that even living in the same city or community, the independent factors for research and evaluation can be influenced by age group or timelines (Flores et al., 2019). An age-friendly environment may benefit the overall data assessment, but the specific effects will vary depending on the social and cultural context. Hence, this dissertation will fully account for the various influences and possible limitations when designing the AFCC design guideline.
Furthermore, in addition to some of the positive factors driving the AFCC movement, Russell presents resistance to building AFCC in her research (Russell et al., 2019). She uses the Canada Elderly Care funding project as a case study and points out that over-reliance on external factors such as volunteers and committees may cause laziness. This would affect the functioning of the community itself and the extent to which the community can truly become age-friendly. So in designing AFCC, we need to strengthen the city and the community’s mechanisms. For this dissertation, the design framework guideline will focus on improving the institutions that operate in urban communities and public places, avoiding introducing too many external factors (markets, volunteers, etc.). Thus, the dynamism of the community and urban space motivate older people to get out and enjoy the urban environment.
figures are author’s own illustration
3 08 3 LITERATURE REVIEW
AGE-FRIENDLY PUBLIC REALM IN MANCHESTER CITY CENTRE
All
unless stated AGE-FRIENDLY CITIES AND COMMUNITIES - DESIGNING AN
Figure 3.2 The WHO Age-friendly Cities Framework
3.3 Learning Best Practices From AFCC-driven Studies


Although many studies analyse the best practice of AFCC-driven studies, there are limited articles on the spatial aspect published in mainstream journals. Most of them are city-specific case studies, except for Torku, a systematic review of AFCC publications from previous years (Torku et al., 2021). All three articles are qualitative studies of ageing groups in a particular city, mainly based on focus groups and interviews. Sterns’ study focuses more on the physical dimension, i.e. the neighbourhoods and streets in the city (Sterns et al., 2020). Both elements are, to some extent, part of the public or open space in the city. He provides direction for future ageing initiatives by describing how people identify with and cannot be disconnected from their streets and neighbourhoods. Ronzi and Irmina’s study focuses more on the core elements of building age-friendly cities, and their research topic is much broader. These two studies also come to different conclusions; Irmina argues that active transport is a critical component of an age-friendly city(Klicnik and Dogra, 2019), while Ronzi believes that respect and social inclusion are at the core(Ronzi et al., 2020). Irmina’s study seems to be more oriented toward an urban design perspective. She subjectively agrees with the importance of urban design in promoting active transport and offers future age-friendly city building Ideas on active transport. These ideas are helpful for the topic in this dissertation. The reorganisation of transport is a crucial measure to strengthen the willingness of older people to go out, access public or open spaces, and establish links with society.
3.4 Recommendations For Future Development
In recent years, there has been rich literature on recommendations for future development in the AFCC research agenda. Both Stefanie and Dikken have designed a system for assessing the age-friendliness of cities and communities. Buckner proposes an evidence-based assessment tool designed to capture the complexity of age-friendly topics(Buckner et al., 2019). In contrast to Buckner, Dikken’s assessment system is in the form of a questionnaire (AFCCQ), which is more comprehensive and systematic(Dikken et al., 2020). The questionnaire covers the eight areas of the Age-Friendly Cities model proposed by WHO and an additional area on financial status. This questionnaire model will be referred to in the construction phase of the guiding framework to design this age-friendly urban public space guideline.
Moreover, Faber and Marston’s research also suggest innovative ways of building the AFCC. Faber’s proposed approach focuses more on the involvement of older people themselves in constructing the AFCC - participatory video design (von Faber et al., 2020). This approach gives older people a voice in designing their living space and improves their social profile. Unlike Faber, who concentrates on concrete and direct design tools, Marston focuses on a more macro level of integration, merging technical areas into the eight areas proposed by the WHO, resulting in a framework for an intelligent and age-friendly ecosystem.
All figures are author’s own illustration unless stated
3 09 3 LITERATURE REVIEW
AGE-FRIENDLY CITIES AND COMMUNITIES - DESIGNING AN AGE-FRIENDLY PUBLIC REALM IN MANCHESTER CITY CENTRE
Figure 3.4 Learning Best Practices From AFCC-driven Studies Figure 3.3 Mapping Challenges or Drivers to Realising AFCC
He emphasises that age-friendly design should ensure the application of a multifaceted and interdisciplinary theoretical base (Marston and van Hoof, 2019). Marston’s research is similar to Hoof’s, which does not propose a new assessment or design tools though. However, it stresses applying technology in the eight areas promoted by the WHO (Van Hoof et al., 2018). He argues that design programmes and projects do not cover these eight areas evenly and that technological tools should be introduced for continuous evaluation and validation.
AGE-FRIENDLY CITIES AND COMMUNITIES - DESIGNING AN AGE-FRIENDLY PUBLIC REALM IN


In 2020, for example, Reuter’s research pointed out that audio and radio production can be an accessible technology for older people’s participation. They are central in promoting civic voice in later life (Reuter and Liddle, 2020). However, Liddle’s individual research does not fully endorse these views. Considering the role of technology in different community contexts, he argues that design efforts should consider context and minimise the role of technology as a link between people(Liddle et al., 2020). Liddle’s view is relatively more critical and dialectical. Although technology can be an essential tool in building AFCC, it should be used in a way that considers physical and social factors.
Pedell’s research in 2021 also suggests that digital technologies should be applied to design. Unlike Marston and Hoof, Pedell’s research did not cover the eight domains of the AFCC framework. Instead, it targeted three of them: communication and information, outdoor spaces and buildings, and social participation. He argues that combining these three domains with outdoor environments and integrating them through the technological means of digital platforms can reduce the isolation of individuals and enable older people to become more actively involved in the design of AFCC (Pedell et al., 2021). In the context of this dissertation, most public or open spaces in cities are outdoor. Pedell’s findings provide a good entry point for this research - the significance of outdoor areas for older people’s communication and social engagement.
Reuterhasequallyreferredtotheimportanceofdigitaltechnologyinmanyofhisrecentresearches.LikePedell, Reuter emphasises the significance of older people as positive contributors to a digital society (Reuter et al., 2021).Hearguesthatdigitalaudioisacreativewaytoengagethepublicinaseriesofage-friendlydiscussions (Reuteretal.,2020)butisalsoanessentialmeansforolderpeopletoparticipateincityandcommunitybuilding.
Therefore, social and environmental factors prioritise promoting the AFCC movement. Boilard’s research illustrates well the significance of the social element in building AFCC. He argues that the key to expanding the AFCC movement lies in the public and social concern and response to the older people’s community (Rémillard-Boilard et al., 2021). As Flores emphasises, social inclusion and respect for older people should be a fundamental value of WHO’s initiative and cannot be considered separate (Flores et al., 2019). Han is also concerned with the proposition of the role of older people in society, and he developed a policy framework based on this proposition in 2022 (Han et al., 2022). This framework emphasises that the social status of older people should be equal to that of other age groups and points to the importance of older residents in participating in the development of community regulations.
All figures are author’s own illustration unless stated
3 10 3 LITERATURE
REVIEW
CITY CENTRE
MANCHESTER
Figure 3.5 Recommendations for Future Development
In addition to examining the social status of older people and an age-friendly policy framework, Han proposes strategies for integrating AFCC promotion into Sustainable Urban Development (SUD). He argues that developing a silver hair market can be a satisfactory means of achieving age-friendliness and an entry point for SUD (Han et al., 2021). vvv means building an age-friendly market system by expanding financial industries related to older people. Atkins also proposes a new approach to the promotion of AFCC in 2020. She presents her innovative ideas physically and socially (Atkins, 2019). Where physical factors are prioritised, urban form reconfiguration, land use planning and the reorganisation of transport are vital to the promotion of the AFCC, elements that are part of contemporary urban renewal. For this dimension, Buffel and Phillipson argue that urban regeneration requires the close involvement of older people and those close to old age to avoid potential age discrimination (Buffel and Phillipson, 2016). Furthermore, he discusses the development of AFCC in the context of globalisation, arguing that age-friendly technologies should be differentiated according to the changing character of cities.
AGE-FRIENDLY CITIES AND COMMUNITIES - DESIGNING AN AGE-FRIENDLY PUBLIC REALM IN
3.5 Conclusion
In summary, the AFCC topic has been studied to some extent by academics in the context of global ageing and increasing digitalisation. However, promoting AFCC still requires collaboration and efforts from all sectors and the government. Older people need to have the same rights and opportunities to enjoy urban spaces as the other people in the city. While there are systematic recommendations for policy and operational mechanismsin the referenced literature, thereis no guiding framework fordesigninganage-friendlyurban public realm. This dissertation will focus on the aspect of the public realm and attempt to offer suggestions for its promotion.
All figures are author’s own illustration unless stated
3 11 3 LITERATURE REVIEW
CITY CENTRE
MANCHESTER
Figure 3.6 Literature Review Summary Diagram
04 CASE STUDIES


12
Figure 4.1 The members of “The Club of Friendship Between the Generations in Akita” (photo by WHO)
4.4DISCUSSIONANDCONCLUSION 4.1THECITYOFATIKA,JAPAN 4.2THECITYOFOTTAWA,CANADA 4.3THECITYOFHONGKONG,CHINA
4.1 The City of Atika, Japan


AkitaCity is the capital of Akita Prefecture, located in the north-eastern part of Japan. In June 2018 its population was 310,407 people. The most striking demographic feature is the city’s predicted population decline and rapidly ageing profile. The proportion of the population aged 65 and over is currently around 29%. By 2040 the city’s total population is predicted to fall to 244,726, of whom 44% are predicted to be aged 65 and over. By that point, due to a sharp fall in the number of younger adults, it is estimated that the ratio of people aged 15-64 to those aged 65 and over will be around 1:1.

Creating a collaboration system to help solve regional issues with industrial-academic-government-citizen cooperation.
Promotion of various community activities by local residents with regional resources.


Developing future leaders and enhancing human resources by providing opportunities for them to fully demonstrate their experiences and abilities.
One-coin Bus Service
Older people are able to ride a bus at an affordable price, making it cheaper for them to travel around the area. This service began in 2011 by targeting people aged 70 and over and the age threshold was subsequently reduced to 65 in 2017, with the result that more than 62% of older residents that year held a one-coin certificate. Discounts and free drinks are offered by stores and bathhouses to anyone showing a certificate.
The Club of Friendship Between Generations in Akita
The intergenerational club ranges from people in their 20s to people in their 80s. It aims to encourage friendships between generations, enhancing social networks within Akita City. Through these activities, intergenerational exchanges are further promoted, helping older people to continue to be viewed as valuable and knowledgeable individuals. The group has created openly available community spaces where local residents can meet up and participate in activities.
Figure 4.2 Atika Older People Context Figure 4.3 Atika One-Coin Bus Service

A future challenge is to rebuild, reconnect, and revitalise local communities to promote social engagement and participation. This includes the need to create more social and employment opportunities for older people within the city. The age-friendly work in Akita City has also raised awareness of the importance of maintaining social connections throughout one’s life-course. Younger people, aged between 30 and 50, have realised how important it is to maintain social connections, as well as a connection to their community. Through this process, younger people also recognize the need to remain active and participate in civic activities as they age.
All figures are author’s own illustration unless stated
4 13 4 CASE STUDIES
AGE-FRIENDLY PUBLIC REALM IN MANCHESTER CITY CENTRE
AGE-FRIENDLY CITIES AND COMMUNITIES - DESIGNING AN
Information and Data Source: extranet.who.int/agefriendlyworld
Figure 4.4 Atika intergenerational friendship club
4.2 The City of Ottawa, Canada

People aged 65 and over accounted 15.4% of the city’s population that year and this is expected to rise to 22% by 2031. Ottawa is a geographically very disperse city so there is a need for age-friendly policies across urban, suburban area and rural areas. Infrastructure,development, access to health and social services, and affordable transportation options can be a particular challenge in rural communities.While a majority of older people currently live in urban or suburban areas, they represented 12.3% of the population living in rural areas in 2011 and it is expected that the size of this group will grow by an estimated 183% between 2011 and 2031.
Figure 4.5 Ottawa Older People Context


CITY OF OTTAWA OLDER ADULT PLAN 2020-2022
Four Main Strategic Areas:Aging with Choice, Transportation and Mobility, Wellbeing, Communication

Age-friendly Ottawa conducted an assessment to measure Ottawa’s age-friendliness. The assessment involved the creation of a local framework for action.


Accessibility of Outdoor Spaces and City Buildings
The City has improved the quality and accessibility of outdoor spaces and city buildings by installing 39 accessible benches, reprofiling 2,637 pavement curbs to eliminate tripping hazards, upgrading the accessibility of 13 city facilities, and rating 32 city facilities using a new Accessibility Rating Tool.
Four times a year to provide feedback on the realisation and development of the Older Adult Plan. This group of up to 15 older residents is the City’s primary mechanism for ongoing engagement and consultation with older residents on corporate and departmental programmes, services and infrastructure. It acts both as an accountability structure, by inviting older people to share their views on the development of the programme, and as a communication platform by inviting this group to identify and share emerging issues of concern to older adults.
Figure 4.6 Ottawa Accessibility Improvement
Figure 4.7 Ottawa Seniors Roundtable
On October 23, 2019, Council approved the City of Ottawa’s third Older Adult Plan 2020-2022, putting forward 24 concrete actions to make Ottawa an Age-Friendly community through City services, facilities and programs that are accessible and responsive to the needs of older adults.The OAP 2020-2022 retains the vision and long-term goals that were adopted as part of the first two Older Adult Plans:
All figures are author’s own illustration unless stated
4 14 4 CASE STUDIES
AGE-FRIENDLY PUBLIC REALM IN MANCHESTER CITY CENTRE
AGE-FRIENDLY CITIES AND COMMUNITIES - DESIGNING AN
Information and Data Source: extranet.who.int/agefriendlyworld
Seniors Roundtable
4.3 The City of Hong Kong, China
Hong Kong faces some specific challenges as it seeks to prepare for an ageing population, in which the proportion aged 65 and over is projected to rise from 14.7% in 2014 to 30% in 2034. Overall population density is among the highest in the world, with 7.3 million inhabitants in 2017 living in a small, highly urbanised area of 2.75 km2. Property prices are high and living conditions often dense and overcrowded, with air pollution and noise detracting from older people’s quality of life.
The Hong Kong Poverty Situation Report 2013 found that the poverty rate of adults aged 65 years and over was three times higher than for those below 65; in 2016, 31.6% of older people were identified as being in poverty, even after policy interventions. Social exclusion is another challenge. Many of today’s older Hong Kong population spent their lives working long hours, which inevitably restricted their community and social interaction.
Broad stakeholder engagement is at the heart of Hong Kong’s achievements, with age-friendly programmes being driven forward through the involvement of a number of NGOs, charitable bodies, non-profit organisations, philanthropists and agencies working in collaboration with each other and with older people at district level.
Intergenerational interaction is another successful feature of a number of projects, both through the sharing of facilities and the direct involvement of the younger generation in older people’s activities.


Age-friendly Accommodation
Its housing units emphasize home safety, care and support, health and wellness, so that people can grow old in their own homes.
While HKHS provides only a relatively small part (justover 4%) of Hong Kong’sextensive public housing system, it is offering affordable housing in a niche position between the expensive private sector and government public rental housing.
A Three-year Action Plan for Each District
Professional support teams from the four universities (The Chinese University of Hong Kong, Hong Kong Polytechnic University, The University of Hong Kong and Lingnan University) have worked with District Councils to develop a three-year action plan for each district, identifying directions and actions to enhance their age-friendliness.
Figure 4.8 Hong Kong Older People Context Figure 4.9 Hong Kong Age-friendly Accomodation Figure 4.10 Hong Kong Three-year Plan Action
Hong Kong public values technological advances in health services above care of the elderly and end-of-life care, in contrast to a British survey in which end-of-life care was ranked the second highest. Further shifts in public attitudes may need to be part of Hong Kong’s ongoing evolution into a more age-friendly city. Nevertheless, the progress in territory-wide engagement with the concept of age-friendliness at official, charity, NGO, community and even family levels, bodes well for future progress in Hong Kong.
All figures are author’s own illustration unless stated
4 15 4 CASE STUDIES
AGE-FRIENDLY PUBLIC REALM IN MANCHESTER CITY CENTRE
AGE-FRIENDLY CITIES AND COMMUNITIES - DESIGNING AN
Information and Data Source: extranet.who.int/agefriendlyworld
Akita’s age-friendly policy focuses on communication between older people and the community, which includes close


older people and different generational groups. Ottawa’s age-friendly policy focuses on improvements to the physical environment
enhancing access to public spaces, mainly through improvements to the public
to serve the elderly and creates accommodations where older people can age in place.
The analysis of these case studies illustrates that a successful age-friendly strategy requires an improvement in the quality of the physical
the operational logic of the policy. An age-friendly strategy should be site-specific and must define the main planning directions according to the context of the life of older people in a city.
4 16 4 CASE STUDIES All figures are author’s own illustration unless stated AGE-FRIENDLY CITIES AND COMMUNITIES - DESIGNING AN AGE-FRIENDLY PUBLIC REALM IN MANCHESTER CITY CENTRE 4.4 Discussion and Conclusion ATIKA JAPAN OTTAWA CANADA HONG KONG CHINA One-coin Bus Service YOUNG POPULATION MIGRATION SOCIAL PARTNERS TRIANGULAR RELATIONSHIPPUBLIC TRAVEL AND ACCESS TRIANGULAR RELATIONSHIPINTERGENERATIONAL CONNECTION TRIANGULAR RELATIONSHIP GEOGRAPHICALLY DISPERSEHIGH POVERTY RATE Accessibility of Outdoor Spaces and City BuildingsAge-friendly Accommodation The Club of Friendship Between Generations in Akita OVERPOPULATIONDIFFERENT SUB-GROUPSSOCIAL EXCLUSION Seniors RoundtableA Three-year Action Plan for Each District
communication
policy
services
government
generations
between government-led commercial organisations and older people and between
and participatory design for seniors. It aims to encourage older people to get out by
transport system. Hong Kong’s age-friendly
focuses on
for older people. The
encourages different
Figure 4.11 Atika Social Partners Triangular RelationshipFigure 4.12 Ottawa Public Travel and Access Triangular RelationshipFigure 4.13 Hong Kong Intergenerational Connection Triangular Relationship
space and
17 05 SITE ANALYSIS 5.1 SITE LOCATION AND BACKGROUND Figure 5.1 Manchester City Centre Permeability and Porosity Analysis Diagram 5.2 URBAN STRUCTURE AND LAND USE - MACRO AND MIDI LEVEL 5.3 SITE HISTORY 5.4 SOCIO-ECONOMIC ANALYSIS 5.5 RELATED POLICY AND STRATEGY BACKGROUND 5.6 & 5.7 LAND USE ANALYSIS- MIDI AND MICRO LEVEL 5.8 & 5.9 MOVEMENT AND ACCESSIBILITY - MACRO, MIDI AND MICRO LEVEL 5.10 BUILDING HEIGHT, DENSITY AND PUBLIC REALM - MICRO LEVEL 5.11 & 512 PERMEABILITY AND POROSITY - MIDI LEVEL & MICRO LEVEL 5.13 LEGIBILITY - MICRO LEVEL 5.14 SAFETY AND SECURITY ANALYSIS
5.1 Site Location and Background

Figure 5.2 Manchester loction in the UKFigure 5.3 Manchester city centre location


UKGreater Manchester
Greater Manchester is a metropolitan county and combined authority area in North West England; comprising ten metropolitan boroughs: Manchester, Salford, Bolton, Bury, Oldham, Rochdale, Stockport, Tameside, Trafford and Wigan.
Macro Level
Manchester is a city in Greater Manchester, England, with a population of 547,627 in 2018. The city is notable for its architecture, culture, musical exports, media links, scientific and engineering output, social impact, sports clubs and transport connections.
Manchester, as the first UKcity to join the global citynetwork of Age-Friendly Citiesand Communitiesestablishedby the WHO, is activelypromoting the Active Ageing Model recommended by the WHO. Manchester city centre is an important area for Manchester to achieve AFCC development. As global ageing continues to increase, the proportion of older residents in Manchester’s total population will increase yearly. The focus on AFCC will revitalise Manchester city centre and benefit the economic and social well-being of the city.
The analysis of urban design elements in Manchester and the evaluation of older people’s public spaces will help us identify problems in the city centre and provide a basis for subsequent urban design. The analysis will be completed through three levels: macro, midi, and micro.
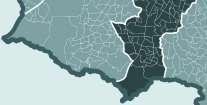
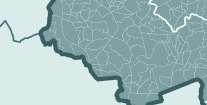
The macro level analyses Manchester city centre, which is the area bounded by the inner ring road. Midi level is an analysis of the main areas of the city centre,which are the Manchester neighbourhoods.Micro level is an analysisof the four neighbourhoods selected for the design section: Spinning fields, Civic Quarter, Chinatown and Petersfield.
Information and Data Source: www.ons.gov.uk, 2021; www.manchester.ac.uk, 2019
Figure 5.4 Manchester Inner Loop
Midi Level Micro Level
Figure 5.5 Manchester’s City Centre
Figure 5.6 Sites locations in the city centre
All figures are author’s own illustration unless stated
5 18 5 SITE ANALYSIS
REALM IN MANCHESTER CITY CENTRE
AGE-FRIENDLY CITIES AND COMMUNITIES - DESIGNING AN AGE-FRIENDLY PUBLIC
5.2 Urban Structure and Land Use - Macro and Midi Level


The area is surrounded by Manchester’s organically shaped inner ring road, which consists of arterial roads and motorways. Because of the high density and flexible form of the grid, the city centre is highly accessible and well connected. Except for the more free-form arterials, the grid of local streets in most of the city centre is a regular cross shape. While this significantly enhances communication between the various neighbourhoods in the city centre and between the city centre and the surrounding areas, the high grid density in some areas can cause a degree of congestion and harm age-friendliness (Not beneficial for active transport for older people when travelling).
Manchester’s city centre has a high density of grain. Apart from the large retail complexes, office areas and large public buildings, the city centre is made up of small, regularly arranged urban grain, which is similar in size. This form is also strongly related to the regular grid of the city centre. Thereare veryfewurbanvoidsinthecitycentre,andthespaceisverywell utilised. Someareaswherethegrainisblankaremainlyfortransport facilities such as rail and train stations. Such a grid allows for clear boundaries between neighbourhoods and increases the utilisation of public space.
Outside of Manchester’s inner ring road, there is a complex mix of building uses, and it is clear that most buildings outside the inner ring road are in residential use. Most buildings in the city centre are for office and retail use, with retail use being the most prevalent. The area to the north of the site is dominated by many large retail buildings and mixed-use developments. Thus, the main functions exercised in Manchester city centre are commercial, entertainment and office. These functions are all relevant to young people, so it is easy to see how this is a youth-friendly city in terms of land use alone, but it isn’t easy to find elements conducive to older people’s lives.
In the areas surrounded by the Inner Ring Road, the volume of blocks contained in the city centre is significantly smaller than in other areas of the Inner Ring Road (especially around Chinatown). Therefore, the city centre has a higher degree of permeability and porosity than the surrounding areas.
Block and Street Data Source: digimap.edina.ac.uk (Version: 2022), Land Use Data Source: digimap.edina.ac.uk (Version: March, 2022)
(Community Use Include: Educational, Emergency Services, Govermental, Health, Religious, Institutional and Communal Accommodation)
5 19 5 SITE ANALYSIS All
AGE-FRIENDLY CITIES AND COMMUNITIES - DESIGNING AN AGE-FRIENDLY PUBLIC REALM IN MANCHESTER CITY CENTRE
figures are author’s own illustration unless stated
Figure 5.7 Grid and Block of Manchester City CentreFigure 5.8 Grain of Manchester City CentreFigure 5.9 Land Use of Manchester City Centre
5.3 Site History


• The industrial revolution had only just begun,and the city centre had not yet been built with a railway station.


• Most of the city blocks were small and disorganised. The roads were random and rough, except for the main traffic arteries.

• The Petersfield (civic quarter) was created due to the Peterloo Massacre, which took place in 1819.
• The central railway station at Petersfield was built and became Manchester’s transport hub. The town hall in Civic Quarter was constructed and became the civic centre of Manchester.


• The blocks are reorganised, and the urban grain becomes clear.
• TThe first Chinese restaurant opened in Manchester, and Chinatown was first built, becoming one of the most important symbols of British immigrant culture.
• The Central Library in the civic quarter is built and, together with the town hall, becomes an iconic building in Manchester city centre.
• Spinningfields was initially built as the CBD of Manchester city centre.
• The urban grain of Chinatown is transformed into something more in keeping with modern times.
• The railway station at Petersfield is demolished. The original building is refurbished into the present-day convention complex.
5 20 5 SITE ANALYSIS All
AGE-FRIENDLY CITIES AND COMMUNITIES - DESIGNING AN AGE-FRIENDLY PUBLIC REALM IN MANCHESTER CITY CENTRE
figures are author’s own illustration unless stated
History Mapping Source: digimap.edina.ac.uk/historic Manchester AFC Data Source: www.manchester.gov.uk Figure 5.10 Site History Analysis
5.4 Socio-Economic Analysis
This project and analysis is concentrated on those aged 66+ based on the age at which people may be entitled to State Pension. All data and information are from Manchester City Council.


(All data are for the population of the Manchester metropolitan area)


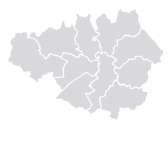
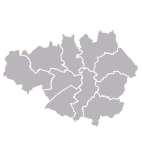

Figure 5.11 Older People Population Analysis
According to previous years’ statistics and projections from the Office of National Statistics (ONS), the number of older people in the Manchester metropolitan area has been increasing over the last ten years. It is expected to grow at an increasing rate - possibly up to 20% over the next ten years. However, the relative proportion of older people to the total urban population will remain stable, with only a tiny increase.
Figure 5.12 Older People Proportion Analysis
Since 2001, the proportion of older people in the Manchester metropolitan area has decreased yearly compared to the Greater Manchester area. However, both regions are predicted to experience an increasing trend in ageing over the next decade.
Older Manchester males are of significant risk, with HLE (health life expantacy at the age of 65) 36% than females.
Figure 5.13 Gender and Life Expectancy Analysis
Women typically live longer than men in Manchester. The life expectancy for both males and females has steadily increased over the last fifteen years. However, between 2018 and 2020, there is a significant downward trend in life expectancy for both males and females because of the effects of covid-19. And according to the report by Manchester city council, the gender gap in life expectancy is set to widen.
Figure 5.14 Deprivation and Household of Older People Analysis
Manchester city centre’s older population ranks high in England for housing poverty. And economic inequalities and mental health problems caused by unemployment among older people are worsened because of Covid-19.
All figures are author’s own illustration unless stated
5 21 5 SITE ANALYSIS
PUBLIC REALM IN MANCHESTER CITY CENTRE
AGE-FRIENDLY CITIES AND COMMUNITIES - DESIGNING AN AGE-FRIENDLY
All Aging Data Source: www.manchester.gov.uk
5.5 Related Policy and Strategy Background


Policy and Strategy Source: www.manchester.gov.uk ; www.greatermanchester-ca.gov.uk ; www.ambitionforageing.org.uk
5 22 5 SITE ANALYSIS
AGE-FRIENDLY CITIES AND COMMUNITIES - DESIGNING AN AGE-FRIENDLY PUBLIC REALM IN MANCHESTER CITY CENTRE
All figures are author’s own illustration unless stated
Figure 5.15
and Strategy Analysis
Policy
According to figure 5.16, the authors found that retail use was the most prevalent within the four sites selected, followed by office use. However, the most predominant function varied from site to site.


Figure 5.17 illustrates the reasons for selecting these four neighbourhoods as analysis and design sites out of several in the city centre. After the author’s pilot visit and observation, it was found that these neighbourhoods gave the author a very different feeling, and the main activities of the citizens were different. This helps the authors to analyse how Manchester can achieve age-friendly public spaces and streets in urban environments with different characteristics, respectively.

5 23 5 SITE ANALYSIS
AGE-FRIENDLY CITIES AND COMMUNITIES - DESIGNING AN AGE-FRIENDLY PUBLIC REALM IN MANCHESTER CITY CENTRE
5.16 Land Use of Manchester City Centre Neighbourhoods Figure 5.17 Features of Sites (Community Use Include: Educational, Emergency Services, Govermental, Health, Religious, Institutional and Communal Accommodation) Land Use Data Source: digimap.edina.ac.uk (Version: March, 2022)
All figures are author’s own illustration unless stated
5.6 Land Use - Midi Level Figure
According to the WHO and NHS England, someone over the age of 65 might be considered an older person generally. This standard will be used for all analysis and design.
Figure 5.19 MAS A Frontage and Activity Analysis
Spinningfields, the CBD of Manchester city centre, is the largest commercial area in the city, with most of the buildings being for office use. It is a civic centre for work and rest as well as entertainment. Most office buildings have ground-floor shops to provide facilities such as bars and restaurants. The area has some high-quality and well-managed public spaces. In addition to this, the MAS also contains government offices and some cultural buildings. The river fronts the area, and the buildings on the river frontage are mainly Spinningfields communities that provide residential functions. This analysis selects Two high-traffic plazas on this MAS as most activity space (MAS). This is because the author has observed that these two space have the highest activity levels. The author recorded the type and number of activities during the field observations to analyse the behavioural patterns of the elderly and the age-friendliness of these two MAS.
Figure 5.20 MAS B Frontage and Activity Analysis
The MAS plan analysis and the pilot visit results showed that MAS A and MAS B had a high proportion of active adults, with a predominance of young people. The difference between the figures on weekdays and weekends is not significant, probably because the public areas are well managed. However, the proportion of older people in this district is still very low compared to the rest of the population. MAS A has more older people than B because A has more rest areas. At the time of the visit, The author found that older people were more likely to sit in a sunny place to relax than adults.
All figures are author’s own illustration unless stated

5 24 5 SITE ANALYSIS
AGE-FRIENDLY CITIES AND COMMUNITIES - DESIGNING AN AGE-FRIENDLY PUBLIC REALM IN MANCHESTER CITY CENTRE
5.7 Land Use and Activities Analysis - Micro Level - Spinningfields Building heights and use Data Source: digimap.edina.ac.uk (Version: March, 2022)
OFFICE RETAIL MIXED-USE RECREATION EDUCATION GOVERNMENTAL TRANSPORT RELIGIOUS GREEN SPACE RESIDENTIAL SITES RED LINES Figure 5.18 Land Use of Spinningfields
Area Use and Activities Analysis - Micro Level - Petersfield

According to the WHO and NHS England, someone over the age of 65 might be considered an older person generally. This standard will be used for all analysis and design.
Figure 5.22 MAS C Frontage and Activity Analysis
Figure 5.21 Land Use of Petersfield
Petersfieldconsists mainly of several largebuildings,and the area mainly provides leisure,entertainment and retail services. Petersfield’s primary function is municipal and central business. The area is characterised by historic and regenerated conservation and high-quality modern buildings. In addition, Petersfield has more buildings with residential functions than any other area. Due to the sparse distribution of the grain, there is a relatively large amount of urbanvoidintheareabutnotalargeamountofpublicspace.ThepublicspaceofhighinvestigativevalueisthesquareinfrontoftheConventionComplex. Therefore this square was chosen as the Most Activity Space (MAS) for this analysis. The author has observed that this apce have the highest activity levels. So that to document the behaviour and friendliness of the elderly.
MAS C is more vacant than the other MAS because there are few rest facilities and relatively low pedestrian traffic as the square in front of the convention centre. However, there is a high proportion of older people. Because there are few rest facilities, people rarely choose to sit and rest at MAS C. This square mainly provides a passageway function. There is also very little active frontage in the surrounding buildings, and during the visit, it was found that older people do not choose to stay in this square.
All figures are author’s own illustration unless stated
5 25 5 SITE ANALYSIS
AGE-FRIENDLY
COMMUNITIES
DESIGNING AN AGE-FRIENDLY PUBLIC REALM IN MANCHESTER CITY CENTRE
CITIES AND
-
OFFICE RETAIL MIXED-USE RECREATION TRANSPORT GREEN SPACE RESIDENTIAL SITES RED LINES
5.7
Building heights and use Data Source: digimap.edina.ac.uk (Version: March, 2022)
5.7 Area Use and Activities Analysis - Micro Level - Civic Quarter


According to the WHO and NHS England, someone over the age of 65 might be considered an older person generally. This standard will be used for all analysis and design. Figure 5.23
Civic Quarter is the heart of Manchester city centre. Land use analysis shows that the area is complex, with a mix of office and mixed-use buildings. The centrepiece of the Quarter is Manchester’s iconic City Hall and Central Library, which provide government administration and public entertainment. The core square of the Civic Quarter is St. Peter’s Square in front of the library, which was redeveloped in 2013 as a public transport hub for the city. The square is an excellent aid to public transport, rest and circulation and welcomes people of all ages. The square is also the most crowded of all the MASs. Therefore, this square was chosen as the Most Activity Space (MAS) for this analysis. The author has observed that this apce have the highest activity levels. So that to document the behaviour and friendliness of the elderly.
MAS D is the most crowded square of all the MAS, perhaps because it is in the heart of the city centre and next to a public transport hub. There is heavy pedestrian traffic here on both weekdays and weekends. It is even more crowded on weekdays. During the visit, the author found that older people are concentrated in the eastern part of the square, near the monument, where there is a semi-enclosed public space. This is perhaps because older people would prefer a quieter location. In addition to the three main activities pictured above, there are many visitors and gatherings of people concentrated in this square.
All figures are author’s own illustration unless stated
5 26 5 SITE ANALYSIS
AGE-FRIENDLY CITIES AND COMMUNITIES - DESIGNING AN AGE-FRIENDLY PUBLIC REALM IN MANCHESTER CITY CENTRE
use Data
OFFICE RETAIL MIXED-USE RECREATION EMERGENCY SERVICE GOVERNMENTAL TRANSPORT RELIGIOUS GREEN SPACE RESIDENTIAL SITES RED LINES
Building heights and
Source: digimap.edina.ac.uk (Version: March, 2022)
Land Use of Civic Quarter Figure 5.24 MAS D Frontage and Activity Analysis
-
Figure 5.26 MAS E Frontage and Activity Analysis
According to the WHO and NHS England, someone over the age of 65 might be considered an older person generally. This standard will be used for all analysis and design. Figure 5.25 Land Use of Chinatown
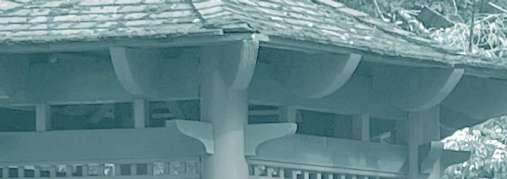
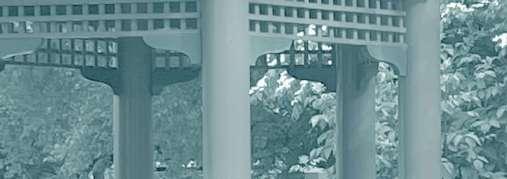
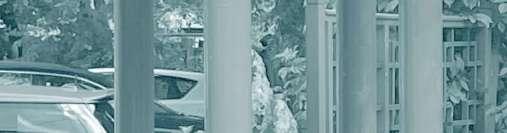
Manchester’s Chinatown is the second largest in the UK and is predominantly a restaurant and retail area, but the two functions are often mixed in one building, so most of the buildings in the area are mixed-use. The site’s landmark is the Chinese pagoda and the Chinese pavilion in the centre of the area. Chinatown is known as the city’s leading restaurant and service centre and has avery high footfall and diverse population, but the streets are very narrow.

The author selected the most central and only public area for an observational analysis to assess the behavioural patterns and age-friendliness of older people in this area. Therefore, this area was chosen as the Most Activity Space (MAS) for this analysis.
MAS E is located in the centre of Chinatown and is surrounded by active frontages providing dining and retail functions. MAS E is now used as a public car park, so the Chinese pavilion to the south of the car park was chosen for the visit. The author found that most older people do not stay in this public space and are even resistant to it. This may be because the pavilion does not look safe and may make the elderly uncomfortable. Some cyclists and pedestrians would rest in the pavilion, and it was notable that none of these people was Asian. Some undesirable behaviour, such as smoking marijuana, takes place in the pavilion. The central car park is functional and has a large throughput.
All figures are author’s own illustration unless stated
5 27 5 SITE ANALYSIS
AGE-FRIENDLY CITIES AND COMMUNITIES - DESIGNING AN AGE-FRIENDLY PUBLIC REALM IN MANCHESTER CITY CENTRE
OFFICE RETAIL MIXED-USE RECREATION GOVERNMENTAL GREEN SPACE EMERGENCY SERVICE RESIDENTIAL SITES RED LINES
5.7 Area Use and Activities Analysis - Micro Level
Chinatown Building heights and use Data Source: digimap.edina.ac.uk (Version: March, 2022)
5.8 Movement and Accessibility - Macro and Midi Level
Figure 5.27 Movement AnalysisFigure 5.28 Accessibility Analysis


Manchester city centre is within the area of the inner ring road. The inner ring road consists mainly of primary roads and a motorway section. A roads and B roads connect the various areas of the city centre to this inner ring road, enhancing the links between the city centre and the multiple areas and between the city centre and the outer areas of Manchester. The density of the A and B roads around the sites is higher than in other parts of the city centre.


The city centre has high accessibility to other parts of Manchester in terms of macro and midi levels. The diagram above mainly shows rail access to tram and train, which are connected via two transport hubs, Piccadilly and Victoria. Any part of the city centre is easily accessible to the tram station and thus to other parts of Manchester. Alternatively, Older people can access the train station via tram to reach other cities. Roads Hierarchy Data Source: digimap.edina.ac.uk (Version: March, 2022), Public Transport Data Source: tfgm.com


All figures are author’s own illustration unless stated


5 28 5 SITE ANALYSIS
AGE-FRIENDLY
AGE-FRIENDLY PUBLIC REALM IN MANCHESTER CITY CENTRE
CITIES AND COMMUNITIES - DESIGNING AN
5.9 Movement and Accessibility - Micro Level - Spinningfields


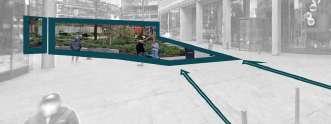


Figure 5.29 Movement Analysis of Spinningfields
Figure 5.32 Accessibility Analysis of Spinningfields


Figure 5.30 Gartside StreetFigure 5.31 A56Figure 5.33 Bus Station and Stop on A56

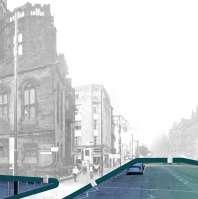
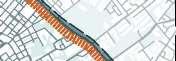
MAS A has almost no direct connection to the vehicle road. There is only a degree of communication with the local street of Gartside Street, as shown in figure 5.30. MAS A is surrounded almost entirely by pedestrian-friendly areas. This is one of the reasons for the high number of older people in this area. Pedestrian friendliness helps to promote active transport for older people and avoids causing social isolation. However, MAS B is next to the heavily trafficked A road, which has resulted in the square becoming a completely open space with very few older adults staying there.
MAS A is very pedestrian friendly, but the nearest bus stop to MAS A is quite far away; MAS B has two bus stops next to it and is much more accessible. The A56 is about 15m wide, which creates a barrier to walking between MAS B and MAS D. At the visit, it was found that there was a high volume of pedestrian traffic on the pavement to the east of MAS B. This suggests a high demand for communication between the two blocks east and west of the A56. Even though MAS B is elementary to reach by public transport, there is still a small proportion of older people on the square.
Roads Hierarchy Data Source: digimap.edina.ac.uk (Version: March, 2022), Public Transport Data Source: tfgm.com, Base Photo Source: www.google.co.uk/maps
All figures are author’s own illustration unless stated
5 29 5 SITE ANALYSIS
AGE-FRIENDLY PUBLIC REALM IN MANCHESTER CITY CENTRE
AGE-FRIENDLY CITIES AND COMMUNITIES - DESIGNING AN
5.9 Movement and Accessibility - Micro Level - Petersfield


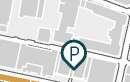
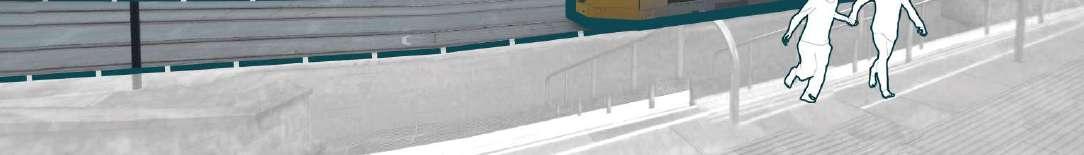


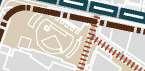


Figure 5.34 Movement Analysis of Petersfield
Figure 5.36 Accessibility Analysis of Petersfield
Figure 5.35 Pedestrian Area and Oxford StreetFigure 5.37 Tram next to MAS C
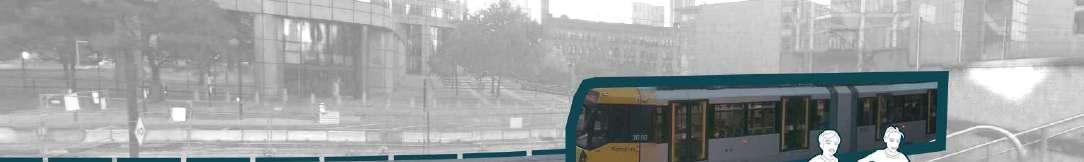
An A-road and a minor road bound MAS C, and the road grid is sparse throughout Petersfield, so there are many more pedestrianised areas than other parts of the city centre. All of MAS C is pedestrian-friendly, and through these pedestrian areas MAS C is directly connected to the Great Northern Square in the northwest corner. This square is adjacent to Spinngfields. The author found that this square has low footfall at the time of the visit, but a high proportion of older people stay there. This may be due to the sparse grid resulting in a quieter environment.
There is a tram track next to MAS C, but no tram station. In addition, there is no free bus route next to the MAS, so its accessibility is limited. However, as the MAS C is very walkable, elderly people can reach the square on foot via the tram stop in the civic quarter to the north. As the entrance plaza to the Manchester convention complex, MAS C should have better access to the public transport network in order to meet the high demand at certain times (e.g. for exhibitions).
Roads Hierarchy Data Source: digimap.edina.ac.uk (Version: March, 2022), Public Transport Data Source: tfgm.com, Base Photo Source: www.google.co.uk/maps
All figures are author’s own illustration unless stated
5 30 5 SITE ANALYSIS
AGE-FRIENDLY
AGE-FRIENDLY PUBLIC REALM IN MANCHESTER CITY CENTRE
CITIES AND COMMUNITIES - DESIGNING AN
5.9 Movement and Accessibility - Micro Level - Civic Quarter


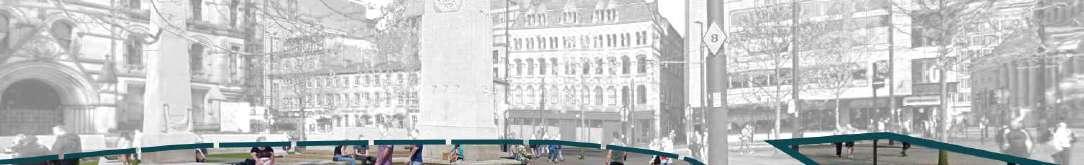


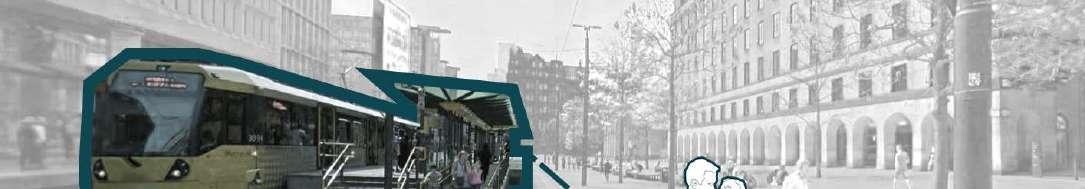
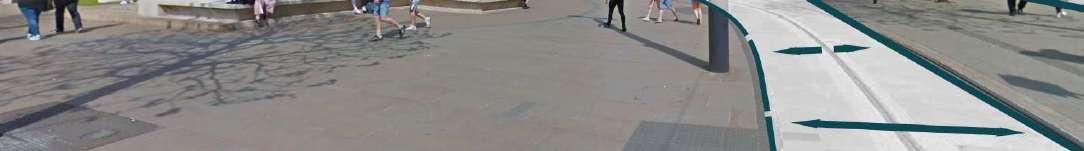
Figure 5.38 Movement Analysis of Civic Quarter

Figure 5.40 Accessibility Analysis of Civic Quarter
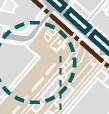
Figure 5.39 Pedestrian Area in the Civic QuarterFigure 5.41 Tram Station next to the Civic Quarter
The central area of the civic quarter is almost entirely pedestrianised, and there are no carriageways in this area. This is one of the reasons why MAS D is so heavily patronised. The pedestrian zone provides direct access to MAS C in Petersfield to the south and MAS B in Spinningfields to the west so that MAS D can be the central hub of the whole age-friendlypedestriansystem. In addition to the central area, the Civic Quarter is surrounded by a circle of A roads and the rest of the inner area has a dense grid, which makes it very reachable from all parts of the area.
St Peter’s Square, the central tram station for the whole of Manchester city centre, is well integrated with the pedestrianised area of the civic quarter centre. The tram tracks do not clash with the pedestrian area and people can walk unhindered when no trams are passing through. This is one of the reasons why the number ofelderly peopleis the highest. The entire area ofthe Civic Quarter has high accessibility,with a large number of car parks, bus routes, and bus stops. However, the area inevitably suffers from the worst congestion.
Roads Hierarchy Data Source: digimap.edina.ac.uk (Version: March, 2022), Public Transport Data Source: tfgm.com, Base Photo Source: www.google.co.uk/maps
All figures are author’s own illustration unless stated
5 31 5 SITE
ANALYSIS
AGE-FRIENDLY
AN AGE-FRIENDLY PUBLIC REALM IN MANCHESTER CITY CENTRE
CITIES AND COMMUNITIES - DESIGNING
5.9 Movement and Accessibility - Micro Level - Chinatown

Figure 5.42 Movement Analysis of ChinatownFigure 5.44 Accessibility Analysis of Chinatown Figure 5.45 China Town Car Park Figure 5.43 The Entrance of MAS E and Nicholas Street next to it
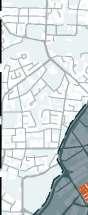
Two A-roads bound Chinatown. The internal roads are all local class roads. The roads around MAS E are narrow two-lane roads, approximately 6.5m wide, and access to MAS E is via the pavilion shown in Figure 5.43. The narrow lanes are prone to traffic congestion and are therefore restricted to one-way traffic on some roads. In addition, the pedestrian areas on both sides of the road are small, so older people do not usually choose to spend time at this MAS; they mostly come to Chinatown to eat and shop.
MAS E now functions as a public car park. As the only parking site in the entire Chinatown area, the car park is used by many vehicles, proving that there is indeed a significant demand for parking space. The car park is an enclosedareawith only one entranceand exit, and pedestrians can accessthe car park via the circle shown in Figure 5.45. The space is rarely accessed by the elderly because of the closed sight on MAS E. Otherwise, there are many bus stops throughout Chinatown, and accessibility is good.


Roads Hierarchy Data Source: digimap.edina.ac.uk (Version: March, 2022), Public Transport Data Source: tfgm.com, Base Photo Source: www.google.co.uk/maps


All figures are author’s own illustration unless stated
5 32 5 SITE ANALYSIS
AGE-FRIENDLY
AGE-FRIENDLY PUBLIC REALM IN MANCHESTER CITY CENTRE
CITIES AND COMMUNITIES - DESIGNING AN
5.10 Building Height, Density and Public Realm - Micro Level - Spinningfields


Figure 5.47 Street, Square and Building Section Analysis of Spinningfields
Figure 5.48 MAS A A-A Section Analysis and public realm assessment
Figure 5.49 MAS B B-B Section Analysis and public realm assessment
Because it is an assessment of the quality of public spaces based on age-friendliness, the total score for the age-friendliness aspect is double that of the other items. This increases the weighting of the elderly experience in the assessment results. So, while the general aspect scores 5 out of 5, the ‘suit to the elderly’ item scores 10 out of 10. The principles of assessment are based on ‘THE COUNCILLOR’S GUIDE TO URBAN DESIGN’ by CABE.
The buildings in Spinningfields are generally high in height, and the building density is also higher compared to other areas. Most of the buildings are over 40m in height. The tall building density results in very little space between buildings, so pedestrians walking through them can feel very oppressive. This may be because Spinningfields is the CBD of Manchester city centre, and most buildings are modern with glass facades. MAS A and MAS B are one of the few public squares in the Spinningfields area and are surrounded by the tallest buildings of all the MASs; MAS B is a more confined space than MAS A. MAS A has more comfortable proportions in terms of width and height ratio.
Based on an assessment of the quality of public space in urban design principles, the author found that MAS A has a significantly better quality of age-friendly public space than MAS B. MAS A has a safer environment, is more holistic for older people and is more attractive greenery. In addition, MAS A was also the highest total rated of all the MASs. This is probably because it has been improved as a whole in the last three years.
Building heights Data Source: digimap.edina.ac.uk (Version: March, 2022), Assessment Principles of Public Realm: www.designcouncil.org.uk
All figures are author’s own illustration unless stated
5 33 5 SITE ANALYSIS
PUBLIC REALM IN MANCHESTER CITY CENTRE
AGE-FRIENDLY CITIES AND COMMUNITIES - DESIGNING AN AGE-FRIENDLY
Figure 5.46 Building Height Analysis of Spinningfields
5.10 Building Height, Density and Public Realm - Micro Level - Petersfield


AGE-FRIENDLY CITIES AND COMMUNITIES - DESIGNING AN AGE-FRIENDLY
Figure 5.51 Street, Square and Building Section Analysis of Petersfield
Figure 5.52 MAS C A-A Section Analysis and public realm assessment
Because it is an assessment of the quality of public spaces based on age-friendliness, the total score for the age-friendliness aspect is double that of the other items. This increases the weighting of the elderly experience in the assessment results. So, while the general aspect scores 5 out of 5, the ‘suit to the elderly’ item scores 10 out of 10. The principles of assessment are based on ‘THE COUNCILLOR’S GUIDE TO URBAN DESIGN’ by CABE.
Petersfield’s grain is relatively sparse, so building density is low. But Petersfield has a landmark high-rise building, Beetham Tower, which at 169 metres is one of the thinnest skyscrapers in the world. This may also be one of the reasons for the very low density of buildings around this building. MAS C is the entrance plaza to the Convention Complex, forming a sizeable width-to-height ratio with the surrounding buildings. Therefore, walking through the plaza feels unusually empty, and the boundaries between the plaza and the surrounding facilities are unclear. This seems to lead to a certain degree of insecurity, as there is no clear division between private and public. However, as a primarily traffic-oriented square, the initial design did not take into account that people would choose to stay here.
There is a lack of greenery on MAS C, and the only greenery on the square is the street trees on Windmill Street. There is only one public art facility in the whole square, but this facility provides a place for people to rest. For the elderly, the square does not inspire them to stay, as the tram on the south side of the square makes a lot of noise and the elderly would prefer a quieter place. However, MAS C is also not an obstacle to active traffic and walking. Therefore, the overall rating for this square’s public space quality is moderate.
Building heights Data Source: digimap.edina.ac.uk (Version: March, 2022), Assessment Principles of Public Realm: www.designcouncil.org.uk
All figures are author’s own illustration unless stated
5 34 5 SITE ANALYSIS
REALM IN MANCHESTER CITY CENTRE
PUBLIC
Figure 5.50 Building Height Analysis of Petersfield
AGE-FRIENDLY CITIES AND COMMUNITIES - DESIGNING AN AGE-FRIENDLY
5.10 Building Height, Density and Public Realm - Micro Level - Civic Quarter


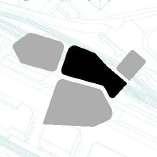

Figure 5.54 Street, Square and Building Section Analysis of Petersfield
Figure 5.55 MAS D A-A Section Analysis and public realm assessment
Because it is an assessment of the quality of public spaces based on age-friendliness, the total score for the age-friendliness aspect is double that of the other items. This increases the weighting of the elderly experience in the assessment results. So, while the general aspect scores 5 out of 5, the ‘suit to the elderly’ item scores 10 out of 10. The principles of assessment are based on ‘THE COUNCILLOR’S GUIDE TO URBAN DESIGN’ by CABE.
The Civic Quarter has a relatively appropriate density and height of buildings. The area has a high number of protected historical buildings. The size of the buildings is well controlled, and there are no skyscrapers or over-density in the area. The city council, the Civic Quarter’s central building, is one of the tallest buildings in the area. MAS D next to it and MAS C function to some extent, in the same way, both being transportable squares, but they are different in nature. MAS C is an entrance transport square, and MAS D is a transport hub, a pedestrian and public transport hub in the centre of Manchester, providing a place for people to rest, meet, and disperse. It has a comfortable pedestrian scale in terms of width to height ratio.
MAS D also scores highly in terms of the quality of age-friendly public spaces. It provides a more private and quiet semi-enclosed public space for seniors and features high-quality urban furniture and greenery in the plaza. The proximity to public transport hubs also promotes active transport for older people, increasing their desire to travel and socialise. However, due to the high volume of pedestrian traffic and the lack of management in some areas, some of the facilities in the square are old and uncivilised, such as graffiti and littering. The overall rating for MAS D is, therefore, still lower than MAS A.
Building heights Data Source: digimap.edina.ac.uk (Version: March, 2022), Assessment Principles of Public Realm: www.designcouncil.org.uk
All figures are author’s own illustration unless stated
5 35 5 SITE ANALYSIS
REALM IN MANCHESTER CITY CENTRE
PUBLIC
Figure 5.53 Building Height Analysis of Civic Quarter
AND

5.10 Building Height, Density and Public Realm - Micro Level - Chinatown


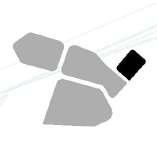


Figure 5.56 Building Height Analysis of Chinatown
Figure 5.57 Street, Square and Building Section Analysis of Chinatown

Figure 5.58 MAS E A-A Section Analysis and public realm assessment
Because it is an assessment of the quality of public spaces based on age-friendliness, the total score for the age-friendliness aspect is double that of the other items. This increases the weighting of the elderly experience in the assessment results. So, while the general aspect scores 5 out of 5, the ‘suit to the elderly’ item scores 10 out of 10. The principles of assessment are based on ‘THE COUNCILLOR’S GUIDE TO URBAN DESIGN’ by CABE.
Most of the buildings in Chinatown are relatively old and were built around the same time. The height of the buildings on the west side of MAS E is therefore generally maintained at around 20m. Although the buildings are not very tall, the small scale of the roads in Chinatown (probably all around 6m wide) and the small ratio of width to height can create a certain degree of oppression for pedestrians walking along the streets. The scale of MAS E is comfortable compared to the road, although it is not currently used as open public space. The pedestrian entrance to MAS E has several benches set into the street, but the proximity of these facilities to the roadway makes this place too open, and few elderly people rest here.
In terms of age-friendliness, MAS E scores the lowest. This is largely down to the unreasonable functions it has in place. During the site visit, the authors identified many unsafe elements at the entrance to MAS E (drinking alcohol, smoking marijuana, etc.), which do not contribute to a friendly environment for older people. MAS E is situated in the heart of Chinatown and has a lot of immigrant cultural public art and dense street trees, which is the potential and advantage of its transformation into an open public space.
Building heights Data Source: digimap.edina.ac.uk (Version: March, 2022), Assessment Principles of Public Realm: www.designcouncil.org.uk
All figures are author’s own illustration unless stated
5 36 5 SITE ANALYSIS
IN MANCHESTER CITY CENTRE
AGE-FRIENDLY CITIES
COMMUNITIES - DESIGNING AN AGE-FRIENDLY PUBLIC REALM
5.11
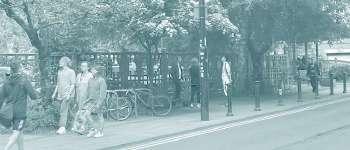
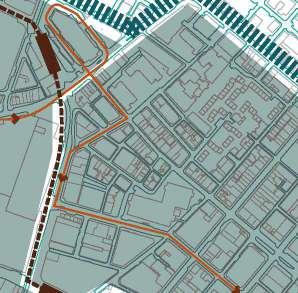
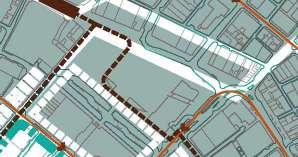
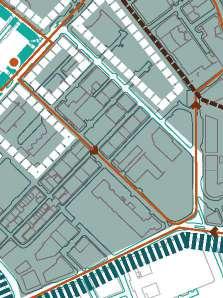
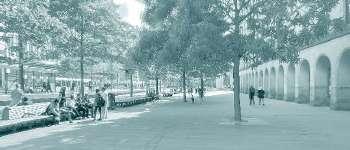
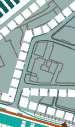
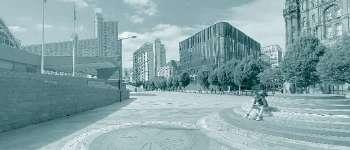
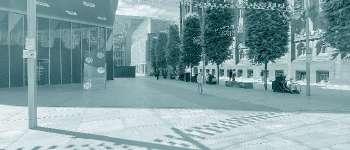
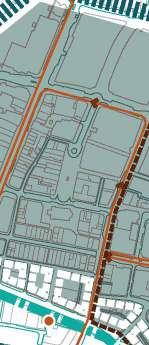
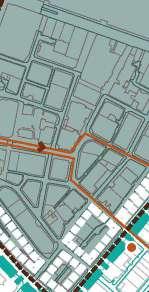
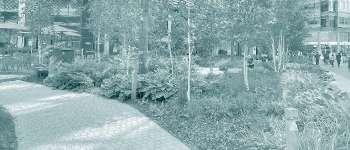
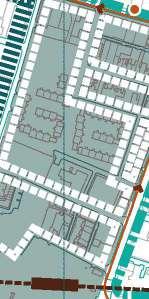
Permeability and Porosity - Midi Level


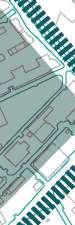

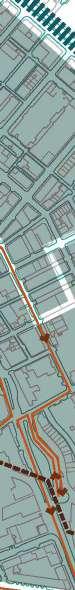


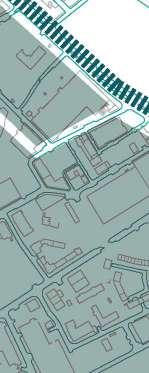


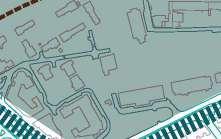

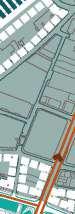


(the easier to access the higher the score)
(the easier to see the higher the score)

5 37 5 SITE ANALYSIS
AGE-FRIENDLY PUBLIC REALM IN MANCHESTER CITY CENTRE
All figures are author’s own illustration unless stated AGE-FRIENDLY CITIES AND COMMUNITIES - DESIGNING AN
Roads and buildings Data Source: digimap.edina.ac.uk (Version: March, 2022), Public Transport Data Source: tfgm.com, Assessment Principles of Permeability: Bentley et al (1985) Figure 5.59 Permeability and Porosity Analysis of Manchester City Centre
5.12 Permeability and Porosity - Micro Level - Spinningfields


Figure 5.60 Permeability and Porosity Analysis of Spinningfields
Figure 5.61 MAS A Permeability and Porosity AnalysisFigure 5.62 MAS B Permeability and Porosity Analysis

MAS A
The assessed score for the permeability of MAS A is 3, which is not an excellent result. This is probably because the MAS is not directly accessible by car and bus. Older people cannot directly observe the MAS from a distance because of the high and dense buildings surrounding it.
MAS B has a high degree of permeability and porosity, mainly due to its proximity to the A56 and semi-open layout. The complete eastern boundary of MAS B is adjacent to a driveway and bus route, so this boundary is completelyopen. Strictly speaking, there are no specific entrances or exits.
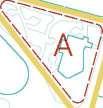
Carriageways and pedestrian areas densely cover the Spinningfields area, and a bus route runs through the area. The physical permeability of the area is, therefore, very high. In terms of visual permeability, some public spaces are less visible due to the high density of buildings and the low width of the roads.
However, the high density of buildings also allows for easy pedestrian access between buildings, and the buildings do not form a block without gaps. Hence, the area has a high porosity. For older people, the greater permeability and porosity help them to explore the area, increase their interaction with the community and avoid segregation. Therefore, the Spinningfields area has an essential age-friendly context.
Roads and buildings Data Source: digimap.edina.ac.uk (Version: March, 2022), Public Transport Data Source: tfgm.com
All figures are author’s own illustration unless stated
5 38 5 SITE ANALYSIS
AGE-FRIENDLY CITIES AND COMMUNITIES - DESIGNING AN AGE-FRIENDLY PUBLIC REALM IN MANCHESTER CITY CENTRE
5.12 Permeability and Porosity - Micro Level - Petersfield
MAS C has the same permeability rating as MAS B, probably because they have a similar layout; MAS C is also a semi-open square, with its eastern and southern edges in direct contact with the roadway, which is entirely open. And MAS C is not surrounded by dense buildings and can easily be observed by the elderly. This is why a large proportion of older people are present at this MAS (according to Figure 5.22).
The Petersfield area has an average density of vehicle lanes with a tram line in the centre. The permeability is high because several bus routes are spread across the area and many roads for bicycles. Most of the public spaces in Petersfield are easily observable and walkable.
The buildings in this area are mostly large in mass, and some have excessive lengths and heights. Therefore the porosity is of average grade, and some places require a detour to reach. This is not really friendly for older people, as it is easy to get bored walking in the open.
Roads and buildings Data Source: digimap.edina.ac.uk (Version: March, 2022), Public Transport Data Source: tfgm.com
All figures are author’s own illustration unless stated

5 39 5 SITE ANALYSIS
AGE-FRIENDLY CITIES AND COMMUNITIES - DESIGNING AN AGE-FRIENDLY PUBLIC REALM IN MANCHESTER CITY CENTRE
Figure 5.63 Permeability and Porosity Analysis of Petersfield
Figure 5.64 MAS C Permeability and Porosity Analysis
5.12 Permeability and Porosity - Micro Level - Civic Quarter

Figure 5.66 MAS D Permeability and Porosity Analysis
MAS D has the highest permeability score and the square is easily accessible by foot and public transport. And because MAS D is in the heart of the city centre, it is part of a large pedestrianised square with no buildings around it, so it is straightforward to observe. MAS D is bordered by only one carriageway. It serves the functions of passage, rest and assembly so that pedestrian flow fills the entire MAS. In summary, this is the most reachable MAS for older people, in line with the previous site study.
The Civic Quarter has a high degree of permeability, and the roads in this area are very dense. In this area, older people have a variety of travel options. This area’s public and pedestrian spaces are concentrated in MAS D and the area around MAS D. These spaces are easily accessible to older people. In terms of visual permeability, the public spaces are easily observable due to the high level of pedestrian flow.
There are long blocks in the Civic Quarter, but these blocks do not have sufficient gaps for pedestrians in between. The relatively low porosity of this area does not really affect the mobility of older people much, as most of the longer blocks are office buildings.
All figures are author’s own illustration unless stated

5 40 5 SITE ANALYSIS
AGE-FRIENDLY CITIES AND COMMUNITIES - DESIGNING AN AGE-FRIENDLY PUBLIC REALM IN MANCHESTER CITY CENTRE
Roads and buildings Data Source: digimap.edina.ac.uk (Version: March, 2022), Public Transport Data Source: tfgm.com
Figure 5.65 Permeability and Porosity Analysis of Civic Quarter
5.12 Permeability and Porosity - Micro Level - Chinatown

NICHOLASSTREETFAULKNERSTREET
MAS E has the lowest rating of all MASs. The MAS is not easily observable, possibly due to the narrow streets surrounding it and the ring of street trees around the square. The buildings surrounding the square are not very tall but are dense. The MAS is not directly accessible via the public transport system. It is difficult for older people, who are generally unfamiliar with the internet, to explore the MAS on their own if they are not trying to reach the square specifically for the purpose.
The permeability of the Chinatown area is average, and although the carriageway is dense, the width of these roads is generally narrow. There is one bus line in the area, and the Tram line does not pass through the area. There are few public spaces in Chinatown, only the spaces next to the streets around MAS E. These public spaces are difficult to access by public transport. These public spaces are difficult to access by public transport. The visual permeability of the area is also complex for the elderly to observe. The block sizes in this area are appropriate, and there are direct pedestrian gaps between the blocks. This is why the area has a high porosity, and older people can access MAS E from anywhere outside of Chinatown through these gaps in the blocks, probably due to the retail and restaurant function of Chinatown itself. The higher porosity is related to the desire of pedestrians to consume.
Roads and buildings Data Source: digimap.edina.ac.uk (Version: March, 2022), Public Transport Data Source: tfgm.com
All figures are author’s own illustration unless stated
5 41 5 SITE ANALYSIS
AGE-FRIENDLY CITIES AND COMMUNITIES - DESIGNING AN AGE-FRIENDLY PUBLIC REALM IN MANCHESTER CITY CENTRE
Figure 5.67 Permeability and Porosity Analysis of Chinatown
Figure 5.68 MAS E Permeability and Porosity Analysis
MAS E
5.13 Legibility - Micro Level - Spinningfields


M1


Figure 5.70 Landmarks of Spinningfields
M1 Manchester Crown Court
M2 Manchester Magistrates’ Court
M3 John Rylands Research Institute and Library
M4 Manchester Opera House
In 1956 the City of Manchester Quarter Sessions and Assize Court were replaced by the Crown Court. A local court attached to the City of Manchester.
A late-Victorian neo-Gothic building. It is part of the University of Manchester.
The theatre opened as the New Theatre in 1912, renamed the New Queen’s Theatre in 1915 and as the Opera House in 1920
A node in a riverside residential area. The node is connected to a pedestrian bridge and provides a public space for local residents.


A node at the north-east corner of MAS A, with facilities such as food services and retail shops nearby. It is the intersection of several pedestrian routes.
A node in front of the courthouse providing a public space. A temporary market is sometimes held here.
A node located to the east of MAS B. The N4 can be used as a signed entrance to the Spinningfields area.
Figure 5.69 Legibility Analysis of Spinningfields
The paths in this area have no particular characteristics, but because the surrounding buildings are generally high-rise, there is almost always only one separate building between the paths.
Theedgesconsistofthreemaincarriageways and the river Irwell. The boundaries of this area are very distinct.
All figures are author’s own illustration unless stated
5 42 5 SITE ANALYSIS
AGE-FRIENDLY
AN AGE-FRIENDLY PUBLIC REALM IN MANCHESTER CITY CENTRE
CITIES AND COMMUNITIES - DESIGNING
Roads and buildings Data Source:
(Version: March, 2022)
digimap.edina.ac.uk
M2 M3 M4
5.13 Legibility - Micro Level - Petersfield


Figure 5.71 Legibility Analysis of Petersfield
M5 Beetham Tower
Beetham Tower (also known as the Hilton Tower) is a 47-storey mixed use skyscraper.
M6 AXIS Manchester
AXIS (also known as the Axis Tower) is a tower in Manchester city centre.
M7 Manchester Central Convention Complex
M8 The Bridgewater Hall

An exhibition and conferencecentre converted from the former Manchester Central railway station.
The hall is home to The Hallé orchestra and the Hallé Youth Orchestra and Choir, and is the primary concert venue for the BBC Philharmonic.
A node located to the eastof Great Northern Square.It is the intersection of two paths, and there is public space at this node.
A node at the intersection of the tram line, the carriageway and the footpath, a characteristic site in the Petersfield area with views of the iconic buildings.
A node to the south of the exhibition centre, at the intersection of the tram line and the carriageway. The features are essentially the same as those of N6.

A node at the intersection of the Petersfield area and the Civic Quarter area. The main feature is the concentration of pedestrian routes. From this node, the Manchester Central Library can be observed.
The paths in this area are relatively sparse. Most of the buildings are large, so paths are generally spaced far apart from each other.
The edges consist of two A roads and a river. The boundaries of the river are less distinct.
All figures are author’s own illustration unless stated
5 43 5 SITE ANALYSIS
COMMUNITIES
DESIGNING AN AGE-FRIENDLY PUBLIC REALM IN MANCHESTER CITY CENTRE
AGE-FRIENDLY CITIES AND
-
Roads and buildings Data Source: digimap.edina.ac.uk (Version: March, 2022)
Figure 5.72 Landmarks of Petersfield
M5
M6 M7 M8
5.13 Legibility - Micro Level - Civic Quarter


M9 M10 M11 M12
Figure 5.74 Landmarks of Civic Quarter
M9 Abraham Lincoln Statue
M10 Manchester City Council
M11 Manchester Cenotaph
M12 Manchester Central Library
The statue was one of two presented to the people of England by Charles Phelps Taft.
Manchester Town Hall is a Victorian, Neo-gothic municipal building in Manchester.


Manchester Cenotaph isa war memorialin StPeter’s Square.
Manchester Central Library is the headquarters of the city’s library and information service.
A node located around the M9. It is a memorial square that serves as a public space for people to rest and visit.
The node located to the west of the town hall. It is the intersection of four paths and exists mainly as a meeting point for traffic.
The node around MAS D. As the central node in the Manchester city centre, it is the core node of the pedestrian zone.
The node to the eastof StPeter’s tram station. The primaryfunction is as atransport node, providing a link between public transport and pedestrian traffic.

Figure 5.73 Legibility Analysis of Civic Quarter
The area is densely populated with paths of various types,both vehicular and pedestrian. One can perceive the different features of the area from the different paths.
The edges consist of four main carriageways - the A roads. The boundaries of this area are obvious.
All figures are author’s own illustration unless stated
5 44 5 SITE ANALYSIS
AGE-FRIENDLY
AND COMMUNITIES - DESIGNING AN AGE-FRIENDLY PUBLIC REALM IN MANCHESTER CITY CENTRE
CITIES
Roads and buildings Data Source: digimap.edina.ac.uk (Version: March, 2022)
5.13 Legibility - Micro Level - Chinatown


Figure 5.75 Legibility Analysis of Chinatown
M13 Manchester Art Gallery
M14 The Portico Library
M15 Arch of Chinatown
Formerly Manchester City Art Gallery, is a publicly owned art museum on Mosley Street.
An independent subscription library designed in the Greek Revival style by Thomas Harrison of Chester.
The paifang, underneath which road traffic passes, was specially built in China and shipped over in three containers.

The node at the southwest corner of MAS E serves as the intersection of two paths, and its primary function is traffic. There are facilities for pedestrians to rest next to the node.
The node in the southeast corner of MAS E is the intersection of two paths and is mainly used for traffic. The node is marked with the landmark M15.
The node in the north-west corner of MAS E is a traffic node where bus and car routes converge.
The node in the northeast corner of MAS E has approximately the same essential characteristics and functions as N15.
The area is relatively dense with paths. Most of the paths are of a suitable volume and have the character of open blocks. The unique scale and atmosphere of this area’s path can prolong people’s time hanging out and shopping here.
The edges are made up of two A roads and two local streets. The boundaries are less distinct than in other areas.
All figures are author’s own illustration unless stated
5 45 5 SITE ANALYSIS
AN AGE-FRIENDLY PUBLIC REALM IN MANCHESTER CITY CENTRE
AGE-FRIENDLY CITIES AND COMMUNITIES - DESIGNING
Roads
and buildings Data Source: digimap.edina.ac.uk (Version: March, 2022)
Figure 5.76 Landmarks of Chinatown M13M14 M15
Safety and Security Analysis
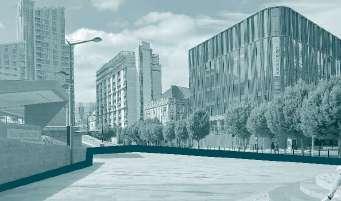


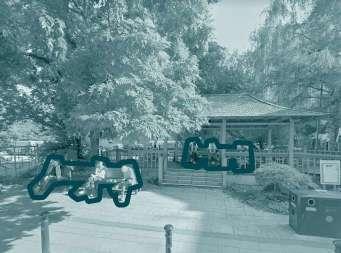


• Unit: Number of crimes incidents contained in each cell.
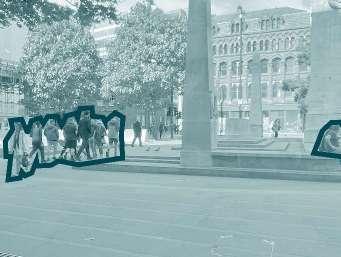
• Natural breaks (jenks) are used to classify the data in order to ensure readability and referenceability.
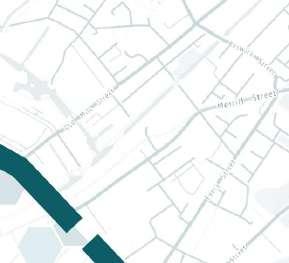
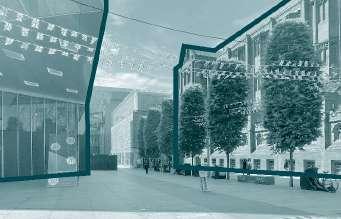
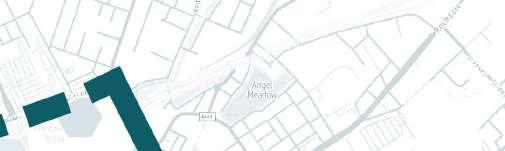
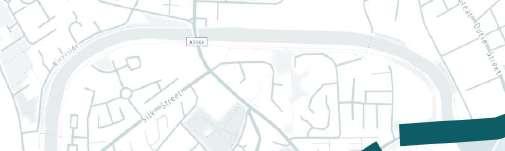

• All crime types counted in the Manchester in 06/2019 include: anti-social behaviour, bicycle theft, burglary, criminal damage and arson, drugs, possession of weapons, public order, robbery, shoplifting, theft from the person, vehicle crime and violence and sexual offences.
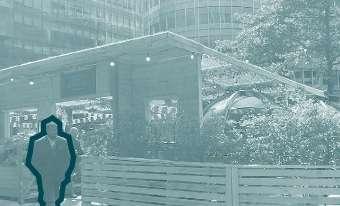


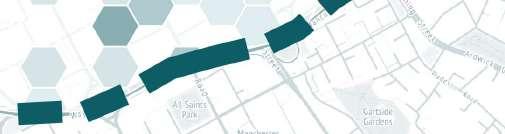
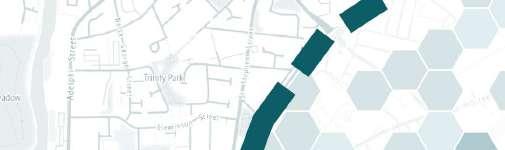
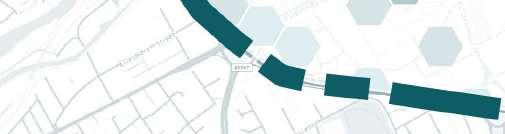

• Limitation: There is no avaliable crime data containing specific locations after 06/2019 online by now.
According to the crime type statistics for Manchester central from June 2021 to May 2022, violent crime was the most prevalent crime type. The next most common type of crime is theft. However, there have been no serious crimes such as homicide or sexual assault in Manchester during this period.
MAS A (Hardman Square) is a well-managed public green space, andafter a sitevisit, itwasfound to be of high quality but lacking in street lighting. Although few older people enter the square, they do not resist passing through the MAS. The buildings with many glass windows surrounding the square provide “eyes on the street” and ensure its safety.
MAS B is relatively unsafe in terms of the crime density analysis diagram. During the site visit, the author found that the two buildings enclosing the square, one of which was not yet in use and one with a fully enclosed façade and no street lighting, were more unsafe. One of the older people interviewed stated that he would not usually visit this square.
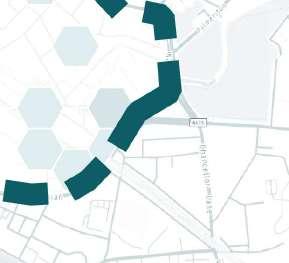
MAS C is the entrance plaza in front of the exhibition complex. This public space is very vacant and mainly provides access, but with minimal pedestrian traffic. The plaza is surrounded by major traffic arteries and has street lighting. In the crime density diagram, the author found this MAS to be relatively safe with a low density of crime incidents. Two older adults interviewed said they would stop to rest when crossing this square.
MAS D is highly pedestrianised as it is the closest to the city centre, there are street lights and other night-time security facilities around the MAS, and the author found police patrols on the MAS during the fieldwork. During interviews, the author found that some elderly people choose to stay around the Manchester cenotaph to rest. This MAS is also the least crime-intensive area.
MAS E is currently used as a car park, and the main public area is the Chinese pavilion at the entrance to the car park. The pavilion is an enclosed space, which the author found to be relatively private during the site visit. There are uncivilised behaviours, such as smoking marijuana and sleeping in this space. So the safety situation is poor. Very few older people were seen staying in this area. This MAS also has the highest crime density of the five MASs.
All figures are author’s own illustration unless stated
5 46 5 SITE ANALYSIS
AGE-FRIENDLY CITIES AND COMMUNITIES - DESIGNING AN AGE-FRIENDLY PUBLIC REALM IN MANCHESTER CITY CENTRE
5.14
Crime Data Source: data.police.uk (version: 2019-06) ; www.ukcrimestats.com
5.77 Crime and Security Analysis Figure 5.78 Crime Type Analysis MAS A SECURITY STAFF NOT YET USED WINDOWS ARE BLOCKED OPEN AND UNSUPERVISED HIGH PEDESTRIAN FLOW ENCLOSED SPACE MAS B MAS C MAS D MAS E
Figure
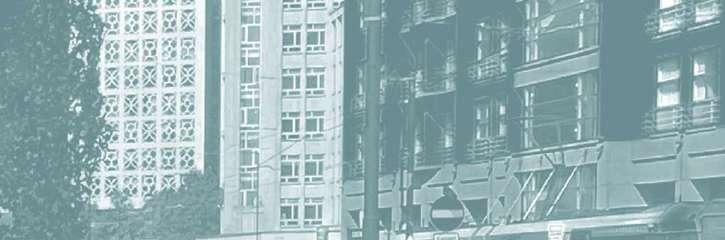
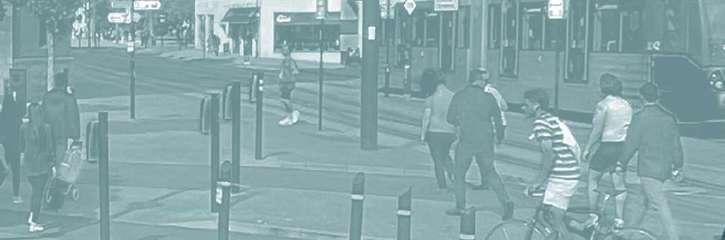
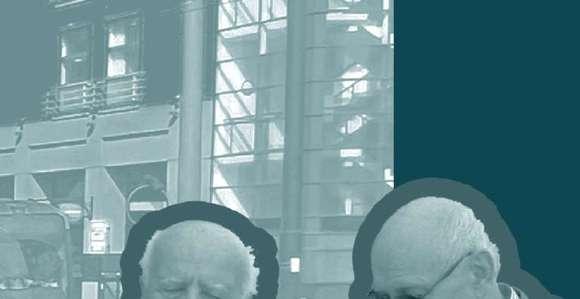
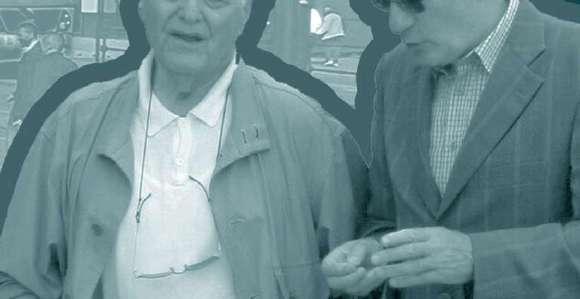
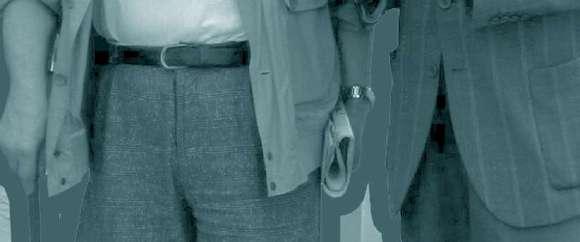


47 06 PRIMARY DATA COLLECTION Figure 6.1 Part of MAS C P11&P12 Interview Transcript Diagram 6.1 BASIC INFORMATION OF PRIMARY DATA COLLECTION 6.4 SWOT ANALYSIS 6.2 ACCESSIBILITY AND SECURITY INTERVIEW 6.3 STRONG POINTS, WEAK POINTS AND REQUIREMENTS INTERVIEW
6.1 Basic Information of Primary Data Collection


Most older people felt that these spaces were safe at all times, with only those in MAS E in Chinatown choosing to avoid the public space at night. Only a small proportion of the older people interviewed visit these MASs frequently.
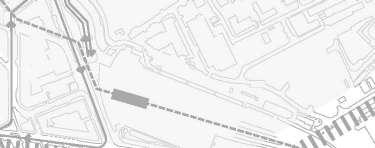
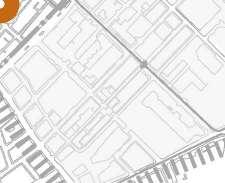
Most older people consider benches and greenery (if available) their favourite elements.
Most older people are unable to identify what they dislike most. In general, they do not like staying in too open spaces.
The needs of older people for additional elements are varied, with most wanting more seating, landscaping and commercial services.
Semi-Sructured
According to the WHO and NHS England, someone over the age of 65 might be considered an older person generally. Therefore, only data and information from older people aged 65 years and over were used in this series of interviews. All interviewees were between the ages of 65 and 82. To control for independent variables, the total number of interviewees was the same for males and females.
The entire interview took place over two days, on the weekday of June 11 and the weekend of June 15. Because semi-structured interviews were used, no quantitative data were collected through the interviews. Older people using the MAS were selected for the interviews, excluding those passing by and walking through.
6 48 6 PRIMARY DATA COLLECTION
AGE-FRIENDLY CITIES AND COMMUNITIES - DESIGNING AN AGE-FRIENDLY PUBLIC REALM IN MANCHESTER CITY CENTRE
All figures are author’s own illustration unless stated
Figure 6.2
Interview Diagram Figure 6.3 Participant Information Diagram
Basemap Data Source: digimap.edina.ac.uk (Version: March, 2022)
6.2 Accessibility and Security Interview


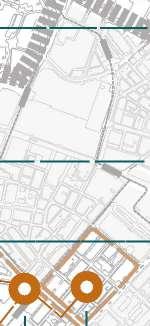


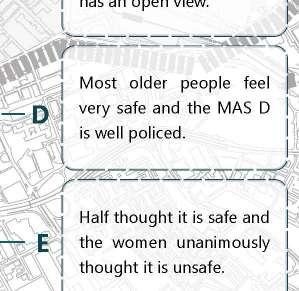

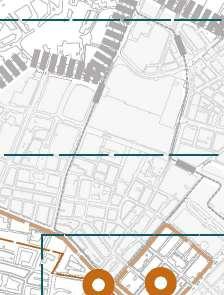


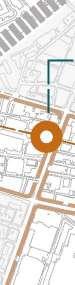


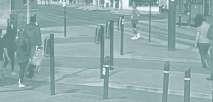


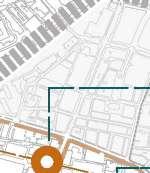


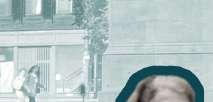


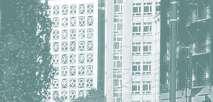


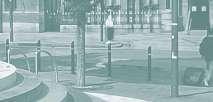


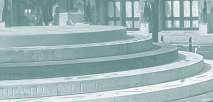


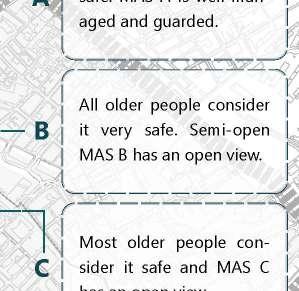

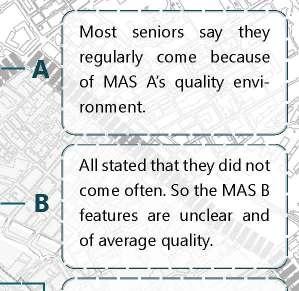
6 49 6 PRIMARY DATA COLLECTION
AGE-FRIENDLY CITIES AND COMMUNITIES - DESIGNING AN AGE-FRIENDLY PUBLIC REALM IN MANCHESTER CITY CENTRE
All figures are author’s own illustration unless stated
People Image Source: www.pinterest.com All images with portraits are from the open source network. They are used here only to convey the graphic effect and the content of the interview.
6.4 MAS C P11&P12 Interview Trancript Diagram
6.5 MAS D P16&P17 Interview Trancript Diagram
MAS E P21 Interview Transcript
Older
Figure
Figure
Figure 6.6
Diagram
Figure 6.7 Accessibility Survey Analysis
Figure 6.8 Security Survey Analysis safe. MAS A is well manhas an open view.
6.3 Strong Points, Weak Points and Requirements Interview


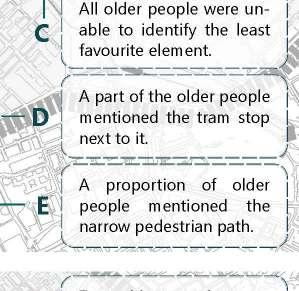


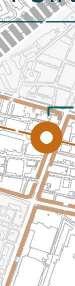


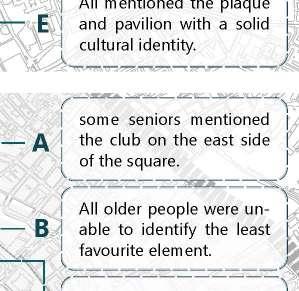


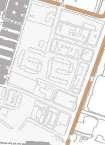


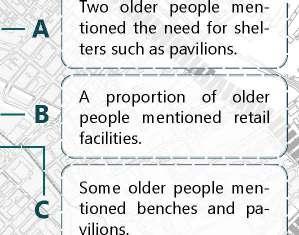


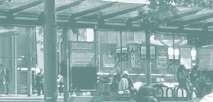


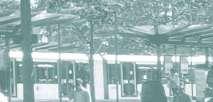

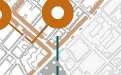


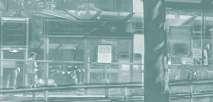


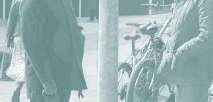


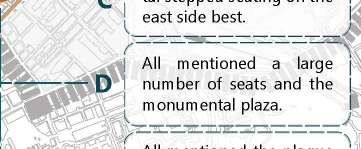

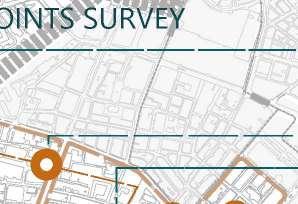


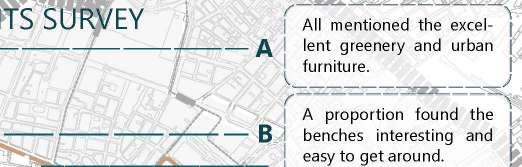

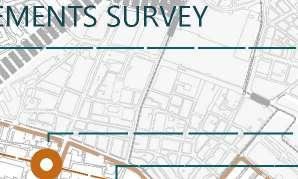
6 50 6 PRIMARY DATA COLLECTION
AGE-FRIENDLY CITIES AND COMMUNITIES - DESIGNING AN AGE-FRIENDLY PUBLIC REALM IN MANCHESTER CITY CENTRE
All figures are author’s own illustration unless stated
Older People Image Source: www.pinterest.com All images with portraits are from the open source network. They are used here only to convey the graphic effect and the content of the interview.
6.9 MAS A P2 Interview Trancript Diagram Figure 6.10 MAS B P7&P8 Interview Trancript Diagram Figure 6.11 MAS D P15 Interview Transcript Diagram
6.12 Strong
Survey
Weak
Survey
6.14 Requirements Survey
Figure
Figure
Points
Analysis Figure 6.13
Points
Analysis Figure
Analysis Two older people menMost like the monumentalstepped seatingonthe All mentioned the plaque


6 51 6 PRIMARY DATA COLLECTION All
AGE-FRIENDLY CITIES AND COMMUNITIES - DESIGNING AN AGE-FRIENDLY PUBLIC REALM IN MANCHESTER CITY CENTRE 6.4 SWOT Analysis Figure 6.15 SWOT Analysis Part 1
figures are author’s own illustration unless stated


6 52 6 PRIMARY DATA COLLECTION All
AGE-FRIENDLY CITIES AND COMMUNITIES - DESIGNING AN AGE-FRIENDLY PUBLIC REALM IN MANCHESTER CITY CENTRE 6.4 SWOT Analysis Figure 6.16 SWOT Analysis Part 2
figures are author’s own illustration unless stated
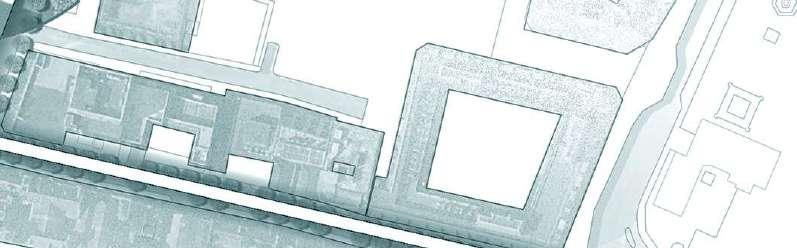
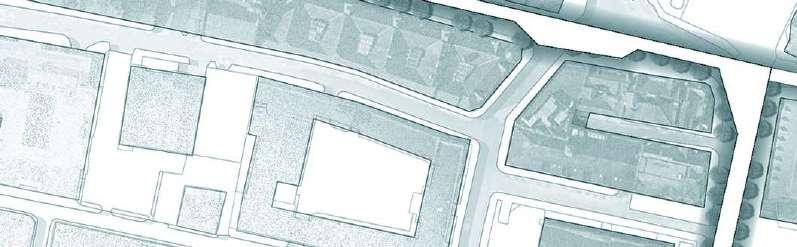
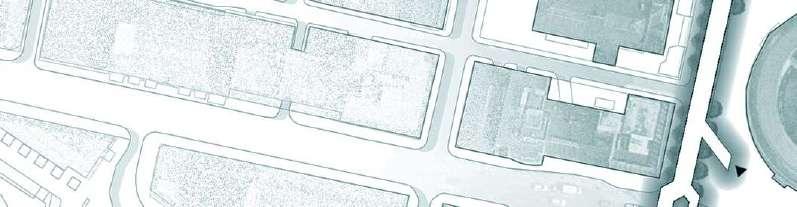
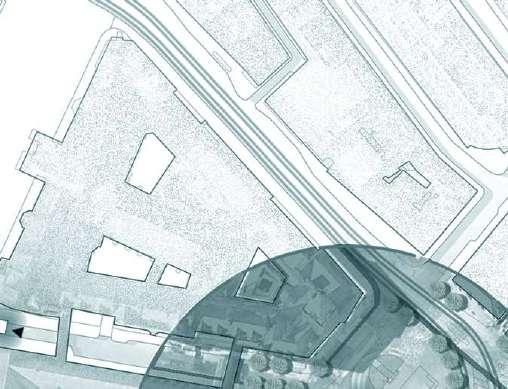
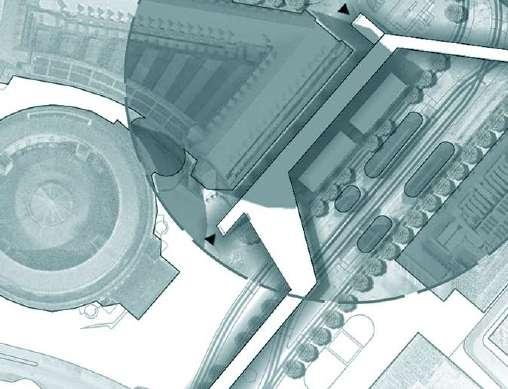
53 07 DESIGN PROPOSAL 7.1 VISION 7.6 GENERAL MASTER PLAN - MIDI LEVEL 7.7 MASTER PLANS AND RENDERINGS 7.2 STRATEGY A: MAKE THE OLDER PEOPLE A CITY JOINER 7.3 STRATEGY B: MAKE THE OLDER PEOPLE A CITY PARTNER 7.4 STRATEGY C: MAKE THE OLDER PEOPLE A CITY ENJOYER 7.5 STRATEGY COMPARISON AND DISCUSSION Figure 7.1 Part of Master Plan
Visions
VISION

ROUTE for older people and anyone else in Manchester City Centre:


SO, WHAT IS SILVER HAIR ROUTE?


A public space connectivity scheme based on age-friendly design and the needs of local older people, dedicated to designing an age-friendly city centre on a social, physical and strategic scale.
SOCIAL PHYSICAL STRATEGIC
AVOID SOCIAL EXCLUSION: Encourage older people to go out and get involved in social activities. Increase the connection between older people and society and make older people want to go out and use public spaces. Increase interaction between older people and different age groups and break down barriers.
IMPROVE ACTIVITY CONNECTION: Connecting the spaces with the highest number of people and activities in each area. Making the routes linking them a distinctive feature of the city centre while increasing the accessibility of each site. Allowing older people unhindered access to each public space.
PROVIDE INNOVATUVE STRATEGY: Provide the logic for each age-friendly design to run successfully. Make each design motivated and resourced, and achievable. It also gives the scheme a basis that can be replicated in other cities, and the government has the flexibility to apply the design through complementary strategies.
54
All figures are author’s own illustration unless stated 7.1
Our
is to build a SILVER HAIR
Figure 7.2 Vision Diagram - Design Analysis 7 7 DESIGN PROPOSAL AGE-FRIENDLY CITIES AND COMMUNITIES - DESIGNING AN AGE-FRIENDLY PUBLIC REALM IN MANCHESTER CITY CENTRE


55 All figures are author’s own illustration unless stated Figure 7.3 Strategy A Analysis Diagram 7 7 DESIGN PROPOSAL AGE-FRIENDLY CITIES AND COMMUNITIES - DESIGNING AN AGE-FRIENDLY PUBLIC REALM IN MANCHESTER CITY CENTRE


56 All figures are author’s own illustration unless stated Figure 7.4 Strategy B Analysis Diagram 7 7 DESIGN PROPOSAL AGE-FRIENDLY CITIES AND COMMUNITIES - DESIGNING AN AGE-FRIENDLY PUBLIC REALM IN MANCHESTER CITY CENTRE


57 All figures are author’s own illustration unless stated Figure 7.5 Strategy C Analysis Diagram 7 7 DESIGN PROPOSAL AGE-FRIENDLY CITIES AND COMMUNITIES - DESIGNING AN AGE-FRIENDLY PUBLIC REALM IN MANCHESTER CITY CENTRE
7.5 Strategy Comparison and Discussion
Figure


STRATEGY ASTRATEGY BSTRATEGY C


7.6 Strategy A Aggregation DiagramFigure 7.7 Strategy B Aggregation DiagramFigure 7.8 Strategy C Aggregation Diagram Figure 7.9 Intervention Strength Analysis
SPINNINGFIELDSPETERSFIELDCIVIC QUARTERCHINATOWN
The strategy applied in MAS A and MAS B in terms of accessibility is consistent with that of the other MASs, and the A-2 used in MAS B is the most representative sky bridge.
The MAS C has been applied to B-1 and B-2, which not only adds a wealth of functionality to the empty square butalsomakesitanode in the overall silver hair route.


TheB-3andC-1applied in MAS D make this square the most critical nodeintheentireroute. Here older people can communicate with their peersandpeopleofdifferentages.

58
All figures are author’s own illustration unless stated
7 7
MAS E transfers the parking area from the ground level to a mixed-functionbuilding. ApplyingA-4andC-2to MAS E has transformed it into the most distinctivesiteinthecity. PUBLIC REALM IN MANCHESTER CITY CENTRE
DESIGN PROPOSAL AGE-FRIENDLY CITIES AND COMMUNITIES - DESIGNING AN AGE-FRIENDLY
59 All figures are author’s own illustration unless stated 7.6
Figure 7.10 Master Plan 7 7 DESIGN PROPOSAL AGE-FRIENDLY CITIES AND COMMUNITIES - DESIGNING AN AGE-FRIENDLY PUBLIC REALM IN MANCHESTER CITY CENTRE
General Master Plan - Midi Level
7.7 Master Plan and Renderings of MAS A


Figure 7.11 MAS A Rendering


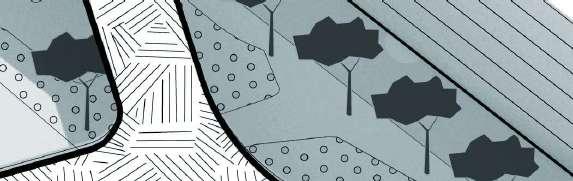


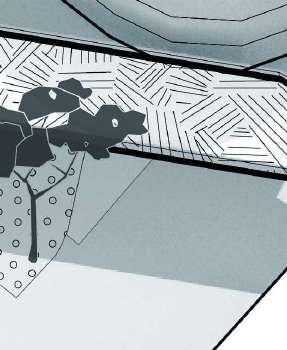


MAS A: THE EYE OF SILVER HAIR ROUTE
The node at MAS A is the eye of the whole route. Due to the good quality of the public space in MAS A, the greenery and landscaping on the ground level are kept intact. At the beginning of the silver hair route, the elderly can see a pleasant view and are tempted to continue using the route to see more of it. So this is the eye of the whole route.
Figure 7.12 MAS A Pedestrian Flow Analysis
60 All figures are author’s own illustration unless stated
7 7
IN MANCHESTER CITY CENTRE
DESIGN PROPOSAL AGE-FRIENDLY CITIES AND COMMUNITIES - DESIGNING AN AGE-FRIENDLY PUBLIC REALM
MAS B: THE MIND OF SILVER HAIR ROUTE


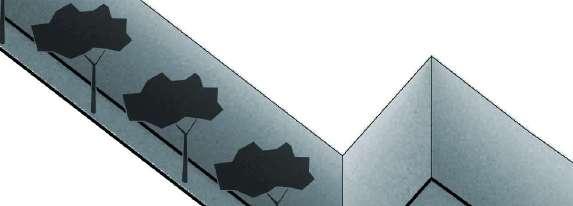
MAS B has been designed as the mind for the whole route. It is located at a distance from the route’s main axis, and most older people come here to participate in the creation and viewing of the art wall here. The seniors and local artists brainstorm and create works that give their own minds. These works will be painted regularly and given new ideas.


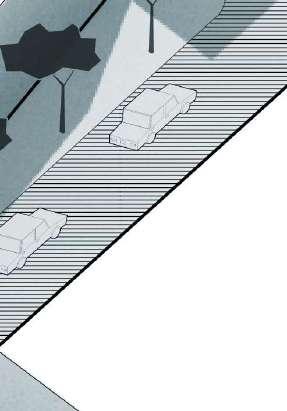
Figure 7.14 MAS B Pedestrian Flow Analysis

61 All figures are author’s own illustration unless stated 7.7 Master Plan and Renderings of MAS B Figure 7.13 MAS B Rendering
7 7 DESIGN PROPOSAL AGE-FRIENDLY
AGE-FRIENDLY PUBLIC REALM IN MANCHESTER CITY CENTRE
CITIES AND COMMUNITIES - DESIGNING AN
MAS


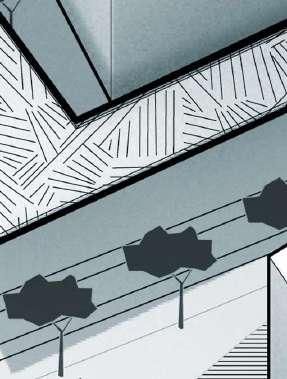


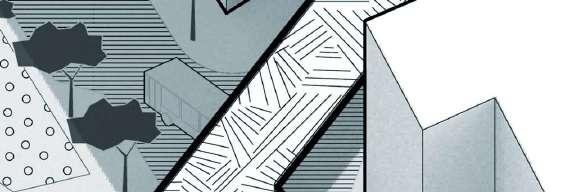


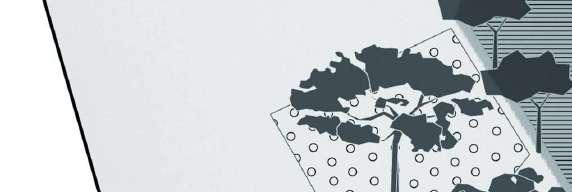
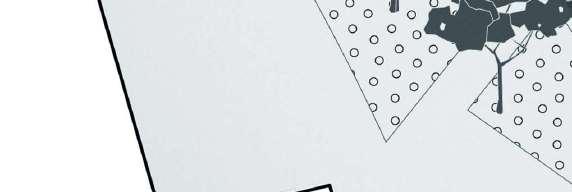


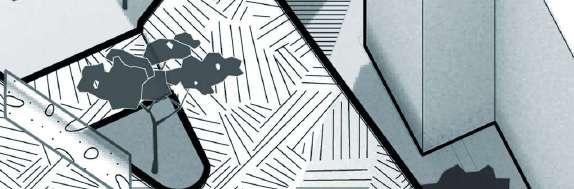

MAS C: THE MOUTH OF SILVER HAIR ROUTE


MAS C is the furthest node from the main axis and has been designed as the mouth of the silver hair route. This is because this is where older people can take part in discussions and speak their minds. These ideas will be considered and adopted by the urban planners. Through participatory planning, MAS C is used as a mouth for older people to express their views.
Figure 7.16 MAS C Pedestrian Flow Analysis


62 All figures are author’s own illustration unless stated 7.7 Master Plan and Renderings of
C Figure 7.15 MAS C Rendering
7 7 DESIGN
REALM IN MANCHESTER CITY CENTRE
PROPOSAL AGE-FRIENDLY CITIES AND COMMUNITIES - DESIGNING AN AGE-FRIENDLY PUBLIC
MAS D: THE EAR OF SILVER HAIR ROUTE


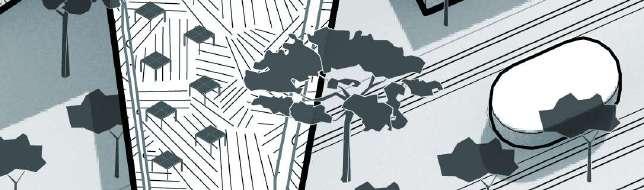
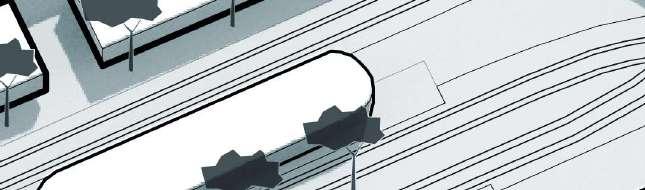
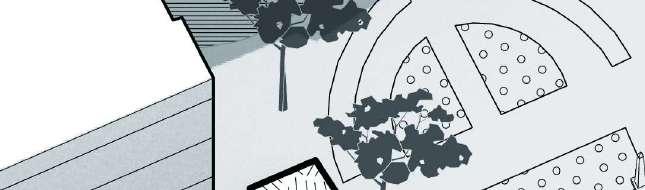


MAS D is the ear of the entire route. As the central node of the silver hair route, the elderly’s sense of hearing is the most loyal, and the MAS D is the most crowded and varied place where the elderly can hear various sounds and get various information to perceive Manchester.
Figure 7.18 MAS D Pedestrian Flow Analysis
63 All figures are author’s own illustration unless stated 7.7 Master Plan and Renderings of MAS D Figure 7.17 MAS D Rendering
7 7 DESIGN PROPOSAL AGE-FRIENDLY CITIES AND COMMUNITIES - DESIGNING AN AGE-FRIENDLY PUBLIC REALM IN MANCHESTER CITY CENTRE
and Renderings of MAS E

MAS E: THE NOSE OF SILVER HAIR ROUTE


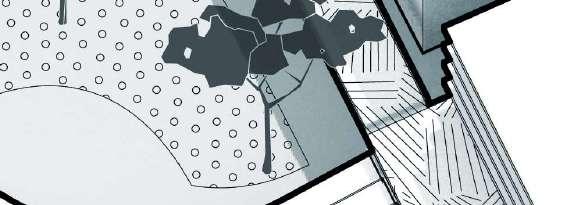
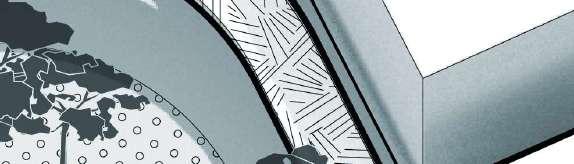

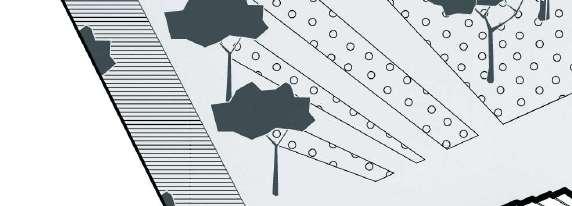


The node at MAS E is the nose of the SILVER HAIR route. Here seniors can plant their favourite crops or ornamental plants in the city and use their sense of smell to participate in the urban design. The urban farm on the slope is a unique feature of MAS E. The aroma of the food from the restaurants in Chinatown and the smell of the plants in the farm help seniors to understand the city.
Figure 7.20 MAS E Pedestrian Flow Analysis

64 All figures are author’s own illustration unless stated 7.7 Master Plan
Figure 7.19 MAS E Rendering
7 7 DESIGN
IN MANCHESTER CITY CENTRE
PROPOSAL AGE-FRIENDLY CITIES AND COMMUNITIES - DESIGNING AN AGE-FRIENDLY PUBLIC REALM


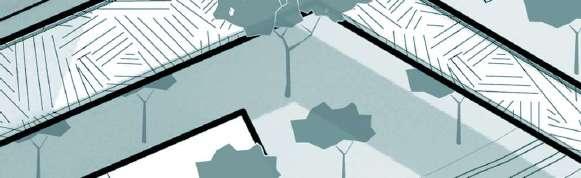


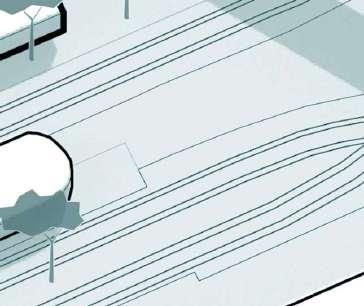

65 08 CONCLUSION
REFLECTION 8.1
8.2
8.3
Figure 8.1 Part of MAS D Rendering
&
CONCLUSION
SUGGESTION FOR FUTURE RESEARCH
REFLECTION
8.1 Conclusion
This design dissertation aimed to explore the definition and key features of AFCC design by investigating public or open spaces in AFCC and examining the existing findings of AFCC design. The design then used the findings to the test sites in Manchester city centre.
The research results show that the research questions can be addressed, and the research objectives have been met.


Firstly, a set of age-friendly design strategies with a high degree of flexibility was constructed. These strategies consider the identity, social participation and many other age-friendly elements of older people from their own perspective. They can be used as design guidelines for building age-friendly cities. Secondly, the design identifies which urban design elements can be applied to the construction of the AFCC through the urban regeneration of the test site, giving future urban planners some reference. Finally, there is no guarantee that the challenges of AFCC building will be resolved when all other cities apply this set of guidelines and strategies. However, because of the flexible nature of the strategies derived from the study, urban planners can adapt them to future problems.
In summary, this design dissertation fully uses the collated data and research findings. It has been tested to construct a flexible, malleable and effective set of urban design guidelines for AFCC.
8.2 Suggestion for Future
Research
While many aspects of AFCC have been examined in this study, the output strategy and the testing of sites focused mainly on public spaces in the city. In future research, a supporting policy system that can support the operation of these functions should be designed, taking into account the current research findings. In addition, future attention should also be paid to the influence of building function and land use on AFCC design.

8.3 Reflection
This research faced several challenges in citing research findings for the test sites. One of the more representative challenges was the difficulty in expressing some of the abstract elements of age-friendly design when redesigning public spaces, such as reducing social isolation. Expressions linking spatial design to the operational logic of some strategies were limited. Another challenge was in the construction of the air corridors in the design. As the initial strategy was to place some of the public buildings on it, this was eventually abandoned because the overpass structure could not support these buildings.
Despite the challenges, the overall logic in expressing AFCC’s design guidelines and design strategy was expressed as logically and entirely as possible.
All figures are author’s own illustration unless stated
66
8 8 CONCLUSION
REFLECTION AGE-FRIENDLY CITIES AND COMMUNITIES - DESIGNING AN AGE-FRIENDLY PUBLIC REALM IN MANCHESTER CITY CENTRE
AND
Figure 8.2 Research Question Recap/ Summary of Conclusion diagram
REFERENCES & APPENDIX 9.1 REFERENCES 9.2 APPENDIX - LITERATURE RESEARCH MATRIX


67
Figure 9.1 Part of MAS E Master Plan
09
REFERENCES AND APPENDIX
9.1 References
AGE-FRIENDLY CITIES AND COMMUNITIES - DESIGNING AN
ATKINS, M. T. 2019. Creating age-friendly cities: prioritizing interventions with Q-methodology. International Planning Studies.
BENTLEY, I. 1985. Responsive environments: A manual for designers, Routledge.
BUCKNER, S., POPE, D., MATTOCKS, C., LAFORTUNE, L., DHERANI, M. & BRUCE, N. 2019. Developing age-friendly cities: an evidence-based evaluation tool. Journal of Population Ageing, 12, 203-223.
BUFFEL, T. & PHILLIPSON, C. 2016. Can global cities be ‘age-friendly cities’? Urban development and ageing populations. Cities, 55, 94-100.
CABE. 2003. THE COUNCILLOR’S GUIDE TO URBAN DESIGN [Online]. Available: https://www.designcouncil.org.uk/fileadmin/uploads/dc/Documents/councillors-guide-to-urban-design.pdf [Accessed 21/08 2022].
DEL BARRIO, E., PINZÓN, S., MARSILLAS, S. & GARRIDO, F. 2021. Physical Environment vs. Social Environment: What Factors of Age-Friendliness Predict Subjective Well-Being in Men and Women? International journal of environmental research and public health, 18, 798.
DIKKEN, J., VAN DEN HOVEN, R. F., VAN STAALDUINEN, W. H., HULSEBOSCH-JANSSEN, L. M. & VAN HOOF, J. 2020. How older people experience the age-friendliness of their city: Development of the age-friendly cities and communities questionnaire. International journal of environmental research and public health, 17, 6867.
DIXON, A. 2021. The United Nations decade of healthy ageing requires concerted global action. Nature aging, 1, 2-2.
FEAGIN, J. R., ORUM, A. M. & SJOBERG, G. 1991. A case for the case study, UNC Press Books.
FLORES, R., CABALLER, A. & ALARCÓN, A. 2019. Evaluation of an age-friendly city and its effect on life satisfaction: A two-stage study. International Journal of Environmental Research and Public Health, 16, 5073.
GIBNEY, S., ZHANG, M. & BRENNAN, C. 2020. Age-friendly environments and psychosocial wellbeing: A study of older urban residents in Ireland. Aging & Mental Health, 24, 2022-2033.
HAN, J., CHAN, E. H., YUNG, E. H., QIAN, Q. K. & LAM, P. T. 2022. A policy framework for producing age-friendly communities from the perspective of production of space. International journal of environmental research and public health, 19, 2031.
HAN, J., CHAN, E. H. W., QIAN, Q. K. & YUNG, E. H. K. 2021. Achieving Sustainable Urban Development with an Ageing Population: An “Age-Friendly City and Community” Approach. Sustainability, 13, 8614.
HOX, J. J. & BOEIJE, H. R. 2005. Data collection, primary versus secondary.
KLICNIK, I. & DOGRA, S. 2019. Perspectives on active transportation in a mid-sized age-friendly city:“You stay home”. International journal of environmental research and public health, 16, 4916.
68 All figures are author’s own illustration unless stated
9 9
REALM IN MANCHESTER CITY CENTRE
AGE-FRIENDLY PUBLIC
REFERENCES AND APPENDIX
AGE-FRIENDLY CITIES AND COMMUNITIES - DESIGNING AN AGE-FRIENDLY PUBLIC REALM IN
LIDDLE, J., PITCHER, N., MONTAGUE, K., HANRATTY, B., STANDING, H. & SCHARF, T. 2020. Connecting at local level: Exploring opportunities for future design of technology to support social connections in age-friendly communities. International Journal of Environmental Research and Public Health, 17, 5544.
MARSTON, H. R. & VAN HOOF, J. 2019. “Who doesn’t think about technology when designing urban environments for older people?” A case study approach to a proposed extension of the WHO’s age-friendly cities model. International journal of environmental research and public health, 16, 3525.
OLGYAY, V. 2015. Design with climate. Design with Climate. Princeton university press.
ORGANIZATION, W. H. 2007. Global age-friendly cities: A guide, World Health Organization.
PEDELL, S., BORDA, A., KEIRNAN, A. & AIMERS, N. 2021. Combining the digital, social and physical layer to create age-friendly cities and communities. International Journal of Environmental Research and Public Health, 18, 325.
RÉMILLARD-BOILARD, S., BUFFEL, T. & PHILLIPSON, C. 2021. Developing age-friendly cities and communities: Eleven case studies from around the world. International journal of environmental research and public health, 18, 133.
REUTER, A. & LIDDLE, J. The Later Life Audio and Radio Co-operative: considering radio as a technology to promote citizen dialogue in later life. 9th International Conference on Software Development and Technologies for Enhancing Accessibility and Fighting Info-exclusion, 2020. 153-157.
REUTER, A., LIDDLE, J. & SCHARF, T. 2020. Digitalising the age-friendly city: insights from participatory action research. International Journal of Environmental Research and Public Health, 17, 8281.
REUTER, A., SCHARF, T. & SMEDDINCK, J. 2021. Content Creation in Later Life: Reconsidering Older Adults’ Digital Participation and Inclusion. Proceedings of the ACM on Human-Computer Interaction, 4, 1-23.
ROGGEMA, R. 2016. Research by design: Proposition for a methodological approach. Urban science, 1, 2.
RONZI, S., ORTON, L., BUCKNER, S., BRUCE, N. & POPE, D. 2020. How is respect and social inclusion conceptualised by older adults in an aspiring age-friendly city? A photovoice study in the North-West of England. International Journal of Environmental Research and Public Health, 17, 9246.
RUSSELL, E., SKINNER, M. W. & FOWLER, K. 2019. Emergent challenges and opportunities to sustaining age-friendly initiatives: Qualitative findings from a Canadian age-friendly funding program. Journal of Aging & Social Policy, 1-20.
SINGH, R. & BISHT, N. 2019. Spirituality and psychological well-being of elderly: Gender perspective. Current Journal of Applied Science and Technology, 37, 1-10.
STERNS, A. A., STERNS, H. L. & WALTER, A. 2020. Prioritizing age-friendly domains for transforming a mid-sized American city. International journal of environmental research and public health, 17, 9103.
TORKU, A., CHAN, A. P. C. & YUNG, E. H. K. 2021. Age-friendly cities and communities: A review and future directions. Ageing & Society, 41, 2242-2279.
VAN HOOF, J., KAZAK, J. K., PEREK-BIAŁAS, J. M. & PEEK, S. 2018. The challenges of urban ageing: Making cities age-friendly in Europe. International Journal of Environmental Research and Public Health, 15, 2473.
VOGT, J., HAUER, R. J. & FISCHER, B. C. 2015. The costs of maintaining and not maintaining the urban forest: A review of the urban forestry and arboriculture literature. Arboriculture & Urban Forestry, 41, 293-323.
VON FABER, M., TAVY, Z. & VAN DER PAS, S. 2020. Engaging older people in age-friendly cities through participatory video design. International Journal of Environmental Research and Public Health, 17, 8977.
WAINWRIGHT, D. 1997. Can sociological research be qualitative, critical and valid? TQR, 3, 1-17.
69 All figures are author’s own illustration unless stated
9 9
CITY CENTRE
MANCHESTER
70 All figures are author’s own illustration unless stated 9 9 REFERENCES AND APPENDIX AGE-FRIENDLY CITIES AND COMMUNITIES - DESIGNING AN AGE-FRIENDLY PUBLIC REALM IN MANCHESTER CITY CENTRE 9.2
Figure 9.2 Literature Research Matrix Part 1
Appendix - Literature Research Matrix
71 All figures are author’s own illustration unless stated 9 9 REFERENCES AND APPENDIX AGE-FRIENDLY CITIES AND COMMUNITIES - DESIGNING AN AGE-FRIENDLY PUBLIC REALM IN MANCHESTER CITY CENTRE 9.2
Figure 9.3 Literature Research Matrix Part 2
Appendix - Literature Research Matrix
Literature Research Matrix
72 All
unless stated 9 9 REFERENCES
AGE-FRIENDLY CITIES AND COMMUNITIES - DESIGNING AN AGE-FRIENDLY PUBLIC REALM IN MANCHESTER CITY CENTRE
figures are author’s own illustration
AND APPENDIX
9.2 Appendix -
Figure 9.4 Literature Research Matrix Part 3
THANK YOU
