7.25.2024


7.25.2024


Project Question:
To diagnose perceived under-indexing of Hispanic Ridership as compared to the population representation in the DART Service Area. Hispanic and Latino populations make up 41% of the total population of the DART Service area and only around 20% of total ridership.
Project Goal:
Identify reasons, rationales and factors impacting Hispanic and Latino ridership to determine reasons for the discrepancy and offer an initial set of potential solutions that could be implemented or piloted in the future.
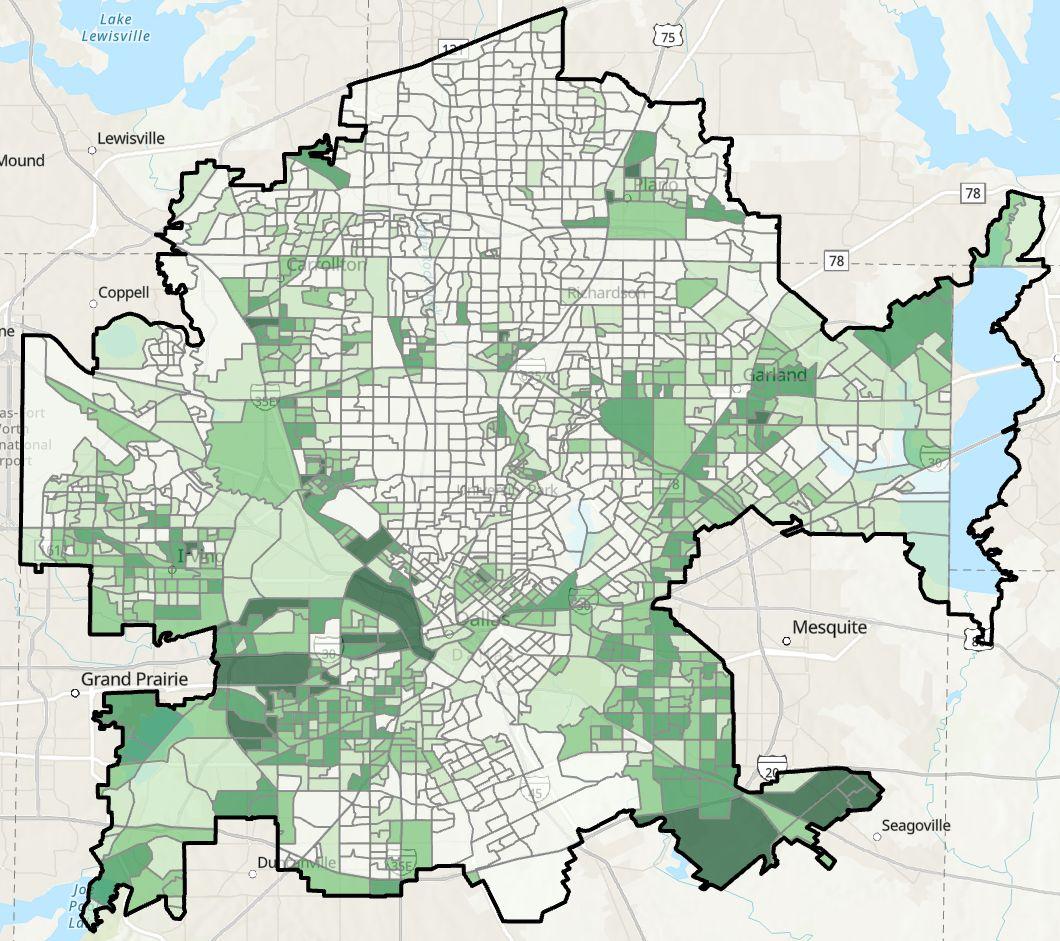
Service Area Demographics
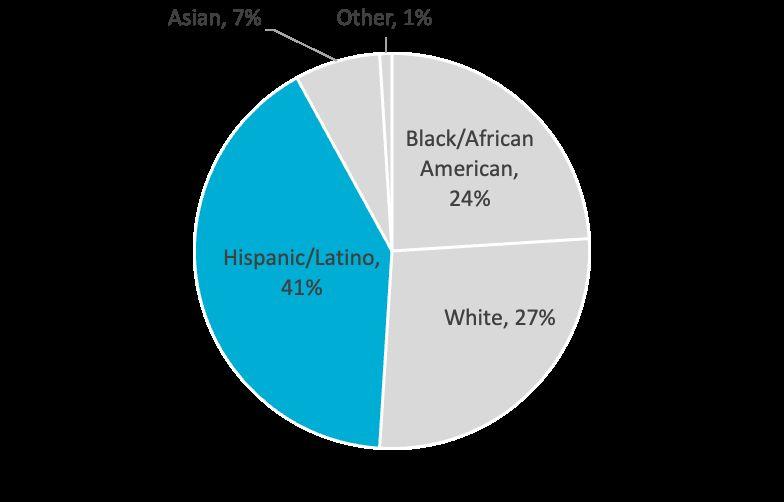
Ridership Demographics
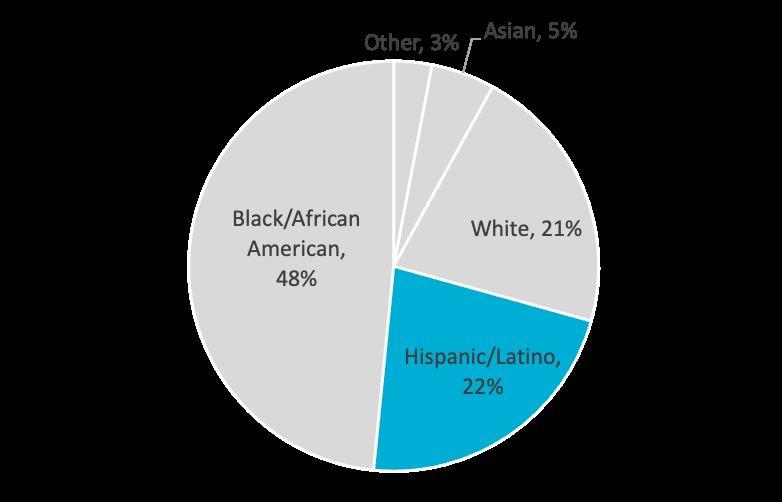

Hispanics and Latinos make up 19% of the population of the United States, and the Dallas metro area is home to a significant number. The DART service area is home to more than 1 million Hispanic and Latino residents, making up 41% of the population.
This map shows the distribution of Hispanic and Latino population across the region. Darker green areas are home to greater concentrations of Hispanic and Latino people.
This demographic is a large and growing portion of the North Texas population, accounting for 38% of the total population growth in the region-more than any other racial or ethnic group.


Hypotheses
Goals


Deliverables

Review and analysis of existing DART and external research
Benchmark DART research with external data sources to identify additional information needs
Establish hypotheses, trends and themes
Develop a primary research methodology
Create a community engagement plan
Develop sampling strategy
Create initial psychographics to target
Build analytical assessment tool
Execute primary research
Analyze results to gain insight into Hispanic community sub-segments
Develop a ridership deficit causal attribution analysis
Identify initial solutions to increase ridership
Report detailing the current data and information, initial hypotheses, trends and themes.
Identified information gaps
Rider segmentation analysis and initial psychographics (moved to Phase 2)
Detailed research plan and methodology proposal
Approved assessment tool
Approved community engagement plan
Deployment of the research plan
Report detailing demographics, rider segmentation and psychographics, discrepancy attribution, causal mapping, and an initial solution set to begin to increase Hispanic DART ridership.

Hypotheses
In Phase 1 we identified 5 hypothesis areas based on prior DART research and demographic benchmarks of the Hispanic and Latino population in the ridership area:
We sourced participants through community partners to attend 6 Community Listening Sessions (CLS) to gather impressions of the hypothesized barriers to ridership and ideate possible solutions.
● Work and school journey (transportation behavior)
● DART services
● Mobile technology and payment
● Demographics and family life
● Language fluency
● Hypotheses were affirmed
● CLS participants shared their experiences riding DART and beliefs and perceptions about riding buses and trains.
In this final phase of the Hispanic Ridership Growth Project, we tested our hypotheses on a ridership area sample of Hispanic and Latino residents, both riders and non-riders and analyzed the DART system as it aligns to the Hispanic and Latino population.
● Hypotheses were tested
● Line alignment mapped
● Riders and non-riders were typed and categorized
● Ridership deficits mapped
● Solution set identified
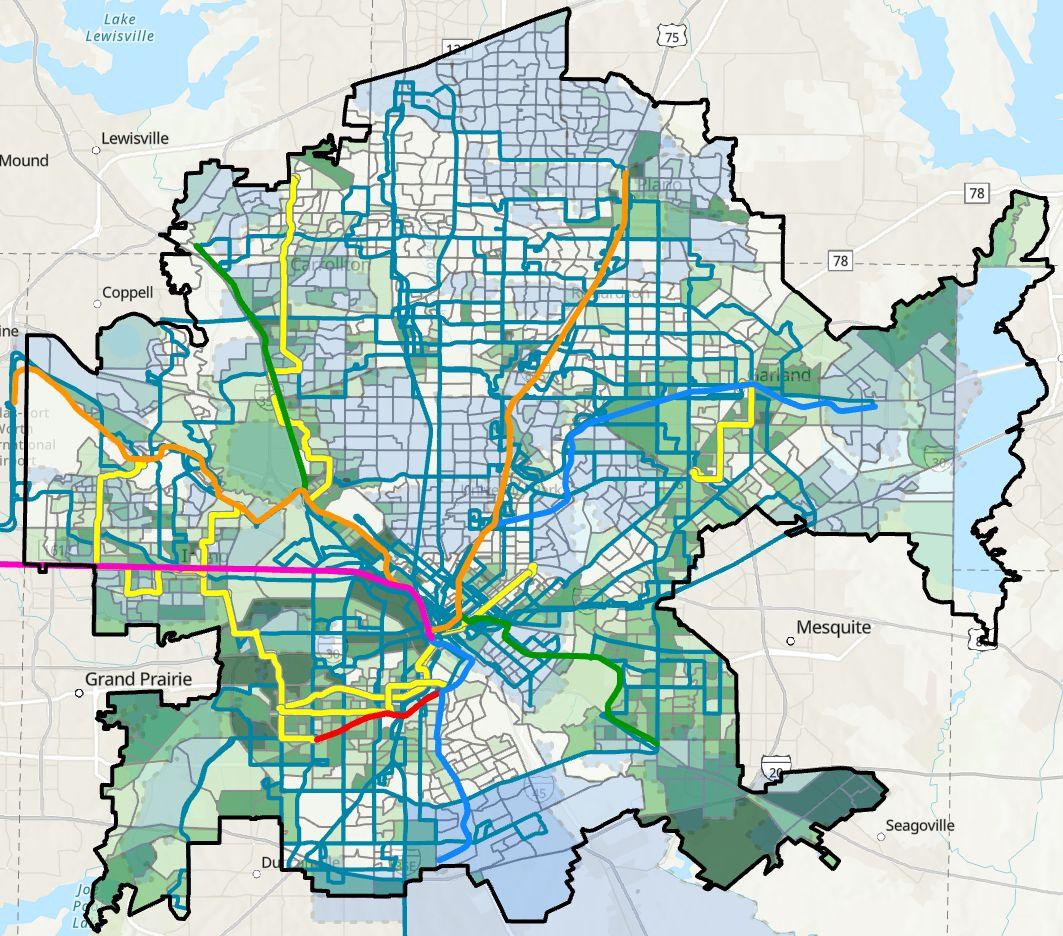
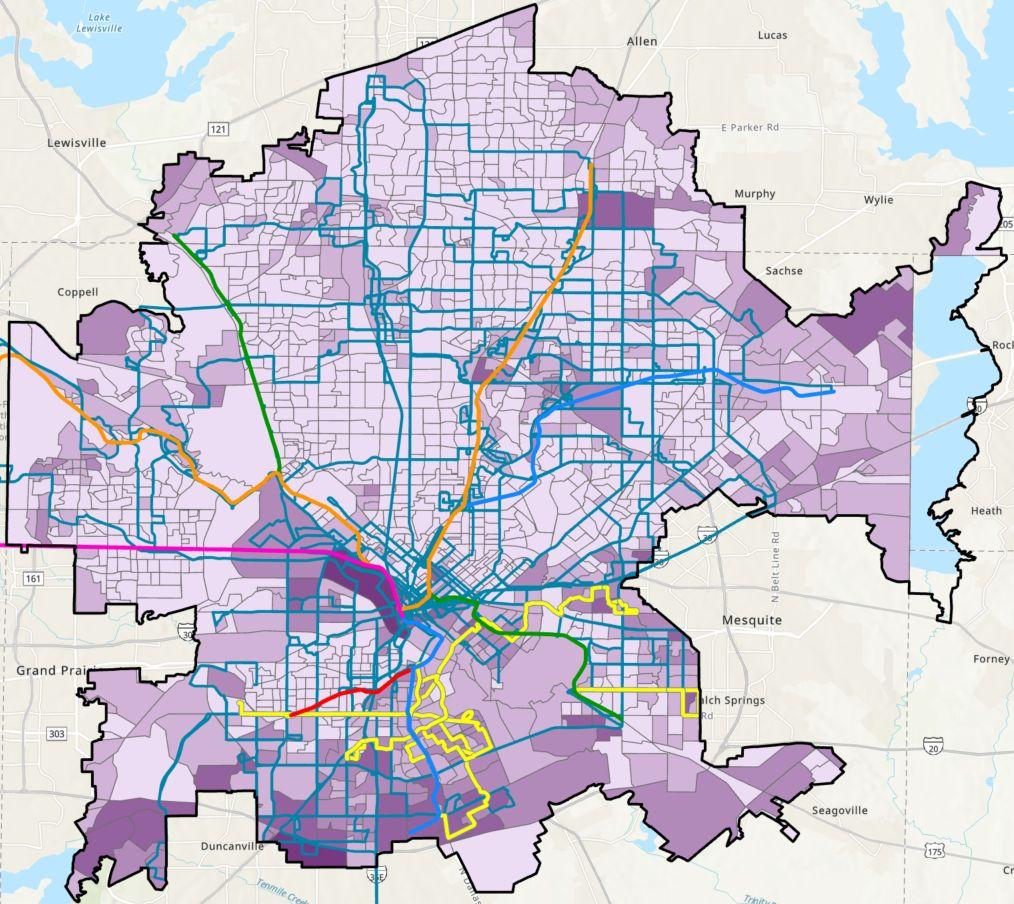
This map displays Hispanic population in green, go link zones in blue shades, bus lines in blue, rail lines in various colors and highly indexing bus lines among Hispanics in yellow.
Services available to the Hispanic population are more closely aligned in the southwestern portion of the DART service area, where most of the highly indexing lines are located. Areas in the far south, the southeast and east regions of the DART service area have higher hispanic populations but lack highly indexing lines. In some cases, notably Rowlett, GoLink service is available but in other areas, for example, in the southeast near Riley and Pleasant Wood, service and Hispanic population are less aligned.
Hispanic and Latino population mapped with DART system: rail, bus, GoLink zones & highly indexing lines
The DART system is more closely aligned to areas with higher numbers of Black/African American residents than it is to areas more highly populated by Hispanic residents.
One reason for the Hispanic ridership discrepancy is this system alignment. Increasing penetration into highly Hispanic and Latino areas has the potential to increase ridership.
Black population mapped with DART bus lines and highly indexing bus lines.

Hypotheses validated:
Transportation
Behavior
DART Services
Mobile Technology & Payment
Commute length
Timeliness
Occupations
Vehicle access
Car preference
Convenience
Safety concerns
Awareness & utilization
Proximity to stations
Elements impacting ridership:
Demographics & Family Life
Language Fluency & Literacy
Internet access
Service awareness
Payment options
Trip planning
Non-rider knowledge
Family demographics
Safety concerns
Riding with children
Cost and fare reduction programs
Language accessibility
Phone settings
Driver and staff welcome
Education & literacy

On commute length and timeliness: Factor elements: commute length, occupation, knowledge gaps, vehicle preference
● Commute impacts: Schedules that don’t align well with peak transit times, destinations that are further from transit or moving to or through locations that feel unsafe play into the decision to ride.
● Occupations: Jobs that have unique transportation needs impact transportation decisions-particularly in fields like construction, maintenance and transportation. Jobs that require carrying equipment, or employment scheduled at multiple locations during the day impact the ability of some Hispanic workers to ride.
● Walking to transit: DART riders may live within a relatively short distance to a bus stop or train station and they typically walk to transit. Hispanic non-riders live a longer distance from transit than riders do, though 44% live within a 10-minute walk.
● Transit timeliness: trip length and timely arrival of transit were important to creating willingness to ride. Trips that take too long negatively impact willingness to ride.
● Vehicle preference: 85% of non-riders prefer their vehicles and this was a factor in non-utilization of DART services.
“When I was looking for a job, I had to look for one that was only on weekdays because, on weekends, DART runs only every hour. That was extremely inconvenient for me because normally during the week it took me two hours to get to work, if I had to go on weekends, the commute was much longer, about three and a half hours.” -Paola, 30-34.
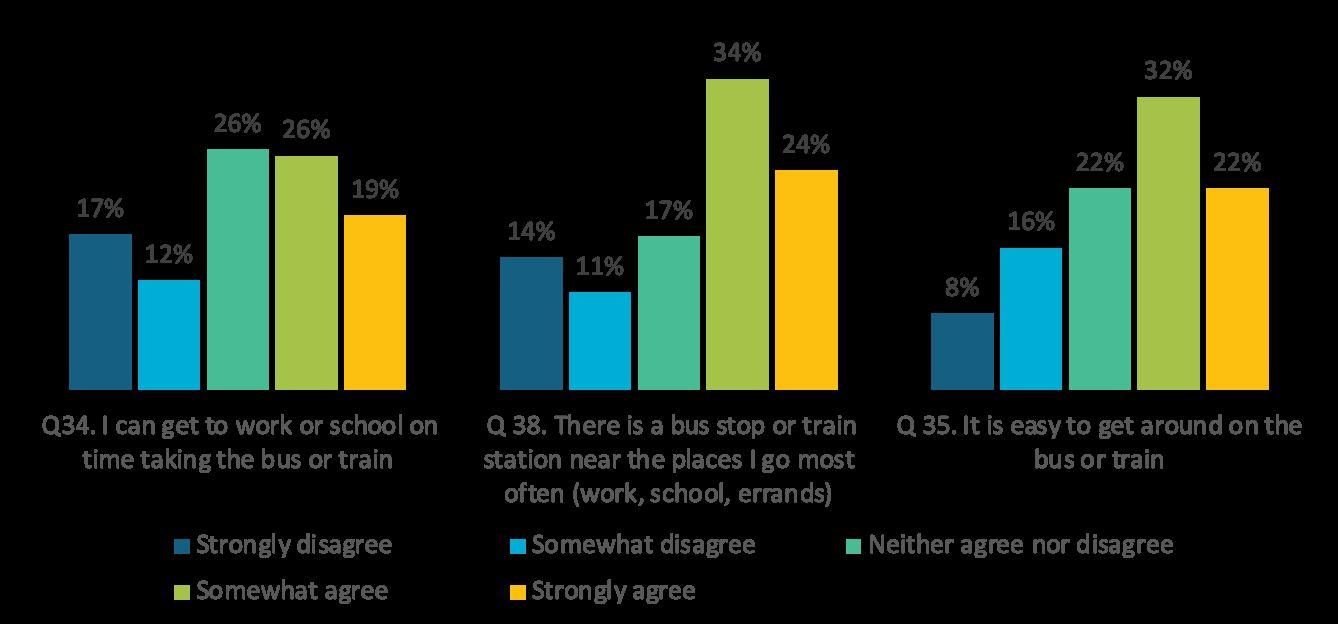
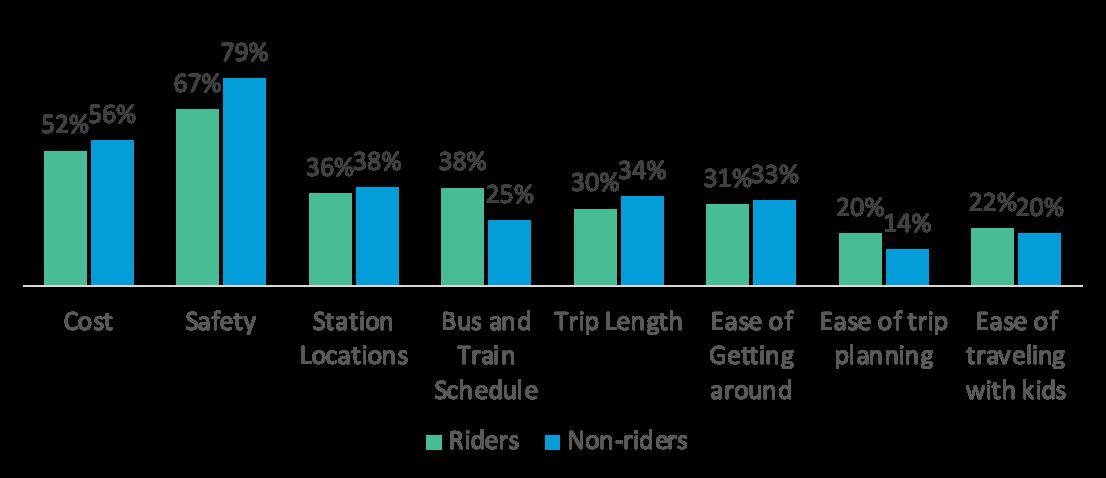
How strongly do you agree or disagree with the following statements:
Factor elements: awareness & utilization, safety, proximity and convenience

Participant quote on safety:
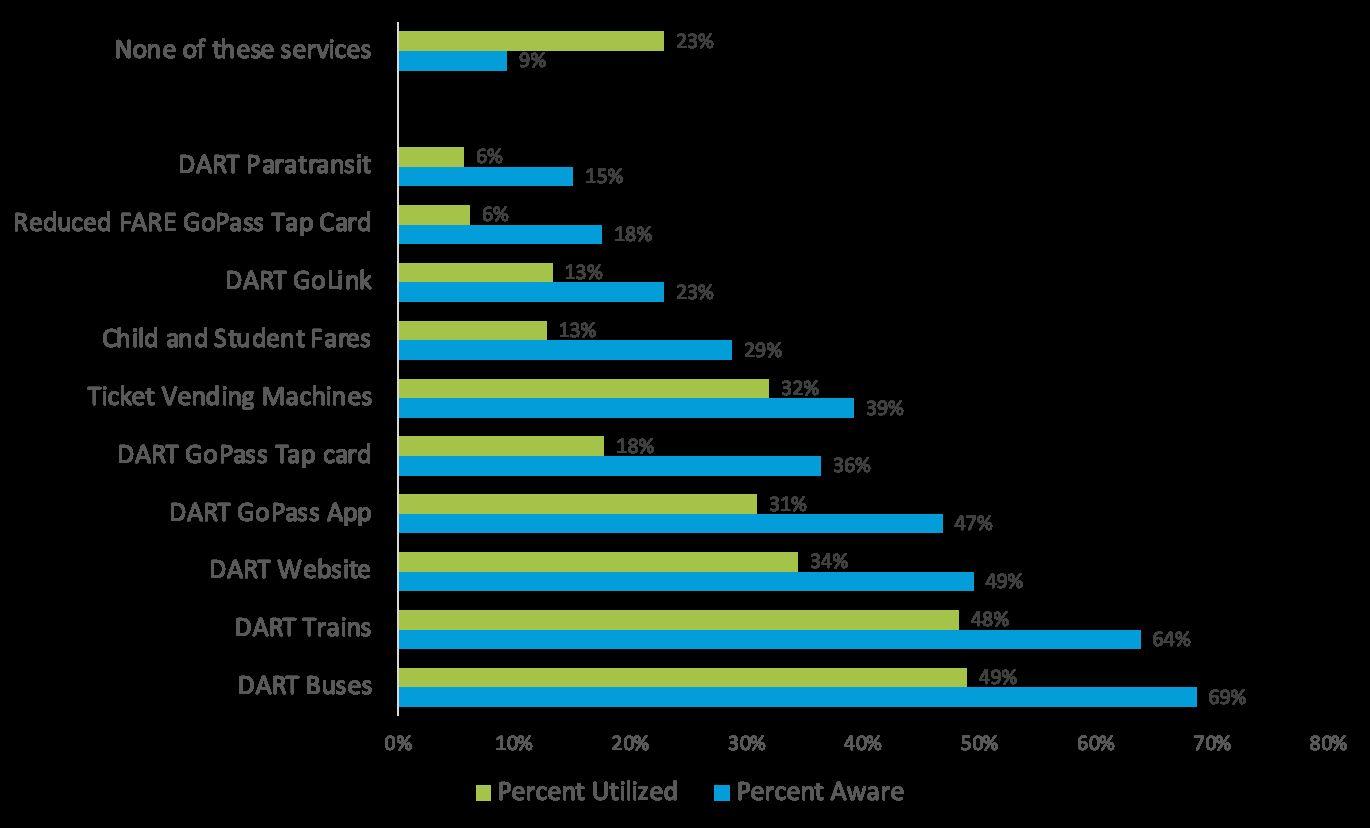
● Awareness & Utilization: There were significant gaps in awareness of services, with awareness of buses and trains being the only awareness measures where more than 50% of the sample were aware of the service. GoPass Tap cards, GoLink, fare reduction programs and paratransit suffered from awareness gaps-with 9% of respondents not having any awareness of the DART system at all.
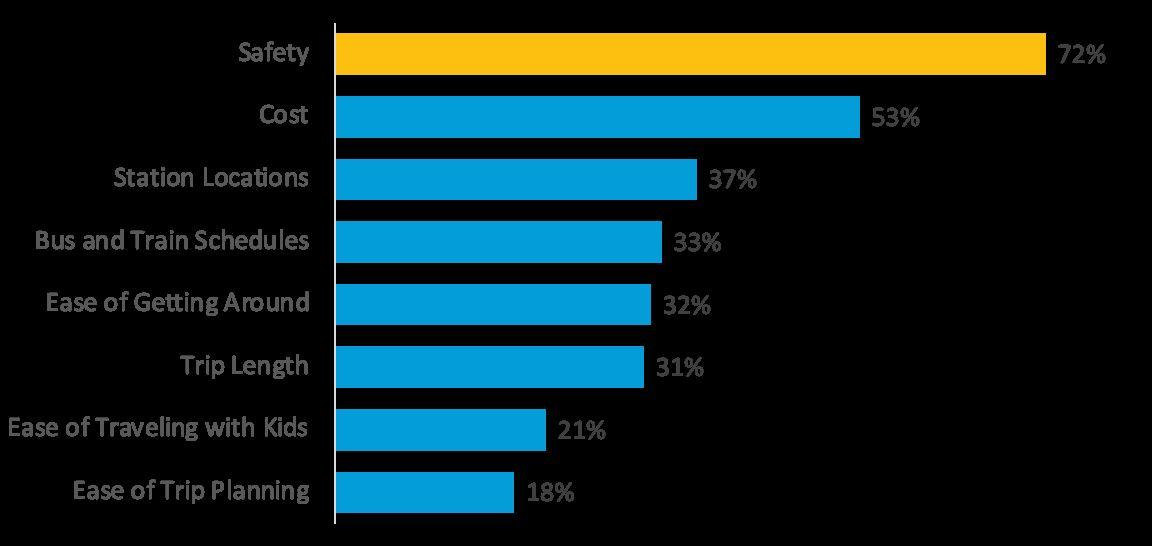
● Safety was a top priority: more than 80% of the Hispanic and Latino respondents said safety was the most important factor when considering riding DART. There were disparities between the high prioritization of safety and the perception that traveling via DART is safe.
● Convenience & proximity: riders found DART more convenient and indicated that stations and stops were closer in proximity to their homes and destinations than non-riders.
“It is also imperative that people feel safe and comfortable when traveling. On one occasion, my daughter took the train to Garland and had a bad experience…with an individual. The train station was far from where she lived, and she had to walk through dark streets, which posed a significant risk of encountering trouble. Since then, she stopped using the train out of fear.”
Awareness and utilization of select DART services

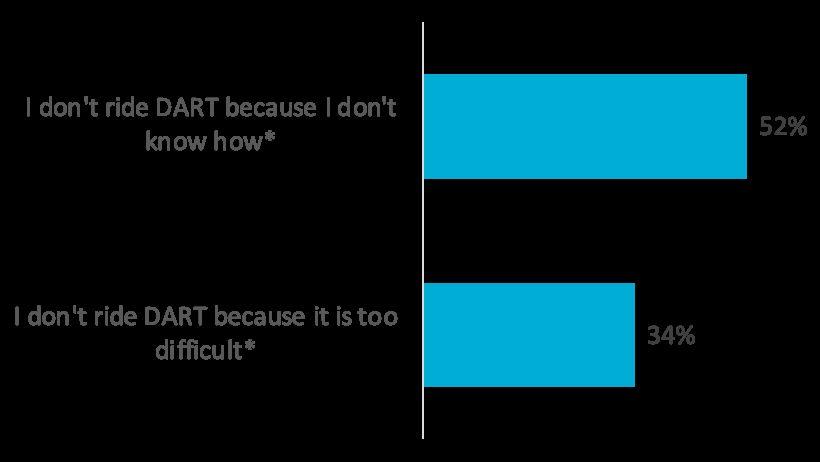
Non-rider reasons for not using DART services:
Factor elements: phone utilization, website and app utilization, home internet, payment options, non-rider awareness
● Home internet and smartphone utilization: Hispanic riders and potential riders are tied to their mobile devices, and almost all participants across all phases of research had smartphones.
● Website and app: Awareness and utilization of the DART website and GoPass App were lower than ideal, but utilization among people who were aware was around 70% for both services. Planning was an important feature for participants with a strong desire to more easily utilize the GoPass App and DART website.
● Payment options: Most riders were comfortable paying for trips on the GoPass App and with credit card. Ticket vending machines were a source of stress for Spanish dominant participants in our community listening sessions and malfunctioning TVMs created stressful situations for riders that were negatively reinforcing for future rides.
● Non-rider awareness: 52% of non-riding participants indicated that they don’t ride because they don’t know how to ride DART. The primary means to educate these riders may be through marketing campaigns, website and app tutorials.
On ticket vending machine hurdles:
“As my nephew told me, the information about the routes and payment is very confusing. He didn't know what payment options there were or if the ticket would depend on the distance to be traveled, and he speaks English. He normally uses the bus, but that day he missed it; he had to use the train, but didn't know how to pay or the correct ticket option for him, so he had to get on without paying.”-Eloisa, Dallas, 45-54.

Factor elements: demographic profiles, concerns about safety, cost and complexity of journeys:
● Rider age-Hispanic riders are younger than non-Hispanic riders.
● Education & Income-Hispanic riders have lower incomes than the general Hispanic & Latino population, and are more likely to have just a high school education or not have completed high school.
● Family & Household size-Despite having an overall younger age, Latino and Hispanic households are larger and likely to include more children.
● Safety-Safety was the top priority for all participants and particularly for women and people with children in their households.
● Riding with children-Riding with children adds to journey complexity. Those with children are more likely to ride but expressed concerns for cost and complexity of their journeys in the Community Listening Sessions.
● Cost concerns-Less affluent participants indicated a greater desire for cost reductions. A desire for weekend, family or other types of fare reductions was expressed.
● Awareness of fare reduction programs-Despite a desire for fare reduction programs, awareness of current student, child and reduced-price fares was low.
Q. What are the THREE MOST IMPORTANT factors when you are thinking about riding DART buses and trains:
On trip complexity and riding with children:
“On one occasion, when we had to take the kids to school, the bus took too long, so I looked for another route on the website, and took another bus. It turned out that the bus just went too far away to Carrollton. That day, we had to go back home and my kids missed the school day because we couldn't find a way to get there.”-Denise, Dallas, 30-34.

On language barriers onboard:
Factor elements: language, phone settings, welcome, literacy
● Language utilization - Fluency in Spanish and English was high in this sample of participants, with 47% of participants indicating that they spoke Spanish and English equally. Foreign-born residents and first-generation residents of the DART service area are more likely be Spanish dominant.
● Phone language settings - overwhelmingly, smartphones were set to English, even when participants indicated that they primarily spoke Spanish. Only 12% of participants had their phones set to Spanish.
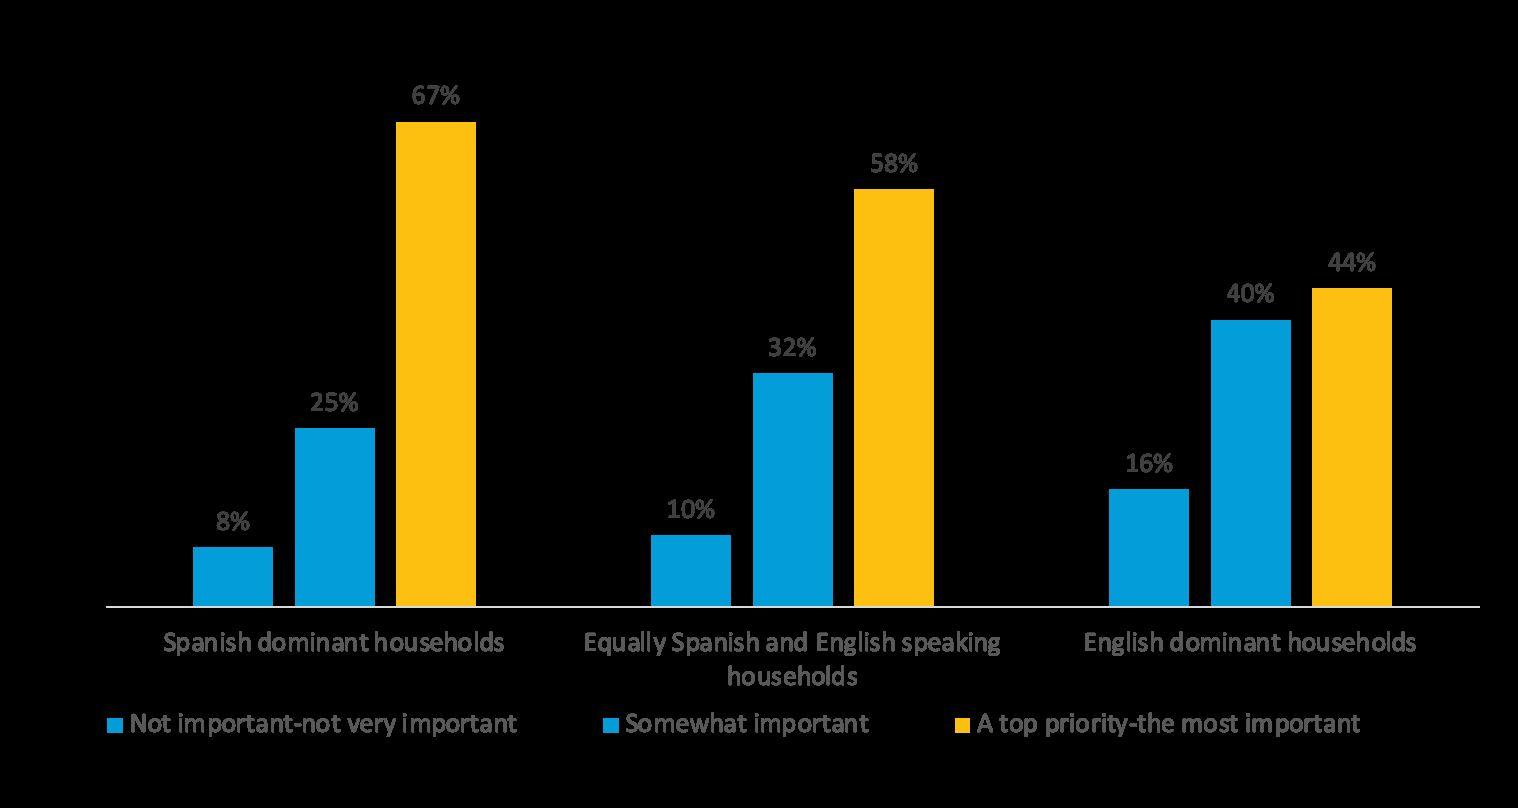
● Driver and staff welcome - for Spanish dominant participants, engaging with drivers came with hurdles. Participants felt under-resourced when they had questions onboard a bus or train and a welcoming environment was key to attracting Spanish dominant riders.
● Literacy & education - A sub-segment of Hispanic and Latino residents have lower educational attainment and may experience literacy barriers in both Spanish and English. Verbal, video and visual cues can alleviate riding challenges for these riders as well as serve other market segments.
“Whenever I use the train there are always people asking for help because they don't understand…how to use it, and I think it's because there are no signs or enough information in Spanish.”-Lorenzo, Carrollton, 35-44.
The importance of onboard welcome by language fluency:

Determining rider types:
Mirroring the work done in the 2019 DART Customer Segmentation study, this cohort of customers and potential customers was typed and segmented.
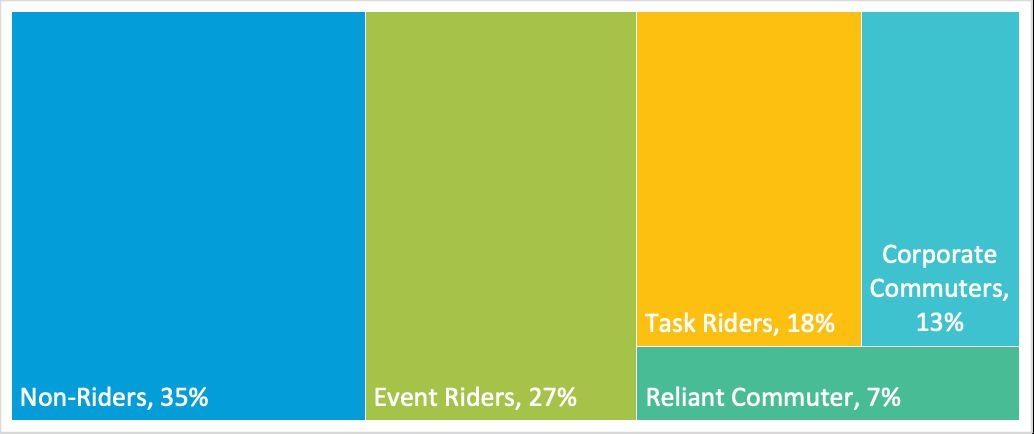
● Reliant Commuters-these riders are dependent on DART for work and personal travel and do not have household access to a vehicle.
● Corporate Commuters-these customers choose to ride DART to get to work, they appreciate the convenience and ease of riding the bus or train.
● Task Riders-use DART for shopping, commuting to school, medical appointments and other errands on a regular basis.
● Event Riders-occasionally use DART for entertainment, casual outings and big events. They use DART to avoid traffic and parking.
● Non-Riders-these potential customers never utilize DART. There is a strong preference for cars in this segment and a knowledge gap around riding.
Hispanic and Latino Rider Types Based on This Study
Knows where the nearest DART stops or stations are located
within a 10 minute walk of their nearest stop or station
Lives further than a 15 minute walk from their nearest stop or station
Market sizing and penetration from DART customer segmentation study, phase 2, 2020
● Current market penetration was sized at 6% of the DART area market
● Growth potential was a prospective additional 18% for a total market penetration of 24%
● 150,000 unique customers in 2019
● 450,000 prospective customers
● Total market prospects: 600,000 residents
● 41% of the market is Hispanic or Latino, indicating a potential ridership of up to 180,000 Hispanic or Latino riders, more than the current total unique ridership
● American Public Transportation Association data shows that DART ridership rates have rebounded to 78% of their 2019 high since the 2020 pandemic, but have remained lower than the 2019 high due to a more dispersed workforce
Hispanic and Latino potential riders, Hispanic Ridership Growth Project, 2024
● 35% of these participants were non-riders, with 44% of those non-riders living within a 10 minute walk to the nearest DART station or stop
● Another 21% of these participants rode DART once a month or less and 56% of those who rode once a month or less lived within a 10 minute walk to the nearest DART stop or station
● Market penetration has the most potential to be increased for those who don’t ride DART or who rarely ride DART and live within a short distance to DART stations: approximately 38,000 potential additional unique riders, a potential 25% increase
● Given the lower utilization for commuting post-pandemic, non-riders and rare riders have the potential to be converted into (or into more frequent) task and event riders
Sources: DART Customer Segmentation Phase 2-penetration estimates 2020 & American Public Transportation Association Ridership Report 2023.
Spanish
Spanish
Welcoming
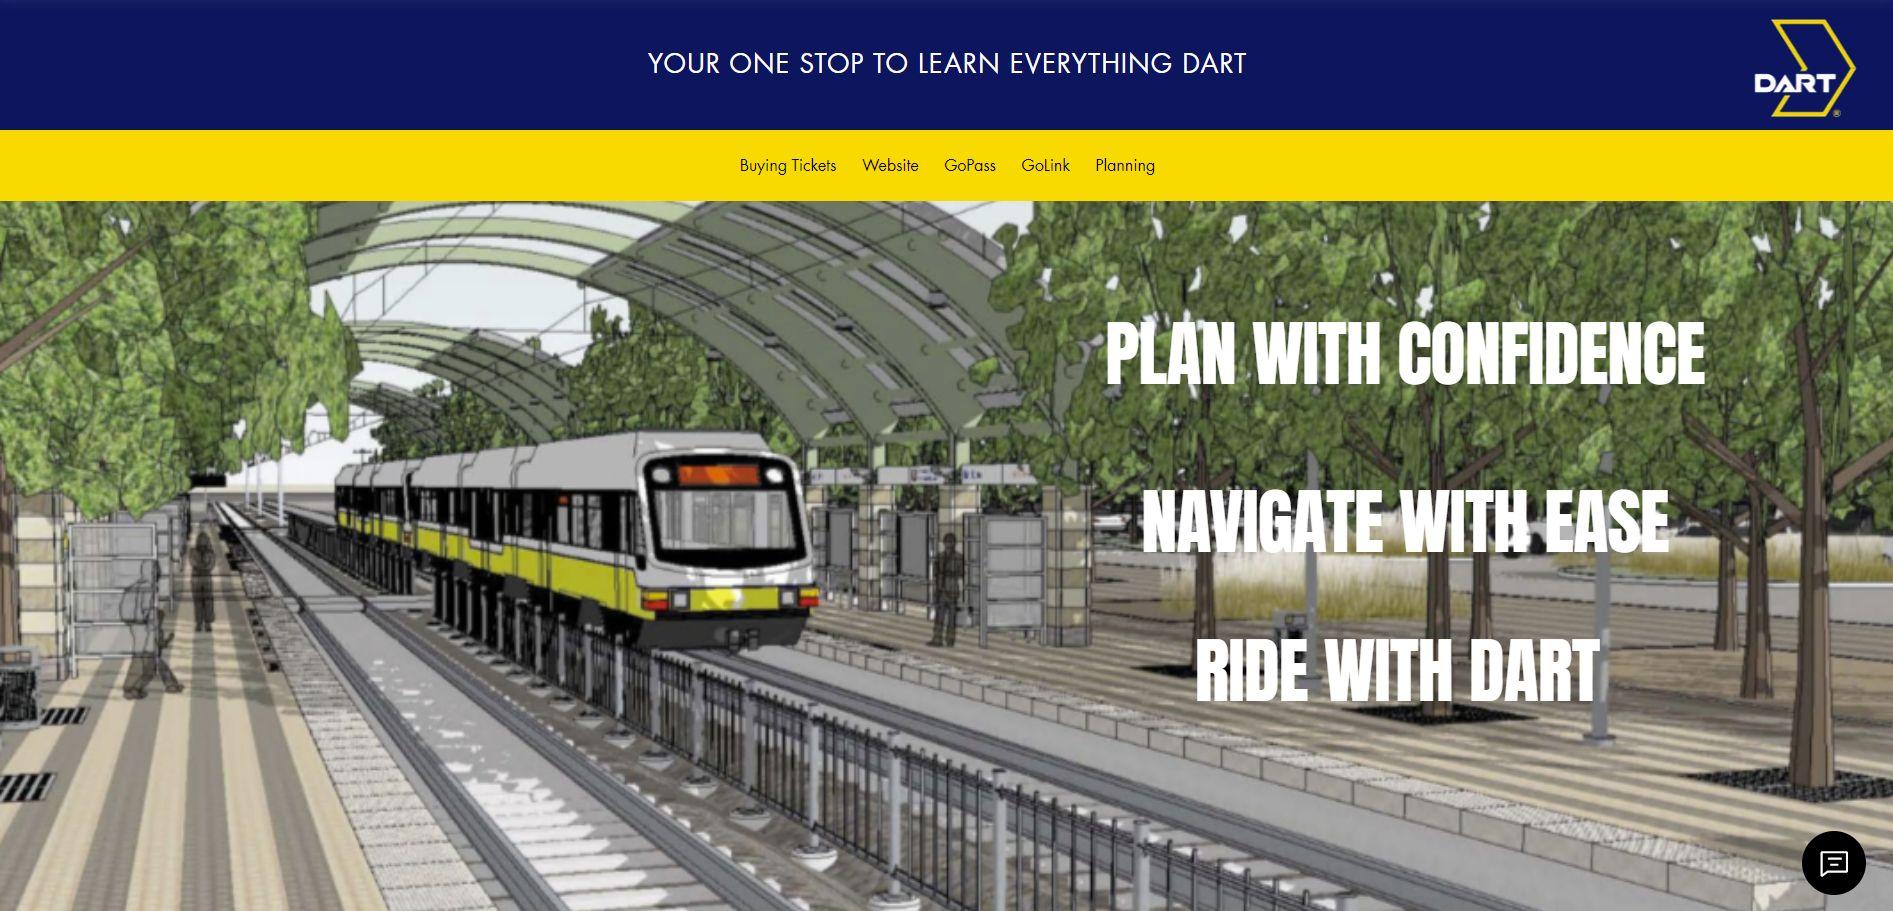
Create a resource to reduce barriers of understanding between users of DART and DART services. Resources can entail graphics or explanatory videos targeting main areas of friction.
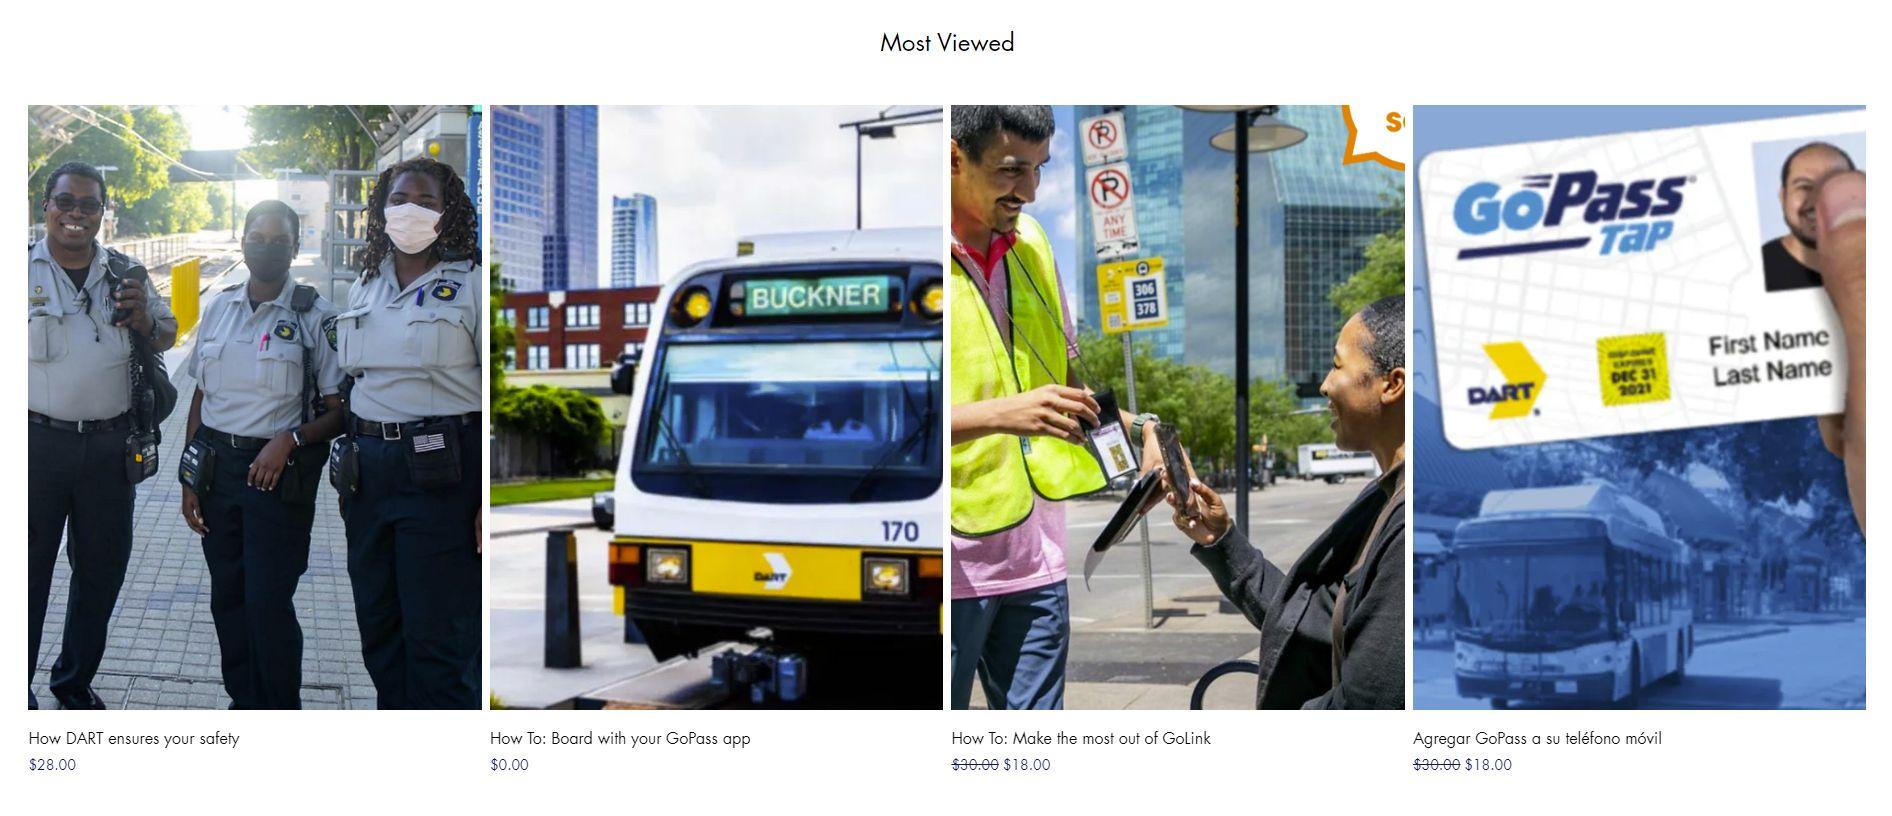
Create and deploy a DART services landing page in order to upload informational videos and graphics that will help understanding of DART’s. Video/ Graphics can cover topics such as:
● “How to navigate through the DART website.
● “How to use the GoPass App”
● “Purchasing your tickets”
● “How to plan your trip”
● “Saving money with DART” Videos can also be in Spanish to help assist Spanish speaking riders in understanding the DART system and the services it offers.
Help users understand the logistics of purchasing tickets and ride transfers in order to facilitate trip planning and reduce friction.
Create Spanish language media content to be shared on owned media platforms (Facebook, Instagram, YouTube) with the goal of converting X% of non-riders to riders by eliminating the idea that DART is hard to use/too difficult and improving the overall perception regarding DART’s ease-of-use for Hispanic riders.
● Facebook: https://www.facebook.com/DARTDallas
● Instagram:https://www.instagram.com/dartdaily/
● YouTube:https://www.youtube.com/@DARTDallas

Increase riders perception of safety on DART lines, which proved to be one of the largest areas of concerns for current Hispanic DART riders.
Create content and announcements that will:
● Showcase recent security upgrades, programs and better security statistics
● Be aimed at Hispanic segments to show security presence
● Design instructional videos in the case that riders require assistance
● Promote how they can alert DART when something goes wrong
Furthermore, operational changes may be needed in order to identify and address security issues on DART lines related to riders and relevant to Hispanic riders.

Traditional TV and streaming with a focus on reaching the target audience where possible
● Secure area-wide radio buys working with local radio stations and streaming
● Leverage sponsored social media including Facebook and Instagram
● Incorporate Google Search (SEM) and digital banners
● Local event sponsorship where DART would have opportunities to interact on a one on one
Basis to explain the various benefits and tools to make the usage of DART for efficient
● Influencers that are connected through traditional media, social media, and digital assets


STV/OTT, Traditional, Youtube/Pre-Roll
RADIO
Streaming and traditional to build awareness
Billboards, direct mail and print publications to build awareness
SEM and banner ads to target prospects across their online devices
Develop content and paid media strategy to support acquisition
Improve alignment between GoLink zones/ DART lines and areas of high Hispanic population (as a percentage of total population in a given area).
Address GoLink and line alignment disparity by focusing on areas with high Hispanic population and low GoLink zone presence/ low line alignment.
Potentially expand GoLink into the following area:
● Pleasant Grove/ Pleasant Wood
● Cockrell Hill
● Garland
Potentially expand lines in the following areas:
● Pleasant Grove/ Pleasant Wood
● Rylie/ Kleberg
● Rowlett
Improving the Hispanic riders’ experience with DART is a top priority as their perception of safety and accommodation on DART lines was identified a key barrier for increasing ridership.
DART can conduct staff training that will potentially improve the Hispanic riders’ experience by focusing on Hispanic rider’s concerns such as:
● Training staff to be aware of language barriers and equip them to handle interactions with Hispanic riders
● Creating more verbal announcements for stops and stations in Spanish
○ Train staff to greet riders in Spanish when possible
● Increasing language free explanatory content, make available via QR code and landing pages with informational content
● Hiring more Spanish speaking personnel and/or train them in how to communication with Spanish speaking Hispanics Addresses: Welcoming Drivers, Spanish announcements onboard, and potentially station and stop safety

Hispanic families often have larger households, making transportation costs a significant concern. By creating tailored transportation packages for specific events, we can attract these families to become regular transit users. Such initiatives can demonstrate the convenience and cost-effectiveness of public transportation.
Our strategy involves offering family ride packages during specific times of the month or around popular events. For instance, a "Family Ride Package Weekend" or special offers during the State Fair can provide Hispanic families with an opportunity to experience DART services. This approach can encourage them to use public transit more consistently, showing them the benefits of avoiding traffic and parking hassles while enjoying family outings to events or attractions like the zoo.


Idea Goal
Landing Page
Media Content (Transfers and Ticket Purchase)
Improve understanding of DART services with reusable content.
Reduce friction when it comes to buying and planning trips with DART.
Messaging
Media Content (Safety)
Family Ride Packages
Improve the perception of safety amongst Hispanic riders.
Messaging
Execution (level of difficulty)
Easy |
Moderate: Requires website setup and video/graphic creation.
Moderate: Requires video/graphic creation and audio where applicable.
Low | Medium | High
High: Educates users on the DART system.
Medium: Engage with users to navigate vital DART features.
Messaging
Moderate: Requires video/graphic creation and audio where applicable.
High: Addresses safety concerns.
Create more value for Hispanic riders traveling in families by reducing cost.
Operational
Easy: Just requires planning and execution based on the family of four.
Medium: Increases accessibility for families.
Staff Training
Improve ride experience of Hispanic Riders by creating more accommodations.
Operational
Easy: Scheduling needed to set up additional staff training and development of training curriculum.
High: Provides an extended sense of safety and inclusion.
GoLink and Line Expansion
Potentially serve a greater number of Hispanic riders through more lines and extended shuttle service.
Operational
Difficult: Requires line and GoLink zone expansion in identified areas; scope of operations will slightly be expanded.
High: Adding new lines and GoLink areas increases reach.
Create a plan to capture a percentage of the 38,000 additional unique riders that would increase the DART customer base by 25%. Utilize the factor elements shared today to encourage Hispanic and Latino residents to ride DART buses and trains by incorporating some or all initial solutions identified.
● Evaluate the opportunity to conduct additional research to focus on non-riders
○ Study can focus on all segments not just Hispanic to understand causality and how DART can better connect with them
● Determine in-house media capabilities to execute on recommendations
○ Consider running short test to further validate messaging needs
○ Prioritize content topics that will drive greatest impact (safety, product demos, “how to’s”, etc)
○ Evaluate if test can be run as part of this project or if new RFP is required
● Identify operational roll-out pertaining to associates, drivers and general staff
● Feasibility assessment of GoLink expansion and family packages recommended
○ Prioritize big events that have natural earned coverage (State Fair, holidays)
● Socialize findings with greater team and determine what is shared with board and other stakeholders

● Car preference and utilization-working vehicles were available to all non-riders and car ownership rates for Hispanic and Latino residents mirrored those of non-Hispanic white DART area residents.
● Awareness of services-both riders and non-riders lacked a comprehensive awareness of DART services available to them, with larger gaps in awareness for non-riders.
● Knowledge gaps-more than 50% of non-riders indicated that they did not know how to use DART. Education on services, tutorials on utilizing the DART website, GoPass App, GoLink services and Ticket Vending Machines would help to encourage greater utilization of services. Ease of purchasing a ticket was closely linked to the perception that DART is easy to utilize.
● Language barriers-While the majority of DART area Hispanic and Latino respondents were bilingual, additional information was desired by Spanish-dominant subsegments of riders. These riders also have lower educational attainment and would benefit from audio, video and language free educational and marketing content. Spanish-dominant respondents were the most likely to value welcoming DART staff and prefer to pay in cash.
● Employment types-while employment types were similar between riders and non-riders, non-riders were more likely to indicate that their day included more stops and their journeys were more complex.
● Safety and Security-Safety and security were the most important priorities for riders and non-riders alike and were the #1 reason for both groups not riding DART or not riding more frequently.
● Cost-Non-riders were more cost conscious than riders and community listening session participants indicated a desire for additional fare types for families. At the same time, awareness and utilization of reduced price, student and child fares was low.
● System alignment-One cause of the ridership discrepancy is line alignment. Where bus and train lines and Hispanic and Latino communities align, ridership is closer to area population. The system alignment report explores the communities and DART services surrounding highly indexing lines and highlights areas of opportunity for system alignment or marketing pilot studies.