
EDUCATION
2020.09-2025.06
Shenzhen, China
2024.03-2024.06
Vienna, Austria
DISTINCTION
2023 & 2022
2023 & 2022
2023 & 2022
2022 & 2021
2021
INTERNSHIP
2024.09-2024.11
School of Architecture and Urban Planning (SAUP), Shenzhen University(SZU)
Bachelor of Engineering in Urban and Rural Planning
GPA: 3.78/4.5; 85.6/100; Ranking: 4/29
Vienna University of Technology
International Urbanisation; Sustainable urban development-Empirical Approaches; Sustainable urban development-Theoretical Approaches; Integrated Design Studio
COMPETITION
2024.03-2024.07
Core Member Second Prize
2024 WUPENiCity International Competition on Student Course Works of Urban Design
The design of the Vienna Nord railway station is designed to retain the transportation function as a supply mode of energy and agricultural production within the site, and as one of the important carriers of energy circulation and movement within the community, creating a mobile and selfsufficient community.
SZU Third Prize for Academic Excellence of "Saida Kaisa" Scholarship (Top 10%)
SZU Second Prize for Outstanding Student Leader
SZU Third Prize for "Learning Star"
SZU Third prize for "Charity Star"
Second Prize in the Structural Competition of SZU Architectural Culture Festival
Project Intern | Urban Planning & Design Institute of Shenzhen (UPDIS)
Scientific connotation of urban stock space and its type spectrum construction
Conducted comprehensive literature reviews on the definitions and identification methods of urban stock spaces both domestically and internationally; Analyzed the evolution of policies and regulations related to inefficient land use in China; Collaborated with research team members to define the scientific connotation of urban stock spaces based on prior research findings; Developed a typological framework and established a foundational indicator system for classifying urban stock spaces
WORKSHOP
2023.12 Tomorrow : New Town Model 2050 Advisor: TAN SHEE TIONG (Adjunct Associate Professor From NUS)
Awarded with “Excellent Student” (4/35) and recommendation letter
Served as the main designer of project site planning; Created a seamless ecological corridor and achieved reasonable road network layout; Gained a deeper understanding of Singapore's urban planning system and logic, and delved into future urban design
CAMPUS MEMBERSHIP
2024
Deputy Secretary of the Undergraduate Joint Party Branch of SAUP, SZU
Deputy Secretary of the Youth League of SAUP, SZU
Deputy Director of the Volunteer Department of SAUP, SZU
2022.06 2021.06
SKILL
Computer
Volunteer hour exceeding 328 hr in various SZU volunteering activities
Top 10 Volunteer Key Members of SZU Volunteer Union
Volunteer Activist of SZU Communist Youth League
Language Enscape, V-ray, ArcGIS pro, Photoshop, Auto CAD, In Design, Rhino, Grasshopper, Sketch-Up, Adobe Illustrator
English (IELTS:6.5); Mandarin (Native); Cantonese (Native)
2023.09-2023.11
Core Member
Researched the history and spatial evolution of the Vienna Northwest Railway Station, along with the full lifecycle of energy pathways and related detailed data. I proposed a concept for site redevelopment that involves preserving and revitalizing the original railway tracks, leveraging the station's inherent "mobility" to create a mobile energy cycling community. I was responsible for the main layout design, including the creation of the master plan, node renderings, and analysis diagrams.
Excellent Work Award of Village Planning Scheme Section
2023 National College and Universities Student Rural Planning Scheme Competition
Created a three-ring operation and maintenance loop of villages, vocational schools, and industrial parks, aiming to improve the personal quality of villagers to drive the development and prosperity of villages
Conducted on-site surveys in villages to collect information on local conditions by interviewing village committees and villagers; Provided main planning and design ideas and deepening directions; Proposed an innovative idea to take the vocational school as talent transaction place between factories and villages; Led to complete main layout design and drawing of village planning floor plan and node renderings
2021.09-2022.01
Core Member
RESEARCH
2024.11
Individual work
2023.03-2024.04
Project Leader
Excellence Award | 2021 CapitaLand Youth Architects and China-Singapore Guangzhou Knowledge City Zero Carbon Public Space Construction Competition
2023.09-2024.01
Core Member
The impact of green infrastructure on the vulnerability of disadvantaged groups in the context of urban warming
Abstract is currently under review by ETH Zurich Sustainable Built Environment Conference
Analysis of Residential Migration Characteristics of Urban Village Residents in Shenzhen: Based on Comparison With Commercial Housing
Accepted by 2024 Annual Meeting of Urban Planning Society of China; Approved by 2023 Provincial College Student Innovation and Entrepreneurship Training Plan Project
Completed questionnaire distribution and collection in three research sites and surrounding areas; Concluded the basic characteristics and reasons for residents' migration by sorting and analyzing questionnaire information; Used SPSS to conduct data analysis and obtained the main differential factors affecting the reasons for the relocation of residents in commercial housing and urban villages, and the significant relationship between relocation characteristics and satisfaction
Extraterrestrial "Objects" - Research on The Suitability of Location Selection For Timely Delivery of Drone Take-off and Landing Points
Normination Award of 2024 WUPENiCity International Competition on Urban Sustainability Reports
Investigated the current use of drones in Meituan by interview people in charge and questionnaire surveys on customers in thirteen places; Proposed the core factors for drones' take-off and landing point location selection and calculated a formula for calculating the suitability of take-off and landing points through spatial analysis; Selected potential land parcels and potential point in Nanshan District, Shenzhen, and conducted experiment
RESPONSE
During my exchange program in Vienna, I observed Austria's strong focus on addressing the needs of vulnerable groups within its sustainable development policies, particularly in housing initiatives that promote equitable access to green infrastructure for all social strata. This experience made me reflect on China’s emerging underclass, including food delivery riders and e-hailing drivers, who often struggle with limited rest spaces during their off-hours and a lack of affordable housing. Cities should not cater only to the privileged; they must provide a comfortable and accessible living environment for everyone.
Therefore, I aim to incorporate the needs of vulnerable groups into my future studies, exploring innovative strategies to enhance public spaces and contribute to a more inclusive and equitable urban environment.
In the portfolio, I selected works varying from global and urban to community and architectural scales to illustrate how I respond to the needs of disadvantaged groups in my research on sustainable urban design and provide corresponding solutions.
CONTENTS
SELF-SUFFICIENT NEW TOWN 2.0 REBUILD ENERGY NETWORKS
A waterfront future community based on the Singapore New Town model
Build a self-sustaining energy community by 2050 based on the existing railway station tracks
URBAN RENEWAL FOR DELIVERY RIDER AN INCLUSIVE LIFE STATION
Creat a exoteric delivery net based on the negative boundary space in urban villages
Create an open community based on the MBTI philosophy
05 CLIMATE SHOCK FOR DISADVANTAGED GROUPS
The impact of green infrastructure on the vulnerability of disadvantaged groups in the context of urban warming
SELF-SUFFICIENT NEW TOWN
A waterfront future community based on the Singapore New Town model
Type: Workshop
Instructor: Tan Shee Tiong (Adjunct Associate Professor of NUS)
Date: 12/2023 - 12/2024
Location: Huilai county, Jieyang, China
Area: 7.9 km²
Teamwork: Yongqi Li, Xinyue Xu, Jiaxin Huang
Role: investigate and survey 60%, concept 50%, strategy 60%, master plan and system analysis 80% (Personal upgrade in 2024)
We plan the site based on the whole industrial chain cycle of production-consumption-recycling , combined with the upperlevel planning, through the analysis of the links of the industrial chain in all aspects, the required land and productive buildings, I divide the industrial chain into three parts. The first upstream, that is, the primary industry such as agricultural production and site advantage fishery and aquaculture industry; followed by the middle and lower reaches, that is, the product processing and sales part, and the part with a higher industrial processing value; Finally, there are more advanced downstream industries such as R&D and innovation orientation. In order to make this town far away from the central area of the city have better self-resilience in the event of sudden disasters, we learned from the Singapore New Town Model, and deformed this applicability, and created the New Town Model 2.0 to build this green self-sufficient town near the sea
Singapore's new town model facilitates the efficient intensification of land use and the building of integrated and functional communities. Its characteristics are manifested in its high-density and compact layout, TOD model, community complexes as community centers, and emphasis on green and low-carbon development.


The site is surrounded by a large amount of productive agricultural land and small-scale villages, towns and factory facilities. To the north-west, there are well-protected forests and marine resources with a high potential for development.

Jinghai long-distance bus station


Sandy shore
Forest
Paddy field


Cropland
Village Factory
Abandoned site

ADVANTAGES AND OPPOTUNITIES
LOCATION DOMINANT INDUSTRY FEATURED ARCHITECTURE
next door is the regional development center, which can disperse part of the industry to the site for development. And it is located in the middle of the two port areas, which has the advantage of transportation, transshipment and warehousing.


Located in the coastal agricultural farming area, and the high salinity of sea water and lush algae in the waters of Jinghai Harbor are very suitable for abalone seedling cultivation, and the policy encourages abalone aquaculture in the area.

DISADVANTAGES AND CHALLENGES

Jieyang belongs to Chaoshan, and the characteristic houses of Chaoshan are the "simplified version" of the courtyard, that is, the four main houses in front and back are facing the patio, and the windows are generally not open to the outside, and the windows are only open to the inner courtyard. Its architectural style is Cuo Jiaotou.


The site is located in a coastal area with strong winds, high water levels and turbulent currents, which poses a risk of flooding. And there is a lack of relevant flood prevention measures and means to prevent it.


Government
The government plans to enhance local infrastructure and develop new industries by 2035, while safeguarding farmland and the coastline. As a key ecological area, funds have been allocated for regional conservation projects.

ADVANTAGES
Investor Iaborer Inhabitant
Local resources have not yet been explored, and enterprises can invest here to obtain higher returns at lower prices. And local residents are willing to absorb more enterprises to promote local development.

Abundant farmland resources
Diversity of energy resources
Suitable production conditions
PLANNING MODEL - NEW TOWN 2.0
Combined with the geographical location of the site and the advantageous industries, With the goal of self-sufficiency and sustainable development, a new and more detailed new town model 2.0 has the following characteristics: (1) the area of the traffic road is reduced, and more space is released for green space and production services along both sides of the road; (2) compared with the original neighborhood center for commercial services, the model re-arranges the leading industries of each neighborhood center from the industrial chain, and can be divided into agricultural production and R&D-oriented and manufacturing and service oriented according to the type of attached land, of which the town center is the collection of the highest service system, including sales, transportation, production and R&D as one of the complexes. NEW
The local area is surrounded by villages with fewer factories, so there are fewer jobs available and the wages are not high. Moreover, most of the local factories are industries dealing with low-end products, which do not attract migrant workers.

Existing facilities in the village can only meet the basic needs of life, unable to provide higher spiritual and cultural services, and external transportation is only a county road through, out of the inconvenience.

TOWN MODEL 1.0
DISADVANTAGES
Flood risk near the sea
Few transportation connections
Underutilization of resources
Green roof & vertical green
Automatic driving
Rainwater harvesting Slow-moving traffic system
Pocket farm inside Release more green space
Resource recovery
Industrial complex building
Underground transport
Industrial logistics
Ecological corridors
Permeable pavement
Ecological riparian
Flood defense facility
Agricultural landscape

Creating a green, sustainable and self-sufficient community that builds on the logic of the industrial chain, the future mode of transportation, and is people-centered.


STRATEGY 1 - CONSTRUCTION
In order to enrich the architectural forms within the community, the residential, central complex, productive buildings and public support facilities are oriented to form different variations of building blocks according to their functions of use.
FUNCTION
DESIGN APPLICATION
STRATEGY 2 - LANDSCAPE
In order to make coastal cities have a better ability to resist flood risks, there are corresponding sponge city response facilities in urban construction, from pipeline transportation, street paving to landscape setting.
BUILDING PROTOTYPE
RESIDENTIAL BUILDING


Based on the basic enclosure type structure of the characteristic residence, there are different residential service object orientations through different functional mixes based on different functions and geographical locations.


CENTER COMPLEX


The centers of each neighborhood are complexes, but have different dominant functions based on the different attributes of their surrounding land use, and are classified as primary, secondary and tertiary centers based on the upstream and downstream levels of the industrial chain of the land they are attached to.


PRODUCITIVE LAND


SEAFOOD TREATMENT
It mainly includes production land such as agricultural production and mariculture, and industrial land such as agricultural product processing and treatment, seafood processing and treatment, and logistics and transportation.

STRATEGY 3 - TRANSPORTATION
Autonomous driving has reduced the amount of land used for transportation, freed up more green space, and in some areas, the ground floor has been completely used as a public space for pedestrians, while the public space on the normal road is compensated by the building space on both sides.


PUBLIC FACILITY


CUTURAL ACTIVITY CENTER
It mainly serves the basic needs of residents and workers, including infrastructure and cultural services such as schools, hospitals and cultural activity centers.

The New Town Model 2.0 is applied to the site, and different building forms are put into the corresponding functional land to create a changeable sustainable and green development community, and connect with the surrounding existing roads.
In order to have a more comfortable living experience, the traffic between the factory and the residential area was separated as much as possible, so two different systems were created.


Integral system
The core manages buildings and major transportation roads Shopping centre
As the first-level production tower, it integrates the functions of the middle and lower reaches of the industrial chain, and is positioned as a high-end product, mainly oriented to the sales and service industry. And because it is a passenger transportation hub, in addition to being a place where the urban population gathers, it also has the function of warehousing and transshipment, and there is a large storage warehouse underground. The upper floor of the building is mainly used for energy harvesting production and agricultural high-yield research and development to ensure the basic operation of the town.

The community activity center near the sea is not only an area where large-scale community activities gather, but also can be used as an open-air cinema or party performance venue on the ground floor, and also carries the sightseeing and distribution function of the coast, with a certain tourism orientation

CENTRAL GARDEN
In addition to the green corridor, the community center park is a large green public space for residents to take a large leisure walk, and different parks have different orientations, namely child-led, elderly-first, sports park and interpretation park.

REBUILD ENERGY NETWORKS
Build a self-sustaining energy community by 2050 based on the existing railway station tracks
Type: Academic work
Instructor: Kefei Yan
Date: 03/2024 - 07/2024
Location: Vienna, Austuria
Area: 1km²
Teamwork: Yongqi Li, Jiaxin Yuan
Role: investigate and survey 50%, concept 50%, strategy 2&3 60%, system analysis 80%, detailed design(modified) 80%
Awards: the Second Prize | 2024 WUPENiCity International Competition on Student Course Works of Urban Design
The design is based on the renovation of the site's existing transport station, the Vienna Nord Railway Station. After investigating the history and texture evolution of Vienna's Northwest Railway Station, as well as calculating the path and relevant detailed data of the entire energy life cycle, we proposed to renew the site with the concept of retaining and revitalizing the original railway station tracks. Some of them retain the original track traces and their related functions as the supply mode of energy and agricultural production within the site, and as one of the important carriers of energy circulation and movement in the community . Based on the background of 2050, the original "mobile" characteristics of the railway station will be used to create a mobile energy cycle community, and create a mobile "third space" for residents to live and work. It also strengthens the concept of sustainable development, ensuring energy and food self-sufficiency in the community, and increasing resilience against risks in the future.
The North-West Railway Station is now used only as a subway intermediate parking lot and the government has invited public tenders for the redevelopment of the site. It has large gardens on the east and west sides and is in a privileged location next to the Danube.


HISTORY


The site was built in 1870 and ceased to function for freight transport in 2007 and for passenger transport in 2017. It is now used only as a subway intermediate parking lot

The site is the former Nordwestbahnhof (North-West Railway Station) in Vienna, located in the 20th district of Vienna (Brigittenau district). Built in 1913, the site ceased to function for freight transport in 2007 and for passenger transport in 2017. It is now used only as a subway intermediate parking lot.

The site has abundant rail resources, convenient surrounding transportation, and close connection with the city; There are large green spaces on the east and west sides, many public facilities around, and the buildings are old and have sufficient sunshine resources.


Barriers to urban structural development
Climate change and heat wave
2025-Planning Positioning
PROBLEMS
STRATEGY 1 - ENERGY
Solar energy and water resources are collected and transformed to be used in the production and life of the community, Recyclable Waste is collected and reused through sorting and other means, Household Food Waste is processed to be used as biomass, and in addition, the excess energy produced by the community is channelled to the outside city.
Adverse environmental impacts of freight transportation Legacy facility disposal and utilization
POLICIES
2050-Vienna future smart city strategy
2030 Agenda for Sustainable Development - 17 Sustainable Development Goals (SDGs)
Building a clean energy network
logistics and distribution
CARBON EMISSION ZERO-CABON Community
INNOVATION Mobility
CONCEPT & APPROACH STRATEGY
Create a full-cycle energy network using solar, wind, biomass, and rainwater to provide clean, sustainable energy. The network will adapt to future growth, reducing reliance on traditional sources and promoting environmental sustainability.
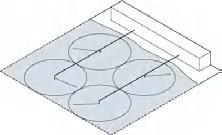
Use original railway tracks as the foundation for modular community mobility, connecting homes, public spaces, and workplaces seamlessly. Leverage big data to offer 24/7 rail services for residents, with drones providing just-in-time transport support.
ENERGY SELF-RECYCLING COMMUNITY Innovation
PEER-TO-PEER CONNECTION
Functional mixed
SELF-SUFFICIENT LIFE CIRCULAR Life
Establish a material recycling model covering the full life cycle of production, distribution, and recycling. The track is designed to bypass public spaces, preserving the community's ecological landscape and enhancing vitality and harmony.

STRATEGY 2 -
The community has a 24/7 service based on unmanned rail transport, allowing residents to make purchases and collect waste without leaving their homes via their mobile phones. In addition, the community uses unmanned transport to supplement rail transport, enabling immediate and rapid peer-to-peer transport, making it easier for residents to enjoy the convenient future life.

automatic operation through online operation
STRATEGY 3 - SOCIETY
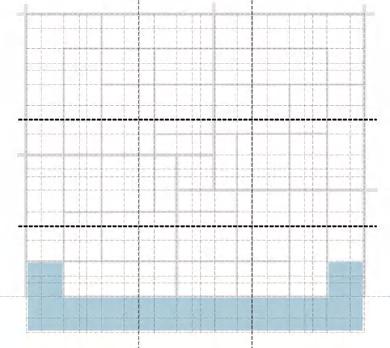
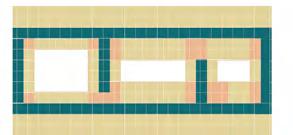
Each living space features a 5x5x4 module that moves along the community track. Residents can command it to travel to the rail station for city access or wait at a neighborhood entrance for direct home entry. However, the modules can only be moved around the track, placing public facilities in a centralised location and encouraging residents to walk and interact within the shared area.


The design incorporates strategic internal openings for natural light and varied proportions of
and public spaces to enhance flexibility. This approach allows diverse configurations across six functional unit types, showcasing the design's adaptability.


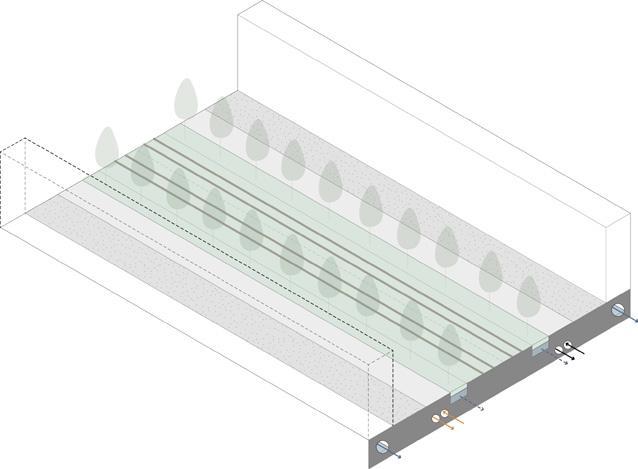
The design leverages existing railway infrastructure to create a vertical community layout, integrating green corridors and public space nodes. A horizontal green corridor connects parks, while rooftops feature energy systems and walkways linking key public buildings.

SYSTEM ANALYSIS
The community consists of a number of networked systems, including energy input and output systems, waste collection systems, green space systems, modular transport systems, and public spaces.


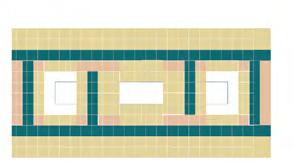
Based on 6 basic room modules, a variety of living unit models can be obtained by combining them according to different needs and family structures. Residents can decide to add to or dismantle existing living modules through their own circumstances, and by combining different living unit modules, they can obtain changeable and growing building facade forms.


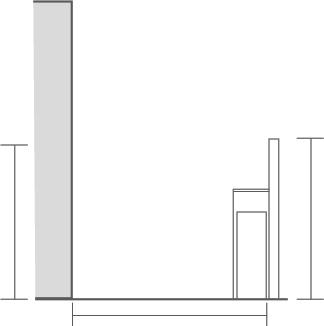
SECTIONAL PERSPECTIVE VIEW


representation of the combination


AERIAL VIEW PERSPECTIVE VIEW
The site’s central green corridor connects buildings through layered landscaping, creating a clear spatial hierarchy. Key entrances feature public buildings, while rooftops integrate green energy systems and walkways, fostering a sustainable, connected community.

The diagram highlights a central green corridor surrounded by open buildings and walkways, fostering interaction with nature. It creates a livable community, enhancing ecological resilience and social connectivity while promoting human-nature symbiosis.

The rooftop design features multi-functional zones, including green energy systems, activity platforms, and connected walkways forming a site-wide network. This approach enhances accessibility, ecology, and functional vitality, fostering diverse and dynamic uses.

URBAN RENEWAL FOR DELIVERY RIDER
Creat a exoteric delivery net based on the negative boundary space in urban villages
Type: Academic work
Individual work
Instructor: Kexin Feng
Date: 01/2024 - 09/2024
Location: Tianhe District, Guangzhou, China
Area: 0.31km²
Urban villages are the areas where delivery riders gather and shuttle most frequently, but due to their special historical status and development process, the building spacing inside urban villages is too narrow, the traffic layout grows freely, and there are no standardized road guidelines and requirements, which has great potential safety hazards. And for both residents and delivery riders, the excessive pursuit of construction area in urban villages has led to a serious lack of public space in the village , leaving people with no place to go for leisure and entertainment. Therefore, in order to improve the spatial experience of residents and riders, after studying the one-day walking routes of riders and residents, it is proposed to establish a pick-up point in the outer ring of the urban village according to the five-minute walking distance and form a peripheral pick-up network, so as to reduce the probability of riders entering the urban village and clashing with residents. In addition, along the periphery of the urban village, the negative spaces such as fences are optimized and improved to provide more public space, and according to the different use of space and required functions of the two, the space is divided into different time periods to lead to different groups of people to provide space use efficiency. It is hoped that through simple acupuncture-style urban renewal, the living experience of disadvantaged groups in the city can be improved.
Combining the entrance ancestral hall and pond to create a center for residents' activities and use the unused land and open space at the entrance to set up a rest and recreation area, which is convenient for riders to pick up food and rest at the same time, and also provides a place for residents to go for leisure.

The Boundaries +
After removing the original fence, it was transformed to separate the boundaries with green plants to increase the visual communication between the urban village and the outside and reduce the sense of fragmentation. At the same time, relevant public facilities and pocket parks are installed along the perimeter for riders and residents to rest.


At the entrance across from the food market, utilizing the geographic characteristics of the entrance with many e-bike related stores, create an area for riders to change batteries, repair their e-bikes and take a rest; and at the same time, set up a pocket park for residents to relax on the road that residents have to go through to buy groceries.


Complex utilization of the ancestral hall and the open space belonging to it as a public space for residents' daily fitness and exercise, and limiting the entrance to the place to allow only residents to enter and exit, so as to safeguard the right of way of human beings.
Pick-up Point +
A pick-up point at the entrance, at the intersection of the two roads, will make it easier for riders to pick up their food and reduce the frequency of riders entering the village to avoid rushing residents.


The boundaries and surrounding functions of the urban village.


BOUNDARY DEVELOPMENT


Different activity routes between riders and residents within and outside the village.

DESIGN STRATEGY


Linear space focuses on the transformation of the long and pass-through space at the entrance or the end of the inner part of the urban village, mixes the existing scattered functional spaces, transforms the space under the wall and improves its utilization efficiency, opens the wall through landscape or functional buildings, enhances the visual communication on both sides, and increases the social and cultural interaction between the urban village and the external city.
Joint design


Combined with the original function of the shop to transform, priority is given to the resident service industry (such as: repair of electric vehicles). Open the shops to the public and provide riders with space to stay.
PICK-UP ANALYSIS - AREA
If the public space is used, the adaptability for riders will be increased while retaining the original function; if the shops are transformed, the rest space and meal taking for riders will be set together with the open space.


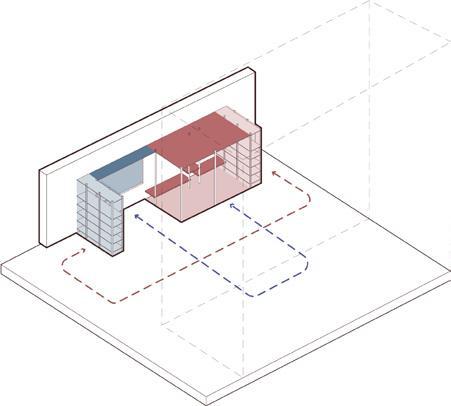


The same space is used at different times by different dominant people. The red area represents the main activity area of the rider at the current time, and the corresponding blue area is the main activity area of the residents.
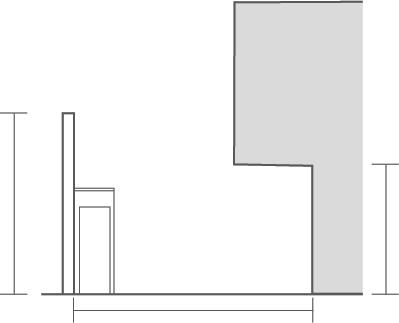
11 : 00
At noon, most residents are indoors, so the outdoor activities at the entrance of the village are primarily limited to delivery riders delivering takeout. Additionally, a shaded area is provided for riders to relax.

20 : 00
At night, residents come out for walks or leisure activities. Although there may be a few riders still delivering meals, the outdoor activities here are primarily conducted by residents.

AN INCLUSIVE LIFE STATION
Create an open community based on the MBTI philosophy
For the project, I focused the site on a TOD cubicle for a bus terminal based on an analysis of the infrastructure coverage around the site. And in order to meet the requirements of the area's job/housing balance, as well as to comply with policy requirements, social housing is built above the bus station. In addition, the concept of MBTI is introduced to create an equal, open and socially mixed community through the design of living units and flow lines.
Type: Academic work
Individual work Instructor: Fang Chen
Date: 03/2023 - 08/2023
Location: Nanshan District, Shenzhen City, China

The analysis reveals that the site has the advantage of good transportation resources, but lacks infrastructure coverage in some areas.
CONCEPT DEVELOPMENT
CCONSTRUCTION REQUIREMENTS for Public Transportation Terminal Stations

DIFFERENCE in 16 MBTIs
THINKING
INTROVERTED
DIFFERENCE between the life of INTROVERTED and EXTRAVERTED people Trajectory of the day's activities
Differences in the degree of openness of space use
Building a Diverse, Open and Equal Community based on TOD Theory
The 3.3m x 7.5m base modules are combined to form single, double and triple occupancy units, and with the aid of removable partitions are available for extroverts and introverts depending on the degree of openness of the room.
SINGLE-PERSON UNIT
TWO-PERSON SHARED UNIT
THREE-PERSON SHARED UNIT
Firstly, it is divided into the public-private level, separating the flow of tourists from the flow of residents, and introducing the public to the observation level in the center through the public space to increase the interaction with the city. In the room arrangement of the private residents, the rooms for the extroverted people are placed close to the public space, and the rooms for the introverted people are placed in the center, forming a public-semi-public-private public space hierarchy.
In addition, a bicycle path is introduced in the middle and lower floors, so that residents can complete the last kilometer of the house by cycling, and satisfy the residents' demand for exercise.

SOCIAL HOUSING
METRO SHOPPING MALL
DESIGN DETAIL
The operation of deletion and consolidation based on 26 basic units per floor allows for versatility of plan and separation of residents and visitors through the provision of corridors.


In addition, from the facade, an observation deck is provided on the middle floor, and small terraces are created in the rest of the building to supplement the supply of public space.


CLIMATE SHOCK FOR DISADVANTAGED GROUPS
The impact of green infrastructure on the vulnerability of disadvantaged groups in the context of urban warming
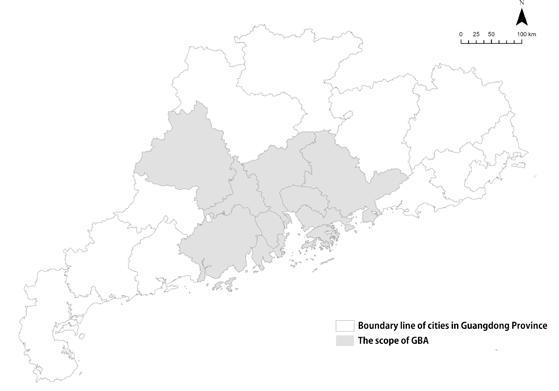
This study aims to explore the relationship between the distribution of green infrastructure and the vulnerability of specific groups (e.g., female, aging and young population) in the Guangdong-Hong Kong-Macao Greater Bay Area (GBA), based on remote sensing images and demographic data. First, the vulnerability evaluation indicator was constructed using the proportion of females, the proportion of people under 15 years old, the proportion of people over 65 years old and population density. Results show a higher vulnerability of disadvantaged groups in edge cities than in core cities, mainly due to the lower level of education, the aging population, and the higher proportion of minorities. Besides, higher vulnerability in central urban areas of core cities is driven by higher population density and more serious aging, which is closely related to urban development and uneven distribution of resources. Second, a kernel density analysis was applied to explore the distribution of green facilities, and the results show aggregation of green infrastructure in the central regions of the Bay Area, while clustered green facilities were also detected in some second-tier cities, possibly due to effective urban greenery policies. Third, correlation analysis reveals a negative relationship between the aggregation degree of green infrastructure and population vulnerability, indicating that vulnerable groups are basically exposed to fewer cooling sources. Additionally, the vulnerability index is found negatively correlated with LST, which is probably due to the vulnerable groups usually residing in non-central urban areas with relatively low LST.
Type: Research
Instructor: Yan Zhang
Date:
Location:
Individual work 07/2024 - 12/2024 the Greater Bay Area, China
This study reveals the uneven distribution of vulnerability and green infrastructure in the GBA and the relationship between vulnerable groups, greenery and urban heat, suggesting an urgent need for urban heat mitigation actions for disadvantaged populations. Potential planning strategies from the green infrastructure perspective include a prior arrangement of green infrastructure in hotspot areas of high vulnerability, an optimal layout of green infrastructure in core cities of GBA to further mitigate urban heat, and a balance between economic development and urban heat reduction in peripheral cities through the preservation of the original natural ecological infrastructure and proper development of new green infrastructure in vulnerable areas.
TRENDS IN GLOBAL TEMPERATURE

Daily global surface air temperatures for 2023, indicating the increase above the average for 1850–1900, the designated pre-industrial reference period. The plot highlights temperature increases within three ranges: 1–1.5℃ (orange), 1.5–2℃(red), and above 2℃ (crimson).[1]
TRENDS IN SURFACE TEMPERATURE

Yearly surface temperature from 1880–2023 compared to the 20th-century average (1901-2000). Blue bars indicate cooler-than-average years; red bars show warmerthan-average years. [2]
HIGH-TEMPERATURE-RELATED MORTALITY


Economic development was not sufficient to mitigate the increase in mortality associated with the heatwave during the same period.[3]
THE HIGHEST TEMPERATURE
51.8℃
In Saudi Arabia, more than 1000 people died because of extreme heat during the Hajj, a Muslim pilgrimage to Mecca where temperatures reached 51.8℃ at the Grand Mosque in Mecca on 17 June, 2024.
EXCEED STANDARD VALUE
+1.54℃
Jan-Sept 2024 global average temperature 1.54 (±0.13)℃ above preindustrial level. Warming above 1.5°C is more likely to lead to an increase in extreme heat waves, extreme precipitation, droughts, etc.
CONCTROL GLOBAL WARMING
1.5℃
It is stated in the Paris Agreement in order to avert the worst impacts of climate change and preserve a livable planet, global temperature increase needs to be limited to 1.5°C above pre-industrial levels.
OLD-AGE MORTALITY RATE
85%
The number of people exposed to extreme heat is growing exponentially due to climate change in all world regions. Heat-related mortality for people over 65 years of age increased by approximately 85% between 2000–2004 and 2017–2021[4]
The study area is the Greater Bay Area (GBA) of Guangdong, Hong Kong and Macao , a major economic region in China comprising nine cities in Guangdong Province - Guangzhou, Shenzhen, Zhuhai, Foshan, Dongguan, Zhongshan, Jiangmen, Huizhou and Zhaoqingas well as Hong Kong SAR and Macao SAR. This region covers the key cities of the Pearl River Delta in southern China, with a total area of about 56,000 square kilometers and a population of more than 86 million.
Located in the subtropics, the region has a humid climate with hot and rainy summers and relatively warm winters, and thus also faces the threat of high temperatures due to global warming.
DATA PREPARATION
POPULATION DATA
Population data cannot be compared directly because of the different population bases in the regions, so they are analyzed in the form of comparative percentages, i.e., the total number of people in the category under study in the region obtained from the survey is divided by the total population of the region to obtain the required percentage data.
LAND SURFACE TEMPERATURE (LST) POINT OF INTEREST (POI) & LAND USE DATA
The surface temperature was analyzed by checking the historical weather records for the summer of 2022 (JuneSeptember) to find the day with the highest temperature (July 24, 2022), and checking that the days before and after it were sunny and not windy, so the MODIS data[5] for that day was selected for the study and analysis.
The reason for connecting POI and land use data by spatial linking the corresponding points and areas, and assigning corresponding weights to the points is to take into account the different impacts of areas and points on the degree of aggregation, which is conducive to reflecting the spatial distribution of green infrastructures more accurately after the kernel density process.


Dimension
Population pressure factor
Vulnerable groups factor
population density
Proportion of population aged 14 and under
Proportion of population aged 65 and over
Proportion of female population
Proportion of population with lower secondary education and below
The more densely populated a city is, the more people will lose their lives or be at risk of losing their lives at the moment of a natural disaster
This indicator reflects the age structure of the city's population, with minors having a lower level of knowledge, weaker coping capacities and greater exposure to natural disasters
This indicator reflects the age structure of the city's population, with older people being less fit, less resistant and more affected by natural disasters
Indicators reflect the gender structure of the urban population, with women being significantly less able to cope with natural disasters than men due to their biological make-up and being more affected by natural disasters
This indicator reflects the structure of educational attainment of the urban population, which is less equipped with knowledge and skills, less aware of disaster response and more affected by natural disasters
Positive indicators
Data Preparation
Data collection
Data are downloaded from the Government Statistical Bulletin, Earth Engine App, and OSM websites.
Social Vulnerablilty Idex (SVI) map
The algorithm calculates the Social Vulnerability Index for each street in the study area, and the results are visually represented in GIS.
Data cleaning
Data within the study area were extracted and removed from obviously incorrect or null values, and units were harmonized.
Spatial Analysis
Land Surface Tempreture (LST) map
By reviewing the historical weather records for the summer of 2022, the day with the highest temperature was selected and the days before and after were sunny and not windy.
Correlation Study
SVI level classification and corresponding LST Correlation test analysis of the three
The SVIs were classified into five categories according to Jenks to find the maximum and minimum temperatures of the corresponding intervals and to explore the correlation that exists between the SVIs and the LSTs.
ALGORITHMS
The values of each raster were extracted using a fishing net and then linear regression was used in SPSS to study the correlation and significance that existed between the three.
Urban Planning
GI Concentration Distribution map
Spatial connectivity to link points and areas, followed by kernel density analysis to derive a spatial map of the degree of concentration of green infrastructure.
Effect of the degree of GI concentration on LST
The values of the corresponding rasters were first extracted using a fishing net, and later visualised by a scatter plot to investigate whether the degree of aggregation of green infrastructure has an effect on LST
Recommendation & Conclusion
Assuming that there are m cities to be assessed for their vulnerability levels and each city contains n impact factors, a matrix A' of social vulnerability indices to be assessed is first established, and the normalised dimensionless matrix A is finally obtained by eliminating the effects of the scales between the indicators through normalisation (aij).


Constructing an information entropy model, the higher the value of information entropy, the lower the contribution of the factor to the social vulnerability of the city.

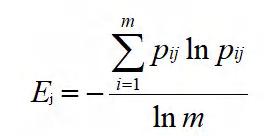
Calculate the weights (wij) of the evaluation indicators: the higher the value of the weight of an evaluation indicator, the greater the contribution of the indicator to the social vulnerability of the city. Then the SVI model (C ) is obtained based on the weights of the indicators and the normalised values of the indicators.


SPTIAL DISTRIBUTION OF SVI
The demographic vulnerability of GBA is characterised by significant spatial differences, with core and peripheral cities differing markedly in their vulnerability levels.
On the whole, the core areas of Shenzhen, Dongguan, the central area of Guangzhou and Zhuhai have lower population vulnerability. In contrast, the population vulnerability of peripheral cities is more significant.
Of particular concern is the fact that Hong Kong's demographic vulnerability is more pronounced than that of other peripheral cities, with its highly concentrated urban development, cramped living environment and significant ageing population increasing the vulnerability of its residents.

From


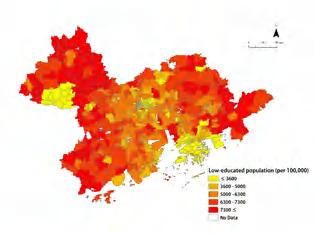
to right are (a)Population density, (b)Female Proportion, (c)Population aged 14 and under ratio, (d) Population aged 65 and older ratio, (e)Low-educated population
SPTIAL DISTRIBUTION OF LST
It can be observed from the figure that the land surface temperature shows significant spatial differences, where the core cities of the Greater Bay Area (Guangzhou, Dongguan and Zhongshan) show higher land surface temperatures, while the fringe cities have lower temperatures.
It is worth noting that although Hong Kong, as an international financial centre, has the most frequent economic activities, the high surface temperature areas in Hong Kong are mainly concentrated in areas with active population and dense construction, and the overall urban surface temperature is relatively calm due to the concentration of the buildable area, with most of the area being mountains or water bodies.

RELATONSHIP BETWEEN SVI AND LST
Most of the areas with high vulnerability levels are located on the fringes of the Greater Bay Area. However, the corresponding surface temperatures are usually low (e.g. Zhaoqing, Jiangmen), so the high levels of population vulnerability in the cities of these regions are mainly due to economic development factors rather than high temperatures.
In contrast, regions with lower vulnerability levels tend to be at the core of the Greater Bay Area and correspond to higher surface temperatures (e.g. Guangzhou, Shenzhen). Due to high economic activity and higher building density in built-up urban areas, the intensity of the urban heat island formed is also higher, and residents are exposed to greater risk of high temperatures.
Table 2. SVI level classification and corresponding LST
Representative colour of SVI Level of vulnerability
Corresponding temperature (℃) High temperature risk level representative city
Guangzhou, Shenzhen
Zhongshan, Foshan
Hongkong, Jiangmen
Hongkong, Huizhou
Zhaoqing
As can be seen from the figure, the concentration of green infrastructure (GI) in the core regions (e.g. HongKong, Shenzhen, Guangzhou and Foshan) is significantly higher than that in the peripheral cities of the Greater Bay Area, and these places are known to have higher surface temperatures. This high degree of concentration not only shows the urgent need for these cities to cope with high temperatures and the heat island effect, but also reflects the tendency for policies and resources to be focussed on such issues. The fringe areas, on the other hand, have relatively less need and support for GI construction due to lower temperature pressures.

Figure 14. Green Infratructure Concentration Distribution map
However, it is worth noting that second-tier cities such as Foshan and Dongguan have an even higher degree of GI aggregation than Guangzhou. This phenomenon may be closely related to its city policy development orientation. In contrast, Guangzhou, as a mega city, faces more spatial constraints in GI planning due to tight land resources and dense urban development.
RELATIONSHIP BETWEEN THE LEVEL OF GI CONCENTRATION AND LST
The concentration level of green infrastructure in the city has a more obvious distribution trend with surface temperature. Each of these points represents a raster cell, and larger values of its kernel density indicate a higher level of concentration and a denser spatial distribution of GI. Specifically, when the spatial distribution of green infrastructure is more sparsely distributed, the number of rasters corresponding to higher surface temperatures is significantly higher. This relationship reveals a correlation between the scarcity of green infrastructure and urban surface temperature, suggesting that green infrastructure allocation is important for mitigating the urban heat island effect.

Figure 15. Relationship between the level of GI concentration and LST
CORRELATION TEST ANALYSIS OF THE THREE
1) There is a negative correlation between the degree of aggregation of GI and SVI, indicating that SVI is usually lower in areas with a higher degree of aggregation of GI. Typically, economically developed areas have more resources to invest in GI such as parks, green spaces, street trees and rain gardens. Residents in these areas tend to have higher socioeconomic capabilities and better health and safety, so these areas are less likely to face problems related to poverty and health risks, and have less SVI than other areas with low concentrations of GI.
2) SVI shows a negative correlation with LST, indicating that LST tends to be lower in areas with higher SVI, while LST tends to be high in areas with lower SVI. Areas with lower SVI tend to be economically developed and highly urbanised. These areas have more buildings, roads and man-made infrastructure that absorb and store more solar heat, resulting in higher LST and a significant urban heat island effect.
3) The degree of aggregation of GI and LST show a positive correlation, indicating that when GIs are more densely distributed in a certain area, the LST of the area will usually be higher.Although GI is generally recognised as being able to reduce LST, because it is located in areas of higher temperatures (e.g. Hong Kong, Shenzhen, Guangzhou, Foshan), the effect of heat build-up in these places far exceeds the cooling effect of GI, resulting in a higher overall LST.
Table 3. Correlation test analysis of the three
Based on the above research analyses, recommendations are given from three perspectives: 1) the policy orientation of urban development, 2) the layout of green infrastructure and 3) the balance of development among cities in the Greater Bay Area:
1) As global temperatures rise, it is necessary to include ecological civilisation in the orientation of urban development, and it is recommended that policies strengthen the focus on the universal construction of GI.
2) Based on the results of the network analysis of the existing GI based on urban big data, the layout of GI can be optimised in a targeted manner. In particular, urban green spaces, parks and community gardens can be increased in areas where vulnerable groups live to mitigate the health risks associated with high temperatures. It is also recommended that cities increase the construction of urban green belts and the planting of street trees in conjunction with existing roads, so as to effectively reduce LST through urban micro-renewal and provide residents with a natural cooling environment.
3) Due to the differences in economic development and natural geographic factors of the cities in the Greater Bay Area, the core cities should pay more attention to controlling the negative impacts of the urban heat island effect caused by economic activities, and strengthen the layout of GI; while the peripheral cities can balance the negative impacts of economic activities through the preservation of the original natural ecological environment, while focusing on economic development.
CONCLUSION
By analyzing the spatial relationship between Land Surface Temperature (LST) and the Social Vulnerability Index (SVI) of vulnerable groups, as well as the correlation between the degree of Green Infrastructure (GI) agglomeration and LST, this study highlights significant spatial differences between core and peripheral cities. Core cities, characterized by low SVI and high GI agglomeration, still experience high LST and are exposed to significant heat risks. In contrast, peripheral cities, with higher SVI and lower GI agglomeration, face relatively lower heat risks. These findings underscore the uneven distribution of climate risks across urban areas, offering valuable empirical evidence for urban planning and policymaking. They emphasize the importance of prioritizing social equity and optimizing the spatial layout of GI to mitigate climate risks and enhance the resilience of vulnerable populations.
One of the key innovations of this study is the integration of environmental and social variables in the analysis. This approach broadens the perspective of climate adaptation strategies and provides new insights into the relationship between GI and the SVI of disadvantaged groups in the context of urban heat. By linking these two dimensions, the study advances the understanding of how social and environmental factors interact to shape urban heat vulnerability.
However, the limited spatial and temporal coverage of the data and the lack of precision in some datasets pose challenges to the generalizability of the findings. Future research should conduct more extensive and long-term observations to improve data accuracy and reliability. Additionally, vulnerability evaluation indicators should be expanded to include economic, demographic, and other relevant factors, enabling a more comprehensive analysis of the interplay between GI and SVI. This holistic approach would yield richer insights into how different dimensions of vulnerability intersect and influence urban climate risks. Additionally, There is also a need to explore and analyse policies on specific green infrastructure measures to gain a deeper understanding of their role and practical effectiveness in reducing the urban heat island effect.
REFERENCES
[1] https://climate.copernicus.eu/global-climate-highlights-2023
[2] https://www.climate.gov/news-features/understanding-climate/climate-change-global-temperature
[3] Yang Xie, Ziqiao Zhou, et al. (2024): Social-economic transitions and vulnerability to extreme temperature events from 1960 to 2020 in Chinese cities. In iScience 27(3), DOI:https://doi.org/10.1016/j.isci.2024.109066.
[4] Lancet Countdown: Heat-related Mortality. 2023. https://lancetcountdown.org/explore-our-data/
[5] https://yilongzhang.users.earthengine.app/view/modis-lst-raster-download-zh
[6] Jun Wang; Jingye Chen; Qinghua Gong; Shaoxiong Yuan, Jun Chen, Bowen Liu, Hao Li; Jun Wang; Jingye Chen et al. (2023): Urban Social Vulnerability Assessment and Optimization Strategies from the Perspective of Resilience: A Case Study of the Pearl River Delta Urban Agglomeration. In Tropical Geography 43 (3), pp. 474–483. DOI: 10.13284/j.cnki. rddl.003649.