
www.idosr.org
©IDOSR PUBLICATIONS
Josiah and Umar
International Digital Organization for Scientific Research IDOSRJOURNALOFCOMPUTERANDAPPLIEDSCIENCES 7(1):45 60,2022. ISSN: 2579 0803
Simulation and
Conceptualization of Automatic Power Factor Compensation for Industries in Uganda
Josiah Ddembe and Kalyankolo UmarDepartment of Electrical, Computer and Telecommunications Engineering, Kampala International University, Uganda.
ABSTRACT
This project includes a research on automatic power factor compensation by industrial consumers of electricity in Uganda as well as a laboratory simulation of automatic power factor compensation. The research made was a micro research able to reach a small number ofindustrial consumers ofelectricity.The results were achieved by aid questionnaires which were answered by different persons responsible in the industries which were reached out to. Another questionnaire was also filled by the responsible personnel at the service center of the electricity distribution company. All the research was carried out in Uganda’s eastern region in the district of Iganga. A laboratory simulation using the results of the research was carried out in the Kampala International University Western Campus in the Electrical MachinesLaboratory using thePowerFactorControlRelayTrainer machine.Usingthe results acquired from the research, it affirmed that the industrial machinery operating power factor couldbecorrectedbythemachine whichwasused.Fromtheanalysisofthe resultsacquired, it was found that there was significant amounts of money spent on a daily basis on unused electricity due to the poor power factor and that this can be minimized by employing Automatic Power Factor Compensation methods.
Keywords: Simulation, Conceptualization, Automatic Power Factor, Compensation and industries
INTRODUCTION
Electricity is increasingly becoming the most common form of energy in Uganda. This is attributed to the fast growing industrial sector in the country. The governmentisalsoas wellputtingineffort to meet the growing demand by investing inpowergenerationandencouragingother private investors to do so [1]
With more than two thirds of energy being generated being consumed by industrial consumers, [2] critical analysis should be takenonhowtheindustrialconsumers use the electricity. Their electrical equipment are mostly comprised of electric motors, boilersandarcfurnaces.Howeverofthese, induction motors are most commonly used. These operate at very poor power factor and a result unnecessarily consume a lot of power.
Power factor refers to the cosine angle between voltage and current in an Ac circuit. It is a measure of how effectively currentisbeingconvertedintousefulwork output and more particularly is a good indicator of the effect of load current and on the efficiency of the supply system [3] A load with a power factor of 1.0 results in the most efficient loading of the supply and a load with a power factor of 0.5 will result in much higher losses in the supply system. A poor power factor can be the result of either a significant phase differencebetweenthevoltageandcurrent at the load terminals, or it can be due to a high harmonic content or distorted/discontinuous current waveform.Poorloadcurrentphaseangleis generally the result of an inductive load such as an induction motor, power transformer, lighting ballasts, welder or induction furnace.
www.idosr.org
A distorted current waveform can be the result of a rectifier, variable speed drive, switched mode power supply, discharge lighting or other electronic load. A poor power factor due to an inductive load can be improved by the addition of power factor correction, but, a poor power factor due to a distorted current waveform requires a change in equipment design or expensive harmonic filters to gain an appreciable improvement [4]
Normally the power factor of the whole load on a large generating station is in the regionof 0.8to0.9.However,sometimesit
Josiah and Umar
is lower and in such cases, it is generally desirable to take special steps to improve the power factor. This can be done by use of phase advancers, synchronous condensers or static capacitors [5,6,7,8]. The economics in the use of the three methods makes static capacitors the best option but however, static capacitors have a definite capacitance neither increasing nor reducing. Given the fact that power factor keeps fluctuating as the load on the supply changes, during low load hours capacitors would not efficiently correct power factor. To solve this.
METHODOLOGY
Research Conducted from UMEME Iganga
A research on power factor compensation in Uganda was carried out at UMEME.
Input
Three Phase DOL Starter Panel. EMT1

Figure 1: EMT1 Panel
It is an input panel which has a D.O.L starter and MCB
The EMT1 panel is a three phase 415V, 50Hz ac input panel. The input is given to EMT 1 through industrial plug socket and mains chord connected from rear of this panel using (rail mounted connectors). Colored lamp indicators on this panel indicatethepresenceofallthephases.The lnput passes through a Miniature Circuit
Breaker(MCB)ofsuitablerating(lor4Amp), which serves as short circuit protection. It will trip immediately if short circuit takes place, and also within 40 45 sec on single phasing. This rating is selected critically so as to protect the equipment in most of the eventualities. As such it may trip due to heavy magnetizing inrush current. The three phase input R,Y,B is further passed through Contactor KI and a bimetal
www.idosr.org
overload relay O/L. This OCR exhibits conventional Inverse over current Characteristics and will trip whenever overload current passes through it for sufficient time. After passing through power contacts of this relay, the R,Y,B supply is made available on shrouded connectors for further use.As shown in the diagram, single phase control supply is taken through Control fuse, Start Push Button, Hold on contact K1(N0), Stop Push Button, Overload Relay contact O/L(NC) and contactor coil Kl to form a typical Direct On Line Starter circuit which connects input 3 phase supply to output connectors under control of Push Buttons.
Josiah and Umar
This supply trips if Stop push button is pressed or over load condition exists. ON indicator is a LED connected across contactor coil. The LED receives DC supply through a diode and current limiting resistor mounted on PCB. Thus whenever Input MCB is ON then three 15W coloured lamps will glow and if Start P.B. R, Y,B,N (1,2,3,4) terminals provided on right side of the panel. If all three lamps don't glow then do not press start PB. It's a case of single phasing. Locate the loose connection beyond the 1T and correct 1tpressed, the input supply will be available at:
Three Phase Multi Functional Power Cum Energy Meter Panel EMT34

Figure 2: EMT34 Panel
EMT34isathreephaseenergymeterwhich is used to measure a number of electrical parameters. It is used to measure line voltage, phase to phase voltage, line current, apparent power, reactive power, power factor, power factor angle, THD and power in watts. Its input is through R, Y, B and neutral connection from the output of EMT1 panel and is input through the shrouded connectors. Its output is as well
R, Y, B and a neutral connector also through the shrouded connectors. An optional earth terminal is provided through the shrouded terminal of green colour. Both the output and input of the EMT34 should be rated three phase AC, 415V 50Hz. For the functioning of the meter, it is required to be powered by an external power supply rated 220/230VAC, 50Hz. The meter is provided with four
www.idosr.org
buttons which are used to toggle through the various meter readings of the different parameter the meter can be used to read.
Josiah and Umar
Figure 3: EMT4A Panel

This is a switching panel with a three phase switching device which acts in such a way thatitswitches on and off the power supply to the load and also can reverse the phases. It has three positions that is the forward position, the off position and the reverse position. In the forward position, the switch allows the electric current to flow through it in such a way that the R phase, Yphaseand B phasearethesameat both the input and the output.
In off position, there is no current that flows through the switch.
In the reverse position, the R phase and Y phase at the output are interchanged whereas the B phase remains the same at input and output.
Its input is through the R, Y, B shrouded connectors and also its output is through the R, Y, B shrouded terminals.
Contactor Panel EMT27
Figure 4 : EMT27 Panel

Thecontactorpanelisathreephasedevice panel with a contactor coil, a contactor switch and two control relays which are connected in NO and other two control relays which are connected in NC operating mode.
It works as a three phase contactor which closes when thecontactorcoilisenergized and opens when the contactor coil is de energized.
The contactor panel has two NO and two NC shrouded connector terminals through which control wiring connections can be made to the contactor coil for which the shrouded connector terminals are too provided for.
For the contactor coil, both the live signal and neutral terminals are provided for through the shrouded connectors. The contactor coil is rated 230VAC 50 Hz. The power wiring input is provided for through the R, Y, B shrouded connector terminals labelled 1,2 and 3 respectively for the R, Y, B phases. The input is short circuitedofextendedwithR, Y,Bshrouded connectors to act as inputs for another EMT27 panel or output for EMT52 panel.
The poweroutputis also provided for with R, Y, B shrouded connectors after the power passing through the 10A contactor. Its output is what is used for controlling the capacitor banks.
The power wiring is rated 415VAC, 50 Hz.
Lamp Indicator/ Toggle Switch Panel EMT7A
Figure 5: EMT7A Panel
The lamp indicator panel consists of three lamps with their switches as shown in the circuit. They are connected to the Reactive Power Control Relay Panel outputs. The lamps switches are switched on during the experimental simulation and the bulbs turn on when the output connected to that
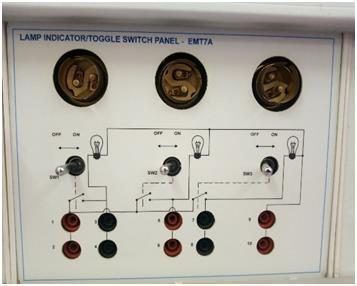
lamp on the Reactive Power control Relay Panel is turned on.
The lamp holders are fitted with 15W lamps. One lamp is connected to a given output of the EMT52 panel and is controlled simultaneously with the control wiring of the EMT27 contactor panel.


www.idosr.org
Auxiliary Supply
Table 1: Technical Data
Josiah and Umar
��Supply voltage: 346 415VAC. ��Operating limits: 15%+10% ��Consumption: 10VA max. ��Frequency: 50Hz or 60Hz Current Input ��Rated Current: 5A. ��Operating limits: 0.05A 6.5A ��Rated Frequency: 50Hz or 60Hz Relay output ��Numbers of outputs. ��Contact arrangement: NO contact type ��Rated capacity 5A, 250VAC (Cosø = 1) ��Max current for the common terminals:6/8/12/14 (PFR60/ PFR80/ PFR120/ PFR140):12Acontinuous Control Range ��Power factor setting: 0.8 inductive 0.8 capacitive ��C/K setting: 0.003 1.20/Auto. ��Switching sensitivity: 5 600 s/step ��Reconnection time: 5 240sFor same step ��THD threshold: 0.20 3.00(20% 300%) / OFF ��Switching Program: Automatic/Automatic Rotate /Manual/Four quadrant ��Rated step coefficient: 0/1/2/3/4/6/8/12/16
VAR Compensation Panel EMT42D

Figure 7: EMT 42D Panel
The EMT42D is a reactive power compensation panel. It consists of star connectedcapacitorbanks.Theseareeight sets of capacitors with each set having three star connected capacitors for compensating reactive power for the three phases R, Y and B. Thefirstsethas1uFcapacitors,thesecond 2uF capacitors. The third, fourth, fifth,
sixth, seventh and eighth sets of the capacitors have 4uF, 5uF, 6uF, 8uF, 10uF and 15uF capacitors respectively. The connection to these capacitors are all provided for through the shrouded connector terminals.
A neutral to these capacitors is also provided for through a black shrouded connector terminal.
www.idosr.org
An earth terminal with a green coloured shrouded connector provided on this panel is used for discharging the
Josiah and Umar
capacitors after carrying out any simulation experimentation.
AC Load Inductor (L) Panel EMT42B
EMT42B is an Ac load inductor panel. This panel together with the resistive load panel EMT42A is used to create the inductive load for purposes of simulation. One inductor from the EMT42B is connected in series with one resistor from the EMT42A plan l to create the inductive load.


The EMT42B panel consists of six inbuilt sets of inductors with each set having three independent inductors for the three phase load.
A 3P7W switch is provided for toggling through the different inductance value inductors as a means of adjusting the inductive load parameters during the simulation experimentation.
The first set of inductors has inductors of inductance 0.3H, the second, third, fourth, fifth and sixth have inductors of inductance 0.6H, 0.75H, 0.9H, 1.2H and 1.5H respectively.
The connection to the inductors is provided for through the shrouded connector terminals.
www.idosr.org
Resistive Load (R) Panel EMT42A
The Resistive Load Panel consists of resistors which served as the load resistance during the simulation. In the process of simulation, they were connected in series with the inductors in the Inductive load panel to obtain the load with the desired resistanceand inductance parameters. These can produce a load with a desired power factor. The EMT42A panel consists ofsix sets ofinbuiltresistors with each set having three independent resistors. A 3P7W switch is provided for toggling through the different resistance value resistors as a means of adjusting the resistive load parameters during the simulation experimentation.

Thefirstsetofresistorshasthreeresistors of resistance value 225ohms, the second, third, fourth, fifth and sixth have resistors of resistance 200, 175, 150, 125, 112 and 100ohms respectively.
Theconnectionto the resistorsis provided for through the shrouded connector terminals.
Connection of the PCFR Trainer
The power supply is connected to the EMT1 Panel. The EMT1 panel consists of
circuitbreakersandadirect on linestarter with buttons provided for starting and stopping the machine.
The output of the EMT1 panel is connected to the EMT 34 Panel. Which is a panel with a three phase meter that can measure various A.c electrical parameters such as line voltage, phase to phase voltage, line current, reactive power, apparent power, power factor among other parameters. After going through the measurement panel, it is then connected to the EMT4A Panel which is a FWD OFF REV switch panel. This panel can switch ON and OFF the power supply as well as reversing the phases.
The power is then supplied to the EMT42A and EMT42B load panels through the EMT 52 PCFR Relay panel.
From the EMT52 PCFR Relay panel with s connected the four contactor panels (EMT27A,EMT27BEMT27CandEMT27D)as well as the lamp indicator panels (EMT7A/1 and EMT7A/2)
The four contactor panels are in turn connected to the capacitor bank panel (EMT42D)
www.idosr.org
Operation of the machine
The machine automatically regulates load power factor with reference to the set power factor by use of capacitor banks. Reactive power compensation is achieved by measuring continuously the reactive power of the system and then compensated by switching of capacitor banks. The sensitivity setting of the PCFR relay optimizes the switching speed with built in intelligent automatic switching program. The power factor regulator further improves the switching efficiency by reducing the number of switching operations required to achieve the desired power factor. Usage of capacitor banks is evenly distributed by the intelligent switching algorithm. This ensures uniform aging of capacitors and contactors used. Thefourquadrantoperationfeatureallows the power factor regulator to operate correctly in the case of active power feedback to the mains where regenerative power sources are used. Harmonic current in the system can be harmful to the capacitor bank. This power factor regulator is capable of measuring the THD in the system and produces an alarm if the THD level is higher than the present value. Other alarms include under/overcompensate alarm, under/over current alarm and under/over voltage alarm. The PCFR relay panel controls the contactor panels by sending a signal to switch them ON or OFF. The contactor panel in turn switches ON or OFF the capacitor banks they are connected to. The PCFR relay panel also controls the lamp indicator panel with the same signal as one used to control the contactor panel. One contactor panel together with one lamp indicator from the lamp indicator panelareconnectedtothesamePCFRrelay panel output. There are four contactor panels as well as four usable lamp indicators and two extra lamp indicators
Results obtained from the laboratory simulation of the PCFR machine
Josiah and Umarall connected to the two lamp indicator panels.
When connections are made, ensure that the load selector switch on EMT42A panel and EMT42B panels are set to match the Load parameters of the load to be simulated. The toggle switches on EMT7A/1 and EMT7A/2 are kept to the LHS position (keptON) The fans should always be ON in the load panel EMT42A, EMT42D and EMT42D.
TheEMT4ApanelshouldbeatOFFposition when the simulation connections are made to the machine. The MCB should be OFF andswitchedON when theconnectionsare completely done. After completing the connections, The MCB on the theEMT1 was turnedON.AlltheR, Y,Bindicatorsglowed indicating that all the three phases were available.Thestartpushbuttonaspressed to make the D.O.L starter ON. Panel EMT34 (three phase multifunctional meter indicated the load V, I, watts, power factor parameters for each phase.
Relay setting
The relay provided with the machine as a range from 0.8 inductive to 0.8 (0.9 L) capacitive (0.9C). This was done by pressing MODE/SCROLL button on the PCFR 80 to set cosø, then pressing the PROGRAM key, the ‘set cosø' LED blinked thenthedesiredpowerfactorwasusingup and down arrow keys to set it to 0.9. Again the programpushbutton was pressed. The machine was switched off by putting the selector switch of the EMT4A panel at OFF position and again switched on by moving the same switch to the FWD position. After 15 minutes, the capacitor started getting selected one by one to bring the power factor to the present value. The contactor’s ON position was indicated by the glowing 15W lamps on the EMT7A/1, EMT7A/2. The process continued until the desired power factor was achieved.
RESULTS
TheEMT52panelwhich is the ‘brain’ of the PCFR machine had current ratings of 5A with operating limits of 0.05 to 6.5 from the information provided by the manufacturer.
The kinds of load for medium industrial consumers is up to 47 kW on average as seen from table 2. These kinds of loads could not be simulated on the PCFR machine because: kW = kVA cosø
www.idosr.org
If the load was operating at a unity power factor, then and a voltage of 415 volts, then
kW = kVA
But power (W) = V.*I 47000= 415*I I. = 113.25A
The value of currentof 113.25A is too high to be simulated on the machine. So real values could not be got from the machine. Results and analysis of results from the Research carried out at UMEME service Centre in Iganga
Itwasfoundthattheelectricitychargesare charged according to the rates set by the electricity regulatory body in Uganda (Electricity Regulatory Authority (ERA))
The industrial consumers are charged according to the rates for all industrial consumers under CODE 20, CODE 30 and CODE 40.
Josiah and Umar
UMEME as the distributor of electricity in the district does sensitize the industrial consumers about the benefits of operating their machinery at the recommended power factor because it is to the benefit of the consumers. The industrial consumers take trouble to do the reactive power compensation but many of themnot to the recommended value of power factor 0.9 However the distributor does not enforce power factor compensation but rather advises the industrial consumers to improve theirpowerfactor. It is to the loss of the consumer and not the distributor because the distributor compensates for the reactive power of the distribution lines.
Typical information was found out about the numbers of the industrial consumers and their average power consumption as summarized in the table below.
Table 1: Results acquired from UMEME service center in Iganga Type of consumer
Number of consumers Average power consumption (kW)
Medium Industrial consumers 350 47
Large industrial consumers 35 80 Extra Large industrial consumers 3 8840
Results and analysis of findings from the individual Industrial Consumers in Iganga district.
From the research which was carried out from the industrial consumers, the research was able to find three medium industrial consumers in Iganga District.
It was found from the research the firstconsumerhadamaximumload of up to 28kW from the combination of the machinery at thepremises.Theconsumerdidnot use any automatic power factor compensation and electric motors in the machines at the premises wererangingfrom0.8to0.85asthe value for the power factor. The machinery working for about six hours a day all through the month (Appendix B)
The second consumer had less machinery on his premises and its maximum load was up to 12kW. There was no automatic power factor compensation equipment availableatthepremisesandall the machine motors had a power factor value of 0.8 The machinery was all always used for about four hours a day throughout the month (Appendix C)
The third consumer had machinery whose maximum load was up to 20kW. The electric motors in the machinery were rated 0.9 as value for power factor from the nameplate but was not using any bulk power factor compensation equipment.
The results are summarized in the table below:
www.idosr.org
Josiah and Umar
Table 2: Results from the field findings of industrial consumers
Consumer Total power rating of machinery Operating power factor Average amount of time used by machinery per day
1 28kW 0.82 6hours 2 12kW 0.8 4 hours 3 20kW 0.9 6 hours
Analysis of economic benefit of power factor compensation for medium industrial consumers
Table 3: Analysis of economic benefit of power factor compensation.
Consumer 1 Consumer 2 Consumer 3
Power rating 28kW 12kW 20kW
Power factor 0.82 0.8 0.9
Power consumed =power rating/power factor. (kW) 34.146 15 22.222
Time of usage of machinery daily 6 hours 4 hours 6 hours
Daily total energy usage=(power consumed)*(time of usage of machinery) (kWh)
204.878 60 133.33
Daily expense of electricity = Total energy used * Cost of 1kWh (575.2) Shs. 117845 Shs. 34512 Shs. 76693
Table 4B: Analysis of economic benefit of power factor compensation.
Consumer 1 Consumer 2 Consumer 3
Power rating 28kW 12kW 20kW
Power factor 0.9 0.9 0.9
Power consumed = power rating/power factor. (kW) 31.11 13.33 22.22
Time of usage of machinery daily 6 hours 4 hours 6 hours
Daily total energy usage = (power consumed)*(time of usage of machinery) (kWh)
186.67 53.33 133.33
Daily expense of electricity = Total energy used * Cost of 1kWh (575.2) Shs. 107370 Shs. 30677 Shs. 76693
If the consumer had operated at the recommended power factor of 0.9, the amount of money spent daily would reduce as a result of the reduction in the
energy used and the above table would otherwise appear as below in table 7 A comparison table for change in power factor after automatically compensating for reactive power using PFCR Machine
www.idosr.org
Josiah and Umar
Table 4: A comparison table for change in energy used after automatic power factor compensation
Consumer 1 Consumer 2 Consumer 3
Energy used at the currently used power factor per day 204.878 60 133.33
Energyusedattherecommendedpower factor of 0.9 per day 186.67 53.33 133.33 Daily energy saving when operating at recommended power factor. 18.208 6.67 0 Daily cost saving when operating at recommended power factor. 10475 3835 0
Table 5: Comparison between energy consumption at lower power factor as used by some of the industries and the recommended power factor. Power factor Consumer 1 energy usage Consumer 2 energy usage Consumer 3 energy usage
Currently used 204.878 60 133.33 Recommended power factor 0.9 186.67 53.33 133.33 A graph showing energy saved by the consumers when they use the recommended power factor
250
200
150
100
50
A graph showing energy saved by the consumers when they use the recommended power factor consumer 1 comsumer 2 consumer 3
204.878 186.67 60 53.33
133.33 133.33 0
Currently used power factor Recommended power factor(0.9)
Figure 11: A graph showing energy saved by consumers before and after power factor correction.
From the graph above, it can be seen that consumer 1 who operates his machinery at power factor of 0.82 consumed much energy than he otherwise would if he had operated the machinery at the recommended power factor of 0.9 which can be achieved by bulk automatic power factor correction. This can be seen from the steeper gradient of the consumption
curve of electrical energy against power factor.
Consumer 2 would also spend much more unnecessarily than he would have spent due to the poor factor. However is can be noted that despite the lower power factor of 0.8 as compared to the 0.82 used by consumer1,hedoesnotincurmuchlosses as consumer one did because consumer 1 was consuming much more energy hence
www.idosr.org
the higher losses Consumer 3, however, despite the fact that he was not using
Josiah and Umar
automatic power factor correction, the power factor of his machinery was 0.9.
DISCUSSION
UMEME as the distributor of electricity in the district does sensitize the industrial consumers about the benefits of operating their machinery at the recommended power factor because it is to the benefit of the consumers. The industrial consumers take trouble to do the reactive power compensation but many of themnot to the recommended value of power factor 0.9. However the distributor does not enforce power factor compensation but rather advises the industrial consumers to improve theirpowerfactor. It is to the loss of the consumer and not the distributor because the distributor compensates for the reactive power of the distribution lines. Typical information was found out about the numbers of the industrial consumers and their average power consumption as summarized in the table below. From the graph above, it can be seen that consumer 1 who operates his
machinery at power factor of 0.82 consumed much energy than he otherwise would if he had operated the machinery at the recommended power factor of 0.9 which can be achieved by bulk automatic power factor correction. This can be seen from the steeper gradient of the consumption curve of electrical energy against power factor. Consumer 2 would also spend much more unnecessarily than he would have spent due to the poor factor. However is can be noted that despite the lower power factor of 0.8 as compared to the 0.82 used by consumer 1, he does not incur much losses as consumeronedidbecauseconsumer1was consuming much more energy hence the higher losses Consumer 3, however, despite the fact that he was not using automatic power factor correction, the power factor of his machinery was 0.9.
CONCLUSION
The project was successfully carried out and it was able to meet its intended objectives in the following ways. It was found that some industrial consumers were still operating their machinery at a lower power factor than the recommended one of 0.9 since out of the three people who participated, only one was operating their machinery at the recommended
power factor. From the simulation of the PCFR machine, it was found that the machine would effectively compensate for the reactivepowerifits operatingrage was up to about 150A. It was also found that theUgandanindustrialconsumers werehit by the financial losses which arise as a resultofoperatingmachineryatlowpower factor.
REFERENCES
1. Kaizon, K. and Judoka, D. (1996). AutomationPrinciples.
2. Energypedia. (2020, April 03). UGANDA ENERGY SITUATION. Retrieved 03 14, 2020, from ENERGYPEDIA: energypedia.info/wiki/Uganda_Ene rgy_Situation
3. Kulkarni Kaumudi, Kumbhar Pooja, Patil Priyanka, . (2016 ). Automatic Power Factor Correction Using PIC MicroController. international Engineering Research Journal IERJ, 13 16.
4. Rohit, M. and Mehta, V. K. (2005). Priciples of Power Systems: includingGeneration,Transmission,
Distribution, Switchgear and Protection. S. Chand
5. Masisani William Mufana and Adabara Ibrahim(2022).Monitoring with Communication Technologies of the Smart Grid. IDOSRJournalof AppliedSciences 7(1) 102 112.
6. Nabiryo Patience and Itodo Anthony Ejeh (2022). Design and Implementation of Base Station Temperature Monitoring System Using Raspberry Pi. IDOSR Journal of Science and Technology 7(1):53 66.
7. Masisani William Mufana and Adabara Ibrahim (2022). Implementation of Smart Grid Decision Support Systems IDOSR
www.idosr.org
Journal of Scientific Research 7(1) 50 57, 2022.
8. Natumanya Akimu (2022). Design and Construction of an Automatic Load Monitoring System on a Transformer in Power Distribution Networks.IDOSR Journal of ScientificResearch 7(1)58 76,2022
Josiah and Umar