2022


58
Page 150
Page 151 Auditor’s Report
Page 154 Glossary
158
* Adjustment for one-off or rare expenses and income.
** In addition to adjusted EBITDA effects, adjusted for effects of impairment tests and other one-off or rare financial expenses and income.
*** Capex ratio = (intangible assets + property, plant and equipment) / revenue x 100
**** Employees at WSTW Group level (consolidated and non-consolidated companies) incl. apprentices.
m 7,053 EUR
Investments in climatefriendly projects in the period leading up to 2027
16,028
(+117) employees
43.9%
(+6.4 percentage points) Equity ratio strengthened further
1,107 m EUR
(+35%) Investments in property, plant and equipment and intangible assets
The past year has demonstrated just how important financial stability and forward-looking management are. The extreme price fluctuations on the international energy markets pushed the entire European energy supply industry to its limits within a very short time – including here in Austria. This made it clear that there is a reason why we, as a company responsible for supplying energy and infrastructure to more than two million people, are closely connected to the City of Vienna.
In this difficult environment, our sustainably oriented business policy has proven itself once again. We can look back on a successful business year in which earnings improved substantially both in the Group and in the business divisions. Substantial here means even without the extreme price effects that drove revenue to a historic record level.
The Group’s revenue rose by 70% to EUR 7.3bn in the last year. This unusually high increase is due to the development in the Energy business division, where the increase is due to an interplay of four factors: sharp increases in energy prices, high cost of materials for gas, price hedging transactions for the high-efficiency combined heat and power (CHP) plant segment, and market price increases in the heating and cooling sales segment. The cost of materials and cost of purchased services in the Group doubled to more than EUR 5.1bn. The operating result (EBIT) rose by 73% to EUR 489m, which is once again a very satisfactory figure. The improvement is primarily down to energy-related income in the production sector.
In an environment that has become more uncertain, we nevertheless intensified our investment course. In 2022, we invested almost EUR 1.3bn in strengthening our sustainable performance. This is 28% above the record value from the previous year. As in the previous year, 81% of the funds used were invested in property, plant and equipment and 14% in financial assets. Climate-friendly investments increased by more than one-third and almost reached the billion-euro mark (EUR 983m). We were able to satisfy the
majority of the required investments with the operating cash flow, which is a great advantage for us in the current rising interest rate environment. We continued to receive considerable government investment grants for the Transport division.
In 2023, our Group will continue to operate in an overall unsettled environment. The war in Ukraine rages on and will continue to profoundly affect the usual supply chains. The upheavals across the entire European energy market hit our Energy business division with full force in the summer of 2022. Nobody would have thought that the purchase price for energy could rise by more than 1,000% within a short period of time. We responded swiftly and decisively in close collaboration with the City of Vienna and in the interest of our customers.
In the energy sector, the European regulator is currently busy adapting the framework conditions to the new circumstances, with the aim of making the road to the energy revolution more assessable and energy more affordable for customers once again. We also want these aims to be achieved. The extent to which this will succeed in the short term, however, remains to be seen.
We continue to make good progress with our operational projects: construction work on our major U2xU5 project is proceeding according to plan and we are also developing our mobility networks and our range of services in many other areas. Our customers are acknowledging and making use of our efforts through an accelerated return to public transport – in 2022, passenger numbers increased by 25%.
In the area of energy, we continue to work at full speed on the expansion of renewable resources. Sun, wind, green hydrogen, regenerative heat and even cooling – we are using all technological pathways available to us to phase out fossil-fuel resources as quickly and as expansively as possible. For instance, we intend to be supplying 20,000 households in the Aspern district with green geothermal heating by 2026. And by 2030, this figure could be as high
as 125,000 across Vienna. These and numerous other projects will enable us to gradually reduce our dependence on gas, especially in the residential sector.
We receive the authority to do this from our owner, the City of Vienna, and as a result from almost 2 million Viennese citizens. We would like to thank you for the trust you place in us, and we look forward to having you by our side once again in the year ahead. We would also like to thank our business partners for the excellent cooperation in the past year.
We look forward to our continued collaboration.

Vienna, April 2023
Two Chief Executive Officers, one wish: Energy has to become more affordable for customers again.
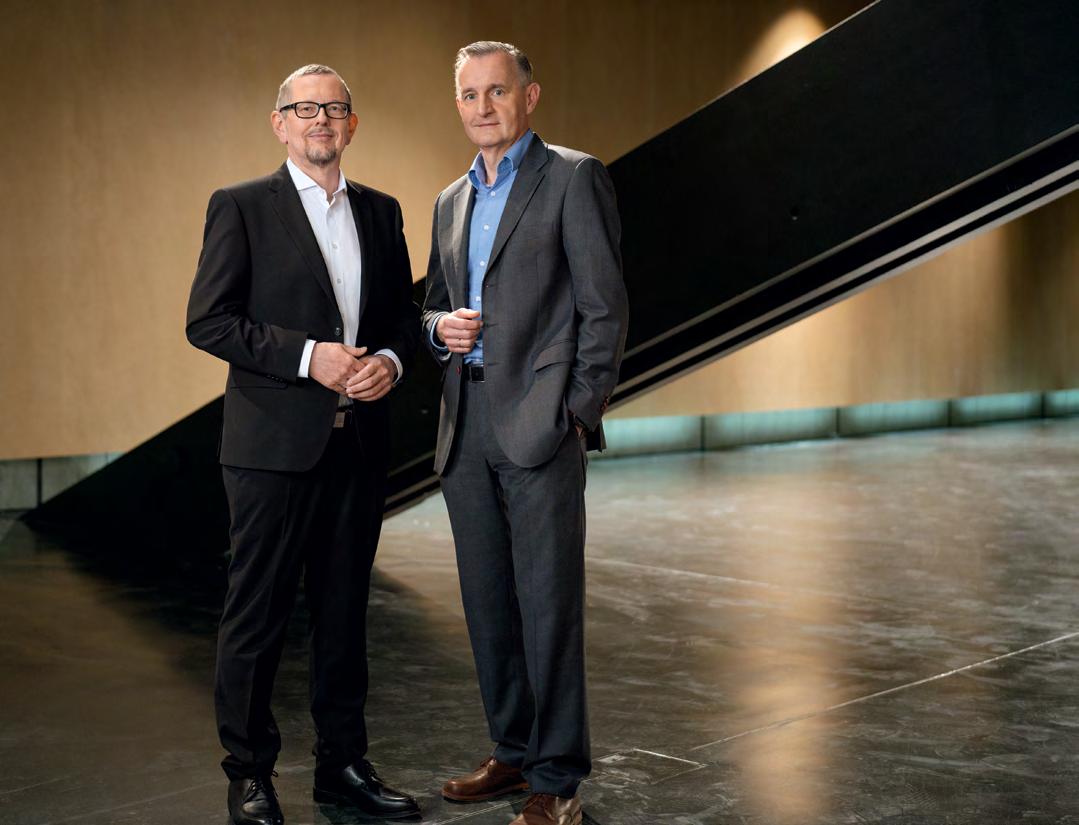 Martin Krajcsir Chief Executive Officer
Peter Weinelt Deputy Chief Executive Officer
Martin Krajcsir Chief Executive Officer
Peter Weinelt Deputy Chief Executive Officer
1
Page 5
Page 24
2 Report on economic position
Page 44
3 Opportunities and risks
Page 50
4 Outlook
All data and bases of calculation in this operating review are in accordance with international accounting standards (the International Financial Reporting Standards, IFRS).
Monetary values are presented in millions of euros (EUR m). Disclosures in millions of euros may be subject to rounding differences.
Principles of the Wiener Stadtwerke GroupThe Wiener Stadtwerke Group is a modern infrastructure service provider and plays the largest role in terms of climate protection in Vienna and the surrounding area. It is one of Austria’s biggest conglomerates and employers, of major significance for the Austrian economy. Its business operations cover the divisions Energy, Energy Grids, Transport, Funeral Services and Cemeteries, and Car Parks. The Energy and Energy Grids divisions are made up of Generation, Distribution and Grid Operation departments which ensure reliable electricity, gas and district heating and cooling supplies. Wiener Stadtwerke services also include public transport (Wiener Linien and Wiener Lokalbahnen), funeral and cemetery management, and car park services (Wipark). These reliable services help to maintain the high quality of life offered in Vienna and this has been confirmed in various studies.
In most cases, Wiener Stadtwerke Group companies must compete in markets that are simultaneously liberalised and regulated. For example, the sales markets of Wien Energie GmbH and its subsidiary Wien Energie Vertrieb GmbH & Co KG are fully exposed to competition, but Wiener Netze’s electricity and gas network tariffs are set by the national regulator, E-Control Austria (ECA).
As Austria’s largest regional energy supplier, Wien Energie supplies some two million people and around 230,000 commercial buildings and industrial plants in and around Vienna with electricity, natural gas, district heating, cooling, and innovative energy services. Wien Energie generates electricity and heat from renewable energy sources, such as solar power, wind power, hydropower and biomass, from energy-from-waste plants, and high-efficiency combined heat and power (CHP) plants. Wien Energie is also active in the telecommunications and electromobility sector, and provides other energy and infrastructure-related services. Wien Energie is wholly owned by Wiener Stadtwerke
GmbH. We actively contribute to shaping the sustainable future of energy through innovation and research.
Wiener Netze GmbH is Austria’s largest combined system operator. Its grids connect over two million people in Vienna, parts of Lower Austria and Burgenland and supply them with heat, light and energy – 24 hours a day, 365 days a year.
Wiener Netze is responsible for grid strategy and grid planning, and builds, expands and operates Vienna’s energy grids. It is also responsible for figures and data, takes care of integrated security management and is organising the transition to smart metering. As a company, Wiener Netze offers a wide range of grid-specific services, including substation and transformer maintenance and conducting safety inspections of gas systems. In the event that the electricity, gas or district heating systems do experience disruption, round-the-clock teams are deployed immediately.
Wiener Linien is Vienna’s leading transport operator, and reports directly to the City of Vienna on public transport matters. Besides operating underground, tram and bus lines, it carries out a wide range of traffic management functions including service and interval scheduling, route and stop planning for all transport modes, sales and marketing, and operational control. In addition, it is responsible for providing the infrastructure and vehicle fleets required for services, and for maintaining all systems.
This remit enables the company to provide an integrated public transport network in Vienna, focusing in particular on ensuring the best possible levels of efficiency and utilisation. In order to provide customers with contemporary, urban mobility as simply and attractively as possible, Wiener Linien continues to provide information and coordination services in a wide range of areas and is responsible for planning and continuously expanding the public transport network. Major focus areas for the coming years are construction of the U2xU5 intersection, introduction of driverless underground trains and expanding the tram network. In addition to efforts with regard to modal shift, there are increasing endeavours to structure the company’s own production in a way that is as energyefficient as possible. This is being done, for instance, through the increased use of brake energy, fitting buildings with photovoltaic systems and testing new drive technologies in the bus sector.
Furthermore, the company operates the WienMobil mobility app, with more WienMobil stations being added on a continuous basis. Not only do these mobility stations offer various sharing services (e.g. electric cars, electric bikes, cargo bikes), but there are also bicycle storage boxes and electric charging points at Wiener Linien stations and stops.
The new bike-sharing service WienMobil Rad, which has already been fully developed in all 23 districts, is another step towards establishing WienMobil as an umbrella brand and a mobility hub. The electric car-sharing system WienMobil Auto complements the broad range of mobility services on offer, and is due to be rolled out further next year. Wiener Linien sees the expansion of public transport to include sharing services as a crucial factor in making mobility in Vienna even more sustainable.
Wiener Lokalbahnen GmbH (WLB) operates the Badner Bahn between Vienna’s State Opera House and Josefsplatz in Baden and is one of the most important commuter connections in the southern environs of Vienna. Badner Bahn is integrated into the Verkehrsverbund Ostregion (Eastern Region Transport Association – VOR). With the 2020 timetable change, which took place on 3 December 2020, the new Badner Bahn transport services agreement (new VDV) came into force. This agreement regulates the operation of the Badner Bahn and an increase in service frequency for the next 15 years. December 2022 saw the first of the new generation of coaches – the TW500 – enter into service. The Wiener Lokalbahnen division also provides transport and private travel services for people with restricted mobility through the subsidiary Wiener Lokal-
bahnen Verkehrsdienste GmbH (WLV). In addition to school days out and regular trips run by the public sector, these services also cover recreational trips commissioned by customers themselves. Likewise, WLV operates the on-call bus service RUFBUS, as well as other bus routes, on behalf of Wiener Linien. Since 2021, journeys have also been increasingly taken on for companies (e.g. secondments or transporting food). Wiener Lokalbahnen Cargo GmbH (WLC), also a subsidiary of Wiener Lokalbahnen, organises intermodal block train shipments across Europe.
Bestattung Wien GmbH is the largest funeral home in Austria – and in Europe. A traditional company, it has organised more than two million funerals and international repatriations since it was established, with funeral services ranging from intimate services among close family through to large state funerals. Bestattung Wien GmbH operates 17 funeral homes in Vienna. The company’s specially trained staff provide thorough advice, and arrange fitting customised funeral services in accordance with the wishes of the bereaved. Their wealth of experience and high customer service standards are reflected in ISO 9001 quality certification. The range of services offered by Bestattung Wien GmbH extends from the collection of the deceased, the comprehensive organisation of the funeral and the holding of the funeral service through to advice on funeral provision. It also offers special services including natural burials, memorial diamonds, traditional horse-drawn hearses, death masks, the lying in state of the deceased in a church and burials at sea.
Friedhöfe Wien GmbH’s business activities are split into the four areas of cemeteries, cemetery gardening, the stonemasonry workshop at Vienna’s Central Cemetery and the crematorium at the Feuerhalle Simmering cemetery. In the cemeteries division, grave usage rights are offered for various types of burial plots (coffin and urn plots). To enable us to keep in step with the trend of urn burial and natural burial, various common graves are also offered (tree plots, lawn plots, shrub plots, urn garden plots, forest burial, family and friendship trees, rainwater urns, and Vienna natural graves), as well as urn plots for joint human–animal burials. In cemetery gardening, we carry out grave maintenance, offer decorative elements for graves and provide floristry products (funeral and occasion flowers). The stonemasonry workshop carries out extensive activities in connection with the construction and maintenance of grave plots. The crematorium performs cremations on behalf of funeral homes, hospitals and as part of body donation programmes.
The company is tasked with operating and managing multi-storey and open-air car parks of all kinds, as well as planning and running projects related to parking space management and the construction of multi-storey car parks. Wipark does not maintain any branches other than the car park locations.
The Wiener Stadtwerke Group is a cornerstone of the Viennese economy, and an attractive employer for a workforce of about 16,000. The company makes a significant contribution to the economic development of Vienna and helps to safeguard the city’s world-renowned high quality of life. Wiener Stadtwerke carries out its responsibilities as a corporate citizen with a focus on economic effectiveness and operational efficiency. Only a financially sound business can deliver energy supply security, provide the people of Vienna with sustainable, high-quality products and services, and make far-sighted investments in future-proof infrastructure.
As a diversified group, Wiener Stadtwerke is in part subject to highly challenging legal and trading environments. Because of this, Wiener Stadtwerke GmbH manages its subsidiaries according to targets and performance indicators that are tailored to each individual operation.
To help meet these requirements, long-term financial stability and support for Vienna on the road to becoming a smart climate city are enshrined in the Wiener Stadtwerke Group’s corporate strategy as central goals. Meeting these goals will both lay the groundwork for essential investments in energy, energy grids, transport, IT, car parks, and funeral services and cemeteries, and play a major part in increasing the – already outstanding – quality of life in Vienna. In particular, Wiener Stadtwerke will seek to implement the City of Vienna’s Smart Climate City framework strategy by acting in a number of ways to upgrade urban infrastructure, combat climate change and promote innovation.
Wiener Stadtwerke sees itself as a corporate group focused on climate protection and wants to increasingly express this to internal and external stakeholders. With this in mind, the Group’s strategy was revised in 2022 to focus on climate protection. Together, the Wiener Stadtwerke Group is careful in what it does and galvanises climate protection efforts through sustainable products and services. Here, too, the customers’ needs are at the heart of all of our efforts. The Wiener Stadtwerke businesses are all geared to the Group’s common aim of acting as a one-stop provider of infrastructure services in the Vienna metropolitan region. This role as a central point of contact and single-source service provider in the greater Vienna area is being reinforced by closer cooperation and leveraging synergies within the Group, optimisation of internal processes and efficiency, and efforts to embed a performance-driven ethos in the corporate and leadership culture.
Wiener Stadtwerke intends to remain an attractive employer and, together with its workforce, it seeks to continue playing a pivotal role in turning Vienna into a smart climate city, and to act as an innovative, reliable and future-oriented partner that the entire population can rely on to provide urban infrastructure and attractive products and services.
Thanks to a strong economy in the first half of the year, Austria’s gross domestic product grew by 4.7% in 2022, according to the December forecast. Responsible for this were the strong recovery of the service sector, the positive development of industrial production, a significant increase in consumer spending, and strong export activity in the first half of the year. 1
From the third quarter of 2022, the global economic downturn and increased energy prices led to stagnation in growth. Geopolitical tensions were responsible for the rise in energy prices in the 2022 financial year, while intense heatwaves and periods of drought in Europe led to a rise in food prices. These factors led to a sharp rise in consumer price inflation, which reached long-term highs. 2
Tourism has been a strong pillar of Austria’s economic development. The number of overnight stays in the 2022 summer season (May to October) was only slightly below the values of the record-breaking season of 2019. 3 With 77.88 million overnight stays from May to October, the comparable figure from the previous year was exceeded by 17.3%. 4
The performance of the employment market painted a positive picture for 2022. Despite the war in Ukraine and the situation on the energy market, on average for the year 17.3% fewer people were registered as unemployed or in training than in the previous year. The first effects of the economic slowdown began to become clear in December, with unemployment in the construction industry rising by 1.1%. 5
The Harmonised Index of Consumer Prices (HICP) inflation rate continued to rise in 2022, reaching 11.5% in October, the highest level since the time series began in 1988. 6 HICP inflation averaged 8.6% in 2022, more than three times higher than in 2021 (2.8%) and more than six times higher than in 2020 (1.4%). 7 The sharp increase from May to October is mainly due to energy prices, although price dynamics are also rising in other sectors. Industrial goods, foods, and services each account for one-fifth of the increase in inflation since May 2022. Despite an easing of crude oil prices, end consumer prices for gas and electricity rose. This led to an increase in production costs in agriculture, industry and the service sector. 8
2022 saw a marked reversal of interest rates and a departure from the zero interest-rate policy. Earlier in the year, the US Federal Reserve indicated that it would raise the key interest rate in several steps in 2022 in order to fight inflation. The rise in inflation was described as a temporary phenomenon by the ECB, which initially maintained its zero interest-rate policy. However, this changed after the start of the war in Ukraine and when inflation began to increase further. The ECB presented the prospect of interest rate hikes and the end of bond purchases. In order to maintain price stability, the ECB raised the key interest rate from 0% to 0.5% in July, marking the first increase since 2011. As inflation continued to rise in the euro area, another interest rate increase followed in September, when the key interest rate was increased by 0.75% to 1.25%, which is the largest interest rate increase in the history of the ECB to date. Two further key interest rate increases followed in 2022 (0.75% in October and 0.5% in December), leaving the key interest rate at 2.5% at the end of the year. Since inflation continues to remain at a high level, the ECB is planning further interest rate increases for 2023. 9
The currently uncertain economic backdrop, the current situation on the liberalised energy market and ambitious climate and energy targets all pose tough tests for Wiener Stadtwerke. These challenges can be overcome by working relentlessly to develop innovative new services and products, providing optimum care for existing customers, and constantly boosting efficiency.
1 https://wko.at/statistik/prognose/text-PDF.pdf?_gl=1*8yarh9*_ga*MTUyMjc0MTg0Mi4xNjc0NTc3MTU5*_ga_4YHGVSN5S4*MTY3NDU3NzE1OC4xLjEuMTY3NDU3NzE2MS41Ny4wLjA, accessed 25 January 2023.
2 https://www.wifo.ac.at/jart/prj3/wifo/resources/person_dokument/person_dokument.jart?publikationsid=70406&mime_type=application/pdf, accessed 25 January 2023.
3 https://www.oenb.at/Publikationen/Volkswirtschaft/konjunktur-aktuell.html
December 2022, accessed 25 January 2023.
4 https://www.statistik.at/fileadmin/announcement/2022/11/20221129TourismusOktober2022.pdf, accessed 25 January 2023.
5 https://www.ams.at/content/dam/download/arbeitsmarktdaten/%C3%B6sterreich/berichte-auswertungen/001_uebersicht_aktuell.pdf, accessed 25 January 2023.
6 https://www.oenb.at/Publikationen/Volkswirtschaft/konjunktur-aktuell.html
December 2022, accessed 25 January 2023.
7 https://www.statistik.at/fileadmin/announcement/2023/01/20230116VPIJahr2022.pdf, accessed 25 January 2023.
8 https://www.oenb.at/Publikationen/Volkswirtschaft/konjunktur-aktuell.html December 2022, accessed 25 January 2023.
9 https://www.forbes.com/advisor/de/geldanlage/2023/01/24/inflation-zinsentwicklung-aktuell/, accessed 25 January 2023.
The Legal, Compliance and Contract Award department coordinates a Group-wide network for legal matters, which ensures that the Wiener Stadtwerke Group’s high legal standards are met.
In order to successfully address the ever-changing legal environment, the relevant legal departments regularly evaluate and offer their insights into draft bills and ordinances, provide their legal expertise to the Group and address legal queries from the Wiener Stadtwerke Group. Employees in these departments apply their knowledge to advise other departments across all areas of the company and support these in fulfilling their duties.
In addition to the opportunities and risks of normal business operations, the term “Group-relevant business cases” was defined in the 2022 financial year and was incorporated into the internal regulations along with the corresponding approval processes. Furthermore, the Wiener Stadtwerke Group focused in particular on energy-related topics in the second half of the 2022 financial year.
Data privacy is an important topic for Wiener Stadtwerke. The Group guidelines for the data protection organisation establish the principles for processing personal data within the Group. The processing of data will be supplemented by a process for data breaches relevant to the Group. Data protection topics that affect several Group companies will be coordinated regularly by the data protection officers within the Group companies. New IT systems will be checked for compliance with data protection legislation before they are rolled out. Mandatory data protection training is carried out once per year for all employees.
With a view to developing data protection specifications, a standardised cloud strategy and cloud policy and a Group-wide erasure strategy have been drawn up. Furthermore, the process for the implementation of an erasure
concept through information lifecycle management (ILM) was started in the S/4 HANA program. Further data processing activities were added to the framework agreement for data processing and data transfer, which was concluded in 2020 and replaces bilateral data processing agreements and regulates responsibility in the case of joint processing activities. The Group-wide security incident response and data breach processes are currently being harmonised. An exercise was carried out to test the Group-wide incident response process.
The political and economic environment in 2022 was dominated by the issues of sustainability and climate protection, though other topics were also in the spotlight. In the wake of the Russian war of aggression against Ukraine, securing energy supplies and dealing with volatile and sharply rising energy prices were both central throughout the EU and therefore also in Austria.
On the one hand, the EU has reacted to the Russian invasion with sanctions packages10 that also affect the energy industry. These largely ban, among other things, the importing of crude oil and refined petroleum products from Russia. On the other hand, the EU proposed measures for making Europe independent of fossil fuels from Russia – initially natural gas – well before the end of 2030. In particular, the proposals included cooperation between member states to secure gas supplies, measures to reduce demand for gas and to mitigate the impact of high energy prices on households and businesses, and the acceleration of the transition to clean energy.
The REPowerEU Plan, first presented as a draft in March 202211, summarises proposals for joint European action to make the energy supply affordable, secure and sustainable, and to reduce demand for Russian gas by two-thirds by the end of 2022. 12 This goal will be achieved by diversifying Europe’s gas supply, accelerating renewable energies permitting, decarbonising industry, doubling the EU’s biomethane production target, installing more rooftop solar power systems, fitting more heat pumps and taking more energy-saving measures, and by embracing a hydrogen accelerator concept. The REPowerEU plan, published in May 2022, raises the renewable energy target from 40% to 45% and increases the energy efficiency target from 9% to 13% as part of the Fit for 55 package of European Green Deal legislation. 13
In response to the upheavals on the international energy markets, the Gas Storage Regulation was issued in June 2022. 14 The Regulation stipulates that EU member states must fill their gas storage facilities to at least 80% by 1 November 2022 and to at least 90% by 1 November of every year from 2023 onwards. Given reduced gas supplies from Russia, the European Commission proposed a plan in July 2022 for reducing gas consumption in Europe by 15% by spring 2023 in order to strengthen European energy resilience. 15
Emergency intervention in the electricity sector (reduction of electricity consumption, electricity price cap, skimming of surplus profits)
The European Commission has drawn up an emergency –currently temporary – intervention for the electricity sector. The regulation on an emergency intervention to address high energy prices16 primarily sets targets for reducing electricity consumption between 1 December 2022 and 31 March 2023, skimming market revenues from electricity generation exceeding EUR 180 per MWh and levying a solidarity levy on “surplus profits” from the crude petroleum, natural gas, coal and refinery sectors. The income is to be used by the member states to reduce the burden on end customers, such as households and small and medium-sized enterprises.
Across the EU, energy companies faced liquidity shortages due to margin calls when using derivative markets. In light of this, in October 2022, the European Commission adopted new rules for market participants, temporarily extending the list of eligible collateral to non-cash collateral, including sovereign guarantees. 17 In addition, the clearing threshold will be raised from EUR 3 billion to EUR 4 billion18, below which non-financial companies will not be subject to margin calls on their over-the-counter (OTC) derivatives. In addition, the Agency for the Cooperation of Energy Regulators (ACER) and the European Securities and Markets Authority (ESMA) are strengthening their cooperation to bolster their capacity to monitor and detect possible market manipulation and abuse in the European spot and derivatives markets for energy. 19
11 COMMUNICATION FROM THE COMMISSION TO THE EUROPEAN PARLIAMENT, THE EUROPEAN COUNCIL, THE COUNCIL, THE EUROPEAN ECONOMIC AND SOCIAL COMMITTEE AND THE COMMITTEE OF THE REGIONS REPowerEU: Joint European Action for more affordable, secure and sustainable energy, COM(2022) 108 final, 08/03/2022; ANNEX 1 ANNEX to the COMMUNICATION Guidance on Application of Article 5 of the Electricity Directive during current situation, COM(2022) 108 final, 08/03/2022; ANNEX 2 ANNEX to the COMMUNICATION Guidance on the application of infra-marginal profit fiscal measures, COM(2022) 108 final, 08/03/2022; ANNEX 3 ANNEX to the COMMUNICATION Use of the toolbox in the Communication of 13 October 2021, COM(2022) 108 final, 08/03/2022.
12 European Commission, REPowerEU: EU Commission guides the way towards independence from fossil energy, 8 March 2022, https://germany.representation.ec.europa.eu/news/repowereu-eu-kommission-weist-weg-richtung-unabhangigkeit-von-fossiler-energie-aus-2022-03-08_de, accessed 23 January 2023.
13 European Commission, REPowerEU: A plan to rapidly reduce dependence on Russian fossil fuels and fast forward the green transition, 18 May 2022,https://ec.europa.eu/commission/presscorner/detail/en/ip_22_3131, accessed 23 January 2023.
14 REGULATION (EU) 2022/1032 OF THE EUROPEAN PARLIAMENT AND OF THE COUNCIL of 29 June 2022 amending Regulations (EU) 2017/1938 and (EC) No 715/2009 with regard to gas storage.
15 Proposal for a COMMUNICATION FROM THE COMMISSION TO THE EUROPEAN PARLIAMENT, THE COUNCIL, THE EUROPEAN ECONOMIC AND SOCIAL COMMITTEE AND THE COMMITTEE OF THE REGIONS “Save gas for a safe winter”, COM(2022) 360 final, 20/07/2022.
16 COUNCIL REGULATION (EU) 2022/1854 of 6 October 2022 on an emergency intervention to address high energy prices, OJ LI 261/1 of 7 October 2022.
17 Proposal COMMISSION DELEGATED REGULATION (EU) amending the regulatory technical standards laid down in Delegated Regulation (EU) No 153/2013 as regards temporary emergency measures on collateral requirements, C(2022) 7536 final, 21/10/2022; Proposal ANNEX to the COMMISSION DELEGATED REGULATION (EU) amending the regulatory technical standards laid down in Delegated Regulation (EU) No 153/2013 as regards temporary emergency measures on collateral requirements, C(2022) 7536 final 21/10/2022; Proposal COMMISSION DELEGATED REGULATION (EU) amending the regulatory technical standards laid down in Delegated Regulation (EU) 2016/2251 as regards the date of application of certain risk management procedures for the exchange of collateral, C(2022) 7326 final, 25/10/2022; Proposal COMMISSION DELEGATED REGULATION (EU) amending the regulatory technical standards laid down in Delegated Regulations (EU) 2015/2205, (EU) 2016/592 and (EU) 2016/1178 as regards the date at which the clearing obligation takes effect for certain types of contracts, C(2022) 7175 final, 25/10/2022.
18 Proposal COMMISSION DELEGATED REGULATION (EU) amending the regulatory technical standards laid down in Delegated Regulation (EU) 149/2013 as regards the value of the clearing threshold for positions held in OTC commodity derivative contracts and other OTC derivative contracts, C(2022) 7413 final, 18/10/2022.
MANAGEMENT
1 Principles of the Wiener Stadtwerke Group
In October 2022, the European Commission presented comprehensive reports on the Energy Emergency20 and the 2022 State of the Energy Union report21. The Council of the European Union agreed in October and November 2022 on new measures for joint purchases of gas, a solidarity mechanism22 and a temporary market correction mechanism to limit excessively high gas prices. Following legislative proposals by the European Commission on the solidarity mechanism23 and the market correction mechanism24, the Regulation on enhancing solidarity through better coordination of gas purchases, exchanges of gas across borders and reliable price benchmarks was adopted at the end of 2022. 25 Likewise, gas distribution measures are defined for in the event of a gas emergency. With the regulation establishing a market correction mechanism26 to protect citizens and the economy against excessively high prices, the EU-wide gas price cap27 was launched at the end of December 2022 and is ready for resolution and publication.
In Austria, several laws accompanying and supplementing the EU-wide measures were passed to address the energy crisis. In April 2022, an amendment to the Gaswirtschaftsgesetz (GWG, Natural Gas Act)28 was decided upon. The amendment deals with the formation and procurement of a strategic gas reserve for Austria from the beginning of November 2022. The newly adopted Gasdiversifizierungsgesetz (GDG, Gas Diversification Act)29 is intended to reduce dependence on Russian natural gas and make subsidies available for the procurement of natural gas from non-Russian sources and for the conversion of plants to alternative energy sources. In preparation for official energy control measures, the Austrian gas emergency plan30 was updated at the end of October 2022, including to bring it in line with the requirements of the EU SOS Regulation31. In the event of a crisis, this emergency plan regulates the supply for protected customer groups in three stages on the basis of the Energielenkungsgesetz (Energy Management Act). In addition, various relief packages were launched at national level and by the City of Vienna to counteract the increase in costs that households and businesses are suffering from as a result of the sharp rise in energy prices.
19 European Commission – Press release of 18 October 2022: Commission makes additional proposals to fight high energy prices and ensure security of supply.
20 Proposal for a COMMUNICATION FROM THE COMMISSION TO THE EUROPEAN PARLIAMENT, THE EUROPEAN COUNCIL, THE EUROPEAN ECONOMIC AND SOCIAL COMMITTEE AND THE COMMITTEE OF THE REGIONS Energy Emergency – preparing, purchasing and protecting the EU together, COM(2022) 553 final, 18/10/2022.
21 REPORT FROM THE COMMISSION TO THE EUROPEAN PARLIAMENT, THE COUNCIL, THE EUROPEAN ECONOMIC AND SOCIAL COMMITTEE AND THE COMMITTEE OF THE REGIONS, State of the Energy Union 2022 (pursuant to Regulation (EU) 2018/1999 of the Governance of the Energy Union and Climate Action), COM(2022) 547 final, 18/10/2022.
22 Conclusions of the European Council (meeting of 20 and 21 October 2022), EUCO 31/22, 21/10/2022.
23 Proposal for a COUNCIL REGULATION Enhancing solidarity through better coordination of gas purchases, exchanges of gas across borders and reliable price benchmarks, COM(2022) 549 final, 18/10/2022.
24 Proposal for a COUNCIL REGULATION Establishing a market correction mechanism to protect citizens and the economy against excessively high prices, COM(2022) 668 final, 22/11/2022.
25 COUNCIL REGULATION (EU) 2022/2576 of 19 December 2022 enhancing solidarity through better coordination of gas purchases, reliable price benchmarks and exchanges of gas across borders, OJ L 335/1, 29/12/2022.
26 Explanation: The mechanism is automatically activated if the Title Transfer Facility (TTF) month-ahead price exceeds EUR 180/MWh for three days and the TTF month-ahead price is EUR 35 above the reference price for LNG on the world markets during the same three-day period. After activation, the bid cap will be in place for at least 20 working days. If the cap is below EUR 180/MWh for at least three consecutive working days, it is automatically deactivated. It is also automatically deactivated if a regional or Union-wide emergency is declared by the European Commission.
27 Proposal for a COUNCIL REGULATION Establishing a market correction mechanism to protect citizens and the economy against excessively high prices, Interinstitutional file 2022/0393(NLE), 19/12/2022.
28 Änderung des Gaswirtschaftsgesetz 2011 (GWG 2011) (Amendments to the Natural Gas Act (GWG 2011)), FLG I No. 38/2022.
29 Bundesgesetz über die Förderung des Ausstiegs aus russischem Erdgas und der Diversifizierung des Erdgasbezugs aus anderen Quellen (Gasdiversifizierungsgesetz 2022 – GDG 2022) (Federal Act on the Promotion of the Phase-Out of Russian Natural Gas and the Diversification of Natural Gas Purchases from Other Sources (Gas Diversification Act 2022 – GDG 2022)), FLG I No. 95/2002 as amended FLG I No. 107/2022.
30 Notfallplan Gas der Republik Österreich (Gas Emergency Plan of the Republic of Austria) pursuant to Article 8 of REGULATION (EU) 2017/1938 OF THE EUROPEAN PARLIAMENT AND OF THE COUNCIL of 25 October 2017 concerning measures to safeguard the security of gas supply and repealing Regulation (EU) No 994/2010, https://www.bmk.gv.at/themen/energie/energieversorgung/erdgas/plan_oe.html, accessed 22 January 2023.
31 REGULATION (EU) 2017/1938 OF THE EUROPEAN PARLIAMENT AND OF THE COUNCIL of 25 October 2017 concerning measures to safeguard the security of gas supply and repealing Regulation (EU) No 994/2010, OJ L 280, 28/10/2017, P. 1, as amended by Commission Delegated Regulation (EU) 2022/517 of 18 November 2021, OJ L 104/53, 01/04/2022, Regulation (EU) 2022/1032 of the European Parliament and of the Council of 29 June 2022, OJ L 173/17, 30/06/2022, Corrigendum, OJ L 245, 22/09/2022, P. 70 (2022/1032).
In addition to acceleration permitting and raising renewables targets, the Council and the Parliament of the European Union reached a preliminary agreement on the EU Emissions Trading System and the Social Climate Fund. The 2030 emissions reduction target was increased to 62%. The cap on total emissions has been redefined, and free allocation is to be phased out from 2026 onwards, being completely phased out by 2034.
The EU Taxonomy Regulation provides a framework for classifying “green” – that is, environmentally sustainable –economic activities within the EU in a universal way. 32 In order to accelerate decarbonisation, the European Commission has presented a complementary delegated taxonomy act, which will aid in achieving the 2050 climate change targets and covers certain gas and nuclear activities. 33 With the adoption of the act34, nuclear and gas power plants will be transitionally classified as sustainable. 35 The InvestEU programme36 provides support for the energy sector, in particular for renewable energy, energy efficiency and building renovation projects with a focus on energy savings, the integration of buildings into a connected energy source, storage, digital and transport system, and the improvement of energy infrastructure interconnection levels. 37
As of 20 December 2021, the EU Commission has granted approval for state aid for the Erneuerbaren-Ausbau-Gesetz (EAG, Renewable Energy Expansion Act). 38 One of the amendments to the Renewable Energy Expansion Act 39, 40, 41 was to suspend the green electricity flat rate for 2022. This is intended to counteract the rise in energy prices. Commissioning deadlines for photovoltaic systems have been extended. Furthermore, it was clarified that in the case of unilateral contractual and fee changes by an electricity supplier, the end customers have the right to terminate the contract. 42
At the beginning of October 2022, the EAG-Marktprämienverordnung (EAG Market Premium Ordinance) entered into force. 43 The ordinance provides subsidies for the generation of wind power, photovoltaics, biomass and hydropower, as well as for biogas plants. The Market Premium Ordinance is the basis for further expanding renewable energies in Austria. 44
Since mid-June 2022, with considerable delay, a ministerial draft45 and, since November 2022, a government bill46 for the Bundesgesetz zum Ausstieg aus der fossil betriebenen Wärmebereitstellung (Federal Act to Phase Out Fossil-Fuelled Heat Supply – Renewable Heat Act, EWG) have been available. The law will set uniform nationwide targets for phasing out heat supplies that use oil, LPG and coal by 2035 and those that use gas by 2040.
32 EU Taxonomy Overview, https://eu-taxonomy.info/info/eu-taxonomy-overview, accessed 30 November 2022.
33 European Commission, EU Taxonomy: Commission presents Complementary Climate Delegated Act to accelerate decarbonisation, 02/02/2022, https:// ec.europa.eu/commission/presscorner/detail/en/ip_22_711, accessed 30 November 2022.
34 COMMISSION DELEGATED REGULATION (EU) 2022/1214 of 9 March 2022 amending Delegated Regulation (EU) 2021/2139 as regards economic activities in certain energy sectors and Delegated Regulation (EU) 2021/2178 as regards specific disclosures for those economic activities, OJ L 188/1, 15 July 2022.
35 News European Parliament, Taxonomy: MEPs do not object to inclusion of gas and nuclear activities, 06/07/2022, https://www.europarl.europa.eu/news/ en/press-room/20220701IPR34365/taxonomy-meps-do-not-object-to-inclusion-of-gas-and-nuclear-activities, accessed 30 November 2022.
36 REGULATION (EU) 2021/523 OF THE EUROPEAN PARLIAMENT AND OF THE COUNCIL of 24 March 2021 establishing the InvestEU Programme and amending Regulation (EU) 2015/1017, OJ L 107/30, 26/03/2022.
37 InvestEU, What is the InvestEU Programme?, https://investeu.europa.eu/what-investeu-programme_en, accessed 1 December 2022.
38 BMK Infothek: EU gibt grünes Licht für Erneuerbaren Ausbau Gesetz (EU gives green light for Renewable Energy Expansion Act), 21/12/2021, https:// infothek.bmk.gv.at/eu-gibt-gruenes-licht-fuer-erneuerbaren-ausbaugesetz, accessed 22 January 2023.
39 Änderung des Erneuerbaren-Ausbau-Gesetzes (Amendments to the Renewable Energy Expansion Act), FLG I No. 172/2022.
40 Änderung des Erneuerbaren-Ausbau-Gesetzes (Amendments to the Renewable Energy Expansion Act), FLG I No. 233/2022.
41 Änderung des Erneuerbaren-Ausbau-Gesetzes, des Elektrizitätswirtschafts- und -organisationsgesetzes 2010 und des Energie-Control-Gesetzes (Amendments to the Renewable Energy Expansion Act, the Elektrizitätswirtschafts- und -organisationsgesetz (EIWOG, Electricity Act) 2010 and the Energie-Control-Gesetz (Energy Control Act)), FLG I No. 7/2022.
42 Austrian Parliamentary Correspondence No. 59 of 20/01/2022, Nationalrat novelliert Erneuerbaren-Ausbau-Gesetz (National Council amends Renewable Energy Expansion Act), https://www.parlament.gv.at/PAKT/PR/JAHR_2022/PK0059/index.shtml, accessed 22 November 2022.
43 EAG-Marktprämienverordnung 2022 (EAG Market Premiums Ordinance 2022), FLG II No. 369/2022.
44 BMK Infothek: Marktprämienverordnung für Ökostromerzeuger tritt in Kraft (Market Premium Ordinance for green electricity producers enters into force), 03/10/2022, https://infothek.bmk.gv.at/marktpraemienverordnung-fuer-oekostromerzeuger-nun-in-kraft/, accessed 22 January 2023.
45 Ministerial Draft EWG, 212/ME XXVII. GP. Text of the act.
46 RV 1773 Blg NR XXVII. GP, EBRV 1773 Blg NR XXVII. GP.
At the end of December 2022, the review process for a revision of the Energieeffizienzgesetz (Energy Efficiency Act) was started, also with considerable delay. 47 Essential components of the Federal Energy Efficiency Act 2014 were limited until 31 December 2020 and are to be adapted to requirements of EU law. In addition, the energy efficiency system that has been in place up to now is to be improved and made more effective. The draft provides for the following main regulatory contents: continuation of energy end-use audits and energy management systems for large companies, obligation of the federal government to an annual renovation quota of 3% and to connection to district heating, individual consumption meters including remote reading requirements, upgrading of advisory centres for households, in particular also for beneficiary households, entrustment of E-Control with energy efficiency tasks and distribution of the national energy efficiency targets.
As in previous years, unusually high temperatures were recorded in 2022. According to the preliminary climate report by the Austrian Central Institute for Meteorology and Geodynamics (ZAMG), it ranks third in the 256-year series of warmest years on record. The temperature deviation compared with the average for 1991–2020 is +1.0°C and for 1961–1990 is +2.3°C. Furthermore, the year 2022 was one of the 15 driest years in the past 165 years in terms of precipitation. Across Austria, 15% less precipitation fell than the multi-year average. 2022 was also the eighth sunniest in the past 98 years. Austria had 6% more hours of sunshine than average. 48 During the reporting period, total heating degrees – the metric normally used in the energy sector for temperature-driven energy demand –in Wien Energie’s supply area were 10.5% below the average for the past 30 years.
47 Ministerial Draft EEff-RefG 240/ME XXVII. GP – text of the act and explanatory notes.
48 ZAMG.
Meteorology
https://www.zamg.ac.at/cms/de/klima/news/2022-unter-den-drei-waermsten-jahren-der-messgeschichte, accessed 19 January 2023.
Oil prices in the first half of 2022 saw almost uninterrupted growth. The geopolitical challenges arising from the war in Ukraine brought oil prices to new long-term highs. This development was slowed only briefly by a short slump in April, which resulted from renewed coronavirus restrictions in China. The lifting of the measures and an accompanying increase in demand, tight supply and, above all, the agreement on EU-wide energy sanctions against Russia quickly helped prices to reach new highs. However, this upward trend was broken again at the beginning of the second half of the year. Major uncertainties due to the war in Ukraine, the fight against high inflation and global recession concerns put significant pressure on oil prices. Aside from a slight countermovement in October, prices continued to decline towards the end of the year. Despite the downward movement, however, oil prices are still at a level that is significantly above that of the last few years. Compared with the previous year, an average price increase of 43% was recorded.
At the beginning of the year, sharply declining Russian gas supplies and the associated geopolitical uncertainties drove prices upwards. This was compounded by historically low gas storage inventories. With the start of the war in Ukraine, the subsequent sanctions and Russia’s cutback in gas deliveries, the European supply situation – and thus the price situation – worsened significantly once again. Fears that the mandatory storage targets might not be met caused severe gas price increases again in the summer months. Further contributing factors to the extraordinary price increase were several instances of maintenance work, supply curtailments and ultimately a complete cessation of supply via Nordstream 1. The upward trend was broken when discussions about market intervention intensified and it became known that storage targets would be reached early. Yet, despite very well-filled gas storage facilities, cool temperature forecasts led to renewed price increases on the very sensitive gas markets. It was not until the end of the year that the gas market eased again thanks to very mild temperatures and declining consumption. The European natural gas storage facilities were filled to 83% at the end of 2022.
Prices on the European electricity markets reached unprecedented heights in the reporting year. Similar to the gas market, the causes for the rapid increase in electricity prices are also manifold. The nervousness on the gas market also affected prices on the wholesale electricity market. This upward trend was boosted by production cuts due to drought across Europe and shutdowns at French nuclear power plants. Furthermore, unfavourable weather conditions resulted in less electricity being generated from renewable sources and thus led to increased use of conventional power plants. Ultimately, the tension was not eased until September 2022, when the high levels in the natural gas storage facilities caused gas prices to fall, which in turn also pushed electricity prices down. On the other hand, as early as November, rising gas and CO2 prices led to renewed price increases on the electricity markets, which continued until mid-December. As the year came to an end, average monthly prices were at EUR 269.8/MWh (base) and EUR 335.4/MWh (peak).
Price movements of CO2 emissions allowances (Emission Certificate Act, EZG 2011 in EUR/t)
The price of CO2 emission allowances or European Union Allowances (EUA) showed a clear upward trend until the outbreak of the war in Ukraine, and even reached a historic high of over EUR 90/t in February. However, after the war broke out, CO2 prices fell in contrast to other commodities, which was due to the liquidation of EUA positions by many market players, who needed liquidity to cover the high margin payments arising from rapidly increasing energy prices. The initial price drop was followed by a fairly stable sideways movement. A larger price increase initially occurred again in August. High temperatures and lack of precipitation led to increased use of gas and coal to generate electricity, which drove up the price of CO2 emission allowances. This trend was short-lived, however, and the prevailing uncertainty in view of possible interventions by the European Commission in the energy markets led to a renewed fall in prices. A new trend reversal occurred in November. The forecast of low temperatures and thus a possible increase in gas and coal-fired power generation provided a renewed boost to prices.
The EAG package was published in the Austrian Federal Law Gazette on 27 July 2021. This package primarily implemented the Directive (EU) 2018/2001 of the European Parliament and of the Council of 11 December 2018 to promote the use of energy from renewable sources. In addition to the completely new Erneuerbaren-AusbauGesetz (EAG, Renewable Energy Expansion Act), the 2012 Ökostromgesetz (Green Electricity Act), the 2010 Elektrizitätswirtschafts- und -organisationsgesetz (EIWOG, Electricity Act), the 2011 Gaswirtschaftsgesetz (GWG, Natural Gas Act), the 2012 Energielenkungsgesetz (Energy Management Act), the Energie-Control-Gesetz (Energy Control Act), the Bundesgesetz zur Festlegung einheitlicher Standards beim Infrastrukturaufbau für alternative Kraftstoffe (Federal Act to Establish Consistent Standards in the Infrastructure Development for Alternative Fuels), the Wärme- und Kälteleitungsausbaugesetz (Act to Expand District Heating and Cooling Lines), the Starkstromwegegesetz (High Voltage Power Lines Act) and the Federal Act of 6 February 1968 on electrical circuit systems that do not cover two or more Austrian provinces were amended. The key content of the EAG includes the new regime for promoting green electricity, primarily based on variable technology-specific market premiums and investment grants, including the supply and management of the funds, the introduction of renewable energy communities and the grid infrastructure plan. The amendments to the Green Electricity Act mainly included provisional regulations regarding the entry into force of the EAG, as well as some contractual amendments.
In the second half of 2022, various legal changes were made to cushion the increase in energy prices for consumers (households and commercial consumers). These changes primarily affect the electricity sector and primarily the suppliers in this sector, but there are also various effects on distribution system operators, predominantly in the form of data deliveries. For instance, one change that has a direct effect on distribution system operators is the Stromkostenzuschussgesetz (Energy Subsidy Act), which, in addition to relieving energy price themselves, also provides for a reduction in grid costs for low-income households, i.e. households exempt from certain bills according to Gebühren Info Service (GIS). The reduced grid fees are compensated by tax revenues.
In connection with the increased costs for the sourcing of grid losses, support from federal funds was decided for the first half of 2023 just before the end of the year. (Note: In January 2023, this support was increased significantly and extended to the whole of 2023.) These funds directly support the purchase of grid losses and thus reduce the expenses for the grid operators. As a result, E-Control Austria (ECA) will have to reissue the grid operators’ cost notices and amend the SystemnutzungsentgelteVerordnung (System Charges Ordinance). This has been announced for the first quarter of 2023.
This act underwent a review procedure in mid-2022 and then passed almost unchanged in the Council of Ministers at the beginning of November. The resolution has not yet been passed in the National Council.
Wiener Netze GmbH lodged appeals against the electricity cost review notices for 2014–2018. The dispute relates to its treatment in the benchmarking exercise, as well as the capital structure regarding the non-influenceability of pension obligations. The appeals regarding the 2014, 2015, 2016 and 2017 tariff years were dismissed by the Federal Administrative Court. The ruling for 2018 is still pending. These verdicts will not have an effect on past or future electricity tariffs, as accounting was carried out in accordance with the principle of prudence. None of the disputed points are part of the cost review notices from 2019 onwards, so there are no legal proceedings outstanding. Wiener Netze submitted an appeal to the Supreme Administrative Court regarding the decision.
At the EU level, 2022 was marked above all by the energy crisis and the associated sharp rise in energy prices. Wiener Linien has pointed out the massive cost increases and the need to promote public transport – including at an EU level.
Other focuses at EU level last year were on the opening up and sharing of data and on digitalisation in the transport sector; the amendment to the Intelligent Transport Systems Directive (ITS Directive) is an important step towards expanding multimodal digital transport solutions. However, the amendment is also intended to create the obligation to generate data that does not yet exist. Furthermore, the European Commission itself would like to be able to expand the categories of data covered by the ITS Directive at any time. In the view of Wiener Linien, this would lead to massive cost increases and legal uncertainty for users.
In the past year, there were also effects on the legal environment of Wiener Linien at a national level, in particular due to the following laws:
In 2021, the taxation of traction current was abolished or massively reduced in the course of an amendment to the legal basis. However, the draft excluded urban rail transport (trams and underground trains) from benefiting. In 2022, the definitions were expanded so that urban rail transport now also benefits from the amendment.
The Regional Court for Civil Matters has ruled that unequal treatment in the purchase of semester tickets by students based on their main place of residence is not objectively justified and that the price difference, or immaterial damages, must be reimbursed. Several lawsuits have also been filed, the outcomes of which are still open, especially since a court has already ruled otherwise. In budgetary terms, provisions were increased accordingly at Wiener Linien. A uniform tariff will be applied for the summer semester 2023.
WLB is supporting the expansion of customer-friendly services at stops and the distribution of the entire range of tickets for eastern Austria in order to boost the appeal of its transport services and entice more passengers onto trains and buses. However, additional revenue from this is not to be expected to be generated directly for WLB due to the gross-contract basis. WLB is positive, by way of example, with regard to the efforts of the public sector to create more choice for passengers’ “last mile” and offers such choices, such as easymobil stations with sharing possibilities.
With the entry into force of the new transport services agreement at the end of 2020, the Badner Bahn tariff risk was merged with that of Verkehrsverbund Ost-Region (VOR). The only risk for Wiener Lokalbahnen (WLB) is the risk of disruption to individual Badner Bahn services. Therefore, there was no loss of income resulting from reduced ticket sales or non-executed indexations.
In 2010, the Funeral Services and Cemeteries Division was reorganised in order to separate the area of operations that is exposed to competition (funeral services) from the infrastructure side (cemeteries).
The range of services offered by Bestattung Wien GmbH covers both upstream areas (e.g. funeral planning) and downstream areas (support for bereaved relatives). In this context, the company offers a service to unsubscribe the deceased from memberships, along with free grief seminars for relatives. The company has always made every effort to enhance the profession. At the same time, the topic of death should be freed of any taboos through education, campaigns and PR work. While the focus at Bestattung Wien GmbH is always on providing information in a respectful manner, the Funeral Museum deliberately takes a more relaxed approach to the topic of death in order to appeal to younger members of the population.
The business activities of Friedhöfe Wien GmbH develop in line with the number of people who pass away in Vienna. Mortality rates in Vienna have fallen sharply over the past few decades, and Statistics Austria predicts that death rates will stabilise in the coming years. However, increasing urbanisation means that there is also a trend for many burials to be carried out in the deceased’s country of origin rather than in Vienna. The number of grave usage rights is hardly influenced by the economic environment, but is influenced by the changing culture surrounding remem-
brance and cemeteries. Negative factors include the long-term decline in the importance attached to end-of-life ceremonies and practices, and the increasing range of alternative services that can be offered in view of the growing number of cremations (e.g. people taking urns home, forest burials outside Vienna, scattering ashes in rivers and so on). In order to counteract this trend, Friedhöfe Wien is continuously optimising its services – by exploiting digitalisation and optimising administrative processes, for instance – and is actively developing the cemetery culture. The value of cemeteries as places of coming together, relaxation, culture and nature is brought to the fore through numerous measures and activities.
On 1 March 2022, the Vienna municipal government introduced a comprehensive short-stay parking zone in Vienna. Traffic-restricting measures are also planned in the 1st district. In principle, it can be assumed that these will have a positive effect on the course of business.
1 Principles of the Wiener Stadtwerke Group
The Wiener Stadtwerke Group’s 16,028 employees (FTEs as an annual average) make a vital contribution to safeguarding Vienna’s high quality of life.
1 Public servants and contract staff.
2 Excluding staff on parental leave, and military and civilian national service.
3 WSTW overall Group staff turnover (including employees subject to collective agreements, permanent civil servants, contract staff and apprentices), not including retired civil servants.
4 Excluding e-learning courses.
The key figures were calculated without including GWSG employees. Rounding differences not eliminated.
In September 2022, 175 new apprentices were welcomed to the Wiener Stadtwerke Group – more than ever before. The search for young talent has never been concluded as early as it was this year, even though numerous companies in Austria no longer manage to fill all of their apprenticeship positions. With around 470 apprentices in training, we have reached a new record. The number of apprenticeships is also expected to be gradually expanded in the years to come. We have also been offering our first laboratory technology apprenticeship since autumn 2022.
In order to successfully address the shortage of skilled workers and the challenges of the climate crisis, the range of apprenticeships offered within the Wiener Stadtwerke Group is continuously being adapted and revised. This also means providing our trainers with the necessary education to keep apprenticeship training at the highest level.
The proportion of women in manual and technical trades was increased to 30% in 2022. In this way, the Wiener Stadtwerke Group is a pioneer and continues to place great importance on inspiring women to pursue technical occupations. For this reason, we have launched a partnership with the Austrian Public Employment Service (AMS) that provides a broad taster programme for young women who are looking for a job.
Central Apprenticeship Management is responsible for coordinating and developing apprenticeships throughout the Group, and our central recruiting function is also based here.
For the second year in a row, the Wiener Stadtwerke Group apprentice programme was awarded the Gold Lehrlingsmarketing Award. The advertising line and the presentation of the 19 apprenticeships for 2023 were completely revised at the start of the recruiting year and now attract new talent with the motto “Lehre läuft!” (“Apprenticeships are go!”) and a new advertising campaign. In terms of content, the focus is on equal opportunities, which is in line with the motto “Die Lehre für Alle” (“Apprenticeships for all”).
The Group’s staff development department is responsible for three closely related areas that are strategically aligned with the existing HR strategy and Wiener Stadtwerke’s Vision 2025 concept: staff development, recruitment and employer branding. Above all, the new employer branding positioning and strategy serve as the starting point for all actions and aim to tackle the major challenges presented by the shortage of skilled workers and climate change by bringing together the combined strengths from across the Group. By engaging key target groups from across the Group and creating personas and compiling employee journeys from all of the different Group companies, we have been able to bring the IT target group into focus through a collection of Group-wide success stories.
The range of services includes measures to boost the appeal of the Group as an employer, the implementation of Group-wide staff marketing measures, central recruitment for management and expert positions while maintaining the highest quality standards and levels of transparency, the ongoing development of the Group recruitment tool, as well as the development of Group-wide staff development measures, such as intra-Group leadership (including up-and-coming leadership) development programmes, the development of the skills of specialists (including Connected Competence, process and project management, and agile and soft-skills methodologies) and skills development in order to establish collaboration and new working processes within the Group.
All three areas are anchored within the Group companies and closely networked via communities, acting as a Group-wide hub for knowledge exchange and trend monitoring.
Protecting employee health and safety is one of the Wiener Stadtwerke Group’s core objectives. In some cases, the wide-ranging action taken on workplace health and safety goes far beyond the statutory requirements. The Wiener Stadtwerke Group sees this primarily as an aspect of its social responsibility.
At the same time, the Wiener Stadtwerke Group firmly believes that a healthy and well-protected workforce that is fit for work makes a substantial contribution to the company’s commercial success. In order to safeguard the health of employees in the long term, a new “Strategic Health Management” function has been launched in the Change Management and Management Board Corporate Culture division. The objective is to systematically develop a healthy, resilient organisation and to anchor health as a matter of management and culture within the Wiener Stadtwerke Group. This enables structured networking opportunities and the structured transfer of knowledge, and identifies synergies in relation to (future) health topics in order to then roll out specially designed initiatives.
The Occupational Health Management function deals with the Group’s strategic objectives and in particular pursues the following Group objectives:
• Supporting, improving and maintaining employees’ ability to work
• Reducing absences due to illness and the number of occupational accidents
• Improving employee health literacy by implementing appropriate health promotion measures
• Gradually reintegrating employees who have been on long-term sick leave
Since the areas of activity within the Wiener Stadtwerke Group are very diverse, the individual Group companies are responsible for implementing these three pillars. This makes it possible to address the various needs and requirements in the most suitable manner. Group management provides support in implementing and adhering to the jointly defined standards, and a Group-wide occupational health management working group has been established for this purpose. Having health and safety contacts firmly established in the Group structure will help in the achievement of these objectives.
The Wiener Stadtwerke Group offers all employees and their relatives free, anonymous mental-health support in difficult work and private situations. The external counselling centre at Health Consult can be reached easily by telephone. Internally, company doctors and occupational psychologists are available to offer advice.
Wiener Stadtwerke places great importance on diversity, inclusion and accessibility, and these are strategically important issues for the Group. This is taken into account with the organisational embedding of the two areas of competence “Diversity and Gender Balance” and “Accessibility and People with Disabilities” in the Change Management and Management Board Corporate Culture division. These areas focus on coordinating the relevant initiatives across the Group, promoting holistic understanding, and strategically advancing the topics towards a common goal and in line with the Group’s vision. The structural, Groupwide embedding with contact persons for diversity and accessibility supports the achievement of objectives and is ensured by a Group-wide Diversity Committee, with representatives from all Group companies, and by the Group guidelines on accessibility and the role of the Accessibility Officer regulated in these.
Diversity, inclusion and accessibility are always taken into account and work is constantly being done to strengthen diversity in all its facets and to keep enhancing products, services, processes and structures in terms of inclusion and accessibility. As Vienna’s largest infrastructure service provider, it is the Wiener Stadtwerke Group’s responsibility to always focus on our customers and to offer products and services that are appropriate for their individual situations, and to do so in a way that is inclusive and accessible. Wiener Stadtwerke also takes this responsibility seriously within the Group itself. This is clear from the staff development initiative, which provides various training sessions, seminars and courses for managers and employees, including as part of specific mentoring programmes. Targeted measures are also taken within the Group’s apprenticeship management processes. A strong focus is also placed on hiring people with disabilities, including by collaborating with external organisations and establishments. With a view to the future, the aim of diversity, inclusion and accessibility is to permanently make Wiener Stadtwerke a more inclusive company.
As a state-owned company, the Wiener Stadtwerke Group has a duty to uphold the values of integrity, reliability, transparency and a sense of responsibility. With this in mind, a Group-wide compliance management system (CMS) was implemented several years ago. The CMS is evaluated at regular intervals by the Chief Compliance Officer in consultation with the compliance officers of the Group companies, and is constantly developed and improved. The system is also subject to regular independent audits of its effectiveness. The Management Board and Supervisory Board receive written compliance reports, as well as verbal reports on a case-by-case basis as required. A Group-wide whistleblowing system that meets all of the legal requirements has been set up, and it is used by employees, customers and suppliers. In the 2022 financial year, a standardised risk assessment was carried out across the Group and risk reduction measures were implemented based on the risks identified. Employees also received faceto-face and online training across the Group. Fine-tuning of the CMS was also a focus of activities during the reporting period. Compliance with the statutory regulations relevant to the Group is monitored and controlled by the compliance function in cooperation with other relevant departments.
To ensure the proper functioning of the services provided to a large city like Vienna with all its inhabitants, a reliable and resilient infrastructure service provider is needed that can face the challenges of the future and offer solutions so that Vienna continues to be the world’s most liveable city.
The Wiener Stadtwerke Group acts in a user-centric manner, addresses a wide range of ecological and social challenges as a corporate group focused on climate protection, and acts in an economic, responsible and future-focused manner. We see innovation as the key to the future.
In 2022, the Group-wide innovation strategy was honed to provide orientation for the Wiener Stadtwerke Group’s innovation activities and projects. The dedicated and skilled employees of Wiener Stadtwerke in particular are seen as factors for success and are at the heart of our innovation strategy. By working together and pooling strengths, combined with an open learning culture within the Group, new solutions are sought out and tried out in a structured way, and meaningful and forward-looking offerings are made a reality. In this way, visible incentives are implemented for a climate-friendly and liveable society, both in Vienna and beyond. The Group is forward-looking. It researches and works on new topics and technologies, taking the form of augmented reality, blockchain, 3D printing, renewable energies, the internet of things, hydrogen, self-driving vehicles, climate protection, robotics, drones, smart grids/smart meters, platform, data analytics, energy storage and resource efficiency.
Launched in 2012, Wiener Stadtwerke’s innovation fund (FTI fund for short) aims to support and accelerate innovative and/or research-intensive projects, as well as providing start-up financing. In 2022, it was endowed with a total of EUR 3.5m, with a total of 26 project proposals being approved for (partial) funding.
In 2022, Wiener Stadtwerke was once again a partner of the Smart City Summit run by the City of Vienna, which took place at the end of May as part of the ViennaUP festival. At the Smart City Summit, everything revolved around the question of how cities can remain liveable into the future. Participants from more than 40 nations took part. The Wiener Stadtwerke Group was actively involved in the programme and was able to present projects and initiatives such as the Climate Lab, Wien Mobil, hydrogen, and the think tank to the international audience. Group companies were also represented at the Vienna Science Festival at Vienna City Hall at the end of September and were able to offer participants the chance to touch and try out research projects and innovations.
With University Meets Industry (uniMind), the University of Vienna has created a forum for lifelong learning through which a closer network between companies and the University of Vienna will be established. uniMind aims to encourage companies to enter into dialogue with the University of Vienna and to exchange views on current issues from the areas of science and practical applications. Wiener Stadtwerke acts as a promoter of this research and knowledge partnership. Interactive workshops and lectures were held under the umbrella theme “Society of Transformation”, one of which was hosted by Wiener Stadtwerke.
The innovative strength of the Wiener Stadtwerke Group was also certified by external parties in the past year and the Group companies received a whole host of awards for innovative projects. At the Iceberg Award, which was presented as part of the Austrian Innovation Forum and honours particularly innovative projects, Wiener Linien and Wien Energie took second and third place respectively with their “Öffi Packerl” and “Energy Dog” projects. Wien Energie also won the MA² Innovation Award 2022 from the Austrian Association of Maintenance and Plant Management (Österreichische Vereinigung für Instandhaltung und Anlagenwirtschaft) for the “Energy Dog”. Wiener Linien won the eAward for digitalisation in apprenticeship training and workshops, specifically in the “Education and Social Affairs” category for virtual reality applications.
In order to provide Wiener Stadtwerke Group employees with a new, entertaining form of further education in the areas of innovation, Smart City, sustainability and trend scouting, a new type of e-learning course called “Digital learning journey – with our four stations through the Smart City of Vienna” was developed in 2022. Across four informative and interactive modules, employees enjoy a learning experience and learn more about the goals and projects behind the topics mentioned above.
In 2022, Wien Energie and Wiener Netze broke ground for the first green hydrogen generation plant. The Wiener Stadtwerke Group’s general goal is to be the first in Austria to map the complete hydrogen value chain – from production right through to distribution and use. The generation plant is being built on the Wiener Netze Campus and will be operated by Wien Energie in the future. Only electricity from renewable sources, such as solar, wind and water power, is used to generate the hydrogen. The plant will be the first of its kind and size to produce green hydrogen directly in Vienna using green electricity. The climate-neutral hydrogen will then be used by Wiener Linien as fuel for its buses. In 2022, the first hydrogen bus was tested in regular passenger service on the 39A route. By 2025, a total of ten hydrogen buses will be running on the 39A route between Heiligenstadt and Sievering.
Climate Lab, the new hub for climate innovations, was also opened in Vienna in 2022. Climate Lab is a joint initiative from Wien Energie, the Climate Ministry and other partners. Over an area of over 1,000 m², start-ups and public administrations will soon be able to work together with those from the science and civil society spheres on energy solutions for the future.
Despite the lower heat demand – and the resulting lower heat generation volume – thermal electricity generation is above the previous year’s level due to the higher clean spark spread. The non-consolidated subsidiary Wien Energie Bundesforste Biomasse Kraftwerk GmbH & Co KG generated 17.0% more electricity than in 2021 across more operating hours. Electricity generated from hydropower was slightly down on last year’s level. This was mainly influenced by unfavourable water conditions in 2022. Wind power output increased by 10.5% year-on-year due to the acquisition of three wind farms that were previously shareholdings. Solar output climbed by 19.4% year-on-year due to the commissioning of a large number of photovoltaic systems.
Total heating degrees were 11.1% down in 2022. District heating sales decreased as a result of higher temperatures.
The total transmission volume declined compared with the previous year. Grid transmission in 2021 was significantly influenced in the previous year by measures to contain the pandemic (lockdowns, working from home, closure of catering establishments, etc.). In the 2022 financial year, the easing of the measures imposed in response to the pandemic resulted in higher consumption by commercial businesses, although the increase was more than offset by declining consumption among household customers.
Passengers
Rounding differences not eliminated.
After the heavy losses in ticket revenues in previous years due to the Covid-19 pandemic, revenues recovered significantly in 2022 compared with the previous year. The number of short-term network passes in particular increased once more due to the rise in tourist flows in Vienna. After a decline in revenue from annual passes due to the new KlimaTicket introduced in 2021, an increase was recorded again in 2022 with 775,000 annual passes (2021: 758,000). The number of annual pass holders also includes 136,000 annual passes for seniors. In addition, there are almost 153,000 KlimaTickets (2021: 101,000), with the
The natural gas volume conveyed to Wien Energie power stations and to boilers and waste (EfW) plants is mainly determined by Wien Energie’s power plant deployment plan. The volume conveyed to third parties (predominantly tariff customers) is below the planning assumptions mainly due to the mild weather in October to December 2022 and the significant increase in energy prices.
KlimaTicket Österreich accounting for 125,000 (2021: 85,000) and the VOR KlimaTicket MetropolRegion accounting for 28,000 (2021: 16,000). Overall, annual passes (including KlimaTickets) have seen an increase of around 8% compared with the previous year. The number of passengers rose by 25.3% year-on-year, recovering significantly after the pandemic receded.
Seat kilometres decreased by 0.4% compared with the previous year. In total, 21,287.8m seat kilometres were recorded.
The Covid-19 pandemic changed the mobility trends of Vienna’s citizens. People are once again walking more, and working from home has become established as part of office culture, which is also reflected in the annual modal split surveys. As in the previous year, in 2022 most of Vienna’s citizens decided to walk (35%) and one-third (30%) travelled by public transport.
Bestattung Wien GmbH’s “main case” service category –burials and cremations – registered a year-on-year increase of 280 ceremonies or 3.8% to 7,663 (previous year: 7,383). The main reason for this is the merger of Bestattung Pax GmbH in April with retroactive effect from January 1, 2022. The company carried out a total of 562 burials and cremations in 2021. The number of service packages provided on behalf of third-party funeral directors dropped by 704 or 24.14% to 2,212 (previous year: 2,916) for the same reason.
Compared with the previous year, there was especially a decrease in coffin burials at the cemeteries managed by Friedhöfe Wien GmbH. In the performance data, the number of grave tenure renewals once again decreased year-on-year by around 2.36% (previous year: -1.96%). In December in particular, the number of orders was very low and it is assumed that there will be a stronger shift to the following year. In May 2022, the Krematorium Wien profit centre was transferred from BFW Bestattungsservice Wien GmbH to Friedhöfe Wien GmbH with retroactive effect from 1 December 2022.
The increase in parking spaces resulted from three new leasehold sites. In March, the Schrödingerplatz car park was added to Wipark’s car park portfolio. This was followed by two more locations in September (TU Science Center OF/ Arsenal; TU Campus Gußhaus). The number of parking spaces in own car parks fell slightly as parking spaces were widened with the redevelopment of Windmühlgasse, meaning that fewer total spaces are available than before.
The average number short-stay parking transactions per month is correlated to short-stay parking income. The increase in short-stay parking transactions is reflected in the entire car park portfolio. The number of long-stay parkers is also above the previous year’s figure. Due to the increase in long-stay parkers over and above the expansion of parking spaces, there is a higher average utilisation of the car parks by long-stay parkers on the reporting date of 31 December 2022.
* Adjustment for one-off or rare expenses and income.
** In addition to adjusted EBITDA effects, adjusted for effects of impairment tests and other one-off or rare financial expenses and income.
Compared with the previous year, recorded revenue increased significantly. This is down to the hedging transactions of the high-efficiency combined heat and power (CHP) plants in order to be able to guarantee price security. On the one hand, a sharp rise in prices on the energy markets in the reporting period led to significantly higher revenues at Wien Energie from the marketing of electricity products, while on the other, this also led to a much higher cost of materials, especially for gas. Furthermore, the increase in market prices also led to higher revenues in the heating and cooling sales segment.
Wiener Netze’s revenue in its role as system operator is calculated in line with regulatory requirements. The improvement on the previous year primarily results from a higher recognition of capex (capital expenditure) costs and higher recognised costs relating to the regulatory deferral account.
Compared with the previous year, ticket revenues continued to recover in 2022 in almost all of Wiener Linien’s ticket categories. Above all, the growing number of passengers and the year-round impact of the KlimaTicket Österreich and VOR KlimaTicket MetropolRegion led to rising revenues.
Higher revenues from the transport services agreement – in particular due to indexation – and higher revenues from train services led to an 11% increase in revenues compared with the previous year. On the other hand, an allocation to provisions for a possible future revenue refund in the 2025 business year had a negative effect on revenues. As a result, despite an increase in revenues in real terms, a 1.7% drop in revenues is reported.
Wiener Lokalbahnen Cargo GmbH recorded decreased revenue compared with the previous year. While revenue from cargo traffic fell, revenue from logistics routes increased.
The revenues of Wiener Lokalbahnen Verkehrsdienste GmbH reflect the improvement in all areas in terms of the number of orders compared with the previous year. In addition, a new contract was taken on in bus operations in September 2022.
Revenue is largely dependent on the mortality rate in Vienna and the position of competitors in the city’s funeral industry. Income from the reversal of accrued grave charges was higher in 2022. Revenue from burials, stonemasonry and gardening is lower because the number of burials fell by -243 (previous year: +163).
Revenue essentially comprises income from the parking business. The 2022 financial year showed significant growth in short-stay parking. Short-stay parking revenue in 2022 was around 48% higher than the previous year and around 15% higher than the pre-crisis year of 2019. Long-stay parking revenue also increased compared to the previous year. The increase can mainly be attributed to the car parks in Neu Leopoldau. The Vienna-wide introduction of the short-stay parking zone in March 2022 has led to growth, especially in the Siebenhirten and Liesing park-and-ride car parks.
The cost of materials increased significantly compared to the previous year. The main reason for this was higher purchasing costs for gas due to the exorbitant price increases on the markets. The management of the energy portfolio led to higher material costs in contrast to revenue. Furthermore, there are higher costs for CO2 emission allowances.
Personnel expenses developed in line with pay increases, adjustments in line with collective wage agreements, expenses resulting from employee benefit provisions, and developments in the number of employees.
Due to several offsetting effects, other operating expenses remained constant compared to the previous year.
The result from companies accounted for using the equity method is mainly driven by the result of Wien Energie Vertrieb GmbH & Co KG. This deteriorates due to provisioning requirements and higher purchase prices, as any price fluctuations can only be passed on to end customers to a limited extent and with a time lag.
The Group posted an operating profit of EUR 489.4m in 2022, compared with EUR 282.9m in the previous year. The improved result in the financial year is mainly due to the energy market-related income from the production sector.
Higher interest expenses in the course of increased capital requirements and higher interest rates led primarily to a deterioration of the financial result. Valuation effects also led to further deterioration. Higher dividends from Verbund and EVN shareholdings had a somewhat compensating effect.
The profit for the year adjusted for extraordinary effects increased mainly due to energy-related income. Material one-off expenses and income were adjusted, as were effects from asset valuation and the sale of property and land.
The Wiener Stadtwerke Group’s total assets fell by around 13% in 2022 to EUR 17,710.2m. As is to be expected for an infrastructure service provider like Wiener Stadtwerke, property, plant and equipment is the largest asset item; at the end of the reporting period this item amounted to EUR 11,131.4m, around +4.5% higher year-on-year (previous year: EUR 10,655.2m). Investment grants of EUR 6,380.9m (previous year: EUR 6,214.1m) were used to offset property, plant and equipment, thereby reducing the presentation in the statement of financial position. Property, plant and equipment represents approximately 27% of total assets.
The carrying amount for investments accounted for using the equity method decreased by EUR 855.9m. This is mainly due to the negative valuation effects from the joint ventures Wien Energie Vertrieb GmbH & Co KG and Energie-Allianz Austria GmbH.
For non-current financial assets, the decrease results primarily from the valuation of the stakes in EVN and Verbund. Both securities decreased in value compared with the previous year. Under other non-current assets, there was an increase in the claim to reimbursement for the plan assets.
Other current financial assets and current financial liabilities decreased significantly due to the offsetting of electricity and gas derivatives (see note 11.5 to the consolidated financial statements). In 2021, the cause of high liquidity requirements and financial statement expansion was the significantly higher initial and variation margins (collateral) that were due for payment. In the 2022 financial year, this accounting effect is significantly less pronounced due to offsetting; the liquidity requirements due to margin payments remain.
The equity of the Wiener Stadtwerke Group, which is wholly owned by the City of Vienna, increased by +1.8% in the 2022 financial year. The improvement is mainly due to the net income for the financial year. Partially offsetting valuation effects in other comprehensive income subdue the positive effect of net income on equity.
Employee benefit provisions were EUR 3,800.5m, or approximately 21.5% of total assets, down by -25.6% on the previous year. The decrease is mainly due to increased discount rates. The majority of the provisions are for pension obligations. Under the Wiener Stadtwerke – Zuweisungsgesetz (Vienna Public Enterprises Secondment Act), the Group must reimburse Vienna City Council in full for the pension expenses incurred for employees assigned by it to Wiener Stadtwerke, with the exception of Wiener Linien staff. This gives rise to an indirect pension obligation on the part of the Group.
In terms of current financial liabilities, in addition to existing long-term financing, short-term loans or advances of EUR 1,825.4m were taken out with various credit institutions in the 2022 financial year as a result of increased liquidity requirements due to the turbulence on the energy markets and the associated obligation to make payments for margin calls. As described above, this effect is overcompensated by the net presentation in the area of electricity and gas derivatives.
In 2022, the Wiener Stadtwerke Group invested a total of EUR 1,283.7m, of which EUR 1,039.1m or 80.9% was spent on property, plant and equipment and a further 13.8% was spent on financial assets.
In 2022, the capex ratio fell by -3.9 percentage points compared with the previous year. Although the total investments in fixed assets rose by around 35%, the capex ratio declined due to significantly higher sales. During the year, more than 88.8% of investments in fixed assets were used for environmentally friendly projects.
Investments in intangible fixed assets were at the previous year’s level and mainly comprised investments in software developments and in rights of use assets for telecommunications networks. At around 74%, the majority of total investments was in property, plant and equipment. The increase in investments in property, plant and equipment compared to 2021 is due to the expansion of renewable energy generation plants (especially photovoltaic plants, wind and renewable heat) as well as investments in district heating and cooling plants and in existing plants.
Investments in property, plant and equipment were primarily directed to the electricity, gas and heating and administration departments. Investments in financial assets principally pertain to the research and development company Aspern Smart City Research.
During the reporting period, about 55% of total investment (excluding financial assets) was accounted for by expansion of the underground network. The current financial structure is based on the public transport services agreement between the City of Vienna and Wiener Linien GmbH & Co KG, which came into effect on 1 January 2017. Under these arrangements, investment finance takes the form of capital grants, and the remainder of the money required for operations is covered by compensation from the City of Vienna to the company for its public service obligations. The capital grants include amounts received by the City of Vienna from the Austrian federal government as subsidies for underground construction projects and as allocations for investment in public transport (Section 20 Finanzausgleichsgesetz [Austrian Fiscal Equalisation Act]). In addition, income from payroll taxes is transferred to the company in the form of capital grants for underground line construction.
At Wiener Lokalbahnen, in addition to investments in SAP S/4HANA, software enhancements such as easymobil were also purchased. Under property, plant and equipment, investments were made in the TW400 air-conditioning system and in the new TW500. There were also major construction projects such as track construction, the Maria Enzersdorf stop, the Leesdorf depot and the Traiskirchen electronic signalling control centre.
In addition to the usual replacement and renewal measures for property, plant and equipment of all companies in the division, investments were also made in projects under development in 2022. These include the further development of online burials, the Dispo app for the Bestattung Wien vehicle fleet, extensions of the IT infrastructure for the brands Pax and BABA, and various licence and model rights for museum and shop activities. In cemeteries, the focus was on replacing the old gardening software GAM with the new software FLORA. In property, plant and equipment, the largest investments went into the completion of the new cold room and an autopsy unit for the Sigmund Freud University at Vienna’s Central Cemetery.
In 2022, investment increased year-on-year. In the area of property, plant and equipment, the general renovation of the Windmühlgasse and Freyung car parks are particularly noteworthy. Other investments included the replacement of the lift in the Stiftgasse car park, the expansion of number plate recognition and door readers, and conversions to LED lighting. Preparatory work was also carried out for the general renovation of Parkring. Software costs for Wiener Stadtwerke’s Group-wide SAP S/4HANA project are reflected under intangible fixed assets.
This item includes eliminations of intra-Group investments.
Cash flow before changes in working capital was higher year-on-year, as cash accounted for a larger proportion of operating profit. The developments in working capital in 2022 resulted a net cash outflows, which primarily resulted from the change in financial receivables from Wien Energie Vertrieb GmbH & Co KG, from the change in the margins to be paid at Wien Energie GmbH and from the increase in inventories at Wien Energie GmbH.
This resulted in a negative net cash inflow from operating activities totalling EUR -319.0m.
The net cash flows from investing activities were the result of substantial investment by Wiener Stadtwerke. The Wiener Stadtwerke Group predominantly finances its investments in property, plant and equipment from government investment grants, which mostly go to the Transport division. These investment grants are reported under cash flows from investing activities, and have the effect of reducing cash outflows from investment activities.
The cash flow from financing activities mainly shows the cash inflow from short-term borrowings due to the situation in the energy industry and the associated effects on the liquidity situation in the energy sector. These were partially offset by outflows connected with financial liabilities and lease liabilities as well as dividend payments to the City of Vienna.
Wien Energie’s need for cash and cash equivalents to cover margins to settle energy trading transactions on the energy exchanges rose exorbitantly at short notice and in a manner that would have been impossible to predict on “Black Friday”, 26 August 2022, due to the unprecedented, unpredictable price fluctuations on the energy markets. In order to (further) ensure security of supply and in the absence of any EU-wide or national government protective mechanisms for the energy sector in Austria, Wien Energie was provided, via its Group parent company, with cash and cash equivalents of the City of Vienna totalling EUR 1.4bn (these funds had been repaid in full by the end of 2022) and, as a precautionary measure, with a temporary financing framework provided by the federal government through the Austrian Treasury (OeBFA) in the amount of EUR 2.0bn (which has not been utilised to date49). 50 In the trading days that followed 26 August 2022, the situation on the energy exchanges eased again. In particular, the price correlation for gas and electricity also returned to normal. This resulted in the repayment of the margins to Wien Energie and, as a result, also in an easing of the liquidity situation.
Wien Energie takes a forward-looking approach and sells electricity from power plants up to two years in advance, while purchasing electricity and gas on a long-term basis for customers and for production in gas-fired power plants on the exchange. This allows the company to protect itself against future fluctuations in electricity prices and puts it in a better position to plan energy prices for the next few years for its customers and for power plant sales. In addition to forward transactions, short-term purchases and sales are also executed on the spot market to give the company the flexibility it needs to respond to changing conditions (e.g. outside temperature, no wind, changes in customer structure and behaviour, etc.) and to be able to meet current electricity requirements precisely.
When it comes to implementing their procurement and marketing strategies, energy utilities companies like Wien Energie operate in a triangle of market risk, credit risk and liquidity risk.
Market risk is influenced by price fluctuations on the spot markets, which are highly volatile by nature. Price fluctuations occur on these markets at peak times in particular. These can be difficult to predict on the one hand, and exorbitant on the other. Given the circumstances, it is not practical to plan the future costs of production and, as a result, reasonable tariffs for customers in the medium to long term.
The credit risk generally arises in bilateral trade with other providers (e.g. energy utilities companies) due to the default risks associated with the trading partners. In Austria, for example, a large number of smaller providers have left the market due to payment difficulties; in September 2022, one of Germany’s largest energy suppliers had to be nationalised.
Liquidity risk arises when derivatives are traded on the stock market and is reflected in (fluctuating) margins. The necessary margins are due as deposits or repayments upon execution and settlement of the transaction and the daily volatility and correlation changes (initial margin), as well as daily in the event of price changes (variation margin). These payment flows are not recognised in the income statement of Wien Energie, as they are repaid (at the latest when the transaction is settled). This means that the risk relates to the ability to raise liquidity for the margins and the associated liquidity reserves.
Wien Energie is committed to reducing market price risk in order to secure prices for its customers and for sales of the energy produced in the long term. As a result, the company relies on trading products on the stock exchange, meaning that it pursues an extremely low-risk strategy in terms of counterparty and credit risk.
On Friday 26 August 2022, the energy markets were hit by unprecedented and unpredictable price fluctuations. This was expressed first and foremost by exorbitant price increases on the energy markets. Electricity prices soared by around 32%, an increase of approximately 700% compared to the beginning of the year. In addition, the price movement that came out of nowhere that Friday was accompanied by a loss of correlation with the price of natural gas, which was significantly lower with an increase of about 7%.
49 As at 29 March 2023.For Wien Energie’s trading activities, these circumstances triggered an eruption in margins, which led to a high net deposit position. The margins that had to be deposited with the clearing house were provided. On that weekend of 27/28 August, it was impossible to assume a priori that prices would stabilise again soon or that, as actually turned out to be the case in the course of Monday, 29 August 2022, prices would drop from 1,015 EUR/MWh to around 791 EUR/MWh, triggering a margin repayment.
In order to adopt a commercially prudent approach, the company, not seeing any other alternative open to it, approached the federal government on the weekend in question, not least due to the lack of any national government protective mechanism for the energy sector in Austria (protective mechanisms were already in place in a large number of other European countries – see also 1.3.3 Political and economic environment “EU-wide measures to reduce liquidity shortages for energy companies”) in order to bring about a protective measure. This resulted in the granting of a credit line by OeBFA (via the province/City of Vienna and Wiener Stadtwerke GmbH). As already mentioned, Wien Energie did not make use of this EUR 2.0bn safety net at any time51
Wien Energie took the events of 26 August 2022 as an opportunity to evaluate its internal processes and strategies. A number of renowned experts were consulted and external expert opinions were obtained from renowned agencies. The external energy, legal and financial experts PwC Advisory Services GmbH, Freshfields Bruckhaus Deringer Rechtsanwälte PartG mbB and Ithuba Capital AG were commissioned in accordance with their specialisation to examine the complex issues in a special audit launched by the Internal Audit Department of Wiener Stadtwerke GmbH so as to produce qualified results and assessments.
The results and findings of the experts are summarised below:
• No speculative transactions were identified. Stock exchange trading is used purely for hedging purposes.
• Margins are repaid after the trade has been settled.
• In order to reduce market price risk and, as a result, hedge prices for customers (which Wien Energie has taken intensive measures to achieve), either a credit or liquidity risk has to be entered into. In the case of credit
risk, the company has to expect a real (balance-sheet) loss, even including a total loss, in the event of default by a contractual partner. In the case of liquidity risk, the margin deposited with the exchange is returned upon delivery. Trading on the futures markets was, and is therefore currently, the only alternative for Wien Energie. A possible protective mechanism for energy companies (similar to those already in place in other countries) could have a positive impact on credit risk and enable more OTC contracts to be concluded.
• The assessment of the reporting obligations vis-à-vis OeBFA, not least a going concern forecast, did not reveal any contradictions or inconsistencies.
According to the expert opinions available, the market turbulence witnessed on 26 August 2022 was not foreseeable based on a state-of-the-art risk model with a 99.99% confidence interval 52 and even more active liquidity management would not have prevented the impact on the company. Recommendations for action and optimisation potential were evaluated on the basis of the experience gained and the changes in the overall conditions in the area of risk management and liquidity risk management and are being implemented to an appropriate extent.
The list of electricity forwards and futures in a year-on-year comparison shown in note 11.7 to the consolidated financial statements shows that 6,368,568.7 MWh (6,368.6 GWh) were hedged for 2022 as at 31 December 2021. The electricity forwards and futures served to hedge the company’s own production of 6,359.0 GWh in 2022 shown in the Management Report for the Group in chapter 2.1.1 and, on the other hand, the external electricity procurement rights of more than 300,000 MWh.
Sustainability is a task for all of society, spanning economic, ecological and social areas. The role that the Wiener Stadtwerke Group plays with regard to sustainability is one of particular importance. As the largest communal infrastructure service provider in Austria, we know that we are in a position to make a change. Sustainability is therefore a fundamental company value for us. Sustainability management has been functionally and organisationally anchored in the Group since 2004, and all Group entities are integrated into this management system in order to ensure that Group-wide sustainability goals are achieved.
Within the framework of the European Green Deal and the resulting Sustainable Finance Action Plan, a revision of the existing regulations regarding non-financial reporting is also planned. At the centre here is the new version of the directive for non-financial reporting, the Corporate Sustainability Reporting Directive (CSRD). As a large corporate group, the Wiener Stadtwerke Group will be affected by the CSRD from the 2025 financial year onwards. For this reason, in 2022 the Group launched a comprehensive, Group-wide project in order to meet the requirements of the Directive by no later than the date on which it comes into force. This requires an intensive examination of the issues that are important for the stakeholders and the Group, the creation of structures and responsibilities with a focus on ESG, including in the areas of risk management and reporting. As a result, sustainability with its many facets will be integrated even more strongly into corporate structures and processes, and sustainability activities will be reported in a transparent manner in accordance with the applicable standards. This sets the course for a Wiener Stadtwerke Group that will continue to be successful and responsible into the future.
The Wiener Stadtwerke Group is there for the people. We create products and services, living spaces, infrastructure, and supply and communications pathways for the metropolitan region and its citizens. In doing so, we align ourselves with our strong corporate values and we strive for more: more innovation, more service, more inclusion, more climate protection, a more sustainable future. This is realised in the Wiener Stadtwerke Group through concrete measures, high levels of investment and key future projects. In the area of ecological projects, for example, this includes the progressing U2xU5 public transport expansion, our photovoltaic offensive, the operation of the Waste2Value research facility, the construction of the most powerful large-scale heat pump in Central Europe, the starting signal for the first geothermal plant in Aspern, waste heat utilisation, greening, the opening of Climate Lab for climate innovations or the production of green hydrogen for mobility. In 2022, numerous measures were also implemented in the areas of accessibility and inclusion, equality and diversity, occupational health and safety, and new ways of working and further training.
In 2022, the Wiener Stadtwerke Climate Fund continued to support numerous smaller-scale measures introduced by Group companies to protect the environment and the climate. In total, 22 projects received a share of the Climate Fund’s EUR 1m endowment to help get their work off the ground.
Making a carbon-neutral construction site a reality at Wiener Linien
Buildings and construction account for around 40% of global CO2 emissions. Using this awareness, Wiener Linien has set itself the goal of making not only public transport but also network expansion environmentally fit for the future. With its carbon-neutral construction site, Wiener Linien is taking a pioneering role in climate protection. The following emission reduction measures were implemented to improve the carbon footprint of two pilot construction sites: dispensing with diesel power units, using green electricity, using construction equipment with electric drives (or equipment with the highest emission standards) and using recycled concrete.
The flat roof of the Wien Energie electric heating building has been used for urban farming since 2022. The roof areas are used for greenery and for raised beds for growing vegetables, fruit and herbs. Sustainability also means getting involved. That is why a garden team has overall responsibility for seed selection and garden maintenance. The areas are accessible to all employees with access rights at the Spittelau plant, meaning that during a stressful working day they can go there to take a deep breath of fresh air in the seating areas.
The Climate Pioneers Contest 2022 has impressively shown that climate protection in the Wiener Stadtwerke Group is not just the responsibility of a few people working on lighthouse projects. Quite the contrary: there’s a climate pioneer in all of us. Employees who are passionate about driving ground-breaking projects and initiatives were able to come together as teams to submit their projects for the contest, thus bringing their ideas into the limelight. A jury of experts and the Viennese population (as part of a media partnership with the daily newspaper HEUTE) chose the following three winners from 71 submissions, which were visible to all Viennese as a large-format street art mural in the underground network:
1st place: Waste2Value – from waste material to green fuel
2nd place: A Wiener Linien bee for every Viennese citizen
3rd place: Decarbonisation of the district heating network
Wien Energie secures climate-neutral energy for Vienna. As Austria’s largest regional energy supplier, Wien Energie has a major part to play in climate reversal. The company has a code of conduct that holds both it and its more than 2,000 employees to exacting social and ethical standards. Wien Energie strives to actively protect the climate and to put measures in place to ensure that Vienna remains the world’s most liveable city. In this undertaking, we are very much aware of the balancing of ecological, social and economic interests. Wien Energie is making significant contributions to decarbonising Vienna by 2040, and is investing a total of EUR 1.3bn in climate protection, supply security and the expansion of renewable energies in the period between 2023 and 2027.
Wien Energie is a key player in the City of Vienna’s goal to achieve climate neutrality by 2040 and to reduce greenhouse gas emissions. The decarbonisation study conducted in 2021 set out scenarios for how Vienna’s energy system could be decarbonised. In 2022, Wien Energie used the findings of this study to put together a detailed climate protection roadmap that contains specific actions and intermediate objectives for achieving climate neutrality within the company.
On the basis of the decarbonisation study, Wien Energie has defined seven fundamental action areas for making Vienna climate neutral. Significant investment and some amendments to the regulatory framework will be required if these goals are to be met. Wien Energie will implement the following measures for achieving net-zero emissions by 2040:
• Expanding the renewable electricity portfolio
• Providing sustainable, integrated and needs-based heating and cooling solutions by decarbonising district heating (including exploiting geothermal energy and expanding large-scale heat pumps), expanding decentralised heating solutions and extending highly efficient district cooling
• Identifying potential for environmentally friendly energy from waste (EfW) plants and opportunities to reuse captured carbon as part of the circular economy
• Expanding sustainable hydrogen production and the associated fuelling station infrastructure, and ensuring that the technological requirements are met for using green gases in Wien Energie’s power stations
•
Expanding the smart charging infrastructure for electromobility in the public sphere, in residential construction and for commercial customers
• Supporting collaborative innovation and research projects that focus on emissions reduction, with both start-ups and large businesses
• Continually implementing digitalisation and efficiencyimprovement projects in order to ensure that energy is used optimally in a way that saves resources
Wien Energie has also significantly expanded its use of renewable energies in 2022. The company commissioned 43 photovoltaic systems and eight wind power systems and increased electricity generation from hydropower through the further development of existing power plants and participations. The wind power and photovoltaic plants constructed in 2022 generate around 80,000 MWh of green electricity – equivalent to the annual electricity demand of over 40,000 of Vienna’s households.
In addition to drawing up the sustainability strategy with ambitious climate targets, Wien Energie also worked on several innovative and sustainable (lighthouse) projects in 2022. As a result, more climate-friendly heating and cooling solutions were expanded. The construction of the environmentally friendly Power-2-Heat plant in Spittelau was completed and the plant was successfully commissioned. The plant converts excess electricity from wind energy into heat. This means that useful energy can be used in a sensible way, the power grid is stabilised and thousands of homes can be supplied with climate-friendly heat.
Wien Energie continued to work on the utilisation of sustainable deep geothermal energy in Vienna after its research activities were completed in 2022. Specifically, after thorough preparation and close examination of all factors, the decision was made to press ahead with the development of the first pilot plant. This pilot plant is the first major milestone for the rapid further expansion of deep geothermal energy in Vienna and could be commissioned in 2026 if the timetables are met and the drilling work is successful. In 2022, Vienna’s first climate protection neighbourhood, the “Village im Dritten”, was also developed. By 2026, the largest “cold district heating network” or “anergy network” in Austria will be built here. The technology here is a technical variant of a heat supply network that operates with low transmission temperatures
close to the ambient temperature and therefore both heating and cooling can be provided. With the help of around 500 ground-source heat pumps, multiple heat pumps and district heating for hot water supply, residential buildings and even schools and commercial premises will be supplied with environmentally friendly heating and cooling.
Great progress was made in the area of renewable hydrogen in 2022. Wien Energie announced that hydrogen would be used for the first time in the Donaustadt power plant in 2023. Specifically, hydrogen mixed with natural gas at a ratio of 15% is being tested in this operational trial. This is the world’s first hydrogen operational trial in an existing power plant of this turbine size.
Furthermore, Wien Energie and Wiener Netze are jointly constructing Vienna’s first hydrogen generation plant at the Wiener Netze Campus in Vienna-Simmering, with construction due to be complete in 2023. Around EUR 10m is being invested in the construction. The pioneering electrolysis plant will be the first of its kind and size to produce green hydrogen directly in Vienna. From summer 2023, up to 1,300 kilograms of green hydrogen will be produced every day; this daily volume is enough to fuel around 60 buses or lorries. The first industrial partners will also be supplied with green hydrogen from the plant.
Wien Energie further expanded its charging station network in 2022. Over 11 GWh of electricity was used for charging at the now more than 2,000 publicly accessible charging points, saving around 8.9 kt of CO2 equivalents in road traffic. What is more, Wien Energie released the new Wien Energie Tanke 2.0 app in November 2022. The app navigates users to the next free charging station and also offers a practical overview of the current charging status and all costs. In 2022, Wien Energie also provided further support to the research project on intelligent charging management by the Technology and Research Centre Wieselburg-Land.
As part of Wiener Stadtwerke’s sustainability principles, Wiener Netze sets out sustainability measures and targets on a yearly basis, and these are summarised in the sustainability programme. Sustainability and the continuous monitoring and improvement of environmental performance across all business operations, in accordance with the ISO 14001 environmental management system, are integral to Wiener Netze’s corporate strategy, as is the embedding of sustainability in its values. This commitment to responsible behaviour towards humankind, resources and the environment is reflected in decisions such as a resource-efficient mobility concept and the far-sighted planning of Vienna’s power grid to prepare it for the energy transformation.
The expansion of the electric vehicle fleet was given a boost in 2022, being extended to the commercial vehicle sector. This relates both to Wiener Netze’s own vehicles and the vehicle fleets of the Wiener Stadtwerke Group companies, which are managed by Wiener Netze. Wiener Netze is also highly integrated in the implementation of hydrogen infrastructure, which is essential to the pioneering and innovative upgrade of Wiener Linien.
The measures developed for the improvement of energy efficiency and the broadening of the expansion of renewable energy were also implemented again in 2022. Noticeable efficiency gains were achieved by replacing the burners and boilers for the process heat and carrying out further conversions to LED lighting systems. Replacing process pumps with highly efficient pumps reduced the amount of electricity required for the circulation in the heating system. At the same time, potential areas for photovoltaics were identified at all Wiener Netze sites, thereby ensuring continued swift expansion in line with the Smart City Vienna Framework Strategy. Here, PV generation capacities were increased to 952.4 kWp. In future, excess current peaks will also be used for hydrogen production or as a renewable form of energy for operational processes. Both the production of electricity at the sites and the purchasing of electricity are exclusively from renewable energy sources and are therefore carbon neutral. Wiener Netze’s detailed carbon and energy footprint can be used in the future to record
and evaluate further measures for the gradual reduction of CO2 emissions.
The EU’s climate protection goals have been significantly accelerated under the Green Deal: greenhouse gases are to be reduced by 50–55% by 2030. Because 80% of the European population lives in cities and 75% of the energy is used in cities, urban areas bear the prime responsibility for attaining climate protection targets. Reworking the Smart City Vienna Framework Strategy in 2019 in partnership with Wiener Netze saw the City of Vienna’s targets realigned to the international 2005 baseline for comparability. The strategy formulates specific targets for 2030 (50% reduction in per capita carbon emissions, 30% drop in local energy use, 30% share for renewables) and 2050 (85% reduction in per capita carbon emissions, 50% drop in local energy use, 70% share for renewables). Similar targets are in place for per capita material consumption footprint and the transport sector. Various energy efficiency and material reduction projects at Wiener Netze are dedicated to reaching these targets.
With some 4,200 construction projects per year across the entire area of supply, sustainability also requires good planning and coordination with the City of Vienna, its municipal departments and the authorities. Collaborating closely means that a large number of unnecessary excavations can be prevented. If all companies coordinate themselves more efficiently when it comes to construction activities on public roads, then works on underground cables, channels and pipes, and also on the rail network, can be optimised and ultimately reduced. The use of trenches for working on numerous supply lines offers considerable benefits. Wiener Netze also uses state-of-theart installation technology. By relining the natural gas network (via a pipe-in-pipe solution) and applying floating cable installation techniques in the power grid, where a cable is inserted into the existing empty piping, Wiener Netze is reducing the volume of excavations by 90% compared to usual levels. This results in a reduction in transport volumes, lorry journeys and the emission of CO2 and other pollutants.
Wiener Linien’s sustainability management department coordinates all environmental and sustainability measures and is responsible for the corresponding sustainability reporting. The implementation of the Corporate Sustainability Reporting Directive (CSRD) is coordinated by the corporate controlling and sustainability management functions. With the electric and hydrogen bus concept or the activities grouped under the umbrella brand WienMobil, to name just a couple, the topics of environment and sustainability have long been an essential part of the core business. But sustainability is also firmly anchored at Wiener Linien by means of the following projects:
Underground train construction is climate protection: The U2xU5 intersection project will ensure faster connections and create more space for more passengers. This makes the construction project the largest climate protection and infrastructure project in Vienna. However, an important goal for Wiener Linien is also to ensure that its construction sites are set up in a CO2-optimised way. Within the framework of a challenge of the IÖB (innovative public procurement), Wiener Linien looked for innovative solutions to help improve the carbon footprint of construction sites in urban areas. A total of 16 solutions were submitted by various companies, with five solutions now being pursued by Wiener Linien.
The topic of circular economy also plays an essential role at Wiener Linien. Several projects are underway to evaluate the possibilities for implementing a circular economy. At the same time, work is being done to improve resource efficiency for Wiener Linien. In addition, both the ecological advantages and the economic costs are being assessed, for instance within the framework of the project on the use of recycled construction materials in the Wiener Linien superstructure.
We also consistently strive to keep our environmental impact as low as possible when putting infrastructure into place, in compliance with legal requirements. The solar power strategy was launched in collaboration with Wien Energie back in 2021. The strategy enabled the companies to identify 20 roof spaces on underground stations and training workshops that can be fitted with solar power stations by 2025. In 2022, three systems were commissioned at the Alte Donau and Ottakring stations and at the main workshop. These systems produce 740 MWh of solar power per year and supply the surrounding stations with climate-friendly energy.
The brake energy project has also contributed to improving energy efficiency. Whereas the project described above uses solar energy, the brake energy project feeds brake energy from underground trains into the internal A/C network or makes it available to approaching trains. In 2022, a new braking energy system was added at the U1 station Vorgartenstraße.
All activities and measures by Wiener Linien concerning the topic of the environment and sustainability are bundled under the motto “Greener Linien” (“Greener Tracks”). This motto communicates both the significance of public transport as a way of protecting the climate and the fact that every passenger contributes to climate protection. As another motto goes: “Öffis nützen – Klima schützen!” (“Protect the Climate – Use Public Transport!”).
At Wiener Lokalbahnen, a first station was fitted with a photovoltaic system. This project was primarily about retrofitting photovoltaic modules onto an existing glass roof. Another highlight is the electric scooter-based factory transport. In order to reduce car journeys on the almost two-kilometre long site and to make it easier for all employees to access services such as the canteen – among many other benefits – fixed electric scooter stations were set up across the entire site, which can be easily booked using an app.
For decades, Bestattung Wien GmbH has been using electric hearses in order to avoid disturbing the peace during funerals. The rest of the fleet is also being gradually converted to low-emission vehicles.
Since November 2022, Bestattung Wien GmbH has been using the sustainable mushroom coffin from the start-up Loop Biotech. The coffin, made from mushrooms, biodegrades in 45 days and is able to transform the human body and the toxins it contains into vital nutrients for the soil.
The environmental focuses for Friedhöfe Wien GmbH are biodiversity and climate protection/microclimates. Cemeteries can be a big help to the urban microclimate by acting as part of fresh air corridors and cold air source areas, as well as by offering a refuge for flora and fauna in urban areas. For example, deer, badgers, hamsters, owls, bats and many bee colonies live in Vienna’s Central Cemetery.
A number of landscape gardening measures have been taken at the cemetery in Neustift to enlarge animal habitats. There are tracts that cater to the needs of bats, reptiles, songbirds and butterflies. This area has been made more visible and appealing as a nature trail since 2019.
Vienna’s Central Cemetery contains some 120,000 m² of natural meadows. Across all of the city’s cemeteries, the natural meadows cover an area of 135,000 m². Bee colonies have already been successfully established at a number of cemeteries, such as the Central Cemetery and the Neustift, Südwest, Stammersdorf/Zentral and Hietzing cemeteries.
Water and energy consumption are still major topics at Vienna’s cemeteries. The expansion of wastewater systems has been completed following an initial review of the options available. Inzersdorf was the last cemetery to be equipped with a wastewater system. Smart meters were installed at the Simmering cemetery as part of a pilot project for the early detection of water losses due to burst pipes, for example. These have already started to be rolled out to other cemeteries.
The relevant environmental topics (water, waste, air and noise) were covered in the “Gemeinsam.SORGSAM.” (“Taking Care – TOGETHER”) communication campaign, which was publicised at the cemeteries in April 2020. On park benches and bins and at taps and organic waste collection points, signs call upon all visitors and tradespeople to remember their active contribution to protecting the environment within the cemeteries – specifically regarding waste, water and noise. In 2021, a number of small actions that have big impacts were implemented. These included the Friedhöfe Wien gardening team transitioning to refillable, glass candle holders and having tree cuttings and green waste from all 46 cemeteries transported to Municipal Department 48 for conversion into compost and bark mulch. As early as 2020, the cemetery management regulations were revised to include provisions to reduce works that create a lot of noise. Electric vehicles have long been used to avoid disturbing the peace of the cemeteries. These vehicles are both energy-efficient and emission-free. Furthermore, the switch to battery-powered gardening tools was continued.
The past few years have been shaped by even better modal splits between public transport and private motor vehicles. Park-and-ride systems and the construction of cheaper collective residential car parks in urban development areas ensure that the largest amount of above-ground space possible can be allocated for various uses. In this way, these car parks help to alleviate the burden on public space and free up outdoor spaces for green areas, playgrounds and pedestrianised zones.
For Wipark, the topic of electromobility is also a major aspect of sustainability and the environment. Electric vehicles already play a significant role in the personal transport market, and this is set to expand in future, particularly in large cities. Over 239 charging points in its car parks in Vienna demonstrate Wipark’s commitment to promoting sustainable vehicle ownership. The charging infrastructure for long-stay parkers is also being expanded on an ongoing basis. We are collaborating with Wien Energie to gradually refurbish the oldest charging infrastructures.
A total of six photovoltaic systems are operated in cooperation with Wien Energie. The systems installed were four rooftop photovoltaic systems on plots S & Q at the Leopoldau site, one photovoltaic carport at the Neulaa site, and one façade photovoltaic system at the Westbahnhof site.
In recent years, rising demand has been seen for bicycle storage facilities in car parks. In cooperation with our customers, projects are continuously evaluated and checked for implementation.
The Wiener Stadtwerke Group has a comprehensive risk management process and all corporate entities and Group companies are included in this process. The risk management process follows the internationally accepted framework of the Committee of Sponsoring Organizations of the Treadway Commission (COSO) and the ÖNORM ISO 31000.
The aim of risk management is to identify risks at an early stage, to analyse and assess these risks and, by implementing appropriate measures, to support the achievement of corporate objectives. In accordance with standard risk management principles, risks are identified, assessed, monitored and documented in a Group-wide risk management system, taking the entire context into account.
Risk identification and assessment: Risks are defined as potential deviations from targeted figures in relation to specific indicators, with the most important being the profit for the year, the net cash flow and the equity ratio. Every identified risk is assigned to a person who is responsible for assessing, managing and monitoring that risk. Scenarios are used to describe risks when these are analysed and assessed. They are then quantified as broadly as possible on the basis of the potential impact and probability of occurrence. At the same time, the possible opportunities (positive deviations from target figures) are assessed.
Risks that cannot be quantified are listed as qualitative risks. Quantitative and qualitative risks are both documented in the same risk management software.
Risk reporting: A workflow-based risk management tool that employs integrated risk management methodology is used to aggregate the overall risk position of the Wiener Stadtwerke Group. Additionally, general risk management guidelines are discussed and decided upon within a risk management committee. The risk management committee is made up of risk controllers from the Group Management Board and the Group companies. The results of the Group-wide risk aggregation process are included in the quarterly risk management report. The Supervisory Board is regularly briefed on the risk management situation. Risk management plays a central role in economic and multiyear planning.
Establishing risk measures: Risk management involves establishing appropriate measures, with the aim of preventing or reducing risk or transferring it to third parties. To determine the appropriate measures, departments carry out cost-benefit analyses in order to review and implement these. Measures are monitored as part of the quarterly analysis process and are adapted to the new risk situation, if necessary.
Risk monitoring and control: The risk management process has been implemented in accordance with the internationally accepted COSO framework. Ongoing surveying, identification and assessment of the risks to which the Group is exposed lays the groundwork for the regular risk reporting. Furthermore, the concept, appropriateness and effectiveness of the risk management system are regularly evaluated, monitored and checked.
The Wiener Stadtwerke Group’s internal control system (ICS) encompasses all of the process-related monitoring measures across the various organisations. It ensures that the main risks associated with the relevant processes are systematically recorded and analysed, and minimised by carrying out periodic checks, and that the key documentation is kept and responsibilities are recorded transparently.
The Group’s Internal Audit department evaluates the execution of business processes, as well as the internal control, in accordance with an annual audit programme approved by the Management Board.
Group guidelines set the minimum standard for the ICS and define the roles and responsibilities within the ICS regulatory process. The ICS is decentrally organised within the Wiener Stadtwerke Group companies and falls under the responsibility of the management of the company in question.
The ICS stipulates that the management boards of the Group companies must ensure that there is transparent documentation and that the ICS is effective.
The duty to report to the various management boards and the Group ICS coordination function at regular intervals ensures that the ICS conforms to the standards. Continued refinement of the ICS is carried out in agreement with the Group companies and the risk management, compliance, IT security and crisis management functions.
Ongoing surveying, identification and assessment of the risks to which the Group is exposed lays the groundwork for the regular internal risk reporting. Reporting on quantitatively assessed risks is embedded in the financial reporting, which is performed by the management control function (integrated reporting).
For future movements in the Group companies’ key financial indicators, risk management processes aggregate the worst-case and best-case scenarios on the basis of the individual risk identified. These are presented in the control reporting.
An annual risk and opportunity review is carried out as part of the budget/actual comparison. This means that the original risk and opportunity assessments from the previous year, which were also the basis of the corporate planning, are compared with the actual values. The insights gained feed into the adjustment of the risk catalogue to changed circumstances. The updated risk catalogue is one of the cornerstones of business planning.
Discussion and coordination of the main opportunities and risks also form part of the annual business planning retreat at each Group company. The aim is to take an all-round view of the risks and opportunities that are to be expected in coming years, so as to take proper account of them in the corporate planning. This gives rise to action plans and closer monitoring of the budget items concerned.
Responsibility for ensuring adherence to the risk management process lies with the risk controllers at each Group company. These controllers report directly to management and the Group risk management function on an ongoing basis. The risk management function then reports to the Wiener Stadtwerke GmbH Management Board.
Compliance with the statutory regulations relevant to the Group is monitored and controlled. The reliability of the financial reporting is assured, as the accounting processes at Wiener Stadtwerke are governed by Group-wide directives and standards.
In the previous year, a tax control system (TCS) was also implemented in addition to the internal control system. The TCS refers to all measures (processes and process steps) that ensure that the taxation basis for each form of taxation is recorded in the correct amount and that any taxes due are paid on time and for the correct amount.
The structure and content of the TCS conform with the provisions of the Austrian Tax Control System Auditing Ordinance (SKS-Prüfungsverordnung) and the guidelines set out by the Austrian Chamber for Tax Consultants and Public Accountants (KWS) in relation to the drafting of an expert report on a tax control system pursuant to Sections 153b(4)(4) and 153f(5) of the Austrian Federal Tax Code (Bundesabgabenordnung – BAO) in its applicable version. The TCS is implemented in line with guidelines that are standardised across the Group and are set out in a Group directive.
The TCS is audited every three years by an external assessor. The last audit was completed by means of an expert report in June 2021.
The TCS helps to reduce the Group’s financial risks, finance-law risks, reputational risks and business risks.
The risk landscape for Wiener Stadtwerke is divided into seven risk groups. The most significant risks in these groups are as follows:
The Wiener Stadtwerke Group operates within the context of political and legal frameworks. These frameworks could change at short notice at any time and may change the wider context of strategic decisions and/or call the company’s strategic trajectory into question. These would include unexpected costs, unplanned cessation or postponement of projects, or being confronted with new strategic challenges that would have to be resolved.
In order to pre-empt these risks, the Group continually analyses the environment in which it finds itself. The Group Management Board and the Group companies also keep in regular contact with the relevant political contacts and regulatory organisations. This enables the Group Management Board to maintain a comprehensive overview, including of potential changes, and to adapt to circumstances as necessary.
Market risks include price and competition risk in retail markets. In various services sectors, but particularly in the areas of energy and mobility, it may be that the competitive situation intensifies and the pressure on performance and prices increases.
Wiener Stadtwerke counters these risks by developing new products and services, by maintaining an active, customercentred sales strategy and by entering into collaborative agreements.
The Group’s procurement activities take fluctuations in the prices of electricity, gas and CO2 into account. In the interests of professional risk management, the Wiener Stadtwerke Group manages these price risks by means of appropriate hedging transactions, such as derivative financial instruments. These include forwards, futures and swaps.
This risk class mainly deals with managing risks related to short-term and long-term financial investments. The primary focus is on the Group’s fiscal stability and, in particular, ensuring the Group’s liquidity.
To manage its short-term liquidity, the Group operates a Group-wide cash pooling arrangement, which helps to ensure that short-term resource requirements can be met at all times. A conservative approach is taken to long-term financial investments, in line with the pension fund regulations. These investments are managed by a separate asset management function within the Group’s management. This asset management function has a standing monthly meeting with the Management Board and the risk management function.
In the course of the events related to 26 August 2022, the Wiener Stadtwerke Group and Wien Energie were confronted with liquidity risks. The risk here was that payments of margin calls from hedging transactions would exceed Wien Energie’s financial possibilities in the short term. Details on risk management in this context are explained in Section 2.1.6.
The business processes that form the basis for these financial investments are audited once per year by an external certified accountant. Corresponding risk indicators are measured on a regular basis. Limits ensure that timely corrective measures can be taken.
Exposure to the default risk of banks, as indicated by their ratings, is curtailed by diversification based on set limits. Risks arising from the US lease transactions are kept under constant observation.
Investment risk encompasses all the risks arising from equity holdings, such as the risk of dividends being lower than expected and of a decline in the value of an investment. In order to pre-empt these risks, all investments are monitored on an ongoing basis. In the event of unexpected developments, the Group management will enter into direct dialogue with the concerned parties.
The Wiener Stadtwerke Group has extensive and, in some cases, complex plant installations at its disposal. The proper functioning of these installations may be impacted to a lesser or greater extent, depending on the circumstances. The extremely high reliability of technical infrastructure is critical to Wiener Stadtwerke’s business success. For this reason, this issue is of great importance in terms of risk management.
In order to minimise the risks, the Group and its corporate entities regularly carry out maintenance and investment programmes. In its day-to-day operations, the Group takes steps to ensure that it conforms to very high technical standards as well as precisely defined maintenance and quality checks. The Group has technical redundancies in place in the critical services sectors. The risks associated with plant and operational safety are also insured against by means of relevant insurance contracts.
Demographic changes mean that a company’s staff is increasingly becoming a critical performance indicator. Growing competition on the employment market may result in Wiener Stadtwerke being unable to fully meet its recruitment needs in terms of new talent and specialists, or being unable to meet these needs at all. For this reason, Wiener Stadtwerke is expediting its employer branding initiatives.
As a responsible employer, Wiener Stadtwerke places great importance on monitoring staff risks. These risks are managed by means of an employee development programme implemented Group-wide that incorporates a range of activities, such as performance reviews designed to optimise staff development and maximise employee satisfaction.
Having business processes that run smoothly across the Group is directly reliant on having a reliable IT system. If systems go down, whether in part or in full, this can significantly impact business processes.
The Group has its own, extremely capable IT function that ensures the technical stability of business processes and provides support for these. The function also applies a range of IT management techniques to ensure high IT availability. This includes a back-up computer centre that can immediately take over the necessary tasks in the event of an IT system failure.
The Group is exposed to a wide range of legal risks in the course of its business activities. These risks may lead to litigation that could in turn subject the Group to economic, operational or reputational damage.
The Group’s legal departments employ renowned experts who continuously deal with the key legal topics of relevance to the Group, the industry and the associated markets. They also develop policies for addressing any identified risks.
As a responsible business, Wiener Stadtwerke pays close attention to the topic of data protection. The data protection officers at the Group companies work with the relevant divisions to ensure that data protection breaches are avoided.
Furthermore, as at 31 December 2022 there were no identifiable risks for the Group management that, individually or in combination with other risks, could pose a threat to the equity ratio.
The Wiener Stadtwerke Group has a clear responsibility to society – its primary duty and greatest interest is to securely fulfil the supply mandate to the citizens of the City of Vienna and the surrounding area.
Beyond this mandate, the Group strives to make use of its entrepreneurial opportunities in the interests of Vienna’s citizens. In this way, the Group ensures its commercial stability and expands its room for manoeuvre in implementing the concepts that continue to enhance the quality of life of those living in Vienna’s metropolitan region and advance the achievement of climate neutrality by 2040.
The energy sector is still facing major changes due to technological developments (for example, use of green hydrogen, carbon capture), regulatory and political changes (including Russia’s war of aggression against Ukraine, tightening of European emissions trading) and current market developments (e.g. increased energy prices). In order to remain competitive in this changing environment, Wien Energie is seeking to strengthen its market position in worthwhile segments by enhancing its own competitive advantages. To this end, we are operationalising the conceived strategy for the heat transition and are continuing to invest in innovative neighbourhood solutions, while consistently decarbonising district heating, including through geothermal energy and the utilisation of
waste heat. We will rise to the challenge presented by the rising demand for green electricity by expanding renewable electricity generation in Austria and abroad. We are supporting the decarbonisation of the transport sector through the expansion of the charging infrastructure for electric vehicles and the construction of hydrogen fuelling stations for buses, lorries and other vehicles. Our generation of high-efficiency combined heat and power (CHP) plants will be taken further in the direction of climate neutrality through the gradual incorporation of green hydrogen as a substitute for natural gas. In addition, Wien Energie will make profitable use of the potential of the circular economy, especially in the areas of carbon capture and phosphorus recycling and through the Waste2Value research project.
People’s need for mobility is increasing. This will lead to more private cars on the roads, with the result that these may eventually be congested with traffic. This further increases the attractiveness of public transport.
When analysing opportunities for Wiener Linien around market development, political developments also play an essential role. Stricter measures, such as car-free zones in Vienna, would significantly change mobility trends among the residents of Vienna and the surrounding area and would make public transport more attractive. Although the paid parking zones in Vienna were extended in March 2022, it remains to be seen whether this measure will have a long-term effect on driving trends. This is also the case for the introduction of the CO2 tax. Conversely, the expansion of Wiener Linien (network extensions) – including investment in the new U2xU5 intersection and in Wien Mobil – brings with it the opportunity for additional passengers and revenues.
In fulfilling its corporate mission, Wiener Linien makes a significant contribution to environmental protection in the City of Vienna. With the current government agreement, the City of Vienna presented the Vienna Smart Climate City Strategy, which also covers mobility and positions Wiener Linien as a central player in its implementation. This has strengthened the role of Wiener Linien as a mobility hub and opens up opportunities for new innovative business models (including data management and city logistics as a solution to the “last mile” issue).
As a railway company, Wiener Lokalbahnen Cargo considers itself to have a vital role to play in the fight against climate change. A key option for reducing the emissions of freight traffic – particularly of road-based freight traffic – is to move this from the roads to the railways. Railways mostly transport cargo using electricity and in an energy-efficient manner. The higher the proportion of renewable energies in the mix (and the trend is certainly moving in this direction), the more climate-friendly the transport. Customers are increasingly asking whether additional green energy can be purchased. One of the greatest opportunities lies in the fact that investments in and promotions of railway freight traffic are underway in the sector. These will lend weight not only to plans to move freight traffic from the roads to the railways but also to the associated emission reduction targets of the European Union and the Austrian federal government. To this end, WLC has positioned and proven itself within the Wiener Stadtwerke Group as an important partner in crisis management and in securing internal logistics chains in the energy sector. In this way, WLC makes a significant contribution to the supply security for Vienna.
The ongoing war in Ukraine means that Wiener Stadtwerke Group is facing the resulting changes in the overarching conditions on the European energy market. At the forefront are highly fluctuating gas and energy prices and the need for the rapid transformation of energy systems. The stated aim is to create independence from fossil fuels and to establish a climate-neutral energy system for the greater Vienna area. The Wiener Stadtwerke Group has a pivotal role to play in making Vienna climate neutral by 2040. The Group has put together a clear corporate strategy for achieving this goal, which is divided into the three major sectors of electricity, heating and mobility. In the face of harsh conditions in the energy sector, the Wiener Stadtwerke Group will maintain its efforts to leverage efficiencies, in order to ensure a strong financial basis for future challenges. The Group is also continually building up its service character and is relying more heavily on digitalisation. Thanks to clear priorities, the Group’s ability to advance major growth, innovation and climate-protection projects will be undiminished.
The massive upheavals on the energy markets were partly caused by reduced gas supplies from Russia, but have also been exacerbated by irrational and speculative market behaviour. While the price of CO2 has fallen, electricity and gas prices have risen manyfold, one step at a time. Making use of a strategic gas reserve, financed by public funds, will ensure that customers will be supplied with gas. In this volatile environment characterised by high prices, energy procurement and the transfer of prices to the customer remain considerable challenges.
At the same time, in the coming years, the Wiener Stadtwerke Group will increasingly address the shortage of skilled workers. Around one-third of employees will retire in the next ten years, while the corresponding skilled workers – especially in the IT and public transport sectors – will no longer be available on the labour market to the usual extent. The focus here is on the employer brand and directly addressing and recruiting the skilled workers we are lacking.
The following major Group-wide initiatives are worthy of mention:
The hydrogen pilot project that was launched in 2020 was successfully continued in 2022. The Wiener Stadtwerke Group offers everything from a single source when it comes to hydrogen, and in 2022 we broke ground for the first electrolysis plant at the Wiener Netze Campus. From summer 2023, up to 1,300 kilograms of green hydrogen will be generated here every day, and from 2025, ten Wiener Linien hydrogen buses will be in regular operation. The hydrogen is produced regionally by Wien Energie, refuelled locally by Wiener Netze and consumed for local public transport by Wiener Linien. In this way, the Group is able to cover all processes along the value chain and also aims to become a pioneer in this area throughout Austria.
The green future is underground. Wien Energie uses thermal water deposits at a depth of over 3 kilometres for this very purpose. The start of the geothermal offensive will be made at the plant in Aspern, which is expected to be connected to the grid as early as 2026 and will heat around 20,000 households with green geothermal energy. The thermal water deposit under Vienna is large enough to supply up to 125,000 of Vienna’s households with district heating from deep geothermal energy by 2030.
Digitalisation of the Group is not only necessary for customers – it is also necessary for the Group’s internal structures. The SAP S/4HANA project is helping to digitalise the Wiener Stadtwerke Group. The “One Fit Processes” project, which is now complete, enabled the Group to identify processes that can be standardised across the Group using digital tools. This enterprise resource planning (ERP) platform will replace the current SAP R/3 system throughout the Group by the end of 2025 for key business processes such as procurement, maintenance and finance.
The strengthening of the Wiener Stadtwerke Group’s service character aims to provide low-threshold and uncomplicated access to services. The service point opened in 2020 is leading the way by example and now offers services from six Group companies (Wiener Linien, Wiener Lokalbahnen, Wiener Netze, Wipark, Wien Energie and Bestattung & Friedhöfe Wien) from a single source, while offering barrier-free access for all. Since 2021, logwien has supplemented existing channels and has enabled Wiener Stadtwerke customers to access and make use of all Wiener Stadtwerke products and services via a central platform, essentially giving them a digital key to the companies of the Wiener Stadtwerke Group.
The Wiener Stadtwerke innovation fund (FTI fund for short) has been supporting innovation and research projects within the Wiener Stadtwerke Group since 2012, having supported 170 projects to date. In 2022, it was endowed with a total of EUR 3.5m, with 26 project proposals being approved for (partial) funding. With the “Öffi-Packerl” project, for example, Wiener Linien is testing the transport of packages by tram passengers in the course of passive mobility behaviour. In the “Smart Thermal Networks” project, Wien Energie has set itself the goal of an automated analysis of all district heating secondary networks and is testing or developing solutions for data-driven network optimisation.
In 2020, Wiener Stadtwerke set up another important fund that is entirely dedicated to climate protection and will remain in place for years to come. 130 projects have already been implemented. From the restoration of land permeability to planting new trees in urban areas and greened façades, this fund is used to finance projects that will improve the urban microclimate and boost sustainability.
Key projects and targets in the Group’s various divisions are discussed below.
The Russian war of aggression against Ukraine had a significant impact on the course of economic events in 2022. This will continue in 2023. High energy and commodity prices and global supply chain bottlenecks will continue to loom over consumers and the energy industry. Wien Energie is still unable to escape the realities of this situation. However, thanks to stable economic activity, consistent preventive measures and a clear strategic orientation, we have been able to guarantee reliable supply to our customers despite the adverse circumstances and we have achieved a positive economic result. The effects of the market upheavals and, in particular, the holistic processing of the extreme price volatility on the energy markets at the end of August 2022 will continue to be one of Wien Energie’s main focuses in 2023.
Due to the war in Ukraine and the increasingly noticeable effects of the climate crisis, the energy market will continue to be subject to high volatility and high gas prices. China’s opening up after years of coronavirus-related seclusion will also have significant effects on the global gas market. The economy in Europe and Austria is expected to weaken noticeably in 2023, but inflation will remain at a high level. In addition, the shortage of skilled workers will become more acute and wages will rise. Due to slower economic development and persistently high energy prices, the expected growth in global energy demand will drop to 1.3%. In the long term, however, electricity demand will increase strongly due to increasing electrification in industry, space heating, business and mobility. The upheavals of the past year also led to a rethinking of the market mechanism previously applied to the energy sector in Austria. For example, member states of the European Union introduced profit levies for energy companies and a gas price cap at the end of 2022. Further interventions in free pricing could follow in 2023.
The conflict in Ukraine is leading to opposing developments around the energy transformation. On the one hand, the expansion of renewable energy is expected to be accelerated. This includes, for example, the recommendation to expand green gas generation capacity; the EU predicts that around 35bn m3 of green gases will be produced by 2030. Due to a large number of major projects and new investments in Asia, especially in India, China, Japan and South Korea, photovoltaic and wind power capacities will increase. On the other hand, the loss of large parts of Russian gas in Europe means that coal consumption will increase in the short term so that security of supply can continue to be guaranteed. Lower gas supplies also mean that energy prices are likely to remain at a high level.
Furthermore, the energy market has also been heavily influenced by social pressure related to climate change. For example, regulations to promote the expansion of renewable energies will be enacted in the next few years as part of the EU climate package “Fit for 55”, including within national legislation. Emissions trading has already been significantly tightened as at the end of 2022 through the faster shortage of available emissions allowances and the abolition of free allowances in the medium term. The phasing out of coal will continue to be a major influencing factor for the energy industry and will drastically increase the need for renewable energy or hydrogen-compatible gas-fired power plants to maintain security of supply. Decarbonisation and the associated need to move closer to achieving the targets set by the energy and climate strategies of the EU, Austria and the City of Vienna will therefore have an influence on Wien Energie’s business policies. In addition to the European Green Deal, on a domestic level the Renewable Energy Expansion Act (Erneuerbaren-Ausbau-Gesetz – EAG), which aims to cover 100% of electricity consumption with renewables by 2030, the Renewable Heating Act (Erneuerbare-Wärme-Gesetz), the Renewable Gases Act (Erneuerbare-Gase-Gesetz) and the targets of the City of Vienna (climate neutrality by 2040, Smart Climate City Strategy) have a major influence on the future strategic direction of Wien Energie. In 2023, it will become clear whether these measures and investments, especially against the backdrop of rising financing costs, are sufficient for a rapid switch to renewable energy and how Europe will fare in competition with the USA, China and India.
In addition to the regulatory requirements, technological trends will also shape the development of the energy economy in the years to come. Therefore, in 2023 it will become clear how promising the production and use of green hydrogen really is. For example, it will be interesting to see how many of the approximately 300 planned electrolyser projects in Europe actually start implementation and whether a first gigawatt electrolyser project can be initiated. Furthermore, the establishment of a European Hydrogen Bank is currently under discussion. An institution of this kind would further boost the use of green hydrogen. It is also expected that prices will fall further as a result of more state funding and the heightened interest of companies, particularly in industry and the energy and transport sectors, and that green hydrogen should also be almost as competitively viable as conventional hydrogen by 2030.
Alongside these developments, there is a growing body of research into a variety of carbon-capture technologies. Since most decarbonisation scenarios can no longer manage without the use of negative emission technologies – i.e. the removal of CO2 from the cycle – carbon capture, utilisation and storage (CCUS) has a key role to play in achieving climate targets. CCUS opens up new business opportunities for energy suppliers, such as the production of methanol and synthetic fuels from captured carbon. In addition to technological development, CO2 pricing in particular is a key driver for wider use of the technology in industry and, according to analysts, will lead to a fourfold increase in the amount of CO2 taken out of the cycle by carbon capture projects by 2030.
In energy trading, increased computer capacities and artificial intelligence (AI) are opening up new possibilities for optimisation, such as through agents based on algorithms that independently identify trading strategies and trigger purchases or sales. Big Data models can be used to create more detailed weather forecasts, e.g. with regard to solar radiation or wind strength, meaning that the generation and sale of renewable energies can be better predicted.
The possibilities presented by digitalisation and technological developments mean that the energy market is becoming accessible and attractive for new competitors. Due to the large number of new market players, the pressure on margins continues to increase. In order to remain competitive despite this increasing competition, Wien Energie is seeking to strengthen its market position by consistently analysing and enhancing its own competitive advantages. This also requires a consistent focus on the company’s own core competencies and a continuous review and adaptation of the corporate strategy to a macro-environment that is fundamentally different.
Wien Energie is aware of the fact that modern life shaped by climate protection has to change and that this requires consistent action. In 2021, Wien Energie introduced a new corporate mission statement and adapted its strategic position in relation to sustainability accordingly and, in doing so, clearly set out its aim of securing a climate-neutral energy supply for Vienna. Guided by this vision, the company is dedicated to ensuring a climate-friendly way of life for the citizens of Vienna and is taking on the role of Vienna’s climate-protection pioneer with regard to the (continued) development of climate-friendly and innovative energy solutions, particularly when it comes to heating, cooling, electricity generated from renewable sources, and electric mobility. In addition, the opportunities of the circular economy and related business models will be increasingly exploited and will be strategically embedded in the future.
To emphasise its strategic direction, over the next few years Wien Energie wants to strengthen its position as Austria’s largest operator of solar power plants. For this reason, one area of focus for its investing activities is the expansion of photovoltaic systems. Wien Energie will significantly boost solar power capacity by 2030, thus making photovoltaics the biggest source of renewable energy and Wien Energie synonymous with solar power in Austria. In addition to the expansion of photovoltaics, the development of the wind power and hydropower portfolio is a major cornerstone for Wien Energie in the mission to achieve climate targets. To this end, investments are being made in renewable plants in Austria and abroad. The aim of these measures is not only to safeguard security of supply in a growing city but also to fully convert the generation of electricity and heat to renewable energies in the long term. In order to make the operation of the high-efficiency combined heat and power (CHP) plants more climate-friendly, trials on the mixture of hydrogen will be carried out as early as 2023. In this way, we want to make a significant contribution to the decarbonisation of Vienna without jeopardising the security of supply.
In addition to the expansion of renewable energy generation, the heating revolution is the main challenge facing climate-protection efforts in Vienna. In the future, energy will be obtained to a greater extent from geothermal pockets, and large-scale heat pumps will be integrated into the existing district heating grid. The existing, well-established district heating grid presents an opportunity to concentrate supply. Housing solutions and decentralised heat pump solutions offer another way of driving forwards the decarbonisation of the heating supply. It is not just about heating – Wien Energie is also actively expanding its environmentally friendly cooling supply. In the years to come, more money will be invested in developing district cooling, and by 2025 the district cooling ring around the city centre will be completed. The aim is to reach a connected value of 370 MW among district cooling and decentralised cooling solutions by 2030.
In line with the rest of Europe, Vienna is paving the way for an energy-efficient, climate-conscious future by introducing new, smart electricity meters. Smart meters are a key element in the expansion and modernisation of power grids. Wiener Netze’s smart meter programme is being implemented by the consortium Siemens-Landis & Gyr-Iskraemeco. The rollout continued in 2022. The switch to smart meters took place in the grid areas over the Danube in particular. As of 31 December 2022, around 766,000 smart electricity meters had been rolled out, exceeding the statutory rollout quota of 40% (IME Regulation – IME-VO). Furthermore, around 7,400 transducer meters were replaced. The rollout will continue as planned in 2023, with the aim of achieving a rollout quota of 95% by the end of 2024 in accordance with the IME Regulation.
In the electricity grid subdivision, the expansion of the digitalisation of medium-voltage operating equipment continues to progress. The strategic expansion of automated, smart transformer stations, as well as remotely detectable overcurrent indicators on inaccessible overhead line sections, is accelerating the fault-clearance measures in the event of electricity grid unavailability and will be further promoted.
The implementation of the concept for digitalising the low-voltage grid is to be discussed on the basis of implementation across a pilot area and, through the theoretical knowledge gleaned in the Aspern Smart City Research, is expected to lead to nationwide implementation in the medium term. The focus here is on the interfaces for connecting measuring, control and communication. In order to meet the legal and regulatory requirements, grid monitoring is therefore also being implemented at the low-voltage level.
The well-known long-term grid expansion projects – including upgrades of old medium- and high-voltage systems, the modernisation of substations based on older safety standards, and adaptation and optimisation measures in accordance with the target network plan – are currently going ahead at full steam.
The construction of five new transformer stations at strategically important nodes and the targeted connection of renewable generation plants to the grid, such as wind and photovoltaic plants, are intended to ensure the implementation of the energy transition in the distribution grid. Disruptions and other types of non-availability are rectified in a more coordinated and more rapid manner by reorganising the fault service at all voltage levels.
Low-impedance neutral earthing was started in 2018 and successfully implemented over the following few years. By 2027, 29 substations in the 10-kV medium voltage range will be converted. The concept for the 20-kV medium-voltage level is also in its final phase. The restructuring of the neutral point connection increases supply security by ensuring that power is restored rapidly following outages.
The need for developments in relation to natural gas will remain a factor wherever natural gas has a role to play as an energy source for higher temperatures in the production and commercial sectors and in industry. Production sites and capacity expansions still require new gas connections or adaptations in line with the grid code.
In the residential sector, alternative energy systems (district heating or systems such as heat pump applications or energy networks) are increasingly being used, meaning that new connections are only being realised to a very limited extent. In the long term, following the plan of the Vienna municipal government, a complete phase-out of gas for
cooking, space heating and hot water is planned under the strategic focus “Raus aus Gas” (“Away from gas”). The legal basis for the phasing out of gas is still to be drawn up. The Gaswirtschaftsgesetz (GWG, Federal Natural Gas Act) currently provides for an obligation to provide gas.
Alongside the previously mentioned expansion of the gas network, safeguarding security of supply and the performance and the operational safety of the existing grid all require investment in order to maintain quality. The main focus is on strategic, condition-based maintenance. As part of this, findings from regular grid inspections (deficiency data) are used along with data on the existing network as the basis for asset management.
With regard to climate protection measures, Wiener Netze is reviewing the gas grid with a view to potentially focusing on and adjusting the high-pressure distribution network (grid level 2) with regard to the use of hydrogen. Dedicated working groups exist for this complex topic and are constantly reviewing the latest findings with regard to the suitability of the piping systems.
Wiener Netze is responsible for the installation and maintenance of the district heating grid. The ongoing expansion of the network is mainly driven by the demand for housing and associated educational and service facilities. Accordingly, moves to open up new areas, increases in the density of existing parts of the network, and expansions in step with new housing are undertaken at strategic interconnection points. Ensuring sufficient grid capacities is key when establishing new connections. Any subsequent improvements or changes must also be taken into account during the initial planning stages.
Investments are planned in potential connection areas and the upstream network infrastructure in order to ensure a sustainable heat supply. Current projects being implemented on behalf of Wien Energie are new grids in the urban development areas of “Donaufeld Ost”, “Nordwestbahnhof” and “Rothneusiedl”. The district heating ring connections in the districts of Ottakring and Döbling are in the planning stage, as are the necessary connection preparations in the course of the expansion of deep geothermal energy on the outskirts of the urban lakeside area of Aspern for supplying a further 20,000 households in Vienna.
Investments of approximately EUR 668.2m are planned for Wiener Linien in 2023 (excluding financial investments), of which approximately EUR 320.3m will be dedicated to new underground construction work. On the one hand, the focus is on the ongoing procurement of vehicle equipment for all departments (Type X trains, Flexity, battery buses, etc.), the associated redesigning of various train stations for exclusive servicing by low-floor trains (Remisen 2.0), the continued modernisation of the U4 line from Hütteldorf to Heiligenstadt, and the replacement of the signalling control centres on the U6 line. On the other hand, investments are also planned for the renewal of tramlines and tracks in the underground train network and for new line layouts (e.g. line 12), including in connection with the U2xU5 intersection. Investments are also being made in the construction of the new training workshop in Simmering and in connection with multimodal mobility (especially WienMobil products). The largest construction projects in new underground construction are the U2 extension from Rathaus to Matzleinsdorfer Platz, the reconstruction of the main line and the new construction of the U5 station Frankhplatz and the adaptation of the control centre.
The expected recovery from the Covid-19 situation, as well as the improved attractiveness of our products and services, population growth in Vienna and the strengthening of climate protection measures, all led to an increase in passenger volumes, ticket sales and, consequently, in revenue. A strong increase is to be expected above all among short-term network passes and single tickets bought in advance and among the annual passes, whereby migrations from various ticket categories to the new digital annual ticket, among others, are taken into account. Revenue from the KlimaTicket is expected to remain at the previous year’s level due to the stable flat-rate payment. Higher income in 2023 can primarily be attributed to the additional need for an operating subsidy – due to the increases in the market prices of energy and fuel, the index increases in personnel and material costs and the elimination of the full-year effect of the 2022 tariff adjustment that was not implemented.
With regard to the underground network, the first phase of construction of the U2xU5 intersection will begin in 2023 with the tunnelling work in the station areas. Factory production of the tunnel boring machine will begin in autumn 2023; it will then be in use from mid-2024, starting at Matzleinsdorfer Platz. The handover of the second sec-
tion of the General Project (U5: Elterleinplatz to Hernals) as part of the second phase of construction is planned for summer 2023. The General Project (U2 to Wienerberg) is also expected to be rolled out in summer 2023. For the U5 line, the necessary tenders will be published in 2023.
As part of a sub-project NEU4, the seals of the U4 tunnel ceiling between Salztorbrücke and Augartenbrücke will be renovated in 2023. The repair of the surfaces by the responsible municipal department and the completion of the sub-project will also take place by October 2023. All modernisation works relating to NEU4 will be completed in 2025. The Type X cars will be launched on the U1–U4 lines from this year, with passengers and a driver on board. The future U5 line will be operated fully automatically. Three more Type X cars are expected to be delivered in 2023.
With regard to trams, the focus in 2023 will be on completing the planning of the construction project for line 12. Line 12 is scheduled to go into operation by the start of the school year in autumn 2025. In order to maintain the rail infrastructure, measures will be necessary in 2023, especially in the areas of the inner ring and Maroltingerstraße/ Thaliastraße. During the construction projects, innovative solutions such as sedum tracks (low-maintenance grassed tracks) were also tested. The ageing of the track network, the dense nature of timetables and weightier vehicle generations make additional track construction packages essential (e.g. Tramways 2025–2035, Points Renovation U6/ U3, etc.).
In 2023, the first delivery lots of the tender for up to 65 electric buses and ten hydrogen buses will be issued. The first vehicles are expected to be delivered in 2023. The ten hydrogen buses are expected to be on the road between Heiligenstadt and Sievering by 2025. As the fleet of diesel Euro 6 buses will continue to form the foundation of urban bus transport, the focus in 2023 will be on synthetic diesel as a climate-friendly alternative. A further call for tenders is also expected for 2023 for the electric minibuses in use on the 2A and 3A routes since 2013. A total of ten more electric minibuses will reinforce the fleet on the 2A and 3A routes, with delivery to be expected by 2025.
At Wiener Lokalbahnen, an increase in revenue is expected in the coming year, which will largely result from the transport services agreement. On the one hand, the TW500 will be used, which promises higher compensation, and on the other hand, the kilometre rates will be indexed higher (especially electricity). The E3 frequency increase from the transport services agreement is planned from December 2023 (double frequency to Wiener Neudorf instead of single frequency as before). A planned construction site in
the city area may also have an impact on the result. This was originally planned for 2022 but has been postponed to 2023 according to the current planning status.
In the 2023 financial year, and in the following years, WLC’s aim will be to secure and build up existing transport revenue and to expand the existing value added in the markets of Germany, Austria and the Czech Republic through the further expansion of its own traction services and to increase its market share in these countries. Furthermore, WLC will strive to diversify its service and customer portfolio and drive forward end-customer sales. The goal is to have an even split between intermodal and conventional business. The forwarding business area will also be further expanded to round off the strategic development.
In addition to the trend towards rising material, electricity and service prices, the utilisation of resources (locomotives, cars, staff) in particular is being permanently monitored in order to ensure that appropriate measures can be taken in a timely manner. The risk of rising energy prices has already been significantly reduced in negotiations with customers to compensate for price increases, but will nevertheless remain a focal point and will be taken into account in customer contracts when business is entered into.
The revenue development of Bestattung Wien GmbH is essentially aligned with the number of deaths in Vienna, which has been stagnating at best for a number of years now. The increasing number of funeral homes in a limited market leads to merciless competition and losses in the number of ceremonies carried out. The intention is that the multi-brand strategy, coupled with increased online activity, will counteract this permanent reduction in market share.
In the Cemeteries division, business operations depend on the number of deaths, as well as general willingness to maintain graves. The mortality rate is likely to remain stable over the medium term, which, to a large degree determines the business performance of the division. We expect to see an increase in the number of deaths from 2025 due to increasing population growth and demographic trends in Vienna. Depending on the volume, revenue is expected to increase, assuming that the deceased are buried in Vienna and not in their country of origin and that no alternative burials outside of cemeteries take place.
In order to be prepared for the expected increases in the number of deaths, extensive measures are being implemented both in terms of refrigeration infrastructure and in terms of staffing. In 2021, an investment was made in a new central cold room in order to secure sufficient refrigeration capacity, including in crisis situations. This cold room, which has been constructed at Vienna’s Central Cemetery and features state-of-the-art technology, entered into operation in November 2022.
In order to secure income and reduce costs, over the coming years the spotlight will be on the strategic objectives of radical customer focus, image cultivation, cost-efficiency and knowledge retention. Customer processes will continue to be optimised, new services (such as natural burials) will be offered and chapels of rest will be improved. Cemeteries will be seen as places for Vienna’s citizens to meet and embrace life. A range of activities and events will encourage citizens to visit our cemeteries even when they are not coming to pay their respects to a loved one.
The digitalisation options are being used for cemeteries in order to facilitate an appealing service that reflects increasing mobility and urbanisation: the Digital Grave and Digital Memorial services allow existing physical graves to be visited from anywhere and at any time. New sources of income are being tapped into via additional services offered by the Digital Grave. The digital vacant plot search functionality is driving the sales of vacant plots. The environment is also taken into account: instead of removing beautiful yet untended plots, these are being made available for use by someone else. What is more, the lease periods for new applicants are now more flexible to allow for the varying needs of customers. The importance of the cemeteries for the environment will also be made clearer to the city’s citizens, which in turn will increase customer loyalty. The number of customers will be stabilised by means of an active customer loyalty programme.
The positive revenue development in recent months gives cause for optimism for the coming business year despite rising costs due to inflation. To counteract the increased electricity costs in particular, Wipark has already taken measures to reduce electricity consumption and will continue to work on reducing consumption, with both cost and the climate well in mind.
In order to ensure the quality and the earnings potential of its car parks, the focus in the next few years will continue to be on renovation projects. Wipark invests in particular in modernising its own car parks in the city centre as these make a significant contribution to the result.
The digital product OSCAR was introduced at the end of 2021 for short-stay parking customers, with the aim of increasing customer loyalty and optimising customer service. After steady growth, the functionalities for customers will continue to be expanded further as part of an overall concept.
With a clear focus on its customers, Wipark is able to respond quickly and flexibly to their changing needs. The ongoing optimisation and innovation of customer solutions and processes ensures the future viability of Wipark. Due to its strong anchoring in the Wiener Stadtwerke Group, the focus is on synergies, efficiency increases and an increase in value creation. Wipark is confident that it will be able to continue its positive business development in the coming years.
Vienna, 29 March 2023
Martin Krajcsir Peter Weinelt Chief Executive Officer Deputy Chief Executive Officer
The Management Board
Page 59
1 Consolidated statement of profit or loss
Page 60
2 Consolidated statement of comprehensive income
Page 61
3 Consolidated statement of financial position
Page 62
4 Consolidated statement of changes in equity
Page 63
5 Consolidated statement of cash flows
Page 64 6 General remarks
Page 67
7 The Wiener Stadtwerke Group
Page 79
8 Group business performance
Page 93
9 Non-current assets and liabilities
Page 104
10 Employees
Page 110
11 Financial instruments
Page 131
12 Equity and debt capital
Page 132
13
Taxation
Page 136
14 Risk management
Page 146
15 Supplementary information
CONSOLIDATED FINANCIAL STATEMENTS
2
3
CONSOLIDATED FINANCIAL STATEMENTS
4 Consolidated statement of changes in equity |
5 Consolidated statement of cash flows
Wiener Stadtwerke GmbH (WSTW GmbH), the parent company of the Wiener Stadtwerke Group, is entered in the register of companies at Vienna Commercial Court, Austria, under FN 127783t. The address of the registered company is Thomas-Klestil-Platz 13, 1030 Vienna.
The consolidated financial statements relate to Wiener Stadtwerke GmbH and its subsidiaries (referred to below as “the Wiener Stadtwerke Group”, “the WSTW Group” or “the Group”). The Wiener Stadtwerke Group plays a vital part in keeping the city of Vienna running. The Group is responsible for providing reliable, environmentally friendly energy supplies and efficient public transport. Other areas of Group operations are funeral services and cemeteries, as well as multi-storey car parks.
The consolidated financial statements have been drawn up in accordance with the International Financial Reporting Standards (IFRS) as adopted in the European Union, and also meet the additional requirements of Section 245a of the Austrian Business Code (Unternehmensgesetzbuch –UGB).
The consolidated financial statements were finalised on 29 March 2023 and approved for forwarding to the Supervisory Board, which is responsible for checking and approving them.
Details of the accounting policies applied can be found in the relevant notes. In the interests of providing clear and meaningful information, some items in the statement of profit or loss and the statement of financial position have been aggregated. These items are broken down and explanatory details are provided in the notes. The statement of profit or loss is prepared using the nature of expense method. All amounts are reported in millions of euros (EUR m), unless stated otherwise. Totals of rounded amounts and percentages may be affected by rounding differences caused by automatic calculation tools.
In the course of preparing the consolidated financial statements, the management is obliged to make judgements, estimates and assumptions that influence the value of the assets, liabilities, income and expenses recognised. Although these are best estimates and assumptions based on up-to-date information, the inherent uncertainty associated with them means that deviations from actual events cannot be ruled out. This can result in significant adjustments to the carrying amounts concerned. Assumptions and estimates are regularly assessed and adjusted prospectively where necessary.
Judgements, estimation uncertainties and assumptions that have a significant influence and entail material risks may necessitate adjustments of carrying amounts in the following year. These are explained in the notes or in the explanations of the recognition and measurement of the items in question.
Judgements are made with regard to the following:
• Definition of the scope of consolidation – see note 7.2
• Definition of companies over which significant influence is exercised – see note 7.3
• Definition of key items related to the Group’s related parties – see note 7.4
• Definition of key criteria relating to impairment testing and delineation of CGUs – see note 9.5
• Classification of investments as non-current financial assets measured at FVOCI – see note 11.3
• Selection regarding the valuation method of expected future losses of trade receivables – see note 14.
Estimates are made in relation to the following:
• Estimates in relation to the accrual-based determination of revenue – see note 8.1.
• Estimates of net realisable value of inventories – see note 8.6
• Estimates of the useful lives of property, plant and equipment and intangible assets – see notes 9.1 and 9.2
• Estimates related to impairment testing – see note 9.5
• Estimates related to provisions – see notes 9.6 and 15.2
• Estimates of parameters for personnel provisions – see note 10.2
• Estimates in connection with the offsetting of financial assets and financial liabilities: In the 2022 financial year, the estimate for the required offsetting of financial assets and financial liabilities in connection with energy-related transactions changed – see note 11.5
• Estimates in connection with determining the fair value of financial instruments – see note 11.6
• Estimates in connection with measuring deferred taxes – see note 13
• Estimates of credit risks and valuation allowances for financial assets – see note 14
New or amended standards and interpretations that had been published by the IASB as at the date of preparation of the financial statements, but were not mandatorily applicable in the EU as at 1 January 2022, were generally not voluntarily applied. The Wiener Stadtwerke Group will apply such standards as soon as they become mandatory. Information on standards which are not yet applicable is provided in the table below. However, these standards are not expected to have a material effect on the consolidated financial statements.
The following standards and interpretations have been mandatory since the last annual financial statements. The newly applied standards did not result in any significant changes in accounting.
Standards adopted by the EU and newly applied in the 2022 financial year
Standards and interpretations not yet applicable
* These standards were not yet adopted by the EU when the consolidated financial statements for the period were compiled.
The consolidated financial statements of Wiener Stadtwerke GmbH include those companies that are material to presenting a true and fair view of the Group’s assets, liabilities, financial position and profit or loss. Changes in the scope of consolidation are presented in the following table:
The previously fully consolidated company BFW Bestattungsservice Wien GmbH was divided and merged into Friedhöfe Wien GmbH and Bestattung Wien GmbH. Bestattung PAX GmbH, which was previously not consolidated due to immateriality, was also merged into Bestattung Wien GmbH.
Furthermore, the previously non-consolidated wind farms Pongratzer Kogel GmbH, Herrenstein GmbH and Zagersdorf GmbH, as well as the non-consolidated Kraftwerk-Gulling GmbH and Kraftwerk-Gulling GmbH & Co KG, were merged into Wien Energie GmbH in the 2022 financial year.
The hydropower plant Rantenbach GmbH (acquired in 2019) and Ratschfeld GmbH (acquired in 2020), which are wholly owned by Wien Energie GmbH, were merged into Wien Energie GmbH in the 2021 financial year. Due to their immateriality, the companies have not previously been included in the scope of consolidation.
On 30 April 2021, Wien Energie GmbH acquired 100% of the voting shares in KW Lavant GmbH at a total purchase price of EUR 4.9m. The company was subsequently merged into Wien Energie GmbH. This initial consolidation had no material effect on the consolidated financial statements.
VID Energie Infrastruktur GmbH and VID Energie Infrastruktur GmbH & Co KG were founded by Wien Energie GmbH together with ARE Beteiligungen GmbH. Wien Energie GmbH holds a 50% stake in each of the start-ups. Wien Energie acquired 100% of the shares in Projektentwicklung KW Pusterwaldbach GmbH.
After purchasing a 49% share in each of the Herrenstein GmbH, Pongratzer Kogel GmbH and Zagersdorf GmbH wind farms in the 2020 financial year, Wien Energie GmbH purchased the remaining 51% of shares in these wind farms on 16 December 2021. Furthermore, Wien Energie GmbH acquired a 50% share in Riddle & Code Energy Solutions GmbH in the 2021 financial year. Due to their immateriality, none of the companies mentioned was included in the scope of consolidation.
The 49% share in the previously non-consolidated Bestatterakademie GmbH was ceded to the Bundesinnung der Rauchfangkehrer und der Bestatter – Bundesverband der Bestatter, the Austrian federal guild of chimney sweeps and undertakers.
Initial consolidation 2021
Wiener Wasserstoff GmbH, which was founded in the 2020 financial year, is included in the scope of consolidation for the first time as at 31 December 2021.
7 The Wiener Stadtwerke Group
The following companies were included in the scope of consolidation as at 31 December 2022:
The following 22 (2021: 27) companies were not included in the scope of consolidation due to immateriality:
All material entities in respect of which WSTW GmbH has direct or indirect control over financial and business policies (subsidiaries) are included in the consolidated financial statements. WSTW GmbH is deemed to have control over a company in which it holds an interest when it has rights to variable returns from its involvement with the investee and has the ability to affect those returns through its power over the investee.
As a rule, this applies when the interest amounts to more than 50% of voting rights, but can also derive from existing de facto control over the activities of an investee which entitles WSTW GmbH to the majority of economic benefits or exposes it to risks. Companies are included in consolidation from the date WSTW GmbH obtains control, and are deconsolidated when it loses control.
In the case of acquisitions, assets and liabilities (including contingent liabilities) are recognised at their fair values, independently of any non-controlling interests acquired, in accordance with IFRS 3. Non-controlling interests in subsidiaries are measured according to the proportionate share in net assets (excluding the proportionate share in goodwill). Intangible assets are recognised separately from goodwill if they are separable from the acquiree or arise from contractual or other legal rights. A remaining positive difference that compensates the seller for market opportunities or development potential that cannot be individually identified are recognised as goodwill. If there is a negative difference, following a new assessment of the value of the identified assets and liabilities (including contingent liabilities) of the acquiree, and of the compensation transferred, the difference is recognised in profit or loss. The difference between fair value and the carrying amount are carried forward in accordance with the related assets and liabilities during the subsequent consolidation. A change in the interest held in a consolidated subsidiary is recognised as an equity transaction without recognition in profit or loss.
Material intra-Group receivables and interim profits or losses are eliminated. The income tax effects of any amounts recognised in profit or loss on consolidation are accounted for, and deferred tax assets and liabilities are recognised as the case may be. Capital consolidation is based on offsetting the transferred consideration against the fair value of the assumed assets and liabilities.
The reporting currency of the Wiener Stadtwerke Group is the euro. The functional currency of all consolidated subsidiaries as well as all investments accounted for using the equity method is also the euro.
Within the scope of full consolidation and at equity valuation, various Group companies were not included in the consolidated financial statements. These are carried at amortised cost less any impairment losses, under other assets. Inclusion of these companies is immaterial to presenting a true and fair view of the Group’s assets, liabilities, financial position and profit or loss. The subsidiaries not included as fully consolidated companies are mostly companies with minimal trading volume, which together account for less than 2% of the Group’s total assets. The subsidiaries’ revenue and total assets are taken into account when determining materiality.
The following companies were not included and possess total assets of more than EUR 20.0m as at the reporting date:
Energie und Gebäudemanagement GmbH
Facilitycomfort Energie- und Gebäudemanagement GmbH), Spittelauer Lände 45, 1090 Vienna
Wohnungs- und Siedlungsgesellschaft der Wiener Stadtwerke Gesellschaft m.b.H.,
236, 1110 Vienna
Energy forta naturala S.R.L., Street Sfanta Vineri 29, Cladirea Bectro Center, RO-030203
* No values are available yet for the 2022 financial year.
The Group’s investments accounted for using the equity method comprise investments in associates and joint ventures.
The following associates and joint ventures were accounted for using the equity method at the reporting date:
As a limited partner, Wien Energie GmbH holds a 100% interest in the assets and earnings of Wien Energie Vertrieb GmbH & Co KG, which specialises in the distribution of electricity and gas. The general partner without asset contribution is Energieallianz Austria GmbH, whose field of activity concerns electricity trading. Wien Energie Vertrieb GmbH & Co KG is managed jointly, as the contracts between Wien Energie GmbH and Energieallianz Austria GmbH mean that Wien Energie GmbH cannot decide on the main activities on its own. In accordance with IFRS 11, this joint venture is therefore presented at equity in the consolidated financial statements.
Energieallianz Austria GmbH is a joint venture within the meaning of IFRS 11 due to existing agreements between EVN AG, Energie Burgenland AG and Wien Energie GmbH, which provide for the joint management of Energieallianz Austria GmbH, and is also included in the consolidated financial statements at equity. Both companies’ reporting date is 30 September. Since the publication of the consolidated financial statements for 2021, Energieallianz Austria GmbH has been included in the consolidated
financial statements on the basis of an IFRS package as at 31 December. Therefore, the company is still included in the consolidated financial statements for 2021 with five quarters. Wien Energie Vertrieb GmbH & Co KG is also included in the consolidated financial statements on the basis of an IFRS package as at 31 December.
Wien Energie GmbH holds an unchanged capital share of 13% in Verbund Innkraftwerke GmbH (IKW), which is active in the field of electricity generation. Within the framework of the company agreement, Wien Energie GmbH was granted rights that go considerably beyond the influence normally associated with a voting share of 13%. Due to these opportunities to influence the financial and business policy decisions of IKW, it is included in the consolidated financial statements as an associated company using the equity method.
The following 17 companies (previous year: 17) were not accounted for using the equity method as at 31 December 2022 due to immateriality:
The following overview shows summary financial information on the associates and joint ventures included in the Group’s consolidated financial statements; Verbund-Innkraftwerke GmbH is classified as an associate, and Wien Energie Vertrieb GmbH & Co and Energieallianz Austria GmbH are classified as joint ventures.
Joint arrangements are consolidated depending on the rights and obligations of the parties to the joint arrangement arising from the contract. If the Group only has rights to the net assets of the jointly controlled arrangement, the arrangement is classified as a joint venture in accordance with IFRS 11 and accounted for using the equity method. In the case of a joint operation, the Group has rights to the assets and obligations for the liabilities relating to the arrangement. The joint operators recognise assets, liabilities, income and expense in relation to their interest in the joint operation. An associate is an entity over which the Group has significant influence, but not control or joint control over financial and business policies. These are included at equity.
Investments in associates and joint ventures are accounted for using the equity method. They are initially recognised at cost, including transaction costs. Following initial recognition, the carrying amount is adjusted to reflect changes in the associate’s or joint venture’s equity, based on the Group’s proportionate interest. An impairment test is carried out if there is an indication of possible impairment.
Wien Energie Vertrieb GmbH & Co KG has negative equity of EUR 304.3m as at 31 December 2022. According to IAS 28.38, the inclusion of losses must be discontinued if the share in the losses of the associate would lead to a negative equity value. The unrecognised excess losses relate to other comprehensive income.
According to IAS 24, a person or entity is a related party if they have direct or indirect control of, joint control of, or significant influence over the affiliate Group. Key management personnel are also related parties. Close members of the families of persons who are related parties are also considered related parties.
On this basis, related parties to the Wiener Stadtwerke Group include all subsidiaries not included in the scope of consolidation, all associates and joint ventures, and key management personnel.
Key management personnel comprise the members of the Management Boards and Supervisory Boards of Wiener Stadtwerke GmbH, Wien Energie GmbH, Wiener Netze GmbH and Wiener Linien GmbH.
The City of Vienna is the sole owner of Wiener Stadtwerke GmbH. Therefore, the City of Vienna and the entities over which it has control or significant influence are also related parties to the Wiener Stadtwerke Group. As the City of Vienna is a public authority pursuant to IAS 24, the Group applies the exemption under paragraph 25 IAS 24, whereby immaterial related party transactions and outstanding balances with a government need not be disclosed if the public authority has control or joint control of, or significant influence over the reporting entity.
Transactions with entities controlled or significantly influenced by the City of Vienna mainly relate to electricity, gas, energy grid and facility management services.
Compensation paid to the members of the Management Boards and Supervisory Boards includes salaries, termination benefits, pensions and payments for Supervisory Board duties.
The following tables show the compensation for current key management personnel, for the Management Board of the Group’s parent, Wiener Stadtwerke GmbH, and for the Supervisory Board.
As in previous periods, no loans were granted or paid to key management personnel in the reporting period. Pension expenses include ongoing pension payments to former members of the Wiener Stadtwerke GmbH Management Board amounting to EUR 0.6m (previous year: EUR 0.6m).
CONSOLIDATED FINANCIAL STATEMENTS
7 The Wiener Stadtwerke Group
The following tables provide an overview of business transactions with related parties. This involves the purchase/sale of goods and services as well as financing:
All receivables from related parties are regarded as recoverable, and as a result no material impairment losses were recognised in the reporting period or the previous year.
In addition to the values given in the tables, government grants were also received from the City of Vienna. The corresponding figures are reported as sundry other income or as other current liabilities. More information can be found under note 8.2 Other operating income and under note 8.10 Other liabilities.
Significant transactions shown in the table are explained below:
The Group has contracts with the City of Vienna and its municipal departments, and with Wiener Wohnen (social housing management) concerning the supply of district heating and purchase of refuse from Municipal Department 48 for heat generation. These transactions resulted in revenue of EUR 102.2m (previous year: EUR 148.0m) and expenses of EUR 102.2m (previous year: EUR 42.7m).
Revenues from compensation to Wiener Linien and Wiener Lokalbahnen for services rendered, which were realised with support from Verkehrsverbund Ost-Region (VOR) Gesellschaft m.b.H., totalled EUR 110.5m (previous year: EUR 105.0m). In the financial year under review, there were expenses from commitment fees and interest for credit lines provided by the City of Vienna (finance, Municipal Department 5) for the first time. In addition, there are still significant levies to the City of Vienna (accounting and taxation, Municipal Department 6) amounting to EUR 47.0m (previous year: EUR 43.2m).
The net liabilities are largely due to a cash pooling arrangement within the Wiener Stadtwerke Group that is also used by non-consolidated subsidiaries and associates. Receivables relate predominantly to two loans granted to non-consolidated subsidiaries. Expenses were mainly attributable to energy procurement services vis-à-vis Wien Energie
Bundesforste Biomasse Kraftwerk GmbH & Co KG, IT services (licence fees) and the provision of facility management services to the Wiener Stadtwerke Group by immOH! Energie und Gebäudemanagement GmbH/HC immOH! Infrastruktur Services GmbH (formerly: Facilitycomfort Energie- und Gebäudemanagement GmbH/Hauscomfort GmbH).
Investments accounted for using the equity method Significant transactions include a contract for services under which Wien Energie GmbH invoices electricity and gas supplies and handles procurement in the name of and for the account of Wien Energie Vertrieb GmbH & Co KG. In addition, the staff working at Wien Energie Vertrieb GmbH & Co KG are assigned from Wien Energie GmbH. Wien Energie Vertrieb GmbH & Co KG has the authority to direct these employees. For the Wiener Stadtwerke Group as a whole, all services result in income of EUR 1,737.6m (previous year: EUR 577.1m) with Wien Energie Vertrieb GmbH & Co KG. The resulting expenses amounted to EUR 1,623.48m (previous year: EUR 410.0m).
As Energieallianz Austria GmbH also markets electricity generated by Wien Energie GmbH, trading is conducted in part by the former. Additionally, Energieallianz Austria GmbH carries out trading in guarantees of origin for electricity supplies. Revenues (including network services for Wiener Netze GmbH) amount to EUR 920.9m (previous year: EUR 403.0m) and expenses to EUR 352.0m (previous year: EUR 108.8m). These transactions also account for part of the stated receivables from Wien Energie Vertrieb GmbH & Co KG and Energieallianz Austria GmbH, which totalled EUR 236.8m (previous year: EUR 139.3m). The majority, however, is associated with a current financial receivable from Wien Energie Vertrieb GmbH & Co KG in the amount of EUR 454.6m, with a liability being reported in the previous year (previous year: EUR 61.7m).
The liability balance is also attributable to a large extent to the previously mentioned transactions with Wien Energie Vertrieb GmbH & Co KG and Energieallianz Austria GmbH, which totalled EUR 37.4m (previous year: EUR 26.9m).
The Group draws revenue from the following business divisions:
The tables below show the changes in contract assets and liabilities over time.
The contract assets predominantly relate to performances not yet invoiced by Wiener Netze.
The contract liabilities largely concern the contributions to construction costs collected by Wiener Netze and Wien Energie (see the remarks below).
During the reporting period EUR 119.2m in revenue (previous year: EUR 119.7m), forming part of the contract liabilities as at the end of the previous reporting period, was recognised.
Contracts for the provision of heating or cooling are basically broken down into two price components: a base rate or capacity charge, and a unit rate.
There is no consideration due under customer contracts that does not form part the above revenue.
The bulk of the revenue derives from customer contracts, and is recognised in accordance with IFRS 15. This standard provides for a five-stage model for revenue realisation. The first step is to identify the contracts with customers so as to locate the separate performance obligations contained in them. The transaction price must then be determined and allocated to the performance obligations identified. The final step is determination of the form of revenue recognition (over time or at a point in time). Revenue is realised when the customer obtains control of the services rendered or goods sold.
Most of the revenue is accounted for by the Energy division. The main area of activity of the Group companies in the Wien Energie sub-group is the supply of heating or cooling services to its customers. The latter include large customers like cooperatives, property developers or owners, and the hospital association, as well as private individuals who obtain heating and/or cooling services from the Group.
The supply of heating and/or cooling services under a district heating or cooling contract is governed by a supply contract, meaning that the customer receives as much heating or cooling as required. The price per kWh, i.e. the unit rate, corresponds to the stand-alone selling price. This means that every unit of heating or cooling (measured in kWh) called off should be regarded as a separate performance obligation. The service is provided when the heat/ cold is called off. The allocation of the consideration is on the basis of the kWh rate and the quantity of heat or cold actually consumed. Revenue recognition is over time, as the customer receives the benefits of the heating or cooling in the course of performance. The customers settle the claims afterwards mainly by means of a monthly payment based on an advance payment. Once a year, a final invoice is issued in which the actual quantities consumed are compared with the payments made, and credit balances or additional payments are determined and offset.
Another distinct performance component is the provision of access to the district heating and/or cooling network. During the minimum duration of the contract, the customer is entitled to the agreed heating or cooling capacity at all times, and Wien Energie must be prepared to meet call-off orders for this capacity. The service provision of Wien Energie therefore takes place during the contract term. The customer must pay a base rate or capacity charge, irrespective of actual use, for the provision of this capacity. The payment is essentially made at the beginning of the contract or before the start of construction and the revenue is recognised on a time-period basis.
If necessary, Wien Energie lays the power or gas connection from the boundary line to the property, or installs the district heating/cooling building substation and system. This work is performed on the customer’s land. Wien Energie’s performance thus results in the creation of an asset, over which the customer obtains control during its construction. The performance obligation is thus normally satisfied over time, as specified by paragraph 35b IFRS 15. Due to the brief construction times involved, in conformity with paragraph 63 IFRS 15 no adjustment is made for the potential effects of a financing component. In the interests of simplicity, revenue is realised upon handover of the completed installations to the customer.
Wien Energie also generates revenue from the recycling of waste and sewage sludge. The latter is delivered by the waste disposal companies and incinerated to produce heat. Revenue realisation is over time as the waste materials are accepted continuously, as they arise. The entire consideration paid comprises both annual fixed amounts and volume-dependent variable components. The billing period is a calendar year and invoicing is on the basis of the quantity of waste actually incinerated. As these remuneration components are not known until the end of the accounting period, invoicing of the variable components is in accordance with the actual waste arising during the billing period concerned.
In the case of the proceeds of electricity and gas sales, the performance obligation consists of the supply of a quantity of electricity or natural gas specified in the agreement. Proceeds are recognised at the time of the physical delivery of the electricity or gas. In conformity with paragraph B16 IFRS 15, revenue is realised in the amount of the right to invoice for it, as this amount reflects the performance rendered to the customer.
Wiener Netze’s sales revenues mainly consist of system charges for electricity and gas, as well as provision fees for the district heating/cooling network and revenue from the reversal of contributions to construction costs for network access and network provision.
Wiener Netze creates new network connections for customers or, where a connection is already in place, connects new customers to the network. Wiener Netze is responsible for operating and maintaining the grid for the duration of the use of system agreement, in order to safeguard network readiness, and thus the customer’s ability to withdraw energy from the system, at all times. These performances should be seen as part of a single performance obligation.
The system charges for the use of the electricity and gas grids are made up of different components. Energie-Control Austria sets the charges by order. They are fixed prices and cannot be changed.
The customer simultaneously receives and consumes the benefits for the duration of the use of system agreement. The performance obligation is thus satisfied and revenue accordingly recognised over time, in accordance with paragraph 35a IFRS 15. The customer’s payment is made monthly.
The primary district heating network owned by Wiener Netze is operated on the basis of a commission contract with Wien Energie. As the principal, Wiener Netze is responsible for the operation, maintenance and expansion of the network, while the sale of district heating to the end customer is carried out exclusively by Wien Energie as the commission agent. In return, Wiener Netze receives a commission fee from Wien Energie that depends on the maintenance expenditure and expansion volume and is included in Wiener Netze’s revenue.
For the correct timing of recognition of the revenue derived from the district heating and cooling, electricity and gas supplies, and use of system charges (which vary with the amount of energy supplied), the quantities sold must be determined and valued. As not all customers have been invoiced by the time that the consolidated financial statements are drawn up, the revenue must be estimated and accrued. Particularly in the case of rolling billing, customers’ meter reading dates are spread over the entire year. Where customers’ meters are not read on a monthly basis, the consumption data for the period between the last invoice and the end of the reporting period are missing. They are determined using the individual process, in which all of the contracts are individually analysed. An invoicing-simulation process is carried out for contracts that are yet to be invoiced. This individual process has the advantage that any changes in tariffs, rates, readings, meters, etc. can be incorporated into the calculation with maximum accuracy.
Taxes and levies are also collected as part of the system charges for which Wiener Netze acts as an agent because, for price components:
• another party (a public or government authority) is involved in the supply of goods or services
• Wiener Netze has no control over these performances
• nor does it provide any significant integration services
• it bears no inventory risk,
• nor it does it have any discretion in the determination of the taxes and levies contained in the system revenues.
Under IFRS 15, this leads to the netting of the taxes and levies contained in the system revenues.
The contributions to construction costs from customers and project partners are one-time contributions for the maintenance and installation of network connections. The contributions to construction costs collected by Wiener Netze by way of system admission and system provision charges are a regulated area, meaning that Wiener Netze’s charges can only be set in accordance with the applicable legislation and the regulator’s rulings. Contributions to construction costs received are accrued as contract liabilities and reversed over the useful life of the investments made, via revenue, in accordance with IFRS 15. An annual financing component is calculated for Wien Energie, but is not recognised due to immateriality. No financing components were recognised for Wiener Netze.
The Transport division consists of Wiener Linien and Wiener Lokalbahnen. These companies provide local public transport in the greater Vienna area, as well as other transport services on a smaller scale.
In the case of season tickets, revenue is realised over the duration of the transport agreement – one week, one month or one year. The fare represents a fixed consideration and is governed by the current tariff regulations.
The proceeds from single, multi-journey and limited-time tickets are recognised at the time of sale, even if they are not validated until later. This approach does not result in distorted presentation as it concerns a shift in accounting periods which is compensated for over time. The additional income received by Wiener Linien from passengers without a valid ticket is accounted for using the cash method of accounting.
The contracts with Wiener Lokalbahnen on which the revenues are based contain return-based variable revenue components and are concluded on a price-indexed basis over a period of several years. Advance payments by customers do not qualify for treatment as financing components as they are only made for periods of a maximum one year.
Funeral services revenue is largely realised at a point in time. The revenue generated by all the promised goods and services is realised upon performance. The date of performance is that of the funeral.
Car park revenue relates to both short-stay and long-stay parkers. It is chiefly recognised in accordance with IFRS 15, not IFRS 16, as the customers have no right to a particular parking space and the revenue is realised over time.
Revenue attributable to the Other segment relates, inter alia, to income from staff posting.
The revenue governed by IFRS 16 concerns letting and leaseholds, and largely arises from the cemeteries’ (Friedhöfe) income, as well as Wiener Linien’s rental charges for advertising and retail space (see note 9.3). In return for the payment of a grave charge, the cemeteries provide the “purchasers” with a limited right to use a given plot (usually for ten or more years). The charge is normally paid in advance on commencement of the contract, and is recognised in other liabilities. The revenue from the use of graves is recognised by means of straight-line distribution of the payment received over the contract duration (see note 8.10).
Other operating income is made up as follows:
The cost of materials and cost of purchased services was as follows:
Income from government grants as defined by IAS 20 includes performance-based grants. Most of these relate to Wiener Linien.
Sundry other income is largely composed of income from the revaluation of investments in non-consolidated subsidiaries and of associates carried at cost, amounting to EUR 15.3m (previous year: EUR 5.7m); it is also composed of other operating income that relates predominantly to Wiener Linien and is mostly made up of compensation and services in relation to maintenance contracts.
Income from government grants as defined by IAS 20 is mainly made up of those grants received by Wiener Linien from the City of Vienna under the revised local public transport and funding agreement (ÖPNV-Neu), which entered into force on 1 January 2017. The agreement was drawn up in order to safeguard operations and ensure the continued growth of local public transport in Vienna after the spin-off of Wiener Stadtwerke from the City of Vienna. As before, the City of Vienna assumes the obligation to finance the annual cash deficit of the company. The required funds are made available to the company in the form of financial compensation for public service obligations. In accordance with IAS 20, the grants made by the City of Vienna under this agreement are treated as “related to income”, applying the gross method.
The “Gas” item includes both gas for power generation and gas purchased for resale. The “Electricity” item largely consists of third-party supplies obtained through procurement rights.
For details of the accounting for CO2 emission allowances, see note 8.6.
Other operating expenses were as follows:
The Group audit expenses contained in other expenses were made up as follows:
The table below shows the regulatory income and expens
es:
Sundry other operating expenses include, among other things, write-downs of other assets amounting to EUR
(previous year: EUR 10.1m) and expenses for energy procurement amounting to EUR 7.8m (previous year: EUR 4.0m), insofar as these were not recognised as cost of materials or cost of other purchased services due to the business activity of the reporting company.
Income from regulatory business activities arises from additions to regulatory assets or disposals of regulatory liabilities. Meanwhile, disposals of regulatory assets and additions to regulatory liabilities result in expenses due to regulatory business activities.
The tables below show the composition of the regulatory assets and liabilities, and their evolution during the reporting period and the previous year.
The regulatory assets due to extraordinary expenses arise from the remeasurement of Wiener Netze GmbH’s pension obligations in connection with the transfer of these obligations to Wiener Stadtwerke GmbH in 2016.
The maturities of the regulatory assets and liabilities are as follows:
The introduction of regulatory deferral accounts by the Elektrizitätswirtschafts- und -organisationsgesetz (Electricity Act) 2010 and the Gaswirtschaftsgesetz (Natural Gas Act) 2011 established a new form of ex-post revenue adjustment. The regulatory deferral account is used to respond to circumstances that could not be taken into consideration in the previous procedure for determining costs and system charges.
The IASB has hitherto only dealt with issues affecting companies operating in the regulated market that are first-time adopters of IFRS 14 Regulatory Deferral Accounts. Due to the limitation of eligibility to apply the standard to first-time adopters of IFRS, in October 2015 the European Commission decided not to propose IFRS 14 for endorsement by the EU.
Irrespective of the failure of IFRS 14 to be adopted as European law, the IASB has always seen it as an interim standard, and its Rate-regulated Activities project is now looking at how to account for rate-regulated business activities. This project aims to create standard rules for the reporting and measurement of assets and liabilities related
to rate-regulated business activities on the basis of the Conceptual Framework, which became mandatory on 1 January 2020. A draft of the new standard was published at the beginning of 2021. The application of this standard has no effect on the recognition or amount of the regulatory items currently recognised in the Group. The presentation of regulatory income and expenses in the consolidated statement of profit or loss will remain unchanged from the previous year for reasons of consistency. The presentation required by the draft of the new standard will not be adopted for the time being.
Wiener Stadtwerke’s consolidated financial statements for the year ended 31 December 2019 were the first to be drawn up on an IFRS basis. Because of this, an accounting treatment based on the Conceptual Framework, which the Group adopted early, was developed for regulatory assets and liabilities. This is almost entirely drawn from previous pronouncements of the IASB and the recommendations of the IASB staff members engaged in the Rate-regulated Activities project. This approach was designed to reflect the effects of accounting for regulatory assets and liabilities in the first IFRS consolidated statements, as dispensing with their recognition would give an incomplete picture of the financial and earnings positions of rate-regulated businesses, as well as leading to artificial volatility in their results.
The regulatory assets and liabilities recognised by the Group relate to the regulatory operations of Wiener Netze. As the system operator of the electricity and gas grids in Vienna, Wiener Netze provides services with prices set by a regulator – in this case E-Control – which are binding for both sides. The legislation behind this rate setting – the Electricity and Natural Gas acts – governs the recognition of differences between the revenue actually generated, and that underlying the prior cost and charge determination procedure, as well as the recognition of exceptional expenses and income in connection with the regulatory deferral account, and the treatment of differences that arise from the delay in compensation for the costs on which the charges are based, due to the regulatory system created by the system charges.
The arrangements arising from the Electricity and Natural Gas acts are also the reason for carrying the regulatory assets and liabilities in the IFRS consolidated financial statements. However, the elective rights of recognition contained in the Electricity and Natural Gas acts must be so exercised that a given approach follows, as this is the only way to give a complete picture of Wiener Netze’s financial and earnings positions in the rate-regulated market.
The first-time recognition of regulatory assets and liabilities was at historical cost. This normally corresponds to the present value of the future rights and obligations recognised in the regulatory deferral account (and to be recognised when exercising all the elective rights under the Electricity and Natural Gas acts). Calculation of the present value is generally based on the discount rate applied by the regulator. Discounting only takes place at a rate set by the regulated company if the discount rate set by the regulator is regarded as inappropriate and the difference from an appropriate rate is attributable to an identifiable transaction or other event. As the regulator sets an appropriate discount rate, discounting is not necessary, and the regulatory assets and liabilities are carried in the amounts shown in the regulatory deferral accounts for electricity and gas or those established by the notices in question.
The reversal of the amounts recognised for regulatory assets and liabilities takes account of the sums cited in the tariffication procedure.
The breakdown of the inventories is as follows:
The net realisable value is the estimated selling price less the costs of completion and the costs necessary to make the sale. Appropriate impairments are recognised for inventory risk due to the length of storage or reduced marketability.
The cost of inventories is measured using the moving average cost method. Other methods, such as the weighted average cost formula, are only applied in the case of immaterial inventories. The costs of conversion of inventories include costs directly related to production (parts, materials and wages), an allocation of material and production overheads assuming full capacity utilisation (which corresponds to current normal capacity utilisation), and a reasonable allocation to production overheads at normal capacity, as well as expenses for voluntary employee benefits and company pension obligations. Interest on debt is not capitalised due to immateriality.
During the reporting period EUR 3.9m in impairments were recognised in profit or loss (previous year: EUR 1.5m). In addition, reversals of impairment losses were presented as a reduction in the cost of materials in the amount of EUR 2.0m (previous year: EUR 0.3m). No inventories have been pledged.
Inventories are measured at the cost of purchase and/or conversion. The net realisable value at the reporting date is recognised if it is lower, for instance due to falls in exchange, market or sales prices.
CO2 emission allowances are recognised on the date of allocation or purchase. Allowances allocated free of charge are measured in accordance with the net method (IAS 20) and are thus carried at zero. Those acquired for consideration are carried at cost under raw material and consumables used. If the fair value of the allowances is below cost at the reporting date, they are measured at the former. In the event of CO2 emissions, a provision for the obligation to return the allowances is recognised under cost of materials. The provision is measured at the carrying amount (average price) of the CO2 emission allowances purchased and shown under other provisions. In the event of underfunding, an additional provision is recognised; this is measured at fair value as at the reporting date.
An analysis of the current trade receivables is shown below:
In the 2022 financial year, the assessment on the required offsetting of financial assets and financial liabilities in connection with energy-related transactions changed. Due to the change that has been implemented prospectively, current trade receivables as at 31 December 2021 include amounts of EUR 61.1m that would have had to be offset based on the same assessment as in the 2022 financial year. Details can be found in note 11.5.
The table below shows the impairments, broken down by time bands:
Trade receivables are measured at the transaction price and recognised at the point in time when they arise. Trade receivables are held under a business model aimed at holding financial assets in order to collect the contractual cash flows. Measurement is at amortised cost. Details of the estimation of impairments can be found in note 14.
The other current and non-current assets are disclosed in the tables below:
The other assets include a receivable, arising from a right to a refund from the plan assets, of EUR 670.9m (previous year: EUR 527.5m).
As described in note 10.2 Employee benefit provisions, in 2018 part of the fund assets were transferred to the trust company Wiener Stadtwerke Planvermögen GmbH as security for its duty to compensate employees in the event of the loss of their pension rights.
Under IAS 19, part of the plan assets may be earmarked for use as reimbursement for benefits already paid to persons with pension entitlements without endangering the assets’ status as plan assets. The entitlement to reimbursement created in this way reduces the value of the existing plan assets. It is recognised in this amount as a claim against the plan assets. Pursuant to IAS 19, measurement is at fair value, which is normally the nominal amount due to the fact that it is repayable on demand.
Although this means that some of the assets held as plan assets no longer exist exclusively to fund employee benefits, the income generated by the part of the plan assets that is devoted to meeting the claim to reimbursement continues to be earmarked for the plan assets. Consequently, until the entitlement is actually exercised, the reimbursement right has no influence on the amount carried as income from the plan assets. As usual, the latter are recognised in other comprehensive income, net of interest income. As required by IAS 19, any impairments are recognised in other comprehensive income and not in profit or loss.
Accrued revenue from contracts with customers must be stated separately from other income sources. Such revenue is recognised as contract asset items under other assets, or as a contract liability under other liabilities.
A contract asset represents the right to subsequent consideration (e.g. the right to future collection of a higher base rate due to the delivery of a product) and is thus the precursor to a receivable. It results in the realisation of revenue. A contract asset item becomes a receivable when an unconditional right to consideration comes into being.
A contract liability arises from the obligation of an entity to transfer goods or services for which it has received consideration from a customer.
The evolution of investment property, which is reported under non-current assets in the statement of financial position, was as follows:
The cost of purchasing and converting investment property is presented net of government grants (net method). These amounted to EUR 9.0m (previous year: EUR 9.1m). This had the effect of reducing depreciation by EUR 0.1m in 2022 (previous year: EUR 0.1m).
The fair value of the Group’s investment property is EUR 199.1m (previous year: EUR 151.2m). Rental income totalled EUR 20.1m (previous year: EUR 19.9m) and the operating expenses of rental property were EUR 5.4m (previous year: EUR 3.3m).
The investment property consists of property held to earn rentals or for capital appreciation, and not for use in the supply of services or for administrative purposes, or for sale in the ordinary course of business. This item is valued according to the cost model. Thus, they are accounted for and valued like property, plant and equipment (see note 9.1).
The Group applies the following methods to measure the fair value of real estate:
• the capitalised income value method and
• the asset value method.
The Wiener Stadtwerke Group principally uses the capitalised income value method. Here, the value is determined on the basis of the future income from the property (Level 3). The asset value method is mainly used for vacant sites. The value is determined on the basis of comparable transactions (Level 2).
Other non-current assets
Other non-current assets include shares in non-consolidated affiliated companies amounting to EUR 101.3 m (previous year: EUR 104.0m) and non-current accrued items for Friedhöfe Wien.
The other current assets primarily include other receivables from taxes and other receivables from investees.
Trade payables were as follows:
As with trade receivables (see note 8.7), trade payables as at 31 December 2021 also include an amount of EUR 61.1m that would have had to be offset based on the same assessment as in the 2022 financial year. Details can be found in note 11.5.
Greater investment volume in the Transport division led to increased total trade payables. Another reason behind the increase is the revised pricing for energy levies due to the package of measures introduced by the Austrian federal government from Wiener Netze.
Trade payables to associates include bills for both Wien Energie Vertrieb GmbH & Co KG and Energieallianz Austria GmbH.
Other current and non-current liabilities were as follows:
Other non-current liabilities
The contract liabilities are mainly made up of customer contributions to construction costs collected by Wiener Netze and Wien Energie. Detailed notes on the contract liabilities can be found in note 8.1 Revenue and note 8.8 Other assets and contract assets.
Further information on current and non-current regulatory liabilities is given in note 8.5.
Other current liabilities chiefly concern amounts due to the City of Vienna tax office. These show temporary financing surpluses as well as current accruals from Personnel. Other non-current liabilities include accruals of prepayments of grave use fees to the cemeteries (see note 8.1).
Also included in the item other current liabilities is the accrual for prior service in the amount of EUR 29.8m (previous year: EUR 27.3m). In light of rulings by the Supreme Administrative Court and the European Court of Justice, the City of Vienna has revised the current rules for recognition of prior service for permanent civil servants and contract staff. Under the new ruling, the City of Vienna must address the process through official channels, so a large number of employees are affected. The first additional payments were made in 2022 and totalled EUR 0.2m.
The consolidated statement of cash flows shows the change in the Group’s cash and cash equivalents during the reporting year as a result of cash inflows and outflows. Cash flows from earnings, operating activities, investing activities and financing activities are shown separately. The Wiener Stadtwerke Group uses the indirect method of presentation. Here, non-cash expenses and income are added to or deducted from the pre-tax result.
The composition of cash and cash equivalents can be found in note 11.2 Cash and cash equivalents.
The changes in working capital led to a negative cash flow from operating activities in the 2022 financial year. This development is mainly due to outflows in connection with margin payments at Wien Energie amounting to EUR 539.1m, the increase in current financing receivables from Wien Energie Vertrieb GmbH by EUR 455.0m and inventories that were EUR 234.8m higher.
Investments are presented in the statement of cash flows net of investment grants received. Grants received for which no investments have yet been made are deducted from cash outflows for investments in non-current assets. Subsidies received in the financial year under review amount to EUR 452.4m (previous year: EUR 243.5m). The non-cash additions to intangible assets and property, plant and equipment amounted to EUR 83.8m (previous year: EUR 41.9m).
The cash flow from financing activities of EUR 1,734.3m mainly includes short-term borrowing in the amount of EUR 2,120.0m, which is offset by repayments of EUR 356.4m. With regard to current and non-current lease liabilities, the non-cash financing transactions amounted to EUR -33.7m (previous year: EUR -17.0m). Cash outflows for leases amounting to EUR 12.3m (previous year: EUR 11.1m) in the reporting period are recognised in the cash flow from financing. The lease interest component amounting to EUR 2.0m (previous year: EUR 1.9m) is included in the cash flow from the net income.
Changes in property, plant and equipment were as follows:
The cost of purchasing the balance sheet items listed above is presented net of government grants (net method).
As of 31 December 2022 these amounted to EUR 6,380.9m (previous year: EUR 6,214.1m). This had the effect of reducing depreciation by EUR 314.7m in 2022 (previous year: EUR 315.8m).
Other changes are included in the right-of-use assets column in the cost table and the accumulated depreciation, amortisation and impairment table. This column relates to the one-time change to all of Wiener Netze’s lease contracts, which were recalculated using new software. The effect arising from the new values in relation to assets and lease liabilities amounts to EUR 0.1m and is included in sundry other income.
Pledged property, plant and equipment, and other collateral or restricted assets
The carrying amount of property, plant and equipment pledged as collateral was EUR 51.4m (previous year: EUR 12.2m). The carrying amount of other restricted property, plant and equipment was EUR 7.8m (previous year: EUR 9.0m).
The carrying amount of property, plant and equipment under construction was EUR 413.9m (previous year: EUR 339.3m). The majority of this is attributable to Wiener Netze GmbH (EUR 213.3m; previous year: EUR 184.9m).
See note 7.1 regarding changes in the scope of consolidation in 2022 and in the previous year.
On recognition, items of property, plant and equipment are measured at cost, including attributable borrowing costs. No borrowing costs in the meaning of IAS 23 were recognised in the consolidated financial statements in the previous year or in 2022. After recognition, assets are measured at cost less any accumulated depreciation and accumulated impairment losses, using the cost model.
Subsequent costs are recognised if it is probable that future economic benefits will flow to the Group and the costs can be measured reliably. Expenses for repairs and maintenance that do not represent a significant investment in replacement parts are recognised in profit or loss in the period in which they are incurred. Regular major inspections are treated as replacements and depreciated over the inspection interval. In this case, the costs of the inspection are recognised.
Investment grants are mostly received from the City of Vienna and the Austrian federal government. These are classified as government grants in accordance with IAS 20, which applies when accounting for them. Government grants are presented as a reduction in the cost of the assets for which they are intended to compensate. They are recognised as soon as there is reasonable assurance that the Group will comply with the conditions attached to them.
Depreciable items of property, plant and equipment are depreciated or amortised on a straight-line basis according to their useful lives. If there is an indication that an asset may be impaired and its carrying amount exceeds the present value of future cash flows, an impairment loss is recognised, reducing the asset’s carrying amount to its recoverable amount, in accordance with IAS 36. If an impairment loss recognised in a prior period no longer exists, a reversal is recognised in profit or loss. The increased carrying amount may not exceed the carrying amount that would have been determined had no impairment loss been recognised for the asset in prior periods.
The following useful lives were applied for depreciation of property, plant and equipment:
Methods of depreciation, useful lives and residual values are reviewed at the end of each financial year and adjusted if necessary. Land is not depreciated.
See note 9.5 for information on the assessment of assets for impairment testing purposes in accordance with IAS 36.
Changes in intangible assets were as follows:
The cost of purchasing intangible assets is presented net of government grants (net method). These amounted to EUR 62.3m (previous year: EUR 60.9m). This had the effect of reducing depreciation by EUR 4.2m in 2022 (previous year: EUR 2.9m).
Concessions include easements with a carrying amount before grants of EUR 39.7m (previous year: EUR 38.2m), which have an indefinite useful life. In addition this mainly comprises electricity procurement rights and similar energy use rights.
CONSOLIDATED FINANCIAL STATEMENTS
9 Non-current assets and liabilities
In the reporting year, EUR 21.9m in development expenditure was capitalised (previous year: EUR 20.2m) and research costs of EUR 2.3m were recognised as expenses (previous year: EUR 4.4m).
Intangible assets with finite useful lives are recognised at cost less accumulated amortisation and impairment losses. No borrowing costs in the meaning of IAS 23 were recognised in 2022 or 2021. See note 9.5 for information on the assessment of assets for impairment testing purposes in accordance with IAS 36.
As in the previous year, the following useful lives were applied for amortisation of intangible assets:
Research expenditure is recognised in profit or loss when it is incurred. In accordance with IAS 38, an intangible asset arising from development is only recognised if costs attributable to the intangible asset during its development can be reliably measured, the product or process is technically and commercially feasible, it will generate probable future economic benefits, and the Group intends to complete the intangible asset and use or sell it, and has the ability to do so. Other development expenses are recognised in profit or loss when they are incurred. Intangible assets arising from development are recognised at cost less accumulated amortisation and impairment losses. The Group’s assets of this type principally comprise internally-produced software.
Subsequent expenditure is only added to the carrying amount of an intangible asset if it increases the future economic benefits of the asset in question.
Methods of depreciation, useful lives and residual values are reviewed at the end of each financial year and adjusted if necessary. Easements subject to a one-off acquisition cost are recognised as intangible assets. Easements related to energy supply equipment are amortised over their useful lives.
In contrast, easements attributable to Wiener Linien have indefinite useful lives, as they relate to land and are usually entered in the land register.
See note 9.5 for details on the measurement of goodwill as well as impairment testing.
The following table shows the carrying amounts of right-ofuse assets:
Changes in right-of-use assets are presented under property, plant and equipment (note 9.1).
For reasons of materiality, the table above does not include rights of use for construction management offices that are rented during the construction of sections of the Vienna underground network, as depreciation is included in full in the cost of the assets recognised under property, plant and equipment. The carrying amount of EUR 4.6m (previous year: EUR 6.0m) is included in assets under construction (see note 9.1). The useful lives of these rights of use range from one to seven years.
The following amounts were recognised in profit or loss for the reporting period:
Lease contracts grant the Wiener Stadtwerke Group the right to control and use an asset for a specified period of time in exchange for a specific consideration. Rights of use for intangible assets are not recognised as leases.
From the date of commencement of a lease, a right-of-use asset reflecting the right to use the underlying asset for the term of the lease, and a lease liability are recognised in the statement of financial position. The lease liability represents the present value of the lease payments. Because lease contracts are a form of financing contract, lease liabilities are presented under financial liabilities and the effective interest method is used for subsequent measurement. Lease payments therefore represent repayment of the lease liability. The cost of the right-of-use asset comprises the amount of the lease liability as well as any initial direct costs incurred, any lease incentives received, and any costs recognised as a restoration provision (see note 9.6). Right-of-use assets are measured in the same way as property, plant and equipment, and depreciated on a straight-line basis over the lease term; in case of impairment, an impairment loss is recognised.
Most of the expenses relating to short-term leases or leases of low-value assets relate to short-term leases in the Wiener Lokalbahnen Group.
See also note 11.4 for details of lease liabilities. A summary of future cash outflows of contractual lease payments can be found in note 14 Risk management.
Rights of use for land and buildings mainly comprise tenancy agreements for office space, other buildings (e.g. Wiener Linien stations) and Wipark’s car park leaseholds and tenancy agreements. Many of the latter contain revenue-based rent components, which are included in expenses for variable lease payments.
Rights of use for plant and machinery principally comprise electric locomotives used by Wiener Lokalbahnen Cargo to offer transportation services. Rights of use for other equipment mainly comprise cars leased for use by staff. Some of these contracts include variable payments based on the distance driven. The contracts do not contain residual value guarantees that would need to be included in the lease liability in case of expected payments.
Lease payments comprise fixed payments, approximate fixed payments, the exercise price of any purchase option and penalties for terminating the lease if the Group is reasonably certain to exercise such options, as well as any amounts expected to be payable under residual value guarantees. Adjustments based on the consumer price index and other price increases are recognised only when they become applicable. In case of amendments to the contract or a change in the lease term, the lease liability is reassessed and the right-of-use asset is adjusted accordingly. Use-based or revenue-based payments are not included in the lease liability, but are recognised in other expenses. For materiality reasons, very small payments that are regularly due in relation to rights of use for land are also recognised in other expenses.
9 Non-current assets and liabilities
The discount rate for lease payments is an intercompany incremental borrowing rate, as Wiener Stadtwerke is financed at Group level. Negative rates are not used, since they would not be applied even if Wiener Stadtwerke took out refinancing. A discount rate is determined for the term of each lease.
In principle, however, the marginal borrowing rate is only applied if the internal rate of return of the underlying leasing transaction is not known.
The lease term is estimated considering the periods of extension or termination options, depending on whether the Group is reasonably certain to exercise such options. The following is applied in case of leases with indefinite terms: for undeveloped land, the lease term is 40 years for reasons of materiality. For built-up land, the lease term is based on the remaining useful life of the building, and for plant and machinery it is based on the remaining useful life of the equipment. These methods provide guidance if there is no other way to determine useful life. Lease terms are regularly reviewed and adjusted as necessary.
The right-of-use asset is depreciated over the lease term. In the financial year, depreciation of rights of use amounted to EUR 14.1m (previous year: EUR 13.3m).
Wiener Stadtwerke applies the following practical expedients to simplify lease accounting:
• Payments for leases with a term of less than twelve months and for leases of low-value assets (approx. under EUR 5,000) are recognised in other expenses. This mainly relates to the rental of mobile phones, laptops, photocopiers and coffee machines.
• Any service components included in lease payments are not accounted for separately, but as part of the lease payment.
Wiener Stadtwerke Group is also a lessor. All lease contracts are classified as operating leases. The majority of lease income is made up of income from Friedhöfe Wien GmbH, and rental fees paid to Wiener Linien for advertising and retail space. Friedhöfe Wien GmbH’s income from grave lease extensions is paid in advance for the full term and reversed annually. A more detailed breakdown and information on accounting and measurement methods can be found in note 8.1.
The table below shows the minimum gross lease payments.
Classification
On inception date of the contract, each lease is classified as either an operating lease or a finance lease. A finance lease transfers substantially all the risks and rewards incidental to ownership of an underlying asset from Wiener Stadtwerke to the lessee. For example, this is the case when the lease term extends over the material useful life of the underlying asset, when the lessee has the option to purchase the underlying asset at a favourable price, when the present value of the lease payments amounts to at least substantially all of the fair value of the underlying asset, or when the underlying asset is of a specialised nature. Wiener Stadtwerke Group is not party to any finance leases.
Lease payments from operating leases must be recognised as income on a straight-line basis or another systematic basis if that basis is more representative of the pattern in which benefit from the use of the underlying asset is diminished – regardless of when rental/lease payments are received. Costs incurred in earning the lease income, including depreciation, are recognised as an expense. The underlying asset continues to be recognised under property, plant and equipment, or in the case of real estate under investment property, and is measured accordingly.
Depreciation and amortisation were as follows:
Property, plant and equipment and intangible assets, including goodwill, are tested for impairment if there is an indication that an impairment loss may have occurred. Goodwill, and intangible assets with an indefinite useful life, are tested for impairment at least annually.
At the Wiener Stadtwerke Group, possible indications of impairment mainly arise from changes in cash flow assumptions (changes in costs or revenue) or changes due to regulatory and supply policy decisions.
An asset is impaired when its carrying amount exceeds its recoverable amount. The recoverable amount is the higher of fair value less costs of disposal and value in use (the present value of future cash flows). If the carrying amount exceeds the recoverable amount, the difference is recognised in profit or loss as an impairment loss. When there is an indication that an impairment loss recognised in prior periods for an asset other than goodwill may no longer exist, a write-up is applied to the asset’s carrying amount. This reversal of the impairment loss is recognised in profit or loss.
If an impairment loss is recognised for a cash-generating unit (CGU), the reduction in the carrying amount is applied first to any goodwill. If the impairment loss exceeds the carrying amount of goodwill, the difference is allocated to the carrying amounts of other assets of the CGU on a pro rata basis. The effects of impairment tests on CGUs are presented separately in the statement of profit or loss.
If there is an indication that a specific asset may be impaired, an impairment test is carried out for that asset only. Any impairment loss is recognised in operating profit or loss.
When measuring value in use, estimates of future cash flows for the CGU in question are carried out in accordance with IAS 36. Business planning principally comprises a detailed five-year budget. For individual CGUs, including goodwill, this is supplemented by rough planning for the remainder of the contract term or useful life. A perpetuity is then assumed, or – if shorter – the cash flow over the remaining contract term or useful life. A fixed growth rate is not applied, but budget parameters are indexed in line with a consumer price index.
A discount rate based on the weighted average cost of capital (WACC) is applied. The cost of equity in the WACC comprises the risk-free rate of interest, a country premium and a risk premium incorporating the market risk premium and the beta factor based on peer group capital market data. The cost of debt comprises the base rate of interest, a potential country premium and a risk premium dependent on credit rating. Market values are used to determine the weighting of debt and equity, using an adequate capital structure for the CGU in question based on peer group data. The resulting WACC is used to discount the projected future cash flows for the CGU or asset. The composition of the peer group is reviewed annually and adjusted as necessary by the Group.
Impairment testing is carried out and documented using the Group’s WACC tool.
The key criterion for definition of a CGU is technical and economic independence in generating cash inflows. For Wiener Stadtwerke, this applies to Wien Energie’s district heating system, power generation fleet (combined heat and power, and boilers), hydroelectric plants, wind farms and electricity procurement rights; Wipark’s car parks/car park conglomerates; Wiener Netze’s electricity and gas grid; and, if no other differentiation is possible, individual companies that contain profit-generating assets (Wiener Linien, individual businesses in the Wiener Lokalbahnen Group and the Funeral Services and Cemeteries division).
All of the Group’s reported CGUs are located in Austria.
Wien Energie
Wien Energie calculates value in use in order to determine any impairment.
For the Pottendorf wind farm, which includes goodwill, forecasts to 2035 have been made and the WACC is 5.10%. The recoverable amount is EUR 21.9m higher than the carrying amount. Only a change in the WACC to around 12.43% would bring the carrying amount to the same level as the value in use.
Wipark calculates value in use for all CGUs when there is an indication of impairment. Cash flow projections are limited to the remaining useful life of the car park or car park conglomerate, or the remaining contract term in the case of other rights.
The current regulatory framework ensures that Wiener Netze’s gas and electricity grid assets are recognised in full when determining tariffs. As this guarantees that assets are fully accounted for, there is currently no indication of impairment of gas and electricity grid assets.
Based on the local public transport and funding agreement, the City of Vienna provides Wiener Linien with the necessary funding for the acquisition or creation of assets required to perform the services it provides. In accordance with IAS 20, assets are netted against government grants (net presentation). Impairment tests are carried out for other assets when there is an indication that they may be impaired. There were no such indications in the current reporting period.
Cash flow return on investment (CFROI) is used to determine whether there is an indication that assets in Wiener Lokalbahnen may be impaired. The CFROI shows the internal rate of return that would be achieved if (gross) capital was invested now and the return earned through net cash from operating activities flows over the useful life of the investment. If the return is higher than the cost of capital, invested capital is covered and there is no indication of impairment. The cost of capital is based on the regulated electricity and gas networks, which have comparable opportunity and risk profiles (due to incentive regulation). There were no indications that assets may be impaired in the reporting period.
In the other companies of the Lokalbahnen Group (Wiener Lokalbahnen Cargo and Wiener Lokalbahnen Verkehrsdienste), there was also no impairment requirement after determining the fair value less costs to sell.
Impairment tests are not carried out at companies in the Funeral Services and Cemeteries division unless there is an indication of impairment.
Value in use is determined for all companies when carrying out impairment tests.
The impairment losses and reversals in the Wiener Stadtwerke Group are shown in a separate item in the income statement after being offset.
Material amounts relate to the following CGUs:
There were no impairments or reversals in the current financial year.
For the car parks of Wipark, there is a total depreciation requirement of EUR 0.9m for 2022 (previous year: EUR 1.7m). This is mainly due to a change in parameters from the WACC (change in the interest rate landscape) compared to the previous year.
Due to stable revenue, a slight upward trend is apparent for most car parks. In the case of one car park, this resulted in a need for a write-up totalling EUR 0.1m in the financial year (previous year: EUR 0.1m).
Changes in provisions were as follows:
Restoration provisions relate mainly to power plant decommissioning obligations.
The allocation to other provisions mainly relates to Wiener Lokalbahnen, which formed an overcompensation provision from the transport services agreement. The Wiener Linien provision regarding a court case in connection with unequal treatment in ticket sales was adjusted and allocated in the financial year.
In the previous year, provisions were set up at WLC for possible customer claims associated with refunds from train line subsidies or infrastructure usage charges in the course of the COVID relief measures. Parts of the provisions were reversed in 2022, as the expected refund amounts were reduced. Likewise, provisions set up in 2020 and 2021 for subsequent charges for traction current were reversed following receipt of the final invoices.
A provision is recognised in accordance with IAS 37 when the Group has a legal or constructive obligation to a third party based on a past transaction or event, it is probable that an outflow of resources embodying economic benefits will be required to settle the obligation, and the latter can be reliably estimated. All identifiable risks are taken into account when determining the amount of the provision, and any possible rights of recourse are excluded.
For long-term provisions, future cash flow estimates are discounted using a pre-tax discount rate that reflects current market assessments of the time value of money and the risks specific to the liability. Since future cash flow estimates are adjusted for risks, a risk-free discount rate is applied.
Provisions for restoration are recognised as part of the cost of the asset in question and depreciated. Any new estimates that result in a change to the amount for which a provision is recognised are also included in the non-current assets.
The table below provides an analysis of the Group’s personnel expenses.
The Group’s average head count (FTE), excluding employees on parental leave, as well as conscripts and community service workers, was as follows:
The table below shows a breakdown of the employee benefit provisions:
Social security expenses include EUR 29.1m (previous year: EUR 29.9m) in spending on defined contribution pension plans, as well as EUR 7.3m (previous year: EUR 6.5m) in contributions to the employee pension fund (“new” termination benefits). See note 7.4 for disclosures pursuant to IAS 24.
Movements in defined benefit pension obligation and plan assets were as follows:
Pension payments are expected to total EUR 186.6m in 2023. The average maturity of the pension obligation (average capital commitment period) is 13.77 years (previous year: 17.12 years).
The table below gives a breakdown of the plan assets:
The pension provisions were calculated on the basis of the following actuarial assumptions:
Actuarial assumptions with regard to pension obligations
Movements in the termination benefit obligation are as follows:
* In addition to future wage and salary increases, the death benefit is valorised at 3.15% for 2023 and 1.95% for 2024 (previous year: 1.60%).
The following sensitivity analysis sets out the effects of changes in forward-looking assumptions on the carrying amount of the gross pension provision.
Termination benefits are expected to total EUR 3.2m in 2023. The average maturity of the termination benefit obligation (average capital commitment period) is 11.33 years (2018: 12.67 years).
The termination benefit provisions were calculated on the basis of the actuarial assumptions below:
Actuarial assumptions with regard to termination benefit obligation
Payments in kind are expected to amount to EUR 5.2m in 2023. The average maturity of the payment-in-kind obligation (average capital commitment period) is 12.64 years (previous year: 17.53 years).
The payment-in-kind obligation was calculated on the basis of the following actuarial assumptions:
Actuarial assumptions with regard to payment-in-kind obligations
The following sensitivity analysis below sets out the effects of changes in forward-looking assumptions on the carrying amount of the termination benefit obligation. Sensitivity analysis of termination benefit obligation
The above sensitivity analyses show the effects of hypothetical changes in the key parameters on the present value of the obligations that are reasonably possible at the end of the reporting period. The calculation of the obligation on the basis of changed parameters mirrored that of the obligation reported in the statement of financial position. One parameter at a time was changed while the others were kept constant. As a result, no account could be taken of any interactions between individual actuarial parameters. However, in reality it is probable that changes in key parameters would also bring about shifts in other parameters.
Changes in the provision for payments in kind are as follows:
IAS 19 defines employee benefits as all forms of consideration given by an entity in exchange for service rendered by employees or for the termination of employment. The standard thus applies to all employee benefits, in particular those provided under formal plans or other formal agreements with employees or their representatives, including the employer’s social security contributions applicable to such benefits.
The Group has defined benefit obligations arising from pension plans, statutory termination benefits, jubilee benefits and provisions for anniversary bonuses, and payments in kind.
Due to the existence of works agreements, there are defined contribution pension commitments, for which the Group makes contributions to a pension fund. These are recognised as personnel expenses. Prepaid contributions are recorded as assets if there is an entitlement to the reimbursement or reduction of future payments.
The amount of the obligations arising from defined benefit plans is computed using the projected unit credit method. The calculation is performed annually by a certified actuary. The fair value of plan assets is always deducted from the pension obligation in order to arrive at the provision shown in the statement of financial position. However, rights to reimbursements paid for out-of-plan assets are shown under other assets.
Service cost, comprising current and past service cost, as well as gains and losses on plan curtailments and non-routine settlements, are reported as personnel expenses. Past service cost is recognised as personnel expenses, in profit or loss, at the earliest of the following dates: when a plan amendment or curtailment occurs, or when the Group recognises related restructuring costs.
Net interest is determined by applying the discount rate to the balance of defined benefit obligation and the plan assets held in connection with the defined benefit plan. Net interest expense or income are reported under net finance costs.
Remeasurements of the net pension obligation are shown under other comprehensive income, in the reserve for employee benefit provisions. They are reclassified to profit or loss in subsequent periods. They comprise actuarial gains and losses, any effects of an asset ceiling, and income and expense arising from the measurement of plan assets, other than interest, which is recognised in net finance costs.
The corporatisation of the Wiener Stadtwerke Group companies in 1999 led to the assignment of the workforce to the hived-off operations without their employment contracts with Vienna City Council being terminated or amended. The pension entitlements of the employees concerned vis-à-vis Vienna City Council are unchanged.
Under the Vienna Public Enterprises Secondment Act, the Group companies are obliged to bear the pension expenditure on behalf of the employees assigned to them (duty to replace pensions). This duty extends both to current pension payments and future pension expense. Due to the assumption of the duty to replace the pensions of assigned staff members, the Group companies concerned have indirect pension obligations. Commitments are made to pay individual employees benefits in given amounts. These pension obligations should therefore be treated as defined benefit obligations according to IAS 19.
Under IFRS, the Group companies affected have a duty to recognise pension provisions for the future benefits. The current salary and pension payments are made directly by Wiener Stadtwerke, even if plan assets exist. Where the latter is the case, this gives rise to a right to reimbursement chargeable against the plan assets. This entitlement is presented as a receivable, under other non-current assets.
Wiener Linien is unaffected as it is not obliged to recognise a provision, owing to the existence of a net pension spending cap agreement with Vienna City Council. Instead, ongoing payments are made to the City of Vienna; these are treated as personnel expenses.
In the course of the integration of Friedhöfe Wien GmbH with Wiener Stadtwerke, a special agreement on the former’s permanent civil servants was made with the City of Vienna, under which Wiener Stadtwerke no longer bears any risk and hence it is not necessary to recognise a provision. Friedhöfe Wien GmbH made a one-time payment, shown under accrued and deferred income, and reversed under personnel expenses over the remaining active service of the civil servants concerned.
In 2018 some Wiener Stadtwerke Group companies (Wien Energie GmbH, Wiener Stadtwerke GmbH and Bestattung und Friedhöfe GmbH [B&F Wien]) transferred part of their holdings of fund units to a trustee – Wiener Stadtwerke Planvermögen GmbH, a newly established company set up to perform fiduciary management of the funds – as security for their pension obligations. A long-term investment strategy designed to ensure coverage of future pension payments is pursued with regard to plan assets.
The trust company Wiener Stadtwerke Planvermögen GmbH is the civil-law owner of the WSTW funds transferred to it, while the Group companies remain the beneficial owners.
These assets are earmarked as backing for the duty to replace pensions, and are offset by the defined benefit obligation of the Wiener Stadtwerke Group. They are classified as plan assets in the meaning of IAS 19. The assets designated as plan assets are not shown on the assets side of the statement of financial position, but are offset against the pension provisions.
The ongoing administrative expenses and tax liability charged against the plan assets reduce the income from the latter, and must be recognised as part of the remeasurements of net liabilities, and accordingly carried in other comprehensive income.
Any additional rights to reimbursement reduce the gross value of the plan assets (see section 8.8).
Depending on their length of service, Austrian employees may have a statutory right to a one-time payment on retirement or termination by the employer (“old” termination benefit). Provisions for termination benefits are recognised to meet this future obligation. The latter arises from a defined benefit plan as defined by IAS 19, which is accounted for in a similar manner to the defined benefit pension plans. There are no plan assets. For Austrian employees whose employment began after 31 December 2002, employers make a monthly contribution of 1.53% of the gross salary to a pension insurance fund. The latter is a defined benefit plan in the meaning of IAS 19. The employer’s payments are recognised as personnel expenses.
In addition to the above plans, some civil servants are entitled to allotments of energy supplies both during their employment and in retirement. The benefits received during these employees’ active service are stated as salary expense. A provision is recognised for post-retirement benefits. As this is inherently a defined benefit plan, the provision is accounted for and measured in the same way as such plans.
Some Group employees have entitlements to jubilee benefits and anniversary bonuses due to their length of service. Provisions are recognised for these obligations in accordance with the projected unit credit method. Measurement is essentially the same as with the defined benefit pension plans. However, actuarial gains and losses are recorded in profit or loss, not other comprehensive income.
income is broken down as follows:
The breakdown of finance costs was as follows:
The net change in the value of financial assets mandatorily measured at FVPL was predominantly related to Wiener Linien foreign currency forwards.
11 Financial instruments
Net gains on financial instruments during the reporting period and in the previous period are shown below.
This item includes cheques, cash on hand, demand deposits, and short-term investments with fixed maturities of less than three months which are recognised at nominal value.
The following tables provide an overview of current and non-current financial assets:
*Classified as restricted cash.
Cash and cash equivalents include amounts held in controlled investment funds. The Group does not have direct immediate access to these amounts. However, the commitment period for these funds may not exceed three months at the time of investment. The remaining cash and cash equivalents are short-term investments related to the cash pooling arrangement, which also have maturities of less than three months.
The significant drop in financial assets from hedging instruments as against the previous year is mainly due to the changes in the assessment regarding the extent to which derivative financial instruments can be offset pursuant to IAS 32. In the case of non-current financial assets, the same assessment as in the financial year ended 31 December 2021 would result in an effect from offsetting of EUR -218.0m; in the case of current financial assets, this effect would amount to EUR -2,587.5m. In addition, this means that current trade receivables as at 31 December 2021 include amounts of EUR 61.1m that would have had to be offset based on the same assessment as in the 2022 financial year. Further details can be found in note 11.5 Offsetting financial assets and financial liabilities.
CONSOLIDATED FINANCIAL STATEMENTS
11 Financial instruments
The table below shows the classification of financial assets for the reporting period and the previous period.
* The effects arising from the measurement of derivative financial instruments are mostly recorded under other comprehensive income. For more information, see note 11.7 Hedge accounting.
As at 31 December 2022, Wiener Stadtwerke had investments in equity instruments for which, due to the long-term holding intention, it irrevocably elected to present subsequent changes in fair value in other comprehensive income, in accordance with IFRS 9. The breakdown of these equity instruments is described below.
Other investments (FVOCI)
Wiener Stadtwerke holds an interest of 13.44% (previous year: 13.44%) in Verbund AG. This is a strategic investment. The fair value of this investment as at 31 December 2022 was EUR 3,671.7m (previous year: EUR 4,617.1m). In the 2022 financial year, dividends totalling EUR 49.0m (previous year: EUR 35.0m) were received from this investment.
Wiener Stadtwerke holds a total interest of around 28.36% (previous year: 28.36%) in EVN AG as at 31 December 2022. Although a significant influence could be assumed on the basis of the shareholding, the analysis of the indicators listed in IAS 28.6 led to the conclusion that Wiener Stadtwerke GmbH cannot exercise a significant influence on EVN AG in accordance with IAS 28.
This primarily results from the position of the majority shareholder, which has been strengthened even further by the articles of association of EVN AG. It is therefore reported under non-current financial assets measured at FVOCI. The Group views this acquisition as a long-term investment and as a financial investment.
The fair value of this investment as at 31 December 2022 was EUR 862.1m (previous year: EUR 1,357.0m). In the 2022 financial year, dividends totalling EUR 62.5m (previous year: EUR 25.0m) were received from this investment. As at 31 December 2022, EVN AG’s equity totalled EUR 7.3m, with annual results of EUR 0.2m.
Wiener Stadtwerke owns a 2.80% interest in Verbund Hydro Power AG through Wien Energie GmbH. This is also a strategic investment and its fair value at 31 December 2022 was EUR 573.8m (previous year: EUR 572.0m). In the 2022 financial year, dividends totalling EUR 14.0m (previous year: EUR 9.8m) were received from this investment.
Wiener Stadtwerke holds a 6.59% stake in Burgenland Holding AG through Wien Energie GmbH, also for strategic purposes. The fair value of this investment as at 31 December 2022 was EUR 18.0m (previous year: EUR 19.5m). In the 2022 financial year, dividends totalling EUR 0.7m (previous year: EUR 0.7m) were received from this investment.
In addition to the aforementioned investments, the Group holds other, smaller investments with fair values of less than EUR 0.5m. Dividends and other distributions paid to the Group in 2022 in connection with these investments totalled EUR 0.1m (previous year: EUR 0.1m).
As at 31 December 2022, Wiener Stadtwerke held securities in the form of long-term investments in a total of seven special funds. At the end of 2018, special funds WSTW I, II, III and V were designated as plan assets in accordance with IAS 19. The remaining special funds IV, VI and VII will continue to be recognised in Wiener Stadtwerke’s consolidated financial statements at 31 December 2022, in accordance with IFRS 10.
Equity instruments account for a part of the investments held through the special funds. The management of these equity instruments is aimed at replicating a global share index. As the investment strategy is geared towards long-term capital preservation as opposed to achieving short-term profit from changes in share prices, all of the equity instruments held by the Group are classified as measured at fair value, outside profit or loss. However, from a management perspective, reallocations can be made within the portfolio.
As at 31 December 2022, 158 shares (previous year: 154) were designated as investments measured at fair value outside profit or loss, and their fair value amounted to EUR 141.5m (previous year: EUR 188.7m). The breakdown of the investments by region/country in 2021 and 2022 was as follows:
In 2022, dividends received from shares (FVOCI) totalled EUR 4.7m (previous year: EUR 4.6m). Due to the portfolio’s diversification, the intention is to depict a global share index, and as such targeted purchases and sales of individual securities were made (FVOCI).
Financial assets recognised in accordance with IFRS 9 Financial Instruments are initially recognised on the trading date when the Group becomes a contracting party under the contractual terms of the instrument. A financial asset is carried at fair value on initial recognition. Transaction costs arising directly from the purchase or disposal of the assets concerned are included in all items not measured at FVPL.
For the purpose of subsequent measurement, a financial asset is allocated to one of the following measurement categories, depending on the business model within which the asset is held and the nature of the contractual cash flows for the asset:
• Measured at AC
• Debt instruments measured at FVOCI
• Equity instruments measured at FVOCI
• Measured at FVPL
With regard to other investments recognised in accordance with IFRS 9 as well as special funds operated within the Group, use was made of the option to recognise subsequent changes in fair value in other comprehensive income. These equity instruments include investments that the Group intends to hold in the long term, as well as investments in shares and share-like instruments held by the special funds for the purpose of achieving long-term increases in value.
Interests in non-consolidated subsidiaries and associates are not covered by IFRS 9. They are included in other assets and are recognised at amortised cost, and impairment losses are recognised where necessary.
Loans and current investments are held within a business model whose objective is to hold financial assets in order to collect contractual cash flows. These financial assets are therefore measured at amortised cost using the effective interest method. However, if the contractual cash flows do not solely represent payments of principal and interest under the terms of the contract, measurement at amortised cost is no longer permitted, regardless of the business model within which the assets are held. In this case, the assets are measured at fair value through profit or loss.
Bonds and other debt instruments within the special funds are held in accordance with a business model whose purpose is to collect contractual cash flows and to sell financial assets. Therefore, the assets are measured at fair value through other comprehensive income, not in profit or loss, provided that the contractual terms give rise to cash flows that solely represent payments of principal and interest. If this criterion is not met, measurement is at fair value through profit or loss. For this reason, investment fund units are allocated to the FVPL category.
Financial assets are not reclassified after initial recognition, unless the Group changes the business model under which the assets are managed. As in the previous year, no changes were made to the Group’s business model during the reporting period.
Under IFRS 9, derivative financial instruments are always measured at fair value through profit or loss. If financial instruments are used as hedging instruments in a hedging relationship in accordance with IFRS 9, the gains or losses from instruments used as fair value hedges are recognised either in profit or loss or in other comprehensive income, depending on the hedged item. In the case of instruments used as cash flow hedges, the portion of the gain or loss on the hedging instrument that is determined to be an effective hedge is recognised in other comprehensive income. Any remaining gain or loss on the hedging instrument is hedge ineffectiveness and is recognised in profit or loss.
With effect from 31 December 2018, the Group designated some of the special funds as plan assets in order to hedge its pension obligations. The Group has no control over plan assets. However, under IAS 19, repayments to the company that bears the pension obligation, for the purpose of reimbursing employee benefits already paid by the company, can be recognised as assets. This entitlement to plan assets recognised under non-current financial assets represents receivables from plan assets for benefits already paid to employees, until it is actually exercised by the Group. These receivables are not covered by IFRS 9, and they are recognised in other comprehensive income, not in profit or loss, in accordance with IAS 19. Only the interest income determined by discounting the pension obligation is recognised in profit or loss.
The following tables provide an overview of current and non-current financial liabilities:
As on the assets side, the offsetting of derivative financial instruments in connection with energy-related purchases and sales also reduces the borrowings from hedging instruments recognised on the liabilities side. In the case of non-current borrowings, the same assessment as in the financial year ended 31 December 2021 would result in an effect from offsetting of EUR 218.0m; in the case of current borrowings, this effect would amount to EUR 2,587.5m. In addition, this means that trade payables as at 31 December 2021 include amounts of EUR 61.1m that would have had to be offset based on the same assessment as in the 2022 financial year. Details can be found in note 11.5.
In addition to existing financing, short-term loans or advances of EUR 2,120.0m were taken out with various credit institutions in the 2022 financial year as a result of increased liquidity requirements due to the turbulence on the energy markets.
The classification of financial liabilities for the financial year and the previous year is shown in the tables below:
CONSOLIDATED FINANCIAL STATEMENTS
11 Financial instruments
The following tables show the changes in liabilities during the reporting period and in the previous period:
The change in current liabilities to banks resulted from short-term loans or advances taken out with various credit institutions totalling EUR 2,120.0m. The other changes in other non-current and current financial liabilities relate to
the offsetting of financial assets and liabilities from energyrelated transactions recognised for the first time in 2022.
Initial recognition of financial liabilities takes place on the trading date when the Group becomes a contracting party under the contractual terms of the instrument.
Financial liabilities are classified either as measured at amortised cost or as measured at FVPL. Financial liabilities are classified as FVPL if they are held for trading, if they are derivatives, or if they are designated as such on initial recognition.
FVPL financial liabilities are measured at fair value, and net gains or losses including interest expense are recognised in profit or loss. The effective interest method is used to subsequently measure other financial liabilities at amortised cost. Interest expense and exchange differences are taken to profit or loss. Gains or losses from derecognition are also recognised in profit or loss.
With the exception of derivative financial liabilities mandatorily measured at FVPL, financial liabilities are recognised at amortised cost.
Financial assets and financial liabilities are offset and presented as a net amount in accordance with IAS 32 if there is also a legally enforceable right to offset the recognised amounts at the present time and there is an intention to settle on a net basis, or to realise the asset and settle the liability simultaneously.
In the normal course of business of Wien Energie GmbH, various offsetting agreements are concluded for which offsetting in the balance sheet has to be reviewed in accordance with IAS 32. Up to and including the 2021 financial year, it was assumed that there was no enforceable right to offset the recognised amounts as required under IAS 32. According to IAS 32, the netting right must not be dependent on a future event and must be legally enforceable in all situations. Enforceability under Austrian insolvency law was questionable up until now. In the 2022 financial year, the matter was subjected to a new legal assessment in connection with the volatility on the energy markets. The ISDA (International Swaps and Derivatives Association) now considers the legal situation in Austria to argue in favour of offsetting. The assessment revealed that, as at the reporting date, there is a legal entitlement to offset the recognised amounts against each other and that, in future, these are either to be realised simultaneously or settled via offsetting. Offsetting is required for the items concerned and will therefore be implemented from the 2022 financial year onwards.
The following items will be used for offsetting:
• Derivative financial instruments (difference between contract and market price)
• Trade receivables/payables (monthly incoming or outgoing invoices)
• Other financial assets and liabilities (variation margins)
The variation margins will only be offset up to the maximum amount that can be offset with the exchange concerned.
The following table shows the effects of the first-time offsetting of financial assets and liabilities as at 31 December 2022. To facilitate a comparison with 2021, in which the amounts were not yet offset, the effects that this would have had are shown.
The following tables show the carrying amounts of financial assets and financial liabilities that are subject to netting agreements:
As the recognition of financial assets and financial liabilities in connection with energy-related transactions has changed due to a change in the assessment of the legal enforceability of offsetting in 2022, this is only to be implemented prospectively. Past financial years are not to be restated.
The determination of the fair values of financial instruments at the Wiener Stadtwerke Group is explained below. Financial instruments are allocated to one of the three levels in the fair value hierarchy specified by IFRS. These provide information on the reliability of the inputs used to measure fair value.
Level 1: This category includes assets and liabilities traded in active markets; their fair value corresponds to the quoted price at the measurement date.
Level 2: This refers to financial instruments for which there is no active market, meaning that the fair value is determined using measurement techniques. Financial instruments are classified as Level 2 if all of the necessary significant inputs are observable.
Level 3: If one or more significant inputs are unobservable, the financial instrument in question is allocated to Level 3.
Transfers between and out of the different levels in the fair value hierarchy are carried out at the end of the reporting period. No transfers took place during the reporting period or during the previous period.
The carrying amounts and fair values of financial assets and liabilities measured at fair value, including their allocation within the fair value hierarchy, in the financial year and the previous year:
The significant drop in receivables and liabilities from derivative financial instruments as against the previous year is mainly due to the changes in the assessment regarding the extent to which derivative financial instruments can be offset pursuant to IAS 32. Further details can be found in note 11.5 Offsetting financial assets and financial liabilities.
The following tables list the financial instruments held by the Group which were not measured at fair value during the reporting period and in the previous period:
Short-term time deposits and trade receivables and payables are not included in the tables, as the carrying amount of these items corresponds to the fair value owing to their short-term nature.
The following table outlines the measurement methods and inputs used to determine the fair values of financial instruments:
1 Other equity investments in Verbund AG, EVN AG, Burgenland Holding AG and sundry other equity investments
3 Equity investment in Verbund Hydro Power AG and sundry other equity investments
1 Shares purchased as investments by the special funds
1 Investments by the special funds in investment fund units
1 Bonds purchased as investments by the special funds
1 Other securities (measured at FV)
3 Loans (measured at FV)
1 Energy forwards and futures (gas and electricity)
2 Receivables and liabilities arising from derivative financial instruments
3 Loans (at cost)
1, 2 Bank loans
- Time deposits with banks
Trade receivables and payables, cash and cash equivalents
In the case of other investments (FVOCI) for which neither the fair value nor the inputs required for measurement are observable on an active market, and which are thus allocated to Level 3 of the fair value hierarchy, a discounted cash flow approach is used in order to determine the present value of the expected benefit from the investments. The main parameters for this approach are the weighted average cost of capital (WACC), calculated on the basis of the capital asset pricing model of 5.1% (previous year: 4.06%), and the expected revenue growth rates, which are mainly dependent on forecast changes in electricity prices.
Viewed in isolation, a 10% increase in the WACC would lead to an 8% fall (previous year: 8%) in fair value, while a 10% decrease in the WACC would result in a 9% rise (previous year: 10%) in fair value. Viewed in isolation, a 10% increase (decrease) in expected electricity prices would bring about a 11% (previous year: 14%) increase (decrease) in fair value.
Market value-based
Net present value-based
Market price
Payments associated with the financial instruments, weighted average cost of capital
Market value-based Market price
Market value-based
Market value calculated on the basis of market prices of the investments held
Market value-based Market price
Market value-based Market price
Net present value-based
Market value-based
Market value-based
Payments associated with the financial instruments, yield curve
Settlement prices on the exchange
Derived from market prices, yield curve, contractual partner’s credit risk
Cost of taking out loans as best estimate of fair value
Payments associated with the financial instruments, yield curve
Carrying amounts as best estimate of fair value
Carrying amounts as best estimate of fair value
In both 2022 and 2021, the change in the fair value of unlisted equity instruments allocated to Level 3 of the fair value hierarchy resulted entirely in measurement results, which were recognised in other comprehensive income and result from the different results of the discounted cash flow methods from period to period.
The Group requires gas mainly for use at its thermal power plants and district heating boilers. In order to ensure the supply of gas around the clock, the Group also operates and actively manages gas storage facilities.
In view of the volatility of gas prices, the Group hedges fluctuations in market prices by means of various strategies which are brought together in the energy trading operations of Wien Energie GmbH. The company collates the required quantities reported by the various divisions and places the necessary orders, taking into account the market transactions concluded with Wien Energie Vertrieb GmbH & Co KG in connection with the latter’s gas delivery obligations to its customers.
This hedging strategy ensures that the reported quantities of gas required in the future can be secured, thereby avoiding the need to cover significant shortfalls or put excess quantities on the market.
Both forwards and futures are used as hedging instruments, and product transactions can be concluded at the CEGH, THE and TTF trading points. It is permitted to initially conclude agreements for products on the most liquid market, then sell the hedged quantity as liquidity increases and fulfil requirements once more at the trading point in question. Transactions are also used to manage counterparty limits.
The Group also hedges sales of electricity produced at its power plants. Hedges are concluded as part of Wien Energie GmbH’s energy trading activities, based on the production volumes budgeted by Portfolio Management. As with gas price hedging, the transactions concluded by Wien Energie Vertrieb GmbH & Co KG in connection with its electricity supply obligations to customers are also included in the hedging strategy for electricity price hedging.
Exchange-listed futures and over-the-counter (OTC) forwards are used as hedging instruments. These instruments are generally not covered by the exception under IFRS 9 for what are known as own use contracts, and therefore must be recognised as derivative financial instruments.
Hedge ineffectiveness can arise in particular from the fact that at the time the hedge is concluded, products may only be available on the market for delivery in months different to that specified in the order, so the delivery months must be adjusted in line with actual requirements. Ineffectiveness may also result from differences between the requirements reported by the individual divisions and the batch sizes available on the market. The strategy of concluding agreements for products on the most liquid market wherever possible can also be a source of ineffectiveness. Proxy hedges are concluded on the German electricity market owing to the higher level of liquidity there. Ineffectiveness may also result from differences in price for identical quantities on the Austrian and German markets.
As at 31 December 2022, the Group held the following instruments as hedges against gas and electricity price risks:
The net carrying amounts shown in the table correspond to the gross carrying amounts before offsetting according to note 11.5. The majority of long-dated forwards and futures will mature in 2024.
As at 31 December 2021, the Group held the following instruments as hedges against gas and electricity price risks:
It is permitted to initially conclude agreements for products on the most liquid market, then sell the hedged quantity as liquidity increases and fulfil requirements once more at the trading point in question. Amounts netted between purchases and sales are therefore presented in the tables above.
The amounts shown in the table below were related to items designated as hedged items as at 31 December 2022:
The tables below show the amounts related to items designated as hedging instruments, as well as the related hedge ineffectiveness:
Hedging instruments are reported in the consolidated statement of financial position under the “Derivative financial instruments – designated as hedging instrument” items on the assets and liabilities sides (broken down into current and non-current assets and liabilities). In the 2022 financial year, these will be offset in the balance sheet for the first time due to a change in assessment regarding the extent to which asset and liability items can be legally offset. The amounts are shown here before offsetting to illustrate this better. Ineffectiveness is recognised under cost of materials and purchased services in the consolidated statement of profit or loss.
The changes in the cash flow hedge reserve (excluding tax effects) were as follows:
CONSOLIDATED FINANCIAL STATEMENTS
11 Financial instruments | 12 Equity and debt capital
The Company’s share capital and shareholder contributions total EUR 500.0m (previous year: EUR 500.0m). The capital reserves include contributions from the owner.
The items presented under other comprehensive income account for certain changes in equity and related deferred taxation that are not recognised in profit or loss. Examples are unrealised gains and losses on the fair value measure-
In 2022 the Wiener Stadtwerke Group’s equity rose by 1.8%, to EUR 7,773.1m (previous year: EUR 7,639.2m). The Group’s management aims for a stable equity ratio, and therefore keeps this metric under constant observation. The equity ratio as at the reporting date was 43.9% (previous year: 37.5%), which represents an improvement compared to the previous year.
ment of financial instruments, the effective portion of the change in the fair value of hedges, and all remeasurements in accordance with IAS 19. The Group’s share of the valuation reserves of investments accounted for using the equity method is also credited to this item.
Movements in these reserves were as follows:
Tax expense is as follows:
The table below shows a reconciliation between accounting tax expense and overall tax expense recognised in profit or loss in accordance with IFRS:
Deferred tax assets and liabilities are as follows:
The table below shows movements in deferred tax liabilities:
Deferred tax is determined in accordance with IAS 12. This means that probable future tax savings and charges are recognised for temporary differences between the carrying amounts in the consolidated financial statements and the tax bases of assets and liabilities.
Expected tax savings from the use of tax loss carryforwards that are judged to be realisable in future are capitalised. Deferred tax assets arising from deductible temporary differences and tax loss carryforwards in excess of the deferred tax arising from taxable temporary differences are only recognised to the extent that it is probable that sufficient taxable income will be generated to allow the realisation of the benefit concerned.
Deferred tax assets and liabilities are offset if they are with the same taxation authority and relate to the same taxable entity or a group of different taxable entities that are assessed together.
The tax loss carryforwards recognised were capitalised and offset against deferred tax liabilities arising on the measurement of financial instruments. These deferred tax liabilities do not take effect until the financial instruments concerned are sold. As these are held as non-current investments, and there is no prospect of disposal and therefore of taxable gains, offsetting against deferred tax assets arising from temporary differences is not possible.
The Group has not recognised tax loss carryforwards of EUR 7,345.3m (previous year: EUR 6,200.0m). These can be carried forward for an unlimited period. In addition, no deferred tax assets have been recognised in respect of deductible temporary differences of EUR 184.2m (previous year: EUR 398.7m).
Deferred tax liabilities arising from interests in subsidiaries –so-called “outside basis differences” – are not recognised as the Group can control their reversal, and the latter is unlikely for the foreseeable future. In consequence, deferred tax liabilities were not recognised in respect of temporary differences of EUR 2,548.7m (previous year: EUR 2,156.4m).
No deferred taxes were recognised in the balance sheet for deductible temporary partial depreciation (over a period of seven years pursuant to Körperschaftsteuergesetz [Austrian Corporation Tax Act – KStG]) in the amount of EUR 2.3m (previous year: EUR 10.7m).
The main companies included in the consolidated financial statements of Wiener Stadtwerke form a group as defined by Section 9 KStG.
The tax group parent is Wiener Stadtwerke GmbH. There is a tax allocation agreement between the group members and the group parent. This prescribes that the tax allocation to be paid by individual group members shall be 25% of the income that would lead to a pooled profit on the part of the parent company. Group members are obliged to pay the parent a tax allocation of 2.5% of the part of their income flowing into a pooled group loss in recompense for the tax relief gained through group membership. If the parent directly or indirectly holds an interest of less than 95% of the share capital of a group member, the tax allocation is 12.5%, rather than 2.5%.
These percentages are derived from the applicable rate under Section 22(1) KStG. In the event that group members post tax losses, this does not result in a negative allocation. However, a record must be kept of the losses attributed to the parent by the members, and these losses are offset against members’ profits attributed to the parent in subsequent years.
On 23 September 2021, Wiener Stadtwerke GmbH and Niederösterreichische Landes-Beteiligungsholding GmbH concluded a Group and Tax Settlement Agreement. The parties to the agreement are Niederösterreichische Landes-Beteiligungsholding GmbH, as the majority associate, and Wiener Stadtwerke GmbH, as the minority associate. This agreement allows Wiener Stadtwerke GmbH to offset its tax losses against the proportionate tax income from EVN AG, thereby enabling all investors to benefit from reduced tax burdens on their shares of EVN AG. As EVN AG’s financial year ends on 30 September, it was included in the investment collective for the first time in the 2020/21 financial year.
The concluded tax allocation agreement stipulates that in a given financial year in which EVN AG generates taxable profit, EVN AG must pay to Wiener Stadtwerke GmbH a tax allocation of 12.5% that is based on the imputed taxable profit and is proportionate to the investment relationship. This tax allocation is to be determined on the basis of the applicable corporation tax rate. Of course, if EVN AG generates a tax loss, this will be retained by EVN AG in order to offset this with taxable profits in subsequent years.
The Wiener Stadtwerke Group has implemented a comprehensive risk management system that permits early identification of opportunities and risks. These are defined as the possibility of positive and negative deviations from the expected profit or loss for the period. The internal control system (ICS) comprises all measures implemented to ensure the reliability, effectiveness and economic viability of important processes. Compliance is concerned with adherence to external and internal regulations. The Internal Audit Department evaluates the execution of business processes, as well as the internal control and risk management system, in accordance with an annual audit programme approved by the Management Board.
The risk management process follows the internationally accepted framework of the Committee of Sponsoring Organizations of the Treadway Commission (COSO). Ongoing surveying, identification and assessment of the risks to which the Group is exposed lays the groundwork for the regular risk reporting. A fundamental distinction is drawn between qualitatively and quantitatively assessed risks. In the information provided below, the focus is on quantitative reporting. For details of qualitative risks, please consult the operational and financial review.
Reporting on quantitatively assessed risks is embedded in the financial reporting, which is performed by the management control function (integrated reporting). Confidence intervals for future movements in key financial indicators, known as ranges, are derived from the risk management system and included in the management control reporting. A key objective is determining the risk-bearing capacity of individual Group companies. An annual risk and opportunity review is carried out as part of the budget/actual comparison. The original risk and opportunity assessments from the previous year, which were also the basis of the corporate planning, are compared with the actual values. The insights gained feed into the adjustment of the risk catalogue to changed circumstances. The updated risk catalogue is one of the cornerstones of the business planning.
Discussion and coordination of the main opportunities and risks also forms part of the annual business planning retreat at each Group company. The aim is to take a holistic view of the risks and opportunities that are to be expected in coming years, so that they can be properly taken into account in the corporate planning. This gives rise to action plans and closer monitoring of the budget items concerned.
Responsibility for ensuring adherence to the risk management process lies with the risk controllers at each Group company, who report directly to management on an ongoing basis, and the Group risk management function, which reports to the Wiener Stadtwerke GmbH Management Board.
The ICS encompasses all the salient features of the process-related monitoring measures across the various organisations. It ensures that the material risks associated with the relevant processes are systematically captured and analysed, and minimised by performing periodic checks, and that the key documentation is kept and responsibilities transparently recorded. The minimum standards for compliance with the ICS are laid down by a Group directive, which also clearly defines the roles and remits within the system’s control processes. The Wiener Stadtwerke Group’s ICS has a decentralised structure, under which the Group companies are responsible for assigning management control responsibilities and ensuring that transparent documentation is kept. The duty to report to the various management boards and the Group ICS coordinator at regular intervals ensures that the ICS conforms to the standards. Continued refinement of the ICS is the job of the bodies tasked with liaising with Group companies, as well as the risk management and compliance functions. Compliance with the statutory regulations relevant to the Group is monitored and controlled. The reliability of the financial reporting is assured, as the accounting processes at Wiener Stadtwerke are governed by Group-wide directives and standards.
14 Risk management
Wiener Stadtwerke’s risk landscape is divided into the following risk groups:
Liquidity risk
Liquidity risk refers to the risk that the Group may be unable to settle its financial liabilities using cash and cash equivalents or other financial assets. The Group’s liquidity management processes are designed to ensure that sufficient liquid funds are available at all times so that the Group is able to meet its payment obligations when they fall due under both normal and strained conditions.
Short-term liquidity management is optimised by means of a Group cash pooling arrangement and short-term bank loans. If necessary, the Group can draw on various credit lines to secure liquidity. In the 2022 financial year, there was unexpected turbulence on the energy markets, putting a strain on the liquidity situation due to margin payments for exchange transactions. In addition to the bank lines, liquidity was secured in the second half of the year in the form of short-term credit lines granted by the City of Vienna and the federal government. Long-term financial investments within the companies are closely coordinated with Wiener Stadtwerke GmbH.
The following tables show the obligations arising from contractual cash flows for the coming year, the next one to five years and obligations after five years for the current and past financial year:
The increase in liabilities to banks with a term of less than one year in a year-on-year comparison serves to finance the negative effects described above. Further information on financing can be found in note 15.5 Events after the reporting period.
The significant drop in liabilities from derivative financial instruments as against the previous year is mainly due to the changes in the assessment regarding the extent to which derivative financial instruments can be offset pursuant to IAS 32. Further details can be found in note 11.5 Offsetting financial assets and financial liabilities.
This relates to the risk of financial losses resulting from the inability of a customer or party to a contract for a financial instrument to meet its contractual obligations. Default risk is mainly concerned with trade receivables and contract assets, as well as bonds and loans held as investments. Bank balances and time deposits are also exposed to credit risk. The carrying amounts of financial assets and contract assets correspond to the maximum credit risk.
IFRS 9 requires entities to recognise loss allowances not only for actual losses but also expected credit losses for financial assets measured at fair value outside profit or loss, such as trade receivables and bonds, as well as for contract assets. The risk exposure as at the end of the reporting period must be determined for each risk group, and provisions recognised on the basis of this exposure, irrespective of whether a loss is actually incurred.
The Group uses the simplified approach to determine impairment allowances and lifetime expected credit losses for trade receivables and contract assets. The probability of default included in this assessment is determined on the basis of the age structure of the respective receivable. For receivables already due, this rate is determined from empirical values and historical default rates of the respective division. The default rate of receivables not yet due is assessed separately, if material. The procedure corresponds to that described in the next paragraph.
Expected losses for all other financial assets are calculated on the basis of the 12-month expected credit losses. When there is a significant increase in default risk, the lifetime expected credit losses and impairment allowances are adjusted accordingly. When determining the credit risk, the individual credit risk rating of the debtors, as well as market-relevant future-related information and historical default rates published by S&P Global are essentially taken into account.
CONSOLIDATED FINANCIAL STATEMENTS 14 Risk management
The Treasury and Asset Management department is responsible for current and non-current investments in the WSTW Group. It manages the credit risk from balances with banks and financial institutions. In order to keep risk concentration as low as possible, investments (in the context of cash pooling as well as in the context of noncurrent investments) may only be made with approved banks, taking into account the limits valid for the respective banks at the time of the investment.
The following table gives an overview of the gross carrying amounts of financial assets in the reporting period and in the previous reporting period, broken down by risk category.
* The trade receivables shown here include non-current receivables of EUR 9.1m, which are recognised as other financial assets (see note 11.3).
* The trade receivables shown here include non-current receivables of EUR 11.5m, which are recognised as other financial assets (see note 11.3).
Allocation to the various risk exposure classes is based on the equivalent Moody’s rating and the time bands for trade receivables or debtors for whom no ratings are available.
The change in impairment allowances for trade receivables and other receivables was as follows:
Such risk can result from changes in the fair value of fixed-interest instruments and in cash flows from variable-rate instruments. The Group is also exposed to reinvestment risk due to its reinvestment of funds from maturing bonds and time deposits, as a result of fluctuations in market interest rates.
Financial assets and liabilities broken down by the type of interest as at 31 December 2022 and 2021 are shown in the tables below.
For reasons of materiality, no impairment allowances are recognised for bonds and overnight deposits.
Financial assets must be derecognised as soon as their uncollectibility is established (bad debt loss). This is the case if the quota has been determined in the course of bankruptcy or composition proceedings or the proceedings have been dismissed for lack of assets. Likewise, uncollectibility is established in the case of waivers (for example, waivers after unsuccessful debt collection), unsuccessful seizure or if there is a court judgement. After expiry of the limitation period, which is usually three years, the claim should also be written off, apart from a few exceptions (e.g. insolvency proceedings).
The customer structure at Wiener Stadtwerke means that no material risk concentrations exist.
The majority of the bonds and loans held by the Group have fixed interest rates. Bonds are measured at fair value through other comprehensive income, not in profit or loss, while loans extended are reported at amortised cost. Therefore, only the bonds held by the WSTW investment funds are exposed to the risk of changes in fair value due to fluctuations in market interest rates.
Bond investments are primarily made in euro-denominated bonds, with a focus on the euro investment-grade bond market. Interest rate risk is determined by the average bond duration on the capital market concerned. At year-end 2022, the average duration was 3.9 years (previous year: 4.0 years) on the euro-denominated market. Around one-quarter of the Group’s portfolio is not exposed to interest rate risk (e.g. liquid funds and shares), resulting in a portfolio duration of around three years (previous year: three years).
A 100-basis-point (bp) shift in interest rates would result in a pre-tax increase or decrease in equity of EUR 26.0m (previous year: EUR 32.2m) due to the resulting change in the fair values of bonds. This assumes that all other variables, and in particular exchange rates, remain unchanged.
Time deposits are usually short-term, fixed-interest investments. As they are measured at amortised cost, changes in market interest rates do not have an impact on equity, or on profit or loss.
In general, long-term financial liabilities are fixed-interest obligations. Financial liabilities are mainly recognised at amortised cost, so fluctuations in market interest rates that lead to a change in the fair values of fixed-rate financial liabilities do not have any effect on equity or on profit or loss.
Variable-interest financial assets and liabilities are predominantly receivables from the cash pooling arrangement with non-consolidated Group companies, associates and joint ventures, and the associated liabilities and non-current financial liabilities. A change of 100 bp in interest rates at the end of the reporting period, which is a reasonable assumption, would therefore only have a minor effect on equity and profit or loss.
The Group is exposed to foreign exchange risk mainly in connection with the securities held by the WSTW investment funds.
In line with the Group’s strategic targets, the holdings of cash and bonds in the funds’ diversified portfolios are subject to strict tolerance thresholds, meaning that the associated currency risk is low. Most of the Group’s foreign-currency positions are denominated in Japanese yen and US dollars, with a small proportion in other currencies, in particular Swiss francs.
Investments in shares are mainly based on the benchmark MSCI All Country World Index (ACWI), which contains the world’s largest listed companies. As a rule, these securities are listed in the currency of the exchange located in the domicile of the company concerned. Accordingly, the bulk of the Group’s global share portfolio is not denominated in euros, and due to the specific characteristics of the stock market, the Group does not take out any currency hedges against the euro. About 61% of the shares in the MSCI ACWI are denominated in USD, approximately 8% in EUR and the remaining 31% in other currencies.
Wiener Linien holds interest-bearing securities denominated in US dollars in connection with its US lease transactions. These are hedged by means of currency swaps. In this case, hedge accounting is not applied. For further details, see note 15.2 Cross-border lease.
14 Risk management
The tables below list the assets with carrying amounts denominated partly in foreign currencies.
The Group has no foreign-currency liabilities, with the exception of derivatives (currency swaps – see note 11.6).
The following exchange rates were applied at 31 December 2022 and 31 December 2021:
A possible appreciation or depreciation of the US dollar, Japanese yen or Swiss franc against the euro could influence the measurement of financial instruments denominated in foreign currencies. The resulting effects on equity and profit or loss are shown in the following table. It is assumed that all other factors – notably interest rates – remain constant.
The only division exposed to raw material price risk is Energy. The energy business is subject to risks related to value drivers such as oil, gas, electricity and CO2 prices, which can have a significant impact on profit. Price risks are minimised by means of forwards and futures, as well as other derivative financial instruments such as swaps and delivery contracts with performance options, which are used exclusively for hedging purposes.
Implementing joint market access for the sales and generating businesses allows the Group to take advantage of synergies, and to centrally manage and monitor all the risks related to energy trading (e.g. market liquidity risk and
counterparty risk). Fluctuations in temperatures result in higher or lower heating sales. Sophisticated portfolio management enables the Group to continually monitor the market situation and optimise generating operations accordingly. Sales contracts are also continuously monitored for signs of impairment. Counterparties in the energy business are assessed and monitored, and potential risks are managed using a limit system.
The following tables illustrate how concluding supply contracts at prices 10% higher or lower would have affected the results reported in the consolidated statement of profit or loss in 2022 and 2021.
As mentioned above, raw material price risks are managed by means of derivatives, and in some cases using hedges (which qualify for hedge accounting). The tables below show the changes in the fair values of these derivatives as at 31 December 2022 and 31 December 2021 in the event of a 10% rise or fall in raw material prices.
Details on hedge accounting are provided in note 11.7.
Contingent liabilities amounted to EUR 52.7m (previous year: EUR 89.3m) at the end of the reporting period. The majority relates to a contingent liability of EUR 42.5m (previous year: EUR 41.0m) to American International Group, Inc. (AIG) connected with the Wiener Linien cross-border leasing deal. See note 15.2 for further information. There are other material contingent liabilities of EUR 6.5m resulting from various obligations to Gemeinnützigen Wohnungs- und Siedlungsgesellschaft der Wiener Stadtwerke Gesellschaft m.b.H (previous year: EUR 6.5m), and various contingent liabilities of Wiener Stadtwerke Vermögensverwaltung GmbH and Wipark in the amount of EUR 3.6m (previous year: EUR 4.1m).
By contrast, the Wiener Stadtwerke Group has contingent assets of EUR 6.5m from Gemeinnützigen Wohnungs- und Siedlungsgesellschaft der Wiener Stadtwerke Gesellschaft m.b.H (previous year: EUR 6.5m), as well as various contingent assets of Wiener Netze amounting to EUR 4.9m (previous year: EUR 1.9m).
Between 1998 and 2003, Wiener Linien concluded various leasing transactions in the United States. These involved lease agreements for underground trains and trams on a lease-in, lease-out basis. The vehicles were leased to a US trust administered by an American fiduciary under a head-lease agreement. At the same time, Wiener Linien subleased the vehicles back from the trust. The US trust paid the full lease payment in advance. In order to finance this advance payment, the trust raised equity capital from an investor and debt financing from several banks. Wiener Linien used the US trust’s lease payment to make allocations to an equity account and a debt account. The
allocation to the equity account was identical to the equity portion of the lease payment, and the debt account allocation was equal to the financing provided by the banks. The lease payments to be made by Wiener Linien under the sublease were made using cash flows from the accounts. The difference between the lease payment received and the necessary allocations to the accounts is recognised as a net present value benefit under contract liabilities and reversed over the term of the lease. US leases VI and IIIa were still outstanding at the end of the financial year.
Paragraph B2 IFRS 16 provides for the combination of two or more contracts if certain criteria are met. Several financially related transactions must be assessed in terms of their overall commercial objective and may, under certain circumstances, be treated as a single transaction. As all of the contracts connected with the US leases were negotiated as a package with a single overall commercial objective that cannot be understood without considering the contracts together, in accordance with IFRS 16, the transactions are accounted for as a single transaction. Therefore, a lease in the meaning of IFRS 16 has not been concluded, and the underground trains and trams that are the subject of the US leases will continue to be recognised as property, plant and equipment in the accounts of Wiener Linien GmbH & Co KG., in accordance with IAS 16.
The following assets and liabilities related to the US cross-border leases were included in Wiener Stadtwerke’s consolidated statement of financial position on the report
ing date:
The securities (FVOCI) relate to the custody account for the furnishing of additional collateral. AIG provides insurance coverage against the potential risk of default by Wiener Linien on its obligations to the investor. If the rating falls below a certain minimum level, the contract requires furnishing of additional collateral. The opening of a custody account for this purpose became necessary following AIG’s downgrade in 2008.
The custody account covers the difference between the termination value, i.e. the amount required to repay the equity portion in the event of termination of the contract, and the equity account, and the balance of the custody account is reduced over time. The custody account, which has been pledged to the investor, is allocated to the “hold to collect and sell” business model and is measured at fair value outside profit or loss.
This item refers to a receivable from Bank Austria, which was initially recognised in March 2015. On maturity, the equity portion of the lease liability will be repaid by Bank Austria.
Forward exchange transactions were concluded in order to hedge the loans to Bank Austria, which are denominated in US dollars, against exchange rate fluctuations. The loan and the forward exchange transactions are not designated as items in a hedging relationship. The forward exchange transactions are measured at fair value through profit or loss.
The translation of the US dollar-denominated loan in the reporting period and in the previous year gave rise to the following foreign exchange result:
With regard to the contractual parties for which there is no statutory guarantee liability, in the case of a significant deterioration in their credit ratings either impairment losses or provisions must be recognised for the residual credit risk. A provision has been recognised in relation to this risk. In view of AIG’s rating, in order to cover this risk it was necessary to recognise provisions for contingent losses and other contingencies at 31 December 2022 and at 31 December 2021.
As a result of the cross-border lease transactions described above, Wiener Linien recognised a net present value benefit resulting from the difference between the advance lease payments made by the US trust and the necessary allocations to the custody account used to cover Wiener Linien’s discounted obligations under the sublease agreement. This net present value benefit is related to the tax benefit accruing to the investor over the term of the lease in question. As the benefit from the lease accrues to the investor continuously over the term of the agreement, the net present value benefit is realised over time. The benefit over the residual term is recognised as a contract liability and is reversed over the residual term of the agreement
concerned on a straight-line basis. The evolution of the net present value benefit is presented below, in accordance with paragraph 116 IFRS 15:
No distribution to the sole shareholder, the City of Vienna, is planned for 2023 (previous year: EUR 16.0m).
The members of the Management Board are:
• Martin Krajcsir (Chief Executive Officer)
The net present value benefit will be reversed through profit or loss over time as follows:
• Peter Weinelt (Deputy Chief Executive Officer)
The members of the Supervisory Board during the reporting period were:
• Dietmar Griebler (Chair since 28 June 2022)
• Erich Hechtner (Chair until 27 April 2022, left on 27 April 2022)
• Christoph Maschek (First Deputy Chair since 7 October 2022; on the Supervisory Board since 1 August 2022)
• Andrea Faast (Second Deputy Chair)
The off-balance-sheet assets and liabilities as at 31 December 2022 are shown below:
• Andreas Bauer
• Elfriede Baumann
• Michael Dedic
• Alexander Hauser
• Jutta Löffler
• Karin Rest
• Thomas Ritt
• Michael Sprengnagl
• Andreas Staribacher
No loans or advances have been granted to Management Board or Supervisory Board members.
The bonds related to US lease IIIa and US lease VI (R), and the loan related to US lease VI were offset against the associated liabilities. The interest income and interest expenses associated with these assets and liabilities, each in the amount of EUR 6.6m as at 31 December 2022 (previous year: EUR 6.3m), were also netted out.
As the short-term credit lines granted by the City of Vienna (partly refinanced by the federal government) in the summer of 2022 are set to expire in 2023, borrowing is being restructured for the margin payments of Wien Energie. Liquidity is to be provided in the form of a revolving credit facility (RCF) from May 2023 onwards. The planned approach is for several syndicated banking institutions to provide Wiener Stadtwerke with a credit line, which is currently still being agreed. This measure is intended to secure the deposit of margin payments for Wien Energie’s energy business for the next two years (with an option to extend). In the event that the framework of the RCF is exhausted, measures are being taken to ensure the provision of liquidity by the City of Vienna (“protective mechanism”). The City of Vienna made the decision to extend a further credit line of EUR 2.0bn in such cases in its council resolution of 23 March 2023. The protective mechanism will be available for use when Wien Energie’s margin payments reach EUR 1.7bn and the RCF agreement has been utilised in full. The liquidity resulting from the RCF and the protective mechanism will be passed on from Wiener Stadtwerke to Wien Energie within the Group.
Vienna, 29 March 2023
The Management Board
Martin Krajcsir Peter Weinelt Chief Executive Officer Deputy Chief Executive OfficerPage 151
Auditor’s Report
Page 154
Glossary
Page 158
Contact and imprint
We have audited the consolidated financial statements of WIENER STADTWERKE GmbH, Vienna,
and its subsidiaries (“the Group”), which comprise the Consolidated Statement of Financial Position as at 31 December 2022, and the Consolidated Statement of Profit or Loss and Other Comprehensive Income, Consolidated Statement of Changes in Equity and Consolidated Statement of Cash Flows for the year then ended, and the Notes to the Consolidated Financial Statements.
In our opinion, the consolidated financial statements comply with the legal requirements and present fairly, in all material respects, the consolidated financial position of the Group as at 31 December 2022, and its consolidated financial performance and consolidated cash flows for the year then ended in accordance with International Financial Reporting Standards (IFRSs) as adopted by the EU and the additional requirements pursuant to Section 245a UGB (Austrian Commercial Code).
We conducted our audit in accordance with Austrian Standards on Auditing. These standards require the audit to be conducted in accordance with International Standards on Auditing (ISAs). Our responsibilities under those standards are described in the “Auditor’s Responsibilities” section of our report. We are independent of the audited Group in accordance with Austrian company law and professional regulations, and we have fulfilled our other responsibilities under those relevant ethical requirements. We believe that the audit evidence we have obtained up to
the date of the auditor’s report is sufficient and appropriate to provide a basis for our audit opinion on this date.
Management is responsible for the preparation and fair presentation of the consolidated financial statements in accordance with International Financial Reporting Standards (IFRSs) as adopted by the EU, the additional requirements pursuant to Section 245a UGB (Austrian Commercial Code) and for such internal controls as management determines are necessary to enable the preparation of consolidated financial statements that are free from material misstatement, whether due to fraud or error.
Management is also responsible for assessing the Group’s ability to continue as a going concern, disclosing, as applicable, matters related to going concern and using the going concern basis of accounting, unless management either intents to liquidate the Group or to cease operations, or has no realistic alternative but to do so.
The audit committee is responsible for overseeing the Group’s financial reporting process.
Our objectives are to obtain reasonable assurance about whether the consolidated financial statements as a whole are free from material misstatement, whether due to fraud or error, and to issue an auditor’s report that includes our audit opinion. Reasonable assurance represents a high level of assurance, but provides no guarantee that an audit conducted in accordance with Austrian Standards on Auditing (and therefore ISAs), will always detect a material misstatement, if any. Misstatements may result from fraud or error and are considered material if, individually or in the aggregate, they could reasonably be expected to influence the economic decisions of users taken on the basis of these consolidated financial statements.
As part of an audit in accordance with Austrian Standards on Auditing, we exercise professional judgment and maintain professional skepticism throughout the audit.
Moreover:
• We identify and assess the risks of material misstatement of the consolidated financial statements, whether due to fraud or error, we design and perform audit procedures responsive to those such risks and obtain sufficient and appropriate audit evidence to serve as a basis for our audit opinion. The risk of not detecting material misstatements resulting from fraud is higher than for one resulting from error, as fraud may involve collusion, forgery, intentional omissions, misrepresentations or override of internal control.
• We obtain an understanding of internal control relevant to the audit in order to design audit procedures that are appropriate in the circumstances, but not for the purpose of expressing an opinion on the effectiveness of the Group’s internal control.
• We evaluate the appropriateness of accounting policies used and the reasonableness of accounting estimates and related disclosures made by management.
• We conclude on the appropriateness of management’s use of the going concern basis of accounting and, based on the audit evidence obtained, whether a material uncertainty exists related to events or conditions that may cast significant doubt on the Group’s ability to continue as a going concern. If we conclude that a material uncertainty about the entity’s ability to continue as a going concern, we are required to draw attention in our audit report to the respective note in the consolidated financial statements. If such disclosures are not appropriate, we will modify our audit opinion. Our conclusions are based up to the date of our auditor’s report. However, future events or conditions may cause the Group to cease to continue as a going concern.
• We evaluate the overall presentation, structure and content of the consolidated financial statements, including the notes, and whether the consolidated financial statements represent the underlying transactions and events in a manner that achieves fair presentation.
• We obtain sufficient appropriate audit evidence regarding the financial information of the entities and business activities within the Group to express an opinion on the consolidated financial statements. We are responsible for the direction, supervision and performance of the group audit. We remain solely responsible for our audit opinion.
• We communicate to the audit committee regarding, among other matters, the planned scope and timing of our audit as well as significant findings, including any significant deficiencies in internal control that we identify during our audit.
In accordance with Austrian company law, the group management report is to be audited as to whether it is consistent with the consolidated financial statements and prepared in accordance with legal requirements.
Management is responsible for the preparation of the group management report in accordance with Austrian company law.
We have conducted our audit in accordance with generally accepted standards on the audit of group management reports.
Opinion
In our opinion, the group management report is consistent with the consolidated financial statements and has been prepared in accordance with legal requirements.
Statement
Based on our knowledge gained in the course of the audit of the consolidated financial statements and our understanding of the Group and its environment, we did not note any material misstatements in the group management report.
The engagement partner is Mr Michael Nayer.
Vienna, 30 March 2023
KPMG Austria GmbH Wirtschaftsprüfungs- und Steuerberatungsgesellschaft
signed by: Michael Nayer Wirtschaftsprüfer (Austrian Chartered Accountant)
The term “funeral services” encompasses all the services that Bestattung Wien provides and charges for. Entire burial and cremation packages make up most of these, but they also include smaller items.
Biodiversity (biological diversity) is the variety and variability of living organisms of all origins.
The capex ratio is a measure of a company’s propensity to invest. It indicates the percentage of revenue that an enterprise reinvests in intangible assets, and property, plant and equipment.
This is a measure of a company’s financial strength and its ability to independently generate the resources required for dividend payments, debt servicing and investment spending.
These entitle the holder to emit a given amount of CO2. They are tradeable, and their price is determined by supply and demand.
A cash-generating unit is defined in the context of the impairment test as the smallest group of assets that generates cash inflows and outflows independent of the use of other assets or other cash-generating units.
The Clean Vehicles Directive (CVD) is a public procurement regulation that promotes clean and energy-efficient road transport vehicles in public spaces. The Directive requires contracting authorities to reach specific quotas in terms of how many zero-emission vehicles are in their fleet upon awarding a contract.
Decarbonisation refers to the reduction of carbon dioxide emissions. In order to drive decarbonisation forwards, the use of fossil fuels must be reduced by making use of low-carbon energy sources, including renewable energy sources such as wind power, solar power, geothermal energy and biomass. The long-term goal is to replace natural gas with hydrogen that is produced using renewable energies and to thereby reduce carbon emissions.
These are forward contracts based on underlying assets. The term derivative refers to a financial instrument for which the price is derived from an underlying market instrument. To hedge financial risks, companies can minimise the risks of an underlying transaction by entering into an offsetting derivative. This is referred to as a hedge. Underlying transactions can be recognised financial assets and liabilities or expected future transactions, for example. Hedge accounting is the accounting of opposing changes in the value of underlying transactions and hedges in the case of derivative financial instruments used for hedging purposes.
The General Data Protection Regulation (GDPR) is a European Union regulation that harmonises the rules for the processing of personal data by private entities and public authorities throughout the EU. It is aimed at protecting personal data within the EU and ensuring the free movement of data within the European single market.
EBIT
Earnings before interest and taxes.
EBITDA
Earnings before interest, taxes, depreciation and amortisation.
This value corresponds to EBITDA adjusted for the foreign procurement right and other one-off or rare expenses and income, and is a key reporting indicator.
Energy efficiency is the ratio of energy output to energy inputs. (Power generation at power stations inevitably involves the transformation of a large part of the primary energy employed into heat. This heat is used at CHP stations for district heating.)
Environmental Social Governance (ESG) is another way of referring to Corporate Social Responsibility (CSR). It refers to the evaluation of CSR efforts; it looks at a company’s voluntary contributions to sustainable development that go beyond its statutory requirements.
In December 2019, the European Commission set out the Green Deal – a far-reaching programme that promotes climate and environmental protection within the EU. At the heart of the Green Deal are the objectives of making the EU the world’s first greenhouse gas-neutral confederation by 2050, significantly reducing the emission of pollutants, and further promoting a circular economy in Europe.
The EU taxonomy is a catalogue of criteria defined by the EU that aims to provide a standard classification of the sustainability of economic activities. When used in conjunction with the EU Disclosures Regulation, the taxonomy will help stakeholders within the financial system, such as investors, to select environmentally friendly financial products and prevent greenwashing.
The EU Taxonomy Regulation sets out specific environmental objectives, such as climate change mitigation, climate change adaptation and pollution prevention and control.
This refers to the delivery of a cooling medium used to air-condition buildings. Either a central district cooling station generates the cooling energy and it is transported to consumers via a heat-insulated network, or absorbers at distributed refrigeration centres are used to produce it from the hot water supplied via the district heating network.
Under IFRS 9, all financial assets are divided into two classification categories – those measured at amortised cost and those measured at fair value. If financial assets are measured at fair value, expenses and income may be recognised either in full in profit or loss (at fair value through profit or loss, FVPL) or in other comprehensive income (at fair value through other comprehensive income, FVOCI).
The difference between a given room temperature (measured in degrees Celsius) and the average air temperature for a day is referred to as a degree day figure. The total of all the degree days for a year is the total heating degrees. Total heating degrees is the heating demand during a year, and hence an important indicator of energy suppliers’ business performance.
Green gases are defined as gases that, when burned to generate energy, do not give off more CO2 than was previously in the atmosphere. This means that they are virtually climate-neutral. Hydrogen is considered to be a green gas.
GDPRThe adjusted profit for the year eliminates material one-off expenses/income with regard to the employer contribution in the Wiener Stadtwerke Group, along with effects from asset valuation, effects related to the provision for impending losses for electricity procurement rights abroad and resulting from the sale of property and land. The value is a key reporting indicator.
The statement of cash flows presents movements in cash and cash equivalents during a financial year with a breakdown into three areas: operating activities, investing activities, and financing activities. The aim is to obtain information about the financial strength of the company.
The Climate Roadmap is part of the new Climate Governance Structure and defines the City of Vienna’s climate and energy objectives. Alongside the Roadmap, a comprehensive package of measures has been set out that aims to achieve a number of goals, including reducing greenhouse gas emissions per capita by 55% by 2030 and making Vienna climate-neutral by 2040.
The financial statements of the parent company and those of the subsidiaries are combined when the consolidated financial statements are prepared by the parent company. During this process, intragroup equity interests, interim results, receivables and payables and income and expenses are netted.
The simultaneous generation of electricity and heat (combined heat and power) maximises fuel efficiency.
Transactions in derivatives that are not subject to the clearing obligation must be collateralised in the EU. Variation margins and initial margins are considered to be collateral instruments. A variation margin serves to regularly offset value fluctuations of derivatives contracts. An initial margin, on the other hand, covers the current and expected future value fluctuations that can occur between the last exchange of margins and the hedging of the exposure or the liquidation of the position if one of the counterparties defaults (is unable to meet its contractual obligations).
This refers to the percentage breakdown of total traffic volume into the various transport modes.
NOx is the abbreviation for nitrogen oxide, which is the collective term for the gaseous oxides of nitrogen.
Other comprehensive income includes income and expense items that are not recognised in profit or loss under IFRS. These are therefore changes in the value of asset or liability items that are recognised directly in equity and result neither from transactions with shareholders nor from the items included in the income statement.
A system that uses sunlight to produce electricity. If it produces heat, it is called a solar thermal system.
The seat kilometre is a unit employed in the public transport industry. It refers to the product of the seats offered by a transport company and the distance travelled by the means of transport concerned. It takes no account of whether the seats are occupied.
This is energy captured from naturally occurring energy forms or sources which, unlike secondary energy, can be used without first being converted. Besides the fossil fuels – natural gas, oil, lignite and hard coal – this includes renewable energy sources including solar, geothermal, wind, hydropower and biomass.
The projected unit credit (PUC) method is an actuarial method for calculating company pension obligations.
A rating is an evaluation of the creditworthiness of a debtor (countries, companies, etc.), often carried out by a specialised rating agency. The evaluation is expressed as a kind of grading. It is very similar to a school grading system. The rating systems of the agencies use different grading schemes and their own symbols.
Risk management is the systematic recognition and evaluation of risk, and the management of responses to identified risks. This process has many areas of application, including the management of business, credit, financial investment, environmental, insurance and technical risk.
Bonded loans are a form of long-term corporate debt. A loan is extended to a borrower by a large financial intermediary without recourse to the organised capital market. These instruments are only available to companies with impeccable credit ratings.
The expression “smart city” refers to a city where information and communication technology, and resource-efficient technologies are systematically deployed in order to conserve resources, enhance citizens’ quality of life and the competitiveness of the local economy, and ultimately increase the city’s sustainability. At the very least, energy, mobility, urban planning and governance are addressed.
Smart metering combines cutting-edge meter technology with information and communication technology to give consumers near-real-time updates on their power consumption, transmit meter readings to the system operator electronically, and price electricity according to current supply availability.
COP stands for “Conference of the Parties” and refers to those party to the UN Framework Convention on Climate Change. COP26 was the 26th conference of the parties to the convention and brought together leading figures from around the world.
Verkehrsverbund Ost-Region (VOR) Gesellschaft m.b.H. is a public transport service provider in the Eastern region of Austria. It is responsible for coordinating timetables and prices and for commissioning local trains and regional bus services in the region.
WACC stands for “weighted average cost of capital” and is used when valuing a company and in conjunction with value-oriented management indicators. It describes the weighted arithmetic mean of a company’s equity and debt capital, whereby the weighting is worked out by dividing the equity and debt capital each by the total capital.
Published by: Wiener Stadtwerke GmbH
Thomas-Klestil-Platz 13
1030 Vienna Austria
Design & implementation: Berichtsmanufaktur GmbH, Hamburg
Photo Page 3, Andreas Jakwerth, Vienna
As at April 2023
© Wiener Stadtwerke GmbH
Note
The financial report is published in German and English, but the German version is authoritative The financial report can also be found at https://www.wienerstadtwerke.at/berichtswelt/en.
If you have any questions, please contact us: Group Communications
Thomas Geiblinger +43 1 531 23-73953 thomas.geiblinger@wienerstadtwerke.at Group Press Officer
David Millmann-Stolz, B.A. +43 664 88 48 0259 david.millmann@wienerstadtwerke.at Press Officer