Wiener Stadtwerke Financial Report 2021
Demand and price trends Crude oil price movements While the price of oil fell to a historic low in 2020 as a result of the economic downturn caused by the Covid-19 pandemic, prices in 2021 were also influenced by the ongoing pandemic for the most part. Hopes of an economic upturn following extensive Covid-19 vaccination programmes helped oil prices grow almost uninterrupted in the first half of 2021. This increase in prices was also helped by limited oil production and an extreme cold snap in the USA. The first significant drop in the price of oil occurred in August in light of growing concerns about the continued growth of the economy. This trend was short-lived, however, and in October 2021 oil prices hit their yearly high of over USD 83/bbl after natural gas, liquefied natural gas (LNG) and coal shortages caused prices to surge. This upwards trend was h alted in November 2021 when uncertainty about the new Covid-19 variant, Omicron, led to a huge fall in prices. On average, the oil price rose by 69% compared with the previous year.
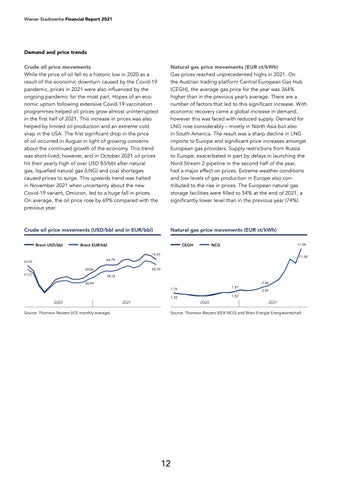
Natural gas price movements (EUR ct/kWh) Gas prices reached unprecedented highs in 2021. On the Austrian trading platform Central European Gas Hub (CEGH), the average gas price for the year was 364% higher than in the previous year’s average. There are a number of factors that led to this significant increase. With economic recovery came a global increase in demand, however this was faced with reduced supply. Demand for LNG rose considerably – mostly in North Asia but also in South America. The result was a sharp decline in LNG imports to Europe and significant price increases amongst European gas providers. Supply restrictions from Russia to Europe, exacerbated in part by delays in launching the Nord Stream 2 pipeline in the second half of the year, had a major effect on prices. Extreme weather conditions and low levels of gas production in Europe also contributed to the rise in prices. The European natural gas storage facilities were filled to 54% at the end of 2021, a significantly lower level than in the previous year (74%).
Crude oil price movements (USD/bbl and in EUR/bbl)
Natural gas price movements (EUR ct/kWh)
Brent USD/bbl
Brent EUR/bbl
CEGH
NCG
11.39
74.25
11.38
64.79
63.50
65.70
49.86 57.23
54.12 40.99
1.57
1.18
2021
2020
Source: Thomson Reuters (ICE monthly average)
2.87
1.52
1. 22
2020
2.86
2021
Source: Thomson Reuters (EEX NCG) and Wien Energie Energiewirtschaft
12

