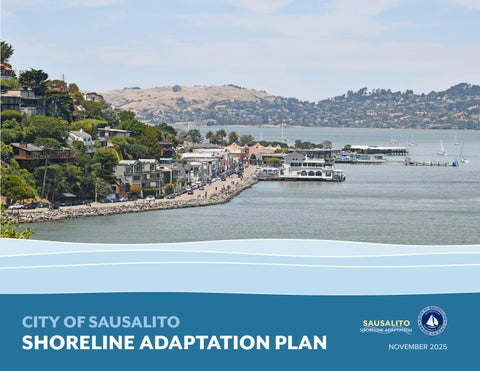
CITY OF SAUSALITO
SHORELINE ADAPTATION PLAN
CITY COUNCIL
Joan Cox, Mayor
Steven Woodside, Vice Mayor
Melissa Blaustein, Councilmember
Jill Hoffman, Councilmember
Dr. Ian Patrick Sobieski, Councilmember
Janelle Kellman, Former City Council
KEY STAFF MEMBERS
Chris Zapata, City Manager
Brandon Phipps, Assistant City Manager
Catie Thow Garcia, Resiliency & Sustainability Manager
Sara Khorshidifard, Capital Project Manager
Kevin McGowan, Director of Public Works
ADVISING COMMUNITY MEMBERS, SEA LEVEL RISE TASK FORCE
Michelle Orr
Terri Thomas
Lise Ciolino
Kass Green
Wilford Welch
WRT / Adaptation Planning, Landscape Architecture wrtdesign.com
Arup / Adaptation Engineering
ONE Architecture and Urbanism / Adaptation Planning
ESA / Ecological Engineering
BCDC:
San Francisco Bay Conservation and Development Commission
FEMA: Federal Emergency Management Agency
CSLC: California State Lands Commission
MHHW:
Mean Higher-High Water
NAVD88:
North American Vertical Datum of 1988
OPC: California Ocean Protection Council
RSAP:
Regional Shoreline Adaptation Plan
SB272:
Senate Bill 272 Laird, Sea-Level Rise
Planning and Adaptation
SLR:
Sea Level Rise
An adaptation pathway is a planning approach addressing the uncertainty and challenges of climate change decisionmaking. It enables consideration of multiple possible futures, and allows analysis/ exploration of the robustness and flexibility of various options across those multiple futures
The Marin Bay Waterfront Adaptation and Vulnerability Evaluation; used to provide governments and property owners data regarding the projected impacts of sea-level rise
The baylands are the lands that lie between the elevations of the high and low tides, including those areas that would be covered by the tides in the absence of levees or other structures.
A tool used to assess the quantitative impact of a project by comparing the financial outcomes of implementation to the upfront project cost
The expected severity and extent of impact given hazard, focus on economic, environmental, equity, recreation and connectivity
Design Height
The appropriate elevation for the construction of new structures located within a flood zone; calculated by adding freeboard to the base flood elevation
Critical habitat found in shallow coastal environments, estuaries and bays that support a variety of significant species and ecosystem functions. Designated as essential fish habitat by NOAA
An innovative form of nature-based flood risk management that integrates transitional wetland habitat along the gradual slopes of flood protection structure.
A district within a city that uses tax increment financing to support development projects related to climate change adaptation and infrastructure maintenance.
The required number of feet the first floor of a structure to be elevated (or flood-proofed) above the base flood elevation; determined by local floodplain management
Buoyant over-water structures used for commerce, recreation, and access that rise and fall with the tides
Sovereign public trust lands that have been transferred to local municipalities to be locally managed while remaining under the authority of the CSLC
Green infrastructure refers to natural systems including forests, floodplains, wetlands and soils that provide additional benefits for human well-being, such as flood protection and climate regulation. Gray infrastructure refers to the humanengineered infrastructure for water resources such as water and wastewater treatment plants, pipelines, and reservoirs.
Water in the subsurface that fills pores in the soil or openings in rocks. As sea levels rise, areas adjacent to tidally influenced water bodies may experience groundwater emergence at a similar rate to sea level rise.
The intensity and likelihood of a particular threat focused on tidal, storm, waves, and groundwater flooding.
The gradual sinking or settling of the ground surface caused by human activities or natural processes.
A green infrastructure technique that uses vegetation and/or natural materials to reduce erosion and wave action while providing habitat.
An offshore structure designed to minimize wave energy and reduce impacts to the shoreline while incorporating natural habitat components for various marine and aquatic species.
The average of the higher high water height of each tidal day observed over the National Tidal Datum Epoch. For stations with shorter series, comparison of simultaneous observations with a control tide station is made in order to derive the equivalent datum of the National Tidal Datum Epoch.
Physical landscape features that can evolve over time through the actions of environmental processes, such as the flow of water and sediment. They can be naturally occurring, or engineered to mimic natural processes. They can reduce the vulnerability of communities to flood hazards related to climate change while also providing a wide array of additional benefits that most traditional hard armoring solutions lack (e.g., fish and wildlife habitat, recreational opportunities, and carbon sequestration). Examples include nearshore oyster reefs, submerged aquatic vegetation, beaches, and wetlands.
The length of time into the future that is accounted for in a particular plan. In sea level rise analysis planning horizons are often set to levels of sea level rise instead of time, because of the uncertainty related to sea level rise projections. Often plans will establish planning horizon ranges for both time and sea level rise depth.
A reach is a defined segment of the shoreline delineated by similar characteristics of both the built and natural environment
A flexible, adaptive strategy that responds to variable physical and contextual conditions along the shoreline. The resilient edge can be a seawall, levee, road or other infrastructure that is designed to a height that protects inland assets from sea level rise.
The probability of adverse outcomes, the integration of hazard, vulnerability, and consequence
The temporary inundation of low-lying areas, associated with riverine and coastal flooding during weather events.
A significant increase in water elevation above normal tidal levels caused by storm events, often leading to extreme flooding in coastal areas
Tidal Inundation is most commonly referenced to the average daily highest tide, or Mean Higher High Water (MHHW) tidal datum. Inundation typically begins when water levels reach above this level. In sea level rise analysis, tidal inundation refers to the permanent change in the MHHW tidal datum in each scenario.
An elevation representing the total water height using a combination of tides, storm surge, and waves
The susceptibility to damage given a certain hazard, focus on potential for erosion and over-topping.
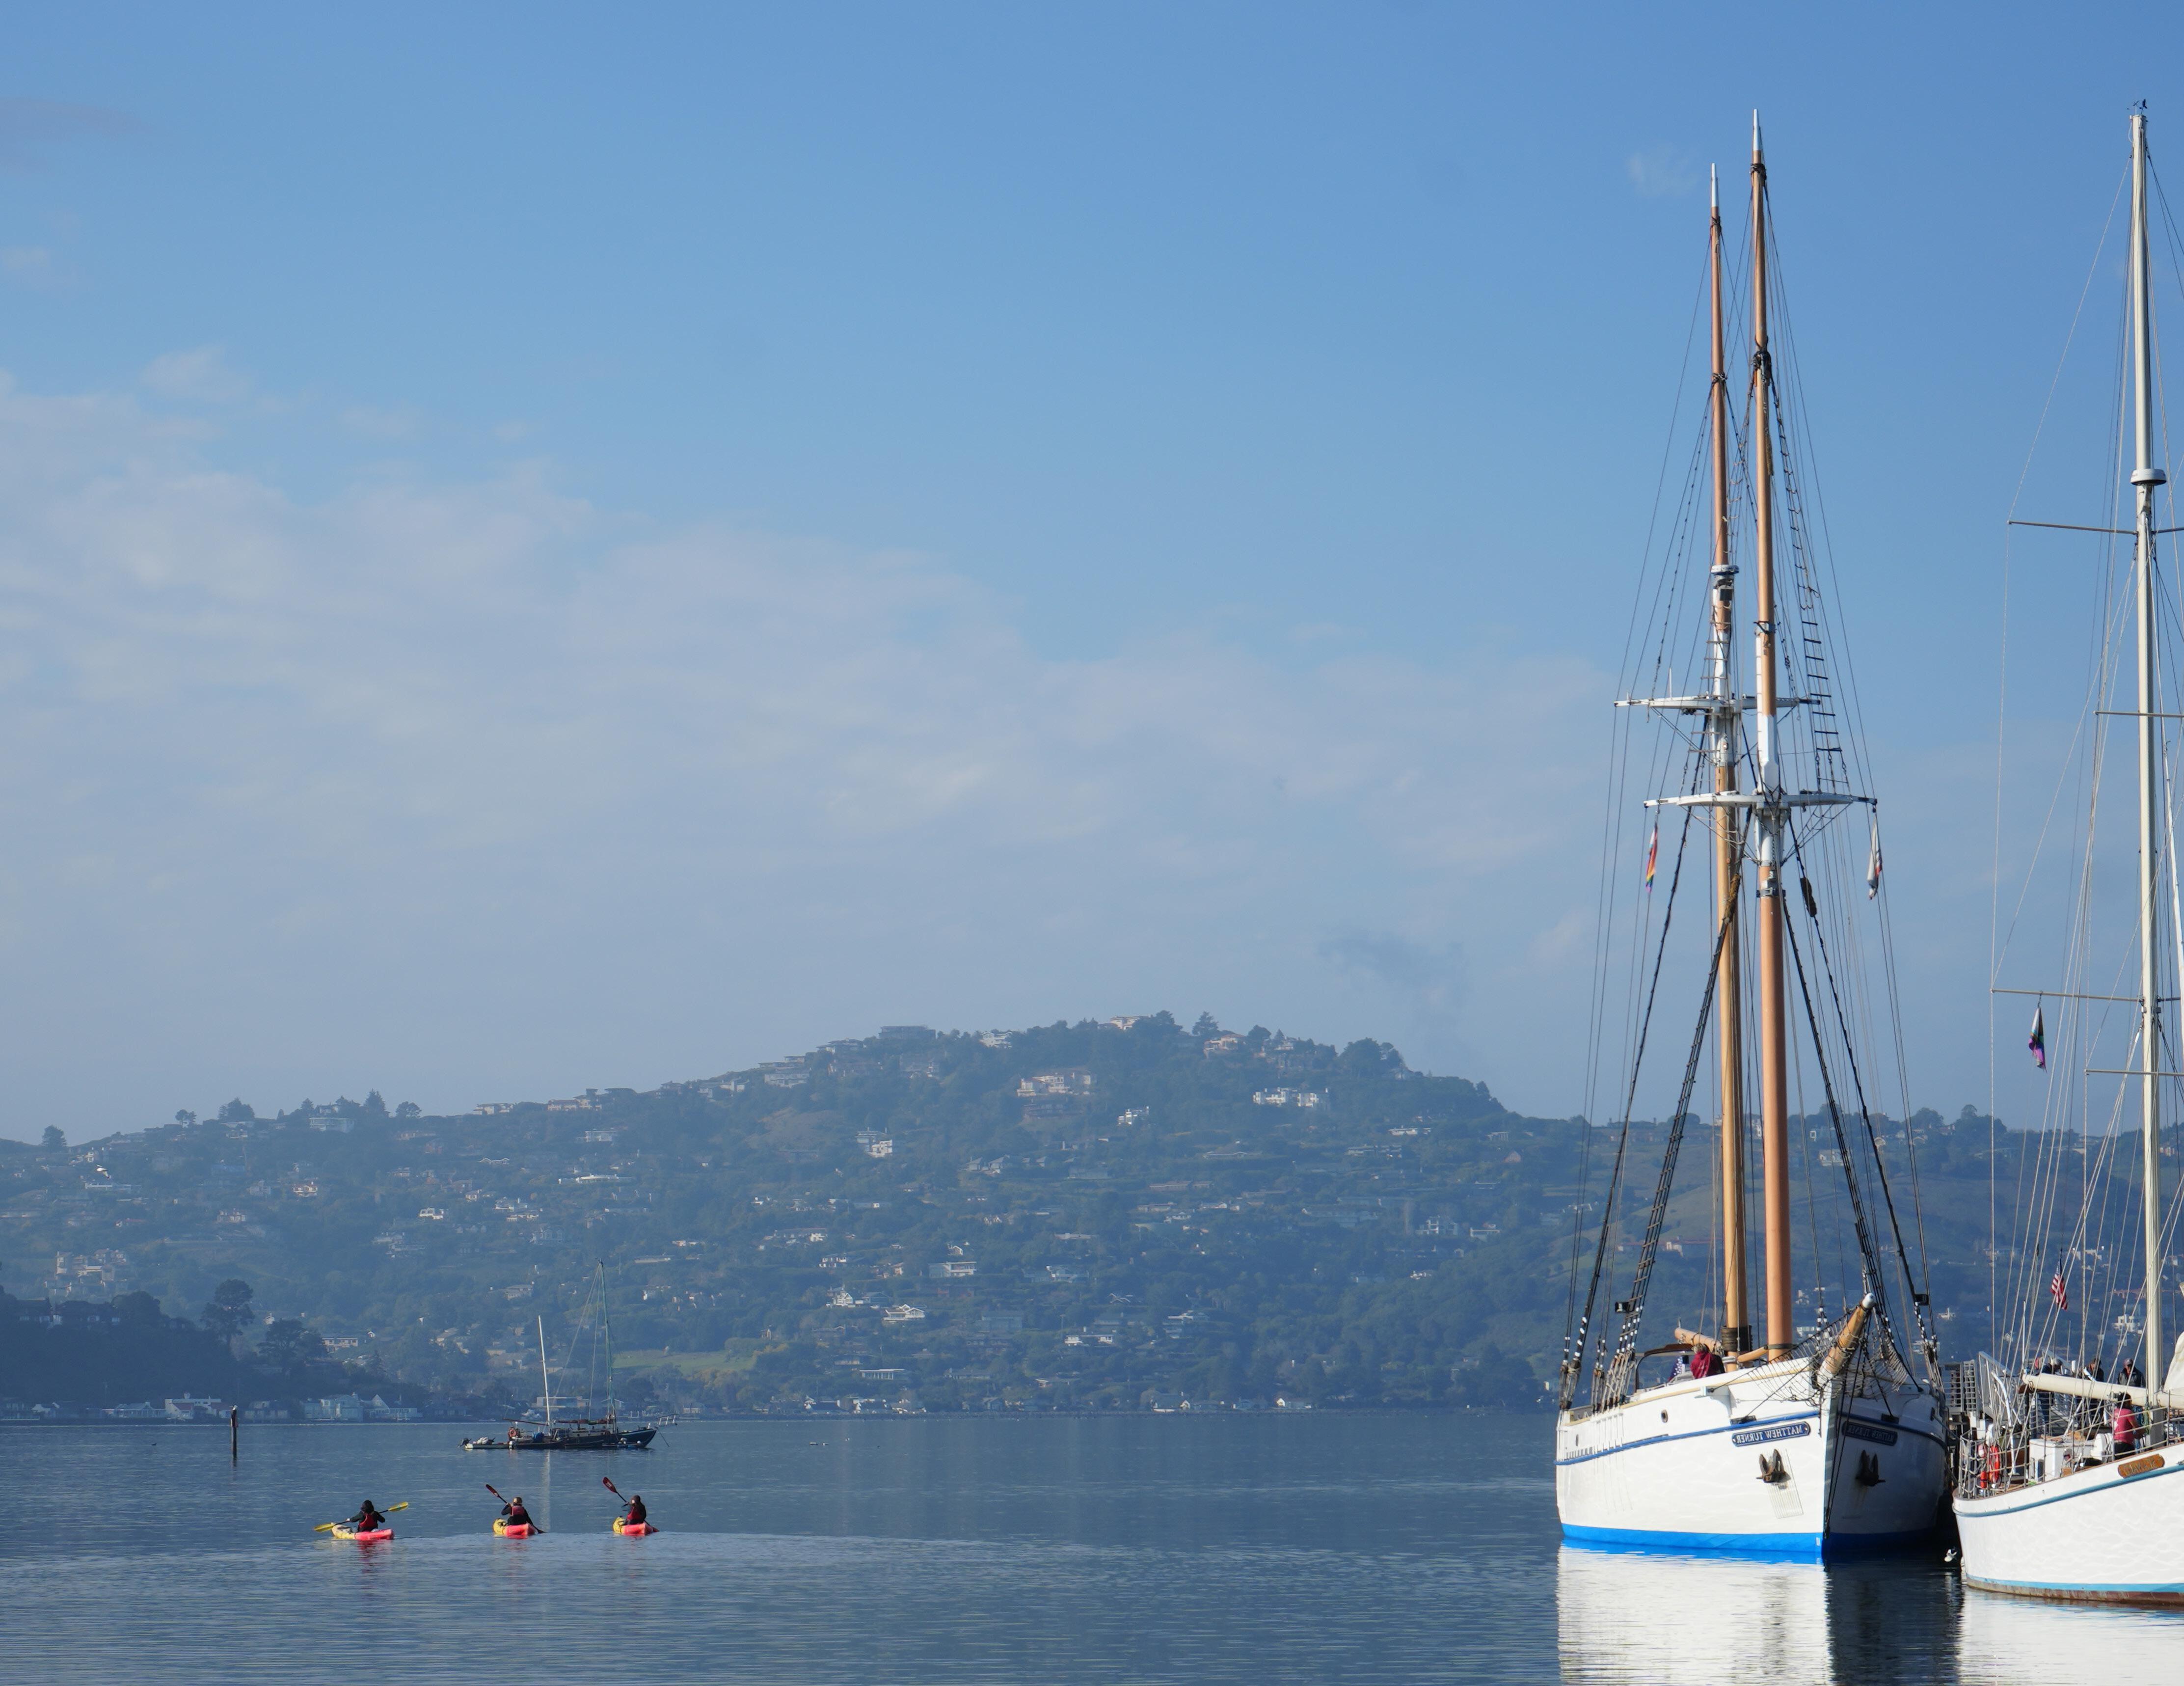
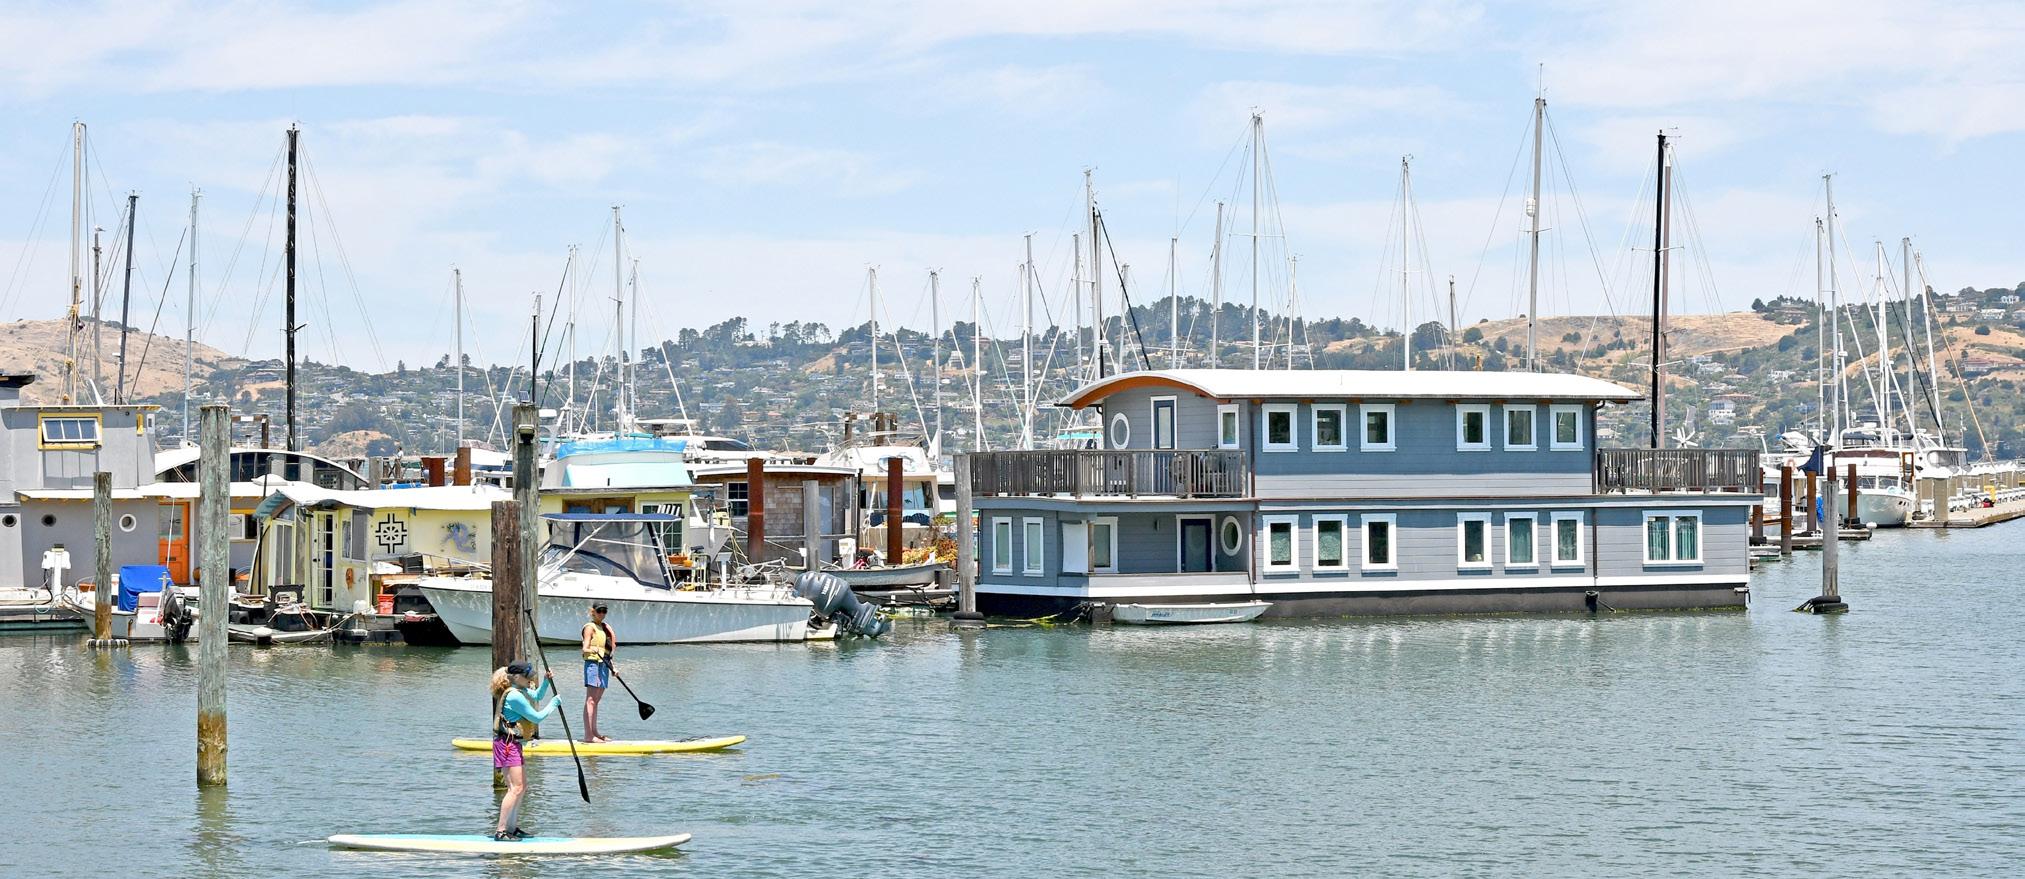
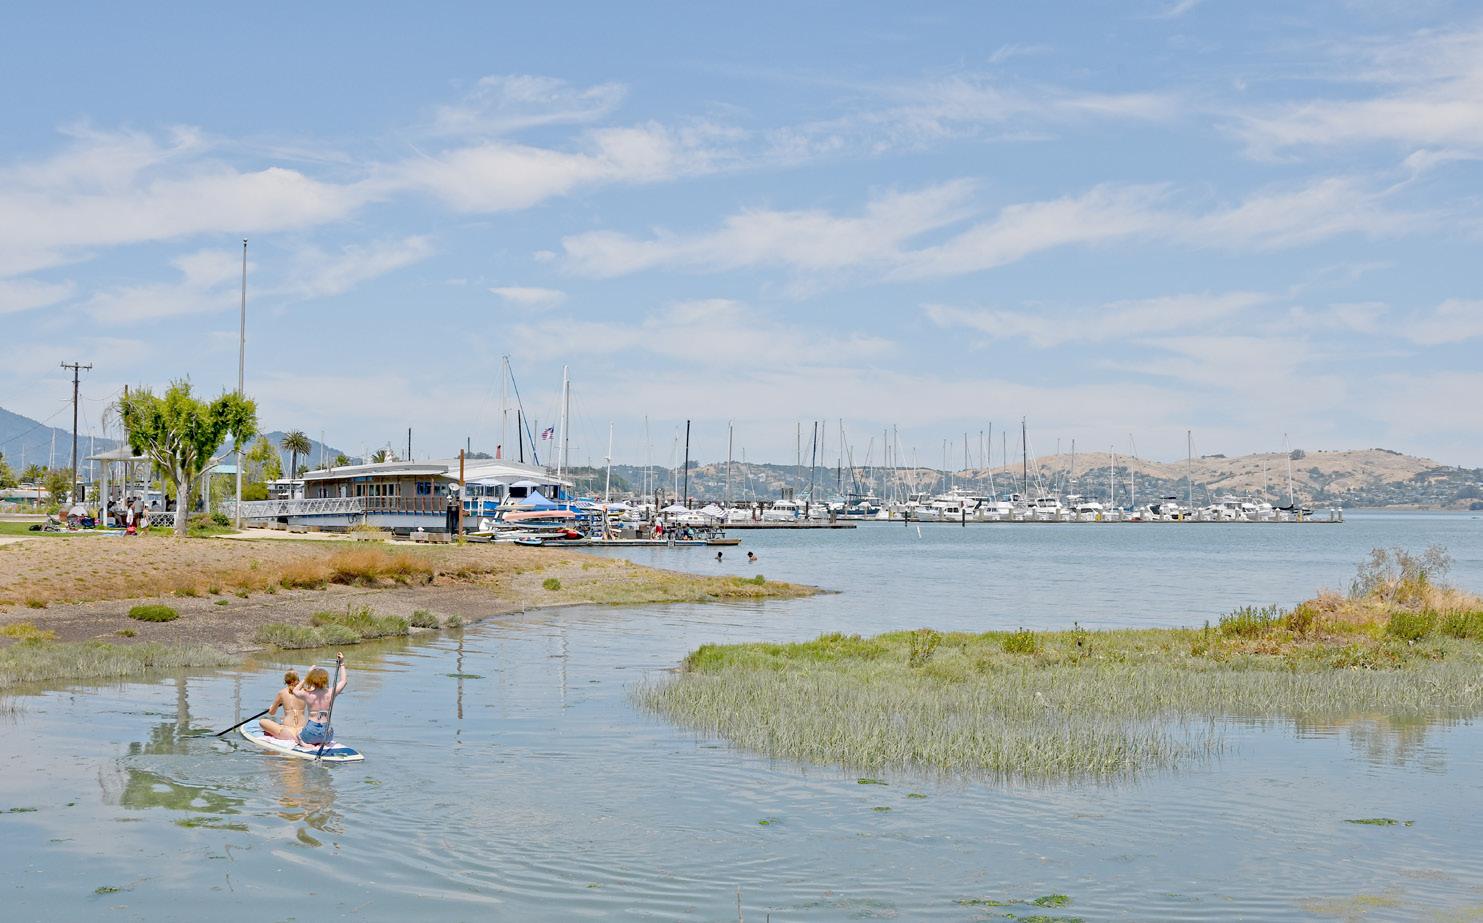
Welcome reader to Sausalito’s Shoreline Adaptation Plan, a planning framework to guide response to sea level rise. State guidance makes clear the water will come regardless of storm or sunny day conditions to inundate shoreline areas. At risk is the economy, identity, infrastructure, safety and transportation network including emergency egress. The scale of the impacts to the city and likely cost of adaptation requires incremental and sustained mitigating actions over the coming decades. Today the City embarks on a course to respond to these challenges in a manner befitting of a place with a world-class waterfront, a rich maritime history, a tight-knit proactive community who shares a passion for the sea. The plan embraces a working waterfront character where maritime uses, public water launches, shoreline promenades, and regional transportation are protected through adaptation over time. Solutions feature ways Sausalito can continue to live with water as the floating home community has demonstrated for years. Vulnerabilities are assessed and documented in the plan. From utility infrastructure to roads and from buildings to parks, the facilities impacted affect all residents, whether they live up the hill, on the shore, or float on the Bay.
The high level of participation by residents in the planning process bodes well for collective actions needed in the future. Protective measures will be more successful if property owners work together across parcel boundaries in the response. The City also has an important role to facilitate adaptation through incentives, clear regulatory guidance, and streamlining of permitting. The plan describes costs and benefits that will be shared through partnerships forged at different scales. Local organizing and funding efforts can be leveraged to attract regional, State, and federal support.
The vulnerability assessment documents what is at risk and associated costs of no action. Low lying shoreline areas are impacted by sea level rise, storm surge, and groundwater emergence. Some areas built on land created on former Baylands are also impacted by high rates of subsidence, complicating the geotechnical engineering required for some adaptation solutions. Impacts are recorded for underground utilities such as sewer lines, roads such as Bridgeway and Gate 5, buildings, shipyards, and parks such as Dunphy. Sea level rise threatens more than buildings and infrastructure. Richardson Bay hosts a rich ecology of aquatic habitats such as eelgrass; a keystone species that provides valuable ecosystem services and supports major fisheries. As water depth changes, eelgrass habitat suitability is impacted.
The plan examines the impacts of three sea level rise scenarios in alignment with state and regional guidance:
1. Mid-century (2050) scenario of 0.8 ft sea level rise without storm surge
2. Mid-century (2050) scenario of 0.8 ft sea level rise scenario combined with 100-year storm surge, which adds to 4.3 ft total water level
3. End-of-century (2100) intermediate projection of 3.1 ft sea level rise, combined with 100-year storm surge; or end-of-century high projection of 6.6 ft sea level rise. Both would result in 6.6 ft total water level.
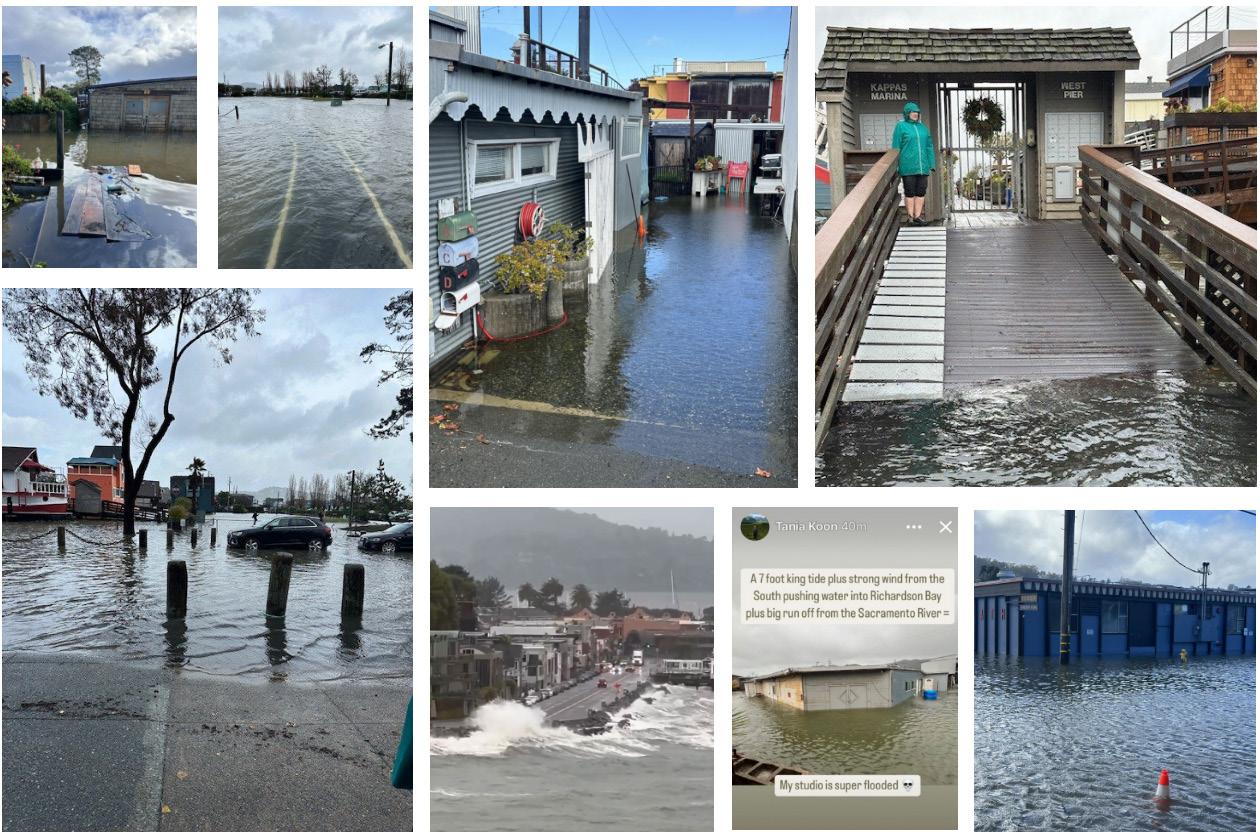
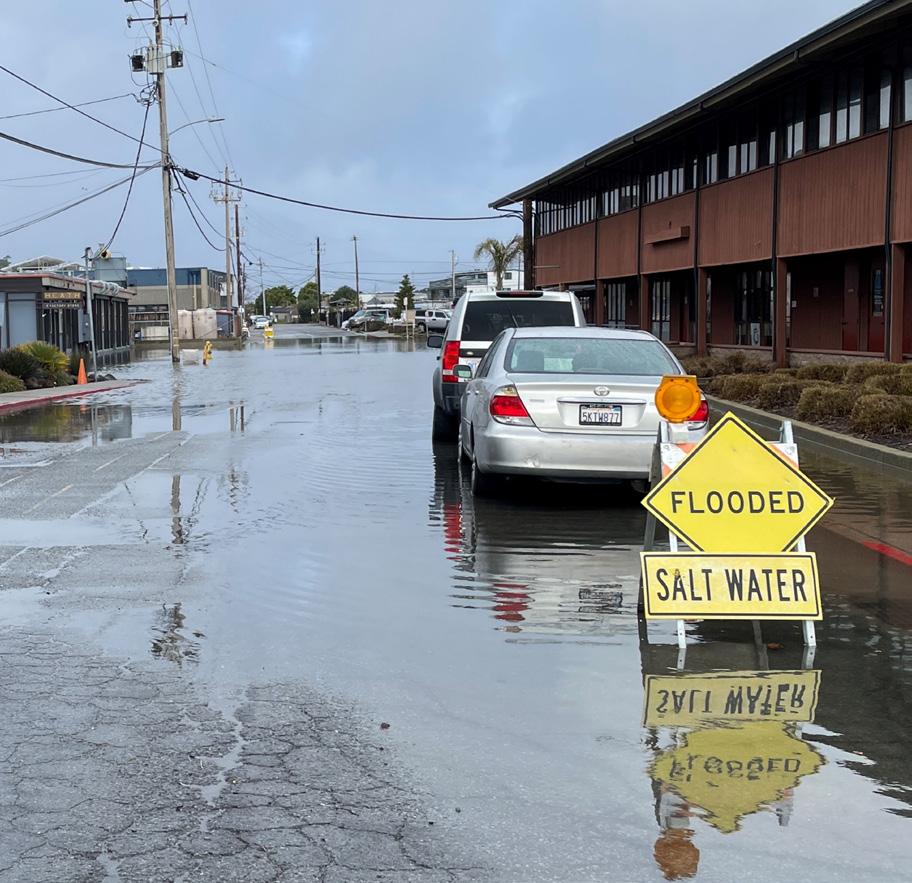
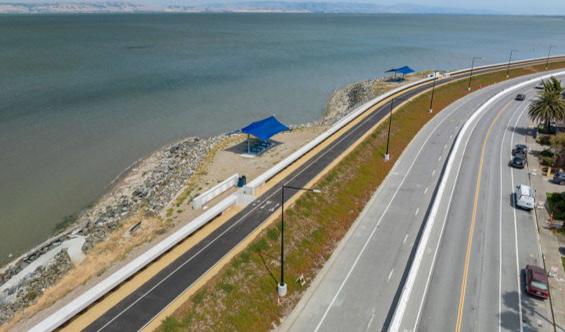
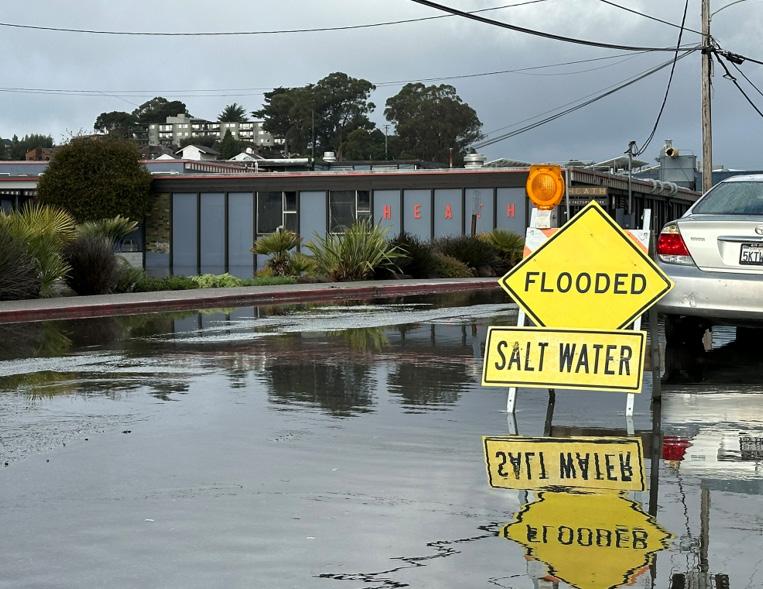
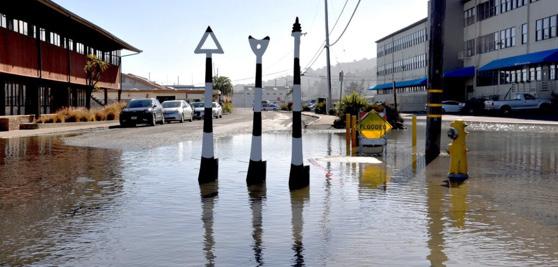
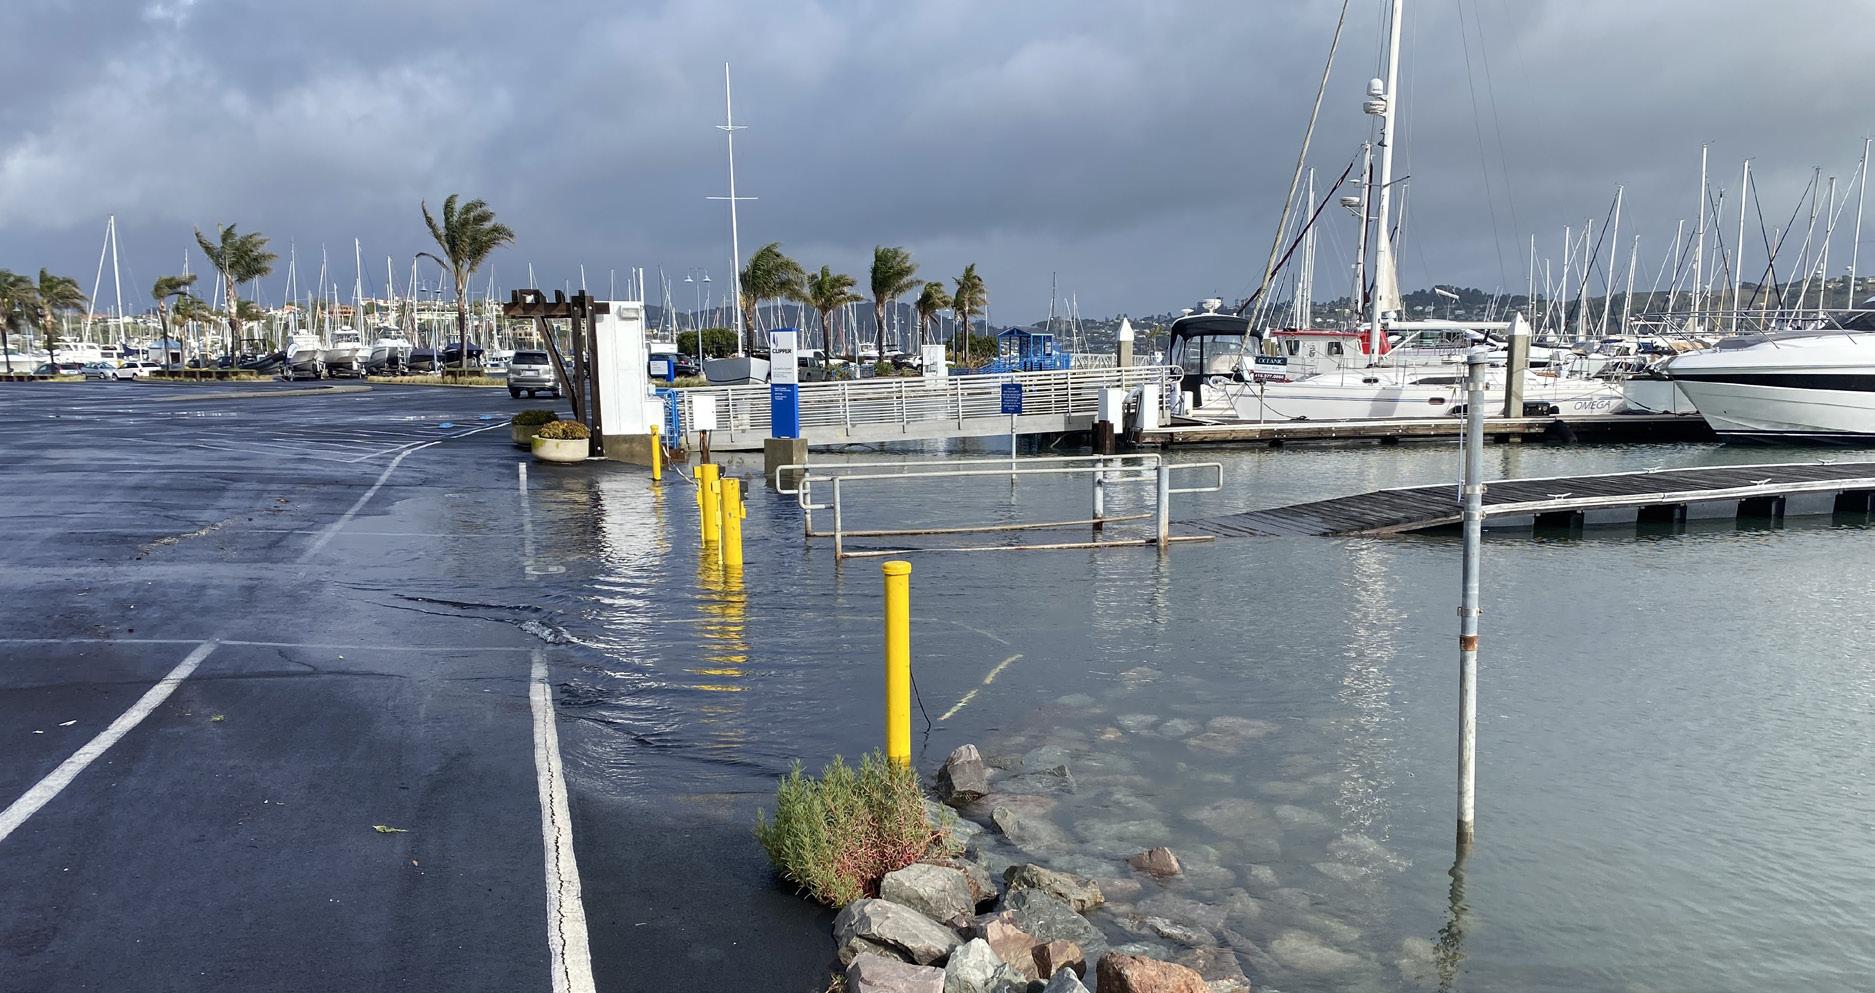
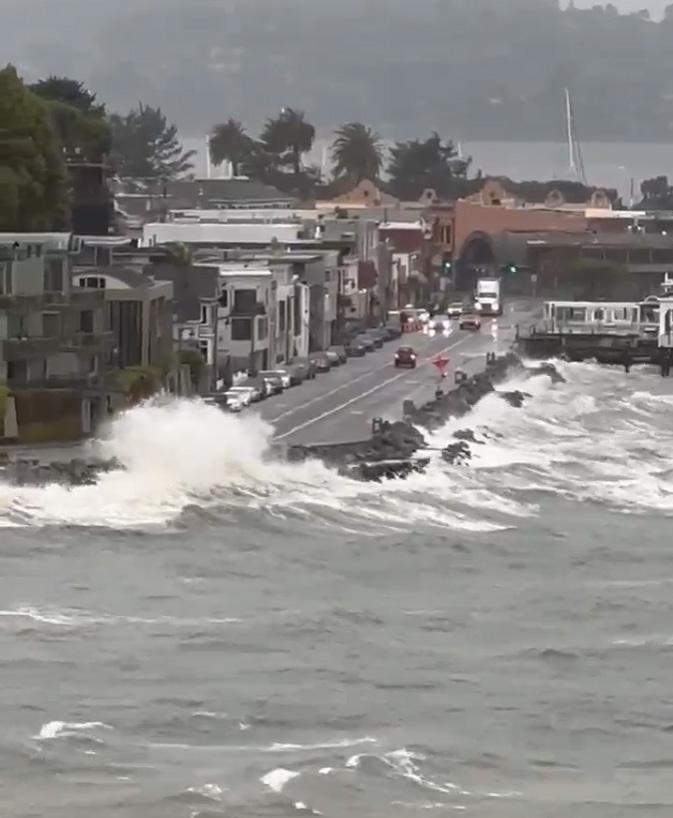
Even the lowest sea level rise scenario (0.8 ft) significantly stresses Sausalito’s utilities and transportation networks. Storm drains which typically divert water into the bay at low elevations, will be flooded as sea levels rise, preventing those systems from draining and causing upstream impacts and flooding along streets. Sewer lines may be disrupted by fluctuation in groundwater and pump stations will require upgrades in capacity. Roads that serve businesses, floating home communities, and provide egress during emergencies will experience flooding during high tides and storms. Local roads such as Spinnaker Drive, Wateree, and Gate 6 Road are among the roads impacted. Bridgeway, the primary connector through Sausalito serving local and regional transportation, is impacted in multiple segments. In the next few decades, water will begin to be visible on Bridgeway during high tides and storms. A familiar example of this condition today is the flooded Shoreline Highway 1 at the Manzanita parking lot.
Long-term impacts at the end-of-century scenario are the result of regular flooding of up to six and a half feet above the current high tide water level (MHHW). Significant areas of the Sausalito shoreline will be
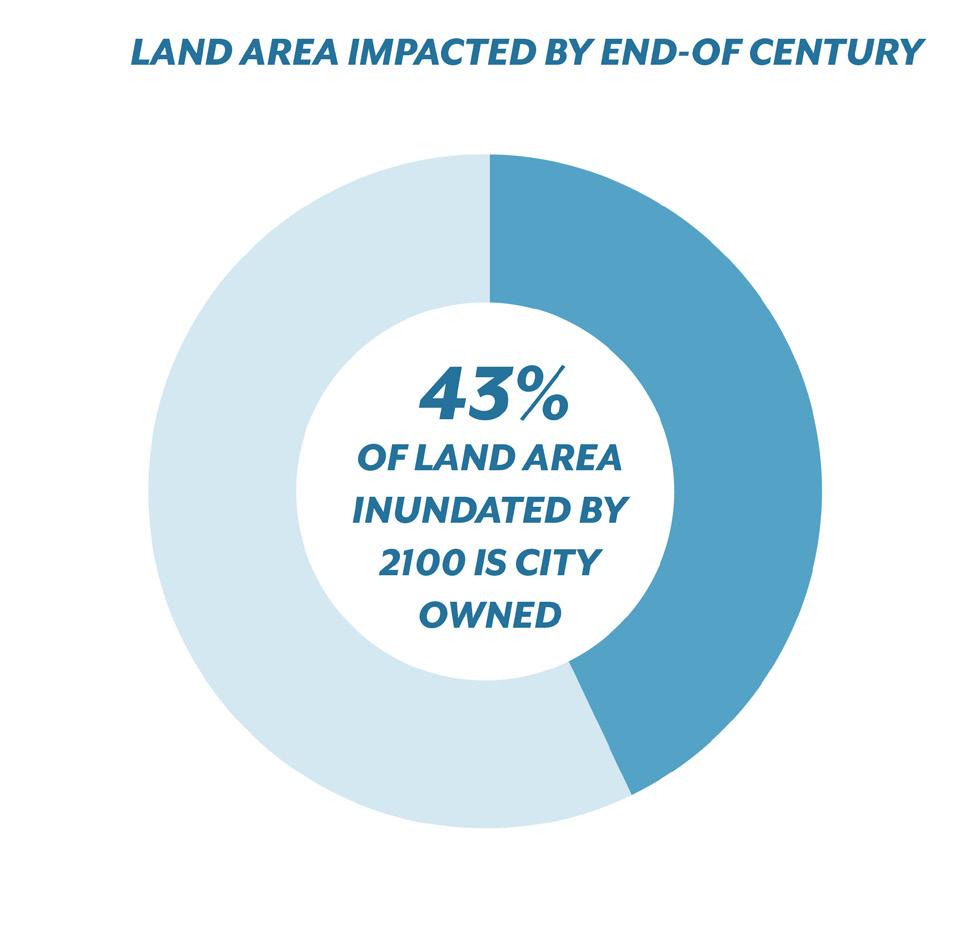
regularly flooded, impacting roads, buildings, utilities, trails, and parks. Flooding water will be present when the sun is shining, not just during storms or winter king tides as it occurs today. Permanent flooding on Bridgeway will effectively cut off access between neighborhoods of Sausalito. By end-of-century, twelve percent of Sausalito’s land area will be flooded, of which fortythree percent is City-owned.

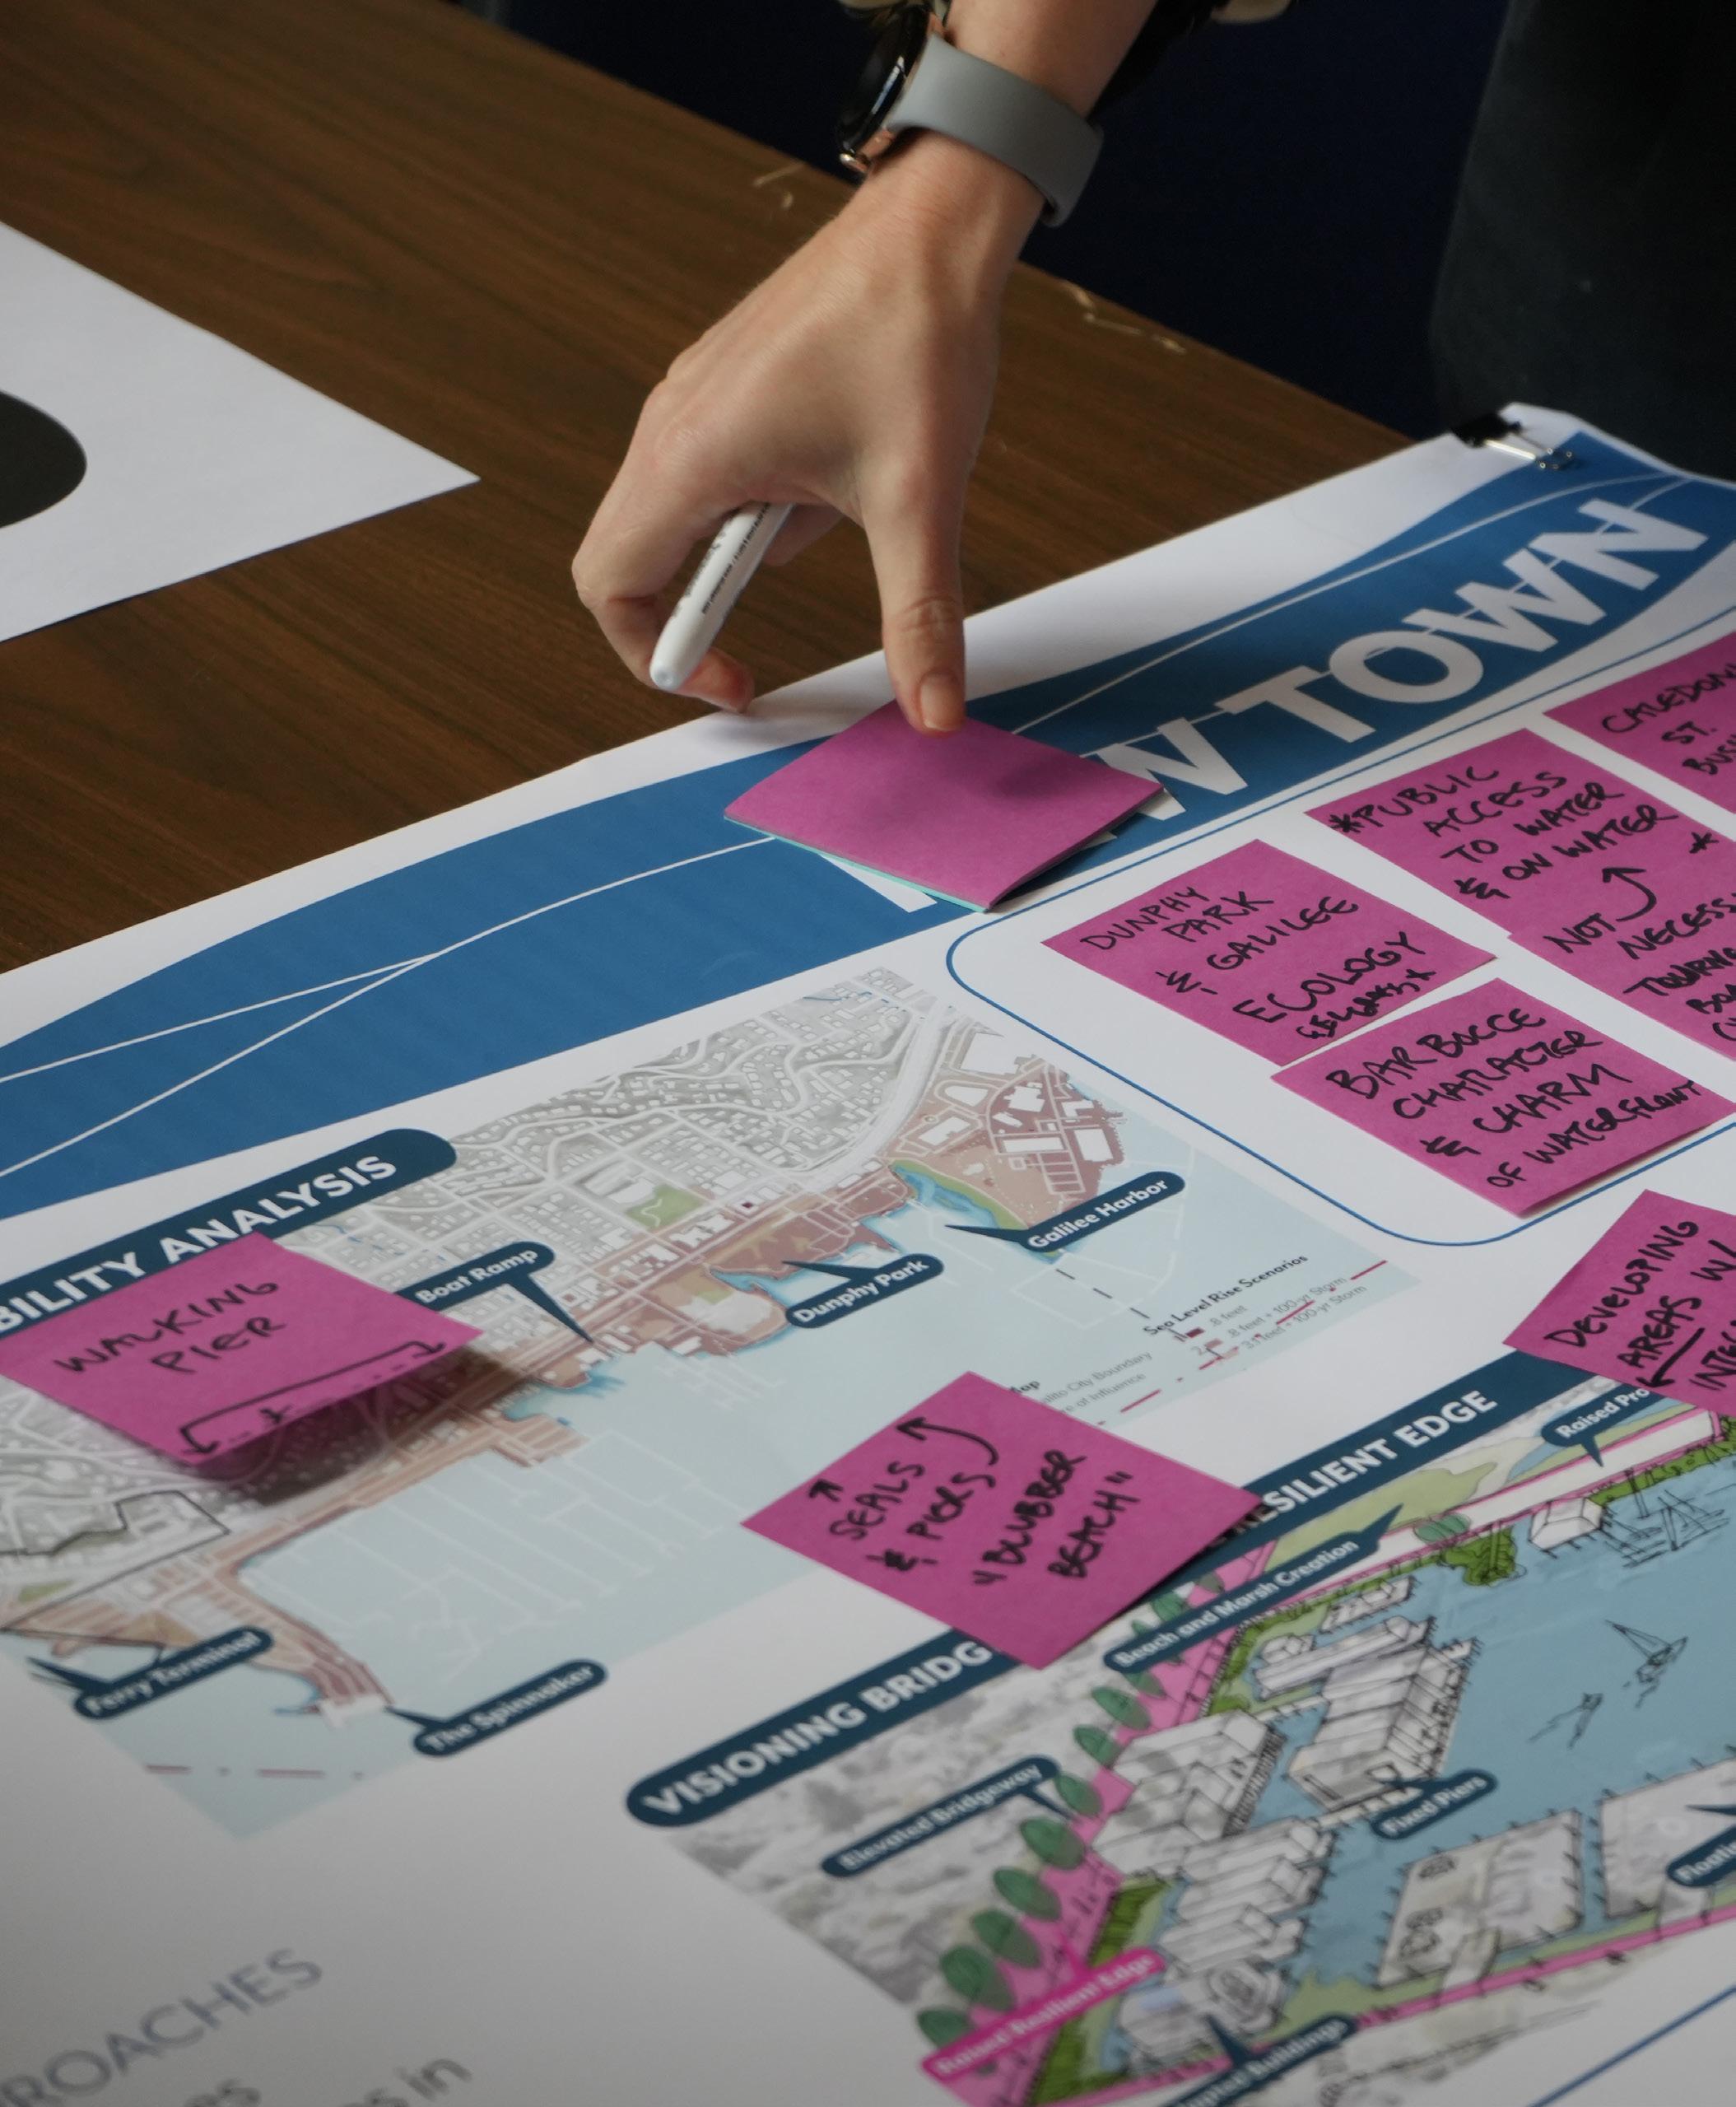
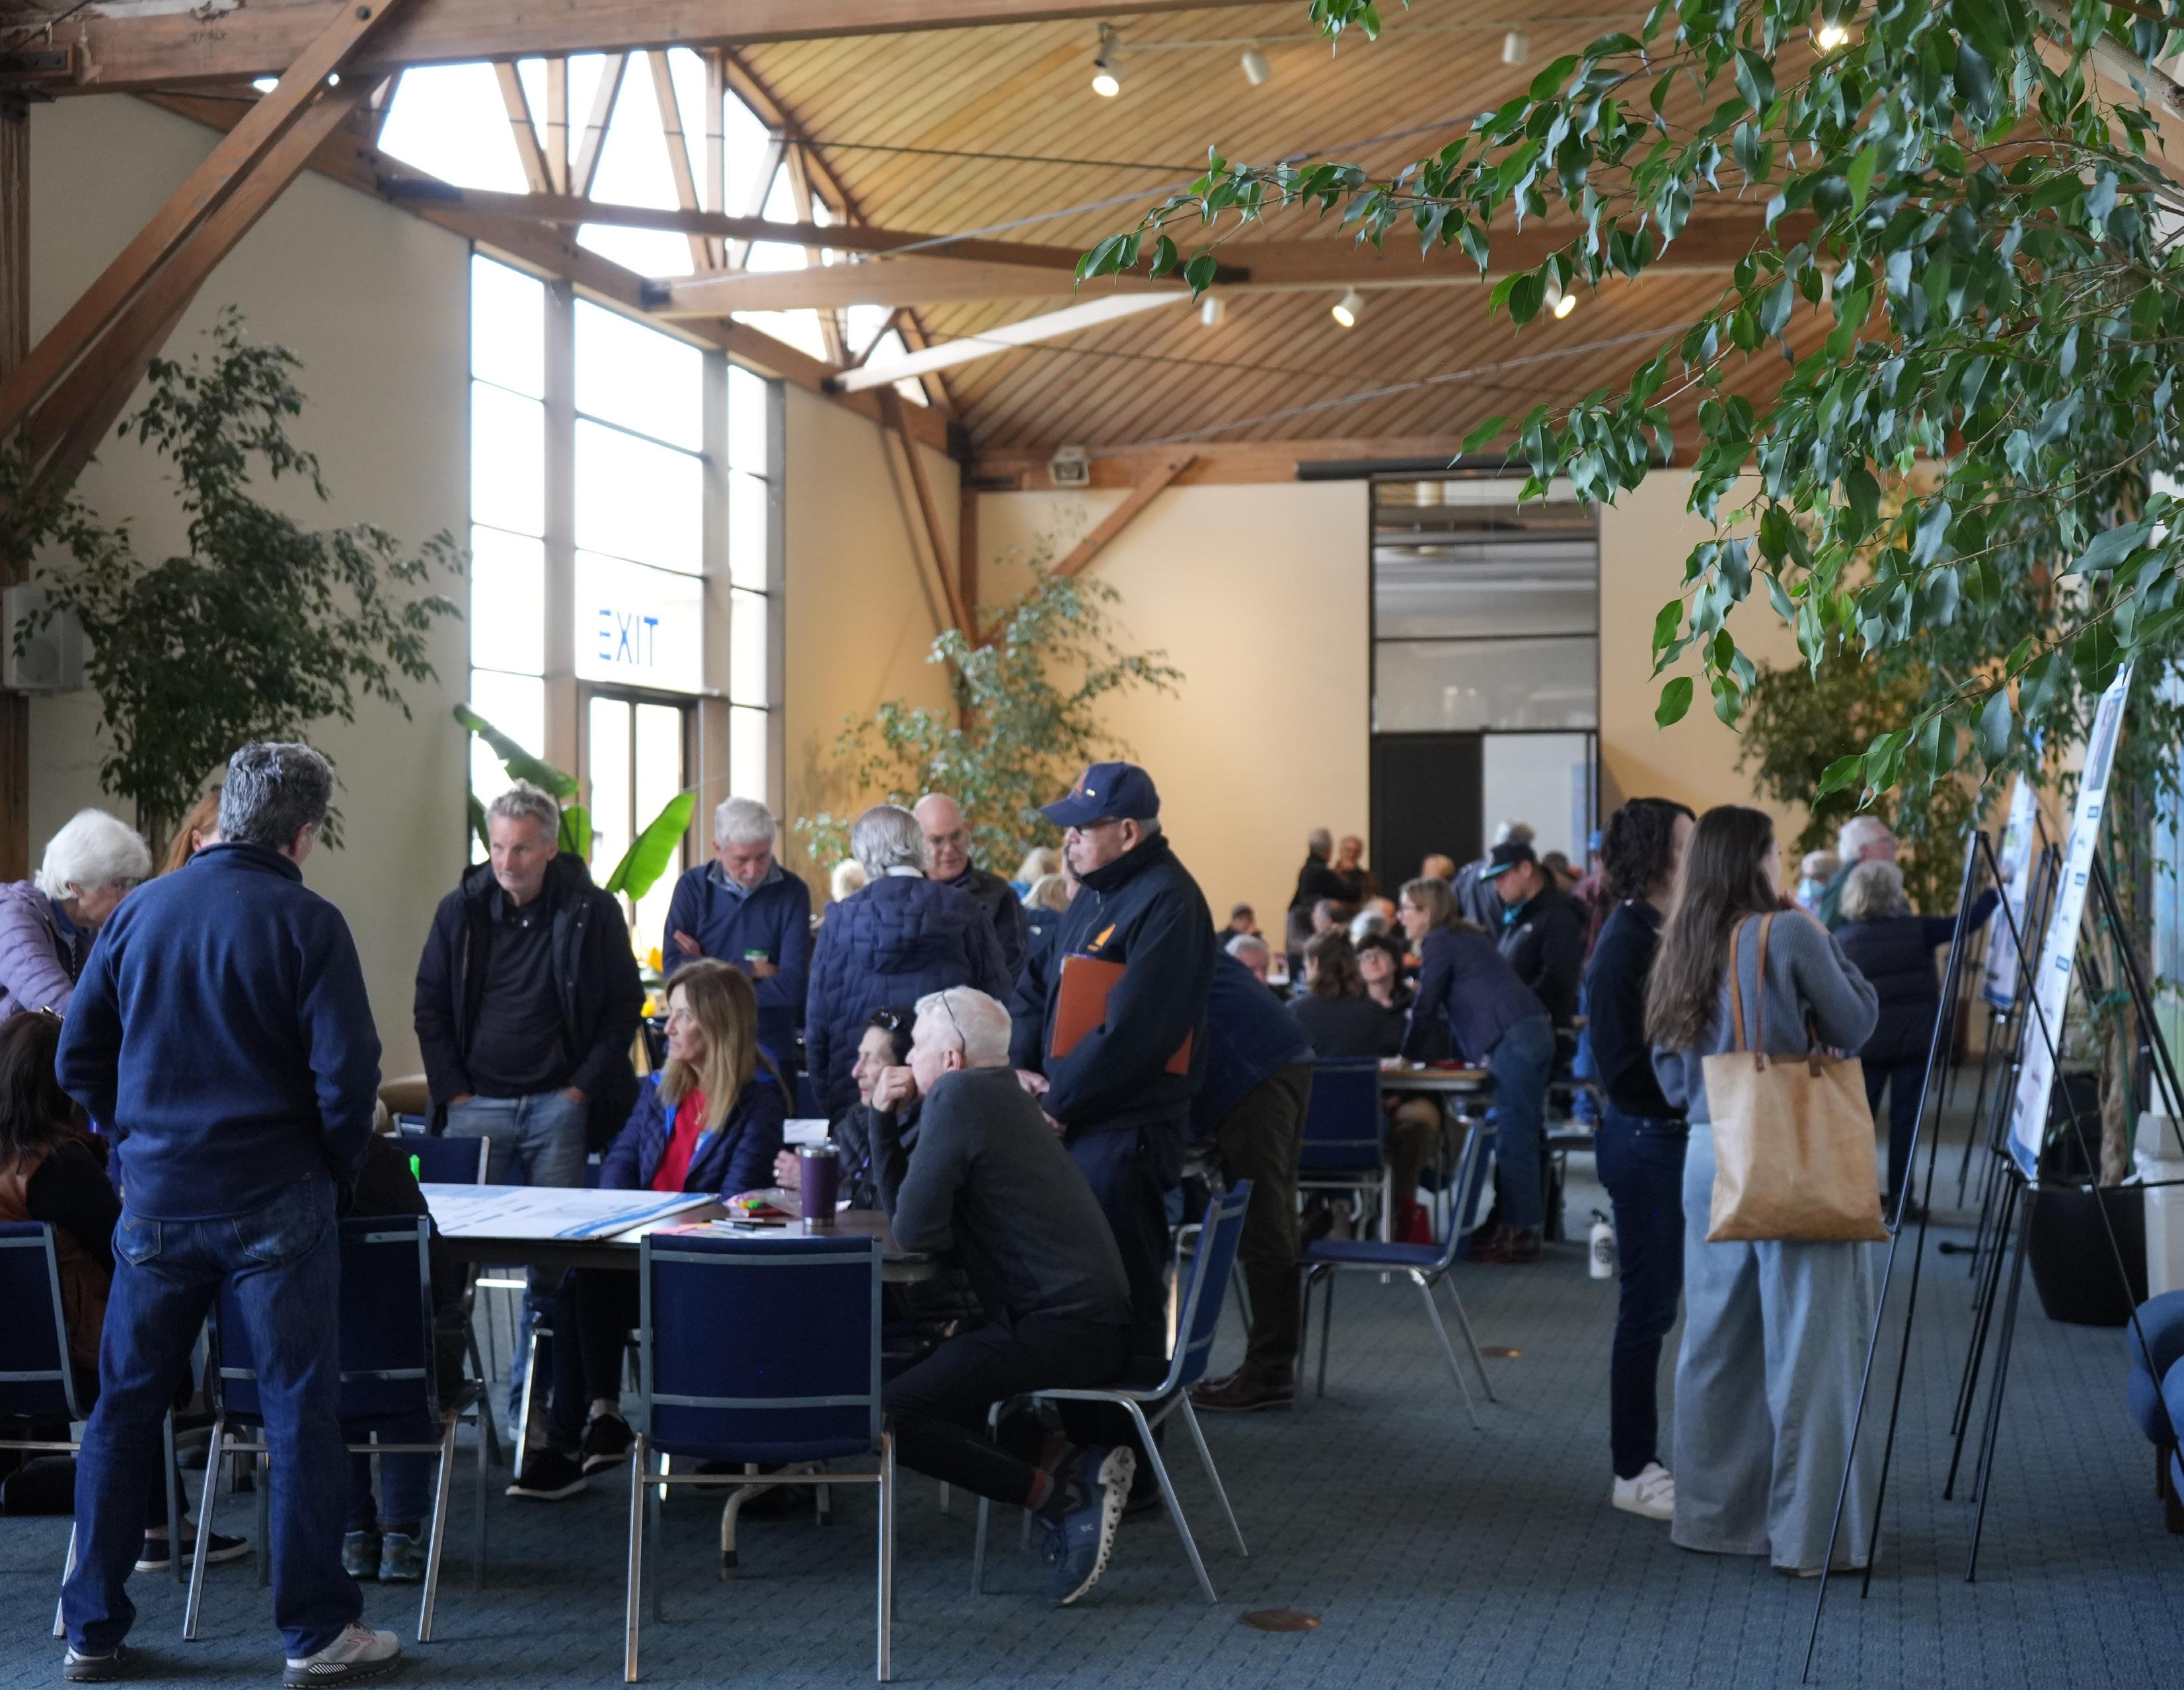
The input and ideas from community members were critical throughout the planning process to build a robust and thoughtful vision. Sausalito will adapt to future conditions while maintaining its maritime character and connection to the shoreline, supporting local ecology and economic vitality, and promoting local arts and culture. Extensive engagement sought input from community members, local organizations, stakeholders, and City staff. Engagement activities included shoreline walking tours, focus groups, community pop-ups, and public workshops as well as an online survey, each providing valuable insight into the community’s insight about Sausalito’s vulnerability and next steps for addressing sea level rise. This input guided the planning effort to examine location-specific adaptation by assessing the City’s shoreline across four character zones: Southern Waterfront/ Ferry Terminal & Bridgeway Promenade, New Town, Marinship, and Floating Homes.
Community priorities that emerged from these engagement sessions include preserving the City’s maritime character, maintaining shoreline connectivity along the waterfront, exploring floating adaptation options, and addressing sea level rise through “collective” action – community members working together in partnership to plan, fund, and build protection. Landowners in the Marinship shoreline are energized to embark on next steps to ensure continued
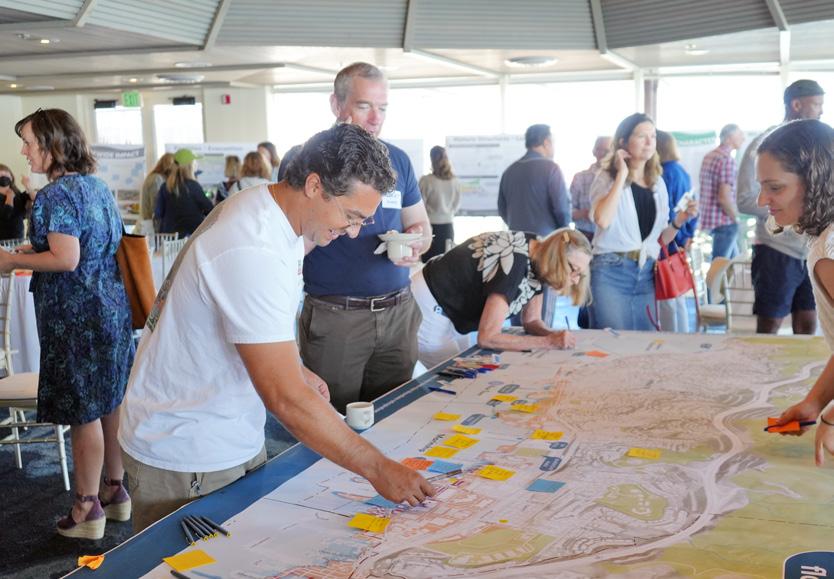
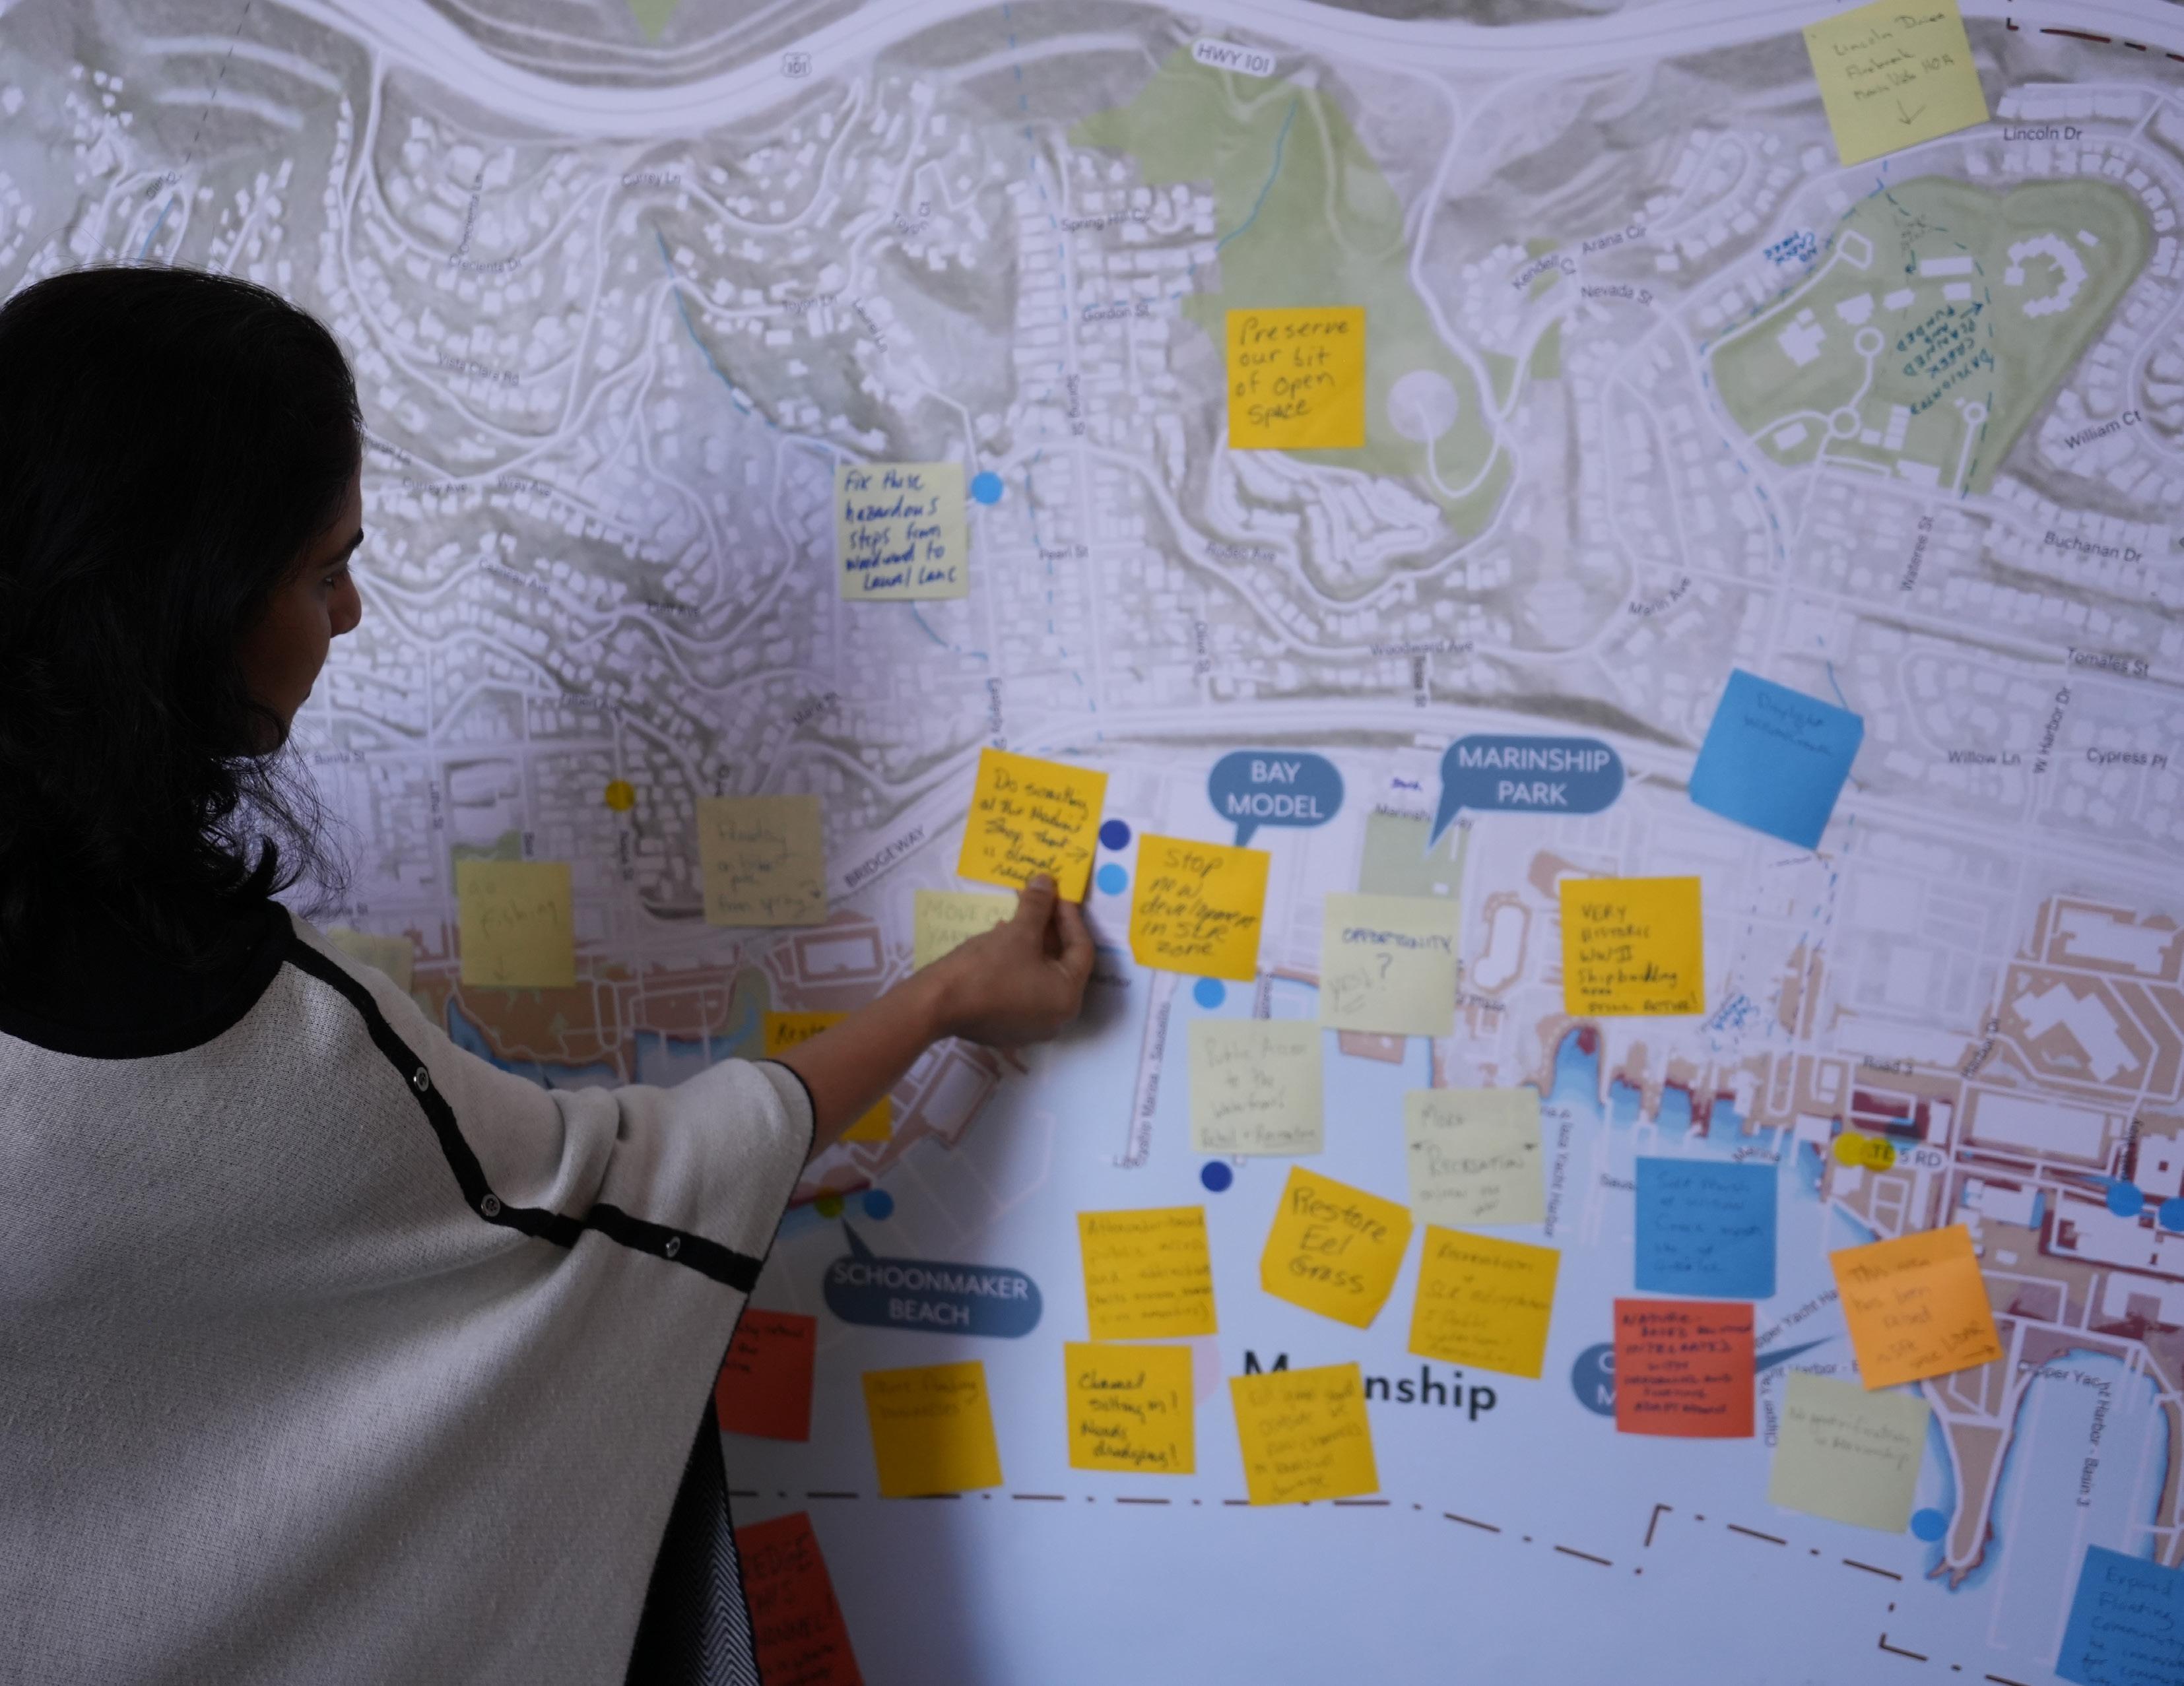
(Opposite) Participants in Community Workshop 2 share feedback on the tradeoffs between concept explorations in the New Town area of the
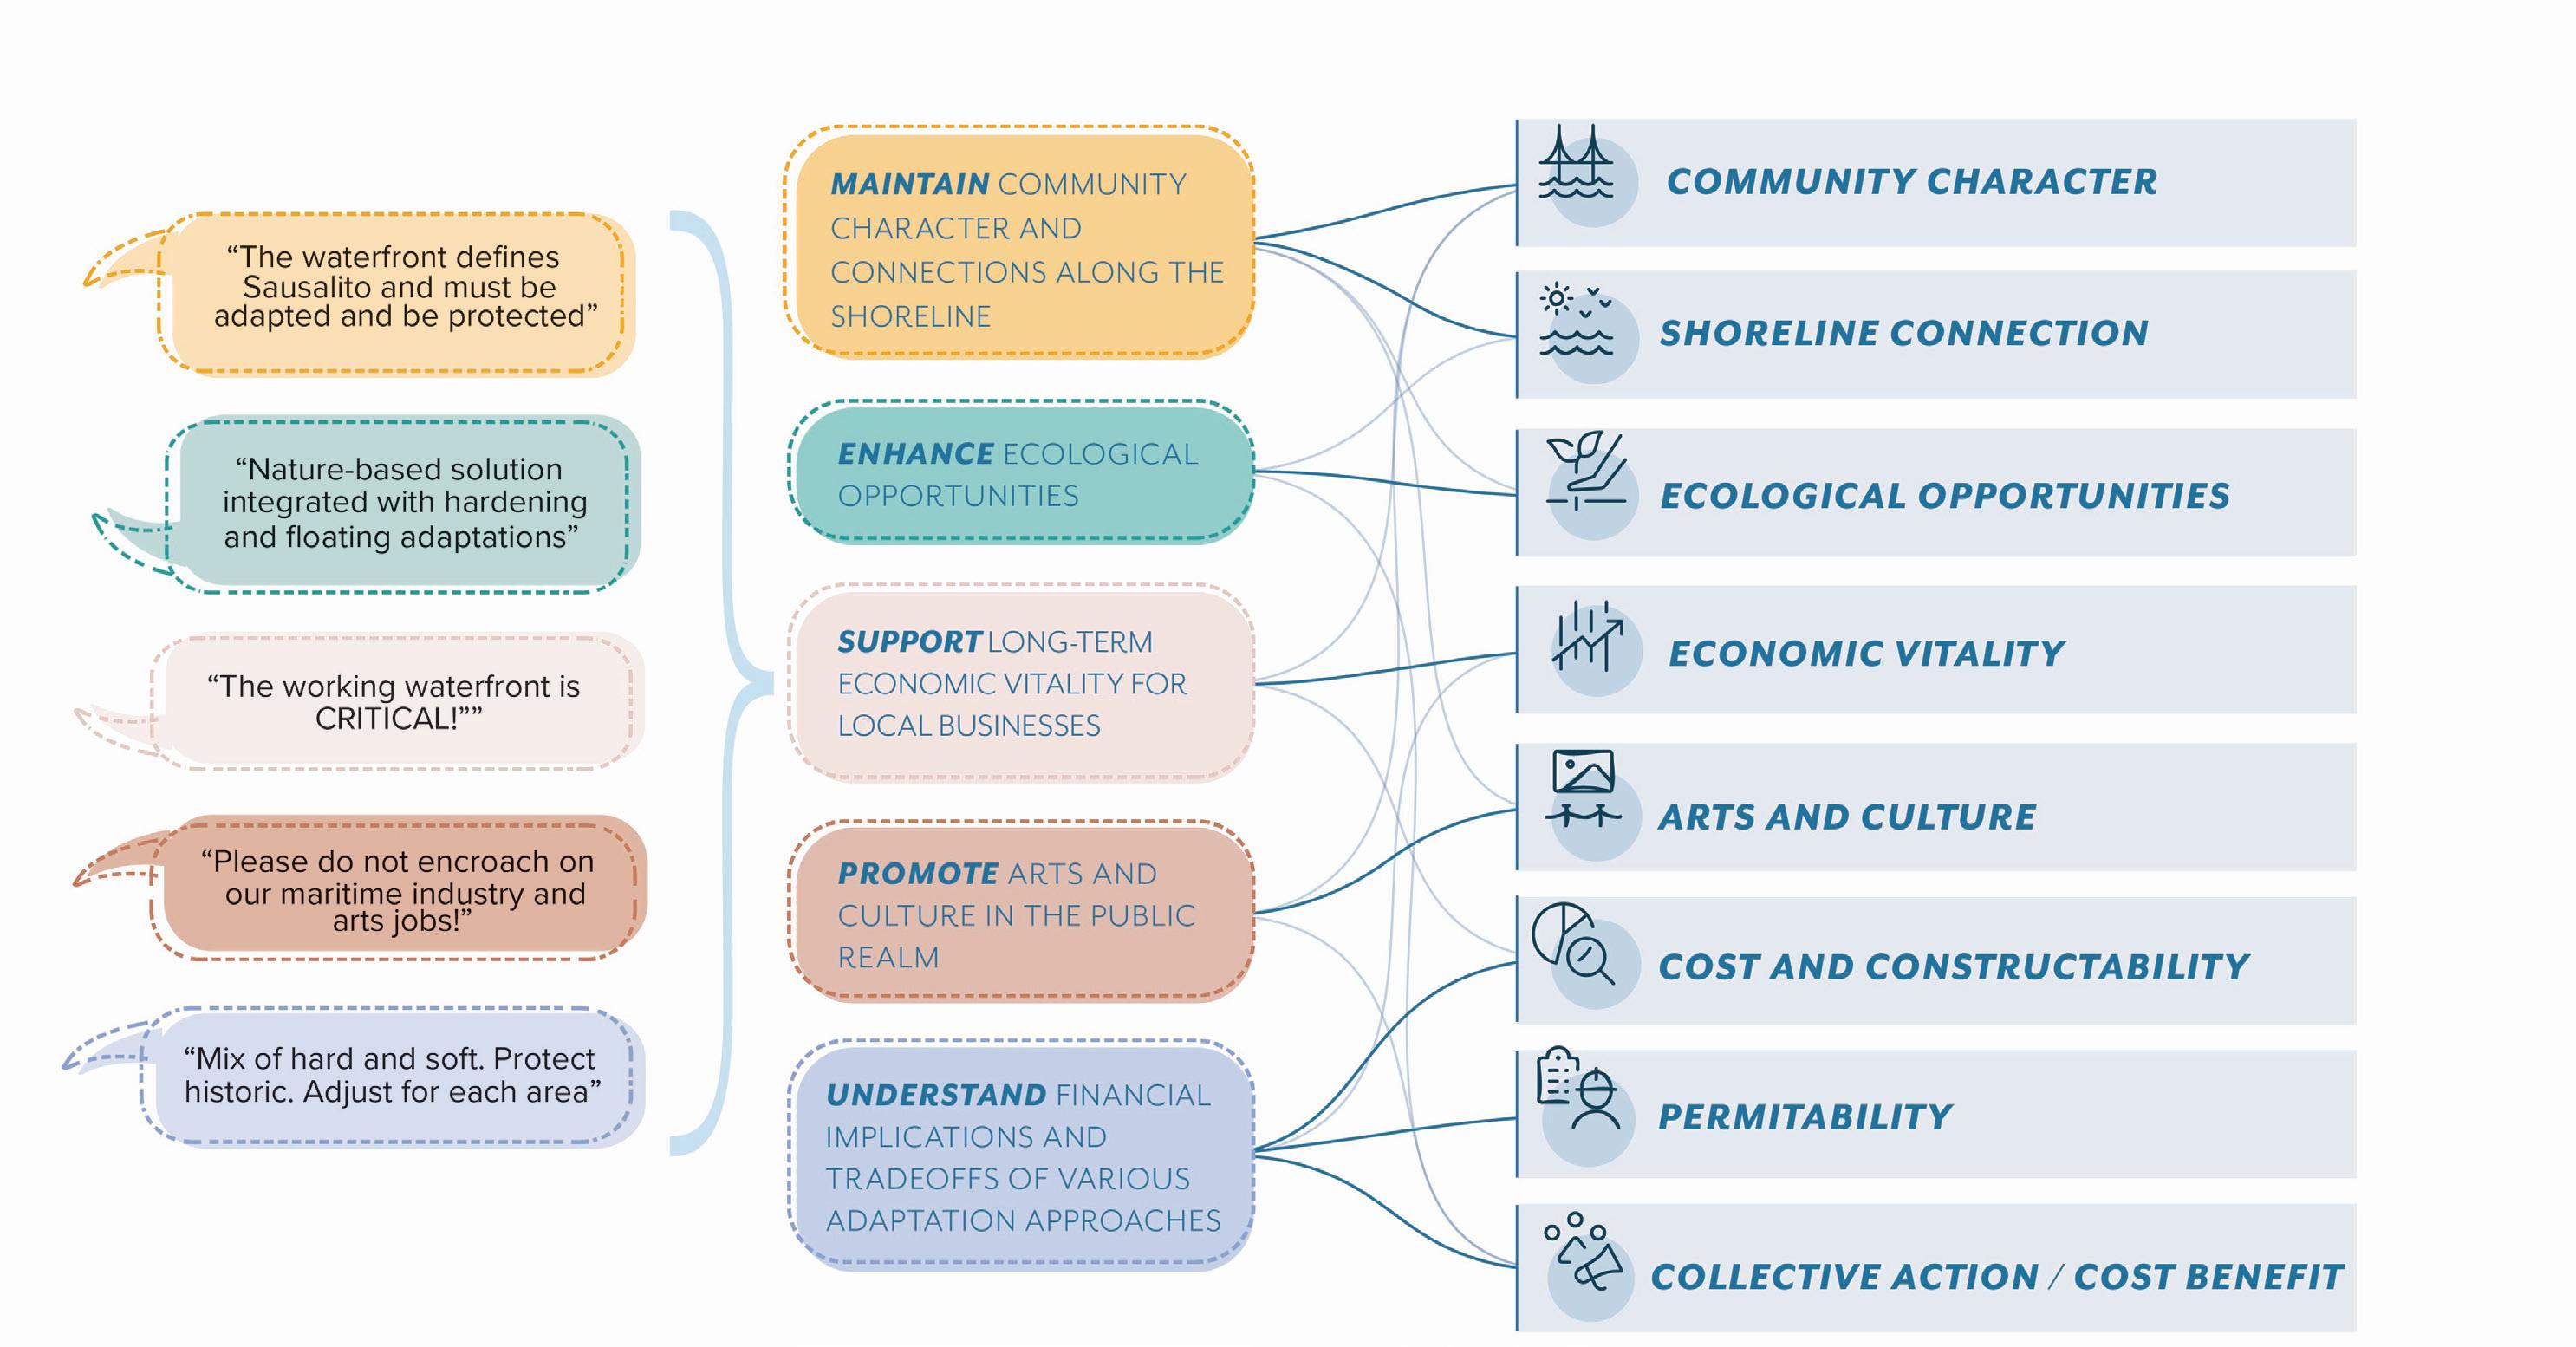
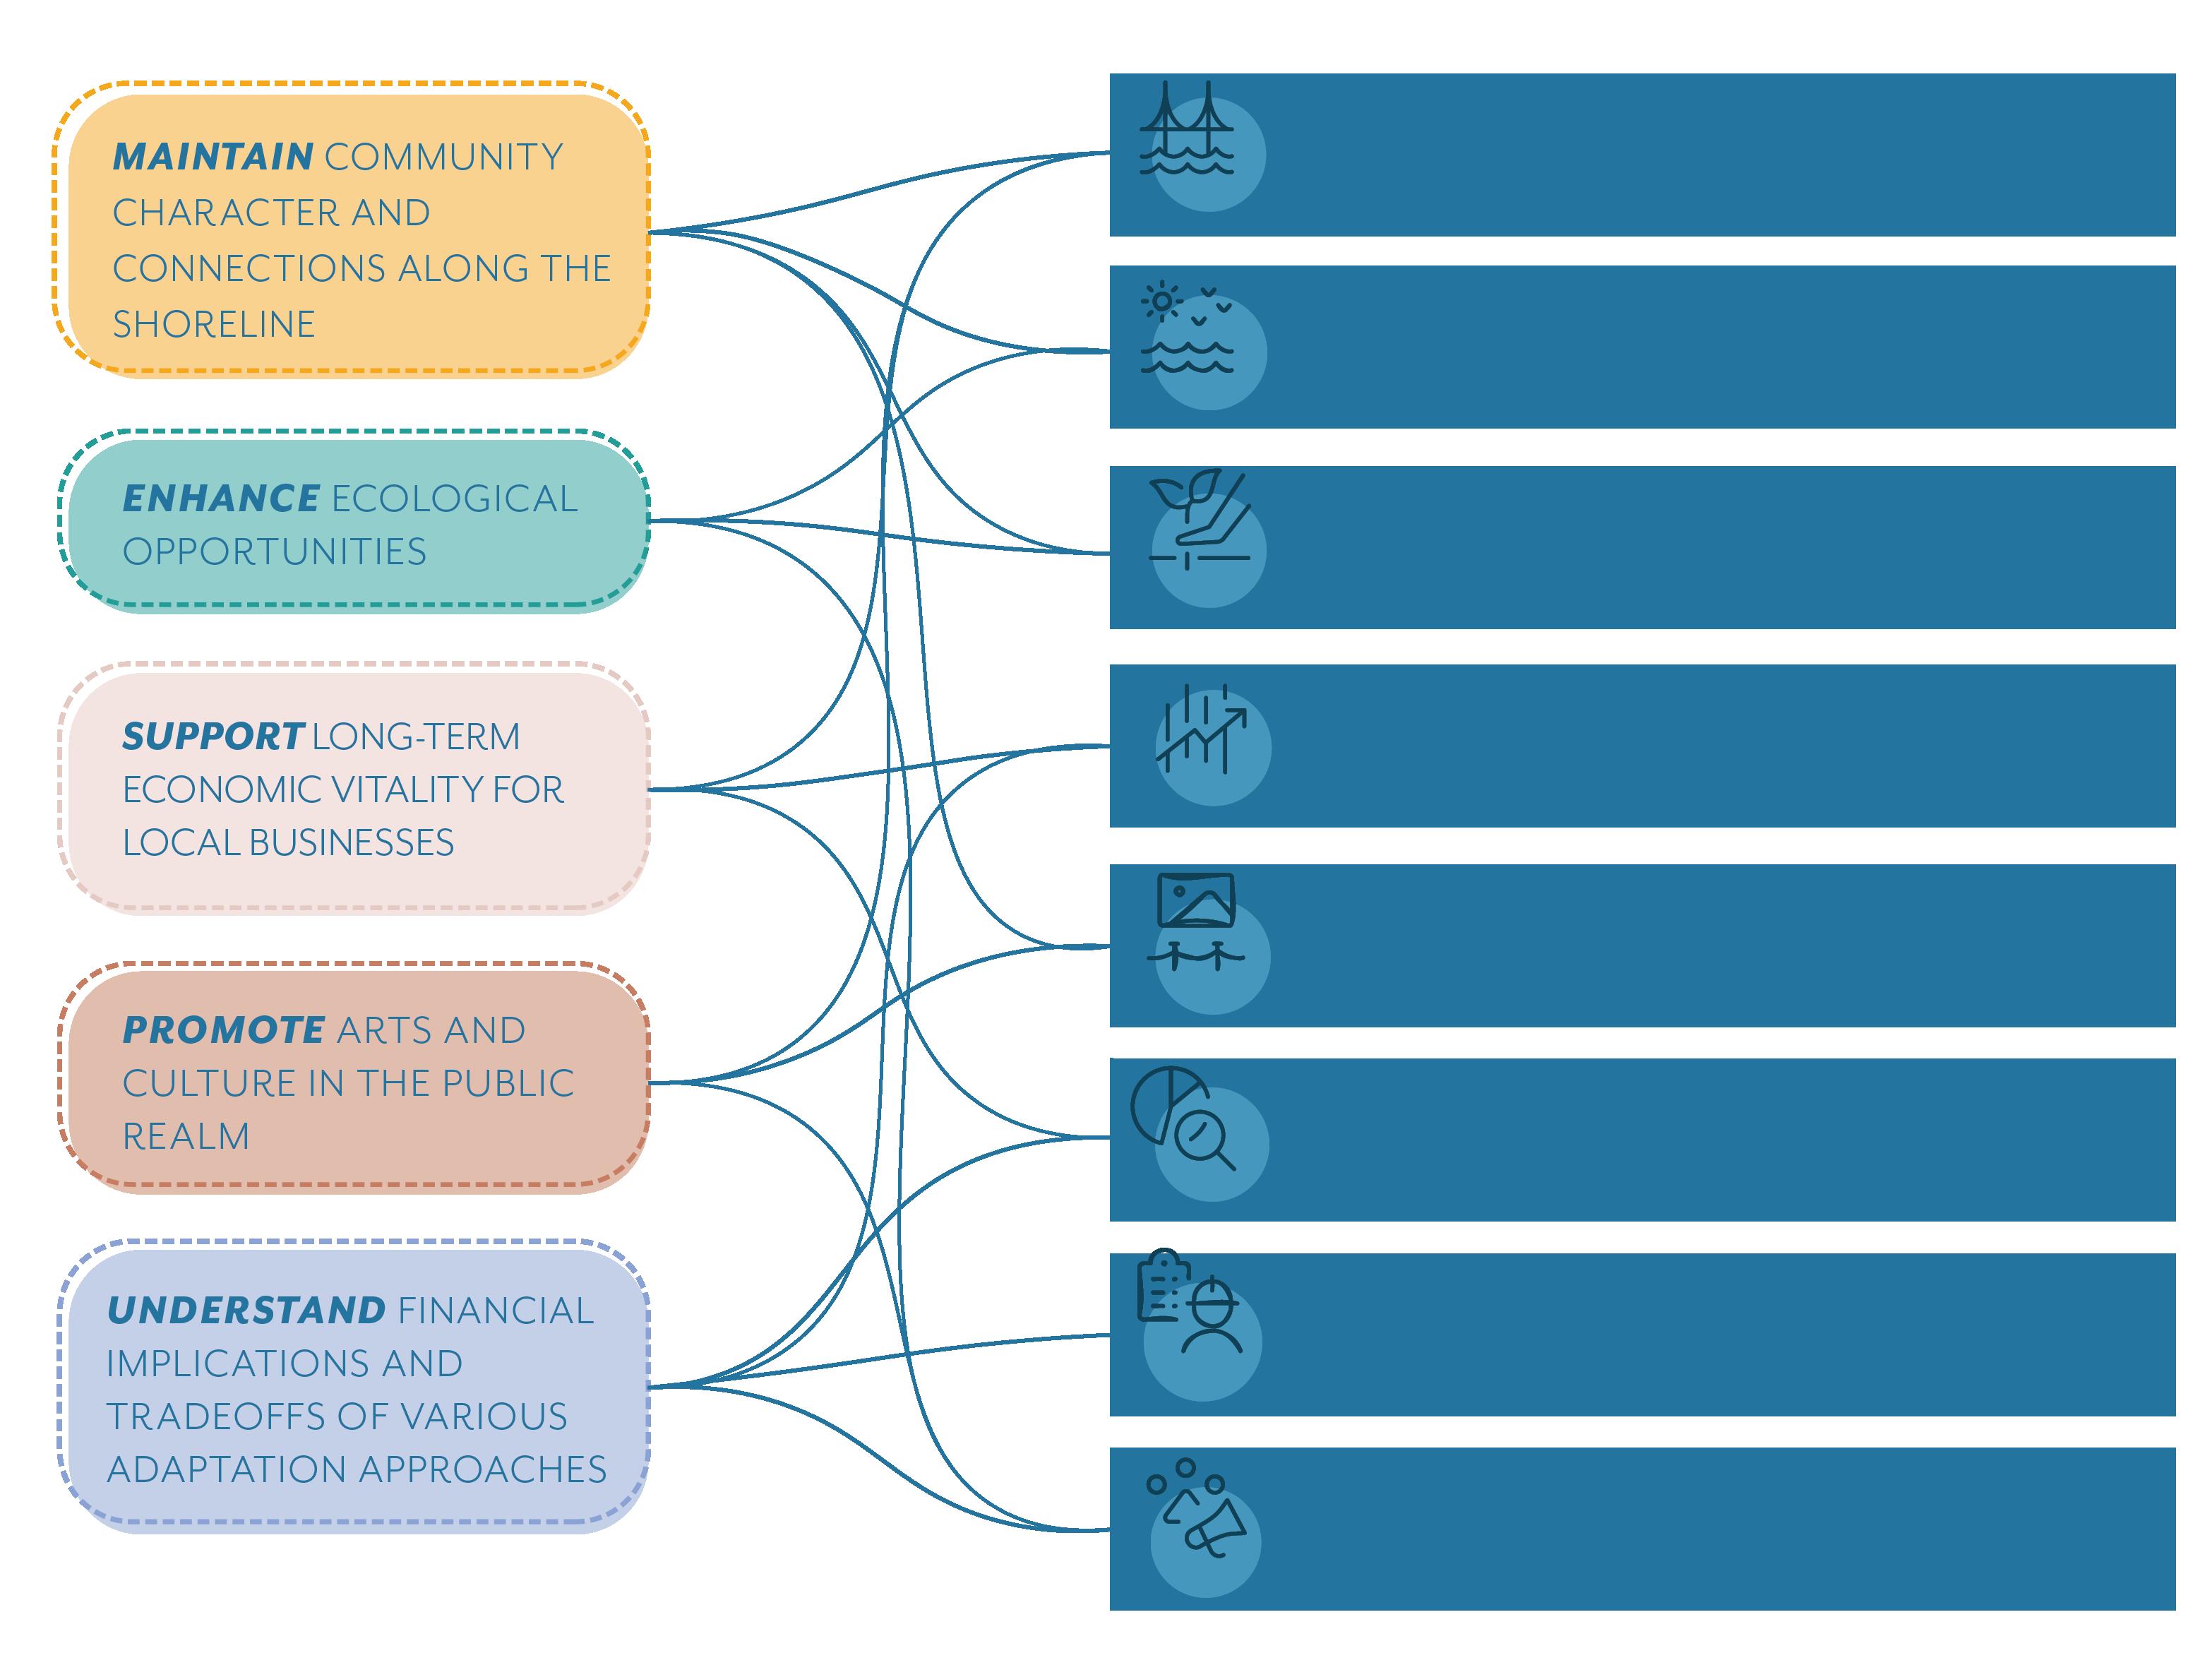
Figure 1: Community-Informed Planning Process: Input, to Project Goals, and Evaluation Criteria.
operations and seek City support to streamline environmental review (CEQA) and permitting of improvements. These priorities as well as other input were used during the planning process to create community informed project goals that then guided the planning team’s exploration of adaptation strategies and implementation.
The plan describes planned and constructed actions needed to mitigate flooding impacts for each reach and subarea along the shoreline from south to north. Near-term actions commonly involve planning, detailed
technical studies, and community organizing that are needed to build toward future resiliency. Some areas will be impacted sooner and need more urgent retrofits to storm drains and buildings. Multiple longterm options are also provided to identify potential protective features such as raising public roads or building seawalls in the future.
Sustained actions are needed to begin today in order to address impacts to be seen in the coming decades. In fact, actions toward a solution are multi-step. The pathways approach helps identify early actions and trigger points for decisions to build protective measures or else face flooding. This plan positions property owners and City decision makers to prepare detailed pathways for each subarea that guide near-term decisions and track deadlines for construction. Success may be based on two critical factors. First, the ability for property owners to work together toward a shared solution or collective action. Partnerships are integral to success and rely on private entities as well as local municipal, utility, and State and Federal agencies. Second, is ability to secure funding. In the case of large collective actions such as protective seawalls that straddle multiple properties and project entire districts, the factors are related. Collective actions require cooperation to create legal structures such as finance districts that lead and receive funding for costly projects.
The changing conditions ahead require new ways of building. If in the future we float our homes, businesses, roads, and utilities, how do our current regulations apply? What incentives or restrictions are needed to ensure new construction addresses what we already know about future flooding? Some of the work ahead will involve preparing new guidance that encourages responsible action.
PRINCIPLES FOR ADAPTATION
PRINCIPLE 1: MAINTAIN AN ACTIVE PUBLIC WATERFRONT
PRINCIPLE 2: EXPLORE FLOATING OPTIONS
PRINCIPLE 3: SUPPORT A WORKING WATERFRONT
PRINCIPLE 4: EXPLORE ECOLOGICAL OPPORTUNITIES AND RESTORATION POTENTIAL FOR SHORELINE PROTECTION
PRINCIPLE 5: SUPPORT AND EXPAND MANY OF THE RESILIENT COMMUNITY PRACTICES ALREADY UNDER WAY
PRINCIPLE 6: ALIGN FUTURE SHORELINE PROJECTS WITH SLR ADAPTATION OPPORTUNITIES
PRINCIPLE 7: DEVELOP ADAPTATION PATHWAYS FOR LONG-TERM PROJECT PLANNING.
The plan also cautions that protective seawalls and levees come with their own risks of failure. This can be a catastrophic flood event caused by breach or overtopping. Also during normal storm events, water from rainfall behind a wall can build up if pumps fail due to electrical outages or equipment malfunction. Ongoing operations and maintenance of facilities becomes a municipal priority and source of risk.
While this plan endeavors to be specific about recommended solutions, the long timeline and immense challenges ahead will
require decision makers to adjust plans –to adapt. The community visions captured here reinforce implementation principles even if conditions change. Property owners taking initiative to implement protections are encouraged to embrace this guidance. The principles are a useful tool for the City and community to examine individual shoreline project proposals moving forward.
ADAPTATION STRATEGY RECOMMENDATIONS BY CHARACTER ZONE
• Build low wall along sidewalk and deploy temporary barriers during more frequent storms.
• Property owners (public and private) organize into working group to study and fund long term improvements.
• Private property study and plan feasibility of nature-based wave attenuation and building retrofit options.
• Study options for adaptation of Bridgeway, adjacent storefronts and retrofit drainage systems.
• Study planning and design standards to support long-term building and habitat opportunities along shoreline.
• Address immediate areas of subsidence, storm drainage challenges and flooding.
• Coordinate working groups and advance district-scale study to fund and implement adaptation improvements aligned with community vision.
Figure 2:
Near-term and long-term adaptation strategy recommendations for the Sausalito shoreline.
• Private properties to study site specific options for protecting utilities, raising parking lots and constructing piers. Raise pile caps at docks and columns at piers. Study habitat enhancements and living breakwaters.
• County/City/Caltrans to study protection of transportation assets including Bay Trail. Caltrans/County to address scour at drainage outfall.
LONG-TERM OPTIONS TO MITIGATE END-OF-CENTURY + STORM
• Build new protective seawall in combination with Bridgeway raising, widening, and protection of utilities. Improving storm drainage system. Raise buildings along Bridgeway or adapt ground floors.
• Swede’s Beach nature-based solutions to reduce impacts to private properties. Individual building retrofit as needed.
• City to raise Bridgeway as the resilient edge.
• Shoreline buildings are individually adapted to be floating, raised on piers or foundations.
• Based on district study, implement adaptation improvements to roadways and public access corridors, shoreline protection, buildings and land, habitats.
• Improve drainage systems to collect, store, and pump stormwater to the Bay.
• Private owners to raise access areas, parks, and utilities.
• Public partners to raise transportation features to address local and regional transportation needs. Improvements also protect adjacent communities including Marin City.
Sea level rise planning is a recent endeavor for cities in California. City staff, elected officials, and community members across the Bay and State are all learning about impacts and potential solutions. Often, adaptation solutions insert new realities and outcomes into what residents have long envisioned for their city. Change takes time. There is also a collective realization that easy solutions are few and major projects are too expensive for a small city to undertake. Property owners need to work together. Multiple agencies need to partner. Civic leadership needs to emerge. This too takes time.
Several municipalities like Sausalito are embarking on adaptation studies to explore what is vulnerable and are beginning to think about what actions they can take. The process of sharing knowledge about impacts, documenting community values, and envisioning change is valuable. So is true in Sausalito. This adaptation plan prioritizes communication of largescale, citywide vulnerability. It documents community feedback about potential solutions. There is greater clarity for nearterm actions described in this plan including where recommendations are made for further study. This is especially true in the Marinship. The plan is limited in terms of specific long-term recommendations for the Marinship. The district’s complexity and uniqueness in the City’s waterfront requires further study and functional cooperation
between landowners to envision a shared future where flood protection, maritime operations, arts and culture, and economically-viable land uses coexist. Local landowners will also be able to consider strategies to fund and implement collective actions. Through that focused planning process, the continued operations of each property can be best resolved as part of a flood protection program.
THE
PLAN IS LIMITED IN TERMS OF SPECIFIC LONG-TERM
RECOMMENDATIONS FOR THE MARINSHIP. THE DISTRICT’S COMPLEXITY AND UNIQUENESS IN THE CITY’S WATERFRONT REQUIRES FURTHER STUDY AND FUNCTIONAL COOPERATION BETWEEN LANDOWNERS TO ENVISION A SHARED FUTURE WHERE FLOOD PROTECTION, MARITIME OPERATIONS, ARTS AND CULTURE, AND ECONOMICALLY VIABLE LAND USES COEXIST.
Sausalito is planning ahead for Sea
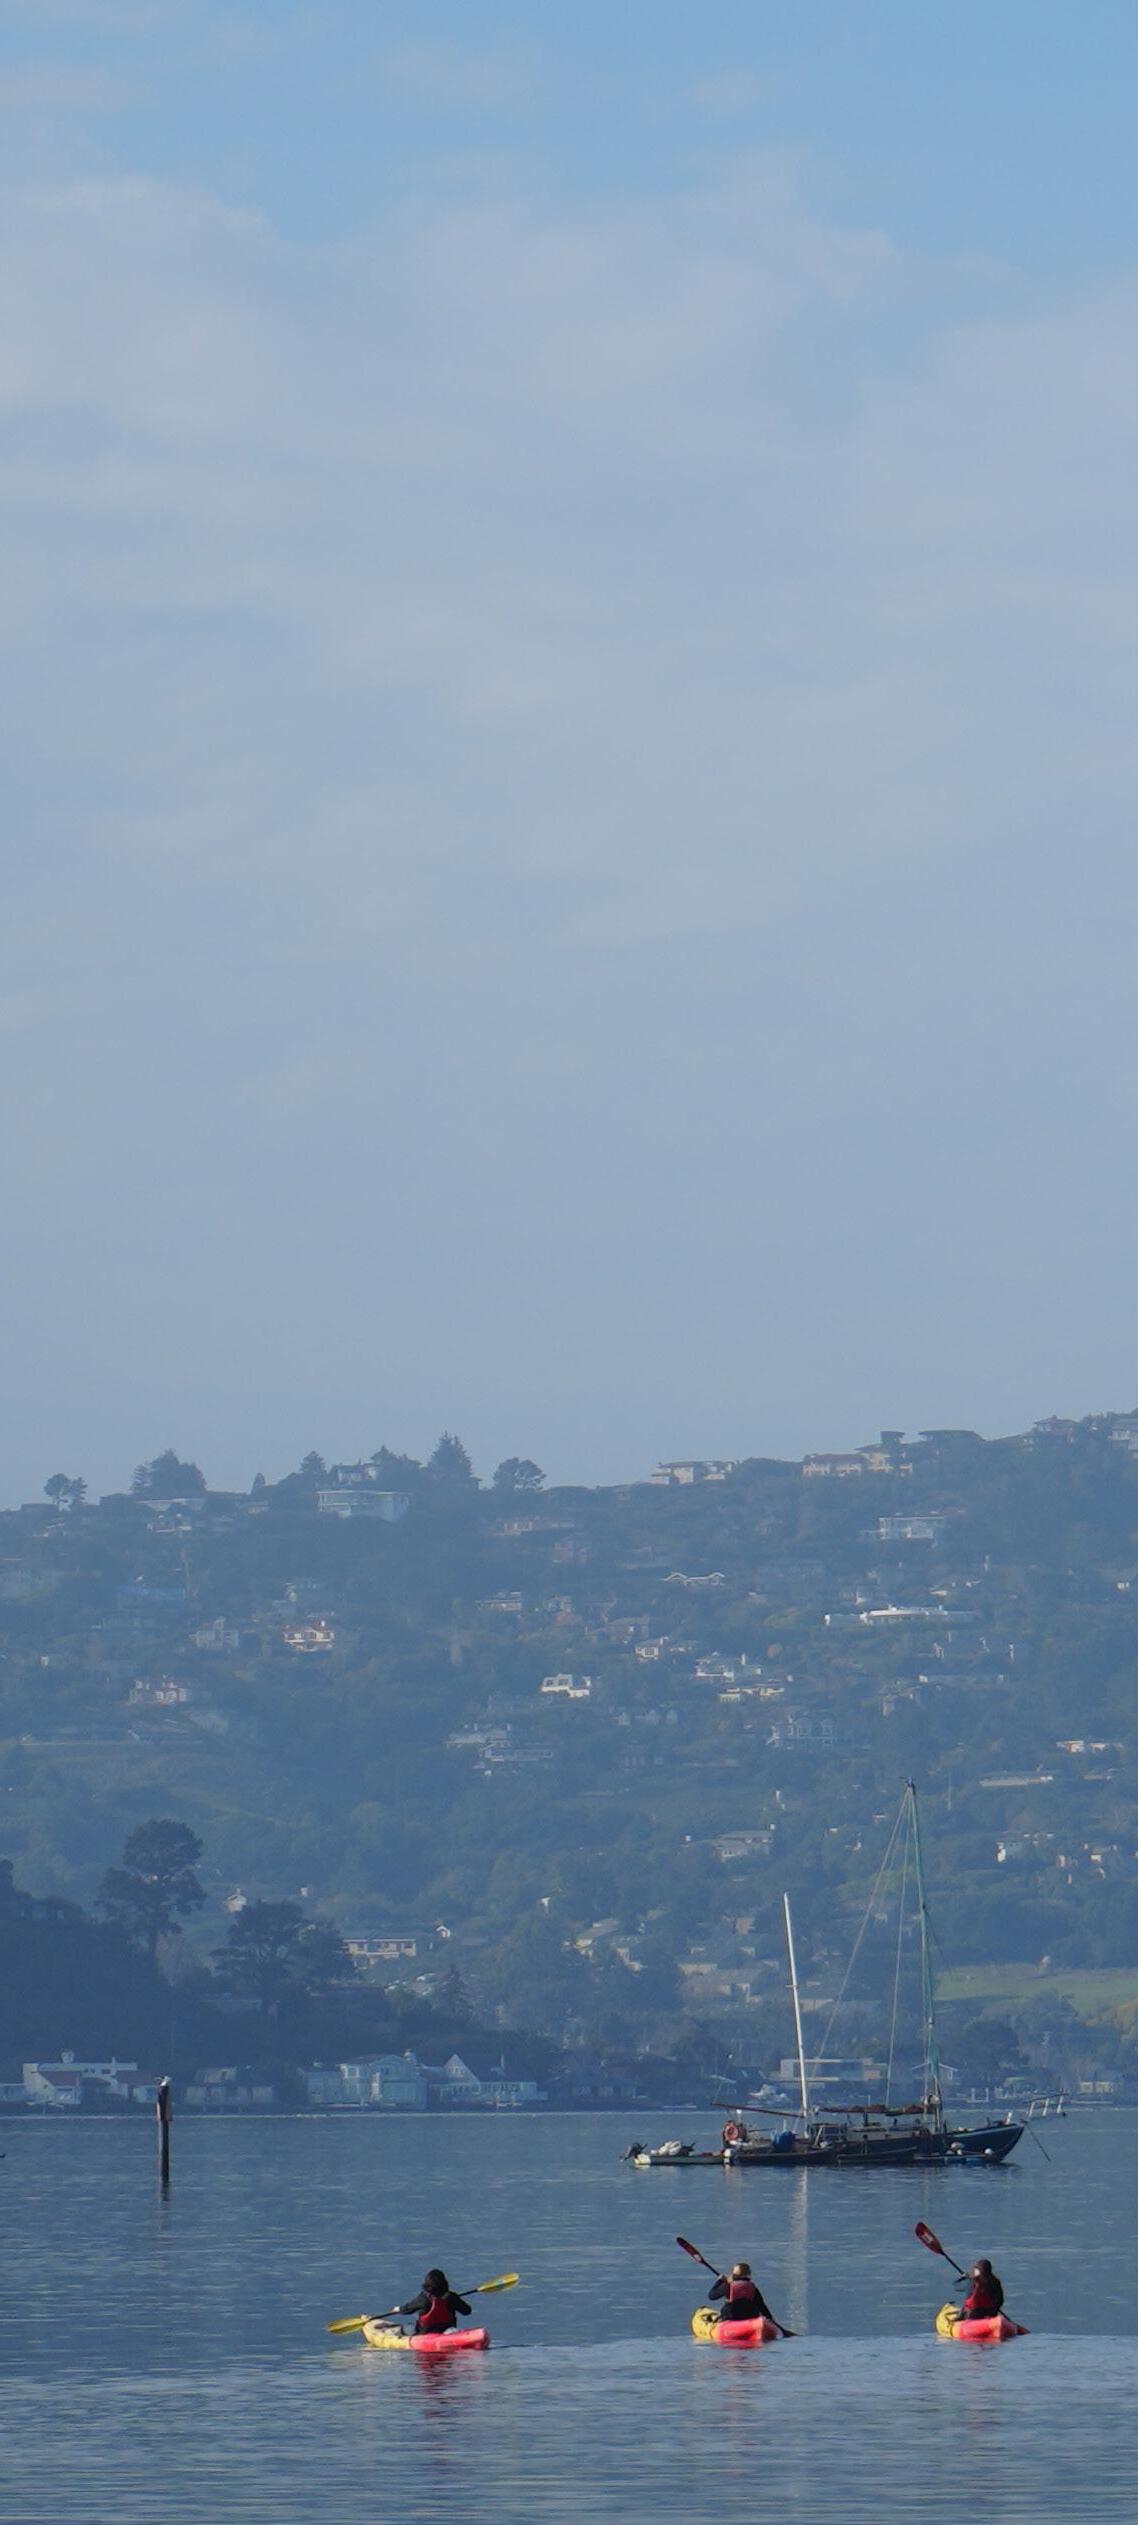
As a community of 7,500 residents situated between Richardson Bay and the coastal mountains, Sausalito is vulnerable to the impacts of sea level rise. Water rising along our 2.5 miles of shoreline will affect a wide range of our physical assets, policy decisions and programs including infrastructure, housing, circulation/transportation, land
uses, and economic growth. To meet these present and future challenges, the City of Sausalito has developed a communityinformed Shoreline Adaptation Plan that aspires to protect our community from surface and groundwater flooding due to sea level rise, enhance shoreline recreation, maintain vital transportation and utility corridors, provide continued Bay access for water-related businesses, and enhance marshes and beaches with nature-based solutions.
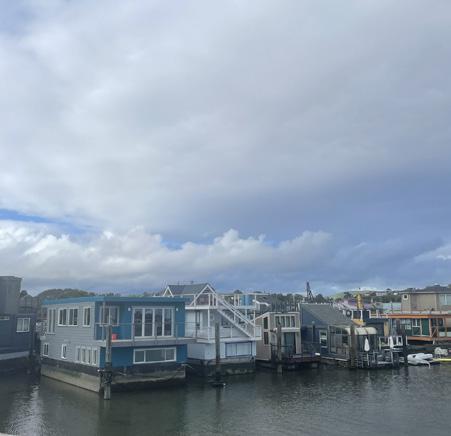
Although the houseboat communities are not technically within the City of Sausalito’s jurisdiction, they were included in this plan through collaboration with the County of

Marin. These neighborhoods fall within Sausalito’s official Sphere of Influence (SOI)—a planning boundary defined by the Marin Local Agency Formation Commission (LAFCo) that identifies areas where the City’s services, policies, and community ties are most likely to extend over time.
The plan includes an update of existing vulnerability assessments, documentation of community visions for the future, and a framework that identifies near-term and long-term adaptation opportunities along the shoreline. This process was led by the Resiliency & Sustainability Manager in close collaboration with the Department of Public Works.
• SB 272 requires cities like Sausalito to develop strategies and recommend projects to address future sea-level rise.
• Plans must be submitted to the Bay Conservation and Development Commission (BCDC) by 2034.
• The Sausalito Shoreline Adaptation Plan addresses some of the requirements of SB 272 as defined in BCDC’s Regional Shoreline Adaptation Plan Guidelines. (per Section 6.4)
The Sausalito Shoreline Adaptation plan uses the updated 2024 OPC guidance and cross references the BayWAVE and the BCDC RSAP’s sea level rise scenarios to guide this analysis.
California’s sea level rise planning guidance:
The California Ocean Protection Council (OPC) is a state body that collaborates with government agencies, NGOs, tribes, and the public to protect California’s coastal and ocean ecosystems. OPC provides the best available science on sea level rise and coastal impacts, with guidance updated every five years, projecting sea level rise through 2150 and advising on coastal adaptation, resilience planning, and investments. The Sausalito Shoreline Adaptation Plan uses the 2024 OPC guidance to set standards for planning.
The Marin Shoreline Sea Level Rise Vulnerability Assessment (BayWAVE 2017)
is a county-wide vulnerability assessment that documents the exposure of the bayside communities to sea level rise. BayWAVE identified specific risks and impacts along the entire bay shoreline, from Sausalito to Novato, for several sea level rise scenarios based on 10 inches, 20 inches and 60 inches of inundation. BayWAVE is used by local communities to understand and prepare for sea level rise along the Bay shoreline.
Developed by the San Francisco Bay Conservation and Development Commission (BCDC), the RSAP guidelines offer a unifying framework for local governments to prepare subregional adaptation plans that are aligned, equitable, and science-based. Its goal is to guide the region toward “One Bay Vision,” ensuring adaptation outcomes— such as flood protection, ecosystem resilience, and shoreline access—work
together across jurisdictions. The RSAP directly responds to California Senate Bill 272 (SB 272), which mandates that all coastal jurisdictions develop sea level rise adaptation plans by 2034.
Understanding city-wide vulnerability in line with regional guidance
Table 1 lists three SLR scenarios examined in this study:
1. Mid-century (2050) scenario of 0.8 ft sea level rise without storm surge
2. Mid-century (2050) scenario of 0.8 ft sea level rise scenario combined with 100-year storm surge, which adds to 4.3 ft total water level
3. End-of-century (2100) intermediate projection of 3.1 ft sea level rise, combined with 100-year storm surge; or End-of-century high projection of 6.6 ft sea level rise. Both would result in 6.6 ft total water level. TABLe 1:
Sea level rise (SLR) scenarios used in the Sausalito Shoreline Adaptation Plan identify two midcentury scenarios with (1) and without storm surge (2), and an end-of-century scenario (3) that illustrates both a lower projection with storm surge and a higher projection without.
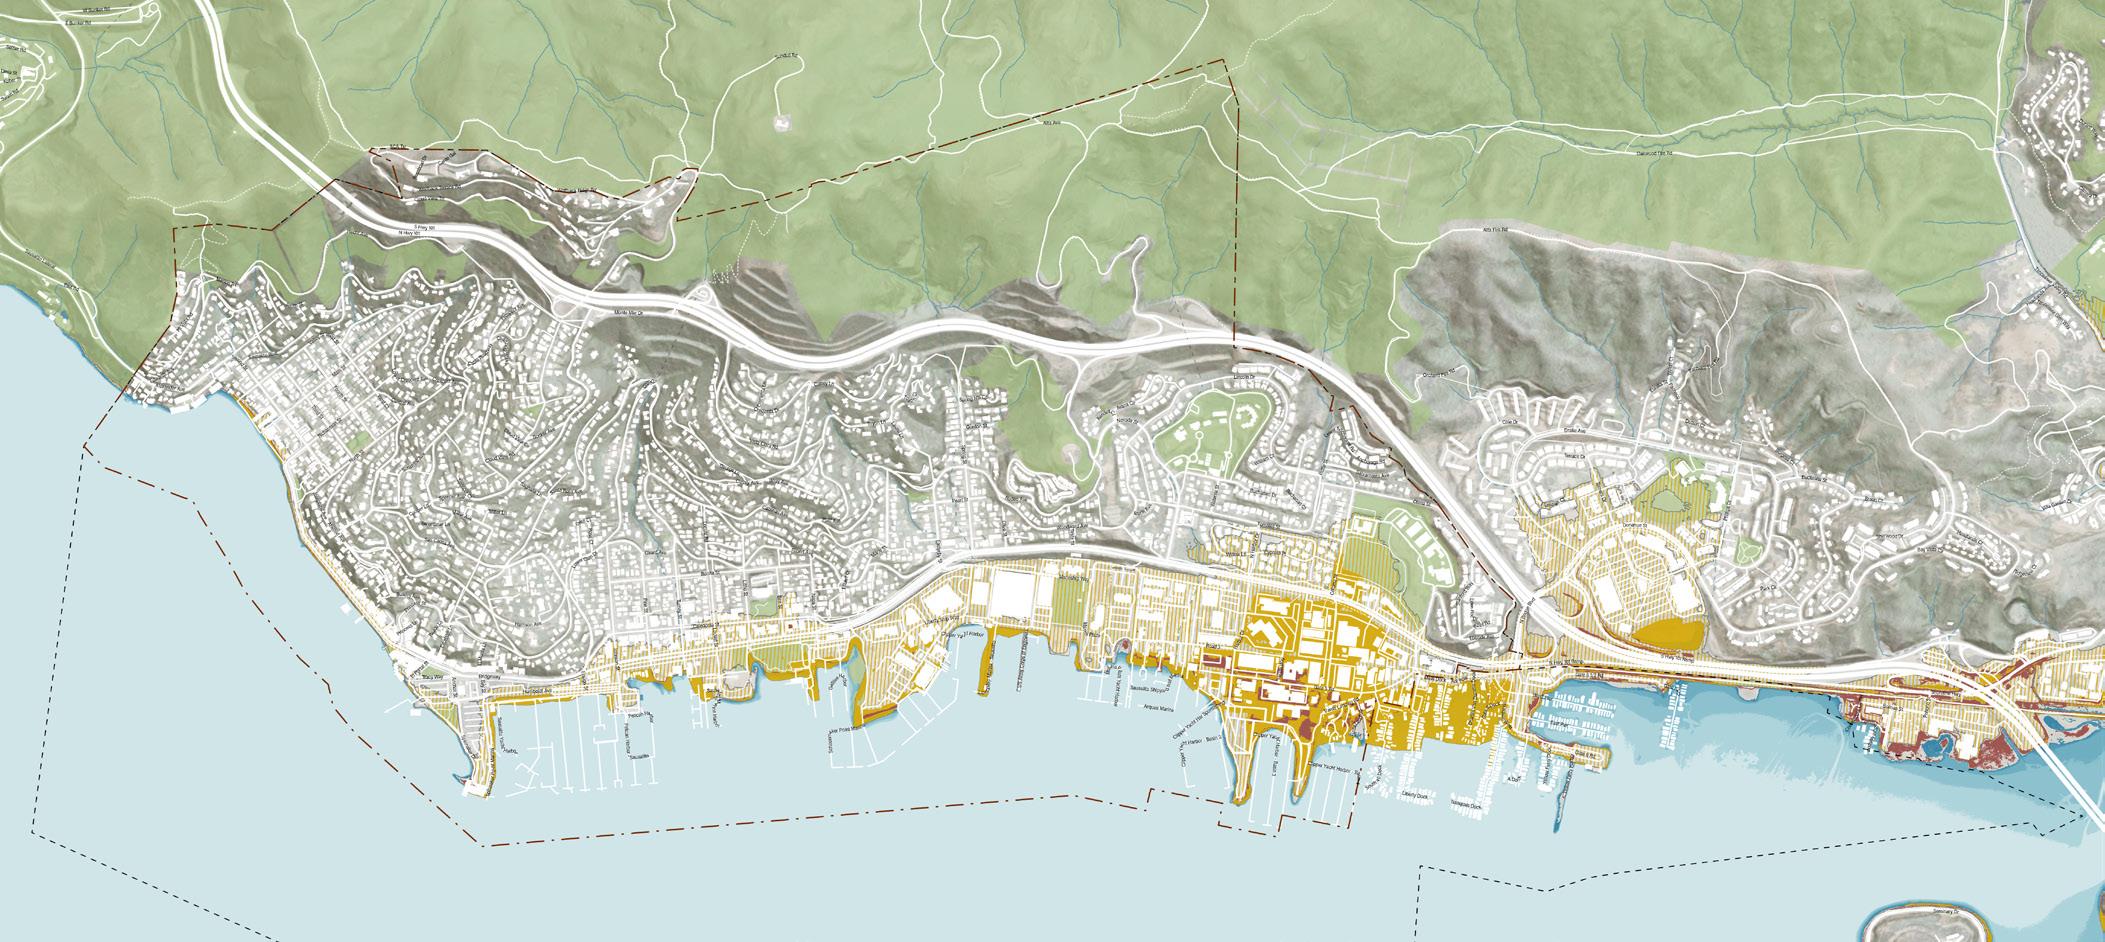
The extent of the study area for this planning effort includes the City of Sausalito jurisdiction and the unincorporated areas of Marin County east of Highway 101 referred to here as the “Floating Homes” area. Several ongoing planning studies are taking place concurrently for the Caltrans Highway 101 corridor and Marin County areas west of Highway 101, including Marin City, and therefore are not included here.
The Shoreline Adaptation Plan builds off of and aligns with other existing City of Sausalito planning policy. This adaptation plan does not create new policy. Rather, it defers to existing policies. Where conflicts may exist, this is an opportunity for future policy planning to consider changes. This will be necessary in order to best protect the city and implement adaptation solutions over time. Existing policy and planning documents include:
• Sausalito Waterfront and Marinship Vision (WAM Report), Waterfront and Marinship Committee, 2010
• Gate 5 Road Area Conceptual Drainage Study, City of Sausalito, 2011
• Marin Shoreline Sea Level Rise Vulnerability Assessment (BayWAVE), County of Marin, 2017
• Sea Level Rise Report and Recommendations, Sausalito Sea Level Rise Task Force, 2021
• Sausalito General Plan, City of Sausalito, 2021
• Dunphy Park Oyster Reef Living Shoreline Project, Estuary & Ocean Science Center (SFSU), 2022
• Marin County Multi-Jurisdictional Hazard Mitigation Plan, County of Marin/City of Sausalito, 2023
• Marin Sea Level Rise Adaptation Organizational Structure and Decision Making Process
• Senate Bill No. 272 Sea Level Rise: Planning and Adaptation Chapter 384, State of California, 2023
• Regional Shoreline Adaptation Plan, Bay Conservation and Development Commission, 2024
• Geologic Hazard Report, City of Sausalito, 2024
• Sausalito Storm Drain Assessment Report, 2025
• US-101 State Route 1 Sea-Level Rise Project
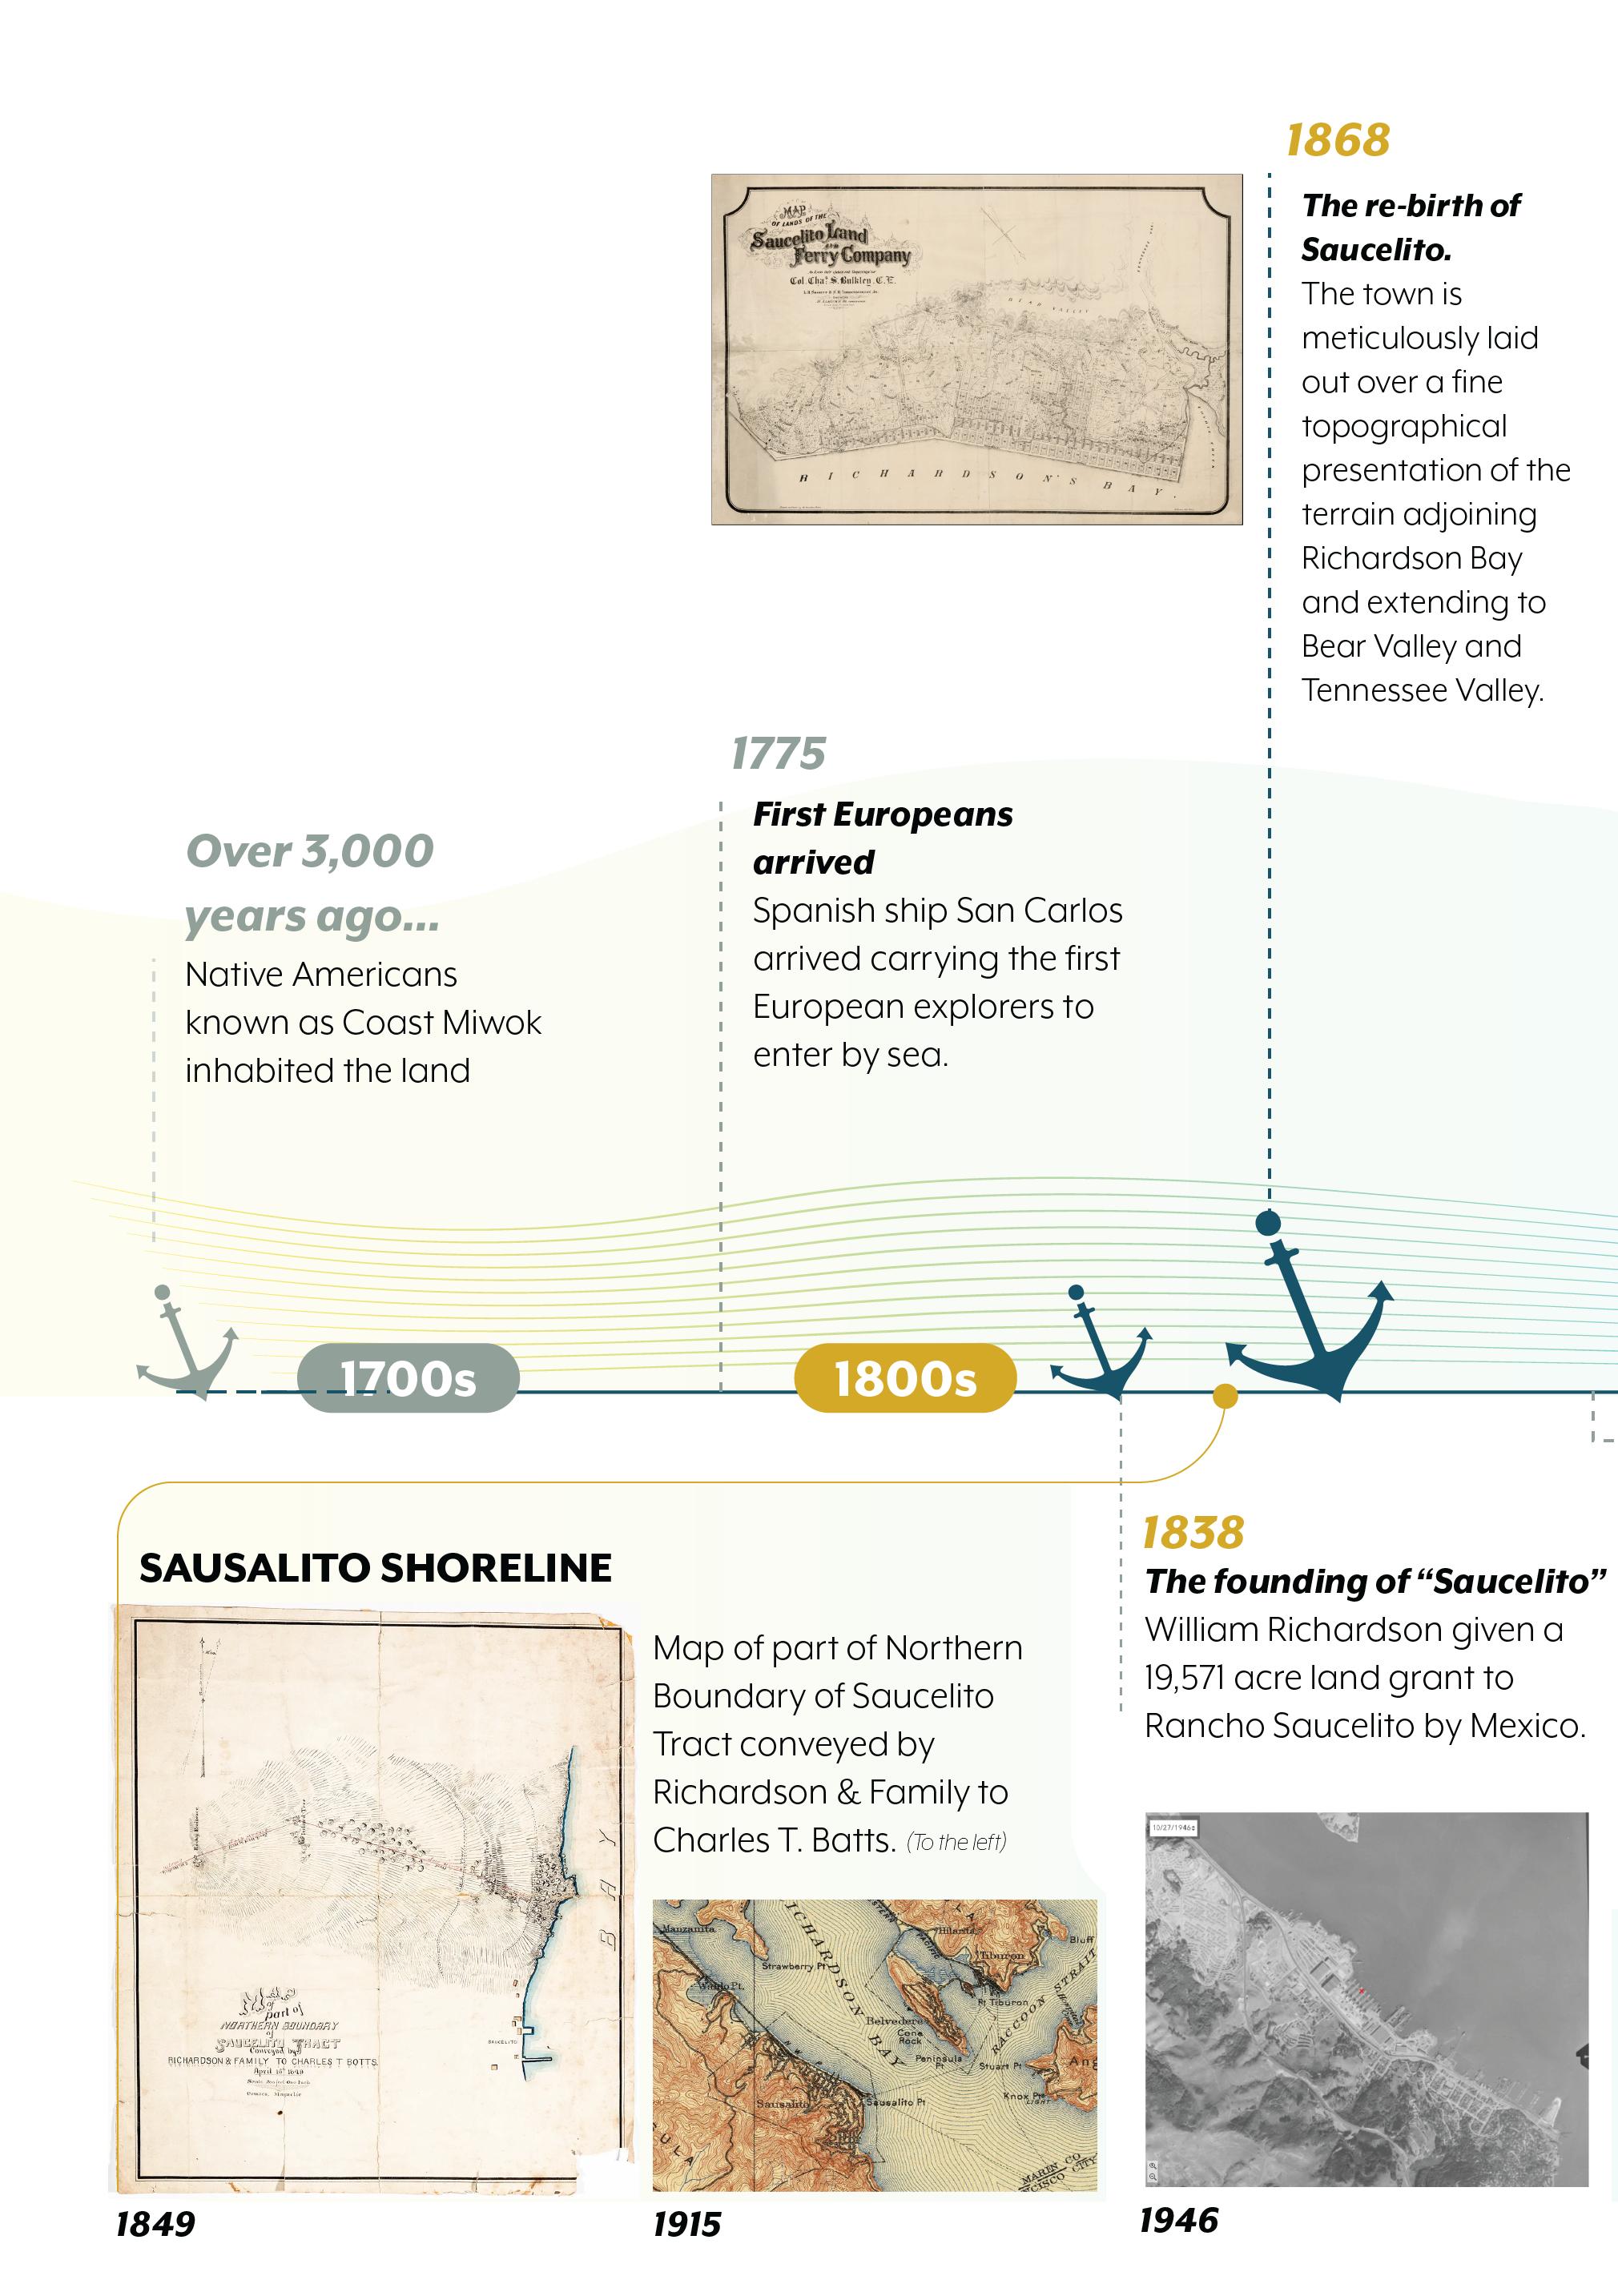
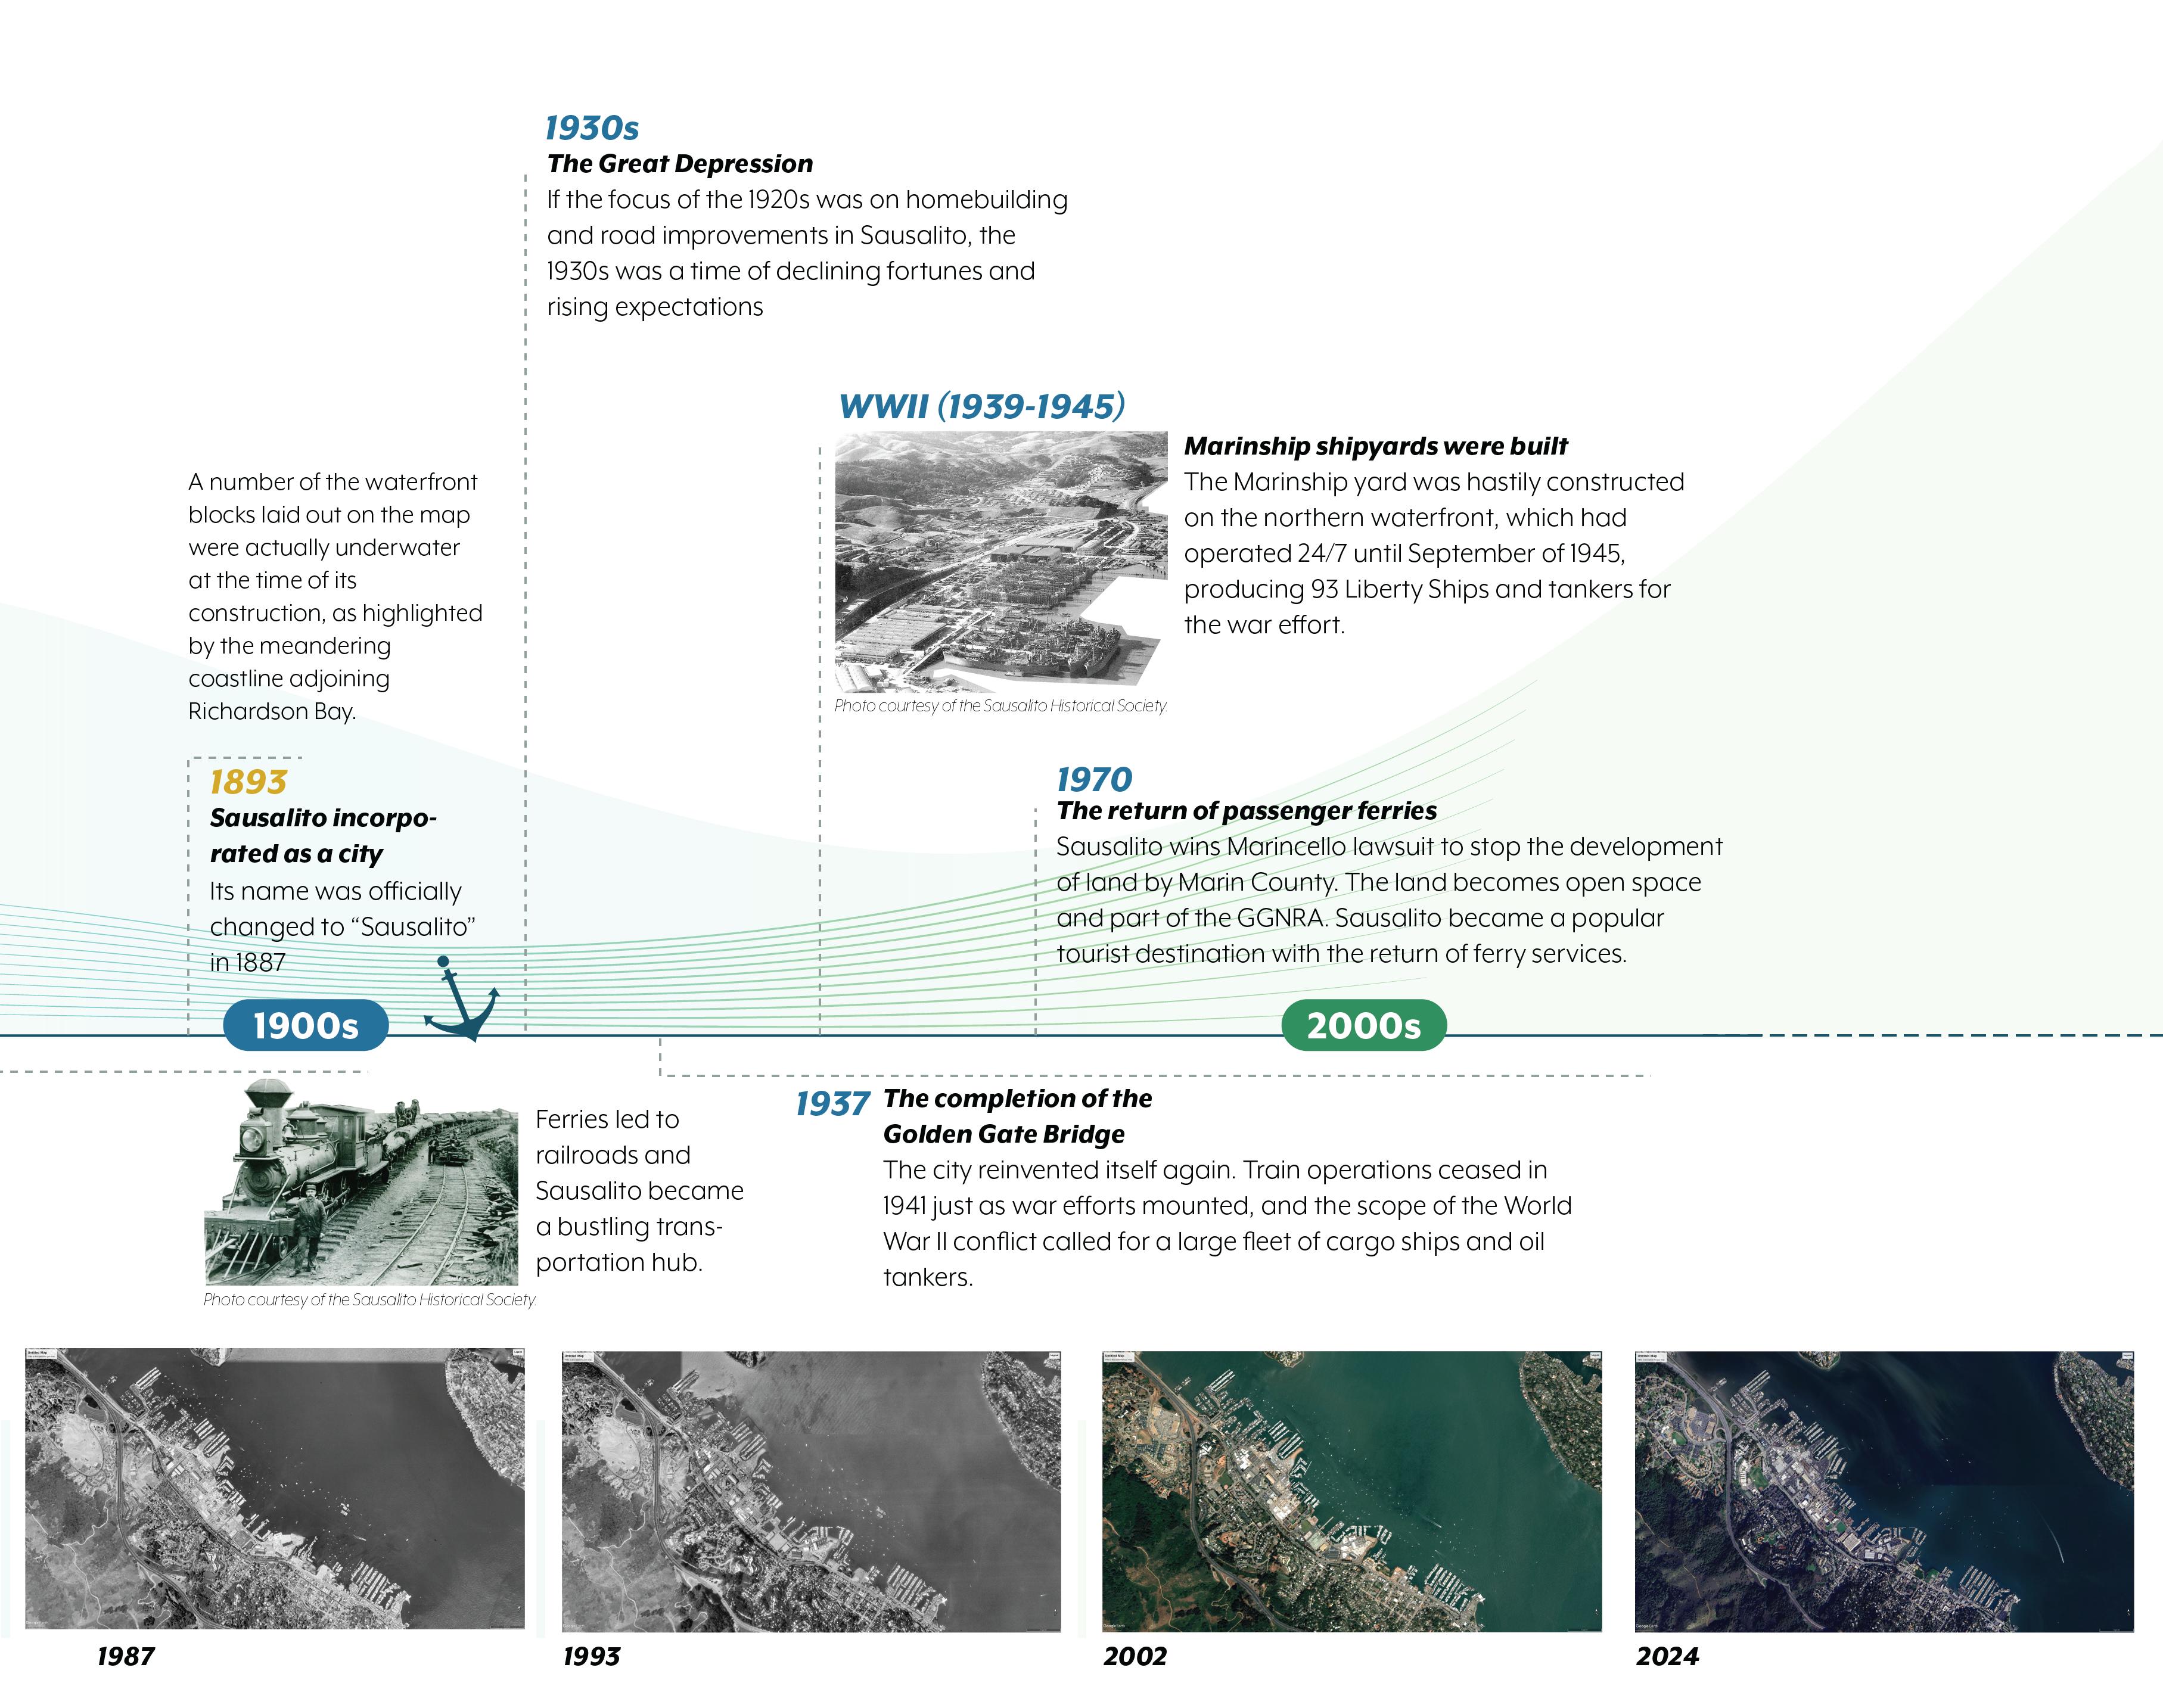
Sausalito is one of the oldest communities in Marin with a long and layered history. As the timeline on the right illustrates, the city’s identity has always been closely tied to its waterfront — where wars, industry, tourism, and trade have reshaped both the water edge and the urban fabric over time.
Often looking back in time can inform the path forward. This is true as we embrace how history has shaped the land and waterfront character. From its roots as a maritime hub and wartime shipyard to its rise as a creative enclave and travel destination, Sausalito’s shoreline is ever-changing, together with the rising tides. This evolution has created a patchwork of distinct shoreline zones, each with its own character. As the shoreline has changed, so too has the way Sausalito defines and protects what it values. In fact, much of the city’s presentday waterfront sits on filled land, shaped by decades of reclamation, reinvention, and inhabitance. The city’s coastal edge is now at a tipping point of climate changetransformation is necessary.
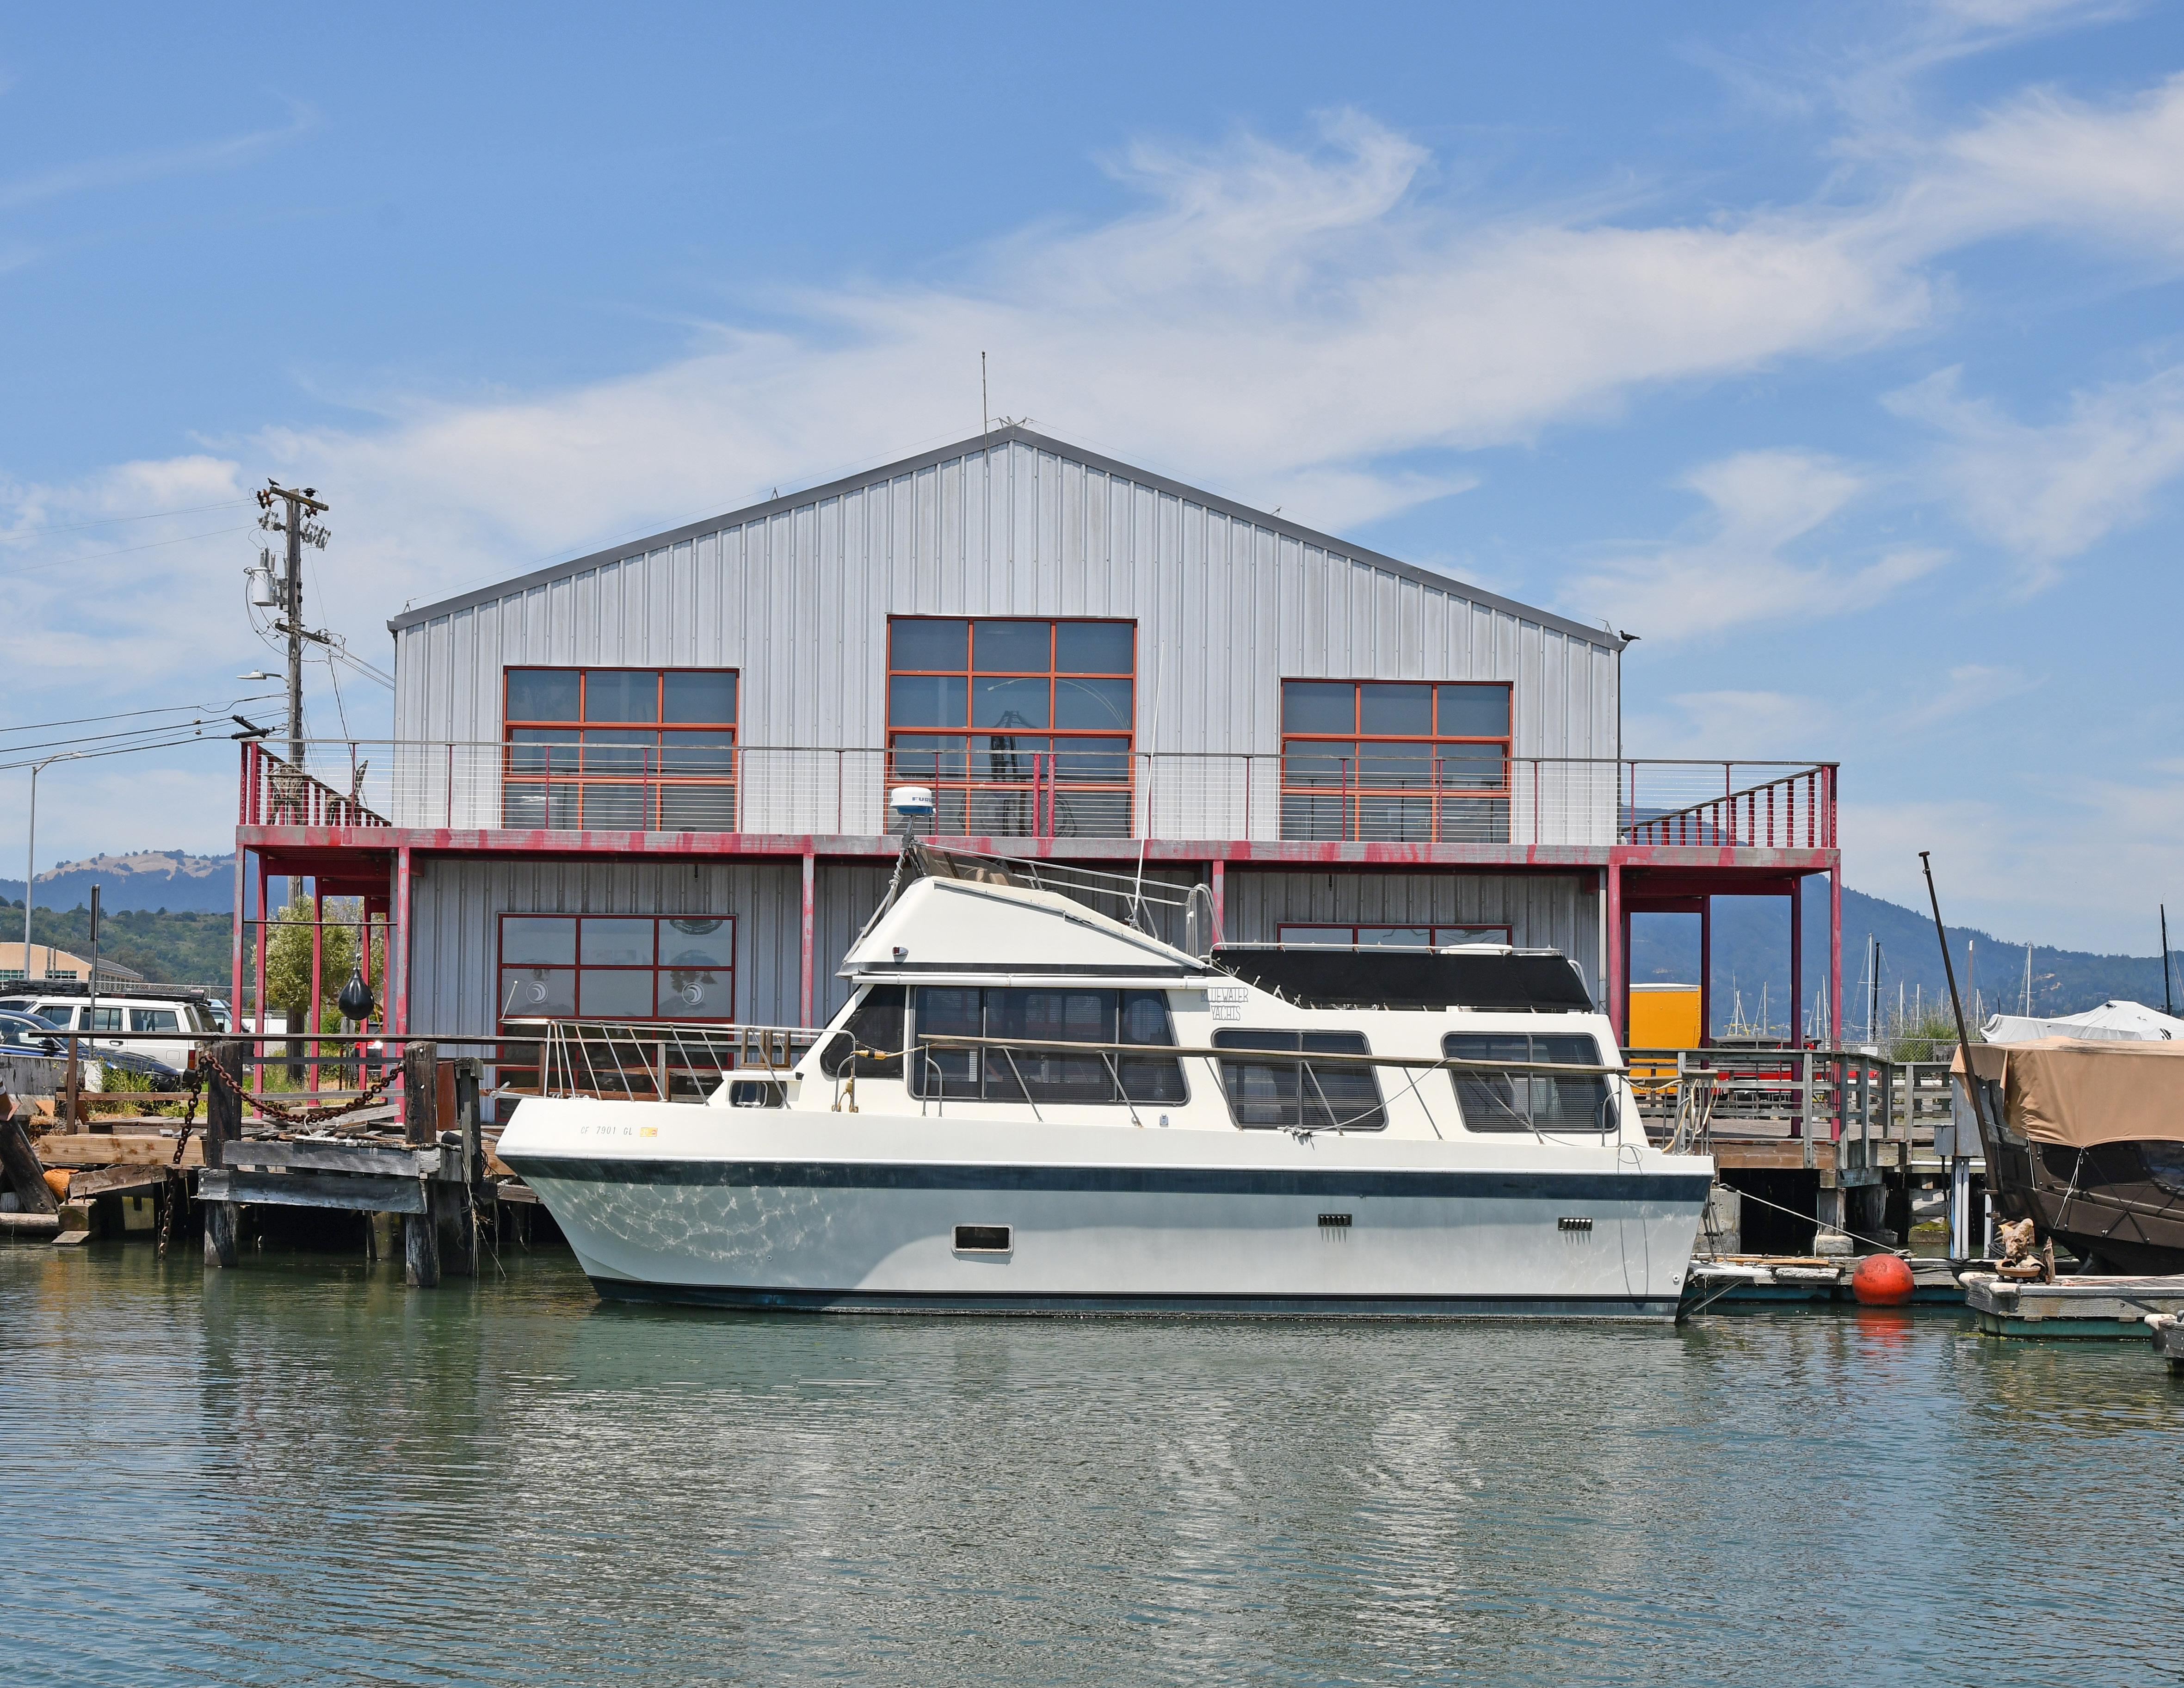
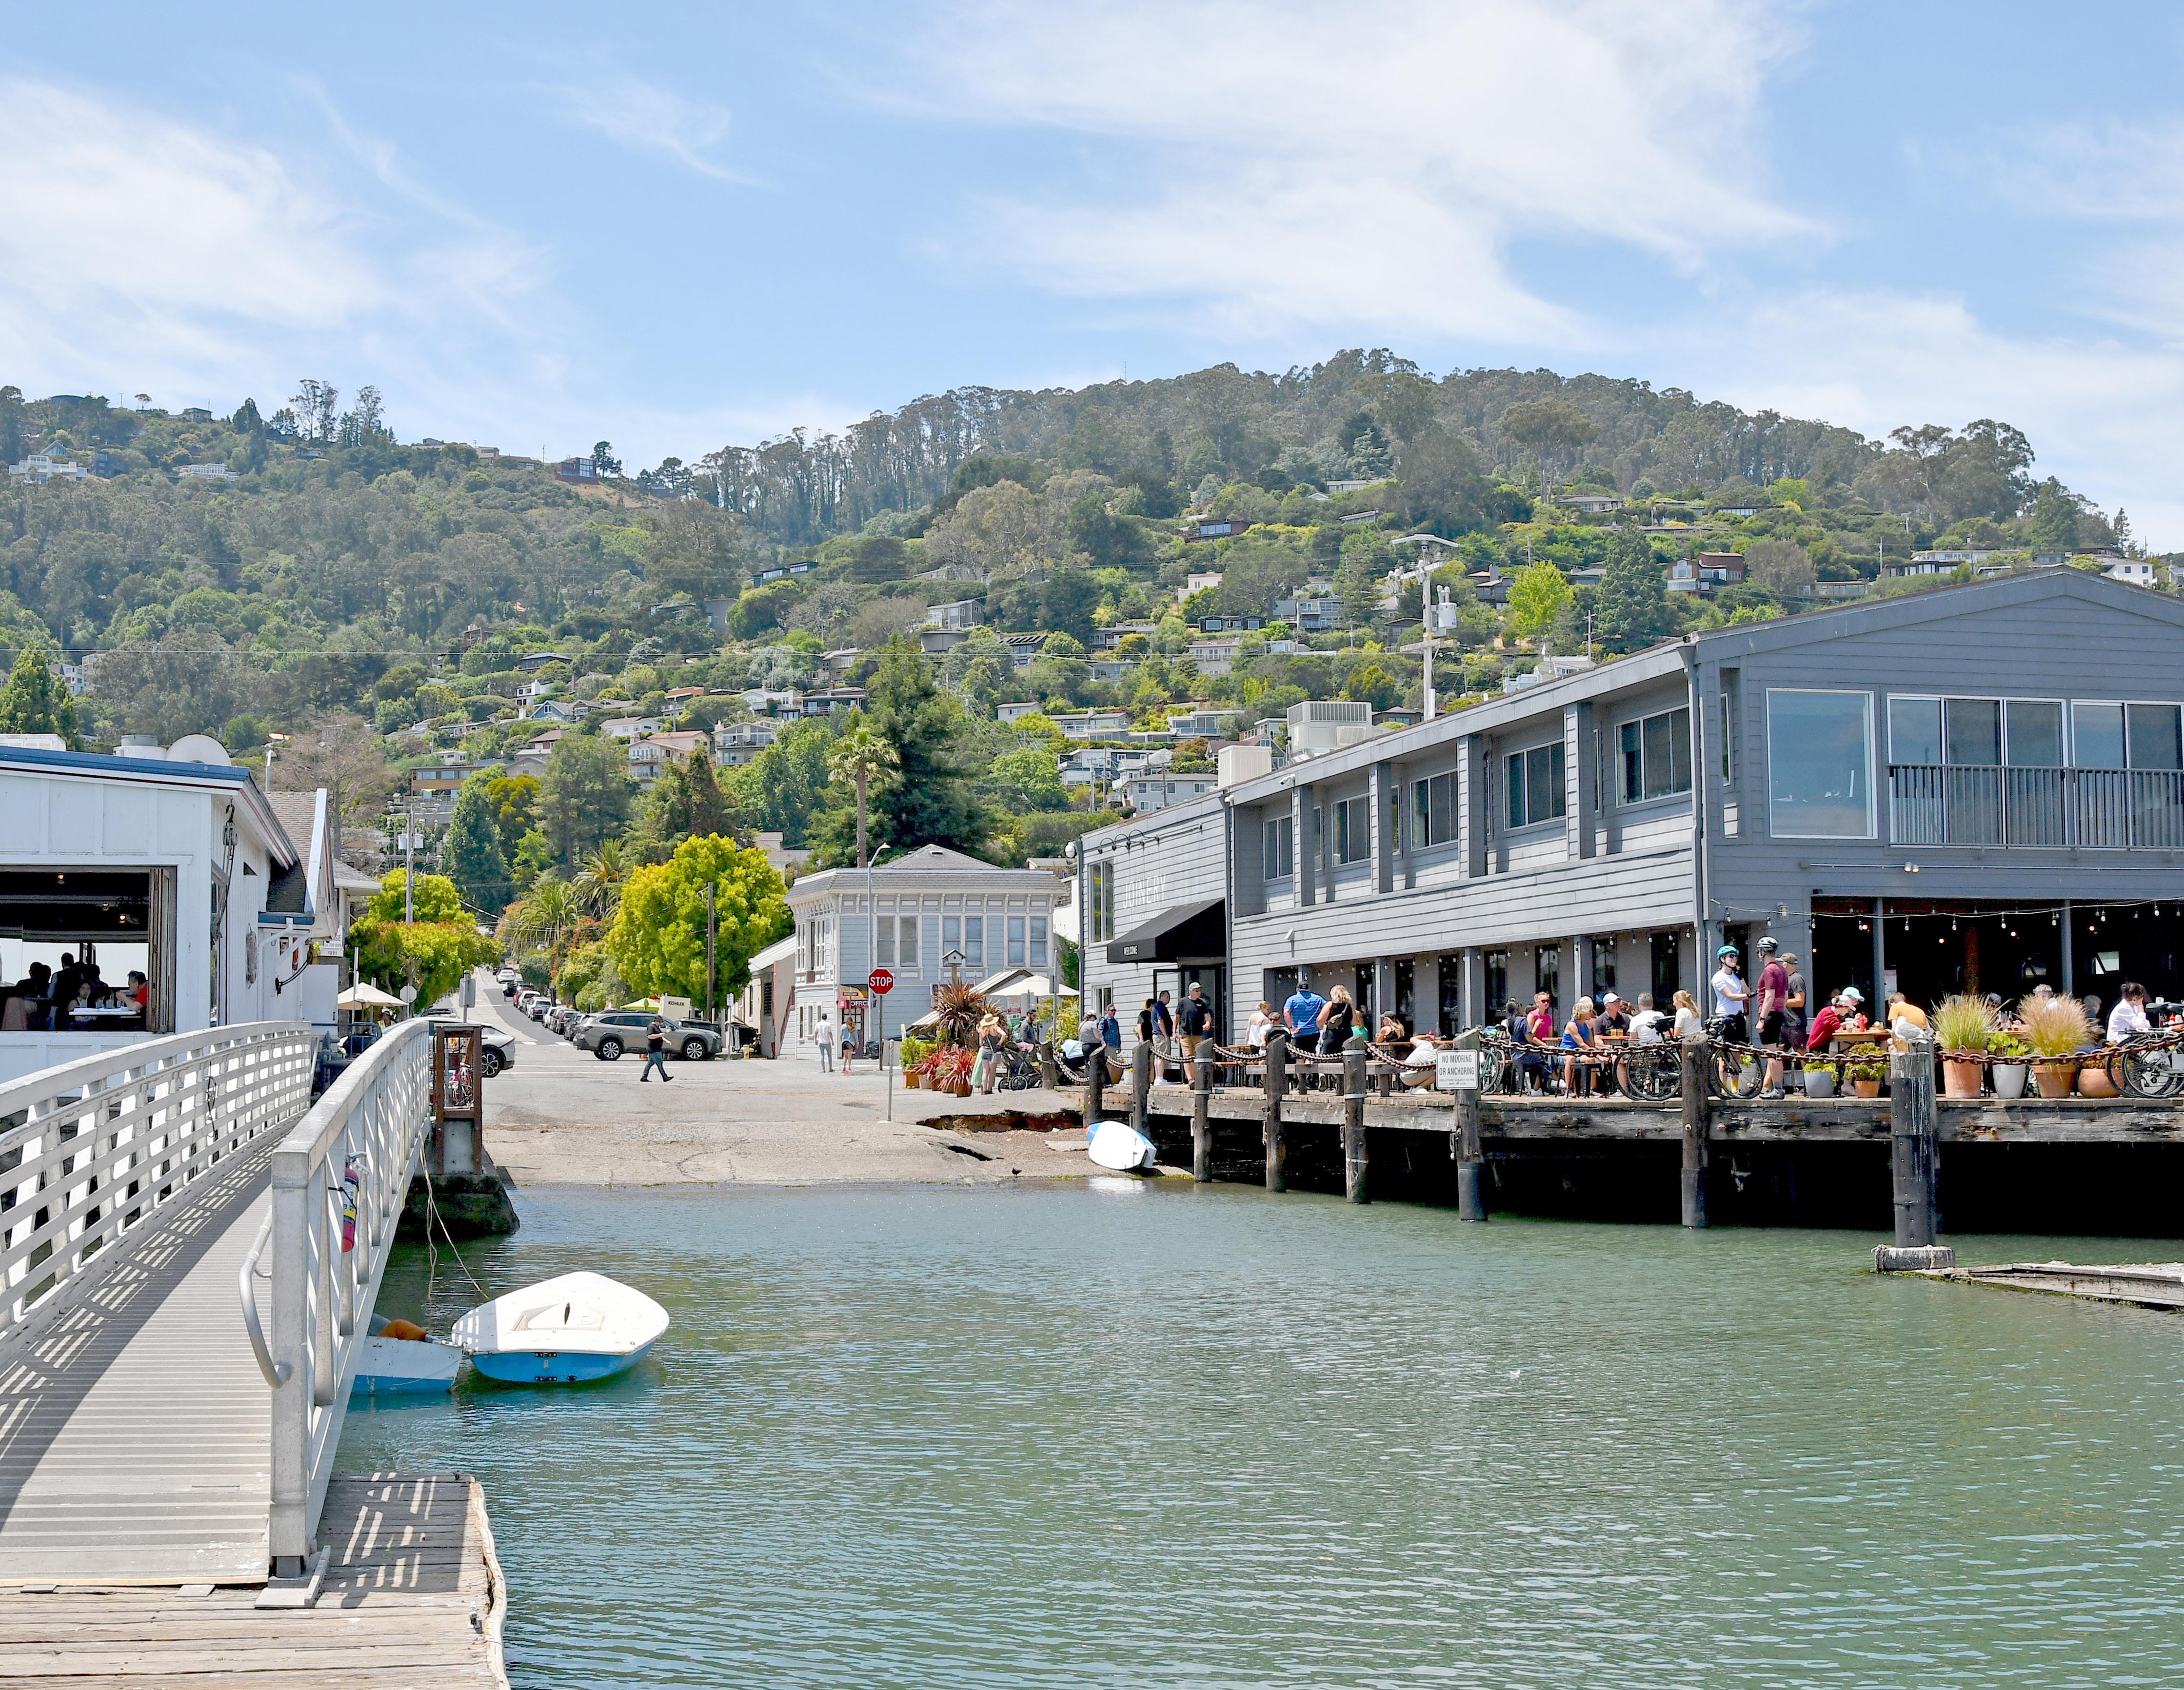
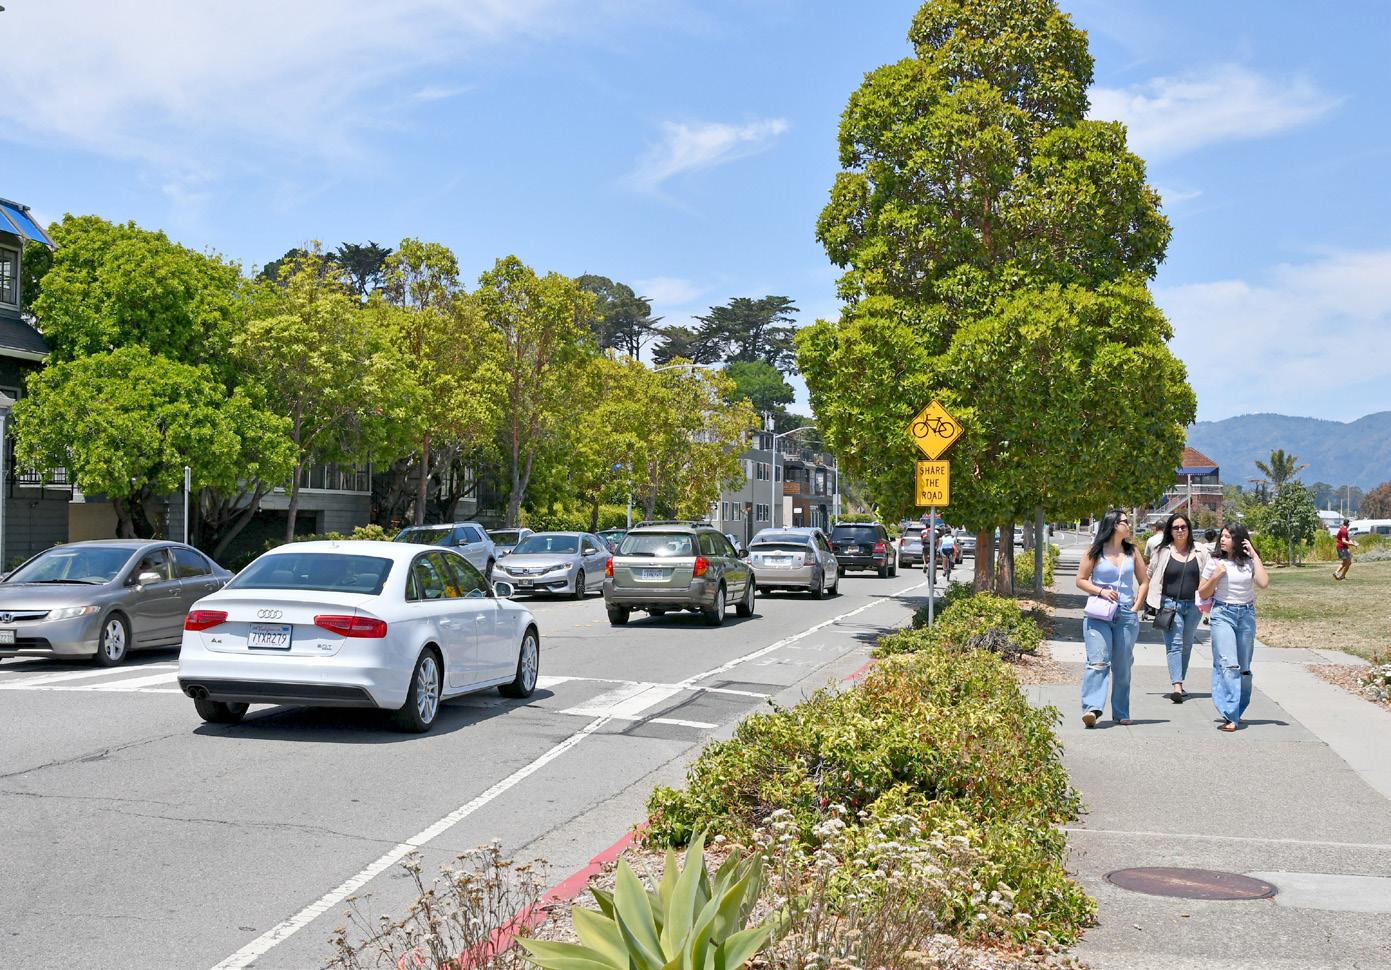
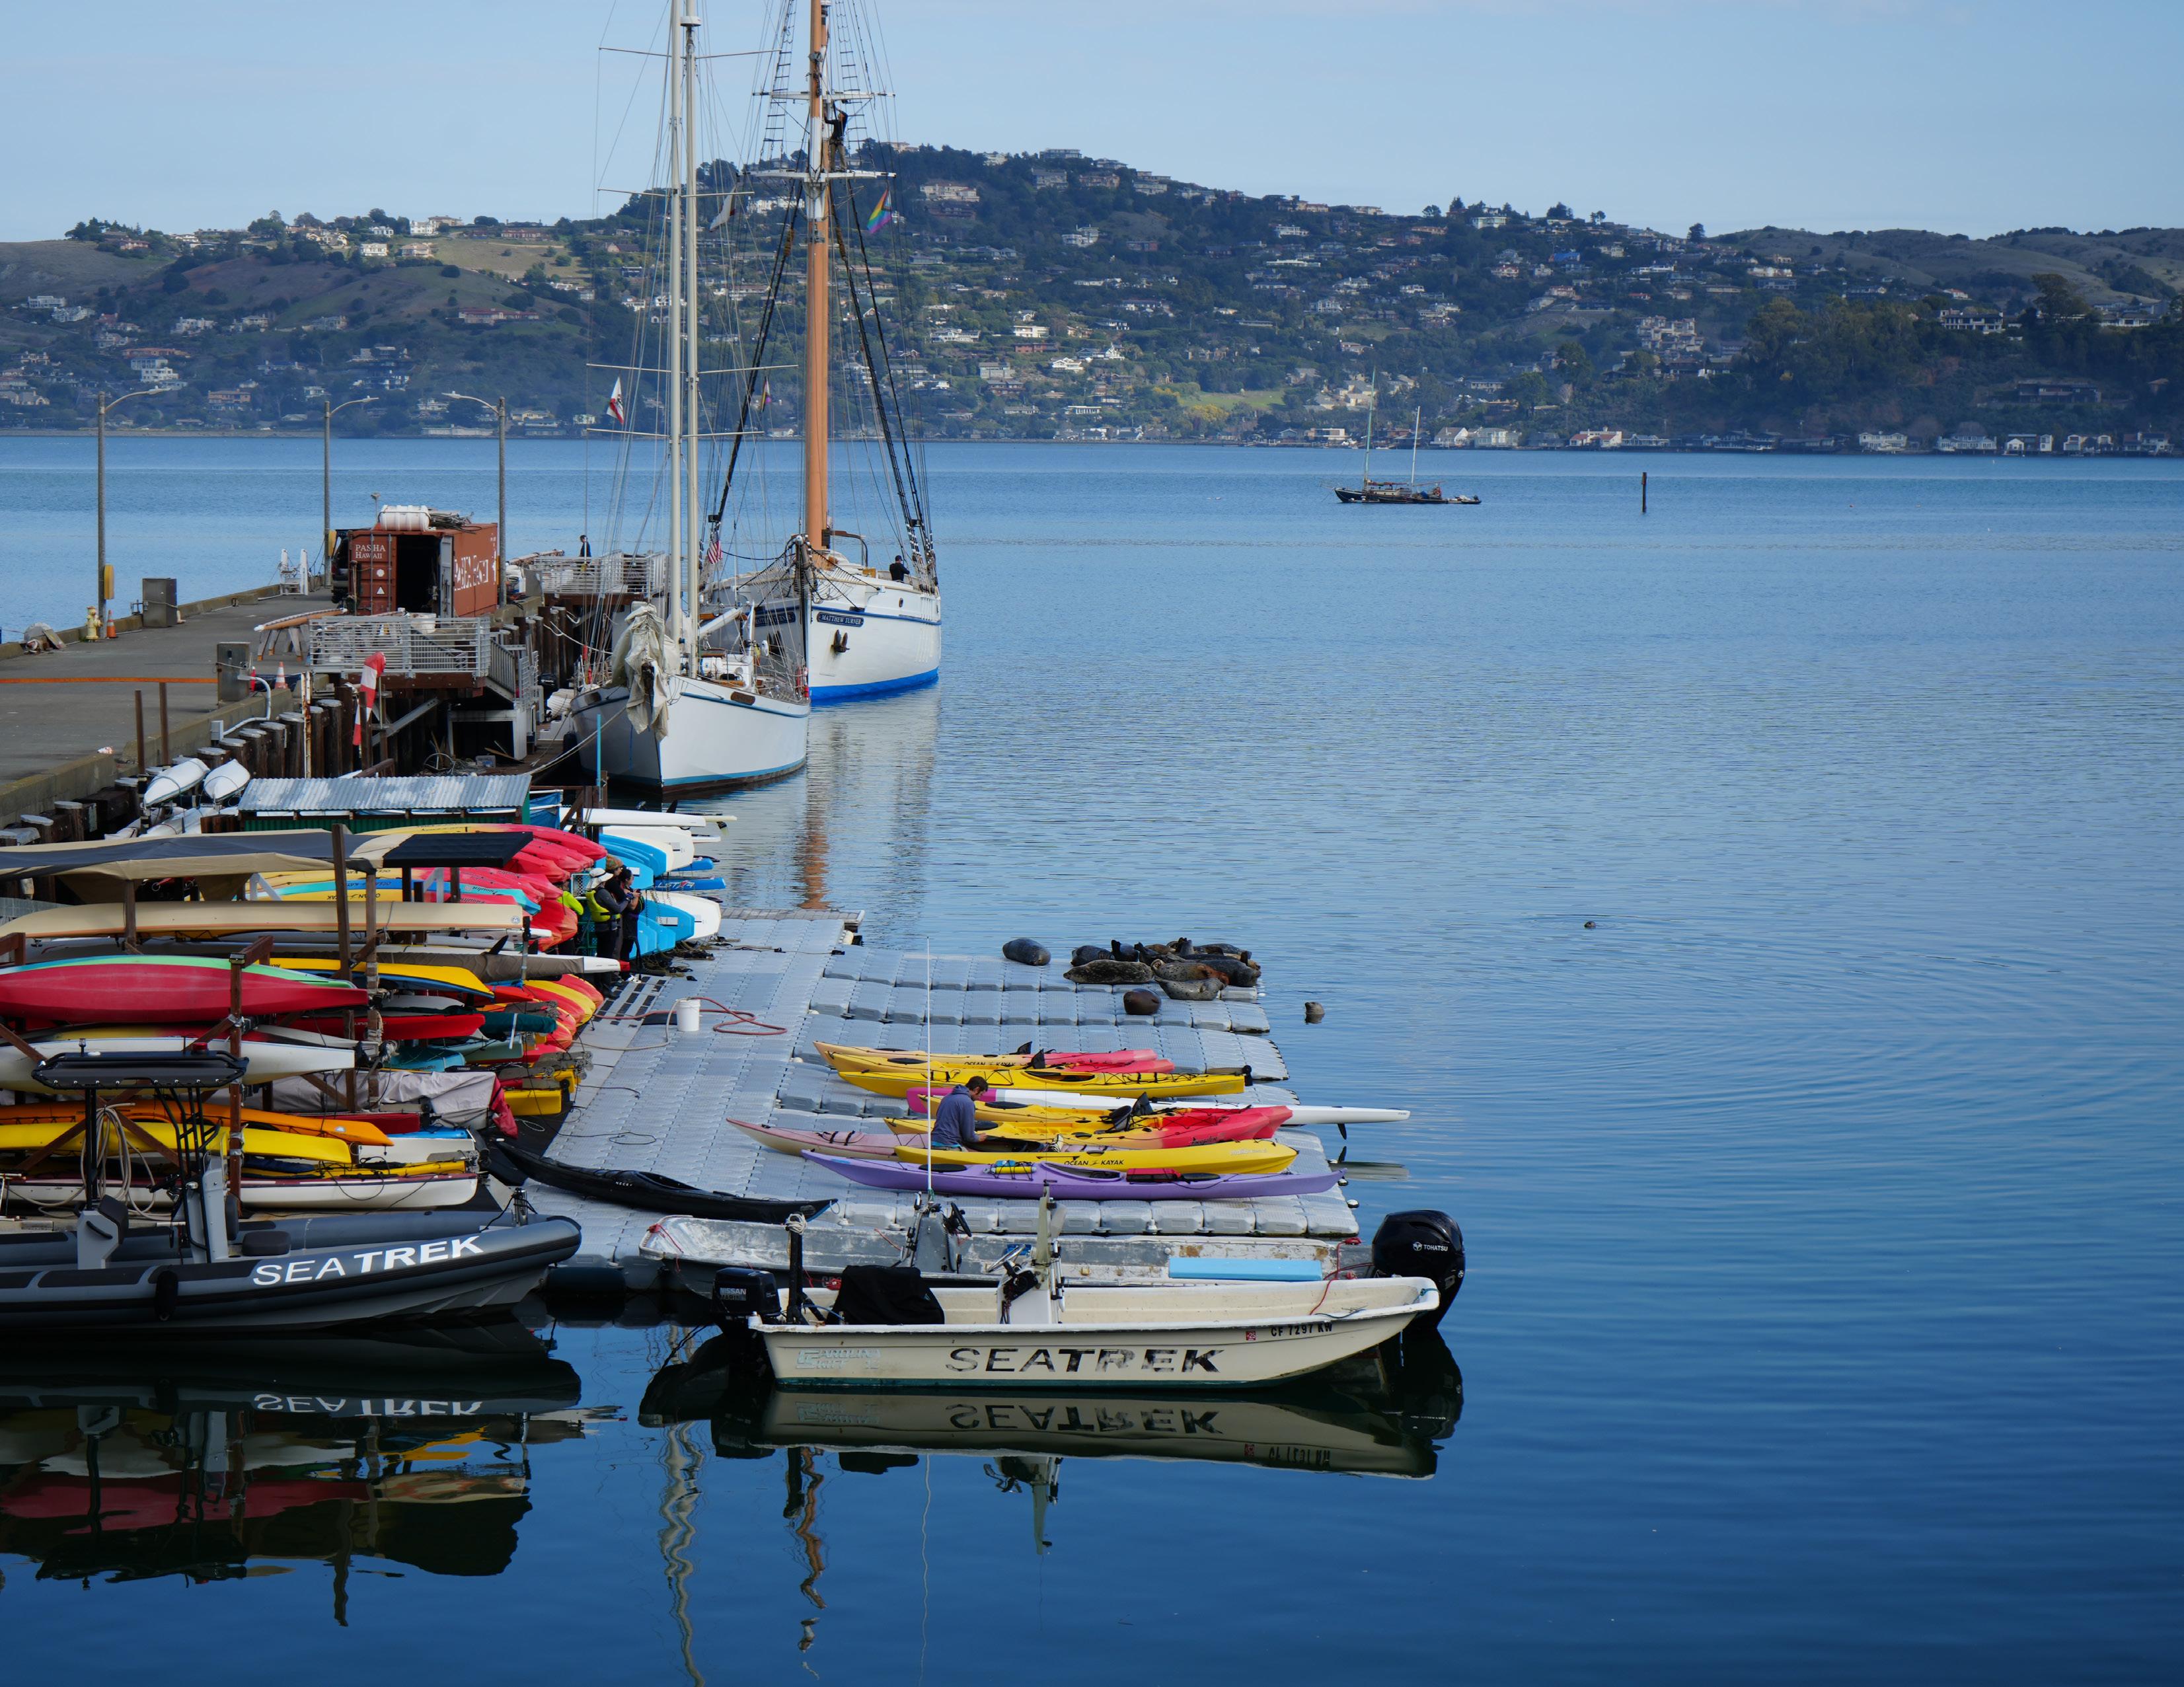
Sausalito’s waterfront is deeply tied to its present-day identity—anchored by an authentic maritime character, a long-standing working waterfront culture, its natural beauty, public access, and creativity.
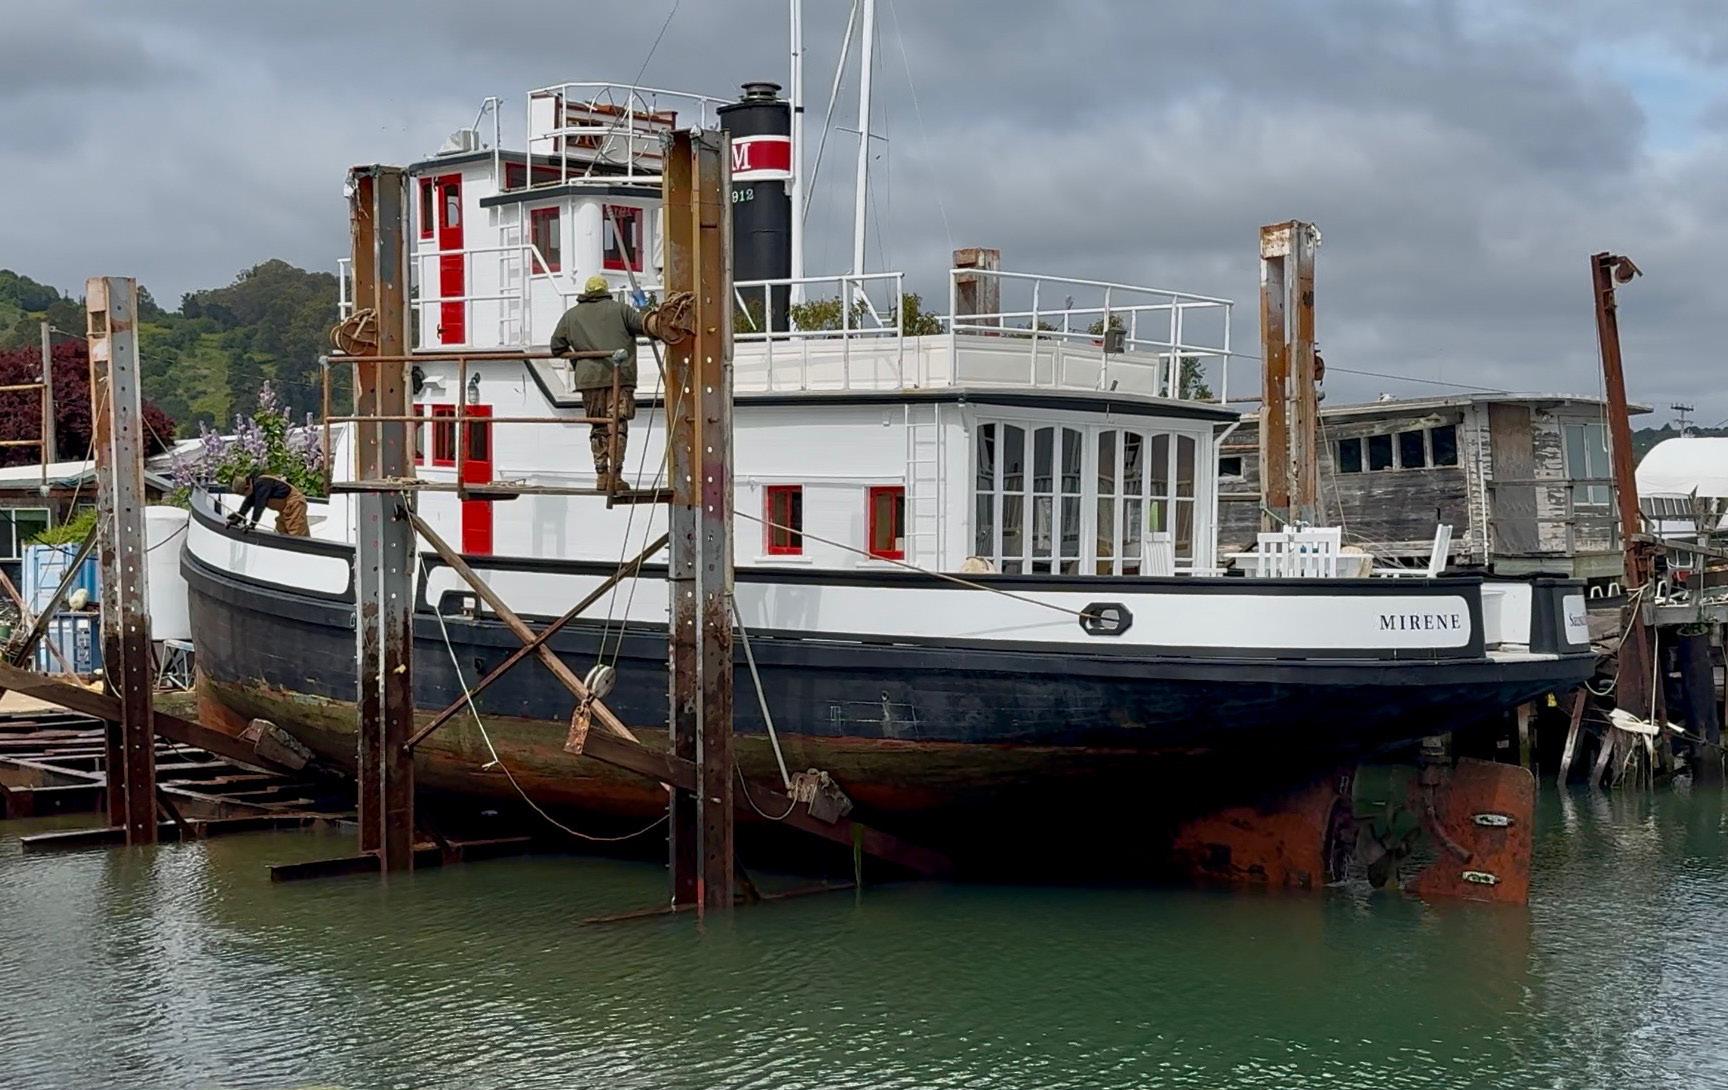
Along and beyond the shoreline, each character zone reflects a distinct community identity and culture. In Marinship, the legacy of wartime industry lives on through active boatyards, artist studios, and marine trades. Along the Bridgeway corridor, the shoreline has transformed into a civic and scenic spine. In New Town, postwar development
“We are unique in that we have the floating homes... We should look carefully at implications to expanding floating homes. What is the impact to floating homes and maritime businesses.”
- Focus Group Participants
brought parks, small businesses, and community gathering spaces. And in the Floating Homes neighborhoods, the Bay itself becomes the foundation for alternative, water-based living. Together, they offer a vibrant, living mosaic of coastal life.
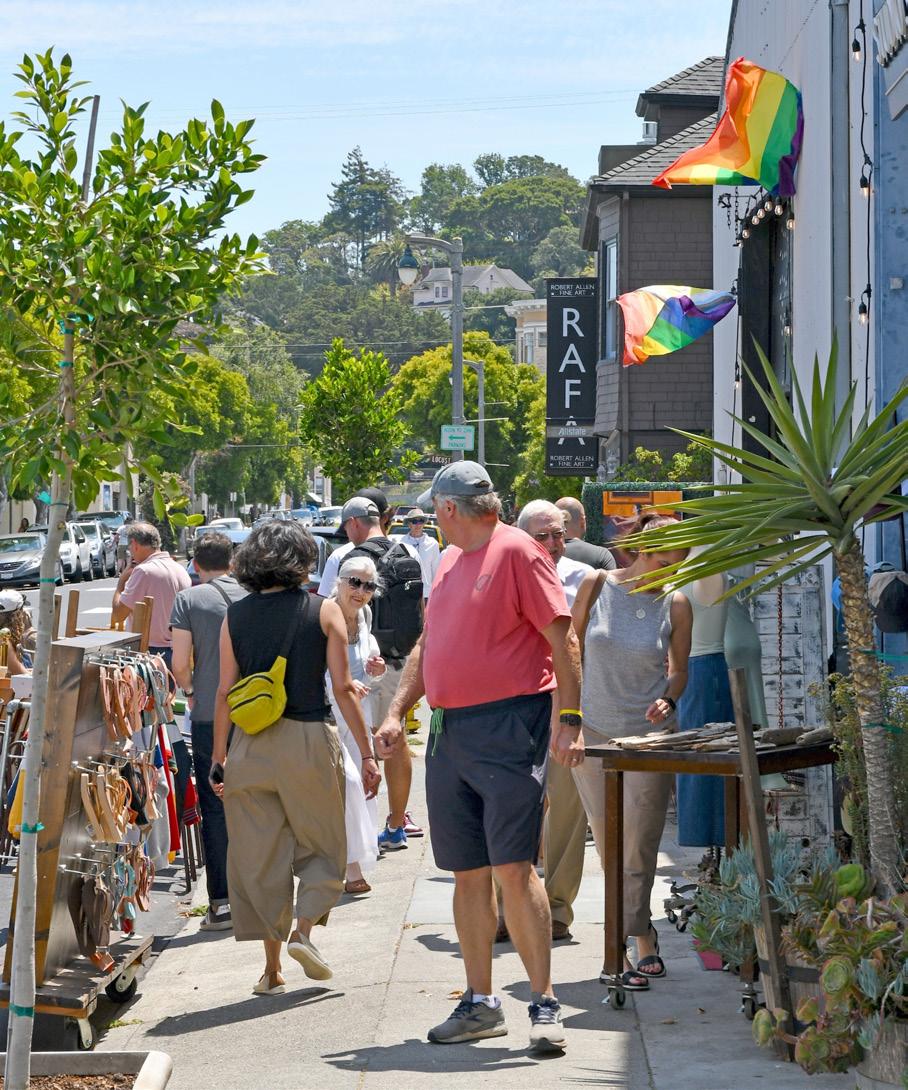
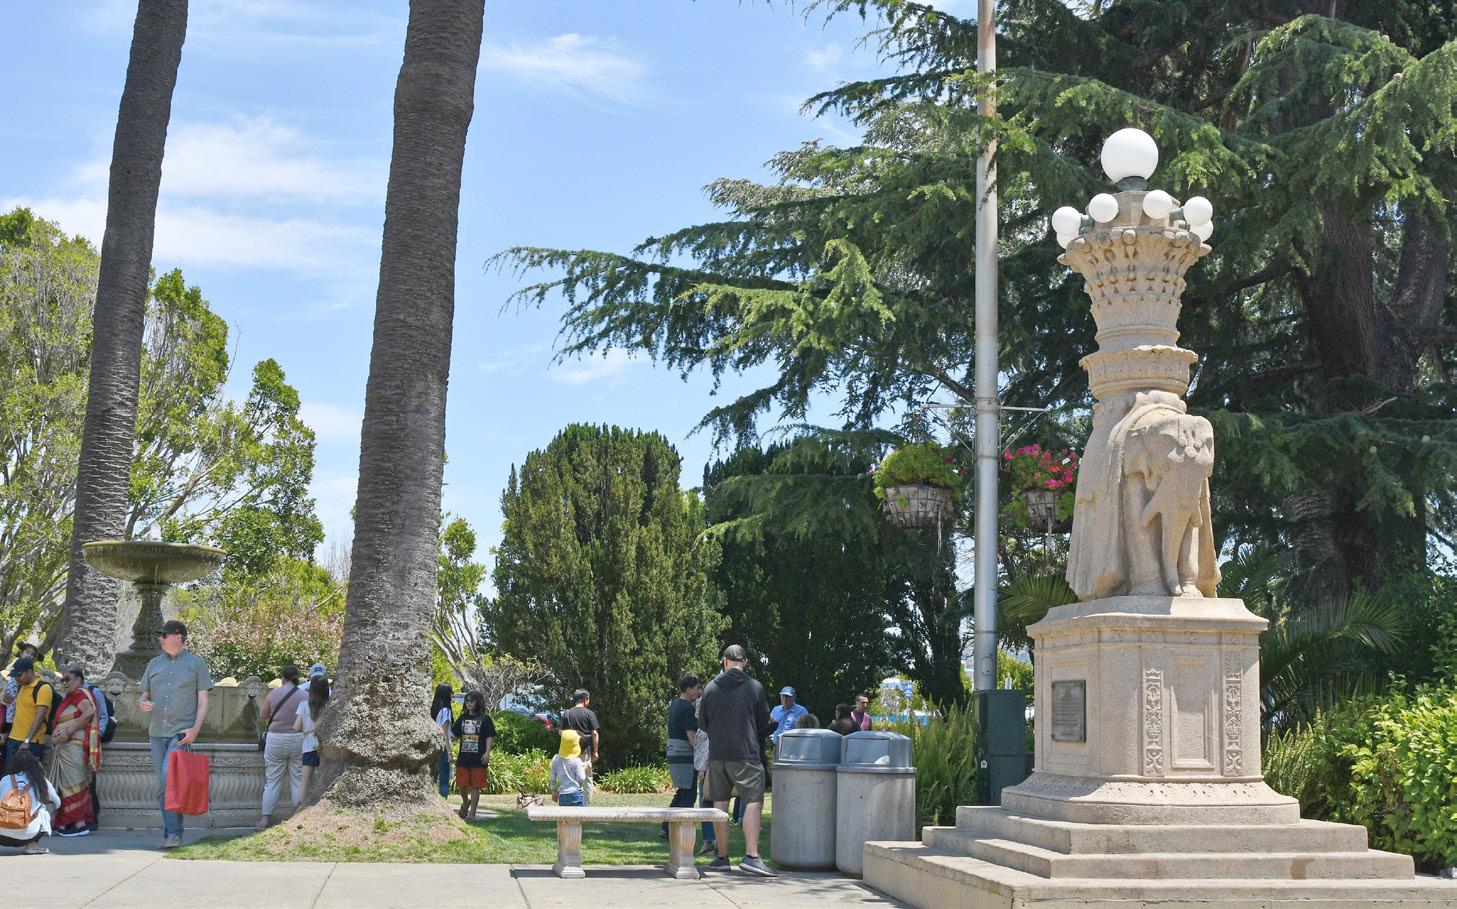
The arts are integral to community character. From public sculpture and mosaics to arts and music festivals in waterfront parks, Sausalito promotes a rich cultural expression in its public realm. Waterfront lands also host galleries and artist studios – each place where people, art, land, and sea all come together and contribute to Sausalito’s unique character.
“Economic viability is one of the objectives.”
- Focus Group Participants
- Focus Group Participants
“Working waterfront is an important part of our history and doesn’t want to see that go.”
- Focus Group Participants
“Subsidence is a big problem...”
- Focus Group Participant
“Really want to see more clever technologies and ideas. Wants to make a plug for relying on technology to support the circumstances we have that we can model into the future. ”
- Focus Group Participant
Resilience is not one-size-fits-all solution. Local and global examples allow us to envision and compare what’s possible across different timeframes and scales, under different leading forces (collective vs individual approach), and based on different community priorities.
Each category illustrates 2-4 case studies on how adaptation can be achieved in ways that are both technically sound and culturally innovative. It is important to keep in mind that these strategies, while generally categorized under separate buckets of adaptation, are not mutually exclusive. For example. An ecotone-levee could serve both as type C and D strategies, depending on whether to construct it along the shoreline for protection against wave action, or further inland combined with government buyouts and easement to reduce total impacted assets.
ALiving with Water introduces amphibious and water-adaptive infrastructure, rising and falling with the tides
Raising Infrastructure involves elevating buildings, roads, and critical infrastructure above projected water levels
Hardening and Raising the Edge involves levees, seawalls, and elevated berms to build stronger shorelines
DReducing Impact involves measures like managed retreat, open space buffers, or ecosystem restoration that provides buffer space from rising water
These strategies encompass a wide spectrum from traditional engineered edge to nature-based solutions. The following examples under each of the four strategies are refined and presented to the public during workshop 2.
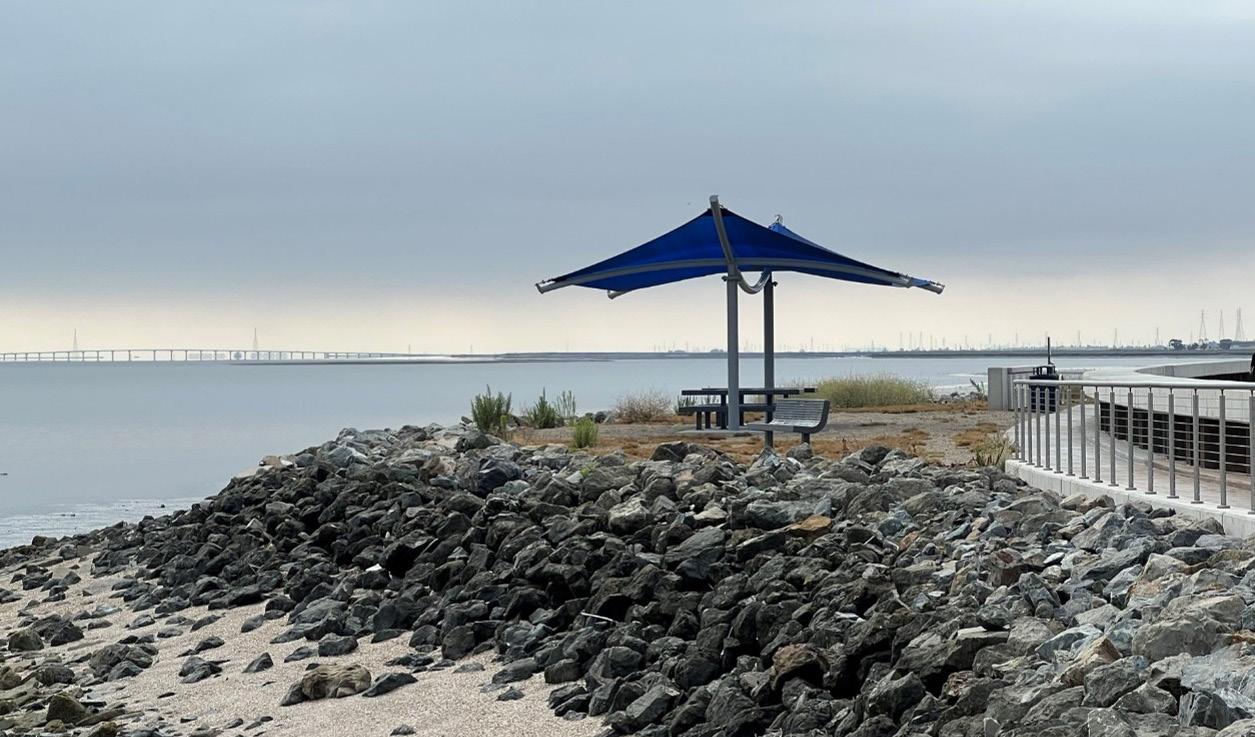
ALiving with Water introduces amphibious and water-adaptive infrastructure, rising and falling with the tides
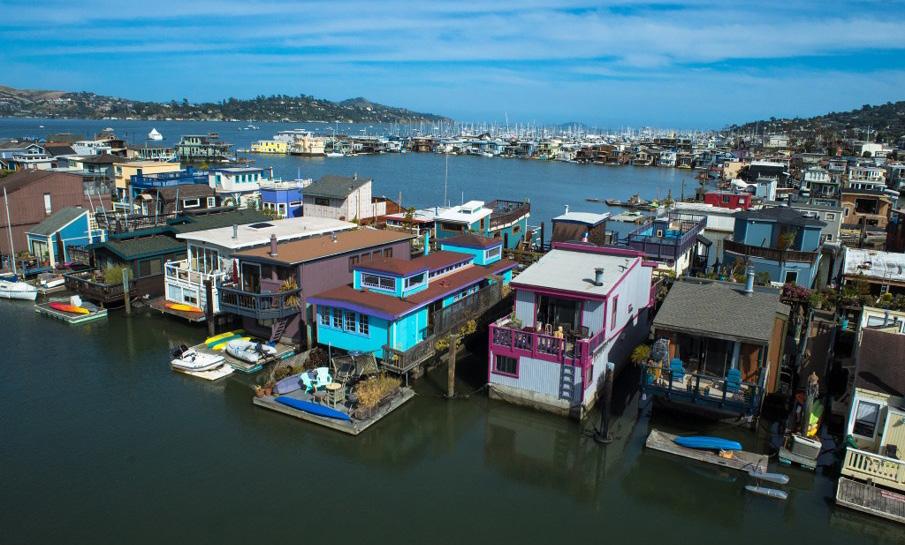
Permanent residences built on a buoyant foundation that floats on water, which are connected to shore-based utilities through underwater cables and pipes.
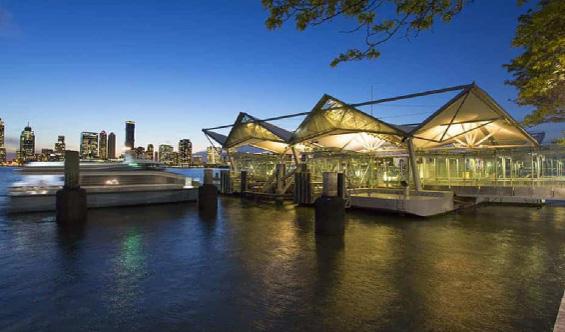
A permanent floating terminal with monohull structure and bedrock anchoring to provide a minimum 25year water transit services.
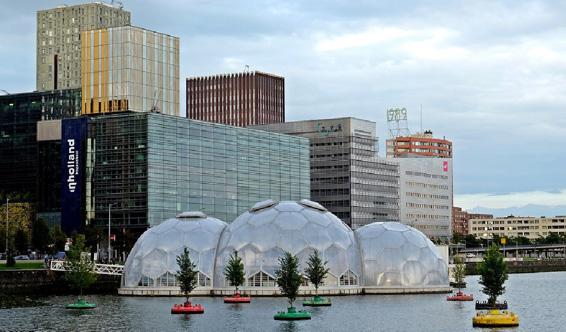
A large facility built on water with light weight materials consisting of exhibition spaces and an auditorium.
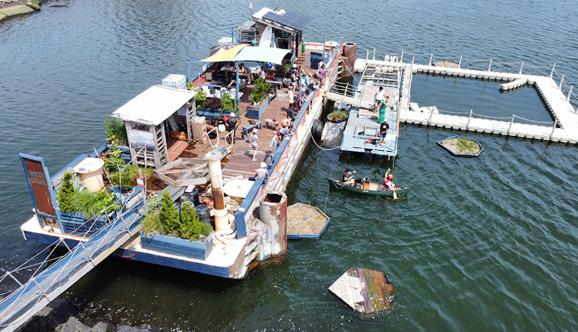
An educational floating facility that provides workforce training and demonstration of floating garden made of salvaged and reclaimed materials.
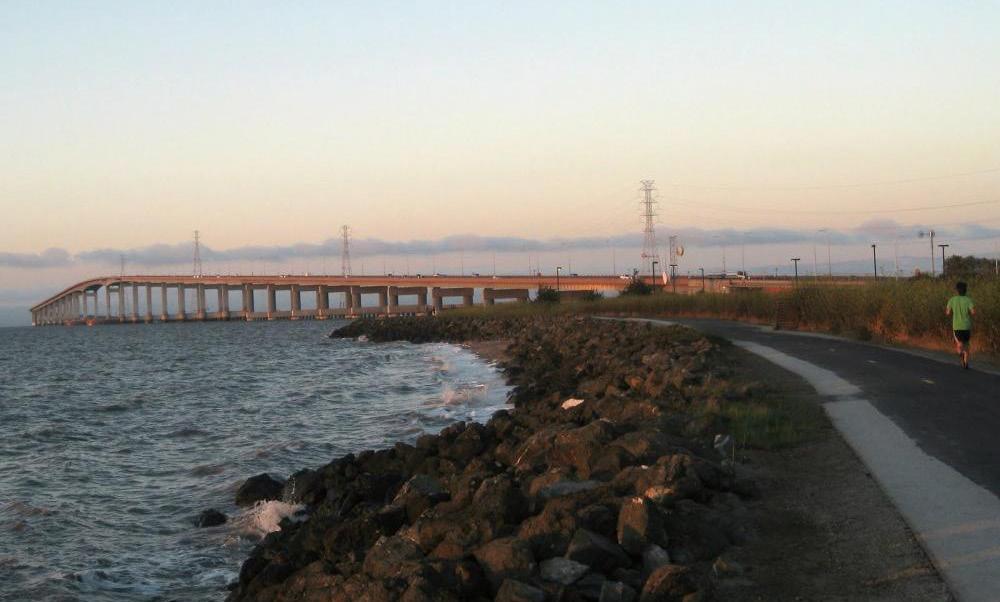
BRaising Infrastructure involves elevating buildings, roads, and critical infrastructure above projected water levels
Dry proofing done to the building facade to withstand frequent flooding due to rising sea level and groundwater.
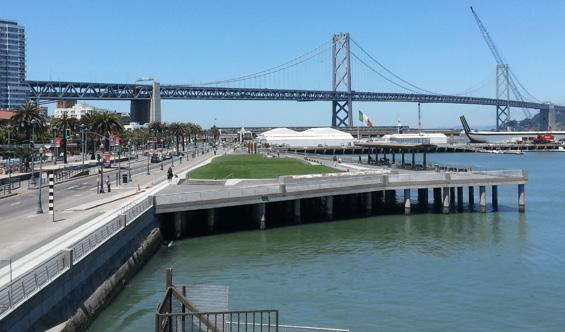
A new 57,000 SF public wharf consisting of a raised lawn and a 2,000 squarefoot craft float.
Raising bottom foundations of homes above the base flood elevation.
Increasing the height and width of the existing levee to improve protection against storm/ tide surges, meet sea level rise projections through the year 2050.
CHardening and Raising the Edge involves levees, seawalls, and elevated berms to build stronger shorelines
DReduce impact
Reducing Impact involves measures like managed retreat, open space buffers, or ecosystem restoration that provides buffer space from rising water .
DETENTION POND IN COMMERCIAL PROPERTIES, CHICAGO, IL
Reduce impact Reduce impact
A berm system that surrounds the outer perimeter of the city to provide protection against storm/ tide surges and sea level rise.
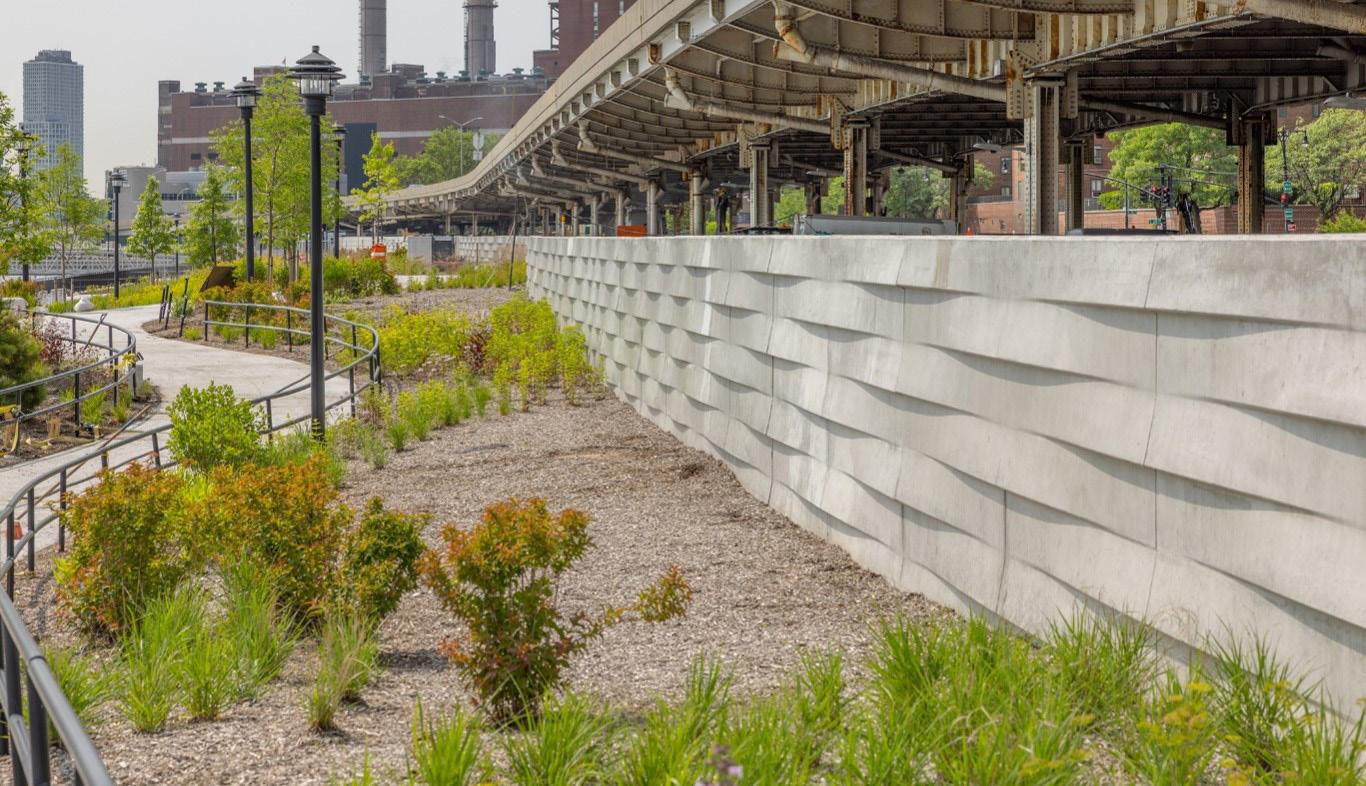
A combination of floodwalls and floodgates integrated in the larger ESCR resiliency project in NYC to adapt to future catastrophic storm events.
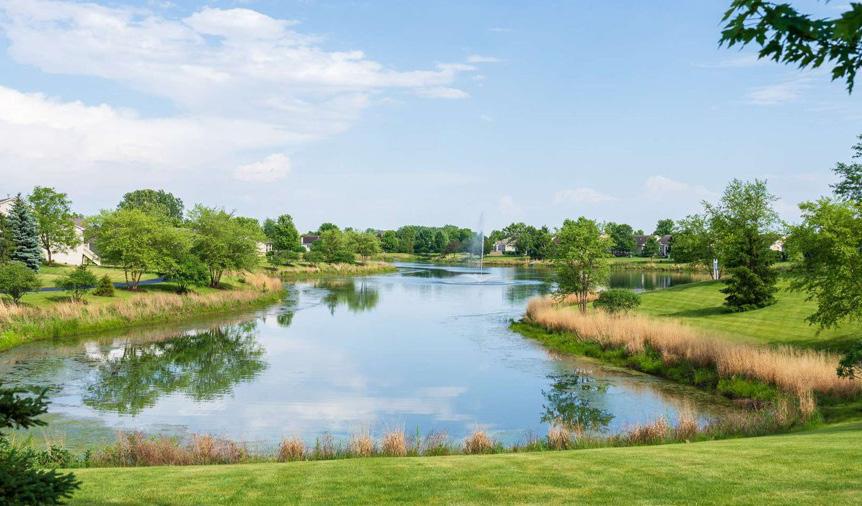
A detention pond that temporarily stores stormwater runoff and releasing it slowly over time.
BREAKWATERS,
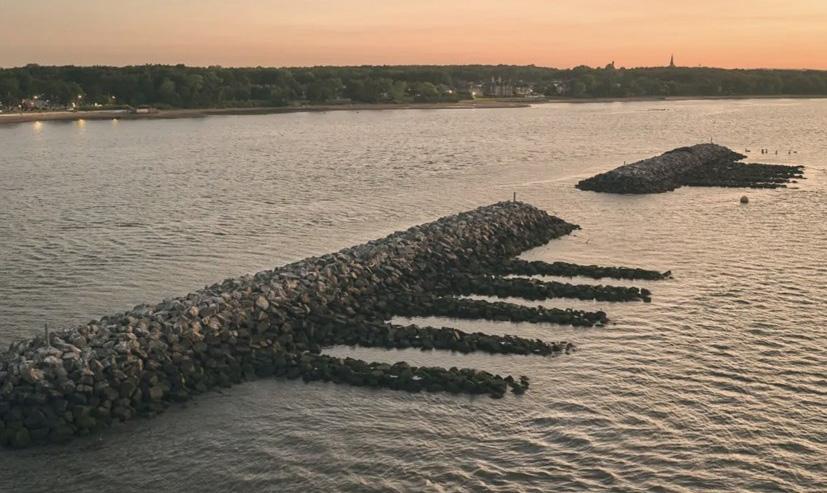
2,400 linear feet of breakwaters built on Staten Island, New York, to decrease the impact of storm waves and erosion.
This chapter evaluates the potential impacts of sea level rise on critical community assets under three scenarios: 2050 with 0.8 feet of sea level rise, 2050 with 0.8 feet of sea level rise combined with a 100-year storm surge, and 2100 with 6.6 feet of sea level rise.
Key findings indicate that low-lying areas face increasing exposure to flooding and storm surge, with essential services such as transportation and utilities becoming more vulnerable under the higher-end scenarios. Habitat areas and community facilities are particularly sensitive, underscoring the need to balance natural resource preservation with infrastructure resilience.
Bridgeway, the spine of Sausalito’s infrastructure and mobility network, is shown to face significant vulnerability, with lowlying sections at risk of permanent flooding under higher sea level rise scenarios if interventions are not implemented. These findings form the basis for prioritizing adaptation strategies to safeguard Sausalito’s critical assets against the impacts of climate change.
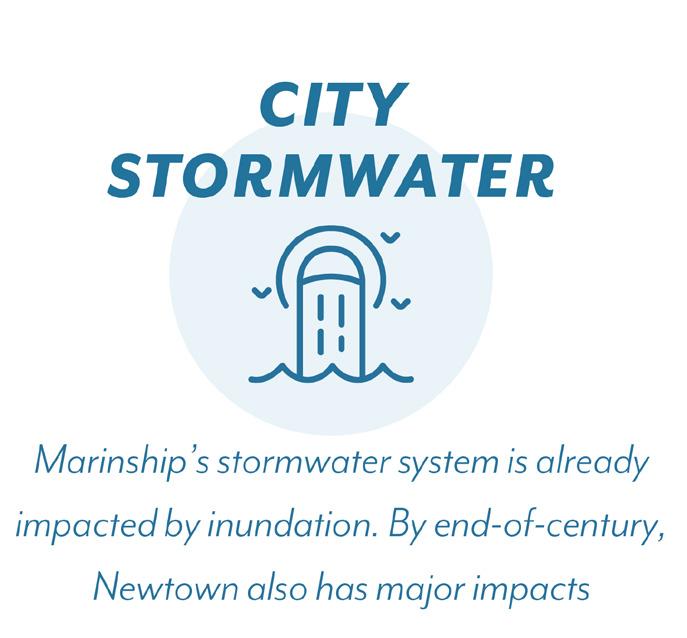
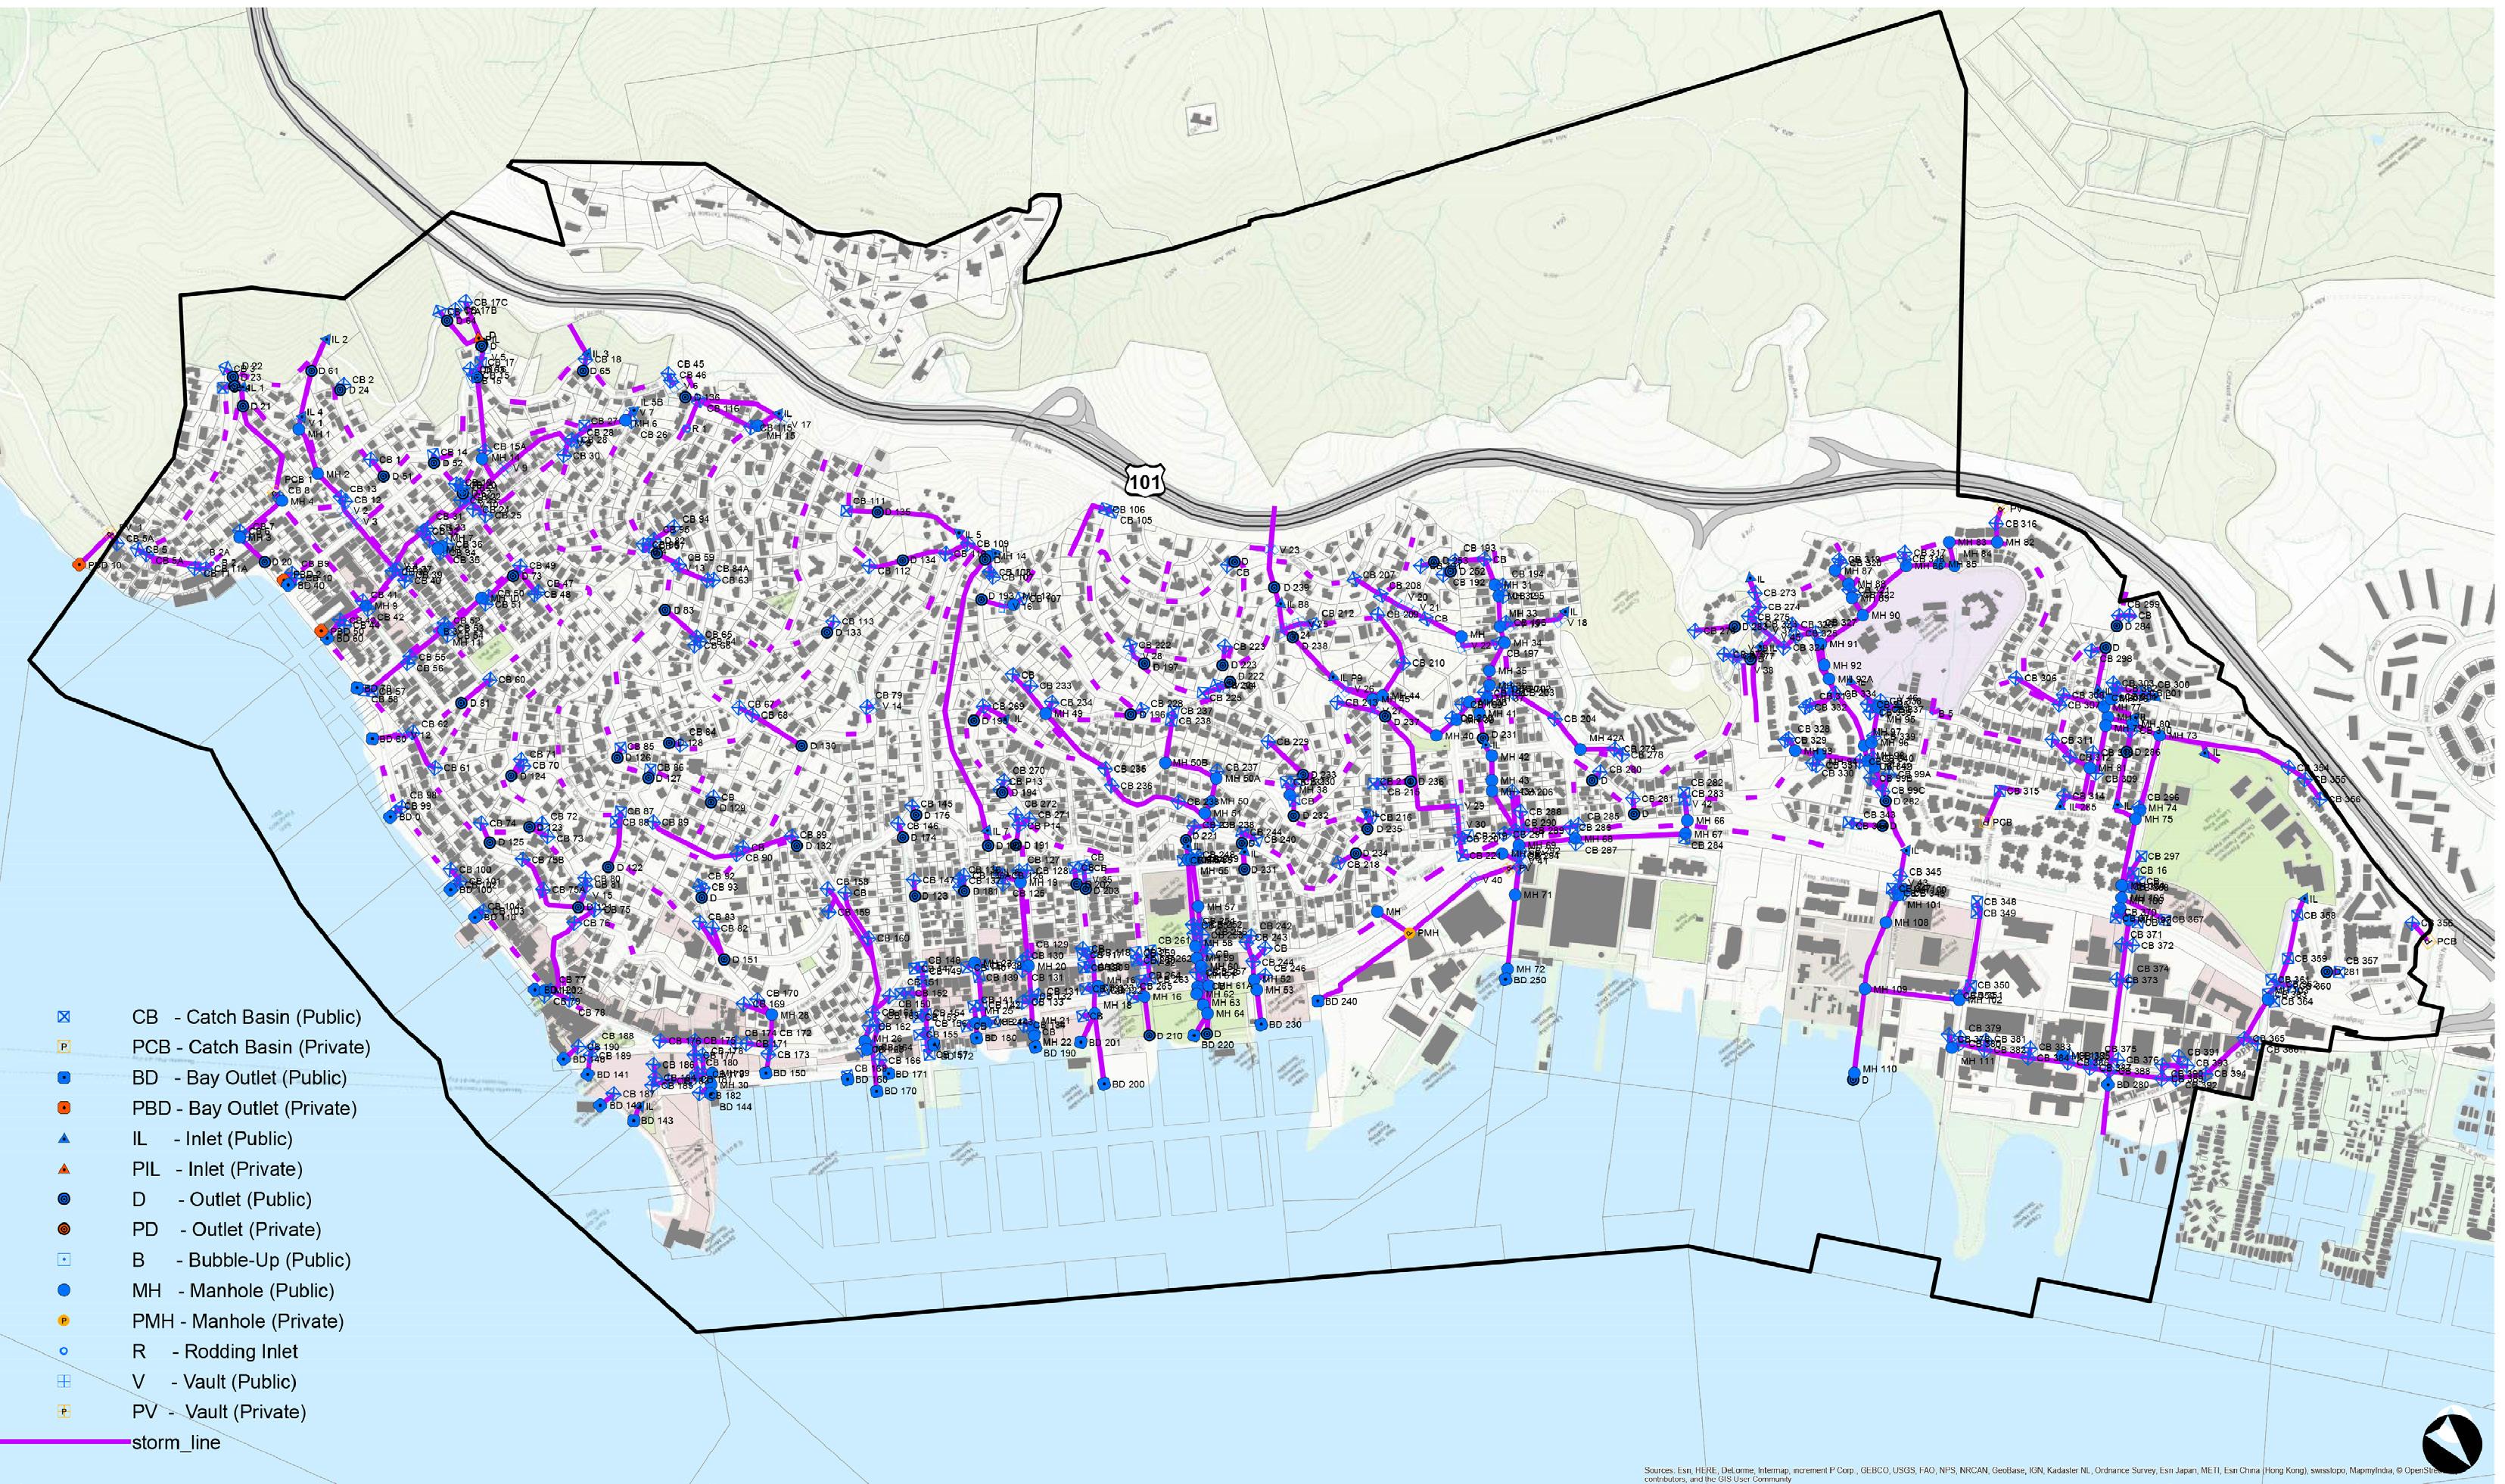
• Stormwater infrastructure manages surface runoff during storms to prevent flooding and reduce erosion. When water levels from SLR exceed the elevation of drains or their outfalls, water cannot exit the stormwater system, exacerbating localized flooding.
• By 2050, eight storm drains and 1700ft of stormwater pipe would be inundated under normal conditions with 0.8ft SLR, and during a major storm these numbers
increase to 50 storm drains and over 1.5mi of pipeline.
• Stormwater flooding upstream of impacted areas would be expected to increase, as conveyance to the bay has been disrupted.
• City sewer infrastructure collects and transports wastewater from buildings to the treatment plant, protecting public health and preventing environmental contamination.
• Pipes exposed to tidal inundation under future SLR scenarios may experience faster rates of deterioration. Approximately 1300ft of sewer pipe
would be below water by 2050 (0.8ft SLR), increasing to several miles by 2100 (2.0mi under 4.3ft SLR and 4.6mi under 6.6ft SLR).
• The transportation system in Sausalito is comprised of roads, transit routes, transit stops, and the ferry terminal. $100M to $300M worth of these transportation assets is exposed to SLR by 2050.
• Bridgeway, the central spine of Sausalito’s roadway network, has several low-lying sections making it highly vulnerable to SLR and storms. During a major mid-century storm, Bridgeway would be flooded along the Promenade, near Dunphy Park, and near Hwy 101. These same areas would be inaccessible on a daily basis by 2100 under 4.3ft or more SLR.
• Sausalito relies on evacuation routes (i.e. Bridgeway, Highway 101, Sausalito Blvd, Filbert Ave, Nevada St) to safely evacuate people during emergencies. SLR-related disruption to evacuation routes bears significant life safety risk. Over the next several decades, evacuation routes are anticipated to stay dry on a day-to-day basis, but during a major mid-century storm approximately 1500ft would be flooded, impeding access along Bridgeway along the
Promenade, New Town, and Floating Homes areas of Sausalito. Evacuation plans should anticipate these impacts to reduce risk to life safety.
• Much of Sausalito’s waterfront properties utilized fixed or floating piers to access boats, houseboats, or other structures.
• Fixed piers are unable to move up and down with the tide and are vulnerable to SLR. This study did not assess the elevation of fixed piers, but it has flagged the length of fixed piers located in areas permanently inundated by SLR. By mid-century, 4,700ft of fixed piers are exposed to SLR and by 2100, the length increases to 6400 to 8000
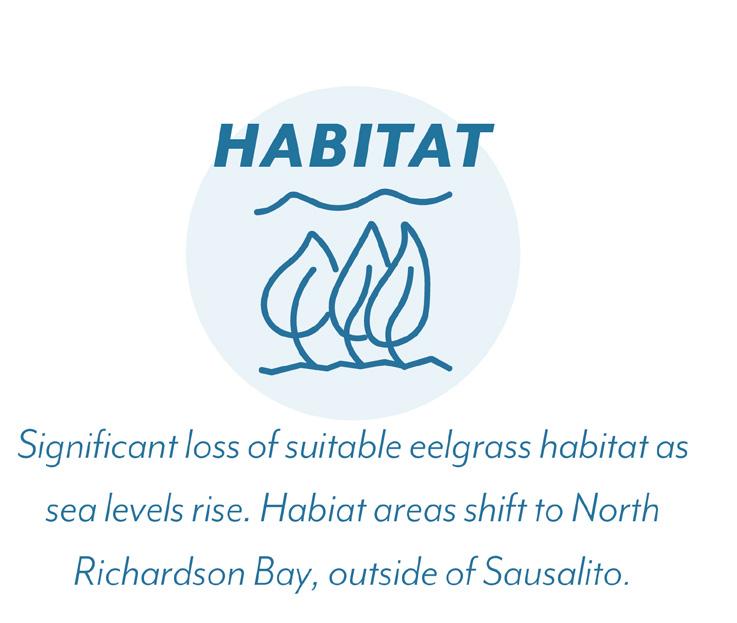
• The coastal wetlands, or baylands, provide critical ecological functions, including wildlife habitat, water quality improvement, and flood protection.
• Significant habitat loss is possible, especially if there is no room for habitat areas to migrate to higher elevations.
• In Sausalito, eelgrass populations may migrate north along the Richardson Bay area toward shallower subtidal zones as sea levels rise.
• Community facilities and historic structures provide essential services, support community well-being, and physically represent Sausalito’s distinct character.
• Many historic structures in Sausalito are in low-lying areas vulnerable to SLR. By 2100, the majority of these structures (>80%) will be inundated either during a storm (with 3.3ft SLR) or during normal tidal conditions (with 6.6ft SLR).
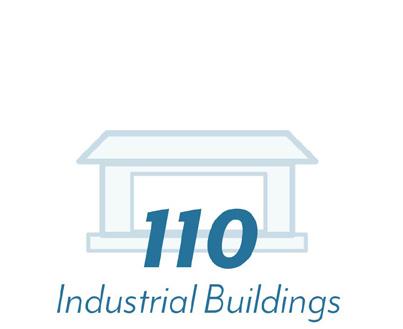
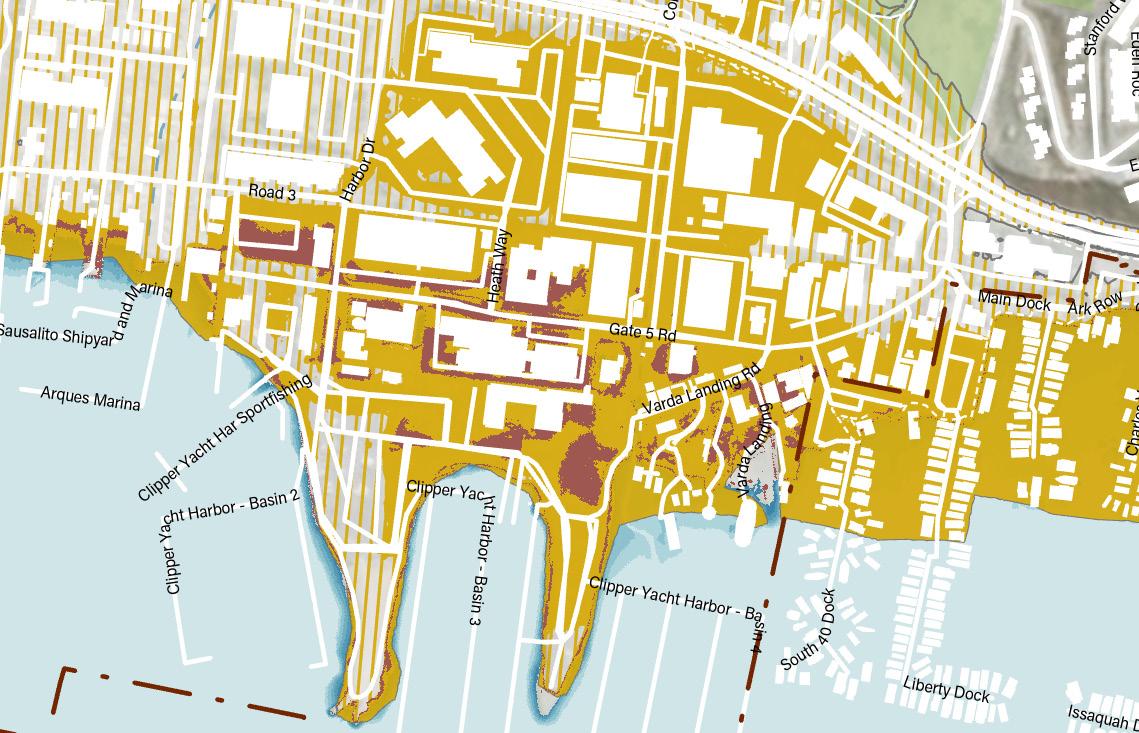
• In Sausalito, a large percentage of the industrial waterfront is at risk of inundation as seen in the following maps.
• 25% of land use area in Sausalito is already located in the Bay or present-day tidal zone, and has been grandfathered into plan areas, such as the floating homes communities.
• Approximately half of land use area under water throughout the remaining century is City-owned, from 0.8ft SLR up to 6.6ft SLR.
Map Sources: City of Sausalito, County of Marin
Map Author: WRT, 2024
Base Map
Sausalito City Boundary Sphere of Influence Parks
Informed by Regional Guidance (RSAP 2024)
The table and section diagram on the right illustrate potential sea level rise scenarios within the mid-century and end-of-century range that informs our adaptation planning:
1. Mid-century (2050) scenario of 0.8 ft sea level rise without storm surge
2. Mid-century (2050) scenario of 0.8 ft sea level rise scenario combined with 100-year storm surge, which adds up to 4.3 ft total water level
3. End-of-century (2100) intermediate projection of 3.1 ft sea level rise, combined with 100-year storm surge; or end-of-century high projection of 6.6 ft sea level rise. Both would result in 6.6 ft total water level.
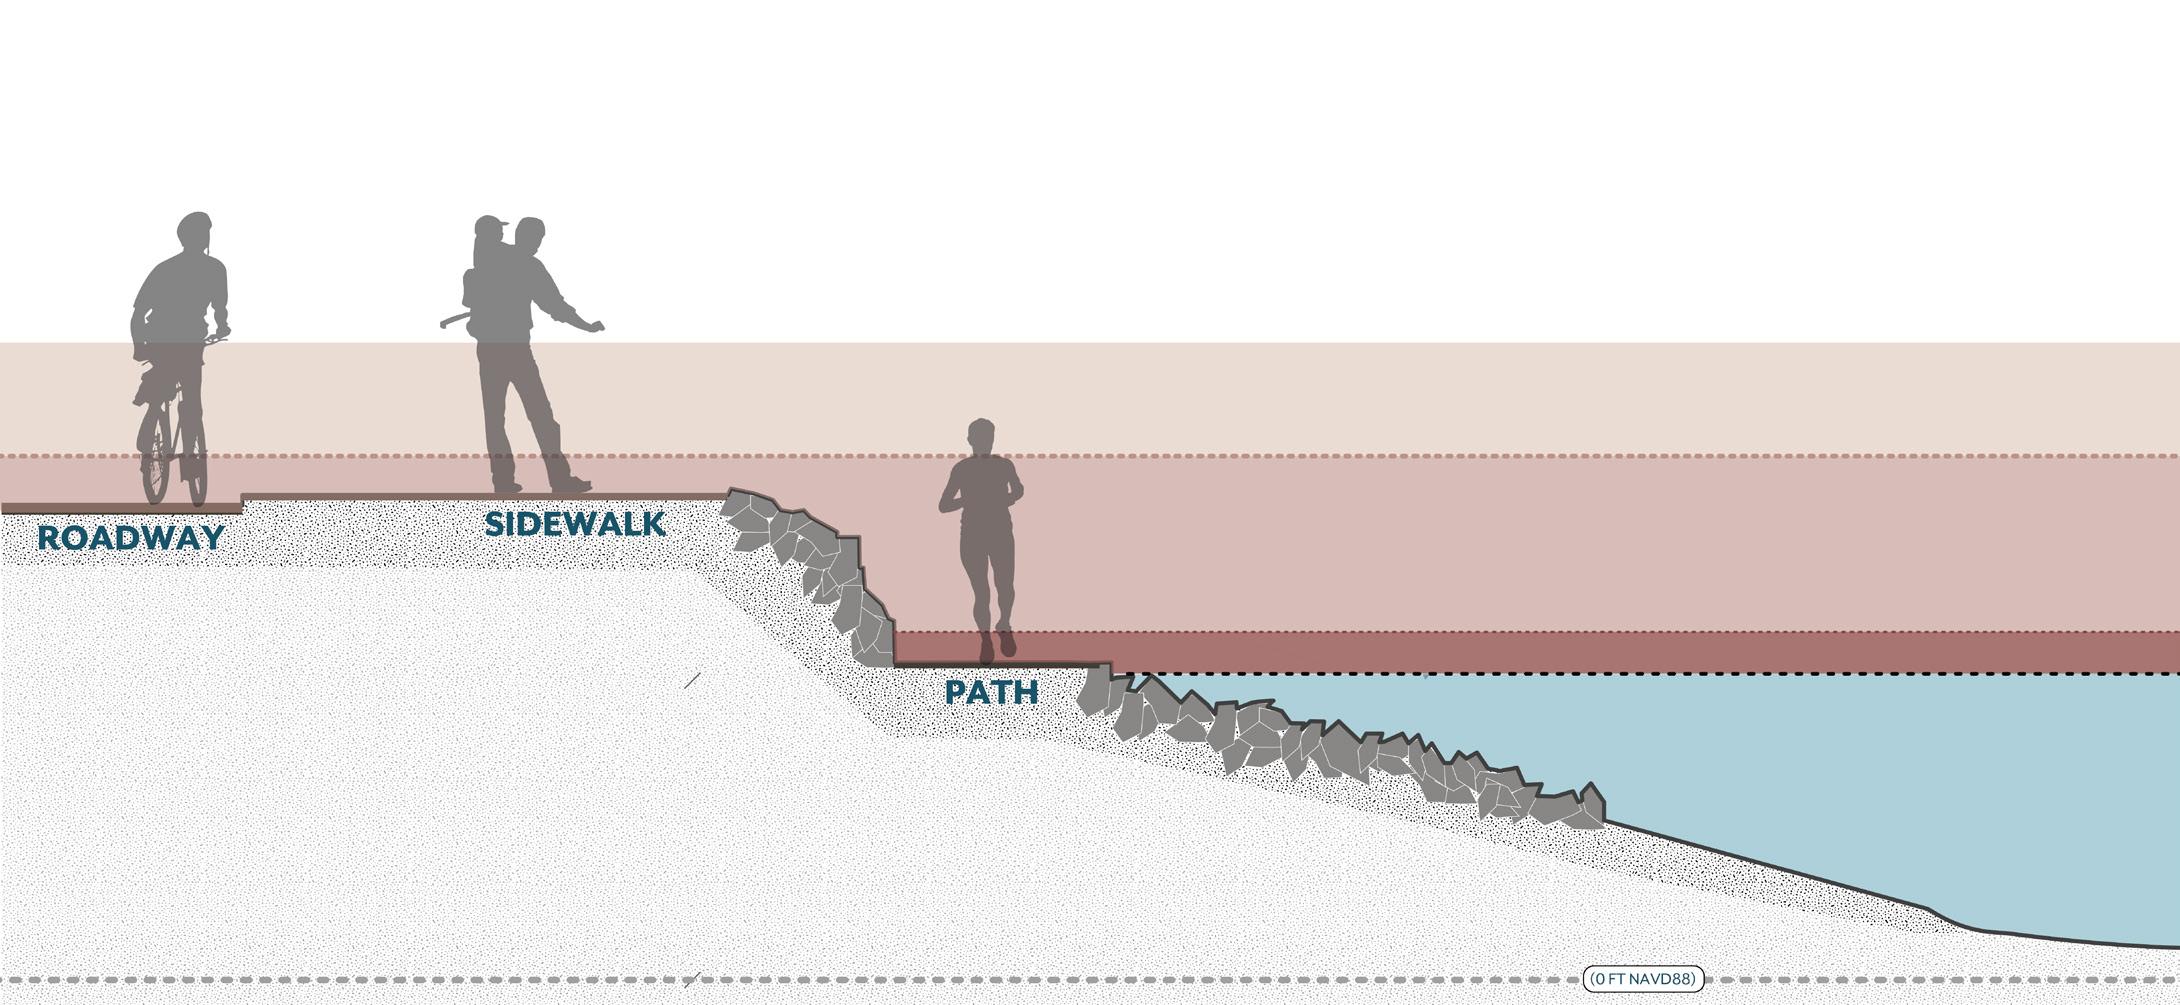
* NAVD88 refers to the official datum used across the U.S. to measure elevations consistently.
2 3 1
While sea level rise is a primary driver of long-term risk in Sausalito, it does not act alone. The following section covers the full range of flood-related and geologic hazards that act as amplifiers of sea level rise.
These hazards include:
• Rainy day flooding from intense storms
Temporary surface flooding caused by intense storm events that overwhelm drainage systems.
• Sunny day flooding from shallow groundwater rise
Tidal flooding that occurs during dry weather due to rising groundwater levels, often exacerbated by sea level rise and poor drainage.
• Landslides / Shoreline Erosion
The downhill movement of soil, rock, or debris triggered by heavy rainfall, erosion, or seismic activity.
• Liquefaction
A geologic phenomenon where saturated, loose soils temporarily lose strength during an earthquake, causing ground instability and damage to structures.
• Land subsidence
The gradual sinking or settling of the ground surface, often caused by groundwater withdrawal, soil compaction, or natural geologic processes.
We will walk through each type of the coastal and inland hazards in this section, accompanied by text descriptions, photos, and maps to unpack their close association to the everyday life of people and places in Sausalito.
A scientific, data-driven approach was taken with assistance of spatial analysis and mapping software like ArcGIS Pro. Maps visualizing the extent of risks and impacts call for adaptation actions for both nearterm and long-term benefits. The summary of impact and estimated cost of no action is further explored in the Implementation chapter.
Sea level rise doesn’t just push water up from the Bay — it also affects how stormwater drains off our streets and neighborhoods. Normally, when it rains, water flows downhill into pipes, creeks, or storm drains that empty into the Bay. But as sea levels rise, the Bay itself sits higher, which means those pipes and drains would need to be redesigned to drain into the Bay at a higher elevation. Therefore, sea level rise will require existing stormwater infrastructure to handle greater volumes of runoff than it was originally designed to manage, reducing its efficiency and increasing the risk of localized flooding.
Storm surges, which are large waves caused by storms, can push water further inland, exacerbating the impact of floods. In addition, climate change is causing large storms to occur more frequently.
Base Map
Sausalito City Boundary Sphere of Influence
Parks
Flood Hazard Type & Zone


100-Year Floodplain (AE)
Coastal Area of the 100-year Floodplain with Storm Wave Hazard (VE)

0.2% Annual Chance Flood Hazard (X)
Flood Depth
0”- 6”
6”- 12”
12”- 24”
24”- 60”

5:
60”+
Map Sources: FEMA, First Street Data
Map Author: WRT, 2024
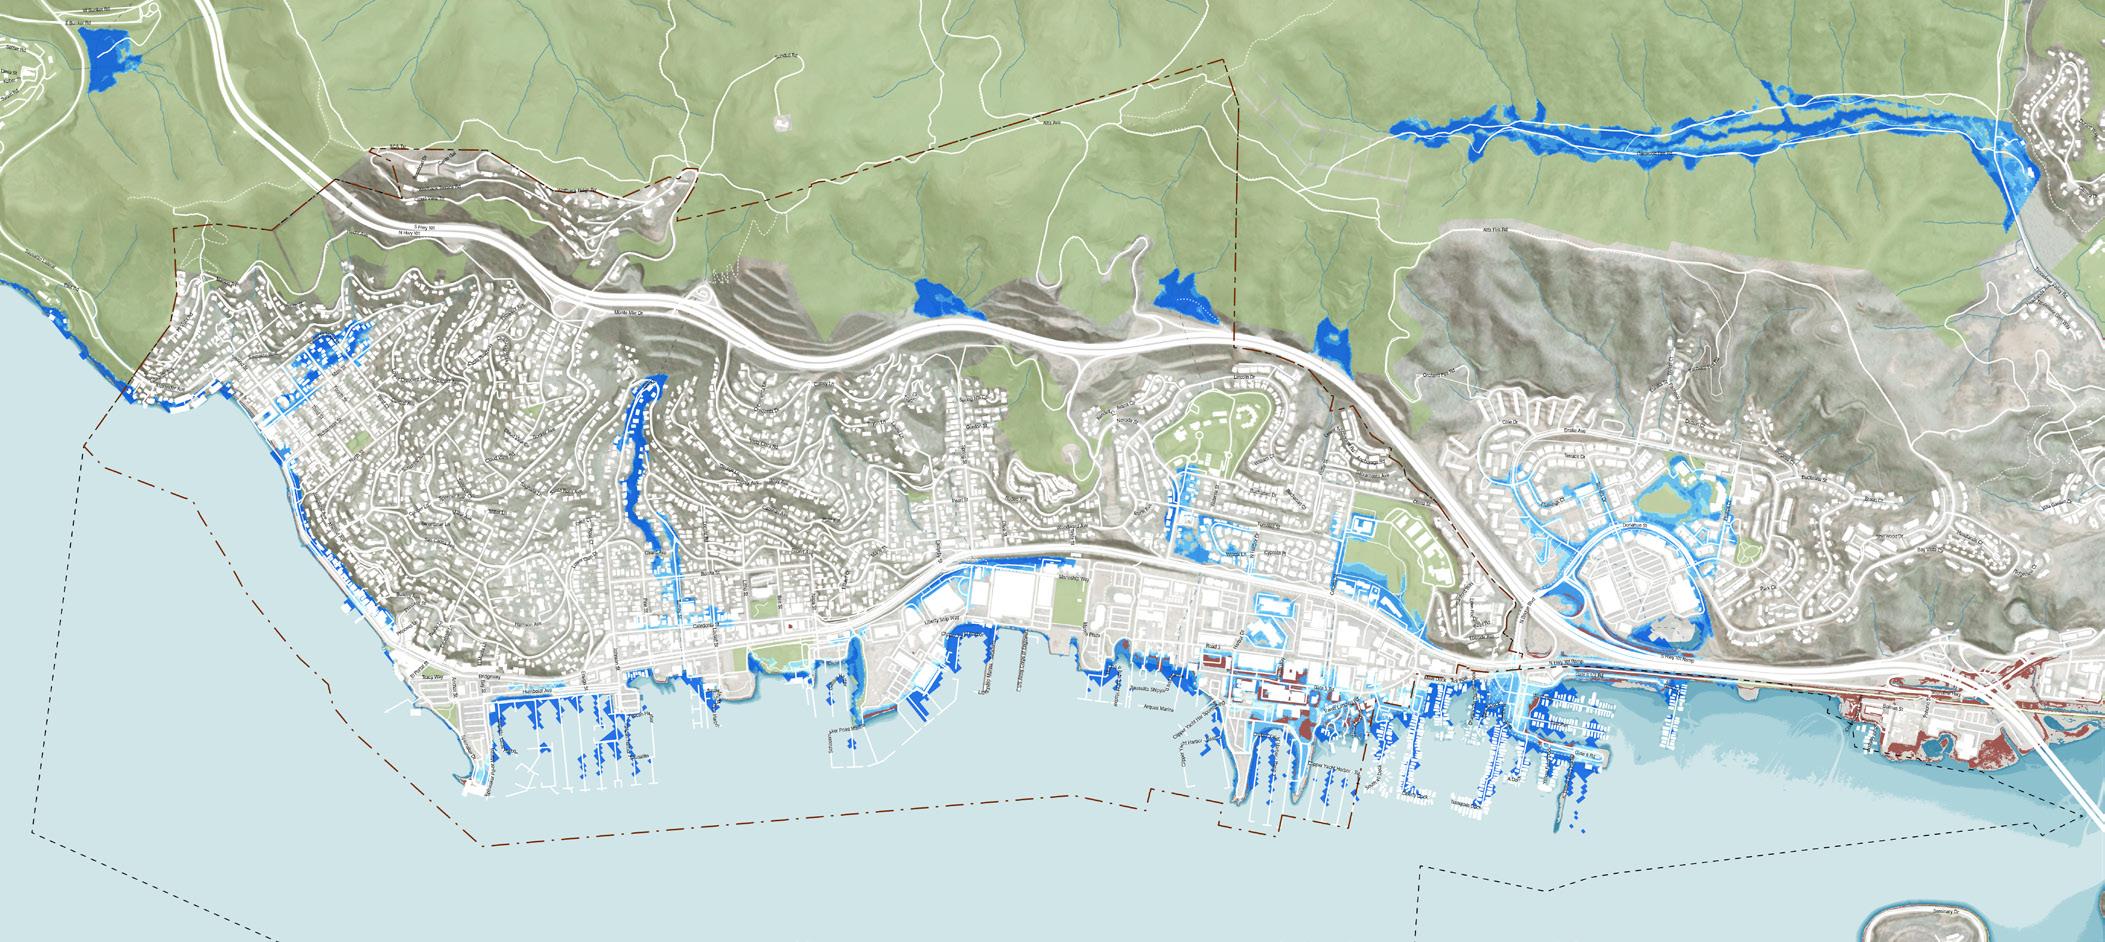
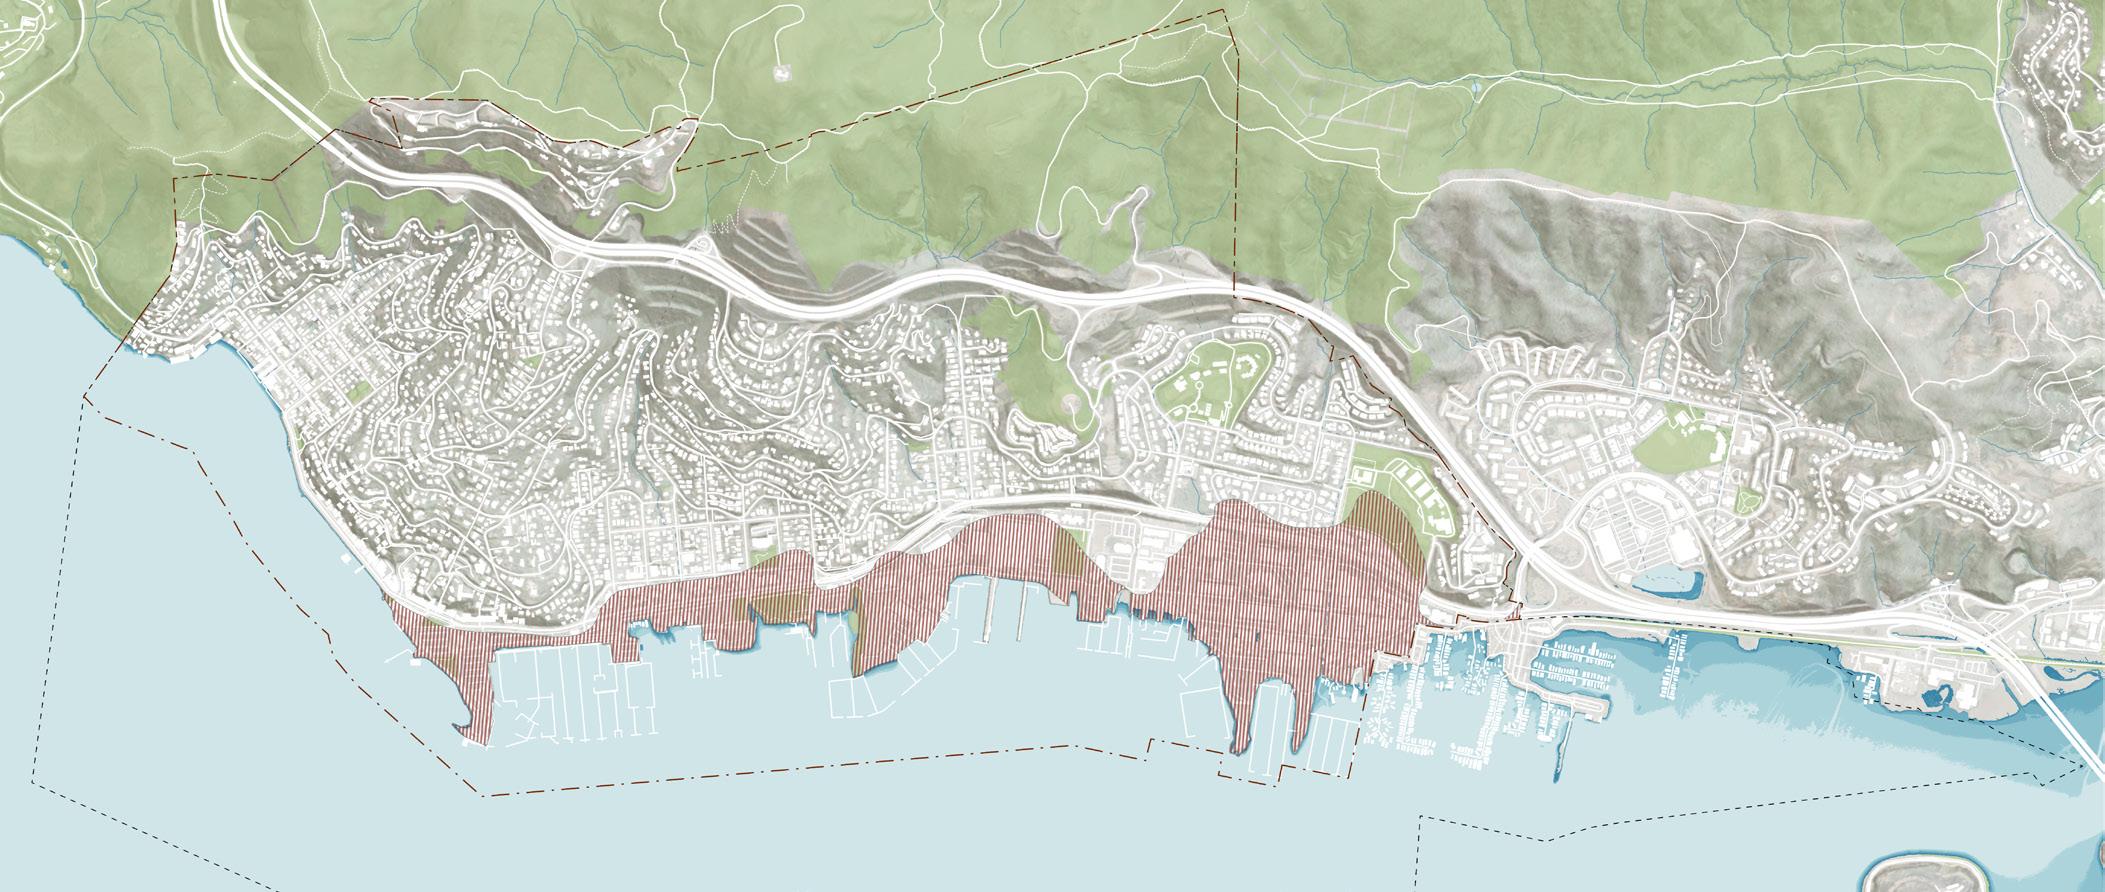
Base Map
Sausalito City Boundary Sphere of Influence
Parks
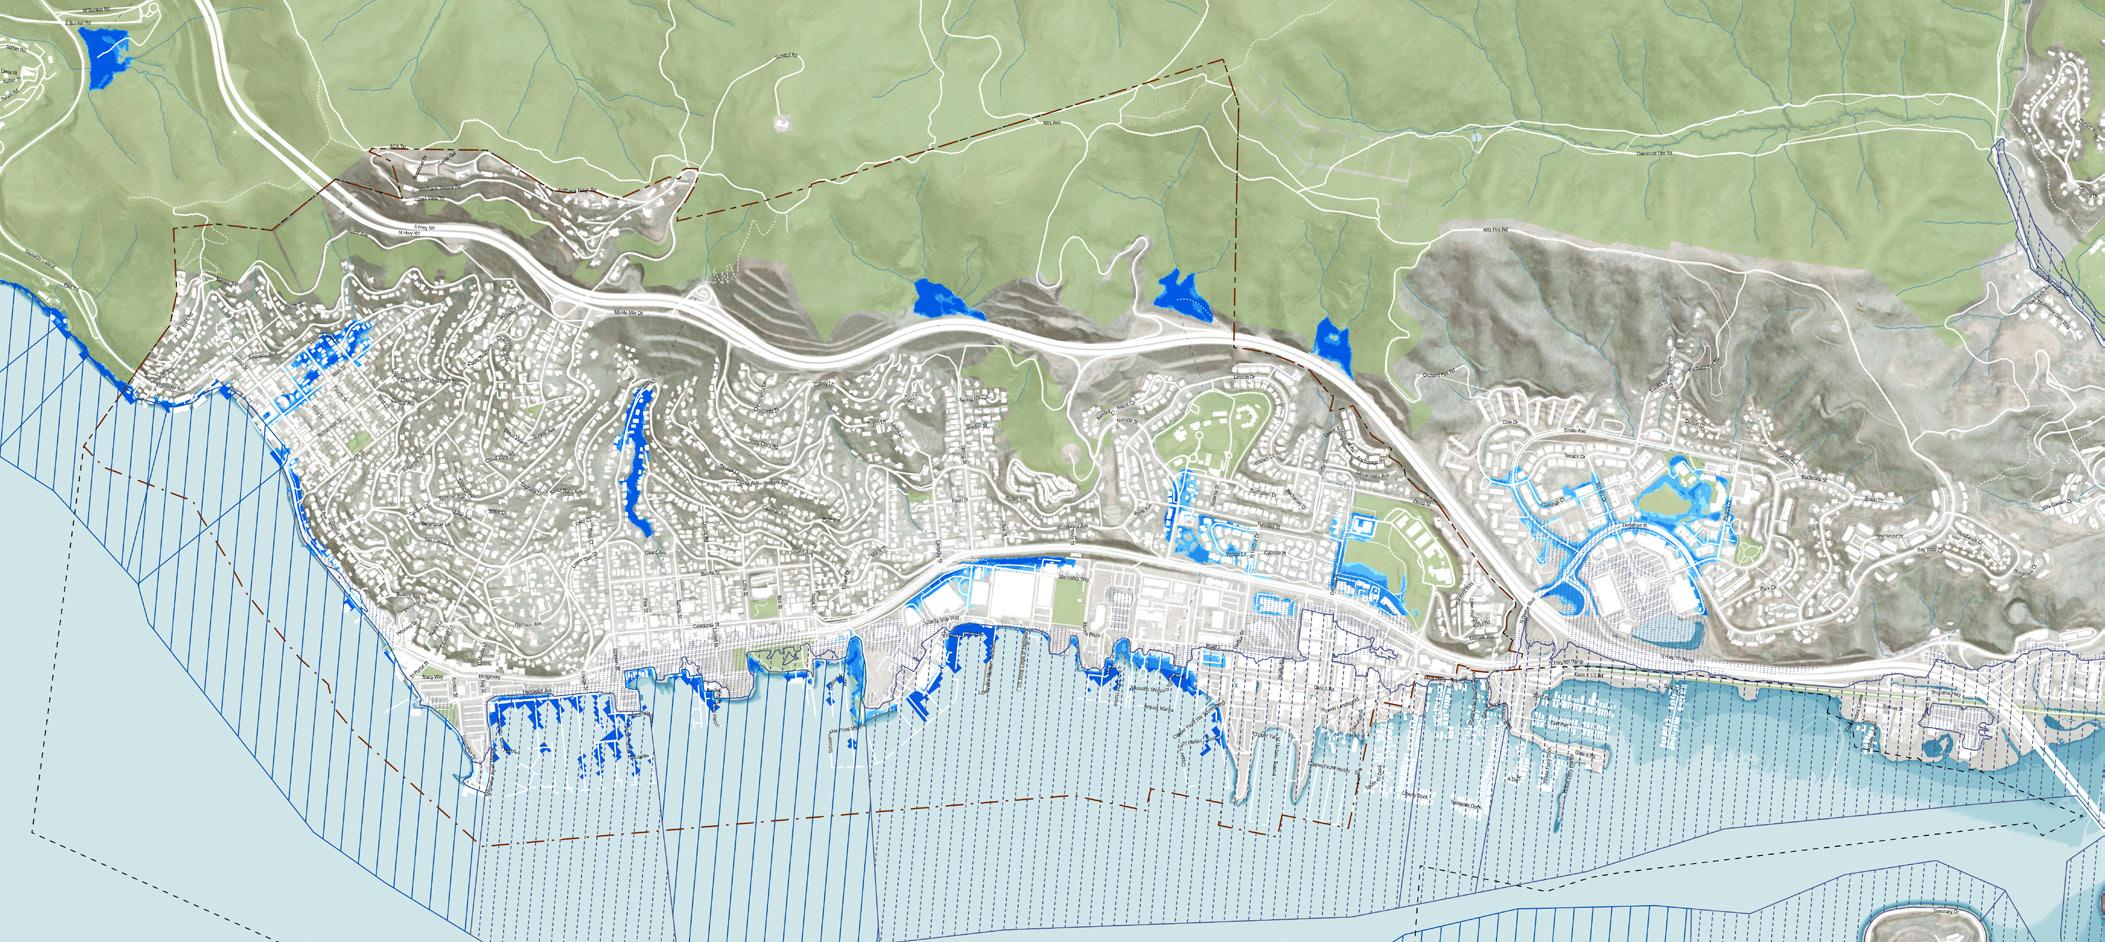
10” Sea Level Rise
Permanent SLR Inundation
Flood Depth
0”- 6”
6”- 12”
12”- 24”
24”- 60”
6:
Storm with 10” Sea Level Rise
60”+
Map Sources: FEMA, First Street Data
Map Author: WRT, 2024
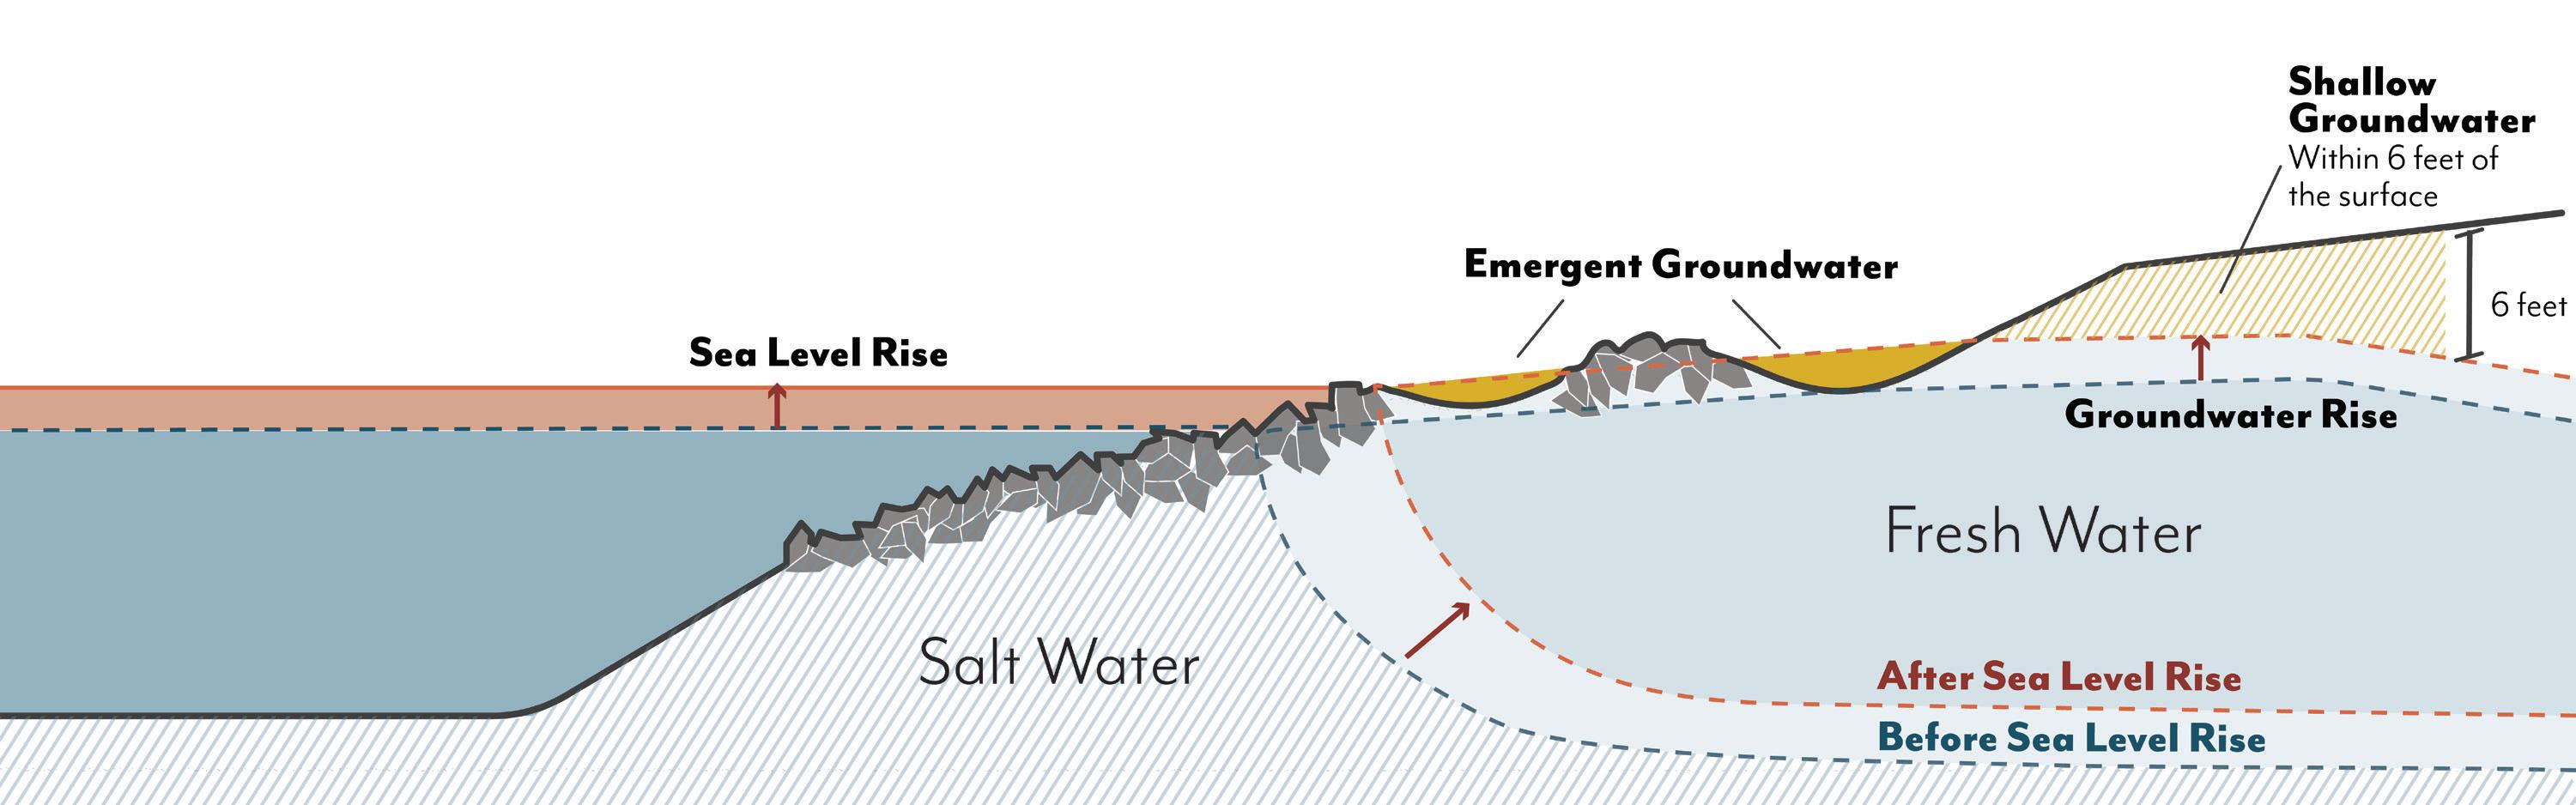
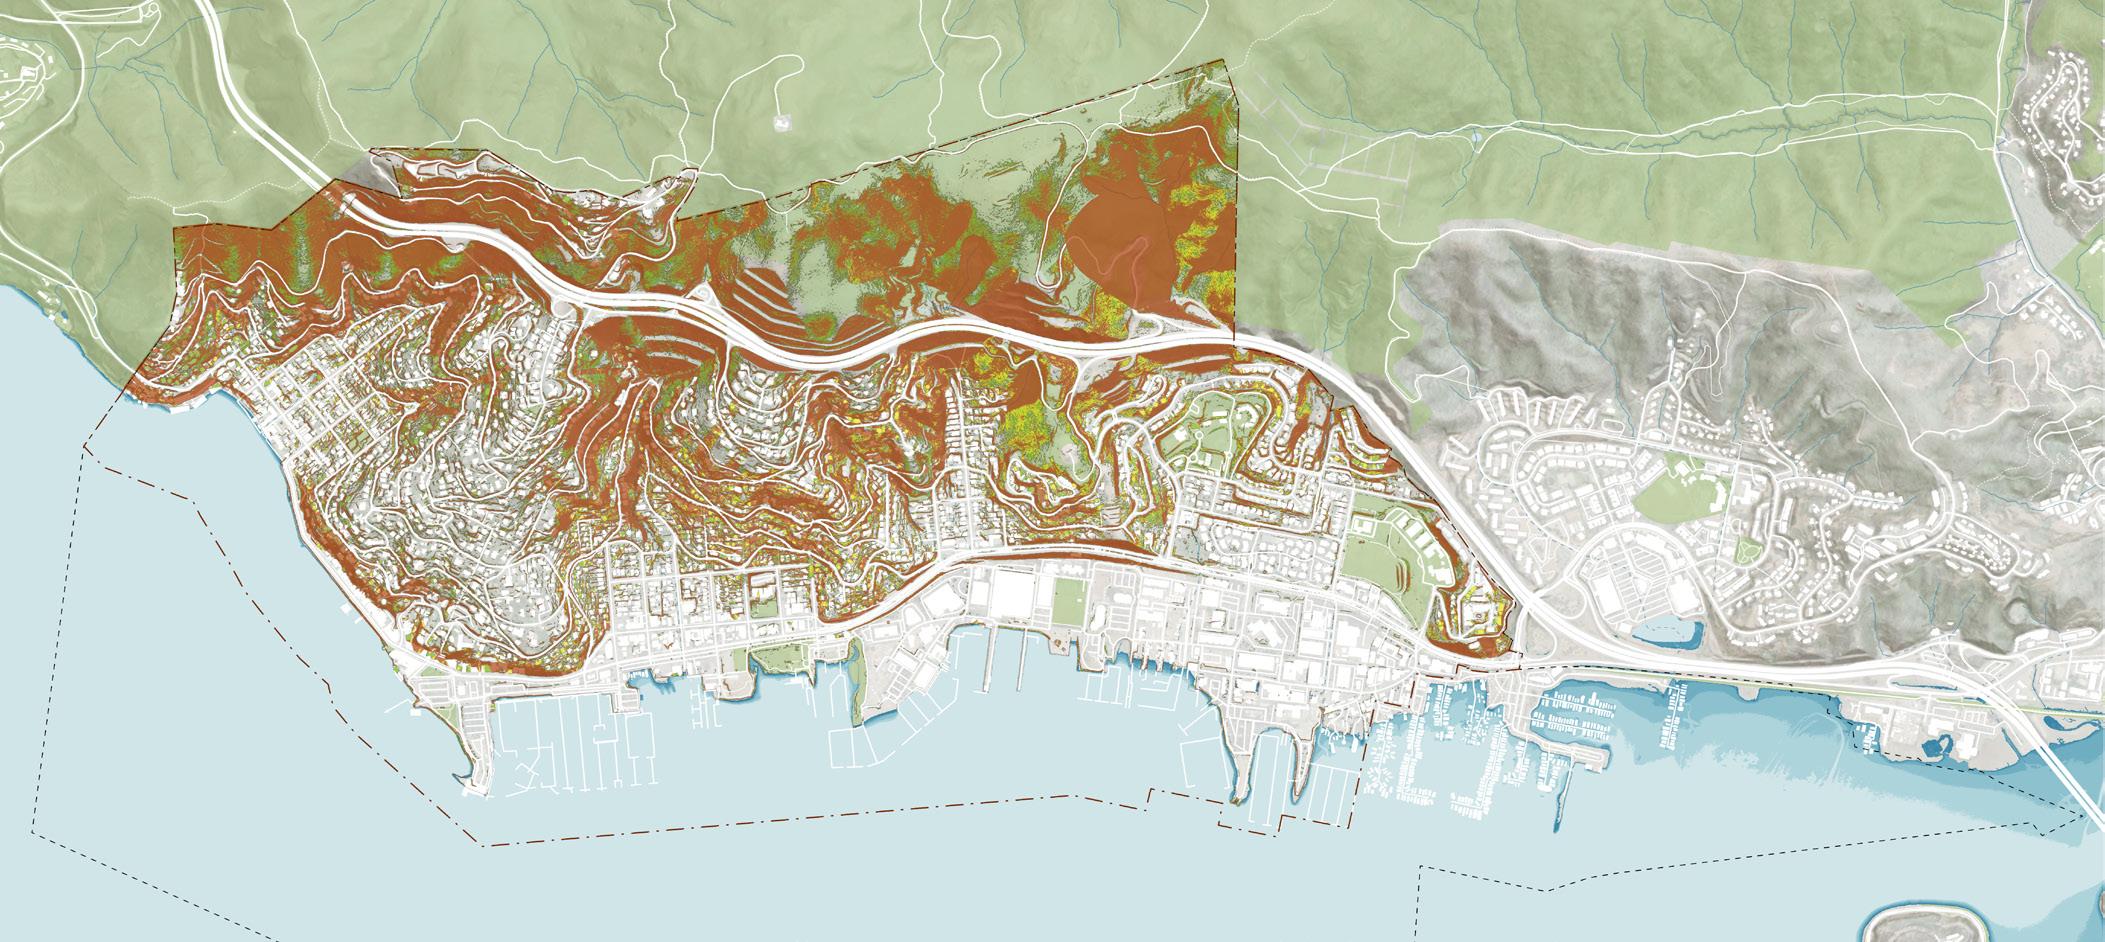
As sea levels rise, subsurface salt water pushes fresh groundwater up through the soil, causing groundwater tables to rise. This happens because salt water is denser than fresh water. Potential consequences of groundwater rise include changes in soil conditions that can impact infrastructure and buildings.
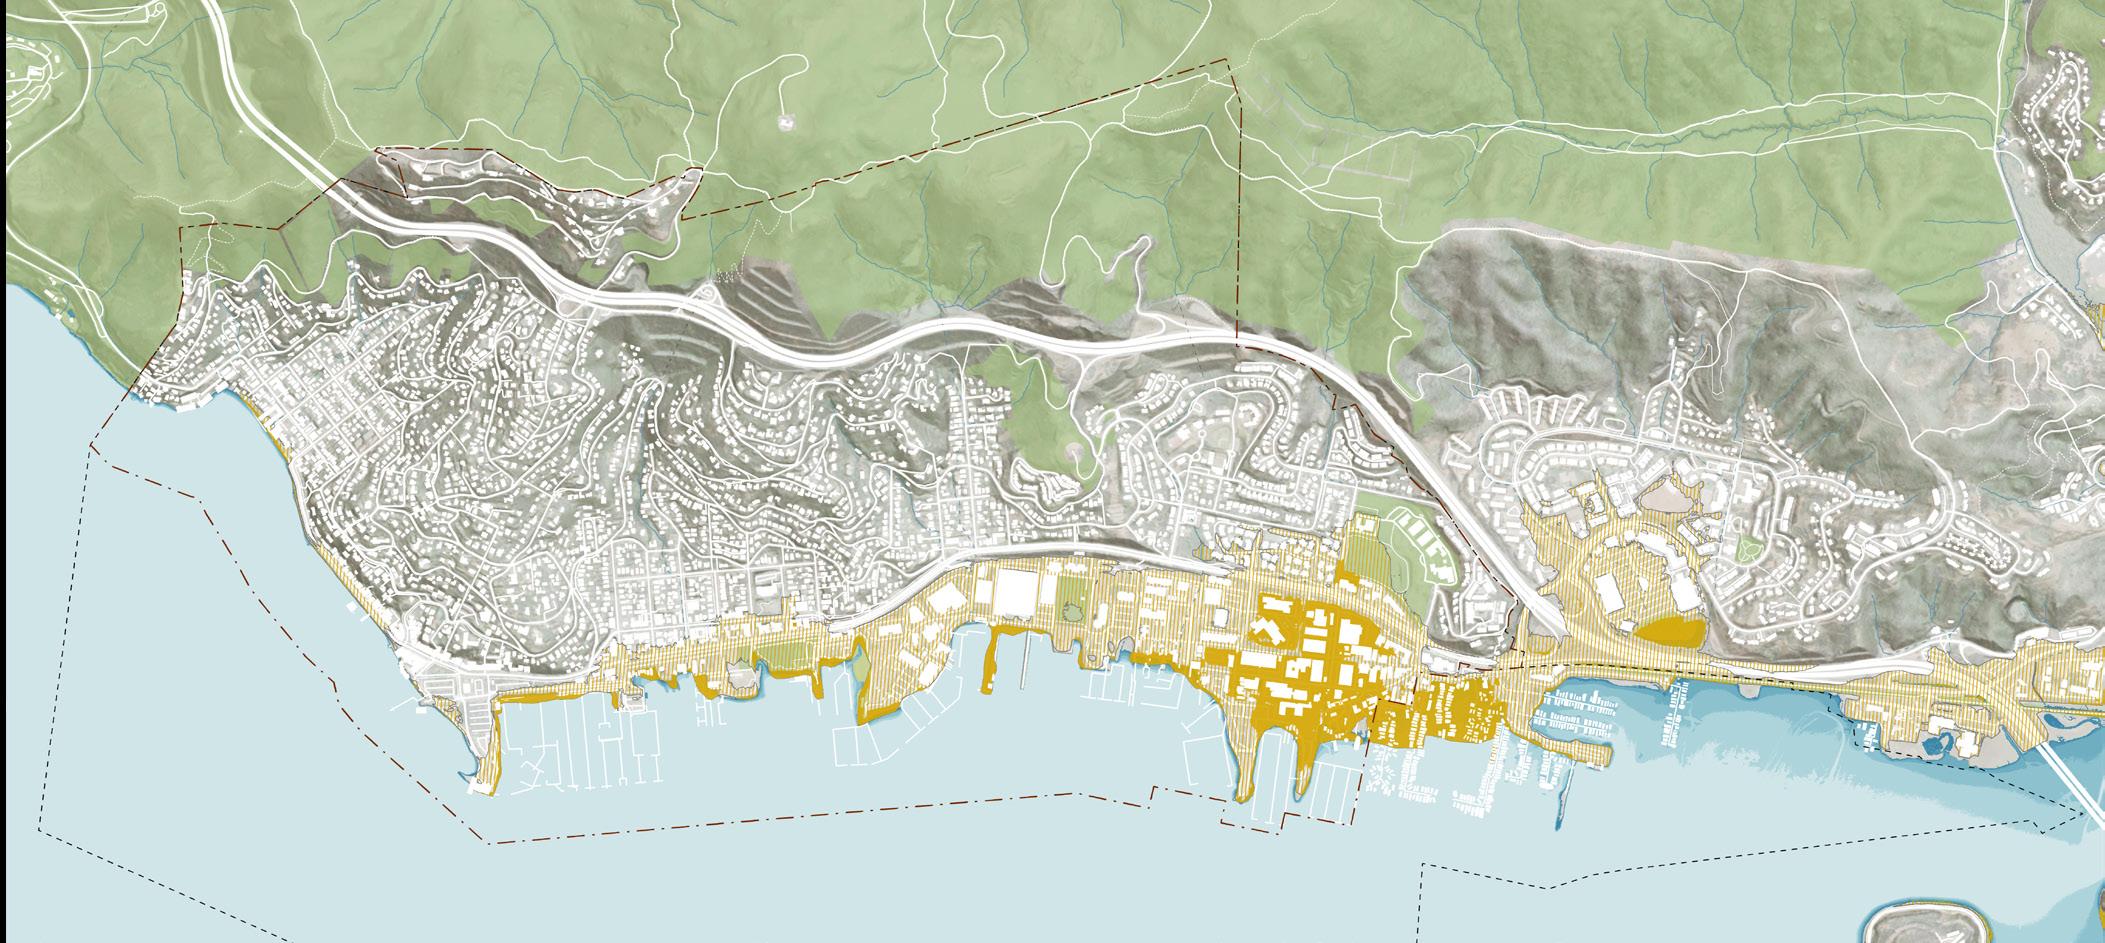
Base Map
Sausalito City Boundary
Sphere of Influence
Parks
Groundwater Types
Emergent Groundwater

Shallow Groundwater (within 6ft of surface)
Map Sources: Pathways Climate Institute, San Francisco Estuary Institute
Map Author: WRT, 2024
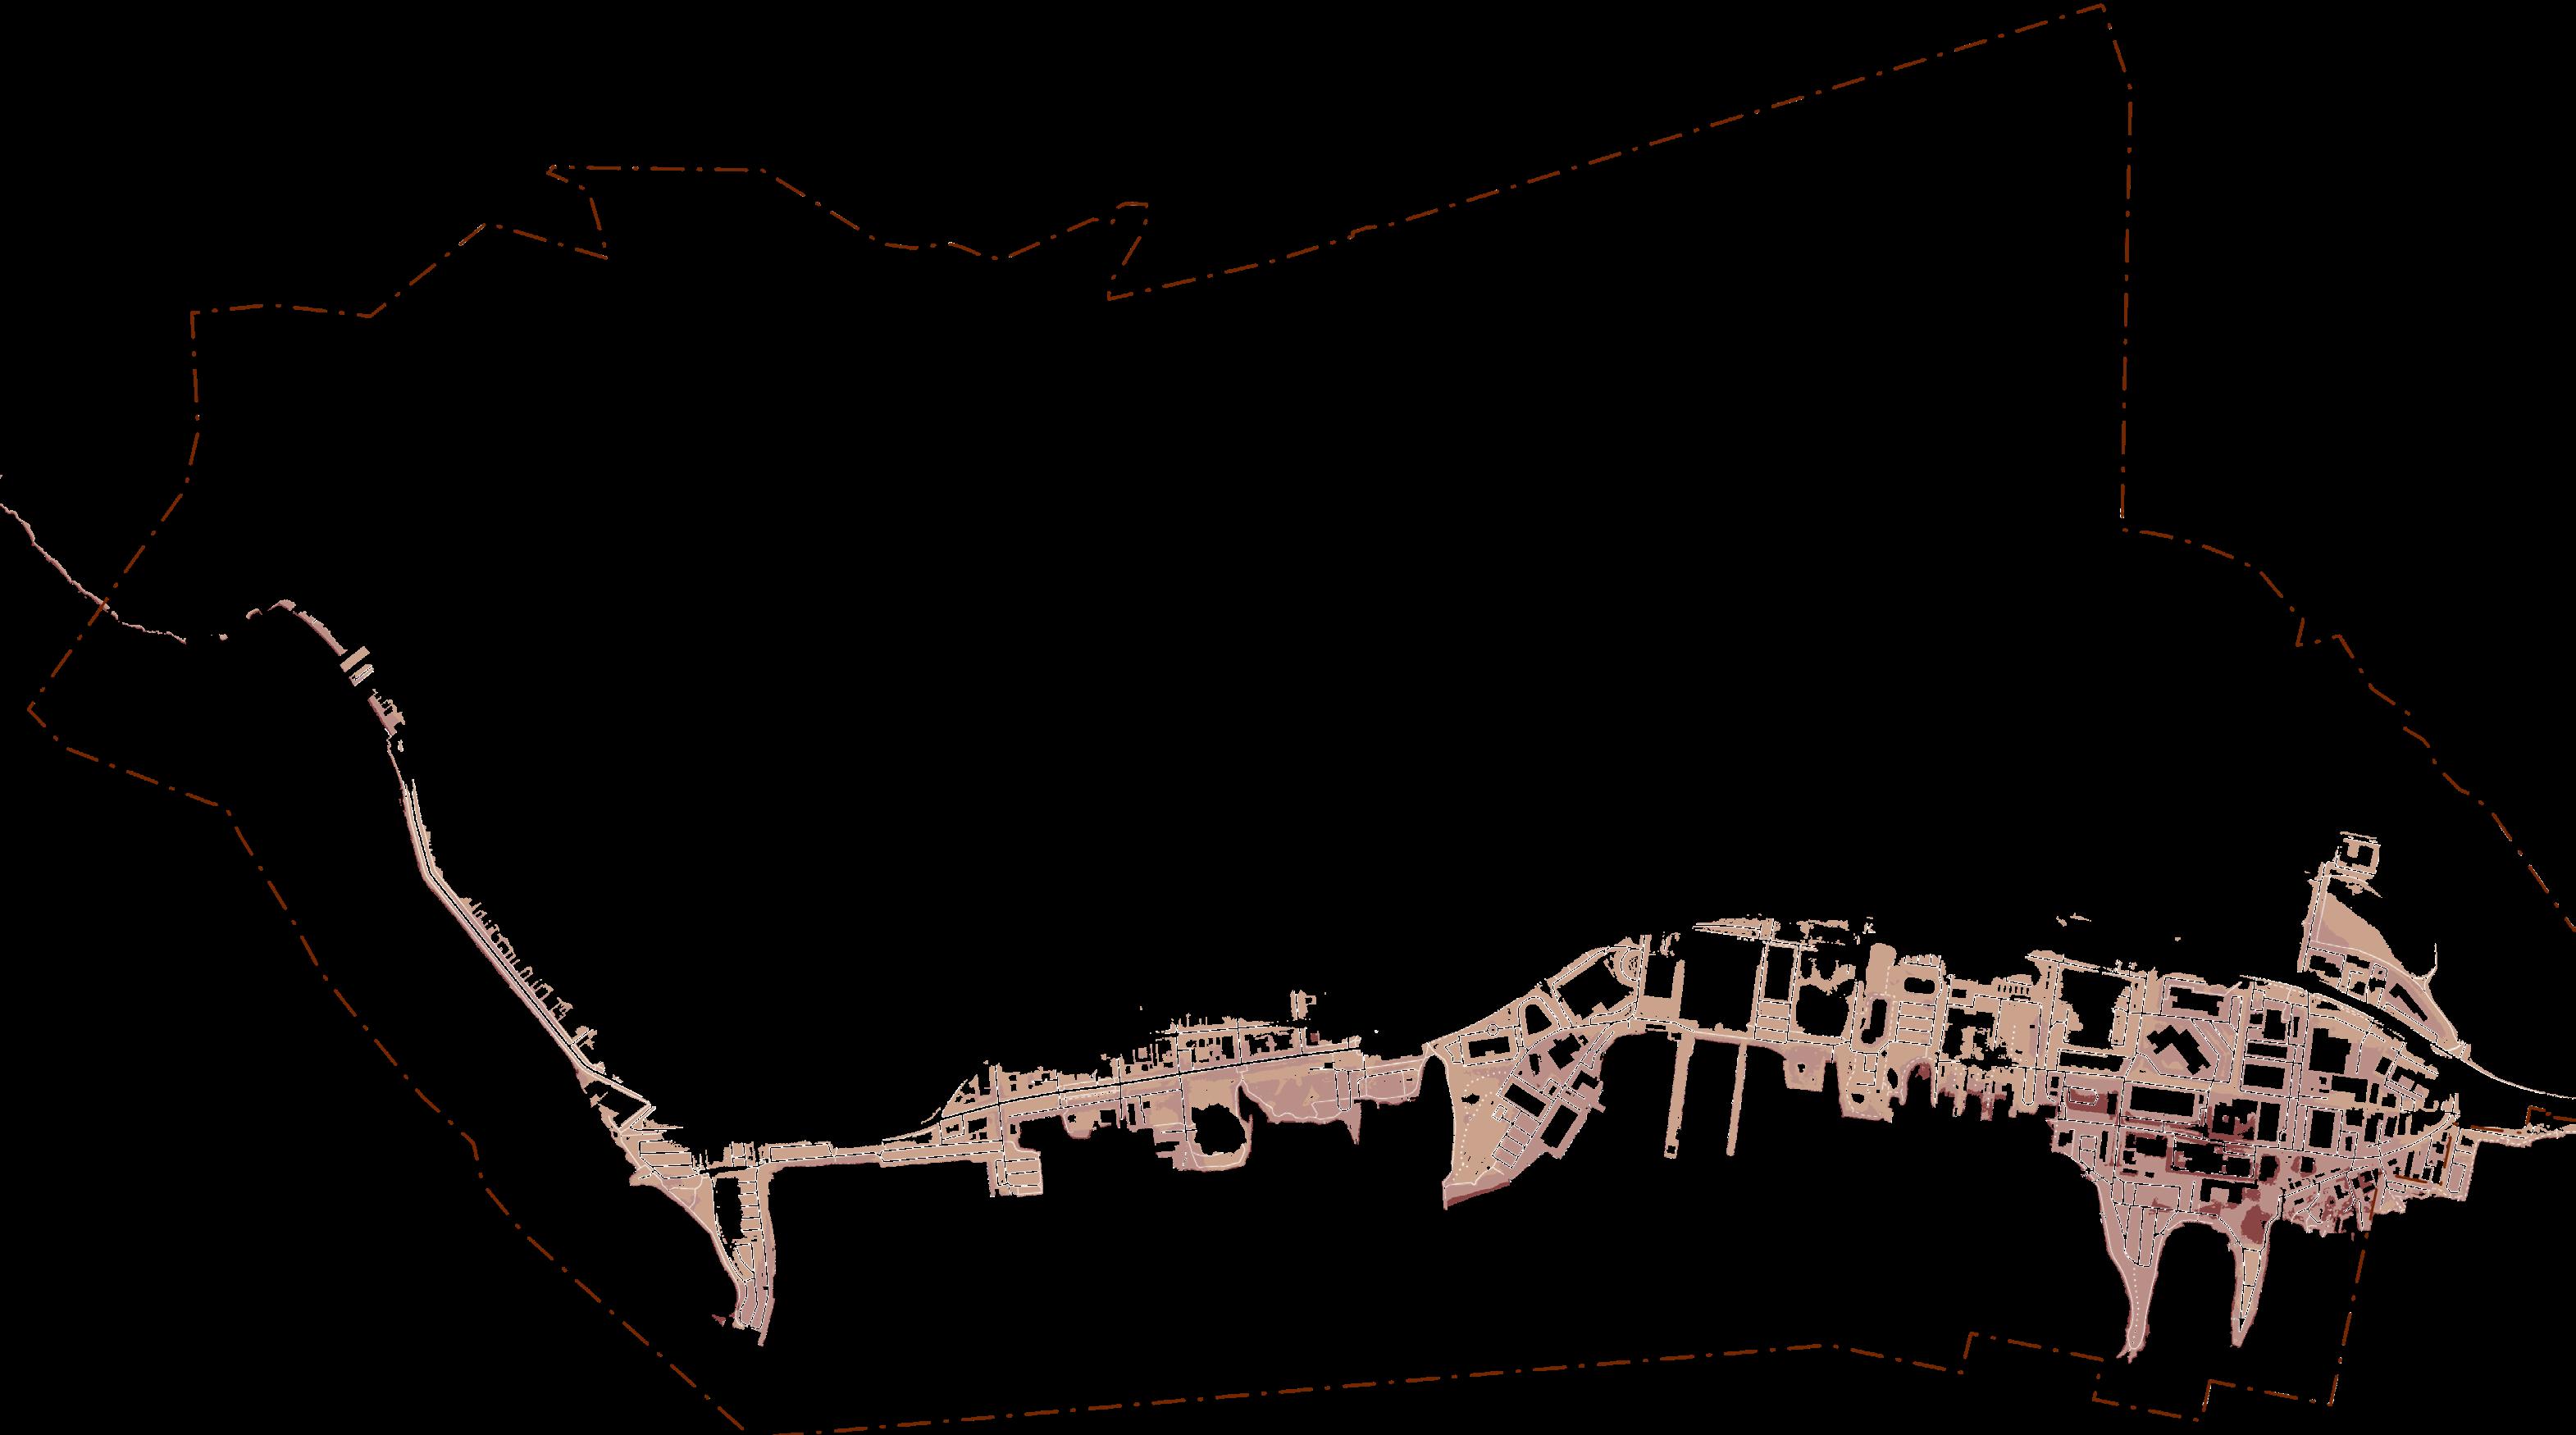
Enlargement Map Extent
Map Sources: Pathways Climate Institute, San Francisco Estuary Institute
Map Author: WRT, 2024
Enlargement Map - Permanent Inundation Areas in Marinship`
Groundwater Types
Emergent Groundwater
Shallow Groundwater (within 6ft of surface)
10” Sea Level Rise
Permanent SLR Inundation
Landslides / Shoreline Erosion
The combination of rising sea levels, groundwater changes and extreme storms can lead to increased landslide / shoreline erosion risk. In addition, Sausalito has seven culverted streams which destabilize hillsides.
Sausalito is susceptible to liquefaction which occurs when loosely packed, water-logged sediments lose their strength in response to strong ground shaking. Sea level rise increases the risk of liquefaction due to the increased presence of water. Some of the shoreline is built on reclaimed land and is particularly vulnerable.
Land subsidence is the gradual sinking or settling of the ground surface, often occurring in low-lying areas around the bay which were historically marsh or mudflat that have since been filled with sediment. Subsidence risk is a critical design consideration limiting the feasibility of certain adaptation strategies along the shore.
In summary, sea level rise, landslides, liquefaction, and land subsidence are interconnected issues that can amplify risks in Sausalito, especially along the shoreline.
Areas in Zone 1 typically consist of relatively level areas in valley bottoms as well as ridge crests and other gently- to moderatelysloping areas underlain by relatively strong bedrock.
Areas in Zone 2 typically include gentle to moderate slopes underlain by thinner soils and weak bedrock. Some steeper slopes underlain by competent rock also are included in Zone 2.
Areas in Zone 3 typically include moderate slopes underlain by thicker colluvial soils and steep slopes underlain by relatively weak bedrock.
Areas in Zone 4 are the least stable, and include existing mapped landslides, steep slopes underlain by thicker colluvial soils and moderately strong bedrock, and very steep slopes underlain by more competent bedrock.
Base Map
Sausalito City Boundary
Sphere of Influence
Parks
Relative Landslide Susceptibility Zones
Very Low (Zone 1)
Low (Zone 2)
Moderate (Zone 3)
High (Zone 4)
10:
Map Sources: California Geologic Survey
Draft Geologic Hazard Report, City of Sausalito, 2024
Map Author: WRT, 2024
Base Map
Sausalito City Boundary
Sphere of Influence
Parks
11: Liquefaction Susceptibility
Map Sources: California Geologic Survey
Draft Geologic Hazard Report, City of Sausalito, 2024
Map Author: WRT, 2024

Liquefaction and Settlement Susceptibility Zone (California Geologic Survey)
The following analysis summarizes the impacts of sea level rise across city-wide assets.
The project team conducted a rough order of magnitude cost exercise to provide additional context. It is reflected in the “cost of no action” estimates provided in the subsequent impact summary tables. These cost figures do not account for broader economic impacts, such as business disruption caused by downtime of impacted infrastructure or tax revenue losses to the City and the region. Nor do they include escalation or discounting (i.e. the time value of money). Instead, the figures represent an order-of-magnitude sense of the potential direct financial losses associated with allowing infrastructure and assets to become quasi-permanently flooded under the various scenarios considered. This approach offers a clear indication of the scale of risk, underscoring the urgency of implementing proactive adaptation measures.
The items listed under the scenario 1 column on the right are impacted with 0.8 feet of sea level rise, or during storms today. Based on state (OPC 2024) and regional (BCDC’s Regional Shoreline Adaptation Plan) guidance, we anticipate this to take place in mid-century (2050).
The items listed under the scenario 2 column on the right are impacted with 0.8 feet of sea level rise and a 100-year storm, with the total water level of 4.3 feet. Based on state and regional guidance, we anticipate this to take place between mid (2050) and end of century (2100).
The items listed under the scenario 3 column on the right are impacted with 3.1 feet of sea level rise and a 100-year storm, with the total water level of 6.6 feet.
Based on state and regional guidance, we anticipate this to take place in end-ofcentury (2100).
TABLe 3: Summary table of city-wide impacts by scenario
Eelgrass: Reduction across most of Richardson Bay; Potential increase in suitability near Gate 6 Rd.
Marshes: No significant changes
Beaches: Potential erosion and narrowing
Eelgrass: Significant reduction
Marshes: Transition to lower mudflat
Beaches: Potential erosion and narrowing
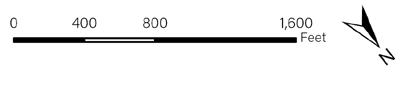
Map Sources: FEMA, First Street, 2021 Sausalito General Plan Update
Map Author: City of Sausalito, modified by WRT, 2024
The map shows city stormwater infrastructure from the 2021 Sausalito General Plan Update overlayed with three SLR scenarios.
Note the storm flooding areas in blue follow the drainage channels designated by the stormwater pipes in purple, which aligns with expectations.
The table shows the total number of storm drains and total feet of stormwater pipeline in the anticipated flooded area for each of the three project SLR scenarios. For Scenario 1 and Scenario 3, the flooded area corresponds to the MHHW for that SLR scenario. For Scenario 2, the flooded area corresponds to the 100-yr storm surge under that SLR scenario.
Feet have been rounded to the nearest hundred (100ft). Infrastructure outside of City boundaries has been excluded.
It is understood that it is conservative to assume stormwater pipes and drains are a complete loss when flooded by a storm scenario, however, given that all scenarios include sea level rise, the plausibility of permanent flooding rendering these assets as a complete loss was deemed appropriate.
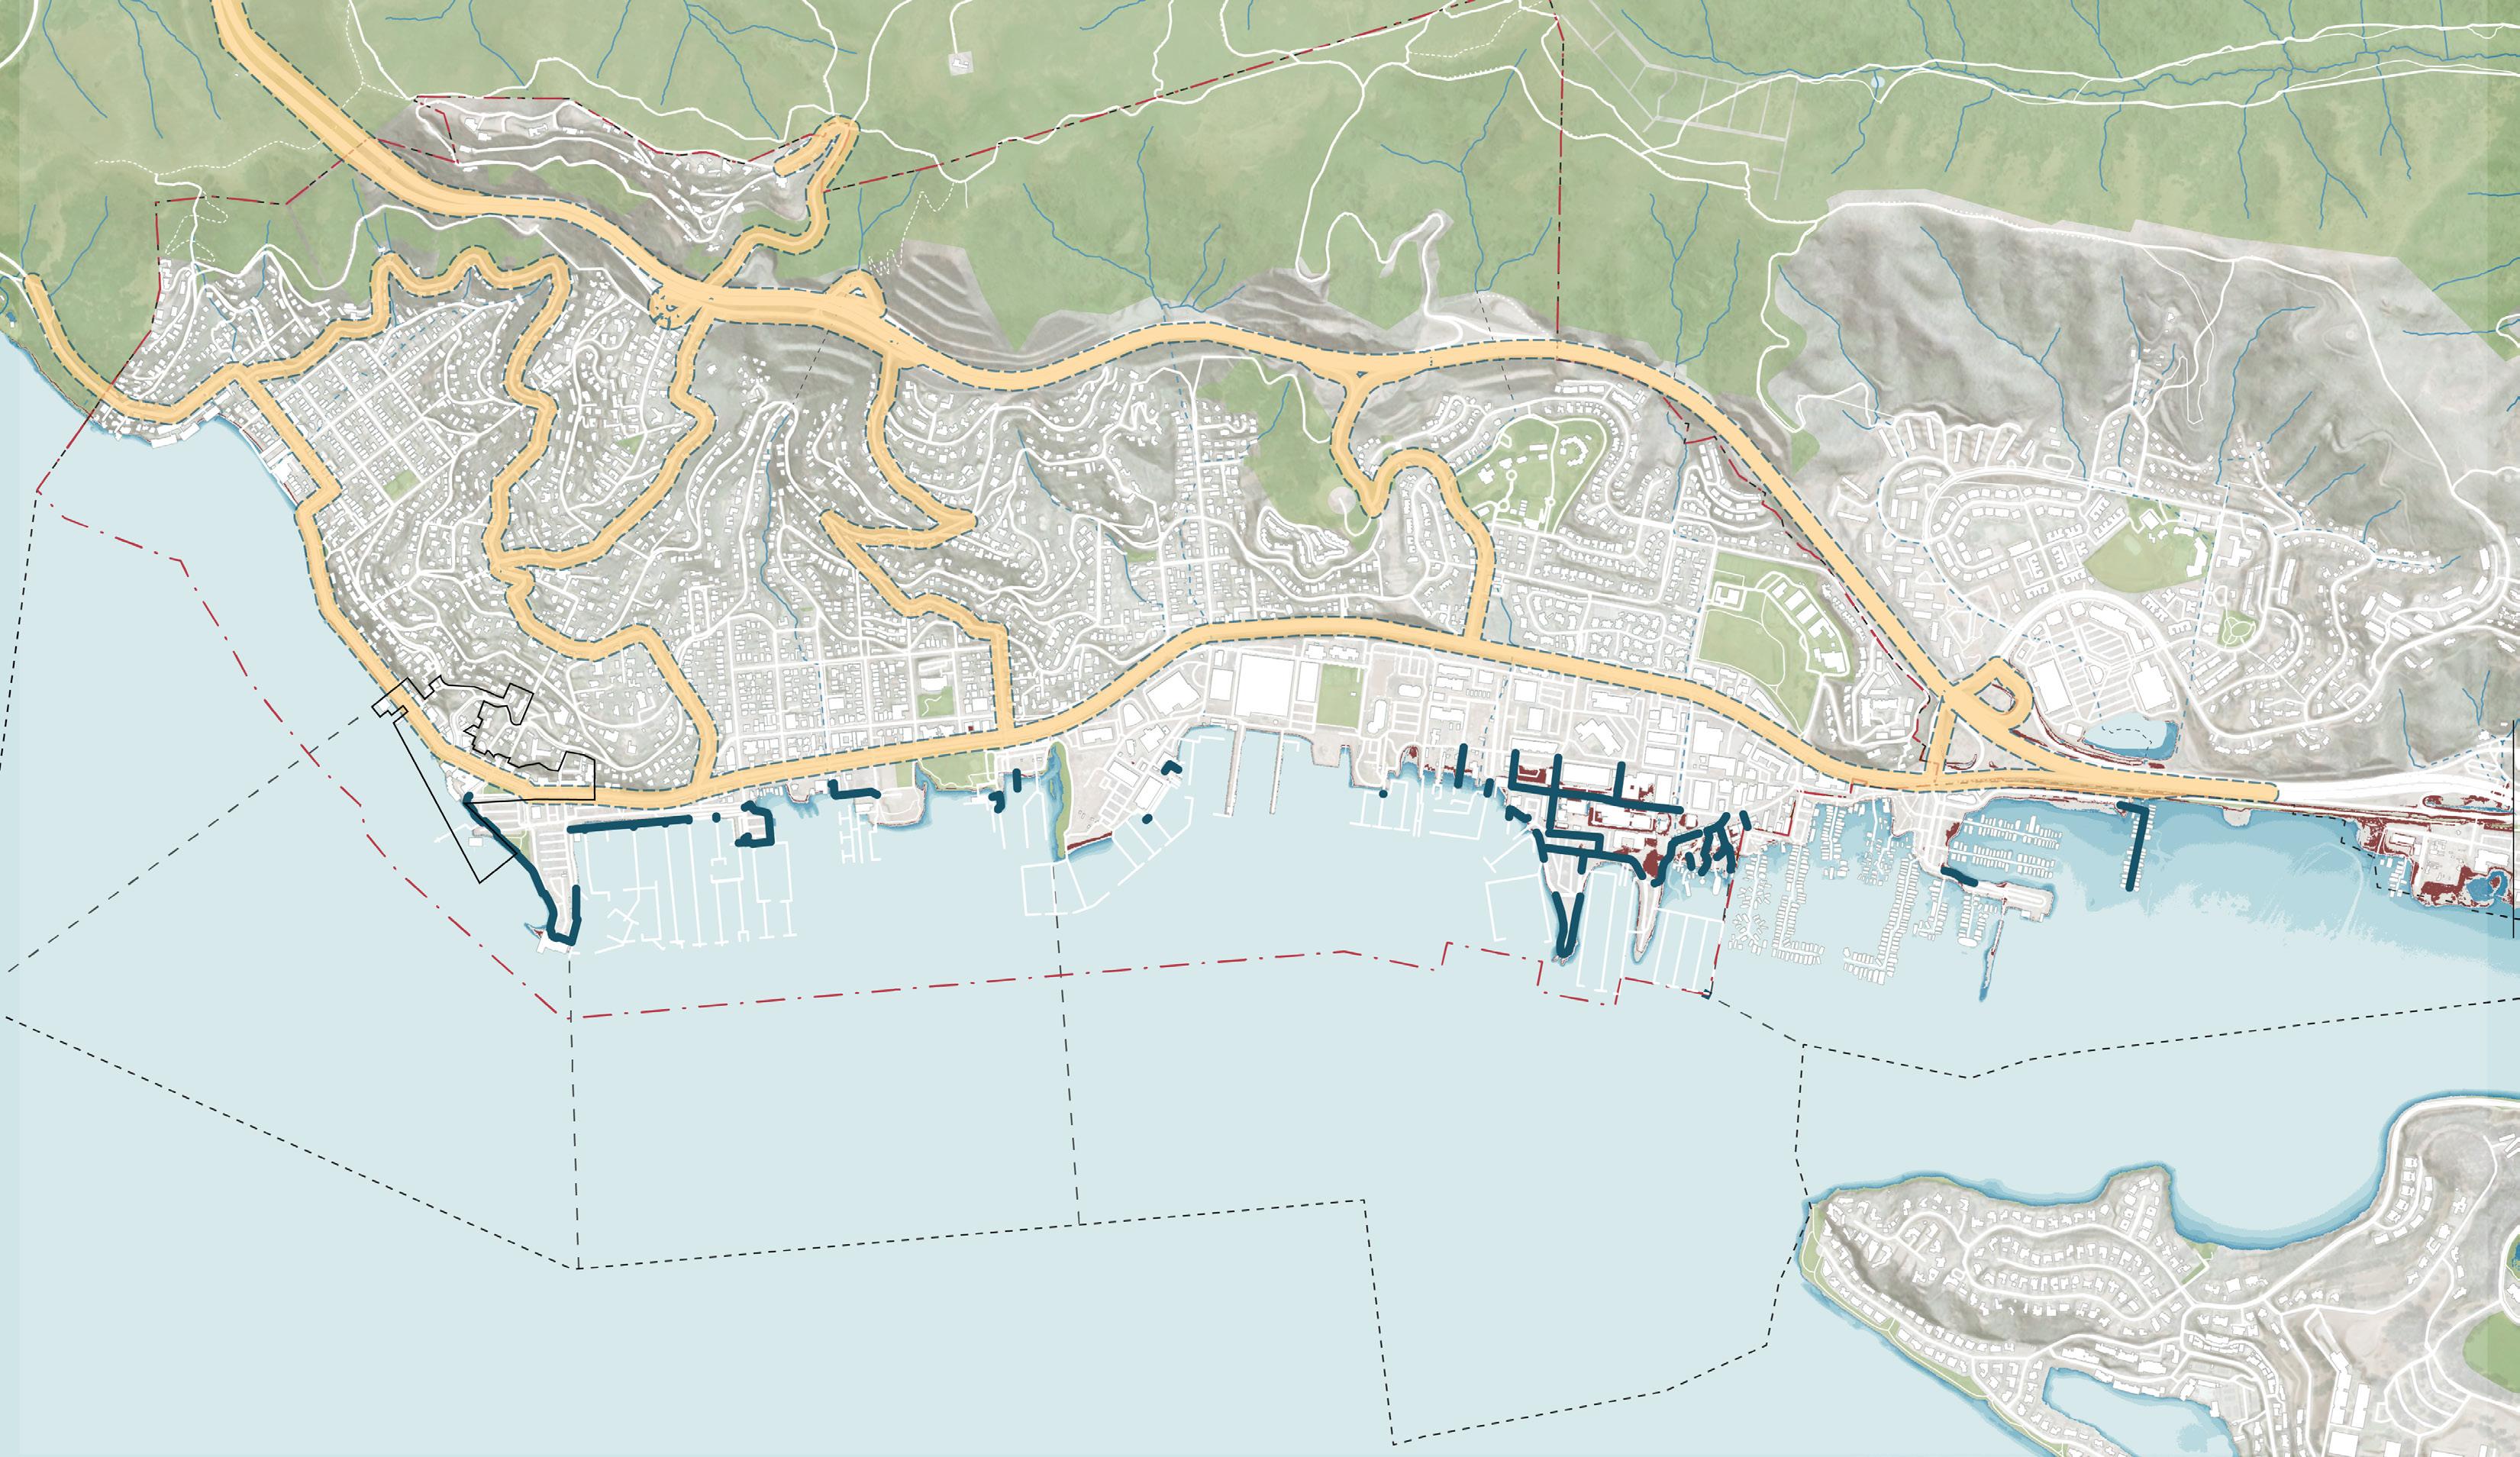
Map Sources: FEMA, First Street, 2021 Sausalito General Plan Update
Map Author: City of Sausalito, modified by WRT, 2024
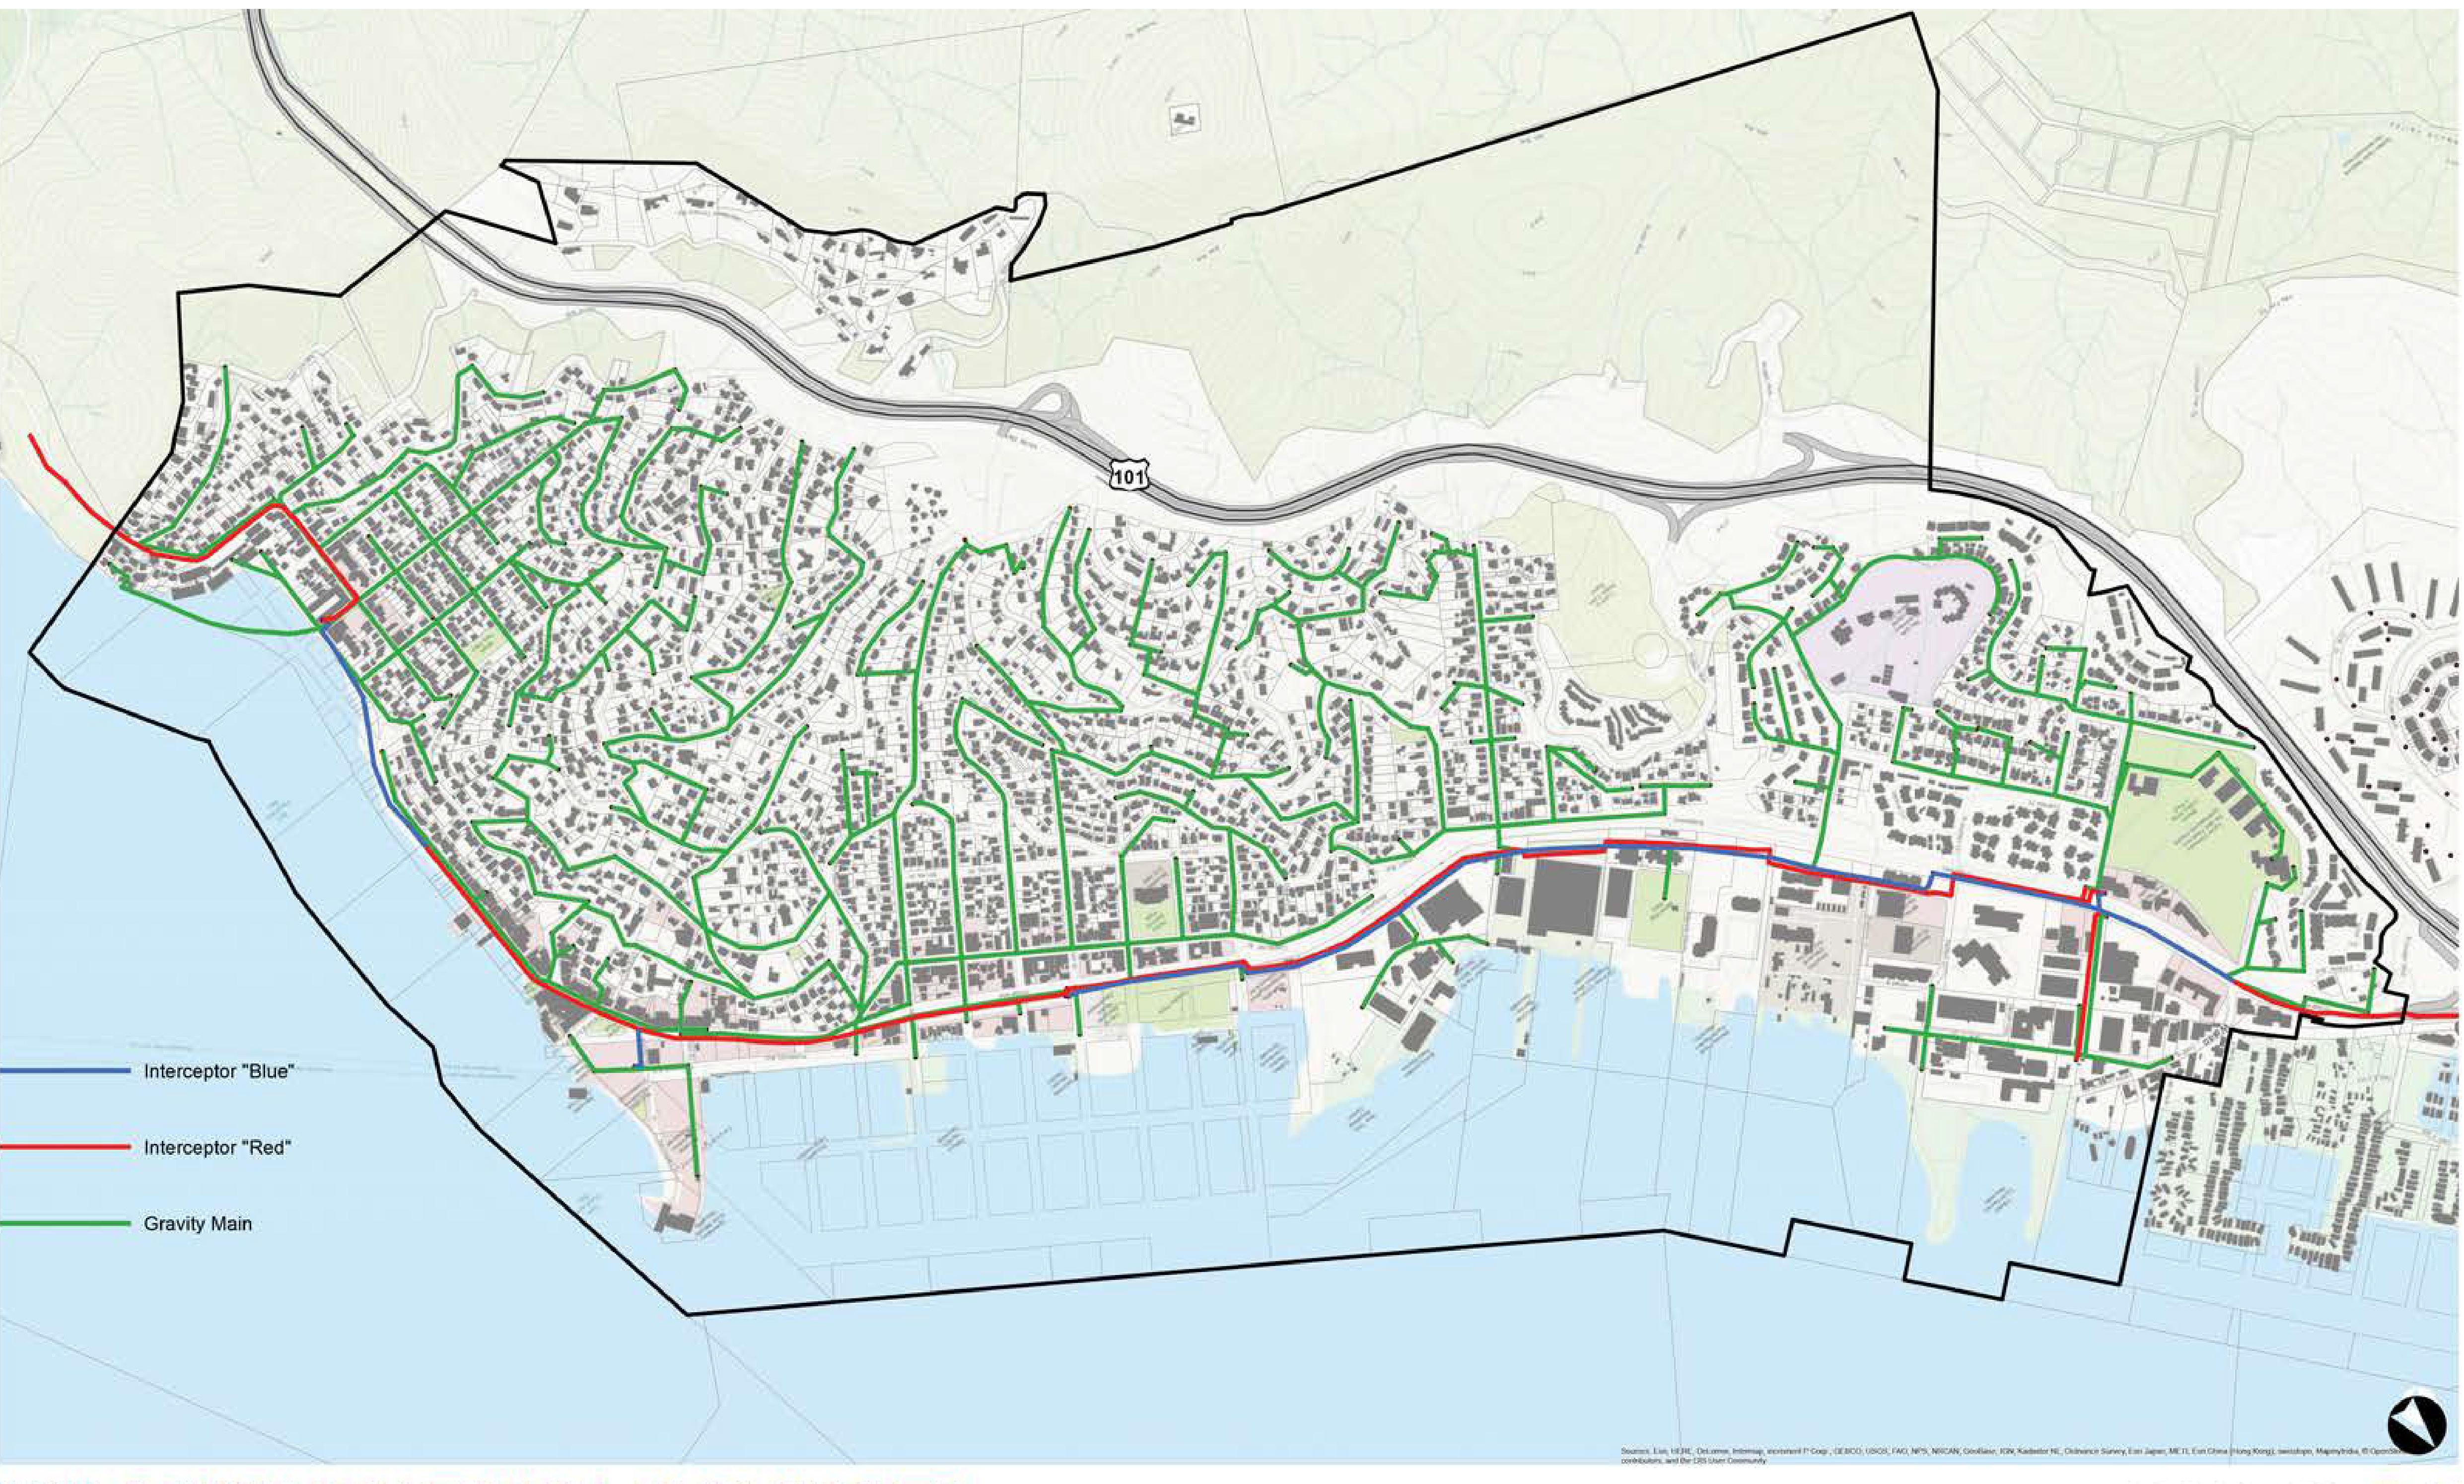
The map shows city sewer infrastructure from the 2021 Sausalito General Plan Update overlayed with three SLR scenarios.
Note the sewer main in green extending into the bay from Swede’s Beach in southern Sausalito. Anecdotally, this segment has experienced issues, likely given its location.
The table shows the total feet of sewer pipeline in the anticipated flooded area for each of the three project SLR scenarios. For Scenario 1 and Scenario 3, the flooded area corresponds to the MHHW for that SLR scenario. For Scenario 2, the flooded area corresponds to the 100-yr storm surge under that SLR scenario.
Feet have been rounded to the nearest hundred (100ft). Infrastructure outside of City boundaries has been excluded, including the wastewater treatment plant, located south of Sausalito. This asset would need to be evaluated separately to understand potential SLR impacts to the plant.
It is understood that it is conservative to assume sewer pipes are a complete loss when flooded by a storm scenario or sea level rise given that they are underground, however, it is plausible that substantial impacts will be incurred if permanent flooding was to envelop sewer lines; therefore this assumption of permanent loss provides a useful indicator of the scale of potential direct financial losses to sewer assets.
Waterfront
Terminal & Bridgeway Promenade
14:
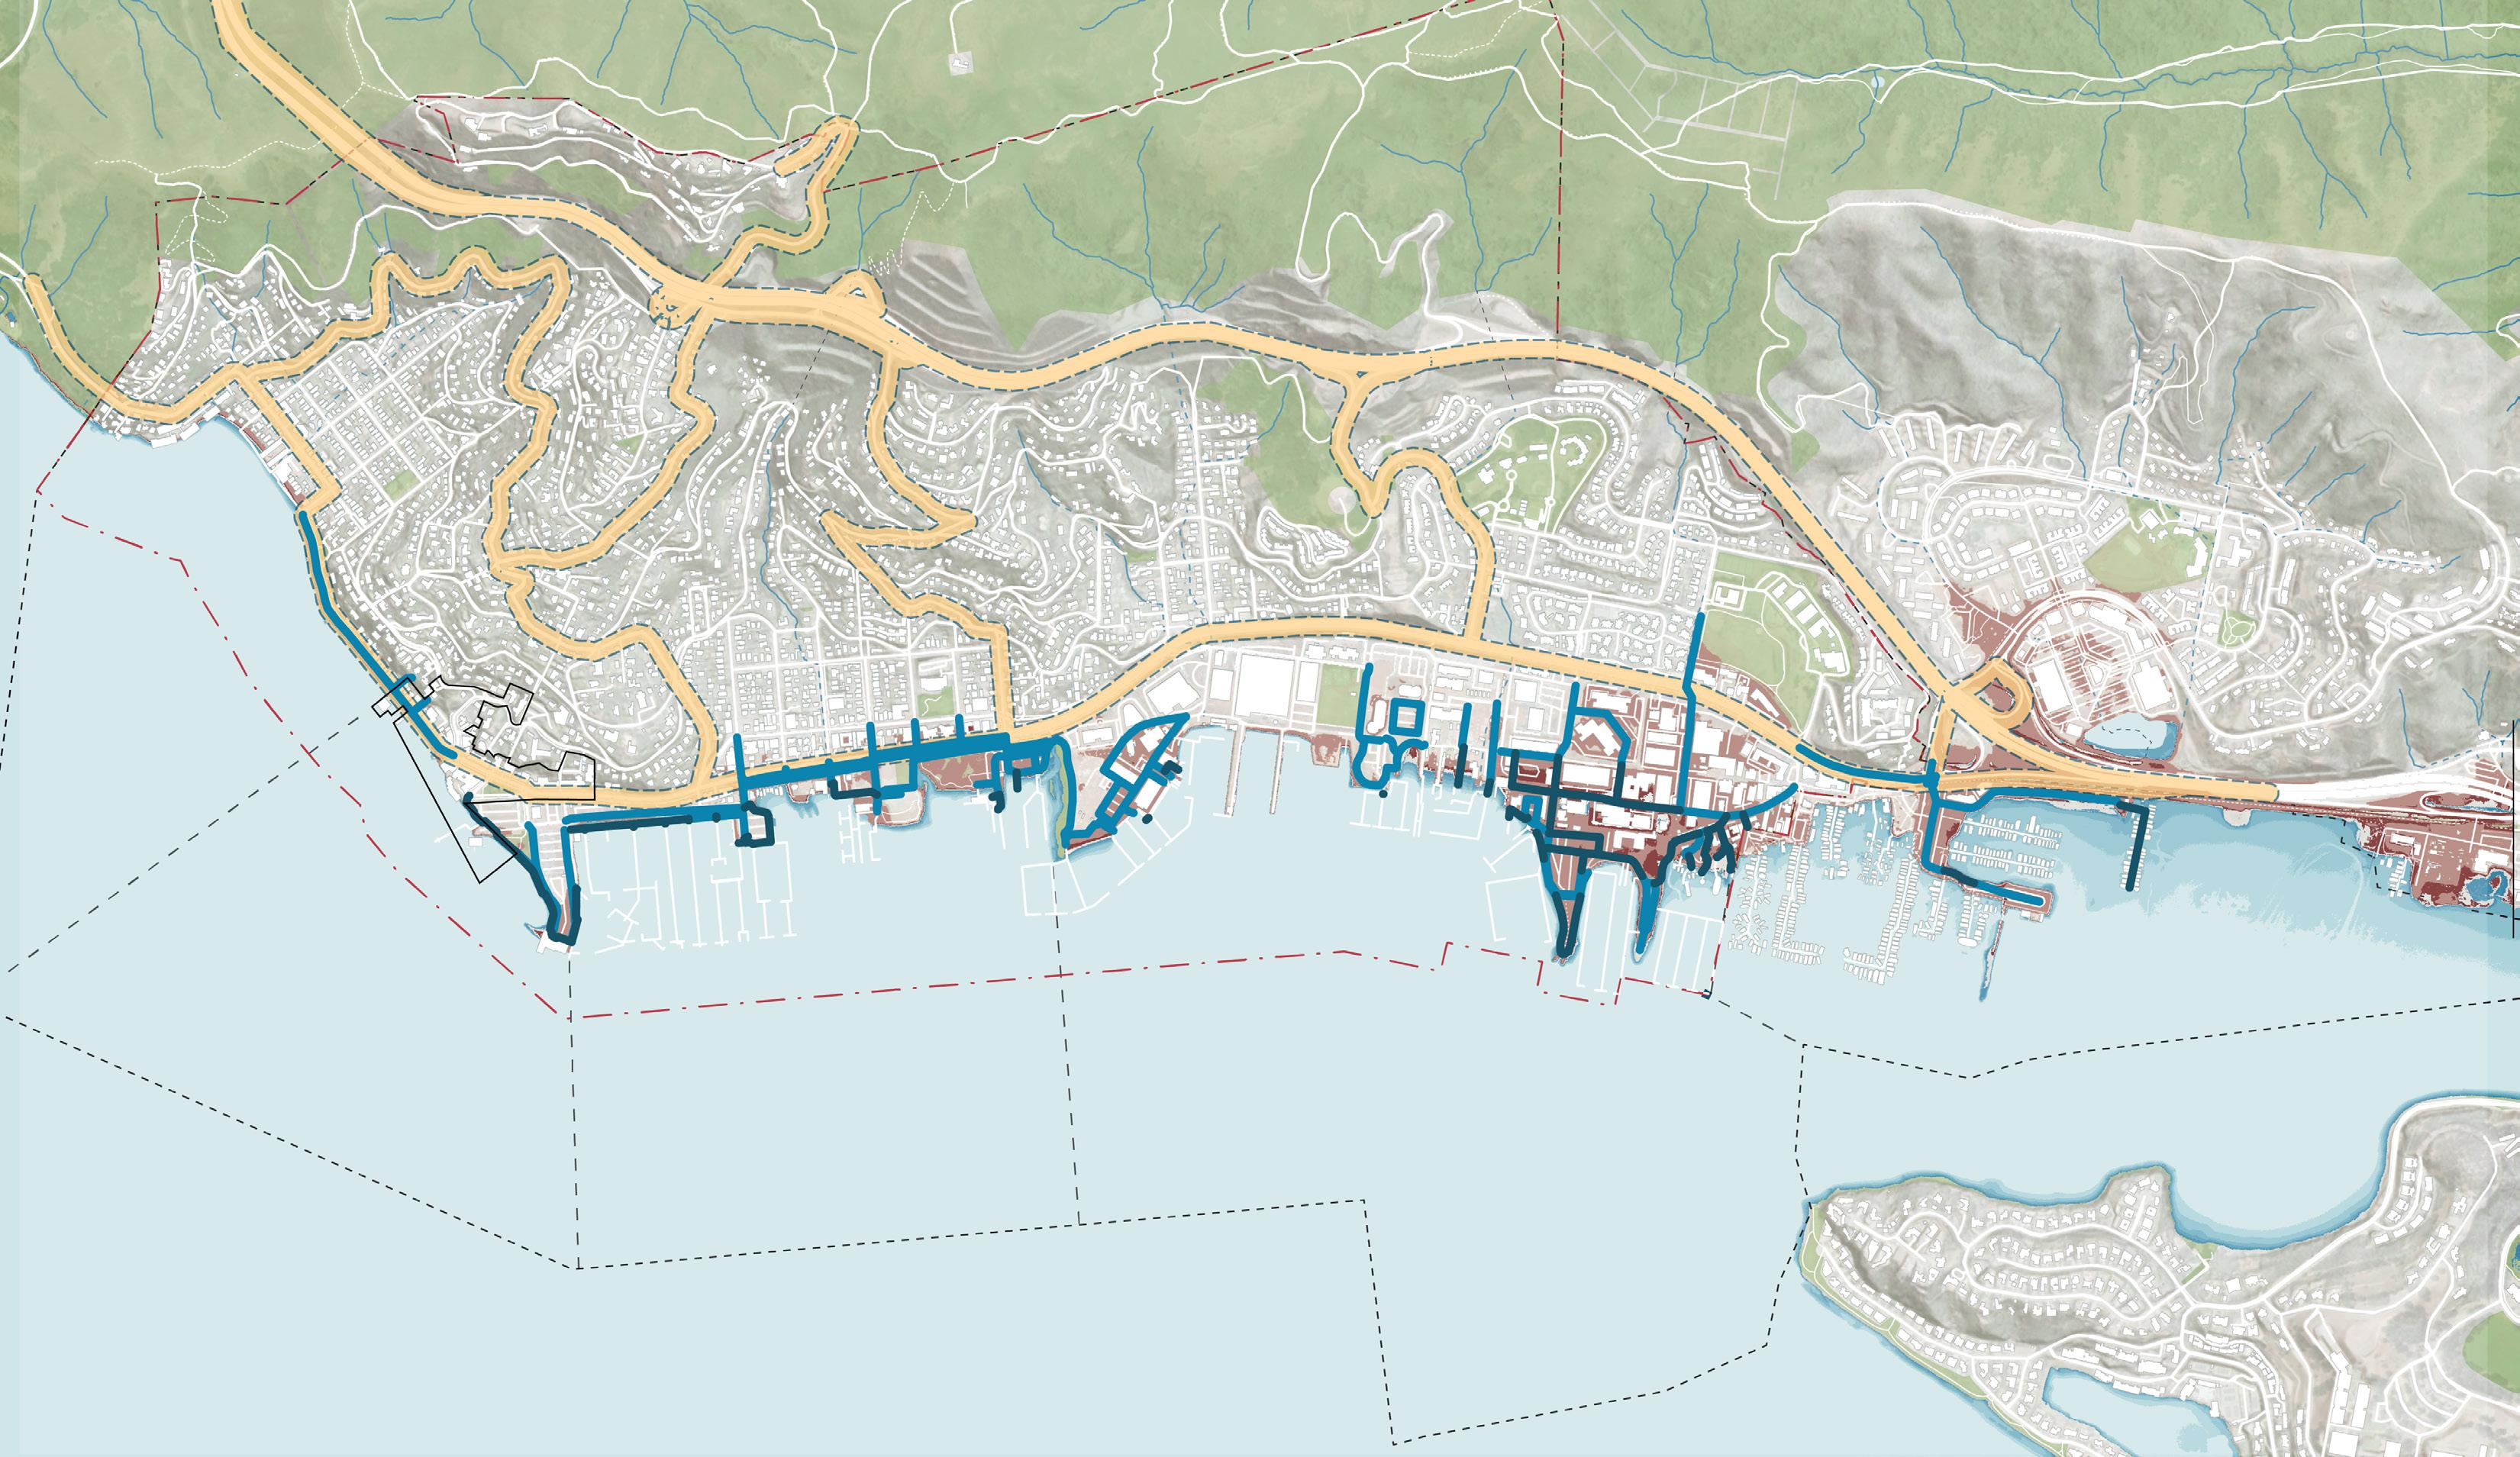
Map Sources: Pathways Climate Institute, Transportation Authority of Marin and ARUP
Map Author: WRT, 2024
**This map uses data created by TAM for the “Sea Level Rise Adaptation Planning For Marin County’s Transportation System”. Refer to the following figures 15-17 for a breakdown of impacted roads by scenario.
Base Map
Sausalito City Boundary Sphere of Influence Ferry Terminal Parks Bus Stops
Impacted Roads / Trails / Transit at various SLR Scenarios
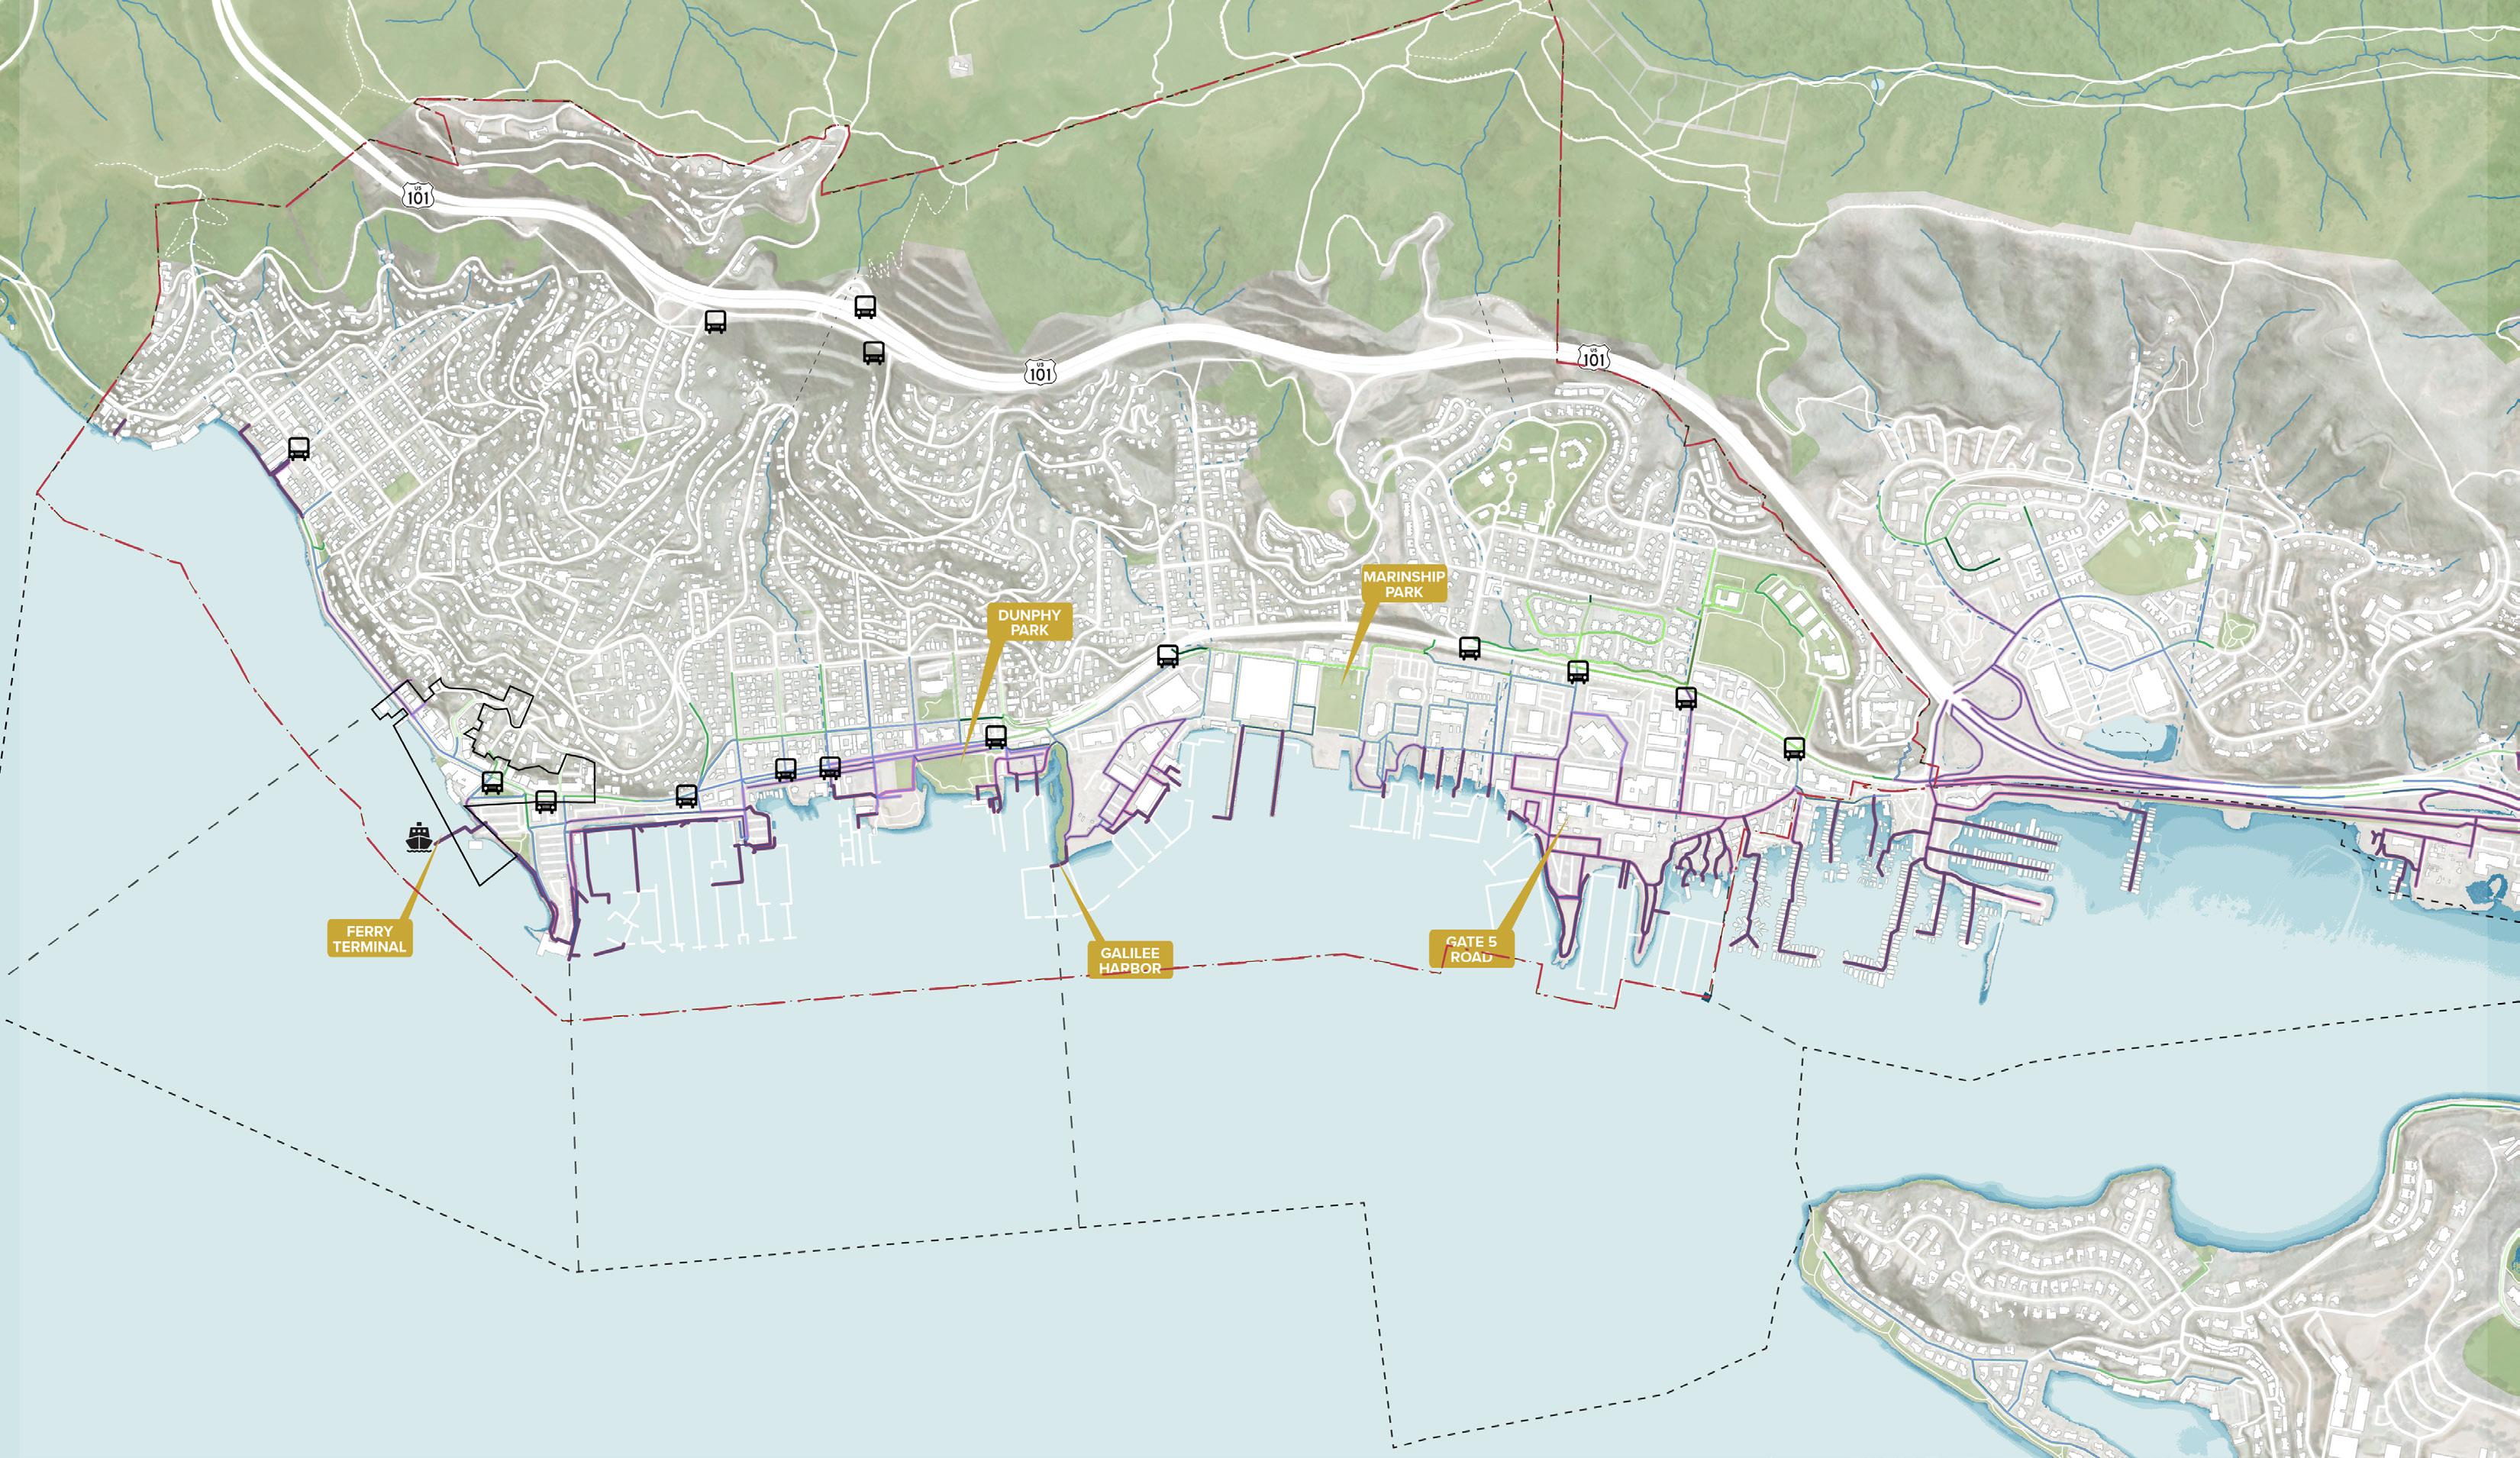
The map shows city transportation infrastructure, including road and transit network, and highlights flooding impacts to roads from storm-driven flooding, sea level rise, and groundwater rise. Although there will be impacts to sidewalks and bike lanes, they have not been highlighted as the intent of this study is to evaluate impacts to the road network and the transportation network’s ability to support evacuations.
For the three scenarios, the table summarizes the total impacts to the following components of the transportation network in Sausalito: roads, piers, bus routes, bus stops, and ferry terminal. Piers are designated as “fixed” or “floating” based on a desktop review.
For Scenario 1 and Scenario 3, the flooded area corresponds to the MHHW for that SLR scenario. For Scenario 2, the flooded area corresponds to the 100-yr storm surge under that SLR scenario.
The ferry terminal was flagged in all three scenarios given its location over the water. Eight (8) bus routes and 4.5mi of roads are anticipated to see flooding in the midcentury coastal storm (Scenario 2).
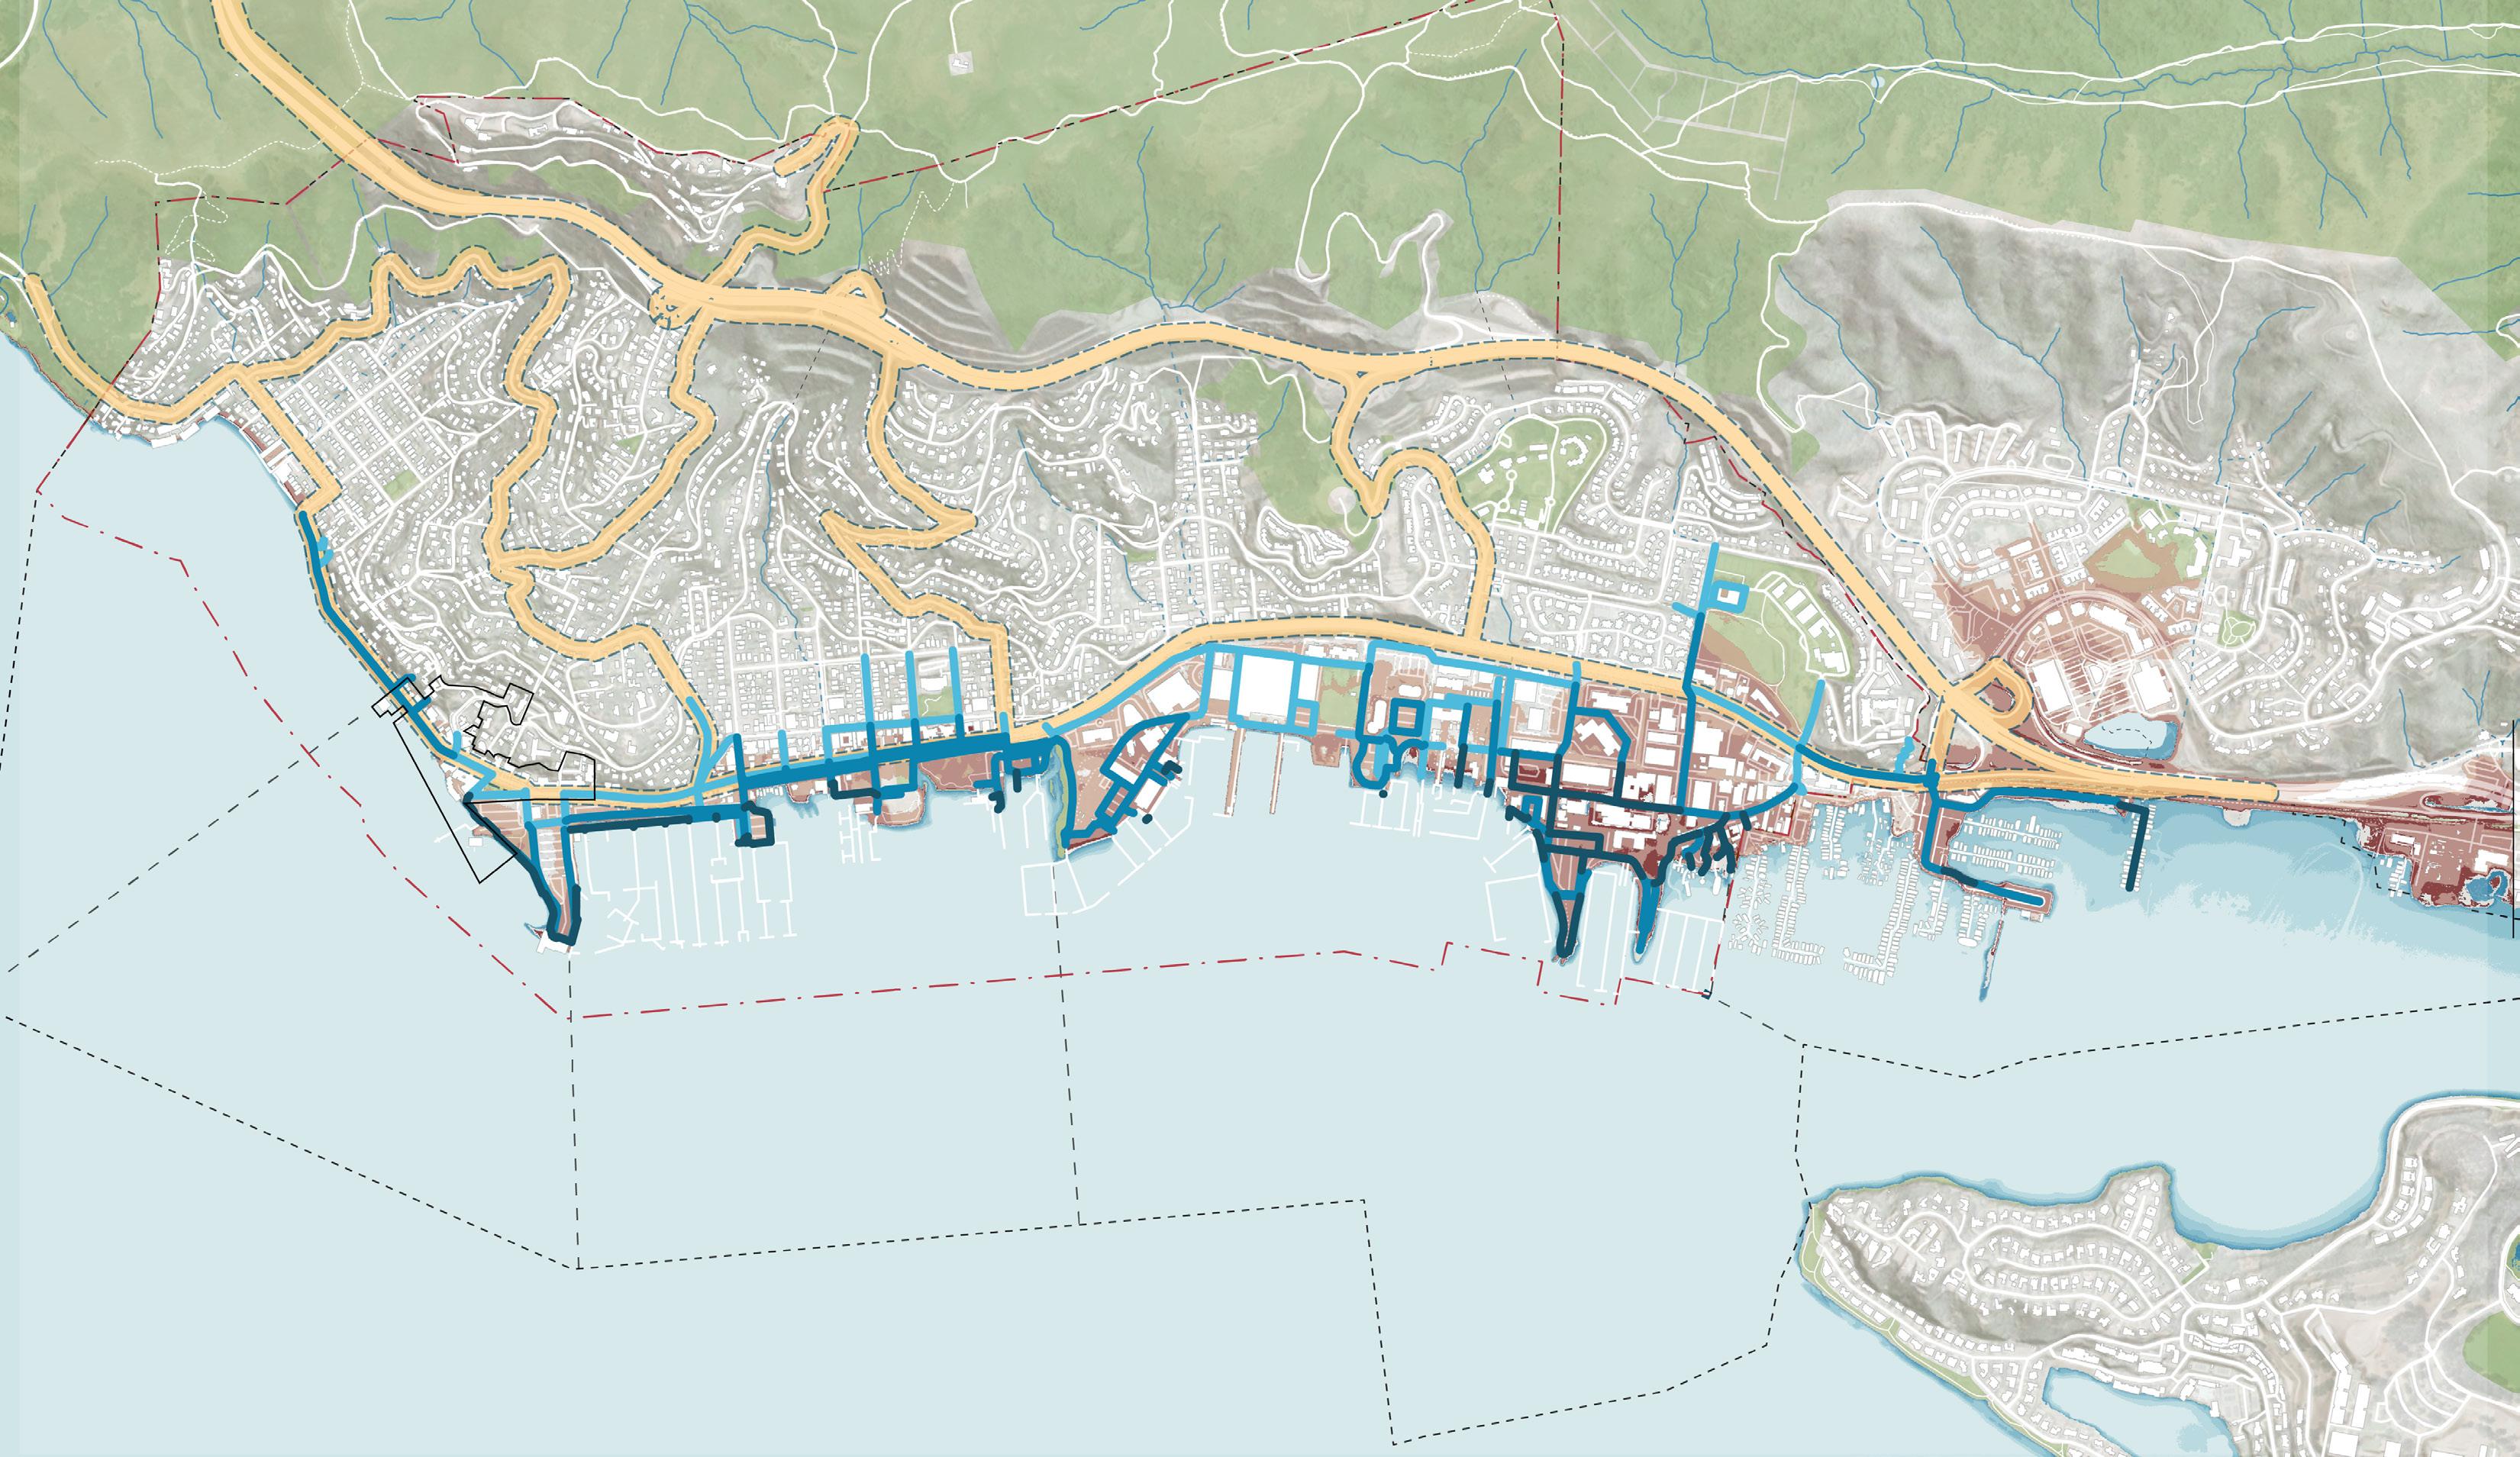
The map shows evacuation routes from Fire Safe Marin overlayed with the three project scenarios: (1) 2050 0.8’ SLR, (2) 2050 0.8’ SLR + 100-yr Storm, (3) 2100 3.1’ + 100-yr Storm.
Gate 5 Rd, Gate 6 Rd, and Gate 6 1/2 Pier have been called out on the map, showing inundation in all three scenarios.
The table shows the length of evacuation route located in the anticipated flooded area for each of the three project SLR scenarios.
The ferry terminal has been included as a critical asset for evacuation.
Feet have been rounded to the nearest hundred (100ft). Infrastructure outside of City boundaries has been excluded.
Impacts to low-lying sections of Bridgeway are expected near-term during storms and long-term during SLR. Bridgeway is central to Sausalito’s evacuation route network.
TABLe 7: Evacuation Routes Impacts
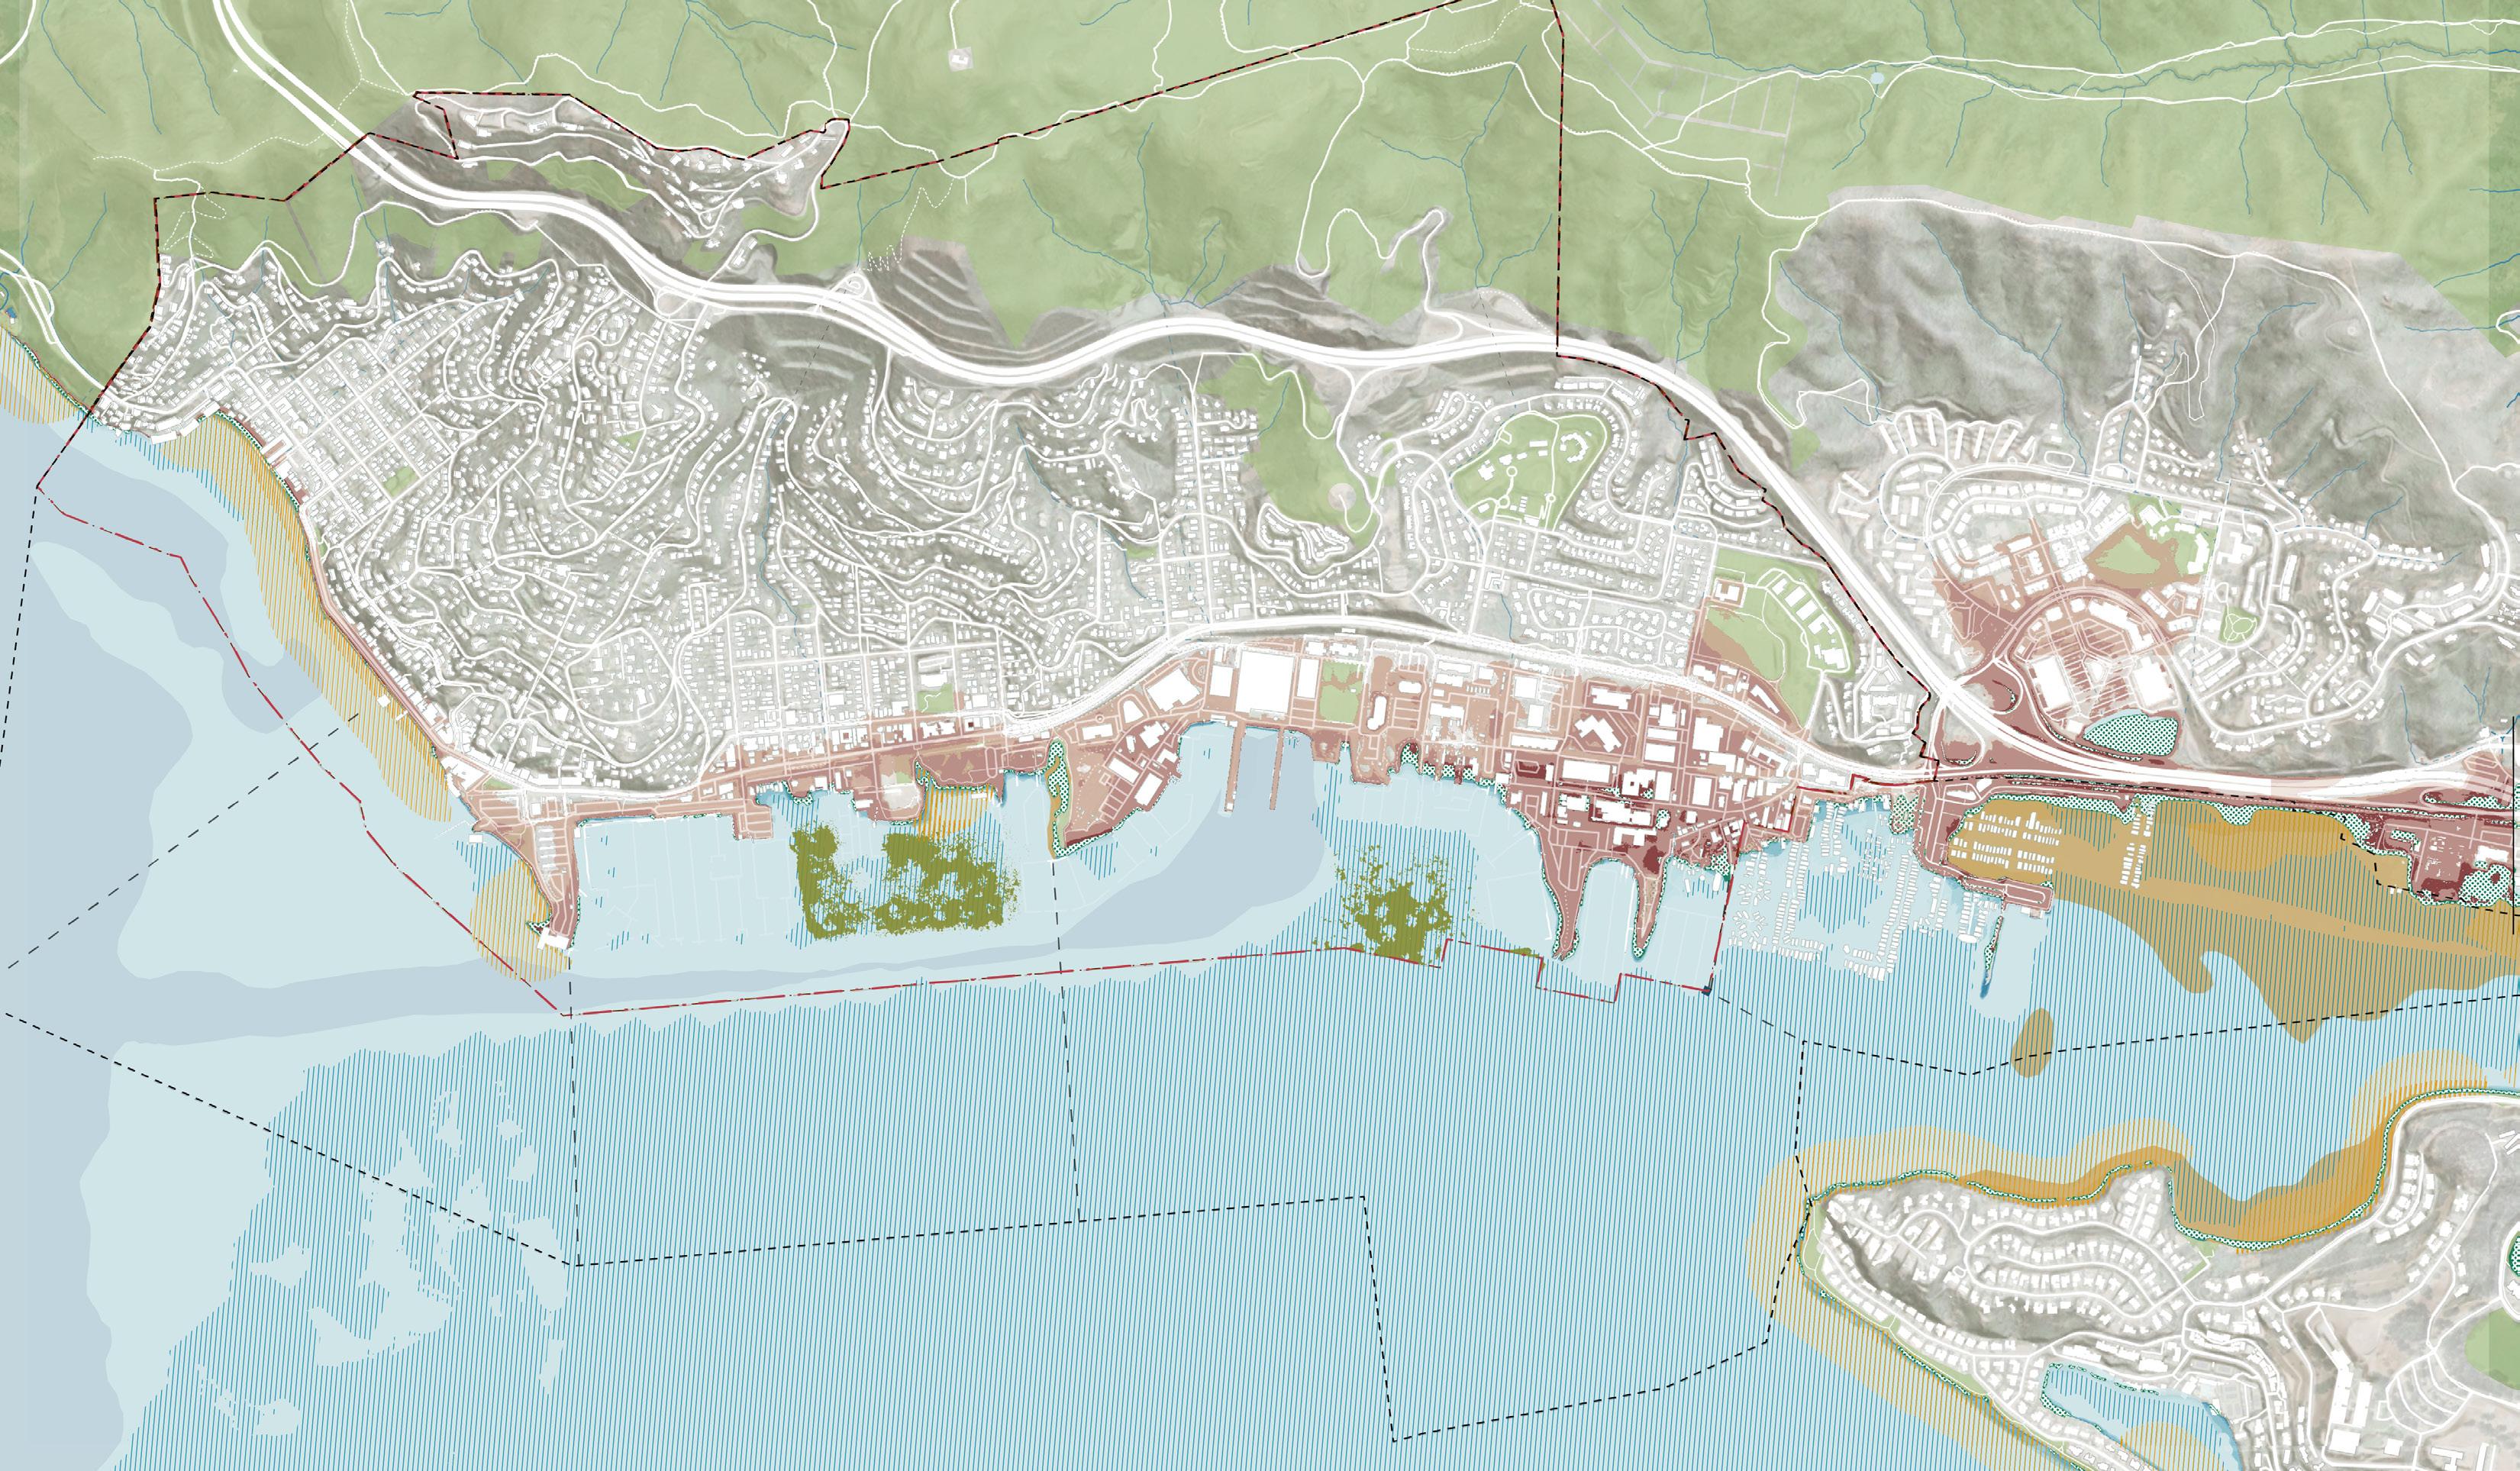
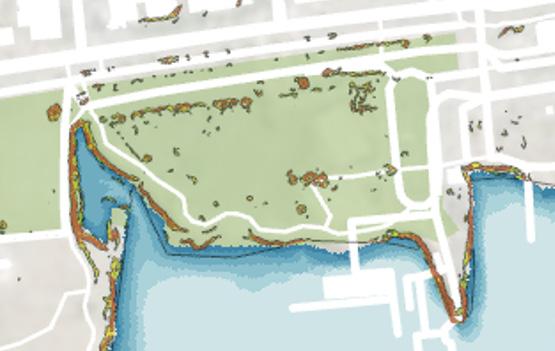
Figure 18:
Map Sources: BAARI, SFEI Adaptation Atlas, City of Sausalito, County of Marin
Map Author: WRT, 2024
Base Map
Existing Baylands Other Habitats


Southern Waterfront
Ferry Terminal & Bridgeway Promenade
New Town
Marinship
Floating Homes
Possible erosion and narrowing of Swede’s Beach.
Decrease of eelgrass patch offshore of Swede’s beach.
No change in tidal marsh (none present).
Decrease in eelgrass in the patch between Ferry Terminal and Spinnaker. Loss of narrow band of eelgrass along other parts of shoreline.
Existing low areas at Spinnaker point are increasingly inundated, with potential for sedimentation and establishment of marsh vegetation.
Patch of eelgrass between Pelican and Schoonmaker harbors increases in shallower areas and decreases in deeper areas.
Marsh persists near Galilee Harbor.
Small increases in eelgrass in the shallowest areas.
Small pockets of existing marsh persist.
Existing low areas on both sides of Gate 5 Road and Varda Landing area are increasingly inundated, with potential for sedimentation and establishment of marsh vegetation.
Increased eelgrass in the shallows.
Small pockets of existing marsh persist.
Existing low areas at Van Damme Park and along part of Gate 6 Road are increasingly inundated and may convert to marsh.
2 3
Likely erosion and narrowing of Swede’s beach.
Decrease in eelgrass.
No change in tidal marsh (none present).
Substantial decrease in eelgrass.
Existing low areas at Spinnaker point and Gabrielson Park are increasingly inundated, with potential for sedimentation and establishment of marsh vegetation, creating marsh and mudflat.
Substantial decrease in eelgrass; some increases along the shallow shore.
Loss of existing marsh near Galilee Harbor (conversion to mudflat).
In the absence of other adaptation, potential for marsh formation in sheltered areas, such as Dunphy Park.
Decrease in eelgrass (incomplete data).
Loss of existing marsh (conversion to mudflat).
Existing low areas on both sides of Gate 5 Road, Varda Landing area, Marina Plaza Harbor area, and Liberty Ship Way area are increasingly inundated, with potential for sedimentation and establishment of marsh vegetation, creating marsh and mudflat.
Increases in eelgrass nearshore, decreases slightly offshore.
Loss of existing marsh (conversion to mudflat).
Existing low areas at Van Damme Park may convert to marsh and mudflat. Low areas along Gate 6 Road and Gate 6-1/2 Road may convert to marsh.
Increased likelihood of erosion of Swede’s beach.
Larger decrease in eelgrass.
No change in tidal marsh (none present).
Larger decrease in eelgrass.
Existing low areas bayward of Bridgeway are increasingly inundated, with potential for sedimentation and establishment of marsh vegetation creating marsh and mudflat.
Larger decrease in eelgrass.
Loss of existing marsh near Galilee Harbor (conversion to mudflat).
In the absence of other adaptation, potential for areas on both sides of Bridgeway to convert to marsh and mudflat.
Larger decrease in eelgrass.
Loss of existing marsh (conversion to mudflat).
Existing low areas bayward of Gate 5 Road/ Road 3/Liberty Ship Way area may convert to mudflat. Extensive low areas between Gate 5 Road and Bridgeway are increasingly inundated and may convert to marsh.
Eelgrass data not available.
Loss of existing marsh (conversion to mudflat).
Existing low areas that are marsh in the 3.1 ft of SLR scenario convert to mudflat. Low areas near Mike’s Bikes may convert to marsh.

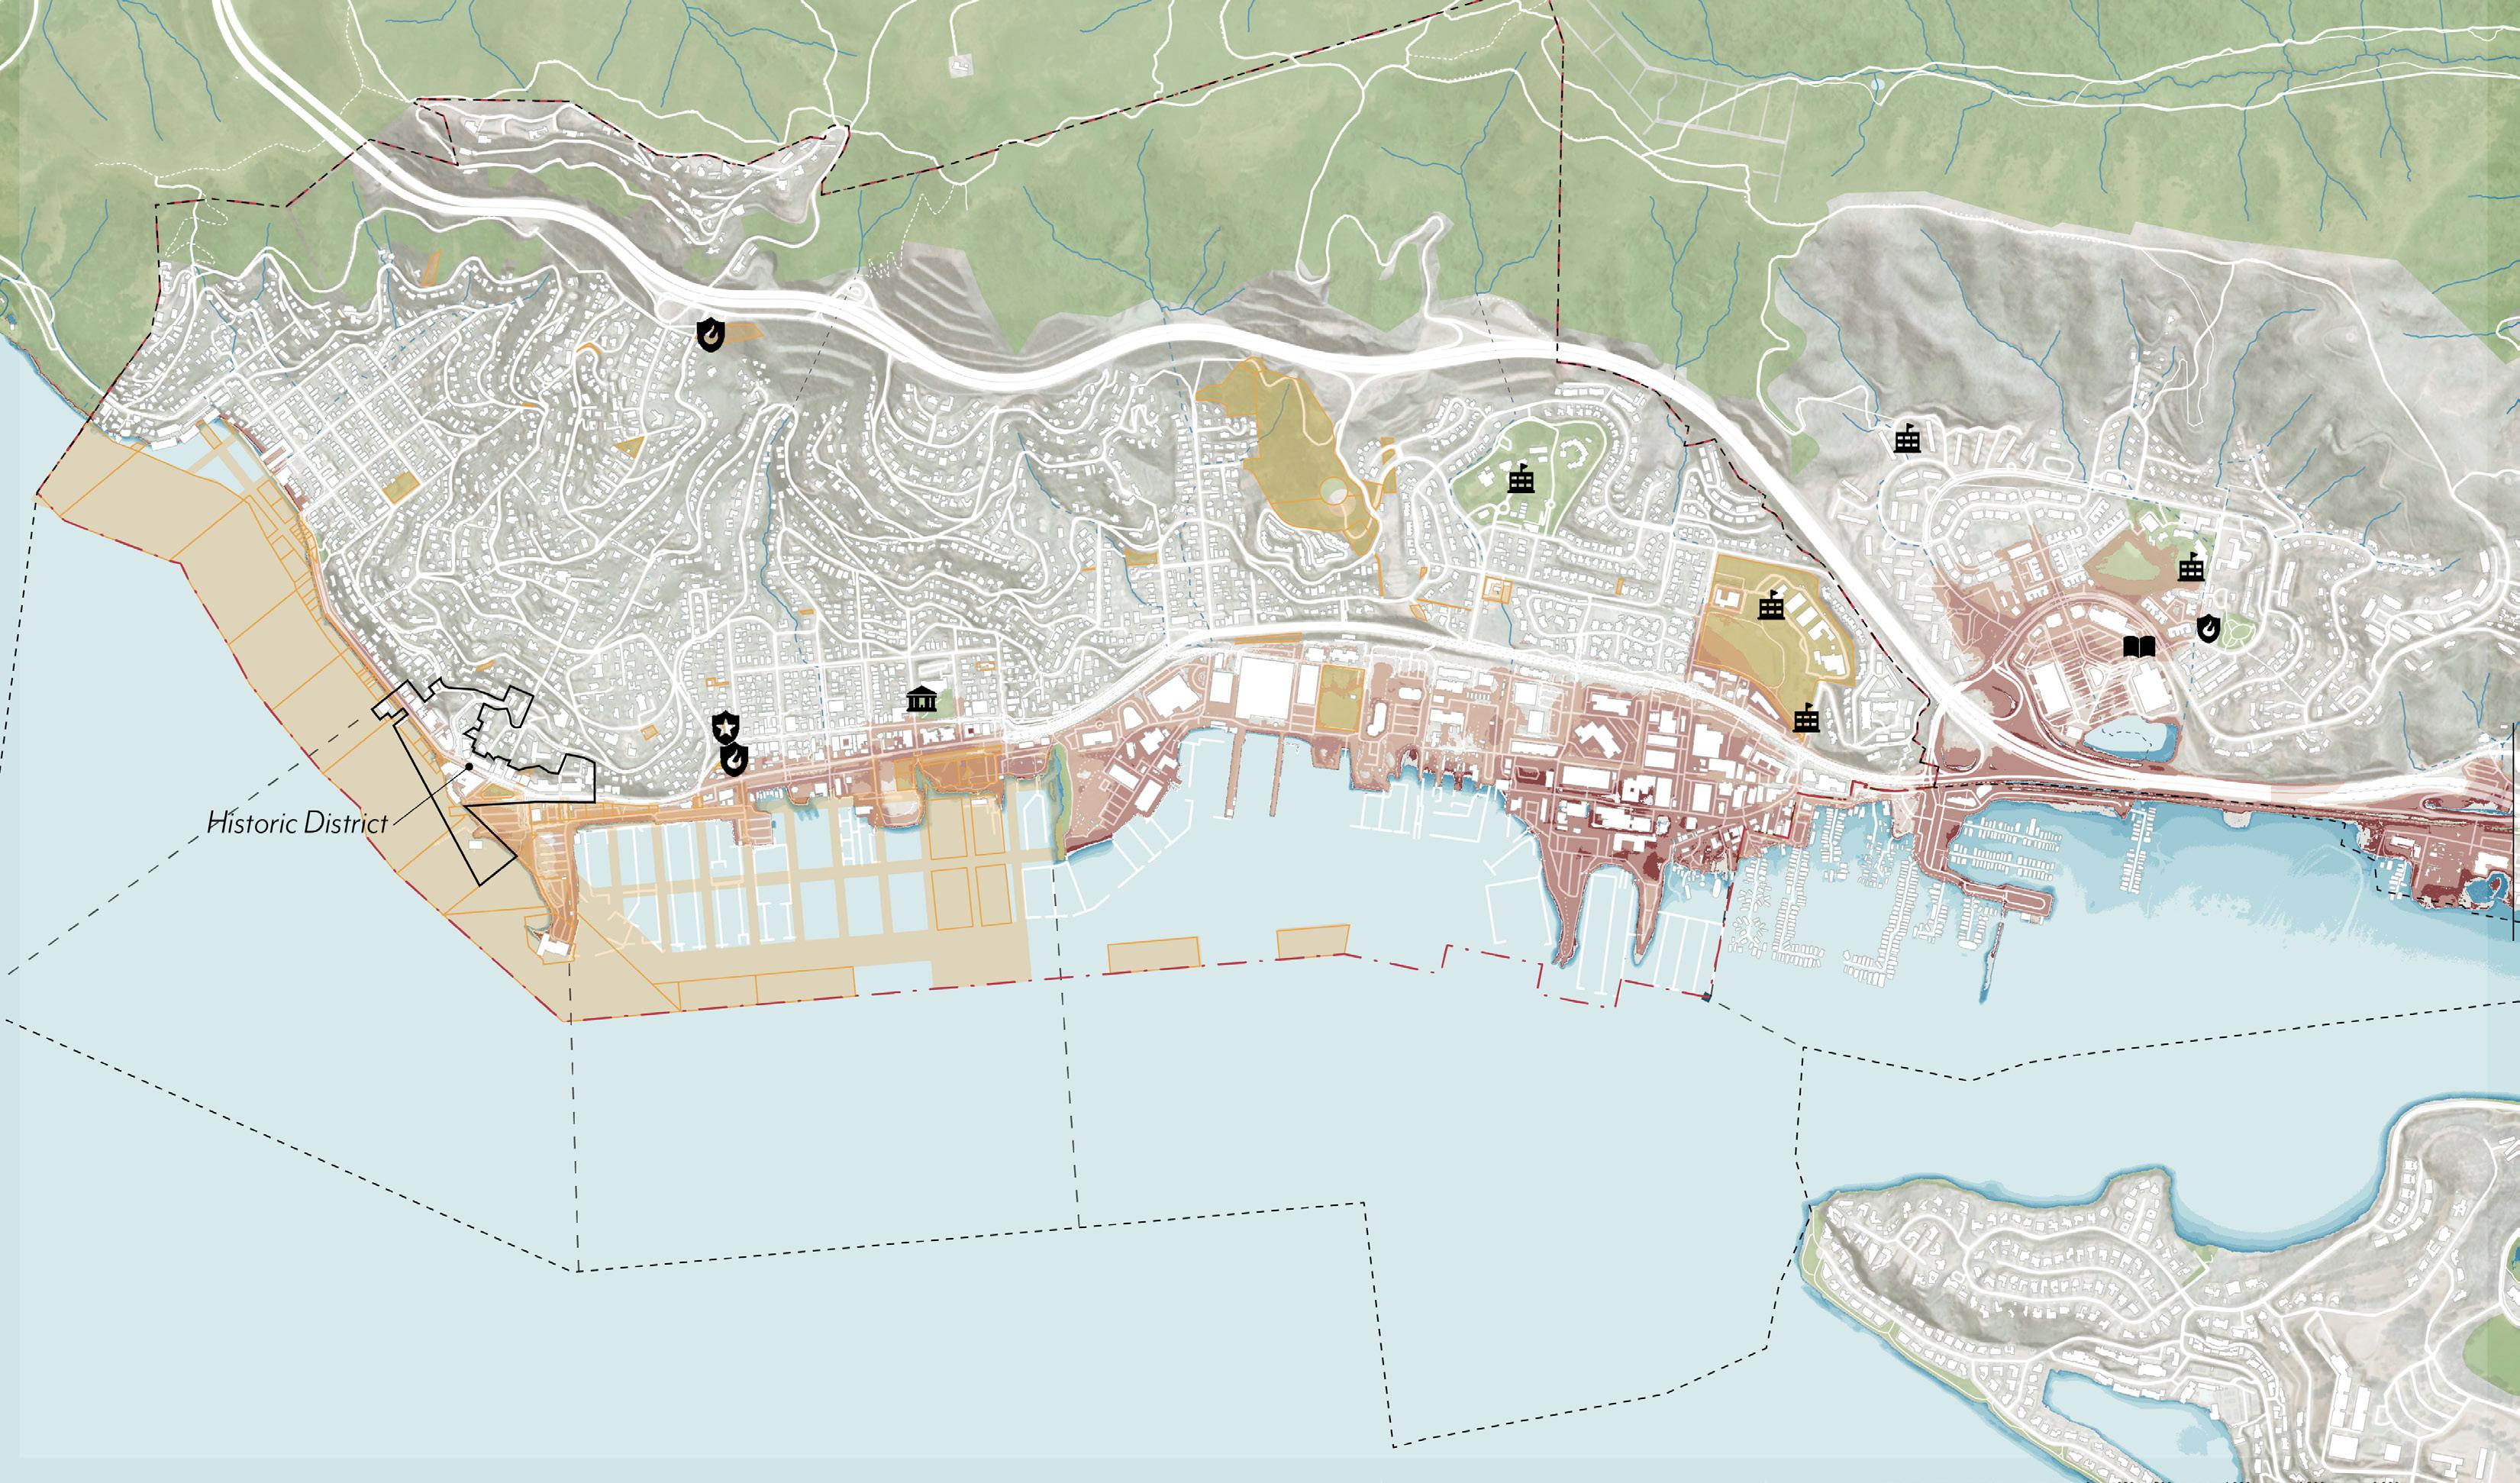


Buildings in the Historic District: 16% in the Ferry Terminal and Bridgeway Promenade and 13% in Southern Waterfront are impacted.
Community Facilities List
• Fire stations
• Law enforcement facilities • Libraries
• Municipal buildings
• Schools
• Wastewater treatment plant
None of the listed community facilities are located in the anticipated flooded area for each of the three project SLR scenarios.
Buildings in the Historic District: 82% in the Ferry Terminal and Bridgeway Promenade and 82% in Southern Waterfront are impacted.
The map shows community facilities, listed on this page, and flood extents from the three project scenarios: (1) 2050 0.8’ SLR, (2) 2050 0.8’ SLR + 100-yr Storm, (3) 2100 3.1’ + 100-yr Storm.
For each scenario, about half of the inundated area is public or City-owned land, labeled as Exempt on the following spread.
Infrastructure outside of City boundaries has been excluded.
Granted Public Trust Lands are sovereign lands, often tidelands and submerged lands, held in trust by the State of California and granted to local entities such as cities and counties for specific purposes and uses. These lands while managed by the local entity must be used for public benefit and consistent with the Public Trust Doctrine.
Sea Level Rise Scenarios + Storm Surge (100-Yr)
Impacted Areas
Map Sources: 2021 Sausalito General Plan Update
Map Author: City of Sausalito, modified by WRT, 2024
Impacted Buildings
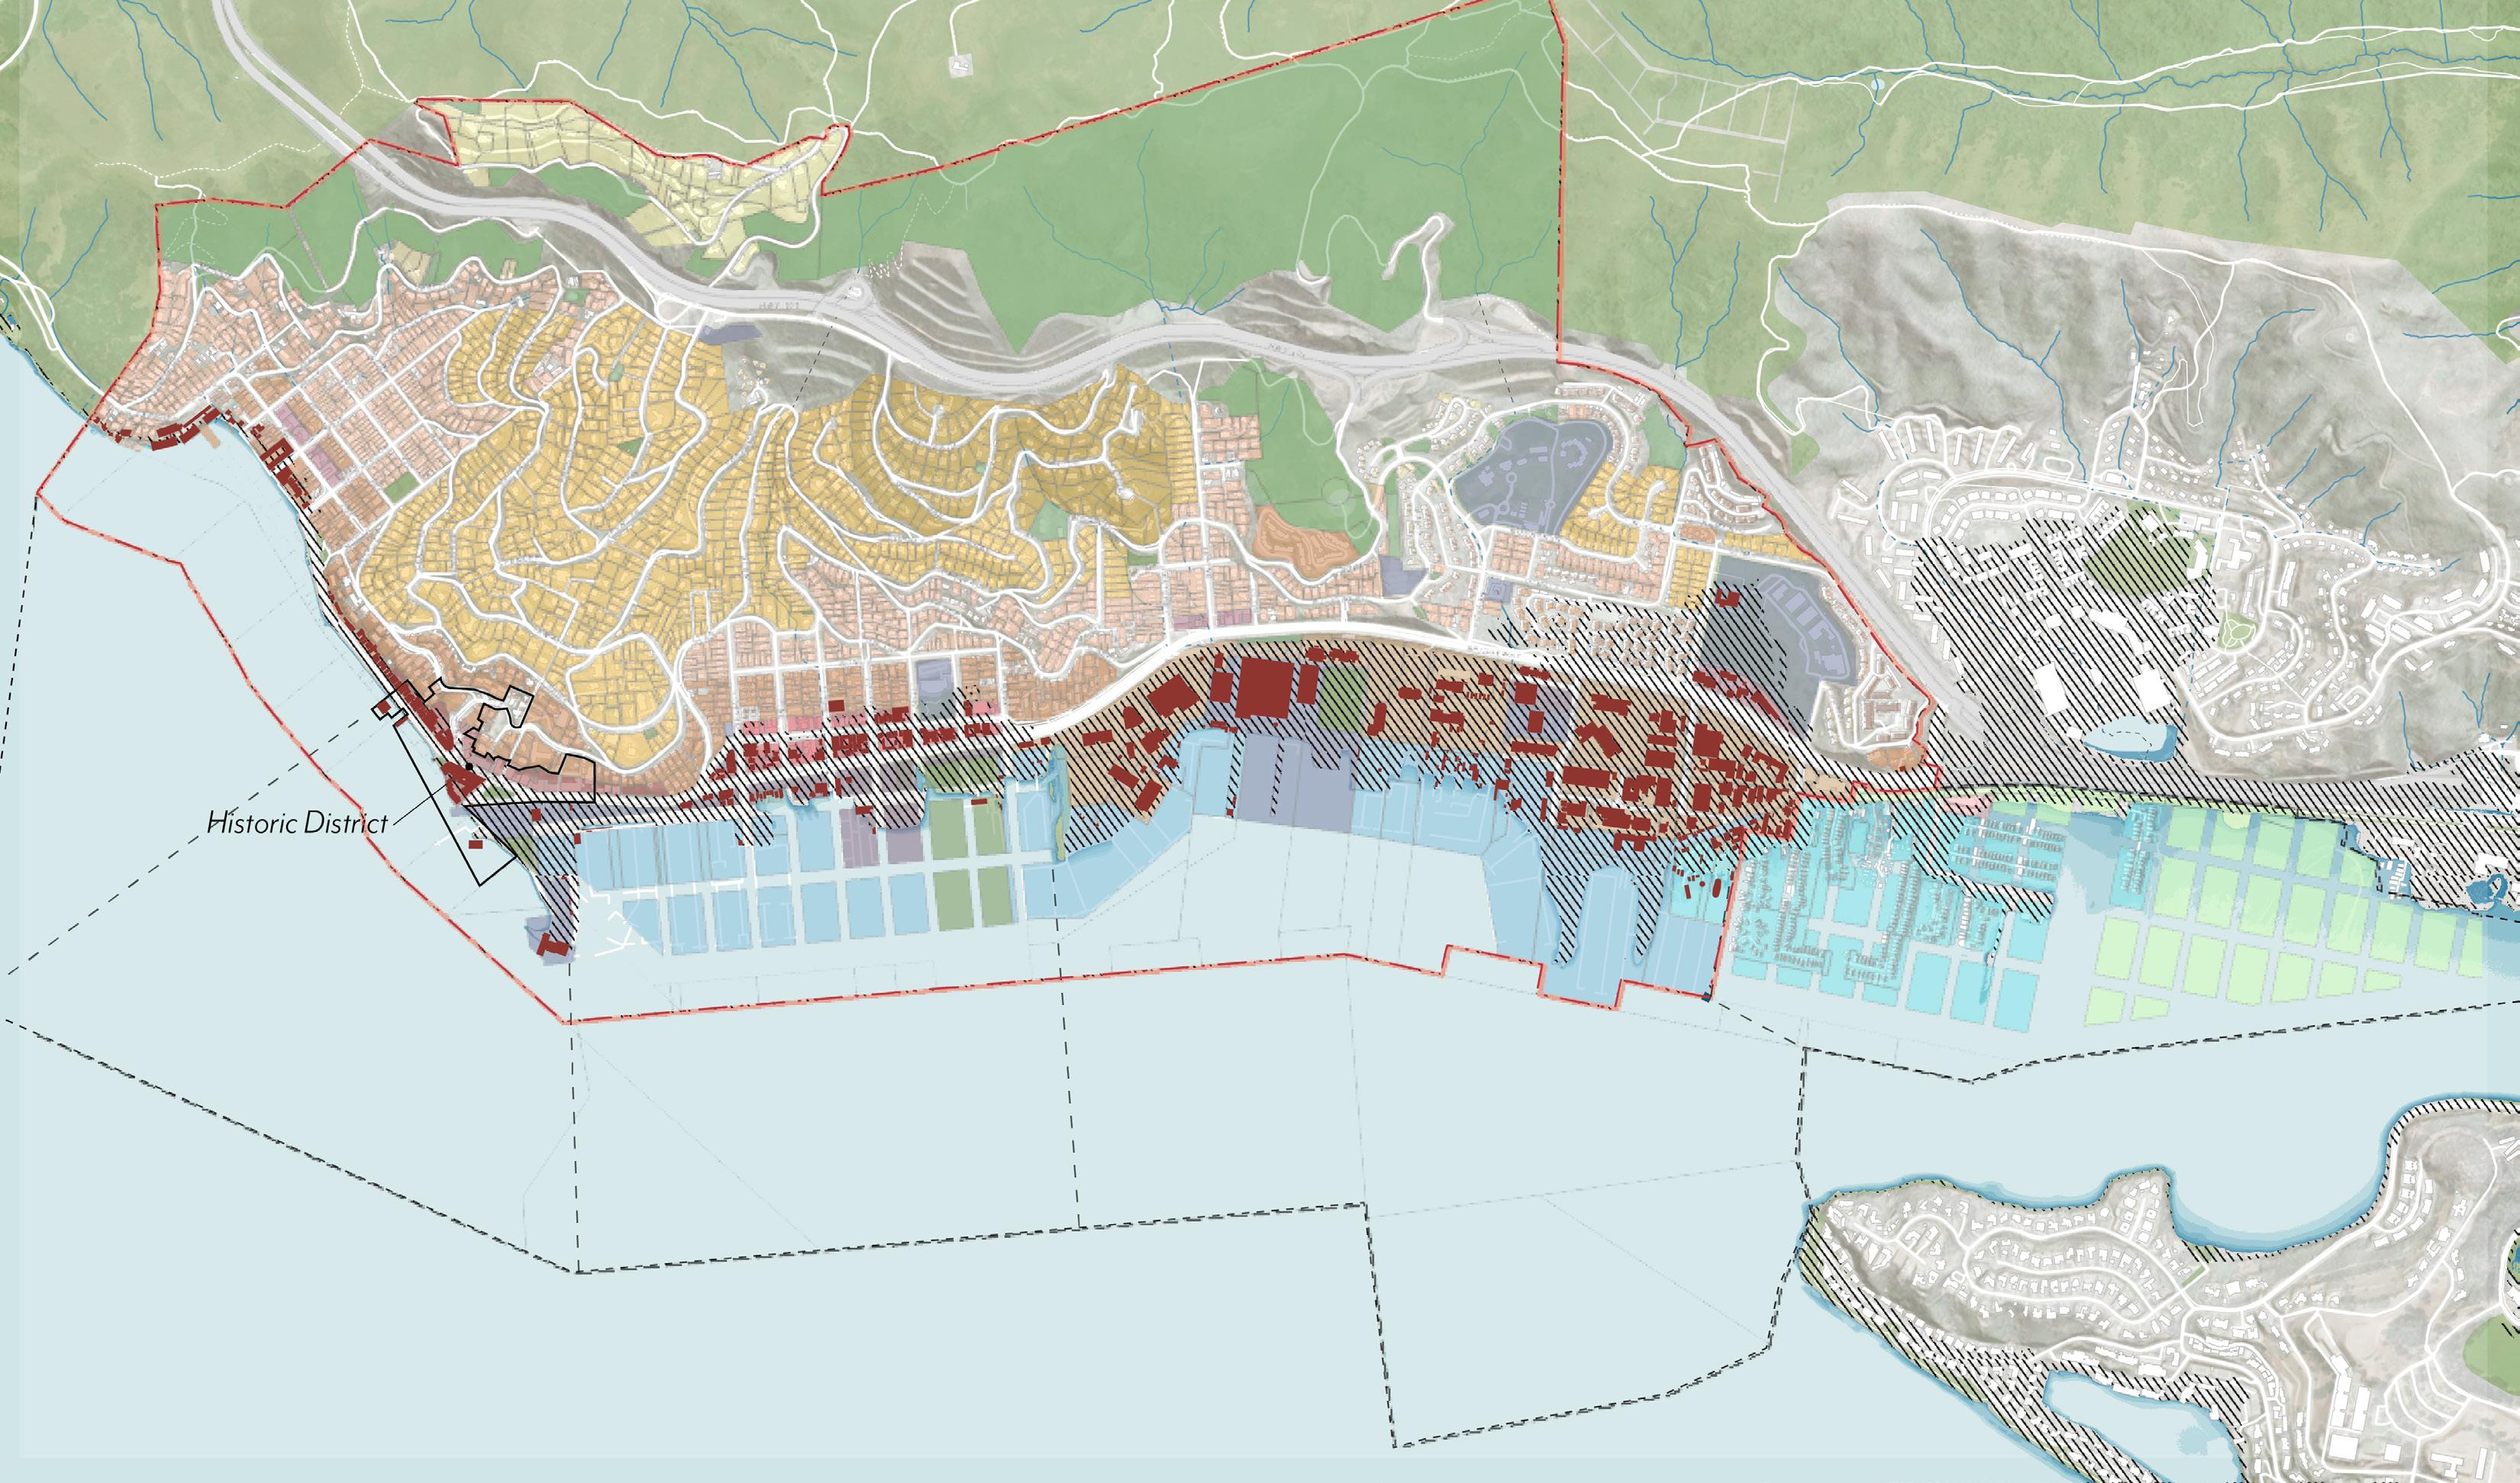
TABLe 10: Land Use Impacts
The map shows land use designations from the 2021 Sausalito General Plan Update overlaid with building footprints and hatched areas located in the anticipated flooded area for any of the three project SLR scenarios.
The table includes a column for Present Day to summarize land use and buildings located in or over the bay. Approximately 25% of land use area in Sausalito is located in the present-day tidal zone, as seen on the map and quantified in the table. These areas present an adaptation opportunity.
Infrastructure outside of City boundaries has been excluded.
Sausalito shows significant vulnerability to sea level rise and coastal flooding given its shoreline infrastructure, including roads, buildings, and utilities. To quantify some of the impacts in terms of dollars, a rough order of magnitude cost exercise was conducted to estimate the losses of impacted infrastructure. There is potential for nature-based solutions helping to minimize impacts of sea level rise over time. This exercise estimates the cost of taking no action, providing a powerful picture of what’s at stake under future sea level rise.
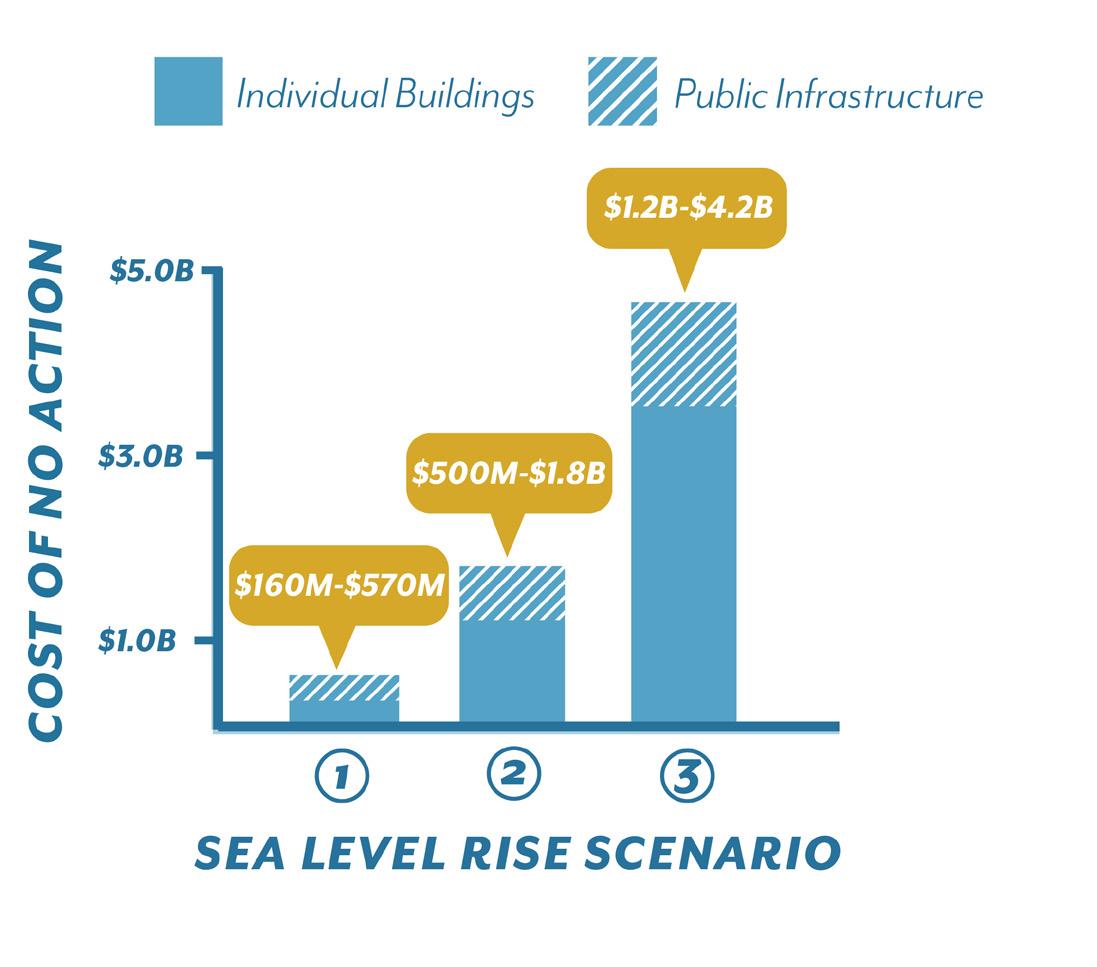
By mid-century, under about 10” (0.8ft) of SLR, significant disruption and damage is anticipated if no mitigation measures are implemented. As estimated in the cost exercise, $160M-$570M worth of assets will be exposed to tidal flooding throughout the year within the next two to three decades. This cost does not account for wider economic impacts, underestimating the financial impact of sea level rise alone, and excludes impacts on the community and environment.
During a significant 100-yr storm in this same time frame (middle of the century), the losses may exceed one billion dollars ($1B) from physical damage alone, assuming that all flooded assets would be considered total losses, as might occur in a major flood when they are eventually exposed to daily tidal
flooding under 4.3ft of SLR (Scenario 2 in this study). Under this scenario, approximately 1,500ft of evacuation route (i.e., Bridgeway) would be flooded in low-lying parts of Sausalito and over 200 buildings inundated, reflecting the costs to both the public and private sectors in the city.
From this evaluation, hundreds of millions of dollars of Sausalito’s physical infrastructure is exposed to mid-century SLR and at risk of being lost. Buildings and shared infrastructure (e.g., roads, utilities, etc.) contribute about equally to the overall dollar amount. Under higher water levels, attributed to mid-century storms or latecentury SLR, the total dollars estimate exceeds $1B and the proportion attributed to buildings goes up, meaning that public and private buildings contribute more to potential loss than roads and utilities. This tipping point around 4-5ft of SLR is where the cost of no action increases from hundreds of millions to several billion.
Sausalito has an opportunity to intervene before these costs are felt. Adaptation strategies are evaluated in the following sections from a collective action approach by the City, and explores their potential costs and impacts to the community. This work sets the foundation for the implementation plan, however does not mean individual actions by property owners will not be necessary to adapt to maintain access, and business opportunities.
Community input was utilized to generate project goals and design criteria. Comments gathered from workshops 1 and 2 were categorized by topic area: working waterfront and economic vitality, ecological opportunities, maritime character and connection to the shoreline, arts and culture, and the cost/benefit of adaptation.
These comments informed the creation of project goals that express how these various topic areas can be addressed. These goals shaped the creation of 8 design criteria to evaluate future project proposals.
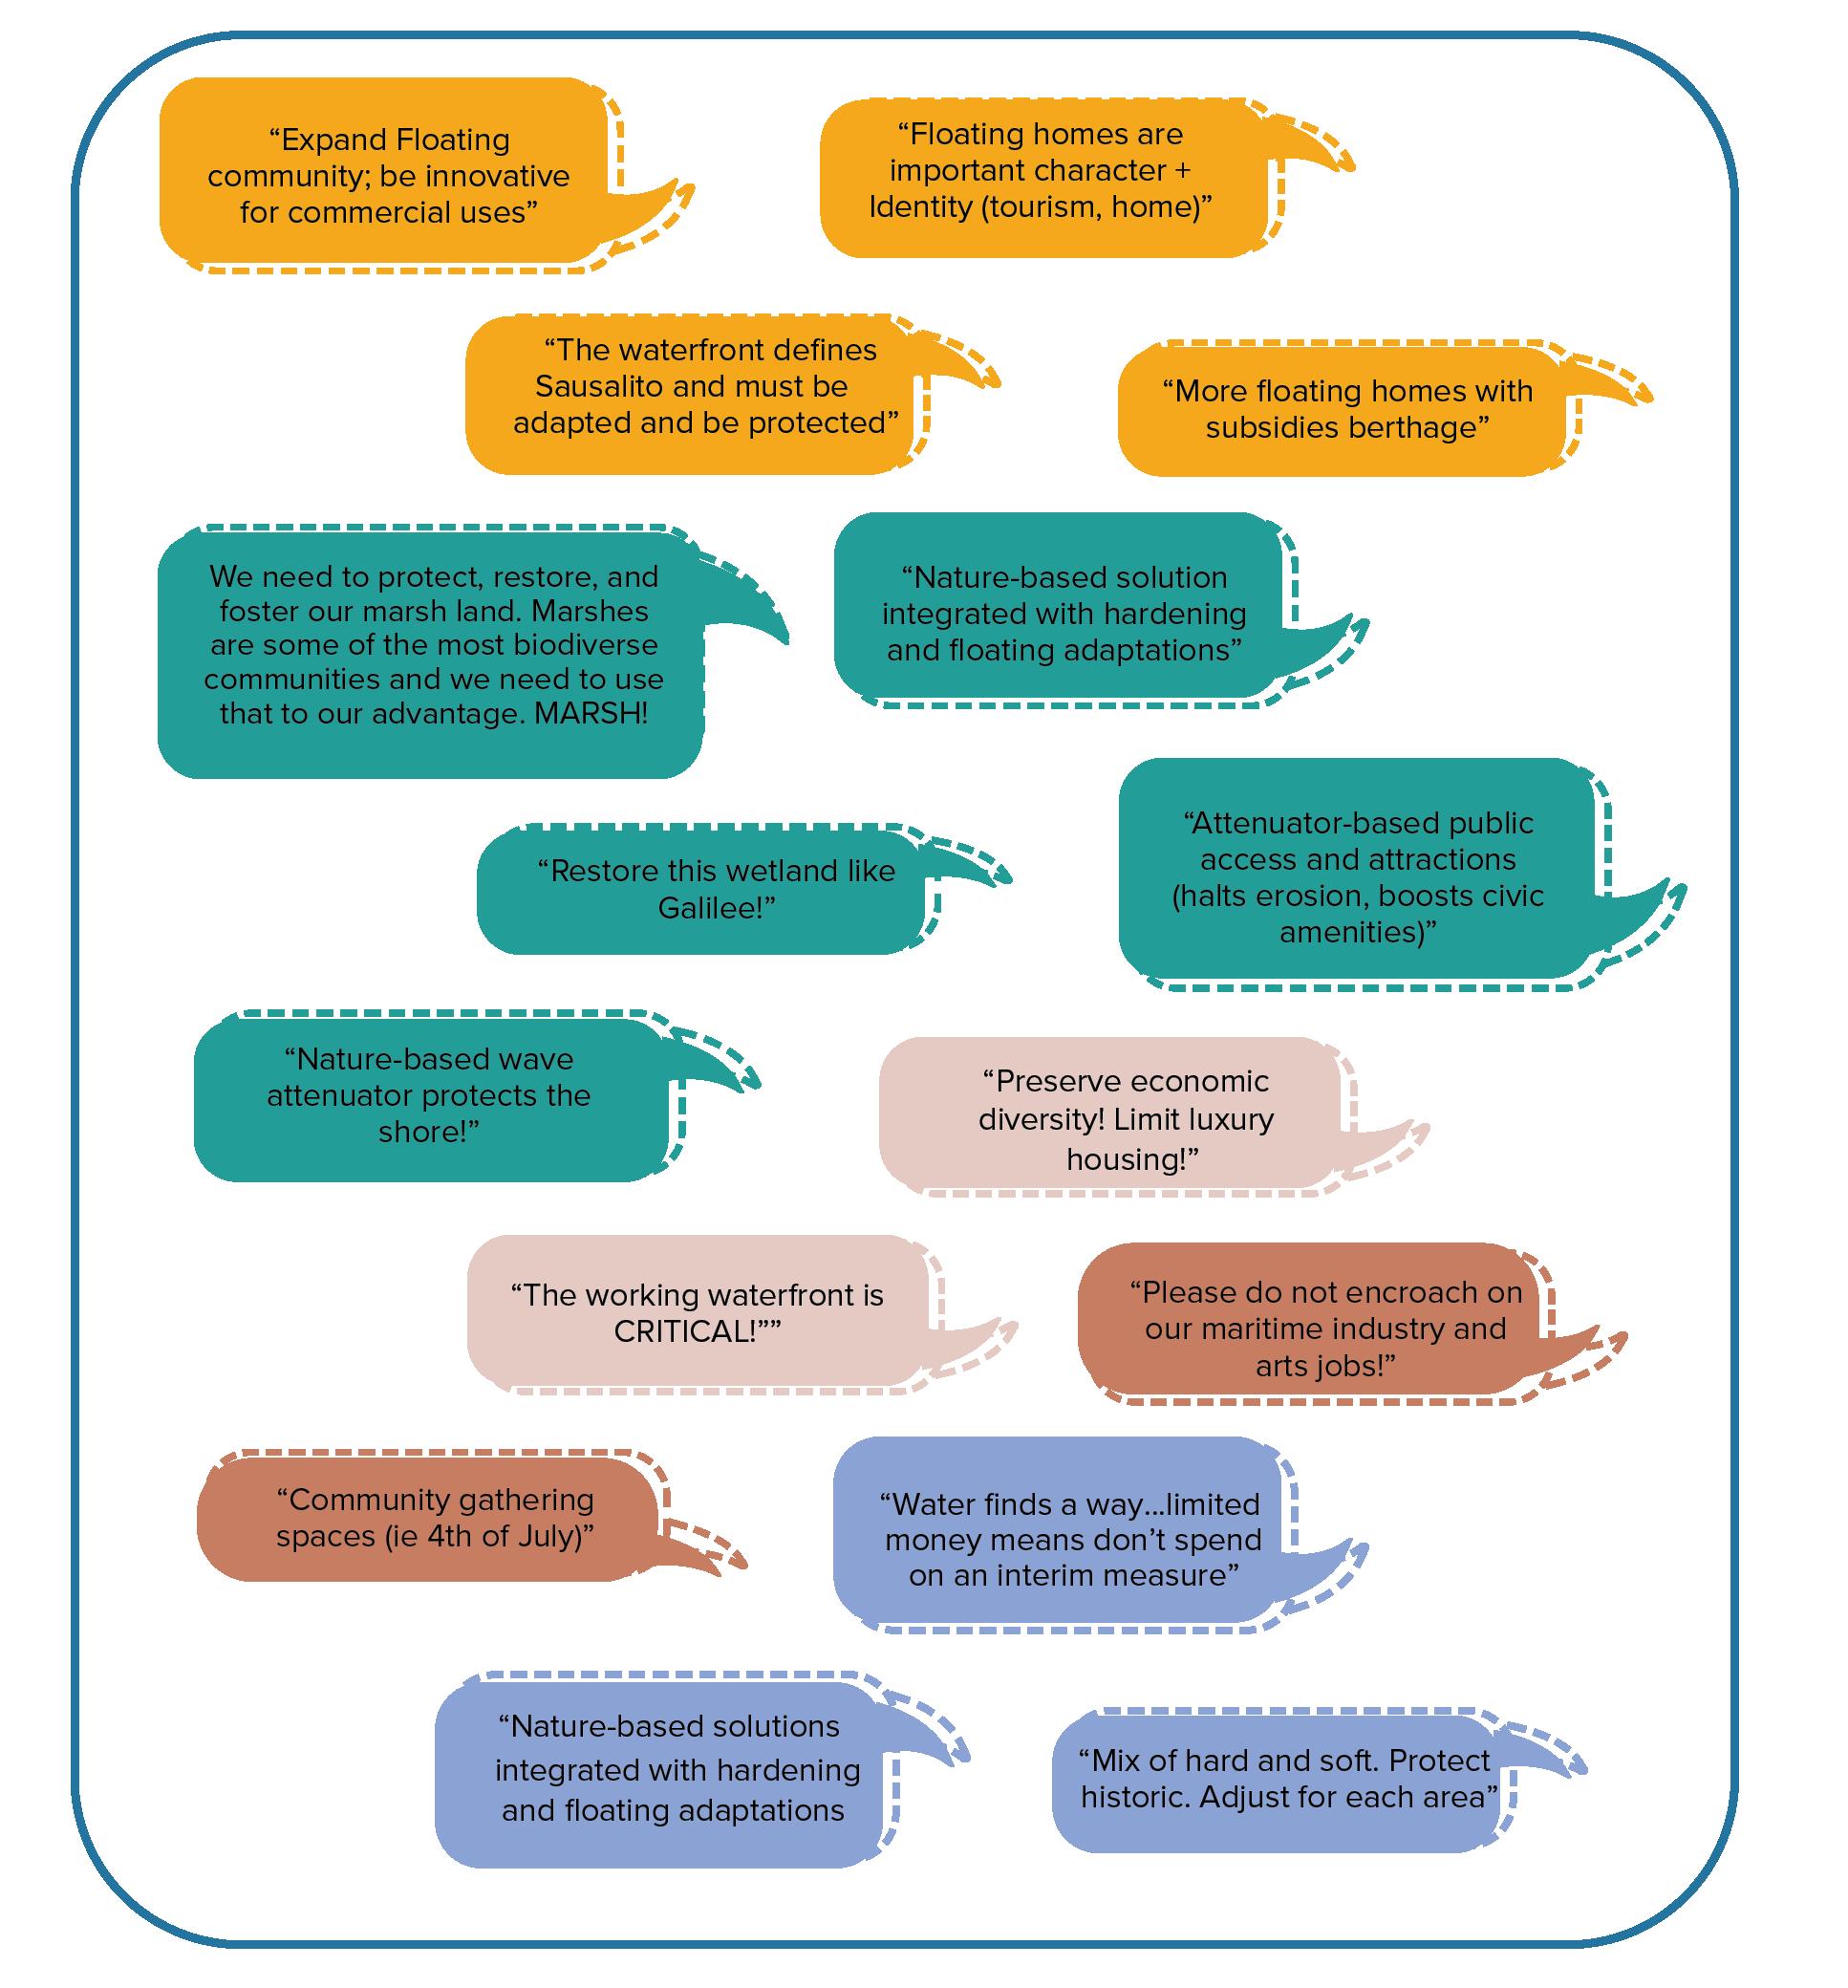
This section captures what we learned from various stakeholder conversations, and how we applied the knowledge to forming goals, design criteria, and categories of evaluation. This process ensures that the adaptation alternatives are reflective and representative of the community priorities and the unique qualities of Sausalito.
Throughout our community engagement process, a number of recurring themes emerged. Overall, there is clear consensus that the city is ready to move forward with shoreline adaptation planning. Community members emphasized the importance of ensuring that future strategies align closely with Sausalito’s unique character— preserving its maritime identity, smalltown feel, and public access to the Bay. There is also strong interest in exploring innovative solutions, particularly floating and amphibious approaches that embrace the city’s relationship with the water. At the same time, there are ongoing concerns about the vulnerability of key infrastructure— especially along Bridgeway—and a shared recognition that near-term needs must not be overlooked. Specific priorities include addressing flap gate upgrades near Gate 5, and improving monitoring of land subsidence and groundwater rise in critical areas.
Through open dialogue and design exploration in workshop 1 and 2, community members highlighted ideas such as:
• Exploring more floating options for properties, infrastructure, and facilities
• Incorporating SLR into all shoreline area projects to build long-term resilience
• Maintaining connectivity along the shoreline (e.g. bikes and public access to water)
• Taking collective actions across properties to address multiple benefits and create a sense of place
• Privately owned shorelines have collective value in their character, use, etc.
• Preserving the existing maritime community character
• Managing eelgrass habitats The adaptation strategy recommendations build upon community-informed project goals and explore possible future shoreline configurations.
“More recreation on/near the water”
“Nature-based wave attenuator protects the shore!”
“Restore this wetland like Galilee!”
We need to protect, restore, and foster our marsh land. Marshes are some of the most biodiverse communities and we need to use that to our advantage. MARSH!
Please consider floating docks. - Houseboat owner
“More floating homes with subsidies berthage”
“Community gathering spaces (i.e. 4th of July)”
“Mix of hard and soft. Protect historic. Adjust for each area”
“Water finds a way...limited money means don’t spend on an interim measure”
“Prioritize walkability, attractiveness, Sausalito’s Character”

“Public Access to the waterfront! retails + recreation”
“Nature-based solutions integrated with hardening and floating adaptations”
“Attenuator-based public access and attractions (halts erosion, boosts civic amenities)”
“Floating homes are important character + Identity (tourism, home)”
“Nature-based solution integrated with hardening and floating adaptations”
“Expand Floating community; be innovative for commercial uses”
“Please do not encroach on our maritime industry and arts jobs!”
The waterfront defines Sausalito and must be adapted and be protected.
“The working waterfront is CRITICAL!””
Working Waterfront + Economic Vitality
Maritime Character + Shoreline Connection
Cost/Benefit of Adaptation
Ecological Opportunities
Art and Culture
The City led a robust public outreach strategy to invite all interested parties to community meetings, answer online surveys, and participate in public comment. These strategies include an email list containing 695 individuals and businesses, workshop invitations listed on digital traffic messaging boards, distribution of flyers at boards around town, announcements by the Mayor at City Council meetings, regular updates published in our Citywide newsletter, Currents, and cross publication of events in partners’ newsletters.
• 695 individuals and businesses on the Email List
• 2 Community workshop invitations on traffic messaging board
• Posters posted around town before every meeting
• 33 updates posted in the City Newsletter – Currents
• Cross publication of events in Sausalito Beautiful, Floating Homes Association, Chamber of Commerce, and Women’s Club newsletters
The community engagement activities are carefully tailored to meet the process goals and gather feedback from as many community members as possible. This section lists out components of the engagement plan and summary of each event to date.
2024
• The purpose of these meetings was to inform interested parties of the Shoreline Adaptation Plan, gain initial feedback on areas of vulnerability along the Sausalito shoreline, and establish community partners who are interested in this work. Invited Focus Group participants included members of City Boards and Commissions, local nonprofit organizations (Sausalito Beautiful, Sausalito Working Waterfront Coalition, etc.), environmental organizations (Richardson Bay Audubon, Marin Conservation League, etc.), community associations (Galilee Harbor, Woman’s Club, Floating Homes Association, Chamber of Commerce, etc.) and local businesses (SWA, Berg Holdings, Clipper Yacht Harbor, etc.)
• Format: Presentations, Discussions
May 2024
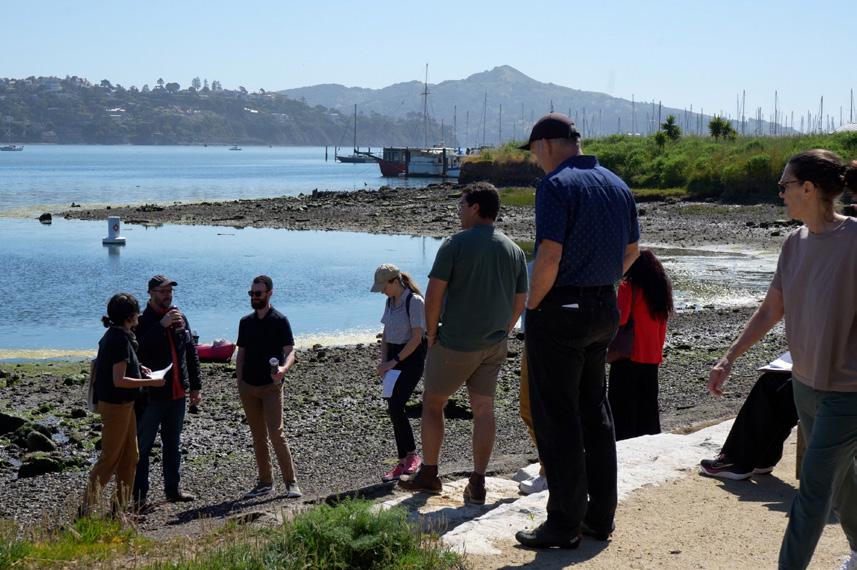
• The purpose of this walking tour was to have the whole project team (City staff and consultants) on-site to walk the shoreline and meet with community partners who were interested or already working on shoreline adaptation.
• Format: In-Person Site Tours, Interviews, Discussions
June 28, July 19, and August 6, October 19, 2024; August 5 and September 27, 2025
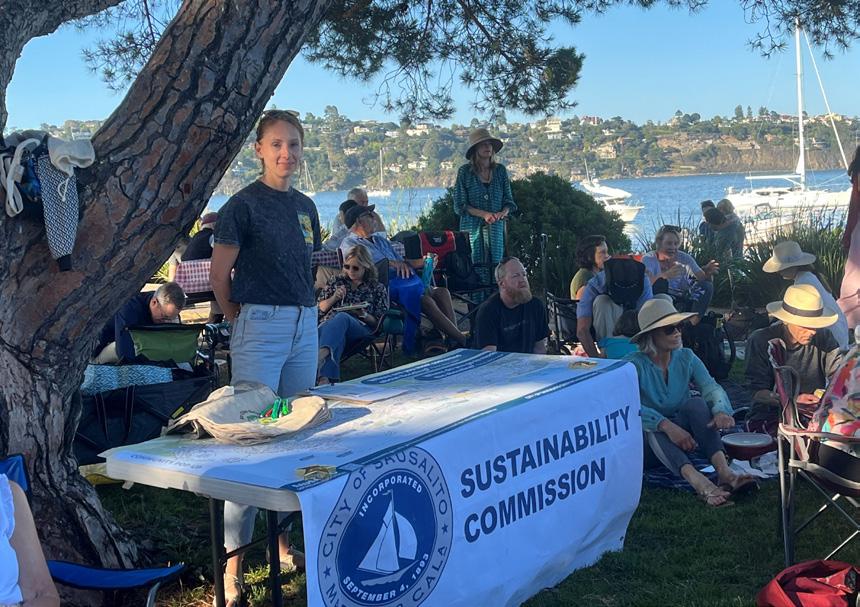
• The purpose of the pup-up series was to raise awareness of the Shoreline Adaptation Plan, answer community questions, and promote attendance at workshops and community meetings.
• Format: In-Person Tabling and Discussions.
September 7, 2024
• 115 Attendees
• Workshop 1 explored projected flooding, sea level rise, and associated impacts to Sausalito community members. We introduced the community to coastal vulnerabilities, potential adaptation strategies and asked for feedback on these approaches.
• Format: Information Boards Display, InPerson Discussions.
September 7 - November 19, 2024
• 200 Respondents
• The Survey asked community members to provide feedback on adaptation strategies and vulnerabilities in Sausalito. This feedback was combined with feedback received in Community Workshop #1 to help shape a the Visions chapter in the Document.
• The full online survey result and process summaries are included in the appendix.
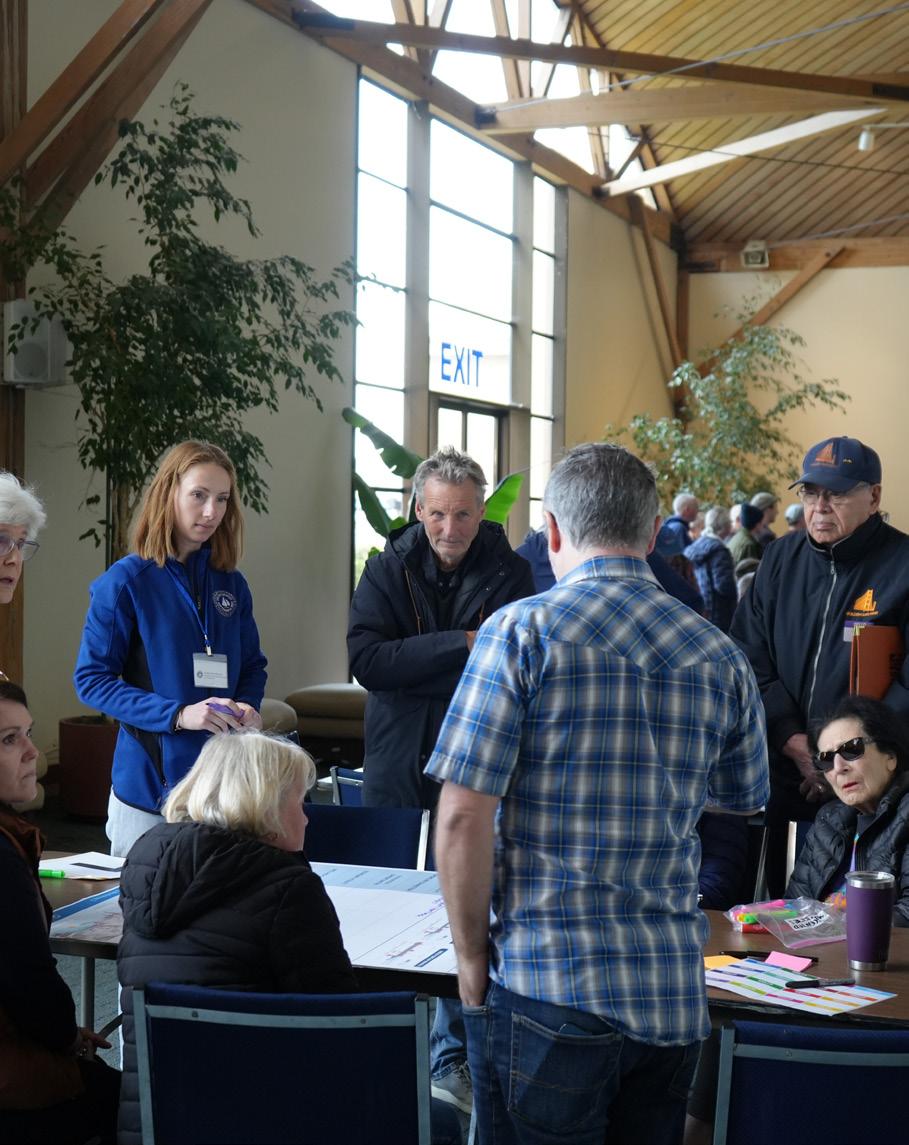
January 25, 2025
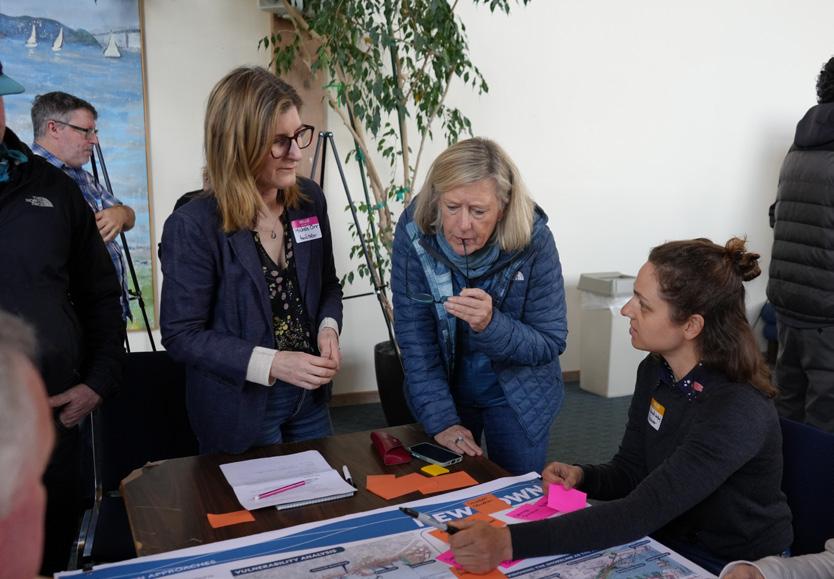
• 120 Attendees
• Workshop 2 presented the vulnerability assessment findings and explored adaptation strategies for selected parts of the shoreline. Materials included the impacts of SLR to roads, buildings, and parks and the cost of no action. We toured sea level rise adaptation strategies from around the world that align with community preferences we heard about in Workshop #1. Guests were presented with conceptual drawings of what adaptation in Sausalito
could look like in the future Breakout discussion groups asked for feedback about how each alternative performed against a series of criteria.
• Format: Presentation, Information Boards Display, In-Person Discussions.
September 10, 2025
• 75 Attendees
• Community Meeting 3 provided the community with an overview of the Draft Sausalito Shoreline Adaptation plan for review, provided an opportunity for questions and answers from the planning team, and announced tools for collecting public comments.
• Pete Hudson, Sutro Science, LLC Floating Home Resident
• Morgan Pierce, Sausalito Beautiful
• KC Pedersen, Clipper Yacht Harbor
• David Johnson, business owner
• Terri Thomas, Marin Conservation League
• Heather Richard, Galilee Harbor resident
• Brad Cornelius, Galilee Harbor Manager
• Donna Colson, Floating Homes Resident
• Casey Skinner, Richardson Bay Audubon California
• Bill Hynes, SWA, Sausalito Beautiful
• David Parsi, Parametrix
• Craig Merrilees, Sausalito Working Waterfront Coalition
• Patrick Haesloop, Galilee Harbor Resident
• Mark Palmer, Sausalito Sustainability Commission
• Kristina Feller, Sausalito Planning Commission
• Dan Morgan, Property Owner
• Doreen Gounard, Office of Supervisor Stephanie Moulton-Peters
• Carlito Berg, Business Owner
• Scott Thornburg, Sausalito Economic Development Advisory Committee
• Kass Green, Business Owner
• Daryl Niemerow, Sausalito Chamber of Commerce
• Vicki Nicols, Sausalito Historic Preservation Commission
• John DeRi, Sausalito Working Waterfront Coalition
• Reason Bradley, Business Owner
• October 15, 2024 - Special Presentation to the City Council
• October 29, 2024 - Consent Calendar item to receive and file the first update to City Council.
• May 20, 2025 - Consent Calendar item to receive and file the second update to City Council.
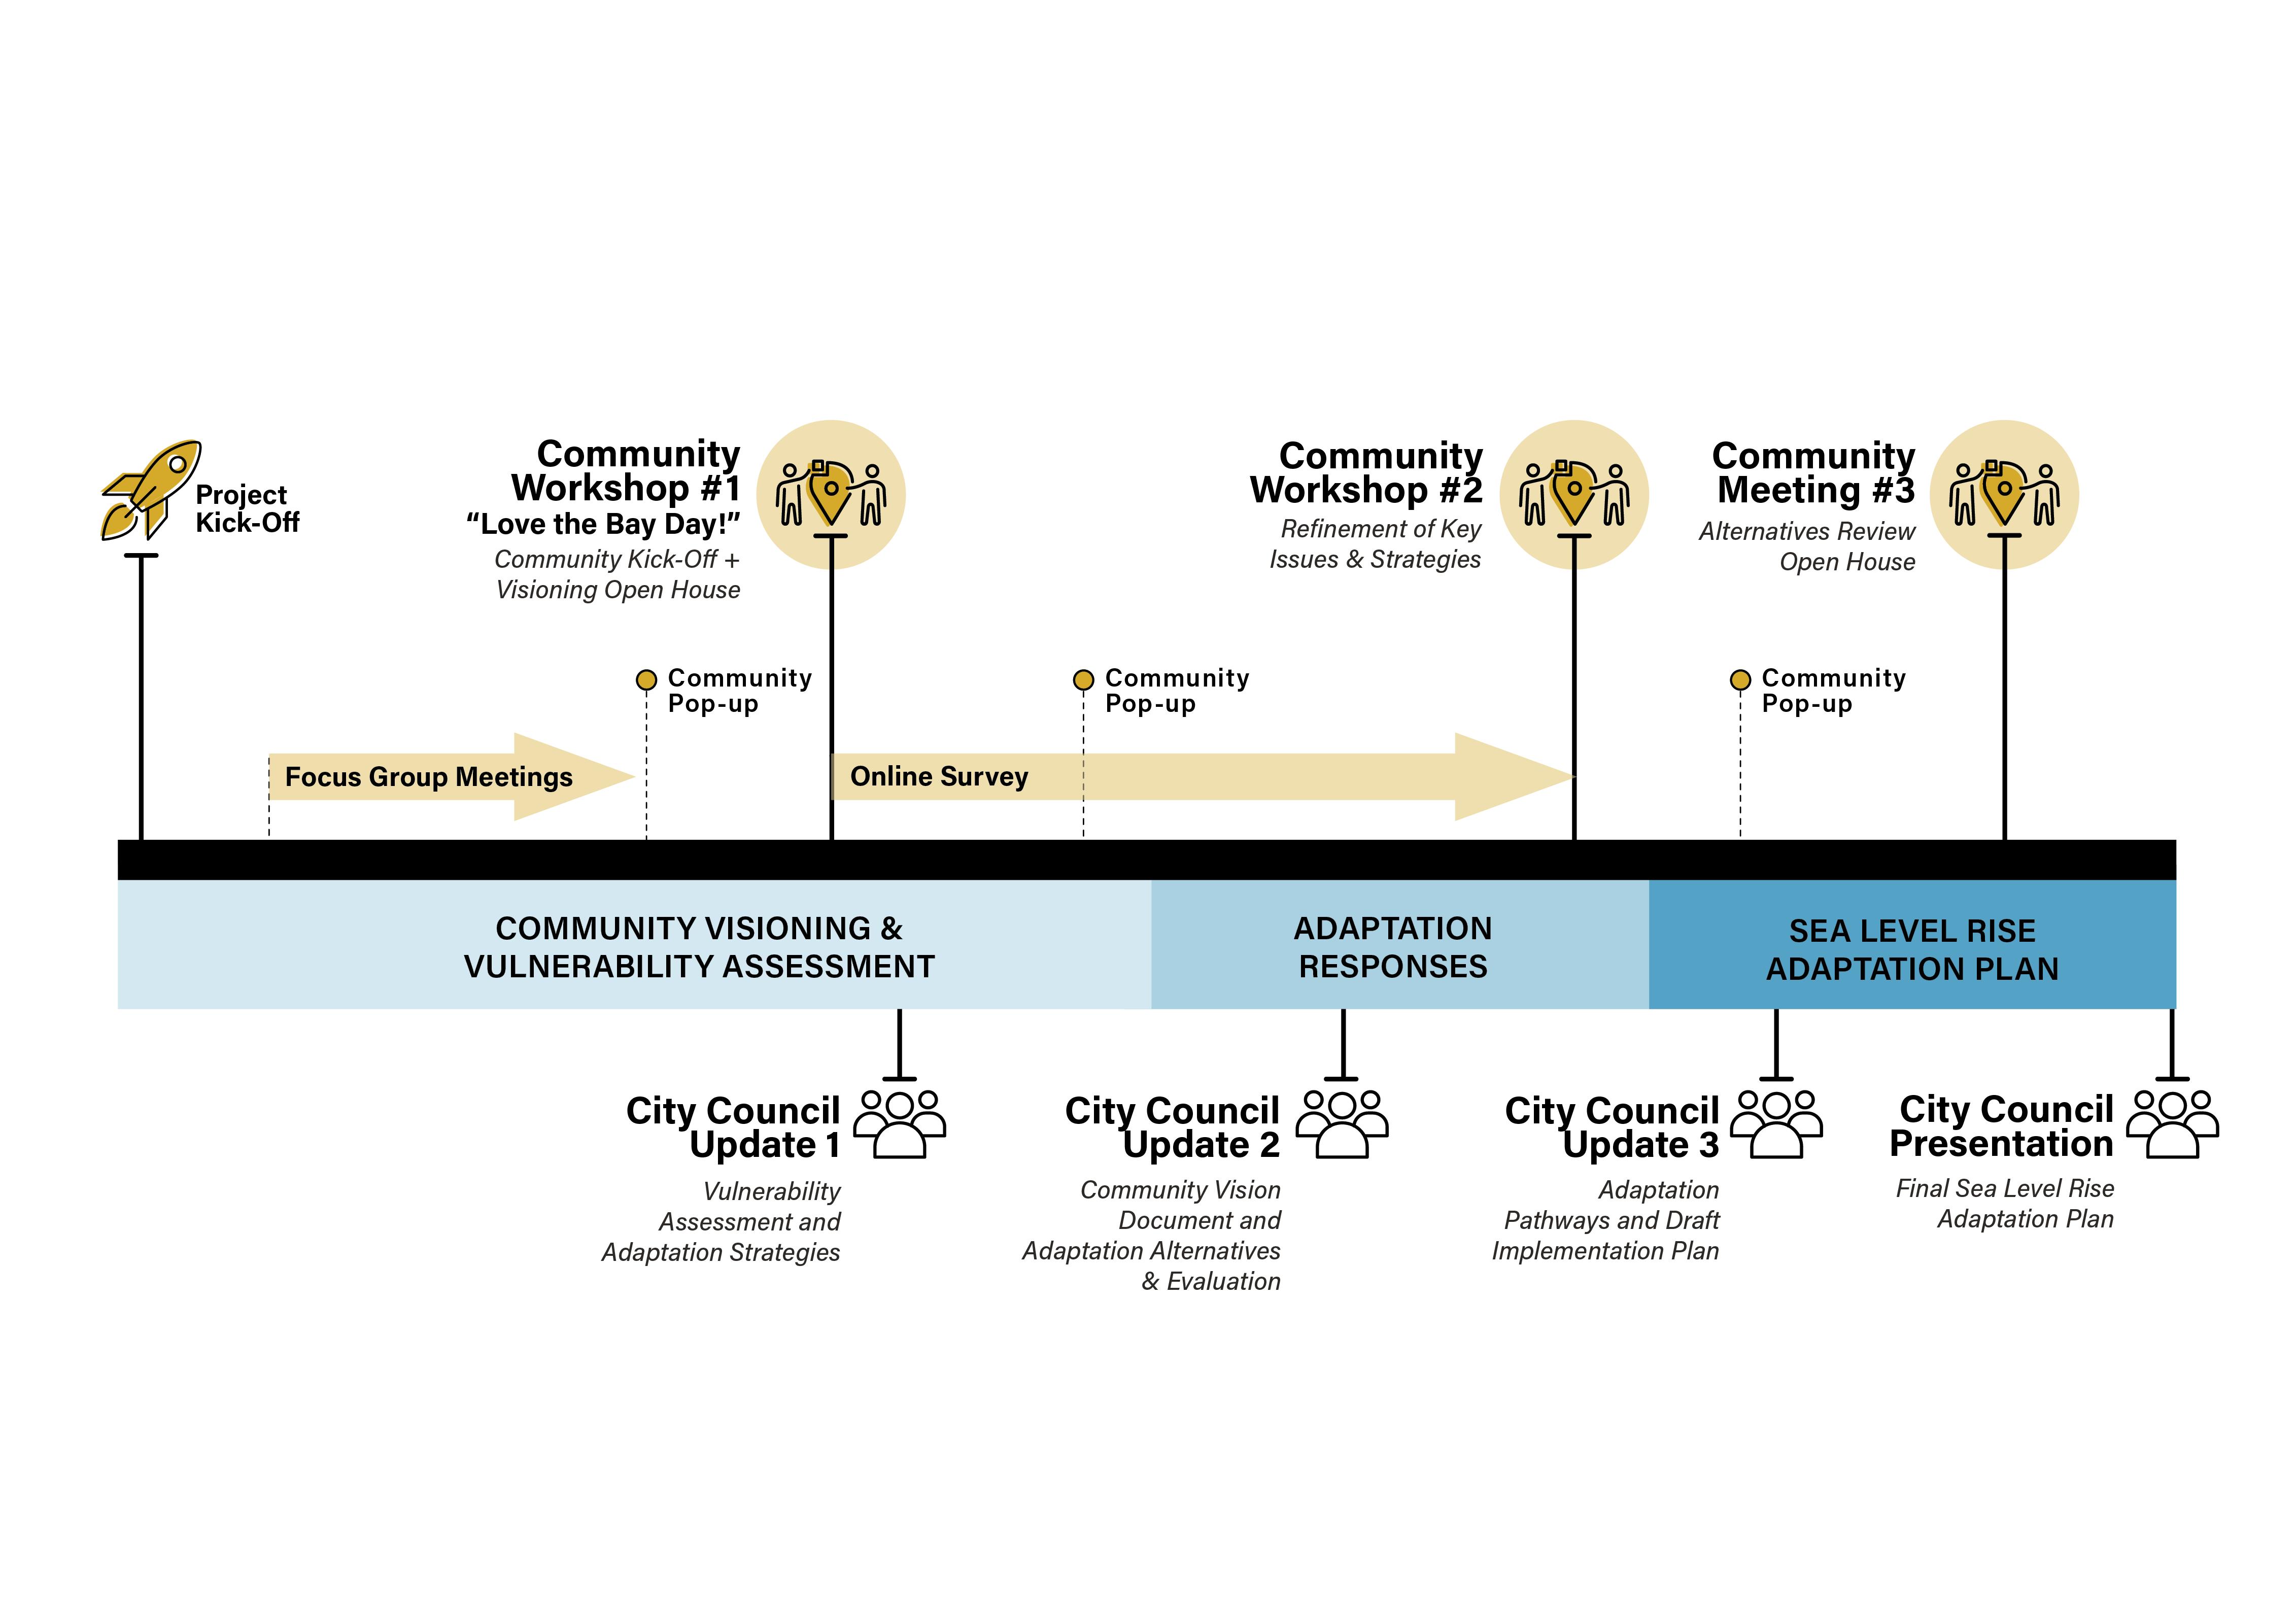
Timeline of Community Engagement Events for the Sausalito Shoreline Adaptation Plan
Through a series of engagement activities, event attendees were informed on the possible sea level rise impacts and the compounded risks across the city. Based on the responses, there is an enhanced shared understanding of the vulnerability which established a foundation for various adaptation alternative elaborated in the next chapter.
The community input has also helped refine the five high-level goals into a few actionable, clear design criteria, shown as bullet points here.
• Preserve what feels authentic to Sausalito
• Support shoreline uses that reflect Sausalito’s identity
• Maintain and enhance visual and physical access to the water
• Integrate nature-based solutions such as living shorelines, eelgrass restoration, and habitat migration corridors into long-term adaptation measures.
• Ensure that adaptation strategies maintain business continuity
• Create space for innovation and flexible land uses that allow businesses to adapt over time
• Leverage adaptation investments to strengthen Sausalito’s creative identity
• Promote tourism by preserving iconic views, creating new waterfront destinations that attract visitors
• Evaluate who pays and who benefits from adaptation under different scenarios
• Use cost-benefit insights to prioritize projects that deliver the greatest shared value
• Consider the permitability and regulatory complexity of strategies when estimating implementation costs and timelines
• Promote collective action models that distribute financial responsibilities and benefits fairly across stakeholders
The collective visioning exercise done in Workshop 1 and 2 helped us better compare benefits and impacts across multiple approaches and alternatives.
The elements compared in the tradeoff analysis are informed by the project goals listed below.
• Community Character: What feels authentic to Sausalito?
• Shoreline Connection: Views, access, water adjacent uses
• Ecological Opportunities: Habitat and nature-based solutions
• Economic Vitality: Innovation, land use impacts, business continuity
• Arts and Culture: Community infrastructure and tourism
• Cost-Benefit: Who pays? Who benefits?
• Permitability: Changes to current and future regulation
• Collective Action: Shared benefits and trade-offs
Evaluation Criteria used to understand the tradeoffs
Trade-off analysis based on the evaluation criteria allows the community to gather together and have an effective conversation on what to prioritize and what to pool collective attention and resources for. Those criteria and outcomes will continue to inform future phases of design, prioritization strategy, and stakeholder engagement as the city moves toward a cohesive, implementable shoreline adaptation strategy.
Evaluate how well adaptation strategies align with and preserve what feels authentic to Sausalito – whether it’s the maritime heritage, floating home community, unique views and water access, historical district and buildings, or the local arts and cultural scenes that construct a rich lived experience.
Consider how adaptation strategies affect the public’s ability to connect with the waterfront—physically, visually, and functionally. Scenarios were evaluated based on their potential to preserve or enhance views of the Bay, incorporate evacuation route consideration, and support existing and future water-adjacent programs such as boating, trails, and public gathering spaces.
Assess adaptation scenarios for their level of integration of habitat preservation and nature-based solutions. This includes protecting eelgrass beds, accommodating future marsh migration spaces, highlighting opportunities for living shoreline/breakwater construction, and improving other habitat qualities. Strategies that create space for ecological adaptation—while also reducing reliance on hard infrastructure—were prioritized for their long-term environmental benefits.
Evaluate how adaptation actions support local economic resilience. Scenarios were analyzed for their potential to incentivize local businesses, bring in more commercial activities and tourism with enhanced waterfront spaces, promote innovative industries while maintaining existing ones. Strategies that allow for economic adaptability while minimizing disruption to existing uses were rated higher.
Sausalito’s identity is deeply shaped by its creative communities, cultural infrastructure, and tourism economy. Adaptation strategies were evaluated on their ability to preserve cultural assets—such as floating homes, historic sites, and public art spaces—and to enhance Sausalito’s social cohesion as a creative, vibrant coastal city. Approaches that maintain/highlight cultural assets are favored.
This criterion assesses the estimated cost and technical feasibility of each adaptation strategy. It considers construction complexity, material needs, site constraints, and ease of implementation. For example, floating infrastructure like a parking lot may be significantly more challenging and costly to build than raising land elevations. The goal is to evaluate whether each option is not only effective but also practical to construct and maintain.
The process of obtaining permits differs whether construction is located inland or whether the structures are located along the shoreline or offshore in the bay. Generally, permitting along or in the water is a more involved process and may require longer time to get through the process. Adaptation strategies that may not be permitable in today’s regulatory environment have been flagged
Financial losses were evaluated for each shoreline character area under the three future SLR scenarios, estimating rough order of magnitude costs due to lost assets (e.g., any assets inundated at high tides during future SLR were considered a total loss, and their replacement values were summed). The cost of adaptation has not been estimated for each proposed vision to properly estimate a benefit-cost ratio, but commentary on collective versus individual action has been provided using preliminary costing information.
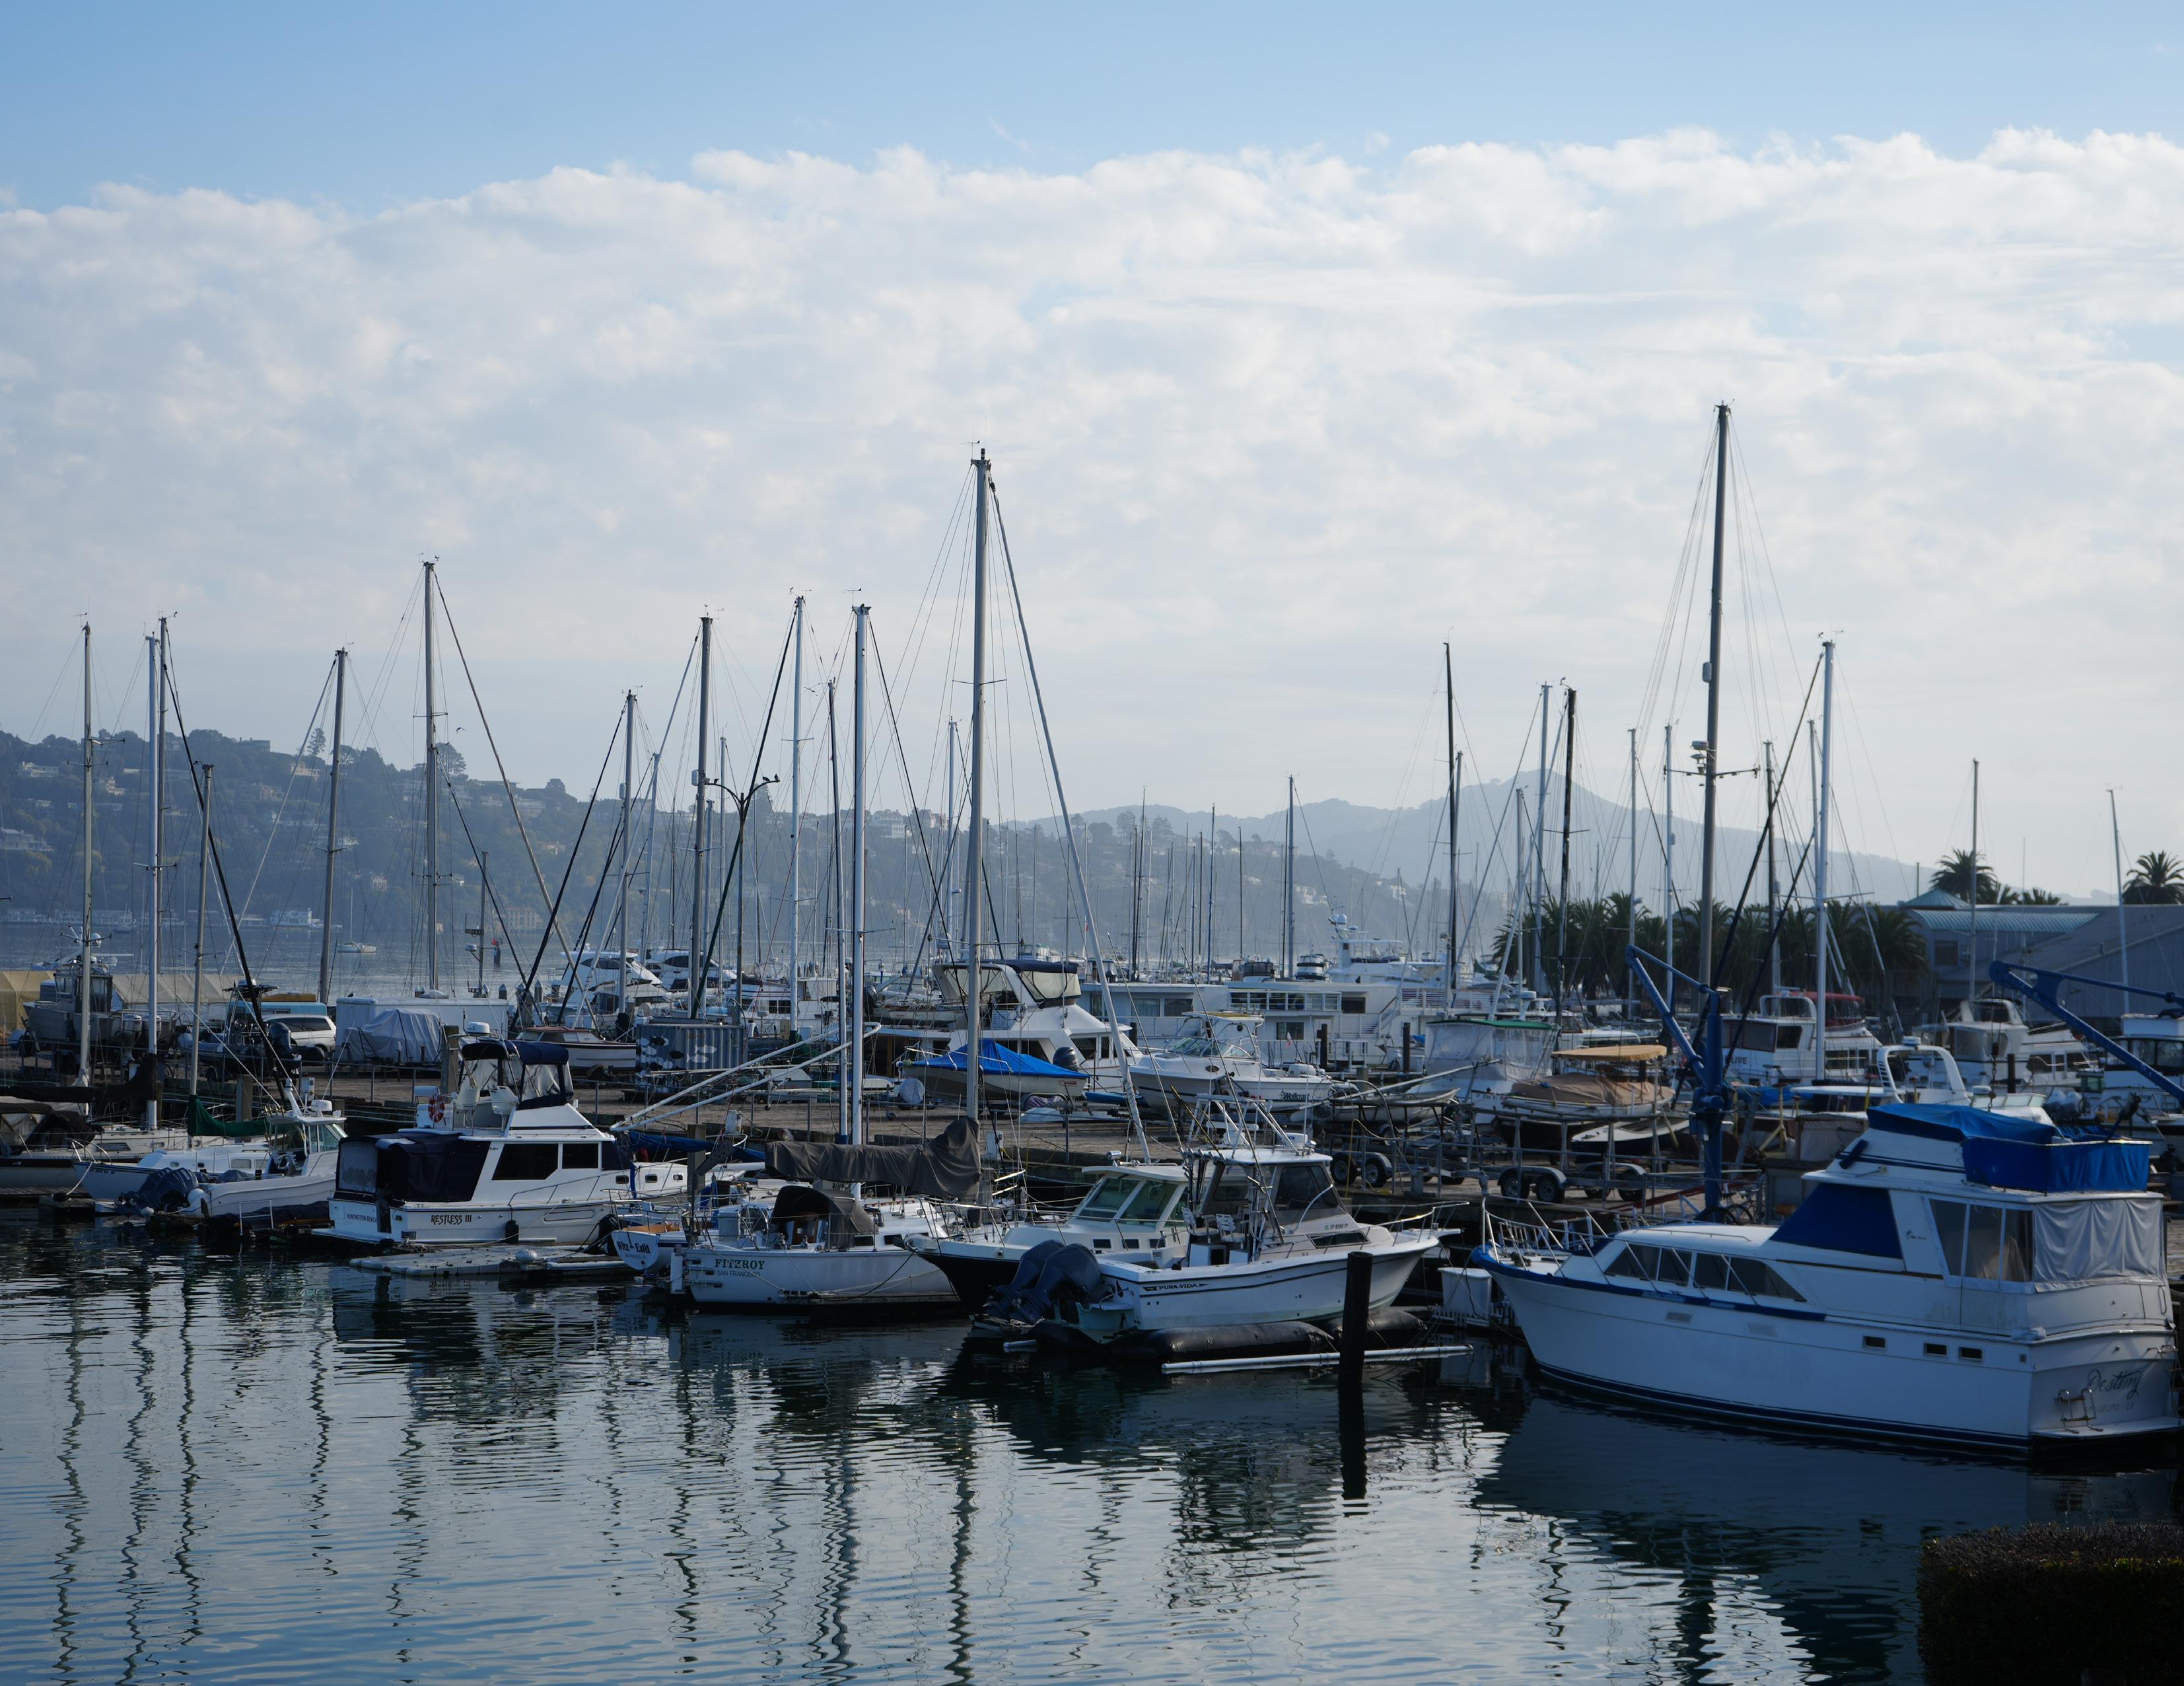
The Resilient Edge Concept Explorations chapter introduces the resilient edge approach to adaptation planning and tests it out by applying it to four focus areas in Sausalito. Multiple resilient edge concepts were developed for each focus area to help the community explore the impacts and opportunities of the resilient edge when located at various distances from the shoreline. The concepts presented in this chapter are not adaptation recommendations. Near-term adaptation strategy recommendations and long-term adaptation alternatives are documented in Chapter 5.
Rather than representing a hard, uniform line between land and water (e.g. a wall, levee, or berm), the resilient edge is a planning concept used to represent a location where various adaptation tools may be applied to minimize tidal flooding over time.
The resilient edge is made up of one or many typologies within a district based on local context and goals. For example, it may transition between a levee with public waterfront access to the bulkhead of a building with walkways and piers and eventually to a reconstructed multi-modal roadway, elevated to stay dry and protect inland areas while addressing improved access for all.
Communities can use the resilient edge concept explorations to build a shared understanding of where and how to hold the line—and where to begin to adapt properties to adapt to changing water levels.
Everything inland of the resilient edge is protected from frequent sea level rise flooding.
Critical facilities, infrastructure, and public spaces inland of the resilient edge are planned with long-term resilience in mind, incorporating elevated foundation, hard barriers, or other strategies to remain dry and functional into the future. Risk remains, however, due to catastrophic failure and other hazards such as subsidence and rising groundwater.
on the water side of the line transforms toward accommodation of water and adaptability.
The areas outside the resilient edge embrace Sausalito’s unique waterfront character by integrating floating buildings, parks, and infrastructure features that are designed to rise and fall with the tides. Other buildings and infrastructure are elevated in place to stay dry. Rather than resisting the encroaching water, this area adapts with it—supporting both community life and economic vitality. Ecological function remains and some migration of habitats inland can occur.
Figure 24:
The diagram describes the resilient edge and associated design heights across 3 locations from the shoreline in location 1 to a Bridgeway alignment in location 3.
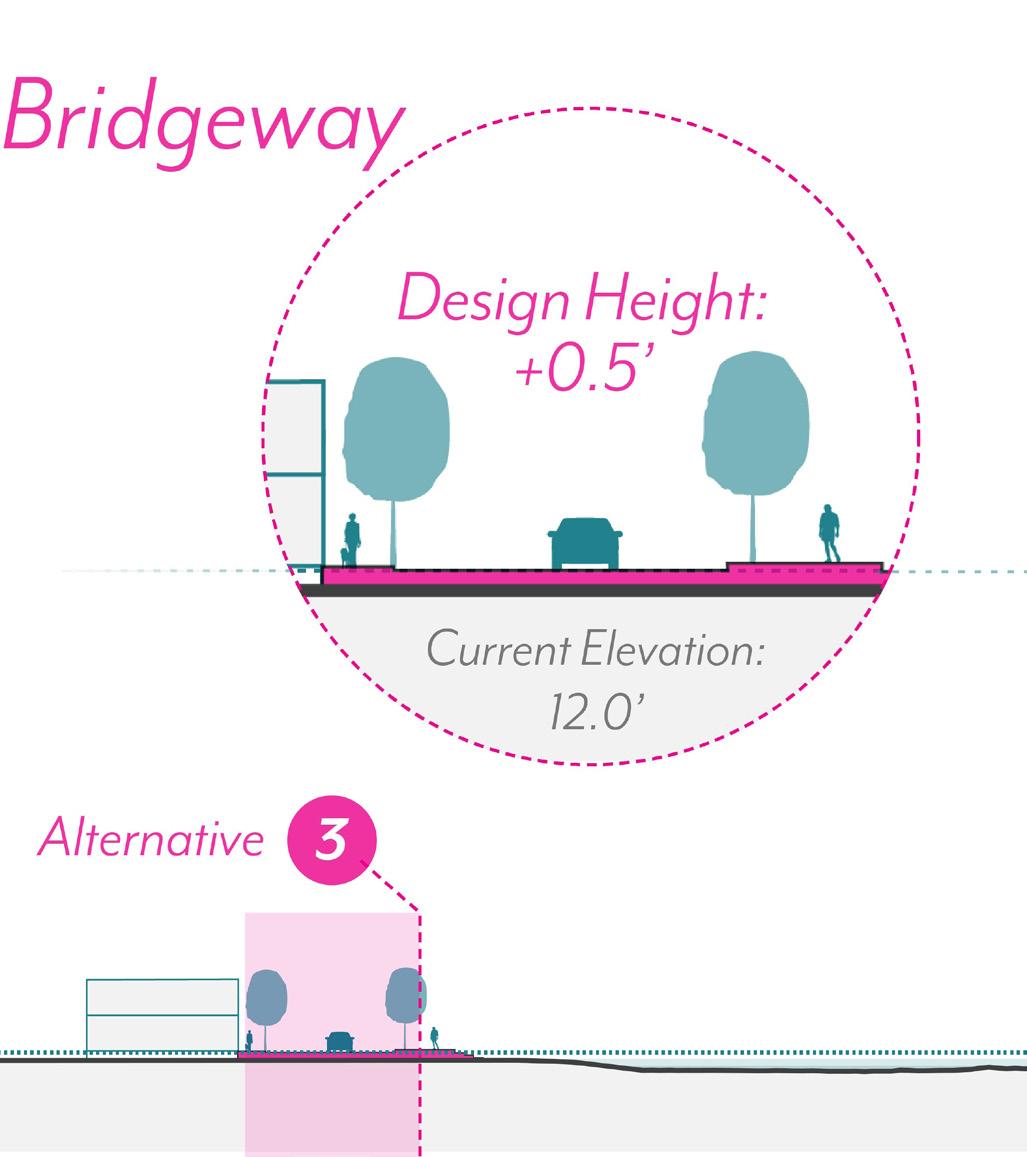

The resilient edge concept explorations compare various adaptation options and enable a community to compare the tradeoffs between them. When comparing resilient edge concepts, one major variable that changes is the relative design height needed to minimize tidal flooding. In this
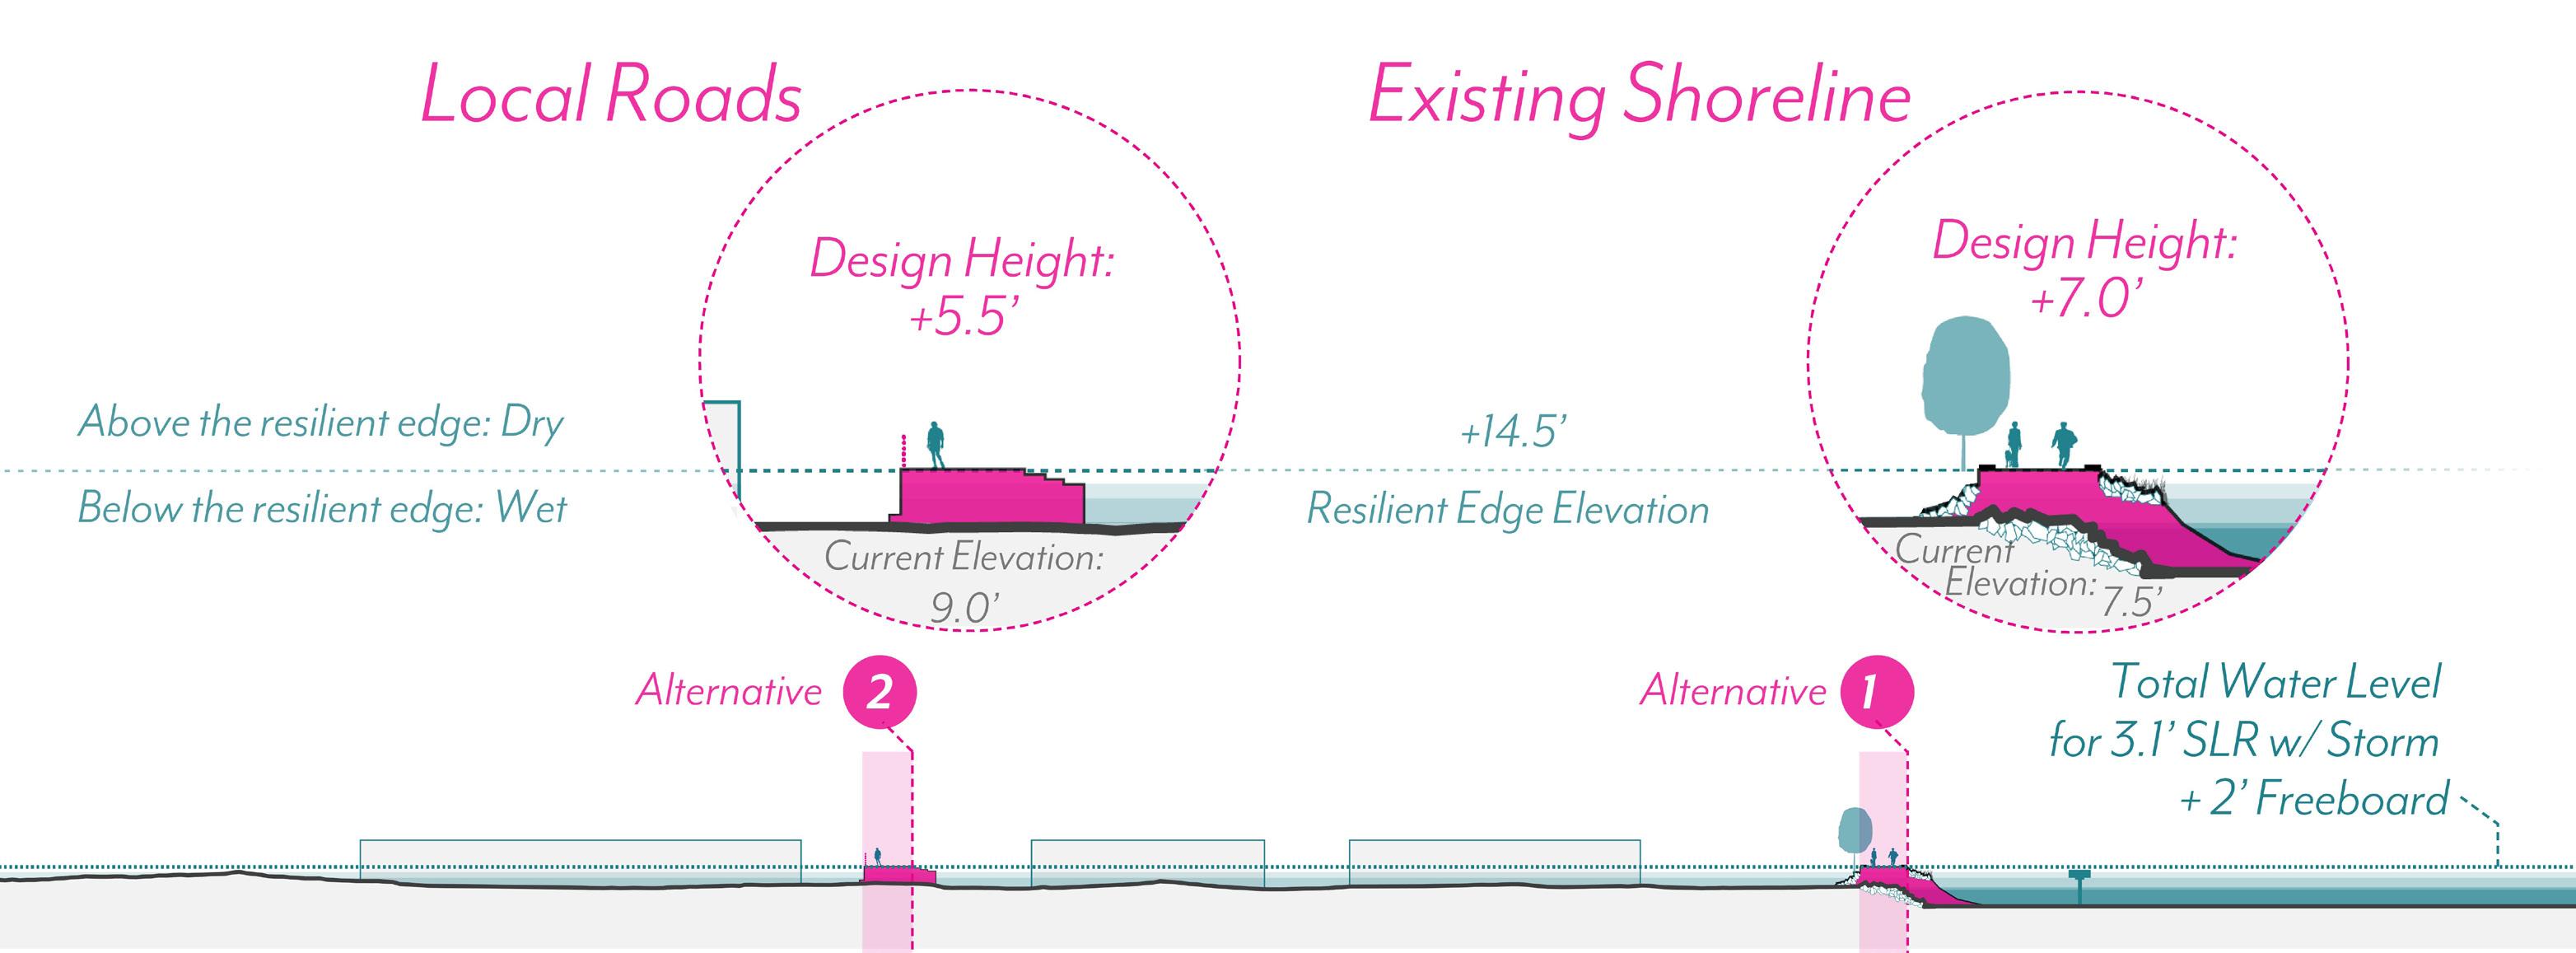
example, the resilient edge located at location 3 along an inland road requires a feature to have a 0.5 foot design height in order to hold back water, whereas location 1 requires a 7.0 foot design height. Location 1 protects more area, but is also much larger, creates a barrier disconnecting the
community from the water, is more costly to build and maintain, and has a higher risk of potential failure. Concept explorations are intended to explore how adaptation designs can incorporate public realm features to minimize disruptions to the waterfront experience while still minimizing flood risk.
The resilient edge elevations refers to the future target elevation that adaptation projects—such as seawalls, raised roads, floating infrastructure, or flood-proofed buildings—should reach in order to remain functional and resilient as sea levels rise. It accounts for the expected increase in water levels over time, including both daily tides and extreme storm events, and typically includes an additional “freeboard” buffer to accommodate future uncertainties like wave action, settlement, or higher-than-expected sea level rise.
The resilient edge design height factors in the following three elements:
• Total water level for different SLR scenarios (e.g. 4.3 feet in Scenario 2, or 6.6 feet in Scenario 3)
• Existing ground elevation at a specific shoreline location relative to tidal ranges.
• 2-foot freeboard for areas near the shore to provide a safety buffer for future uncertainty and wave action.
The recommended resilient edge elevations are shown in Table 11. Freeboard is applied only to areas along or near the shore with concerns of additional wave action during storm events. To calculate the required height for a specific shoreline segment, add the MHHW elevation (5.9 feet) to the SLR scenario total, then subtract the existing ground elevation.
It is important to keep in mind that the design of the resilient edge does not always result
in the
construction
of
a seawall. The resilient edge elevation can inform any type of adaptation infrastructure, ranging from the horizontal levees, elevated boardwalk, to flood-proof buildings.

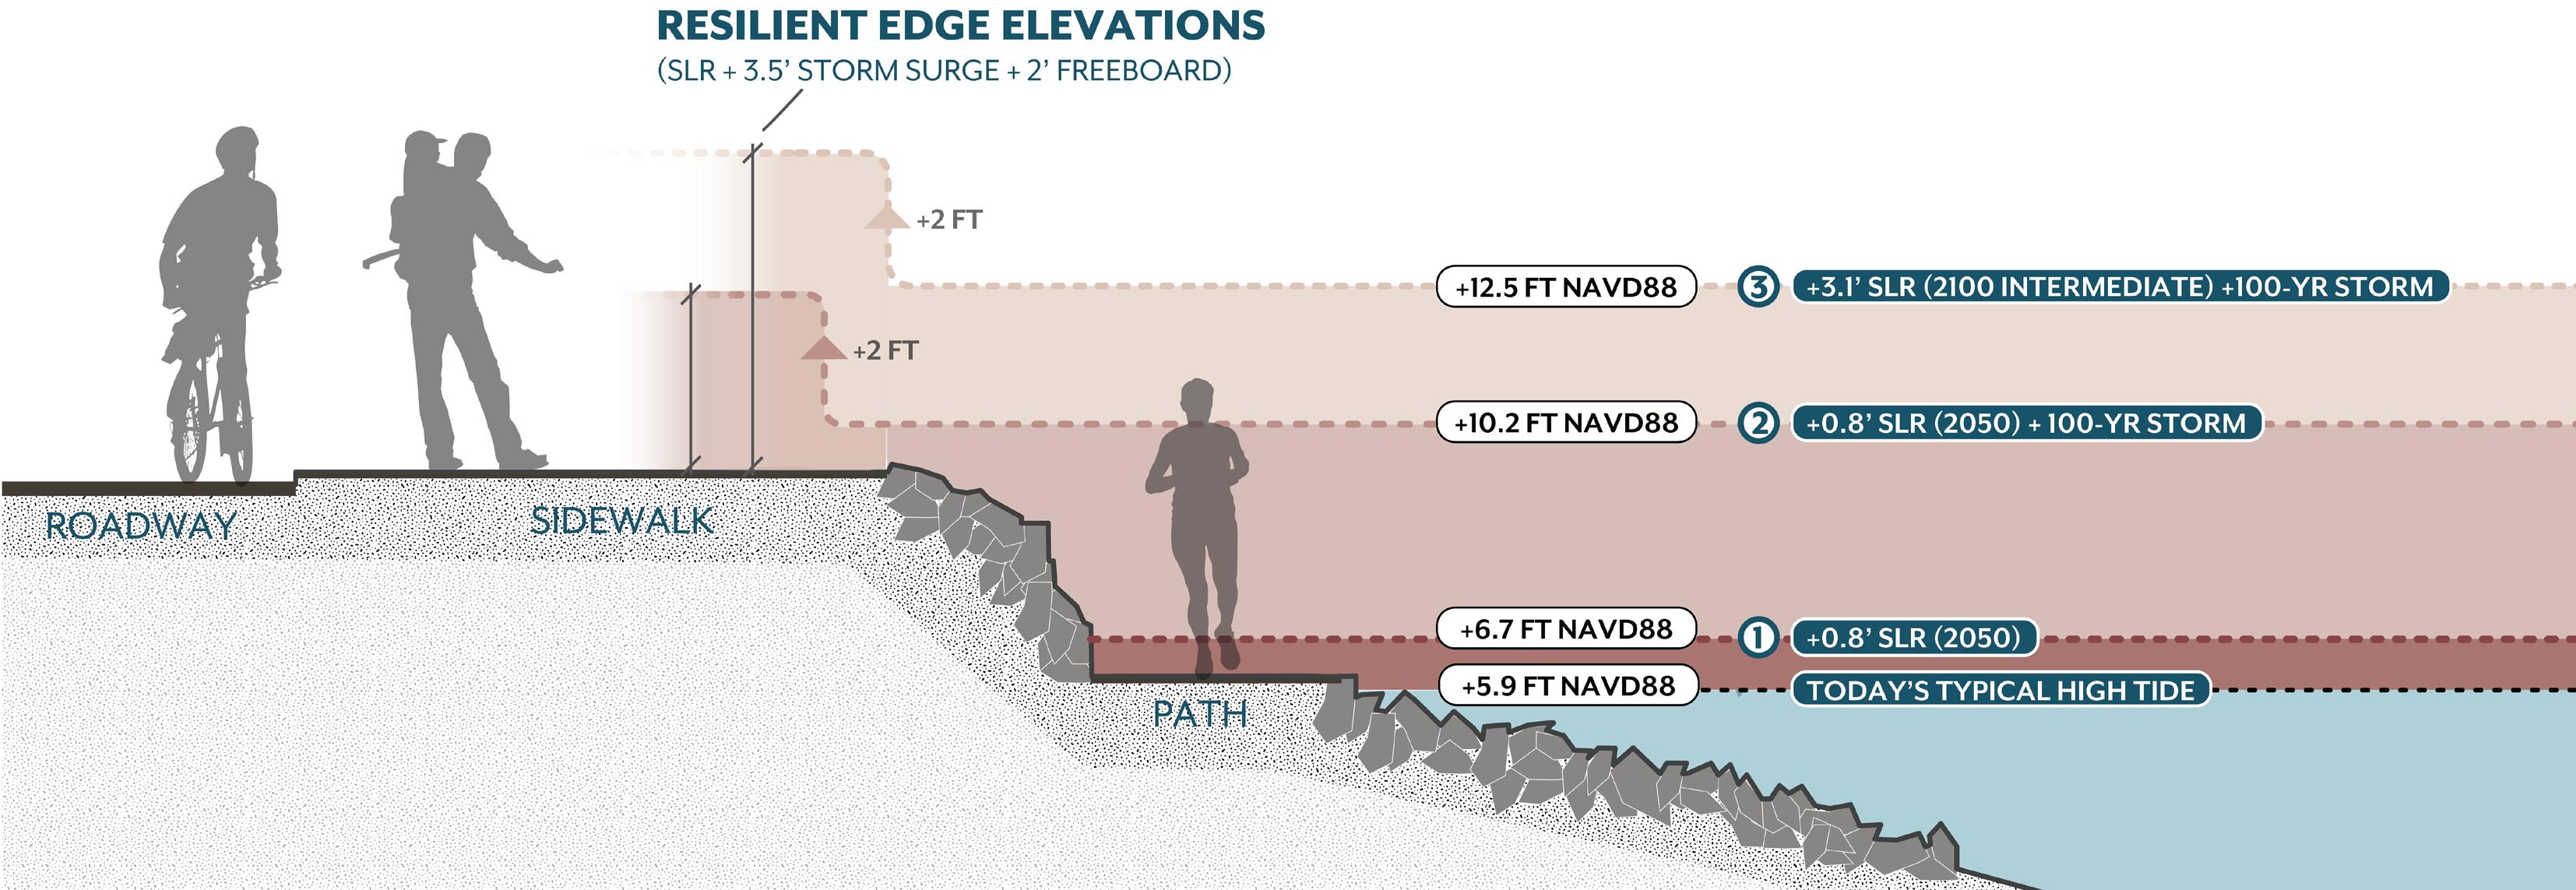
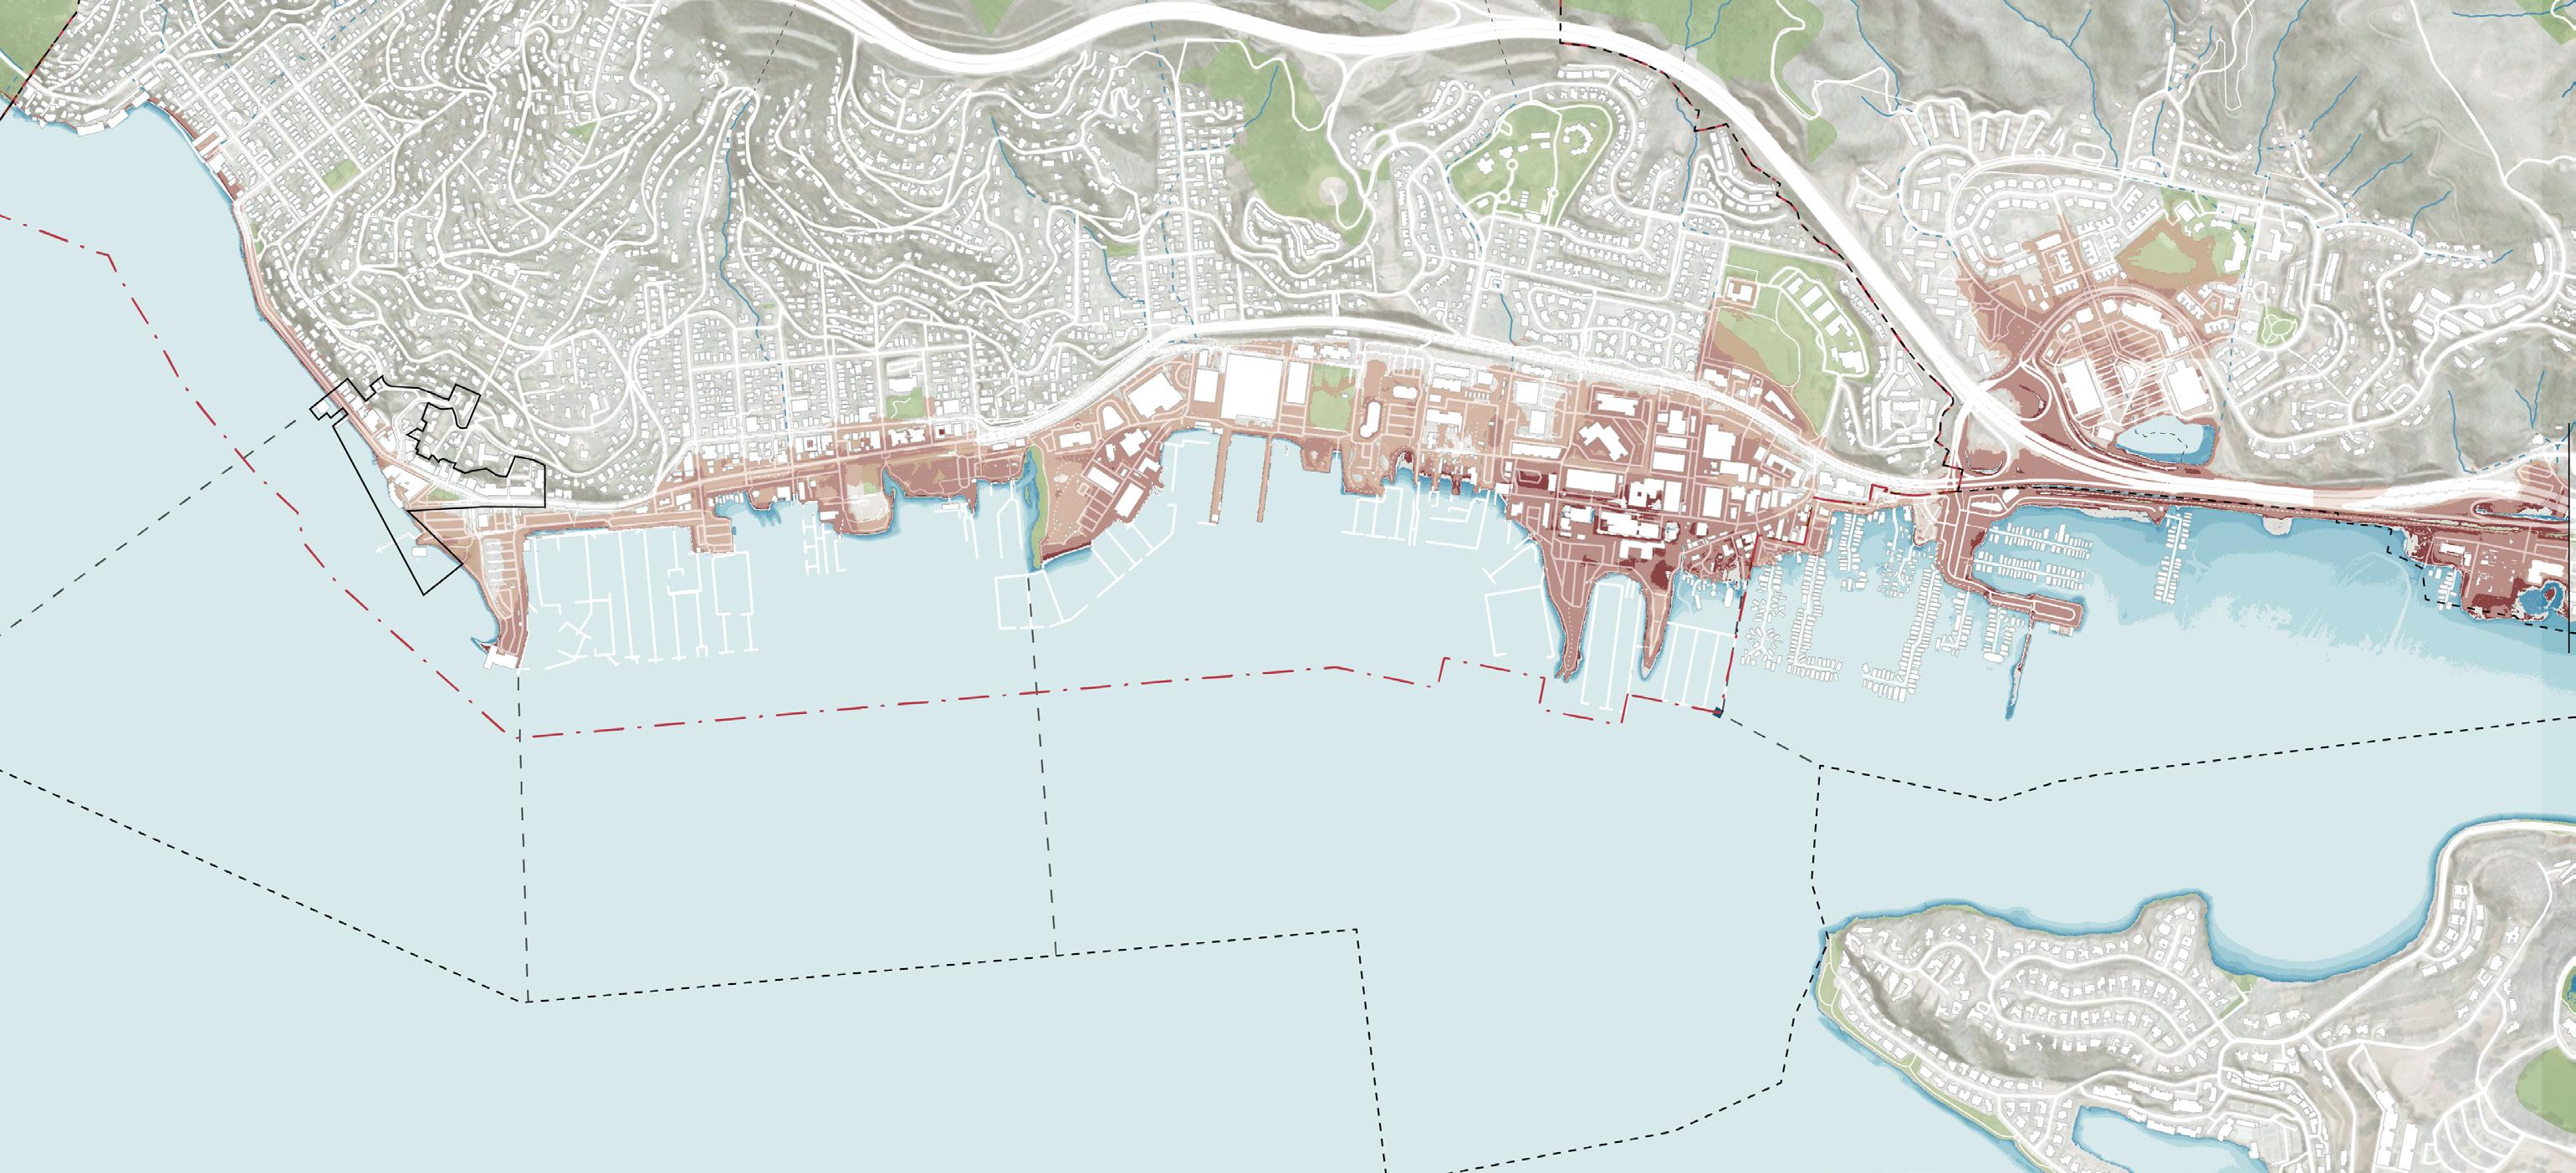
The project team tested alternative concept explorations at four focus areas along the shoreline to illustrate how the strategies can fulfill project goals. The four Focus Areas include (refer fig 22):
Focus Area 1: Southern Waterfront Ferry Terminal & Bridgeway Promenade
Focus Area 2: New Town
Focus Area 3: Marinship
Focus Area 4: Floating Homes.
The options presented for each of the focus areas illustrate how the community-informed project goals can be incorporated among the various natural and built environmental contexts to adapt Sausalito’s shoreline. The focus areas provide examples for the different approaches that can be applied to each character zone, factoring in economic vitality, shoreline connectivity, local ecology, and opportunities for supporting local arts and culture. Within each focus area, different alternatives illustrate different methods of acknowledging local history and character while addressing site-specific hazard vulnerability.
Each focus area section describes the opportunities and impacts of the different approaches. Alternatives are assessed on how they meet the design criteria derived from the community informed project goals.
The pros and cons of the different approaches within the focus areas is evaluated on how it addressed community
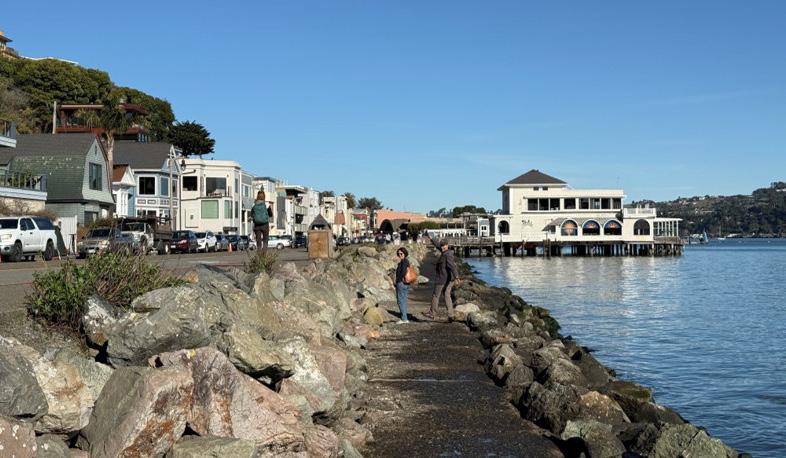
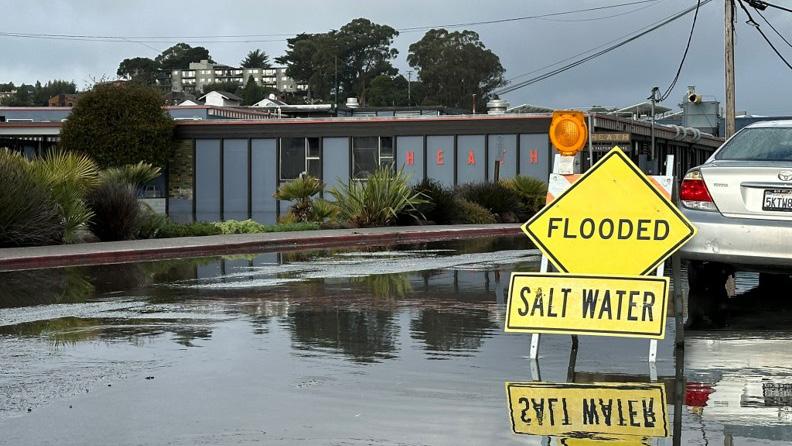
character, shoreline connection, ecological opportunities, economic vitality, arts and culture, cost/constructibility, permitability, and collective action.
Each focus area section concludes with summary table that weighs the potential impacts of the individual concepts presented for each of the evaluation criteria. The table is intended to provide an overview of the opportunities provided by the different approaches to adaptation. The summary tables are intended to provide a comparison of the alternative concepts to guide future planning and project identification.
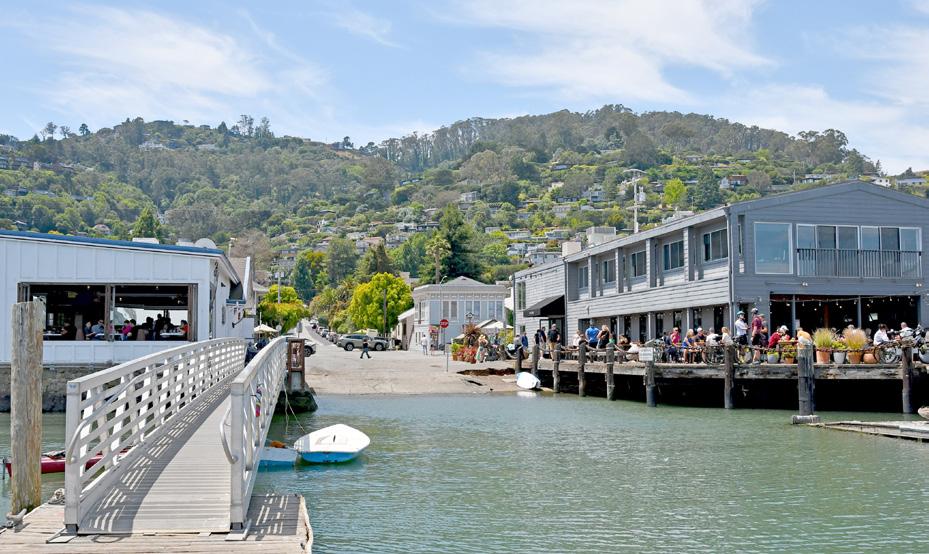
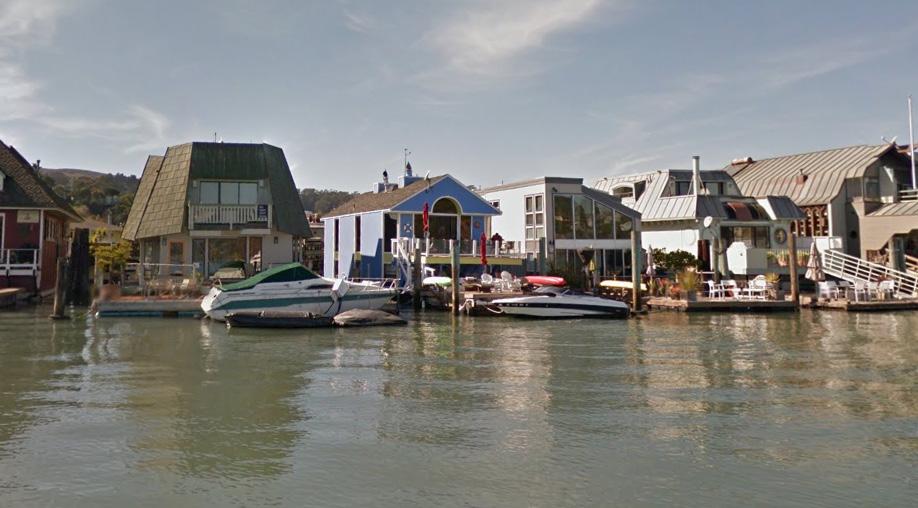
The Bridgeway Promenade Focus Area, spanning from Swede’s Beach to the Sausalito Ferry Terminal, has long served as one of the city’s most visible and visited waterfront corridors. It is the oldest part of Sausalito. Swede’s Beach and Old Town above, is the original heart of the community. Historically shaped by major rail lines for a booming industrial age, the Bridgeway and the shoreline transitioned into a largely obstructed shoreline promenade with waterfront businesses, parks, and plazas.
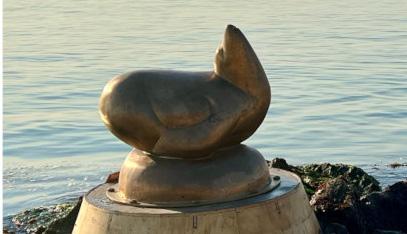
Bridgeway today reflects Sausalito’s identity as a waterfront destination—defined by panoramic Bay views, walkable pathways, small-scale commercial activity, and maritime elements that anchor the city’s coastal lifestyle. Swede’s Beach, one of the few remaining public beach access points, offers a rare opportunity to swim in the Bay. Located nearby is the newly reinstalled sea lion sculpture, a local landmark. Perched on a raised platform elevated to align with tidal fluctuations, the sculpture becomes submerged at high tide reflecting the rising and falling rhythms of the Bay. The tourist population swells in the summer season. Downtown hustle and bustles with visitors on foot, on bike, and in vehicles. Energy is concentrated at the ferry plaza where many gather after arriving by ferry.
The shoreline is primarily a combination of rock placed for protection and bulkheads with private buildings above. Swede’s Beach is a naturally occurring sand beach with concrete walls at the upper end. Significant public infrastructure exists on the shoreline. Bridgeway features shoreline trails and sidewalks, transit, and is the major vehicle route into and out of town. Many transportation demands are placed on Bridgeway and studies have explored opportunities to improve safety and function through restriping and/or widening. Significant utilities such as communication, water, electrical and sewer are buried below the roadway. The busy Sausalito Ferry Terminal is at its southern end. Recent winter storms have demonstrated vulnerability to flooding and impact from large waves breaking over Bridgeway and flooding the street. With projected sea level rise and compound hazards, maintaining public access, utilities, shoreline integrity, and transportation reliability especially during emergency evacuation will require proactive, adaptive strategies.
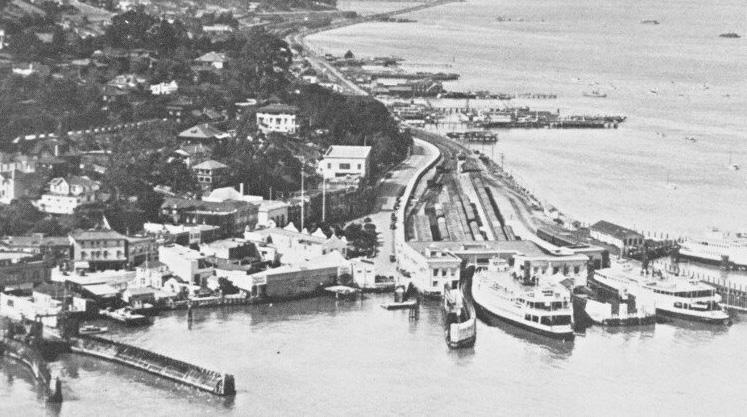
A deep-dive on the end-of-century seawall alternatives for Bridgeway was completed as part of a separate study that occurred after Community Workshop #2. For more information on these alternatives, refer to Figure 26.
Refer to Vulnerability Chapter 1, Section 4.3 for more detailed analysis on vulnerable assets and cost of no action.
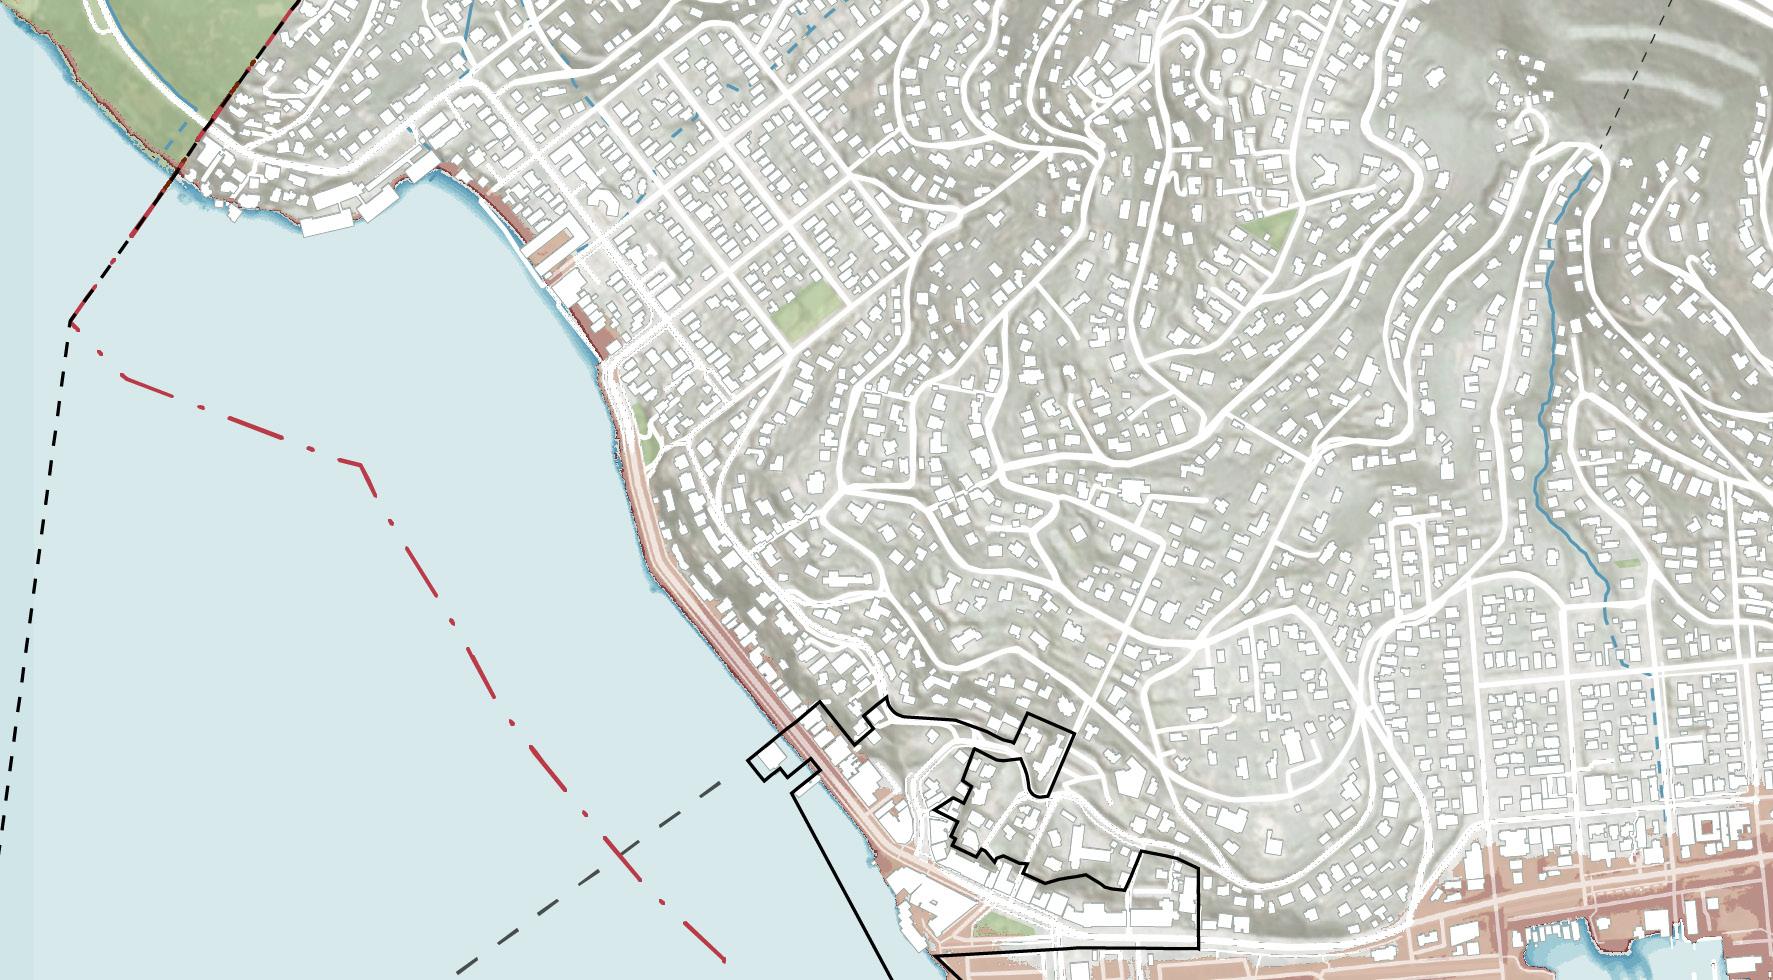
In the mid-century scenario, Swede’s Beach and front-row buildings are at risk of tidal flooding, as is the entire evacuation route and front-row buildings along Bridgeway from Richardson Street to Princess Street. The Ferry Terminal also starts to experience more severe tidal flooding. Charter / tour bus parking lot at Spinnaker is partially affected by the increasing water level.
In the end-of-century scenario, coastal flooding of buildings along Bridgeway increases. Areas near the Spinnaker are permanently inundated with water extending up to Bridgeway, preventing access to the Spinnaker and Gabrielson Park.
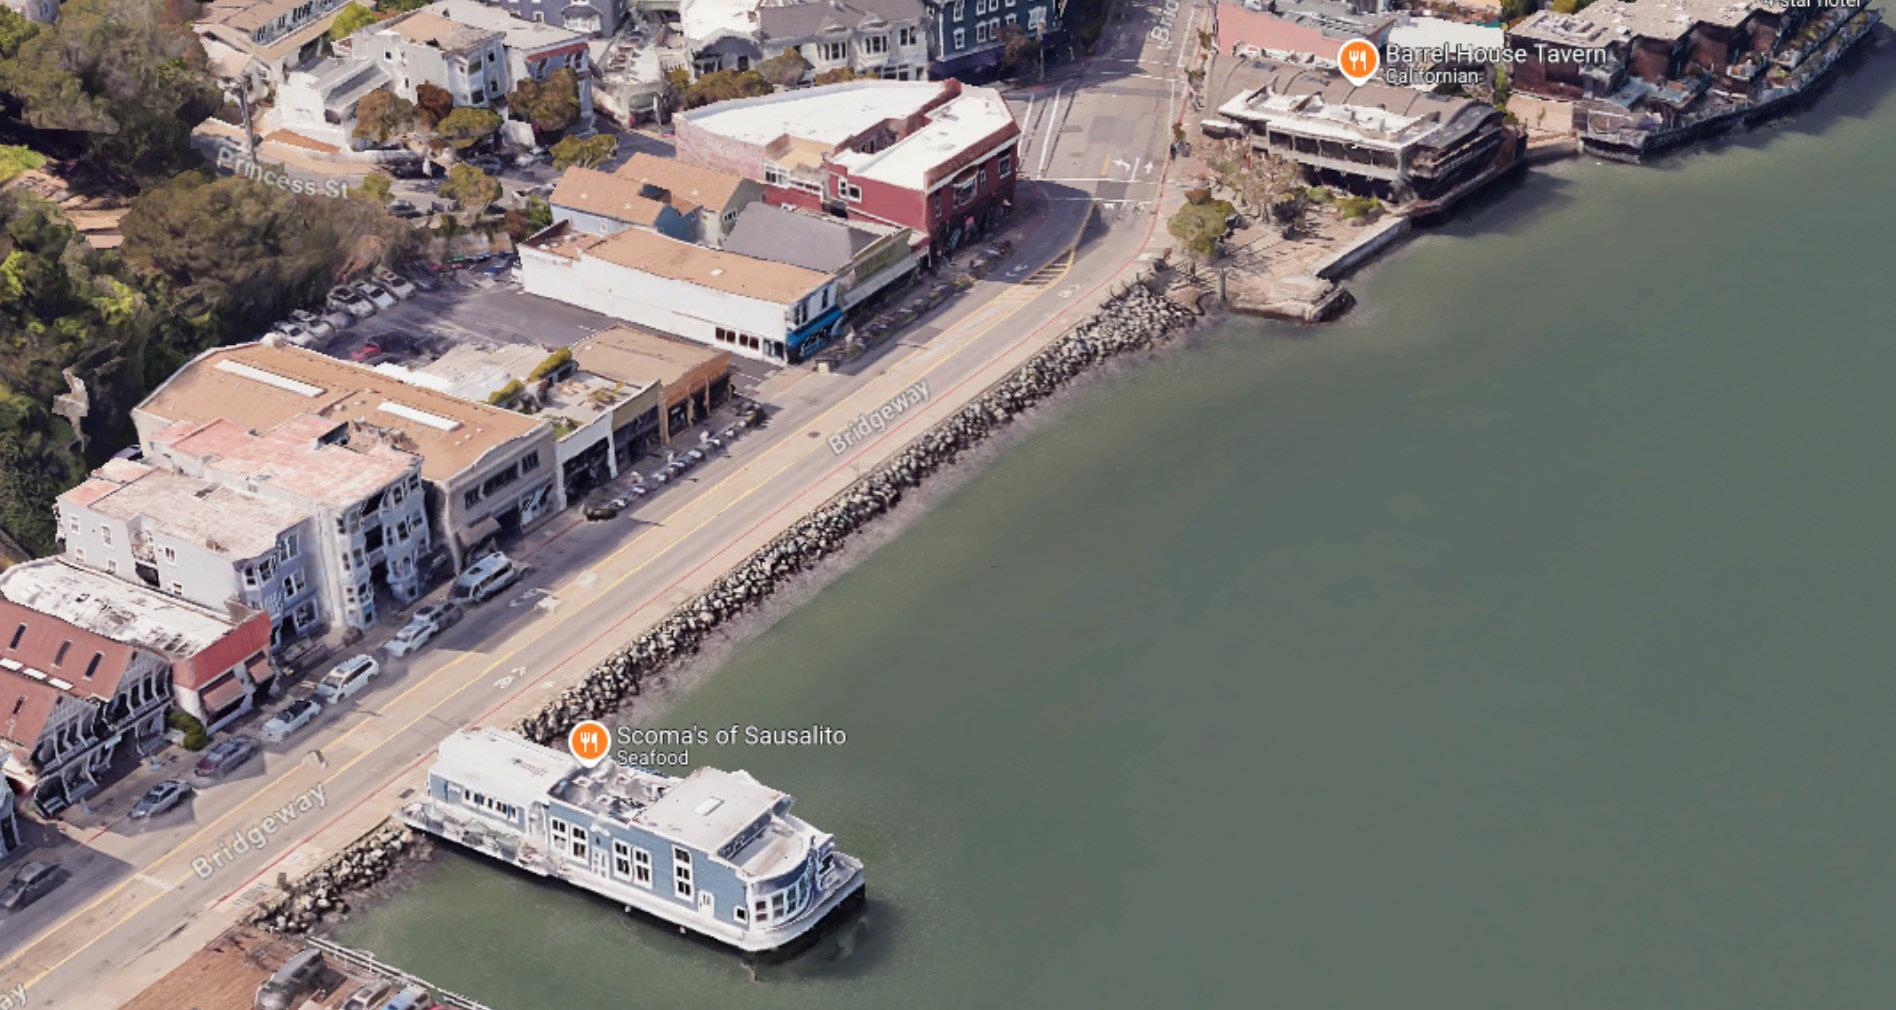
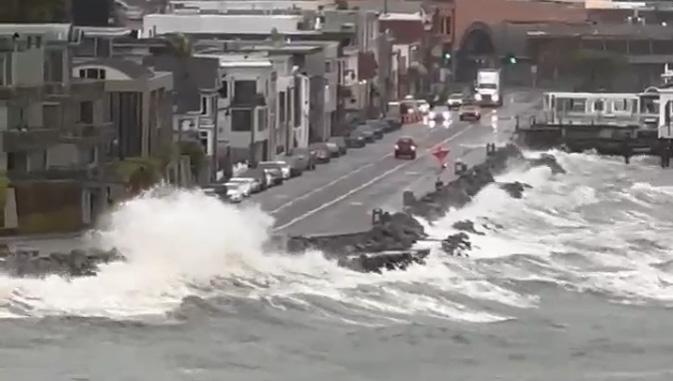
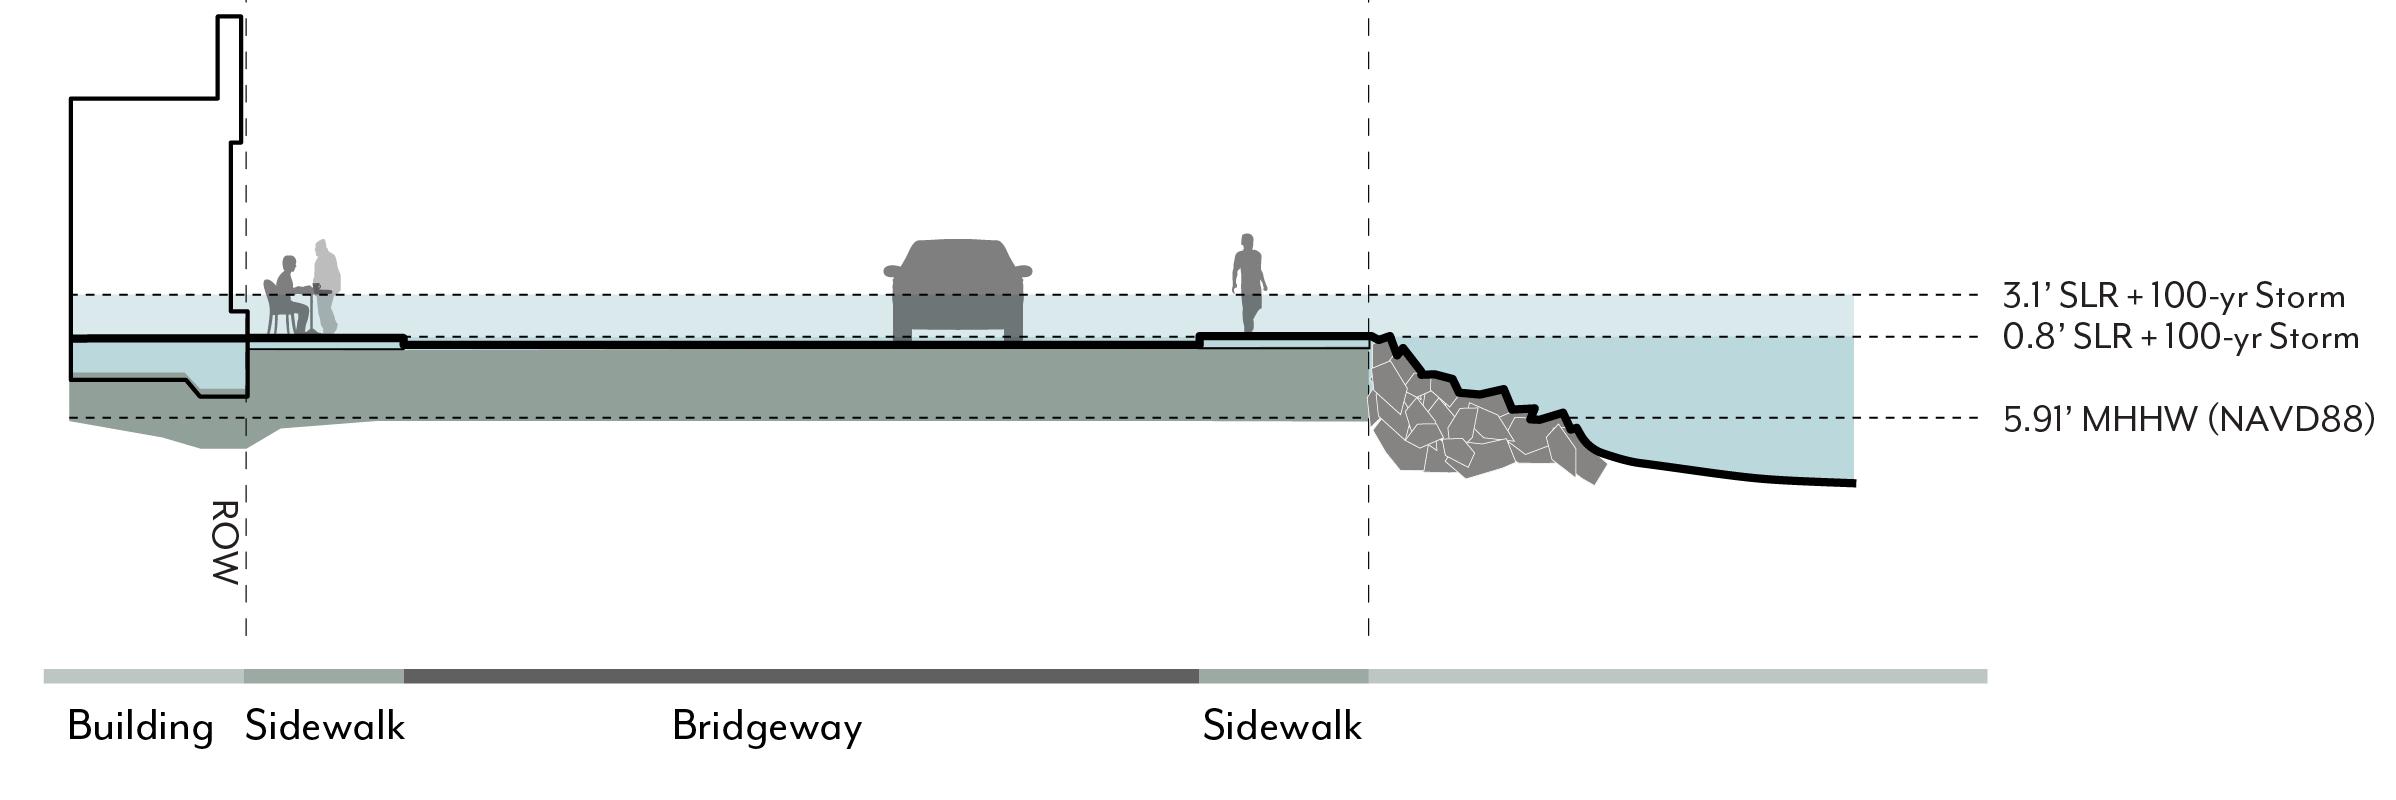
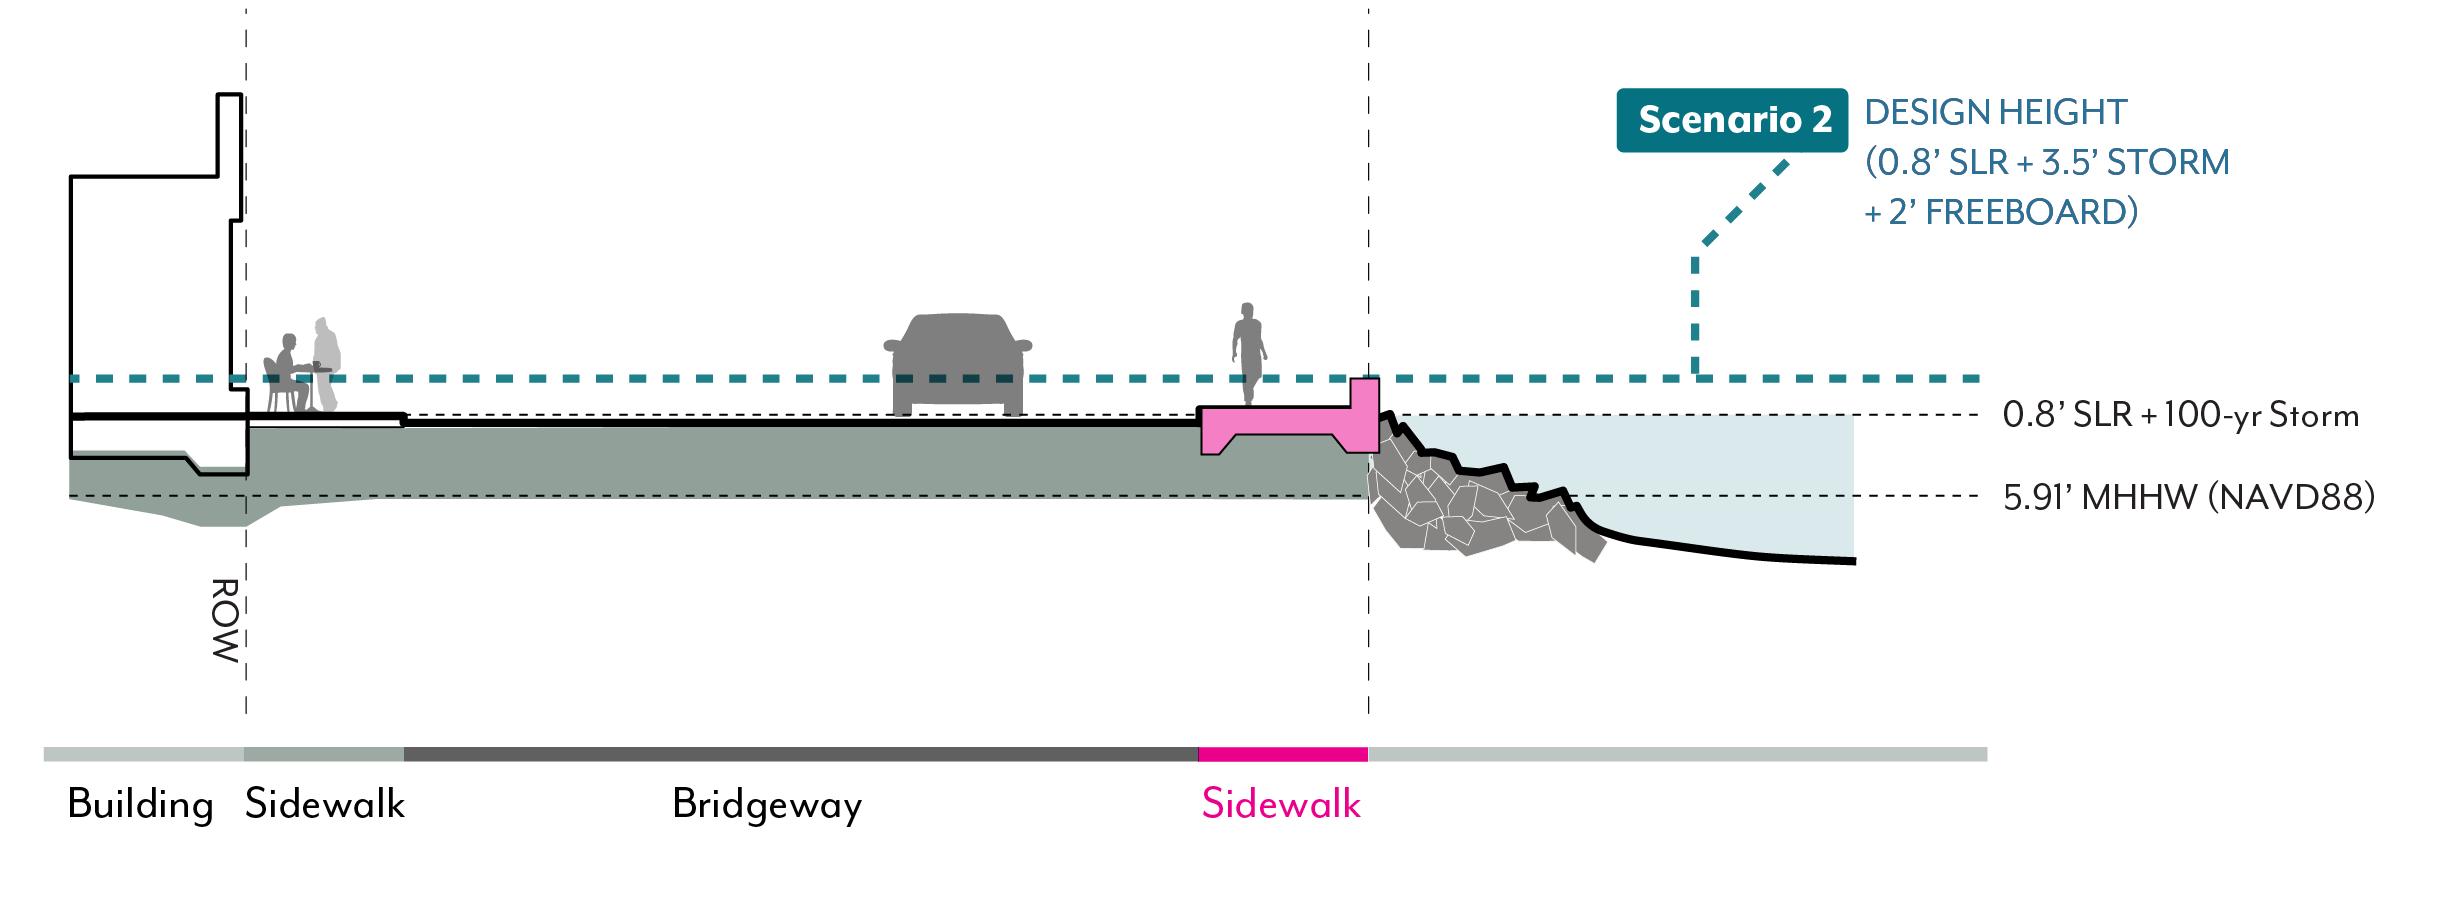
The existing conditions along the Bridgeway Promenade segment between Princess St and Scoma’s include a rip-rap shoreline adjacent to the edge of an eight-foot sidewalk. The roadway dimension from curb to curb is approximately forty-two feet with parking and travel lanes. An eight-foot sidewalk runs along the buildings, many with storefronts and open views of the Bay. Existing buildings have varying ground floor elevations with some older buildings lower than the existing sidewalk. When compared to mid-century and end-of-century sea level rise projections, the roadway and storefronts are at risk of wave overtopping and flooding.
This concept explores the potential for constructing a low wall and sidewalk which mitigates the mid-century sea level rise scenario of 3.1’. The low wall is approximately 2’ tall north of Scoma’s and 3’ tall south of Scoma’s. Temporary flood barriers would be needed at openings and pier entries. Drainage improvement would be needed to manage wave overtopping and rainfall. The benefits include lower cost for retrofit of the existing sidewalk and no obstruction of views from the café sidewalk seating. Tall storm-generated waves would still break over the top of the wall. The rough order of magnitude cost estimate for Concept A is $2.4-2.8 Million.
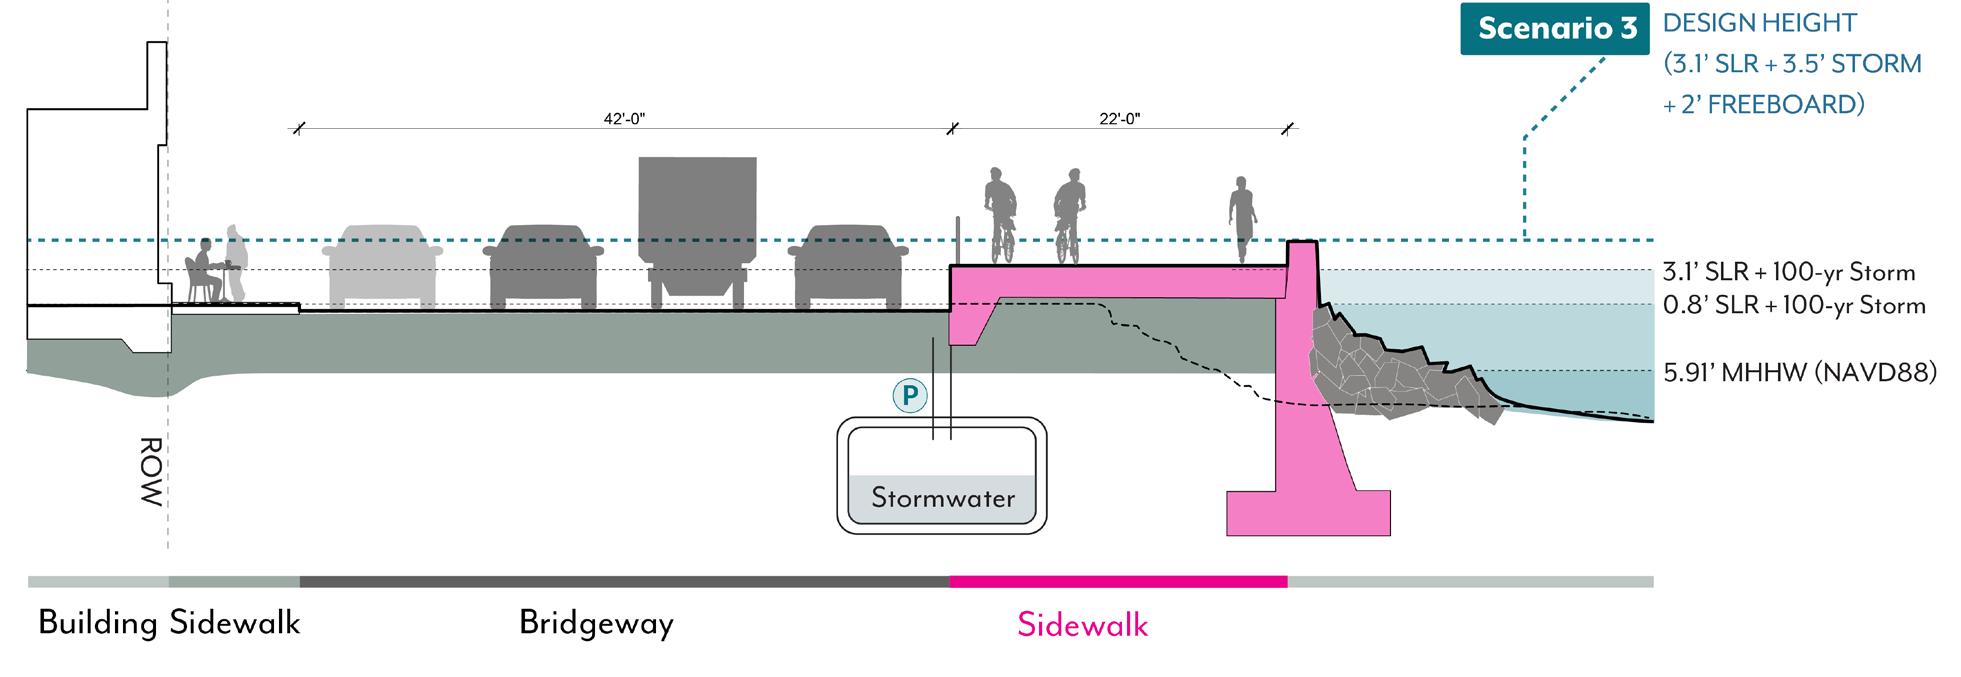
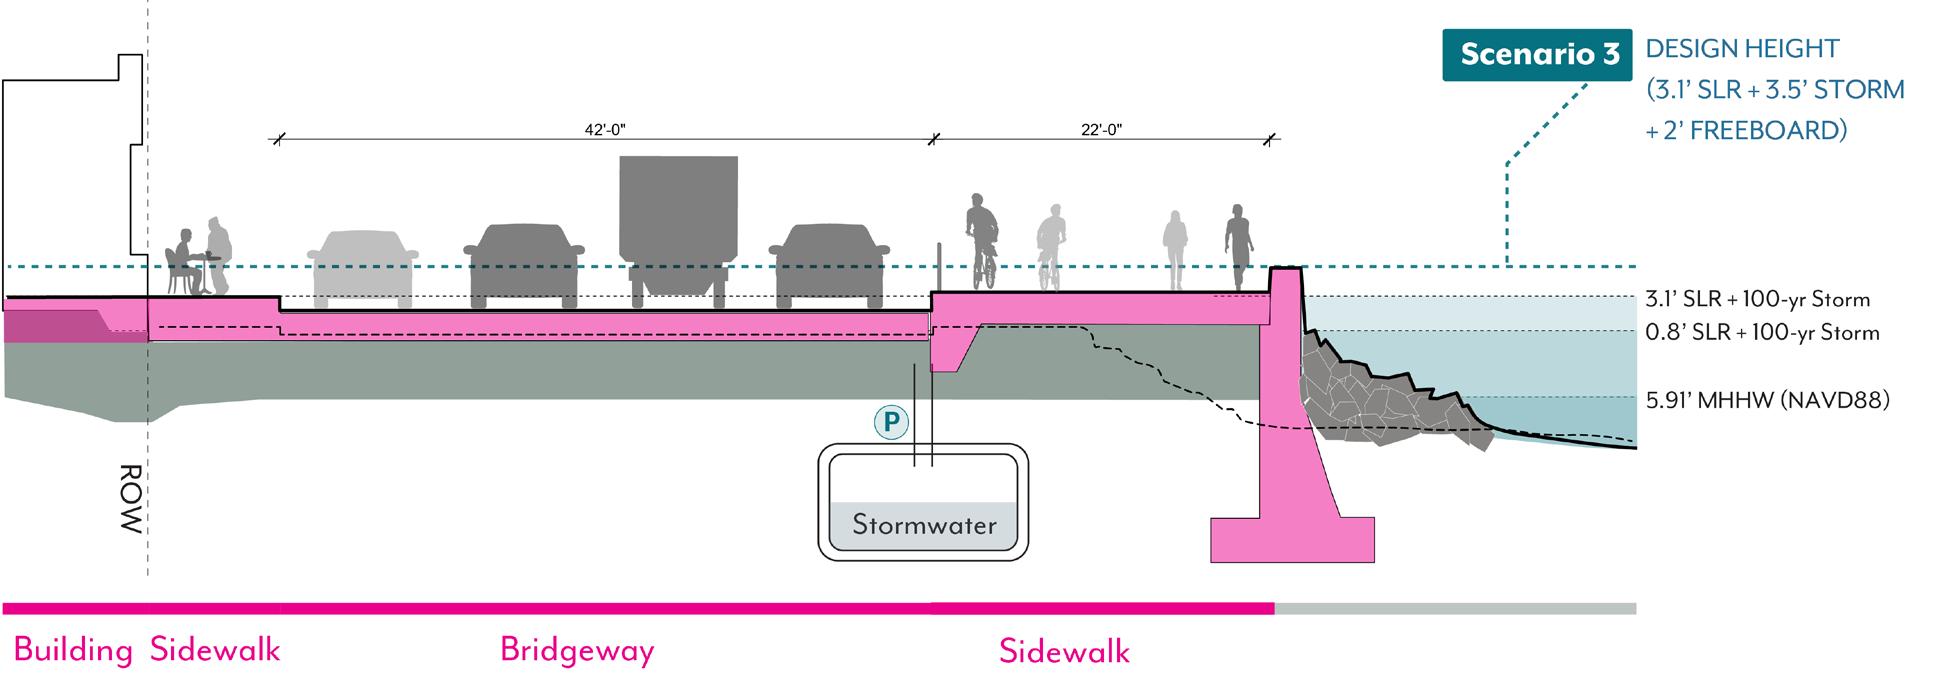
This concept explores the possibilities for constructing a seawall along Bridgeway to end-ofcentury SLR elevations. The seawall provides the primary protection from SLR. The design includes elevating and widening the sidewalk promenade to accommodate pedestrians and bicyclists as a Class I bikeway. Parking and loading can remain in the current configuration. New storm drainage, pumps, and detention facilities are installed to manage water during storm events. The elevated promenade improves waterfront access for pedestrians and bicyclists. The height of the elevated promenade and seawall would obstruct views from the café sitting in front of the buildings. Opportunities for subtidal aquatic habitat features and living breakwater features exist. The estimated cost of Concept B1 ranges from about $55 million to $160 million.
This concept builds off of the previous end-ofcentury seawall design by adding elevated roads and buildings to complement and complete the elevated promenade. This rebuilds the entire corridor higher for greater resiliency and to realize a complete street vision for a world-class waterfront promenade. Each landowner and the City would need to coordinate to take actions for raising the properties and the road. The view to the water is maintained and enhanced with such collective action. Opportunities for subtidal aquatic habitat features and living breakwater features exist. The estimated cost of Concept B2 ranges from about $60 million to $175 million.
The waterfront promenade along Bridgeway presents an opportunity to explore methods in which waterfront connectivity can work in concert with adaptation, balancing the need for a unique waterfront experience with financial cost and impacts on the Bay. An expanded series of layouts for adapting Bridgeway were generated as part of a separate study to illustrate distinct approaches to improving circulation and accessibility to Sausalito’s waterfront while planning for end-of-century climate conditions. The three different concepts presented illustrate various alternative options for navigating pedestrian and bicycle circulation along the proposed future seawall. Additionally, different options within these approaches explore elevating Bridgeway and the adjacent buildings to further flood-proof this focus area. Included in some of these options is a rough order of magnitude cost estimate, which is represented as a range dependent on the design and selected features. While the approaches shown are tailored to the Bridgeway corridor, they illustrate the variety of opportunities for adaptation along other parts of Sausalito’s waterfront.
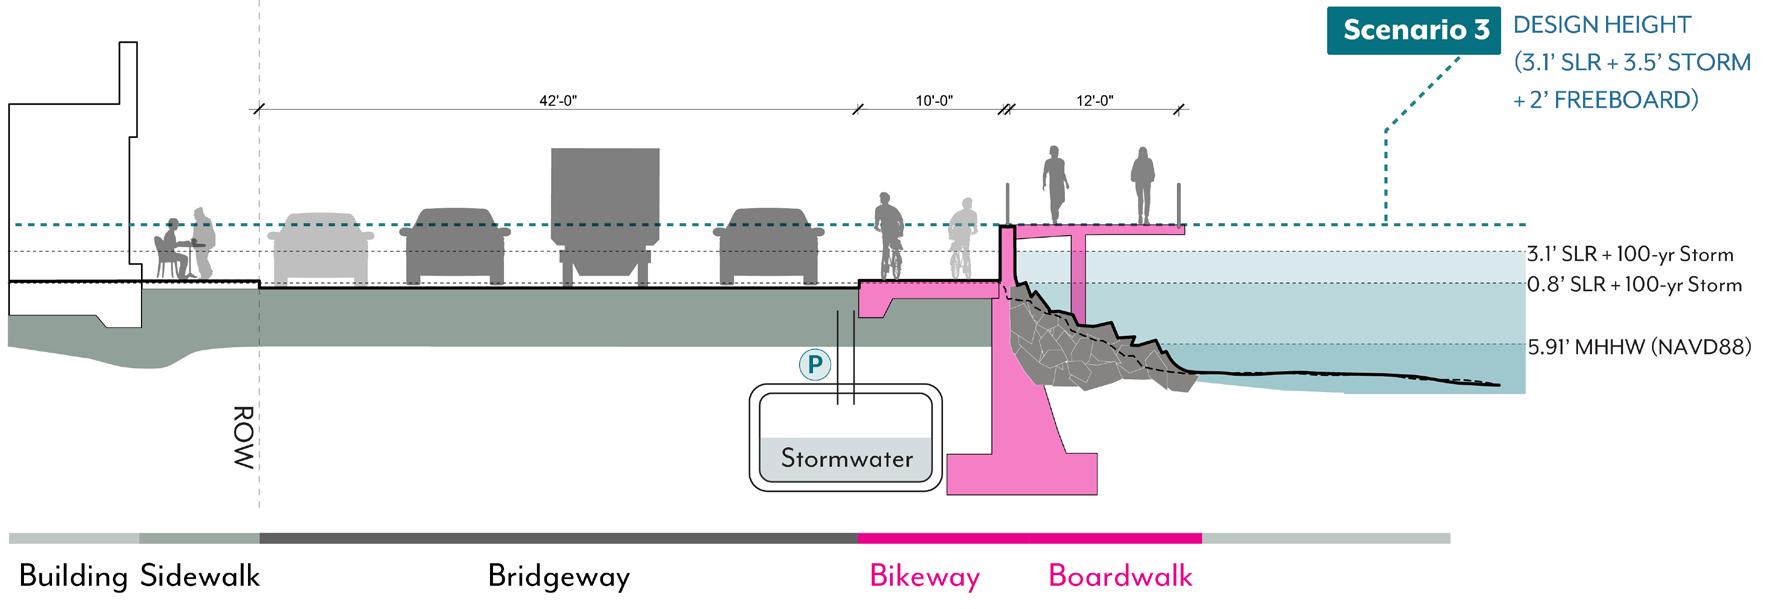
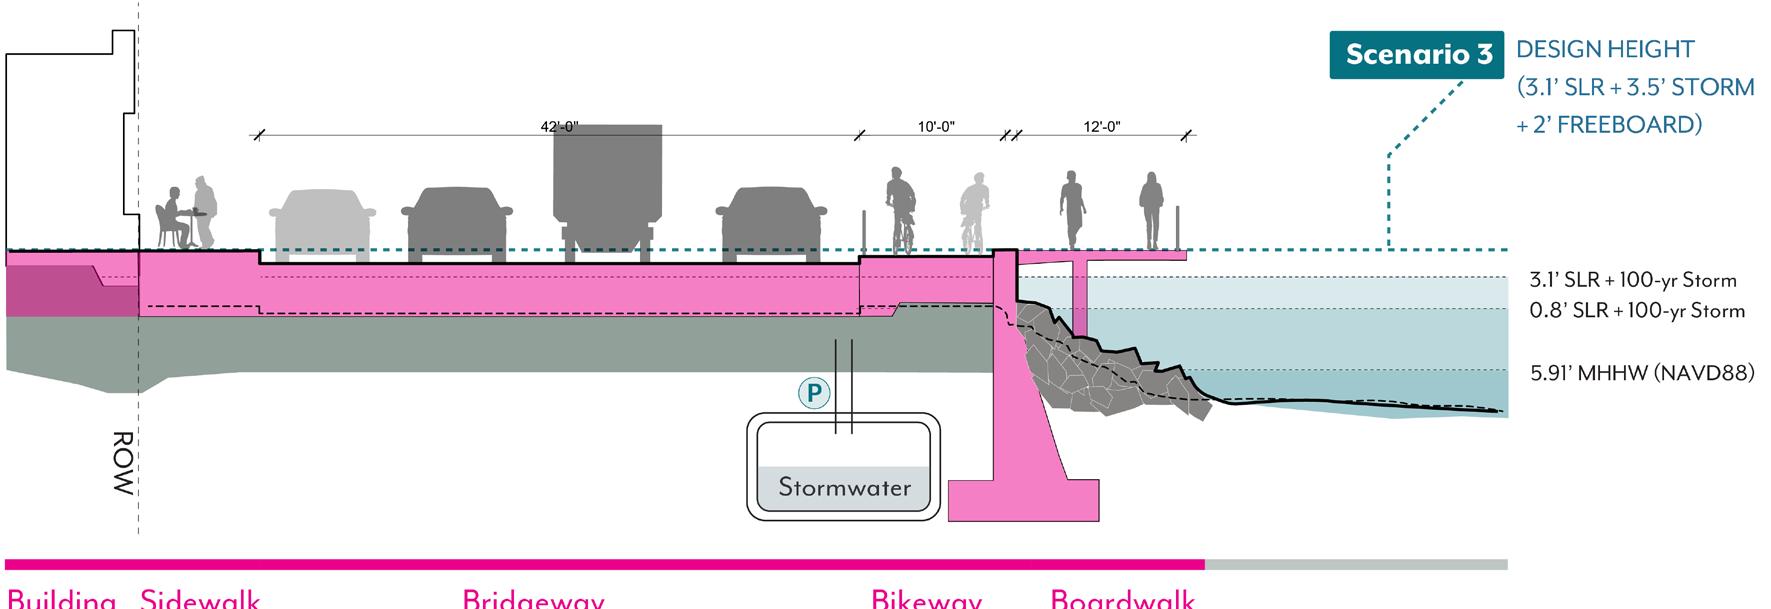
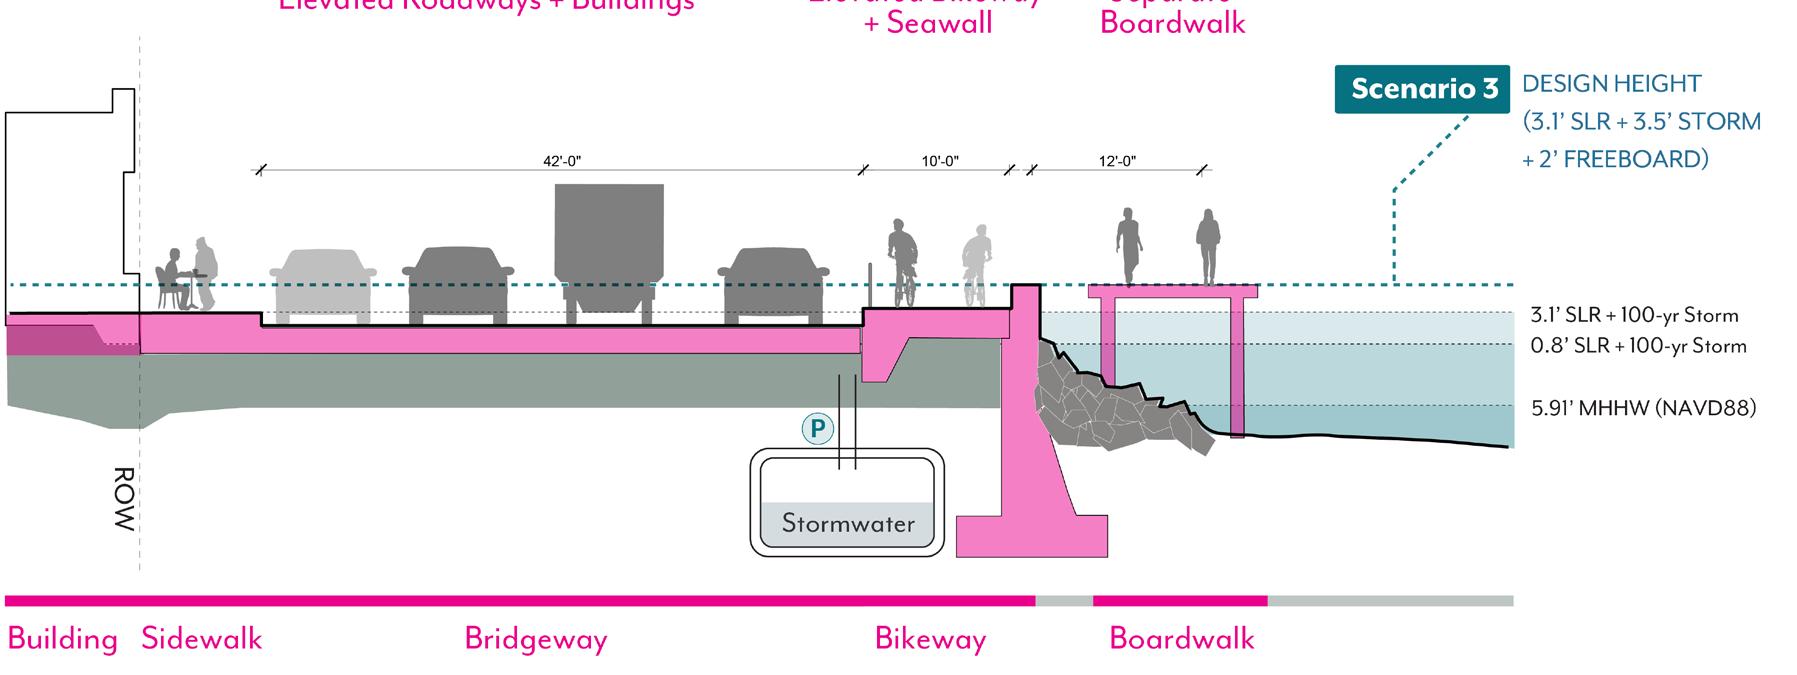
The concept illustrations above were developed to solicit community feedback. Adaptation recommendations are found in Chapter 5.
Concept C provides waterfront pedestrian access using a cantilevered walkway above the shoreline. Concept C1 includes the elevation of only the proposed cantilevered walkway and the elevation of a Class IV bikeway along Bridgeway. This provides enhanced pedestrian experience on the waterfront but may impact views of the water from Bridgeway. The estimated cost of Concept C1 ranges from about $135 million to $385 million.
Concept C2 elevates the road and adjacent buildings to provide additional floodproofing and improve visibility across Bridgeway looking toward the water. Each landowner and the City need to coordinate to take actions for raising the properties and the road. The estimated cost of Concept C2 ranges from about $140 million to $405 million.
Concept D explores the possibility of separating the promenade from Bridgeway. This allows for pedestrian access along the shoreline while bicycle circulation routed along Bridgeway on a Class IV bikeway. This provides an enhanced pedestrian experience by allowing visitors to walk over the water, separated from Bridgeway. Bicycle circulation is routed along a class IV bikeway adjacent to Bridgeway. Additionally, this option elevates the road and adjacent buildings to provide additional floodproofing and visibility across Bridgeway to the waterfront.
Community Character
Preservation of views and a dynamic waterfront that supports Downtown businesses were important factors when evaluating concepts. The low wall provides a simple low cost approach to mitigating some near-term SLR impacts without obstructing views. Longer-term seawall approaches provide opportunities to construct a worldclass promenade, designed to express Sausalito’s unique character. The enhanced promenade serves the critical function of accommodating visitors at Sausalito’s front door.
Shoreline Connection
Connecting people to the water on paths, access stairs, and overlooks were important factors. Bridgeway mobility and safety was discussed at length in a separate project. Useful direction for this project is the long-term opportunity to widen Bridgeway to accommodate a multi-modal configuration. Options to widen the sidewalk into a promenade enhance the waterfront experience for pedestrians. Options that raised only the promenade negatively impact views of the water from adjacent businesses.
Any fill in the Bay is considered to have an ecological impact. Support was given for incorporating special habitat-enhancing materials into the hardened shoreline protection as well as subtidal rocky habitat and eelgrass enhancements if feasible.
Business advocates recognized the importance of protecting the corridor and appreciated the opportunity to consider multi-benefit solutions such as a widened corridor and world-class promenade that attracts visitors. No action results in permanent inundation of Bridgeway and fronting businesses with likely erosion of the roadway and damage to utilities due to the lack of adequate shoreline protection.
Any project has the opportunity to incorporate public art. Low walls or a new promenade are exciting canvases to involve artists.
Concepts show the wide range of estimated cost. A low wall to address SLR by 2050 would be a stranded asset by late century, but offers perhaps a quicker near-term solution to flooding concerns for a cost of $2-3M. More robust options explored the near-term construction of a seawall with a foundation to support future development, including the elevation of the adjacent
pedestrian promenade, that could be incorporated at a later date. These concepts were costed at $55M to $175M. To construct an off-shore pedestrian walkway would increase this cost to $135M to $405M. The phased approach within Concepts B1 and B2 provide flexibility to the City. Noting the total city-wide cost of no action for scenario 1 was estimated to be $160M to $570M.
The proposed options would be constructed within 100 feet of the shoreline, falling in the jurisdiction of BCDC and requiring permits. Priority uses called out by BCDC in the San Francisco Bay Plan include wateroriented recreation, and the scenic drives and bicycling paths proposed herein which apply, particularly as this section forms part of the Bay Trail. Incorporating and prioritizing shoreline recreation sets a strong case for permitting projects along this stretch.
The location of Bridgeway along the promenade as the first exposed asset and publicly owned asset provides a strong case for a collective action approach to SLR adaptation in this reach. By addressing the flooding concerns to this key evacuation and economic corridor, the buildings and business along Bridgeway would also be protected. This approach provides an opportunity to incorporate pedestrian and bicycle infrastructure and potentially expand the ROW for increased community benefit.
TABLe 12: Community Feedback Summary of Focus Area 1: Bridgeway Promenade Concept Explorations
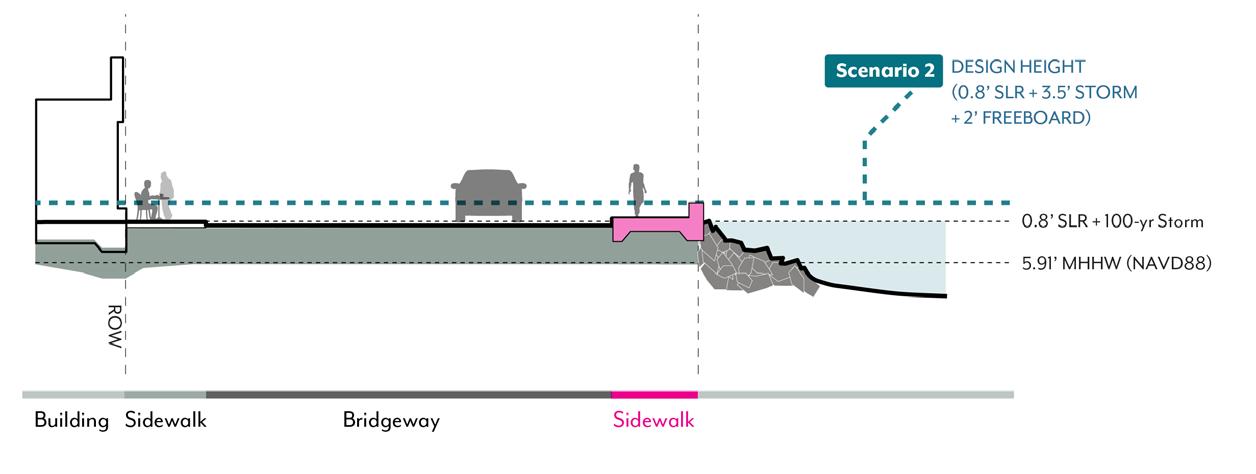
B1. END-OF-CENTURY SEAWALL
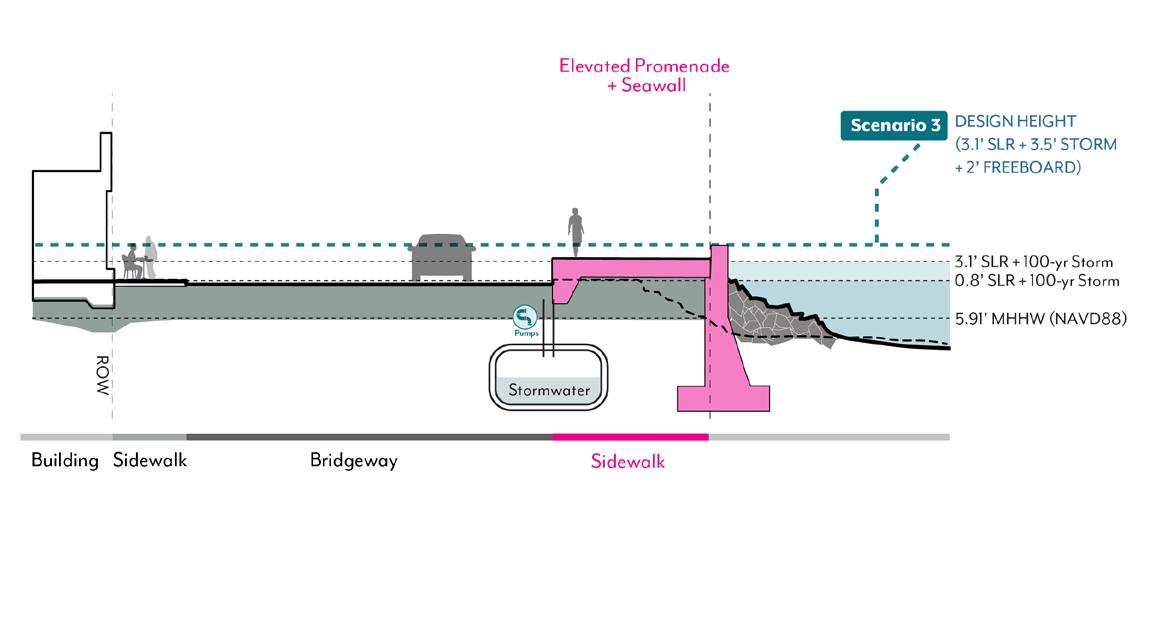
B2. END-OF-CENTURY SEAWALL + ELEVATED ROADWAY
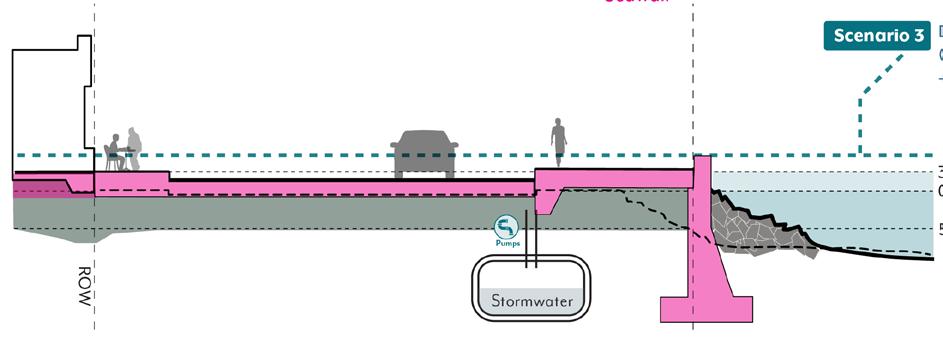
The Community Feedback Summary Table provides a relative evaluation per option on a scale from + to +++ for each of the evaluation criteria. Concepts with +++ indicate greater beneficial impacts and opportunities when compared to those with only + , which signifies relatively fewer positive impacts and opportunities.
COMMUNITY CHARACTER SHORELINE CONNECTION
MID-CENTURY SEAWALL
END-OF-CENTURY SEAWALL
END-OF-CENTURY SEAWALL + ELEVATED ROADWAY
ECOLOGICAL OPPORTUNITIES ECONOMIC VITALITY
ARTS AND CULTURE COST/ CONSTRUCTABILITY PERMITABILITY
COLLECTIVE ACTION / COSTBENEFIT
The New Town Focus Area—extending from the Yacht Harbors near Bay Street to the houseboat communities of Galilee Harbor— reflects a layered evolution of Sausalito’s postwar growth, civic life, and waterfront creativity. Unlike Old Town’s historic village character or Marinship’s wartime industrial legacy, New Town was developed later, on filled tidelands, to accommodate expanding public space, new businesses, and a growing population. Over time, this area has grown into a vibrant mix of civic, recreational, and residential uses, while maintaining its deep connection to the water.
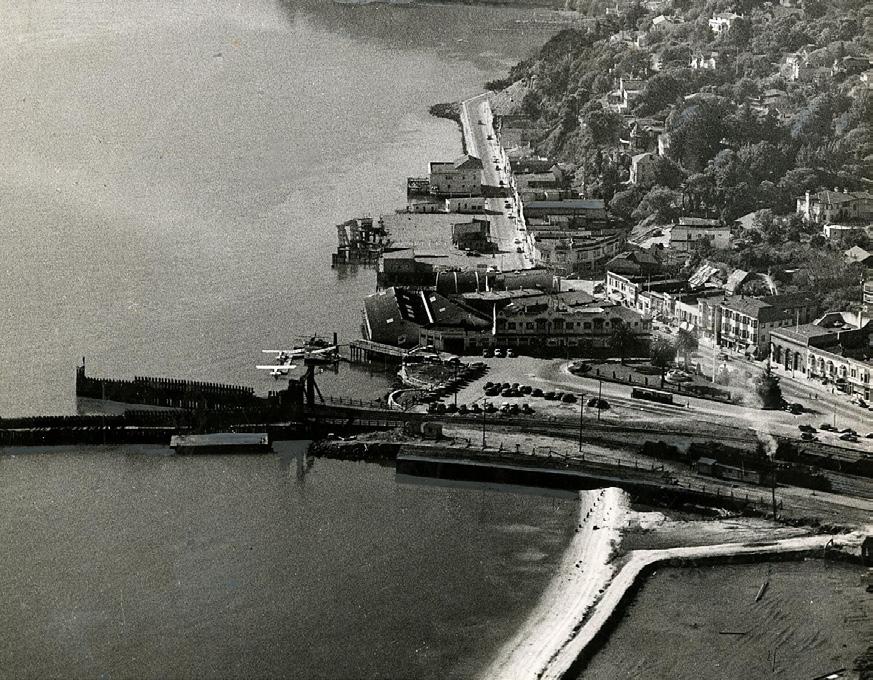
New Town is home to some of Sausalito’s most diverse and beloved waterfront spaces. The Yacht Harbors between Bay and Johnson Streets define the city’s recreational boating culture, while the Bridgeway commercial spine between Johnson and Turney Street extends the downtown core and offers a lively mix of restaurants, shops, and walking paths that blend daily life with visitor activity. The active food and beverage scene that includes the Joinery, from Turney to Litho Street, creates a more casual, social stretch of the shoreline with direct water views and outdoor gathering spaces. Public piers and ramps are well used by locals to launch kayaks and water craft for recreation. Its not uncommon to see someone carry a paddleboard across Bridgeway to launch at the Turney Street pier. Dunphy Park, a large open-space anchor, serves as a civic hub and community event space, frequently hosting local festivals and recreation. At the northern edge, Galilee Harbor stands out as a cooperative live-aboard community that reflects Sausalito’s alternative housing spirit and working waterfront legacy. Together, these subareas showcase a layered, community-centered shoreline that is functional, lived-in, and welcoming.
New Town’s shoreline supports a wide range of uses—from mooring slips and restaurants to kayak launches, bike trails, parks, and cooperative housing. Shoreline treatments range from bulkheads to nonengineered scarps that erode. Some existing building foundations are integrated into the shoreline treatment. It is one of Sausalito’s most actively used waterfront areas and a critical link between civic space, tourism, and residential life. However, much of this area sits on low-lying, filled land and is highly exposed to sea level rise, groundwater intrusion, and storm-related flooding. Parts of the shoreline—particularly near Dunphy Park and Galilee Harbor—already experience frequent drainage challenges and localized flooding. Infrastructure, including public pathways, roadways, and park facilities, may require elevation or redesign to remain viable in the future.
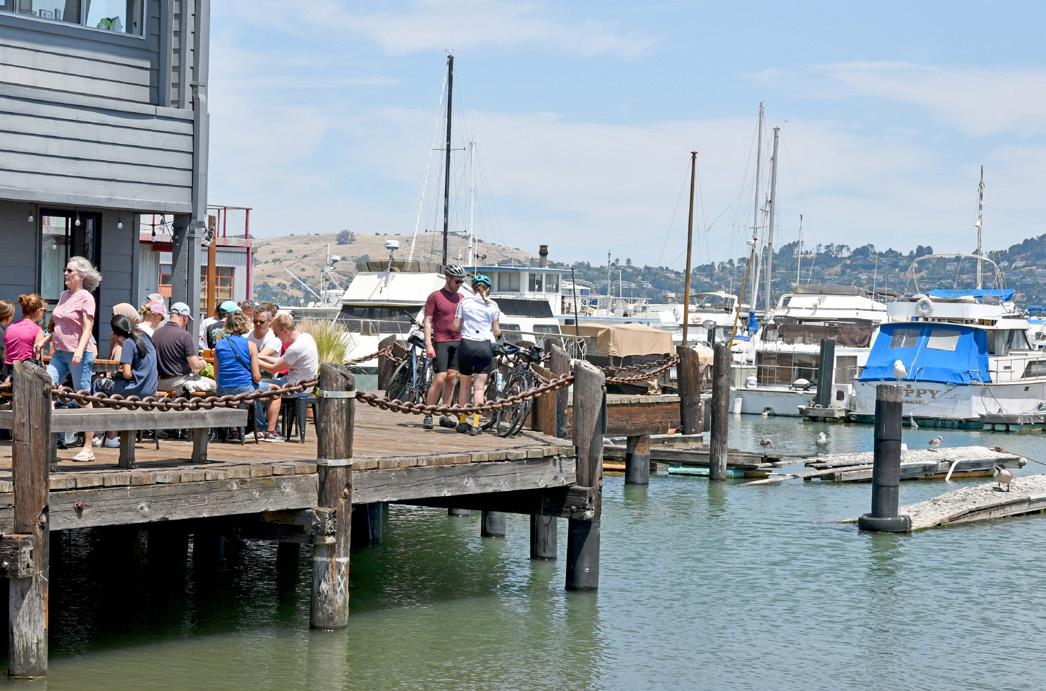
Refer to Vulnerability Chapter 1, Section 4.3 for more detailed analysis on vulnerable assets and cost of no action.
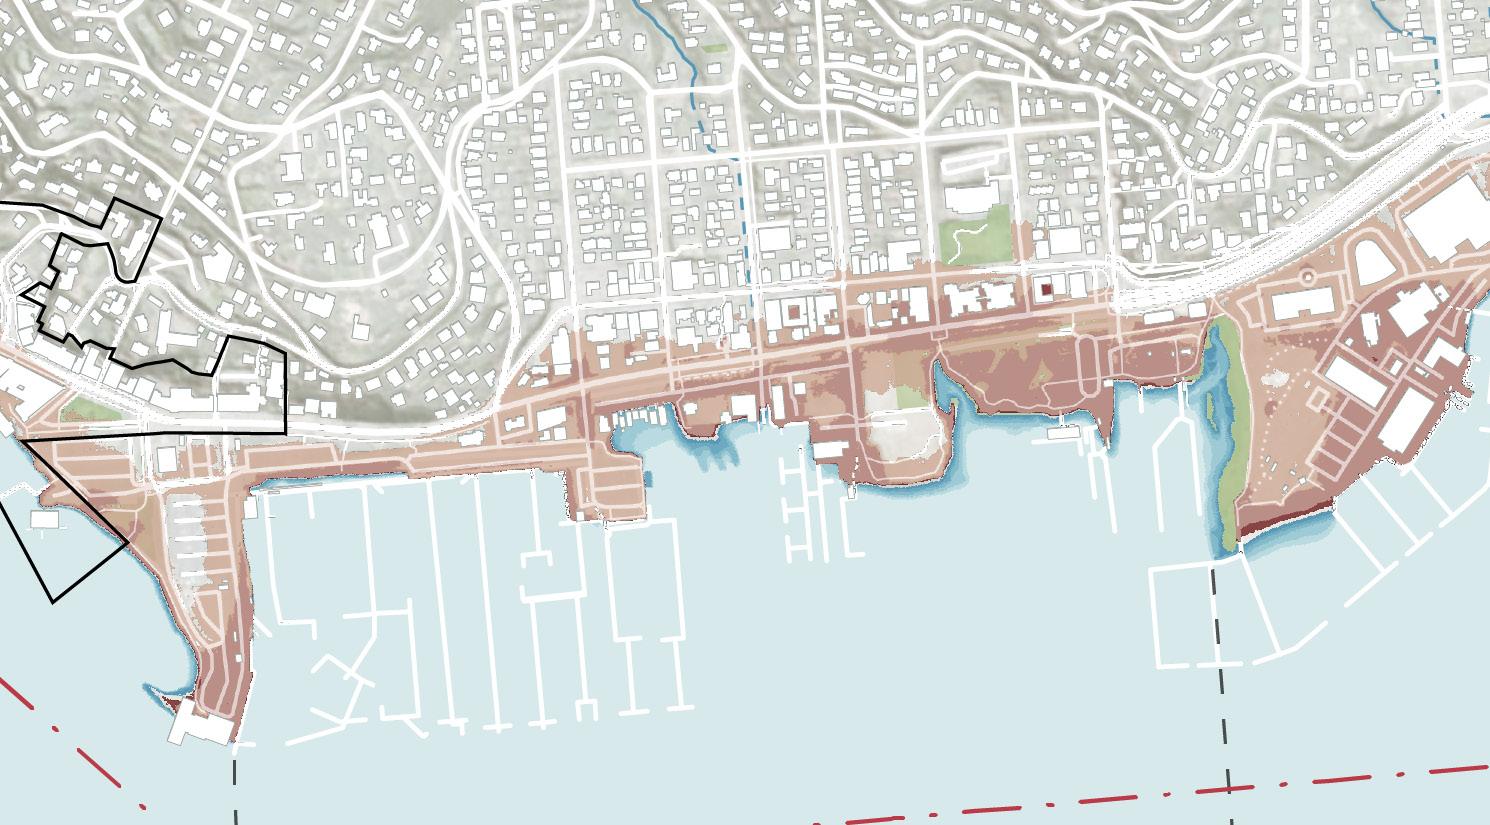
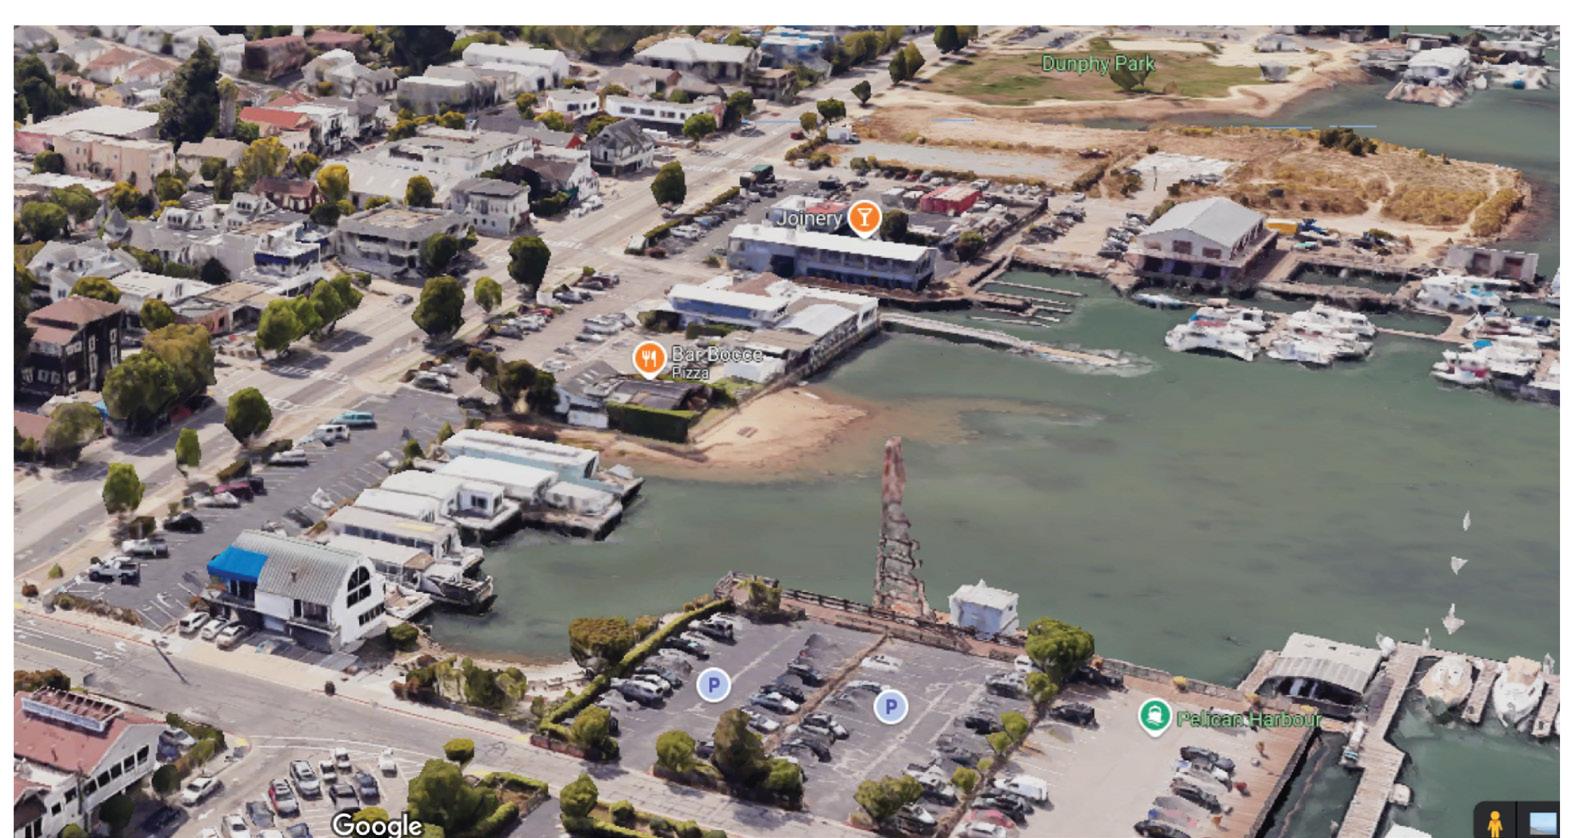
In mid-century scenario without storm (Scenario 1), some shoreline segments at Yacht harbors parking lot and Turney Street boat ramp are impacted. In mid-century with storm scenario (Scenario 2), water further encroaches the Johnson Street to Dunphy Park. Majority of Dunphy Park will become inundated.
In the end-of-century scenario (Scenario 3), Bridgeway, north of the Spinnaker experiences regular tidal flooding. East-west connector streets such as Locust, Litho, and Bee are also flooded.
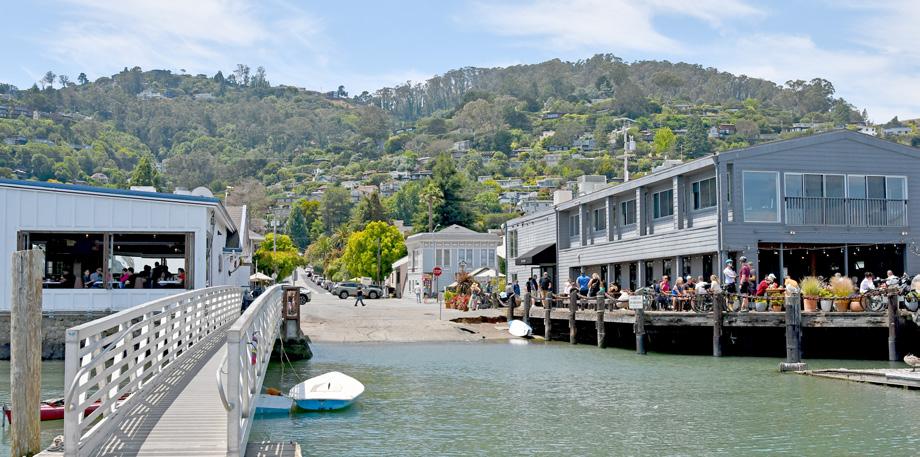
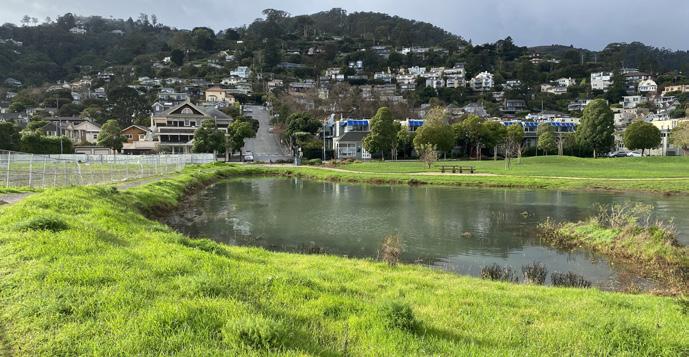
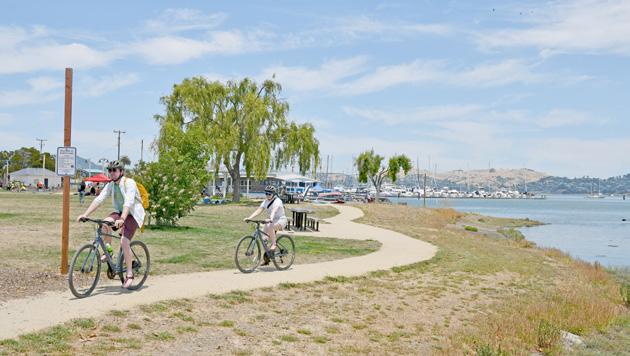
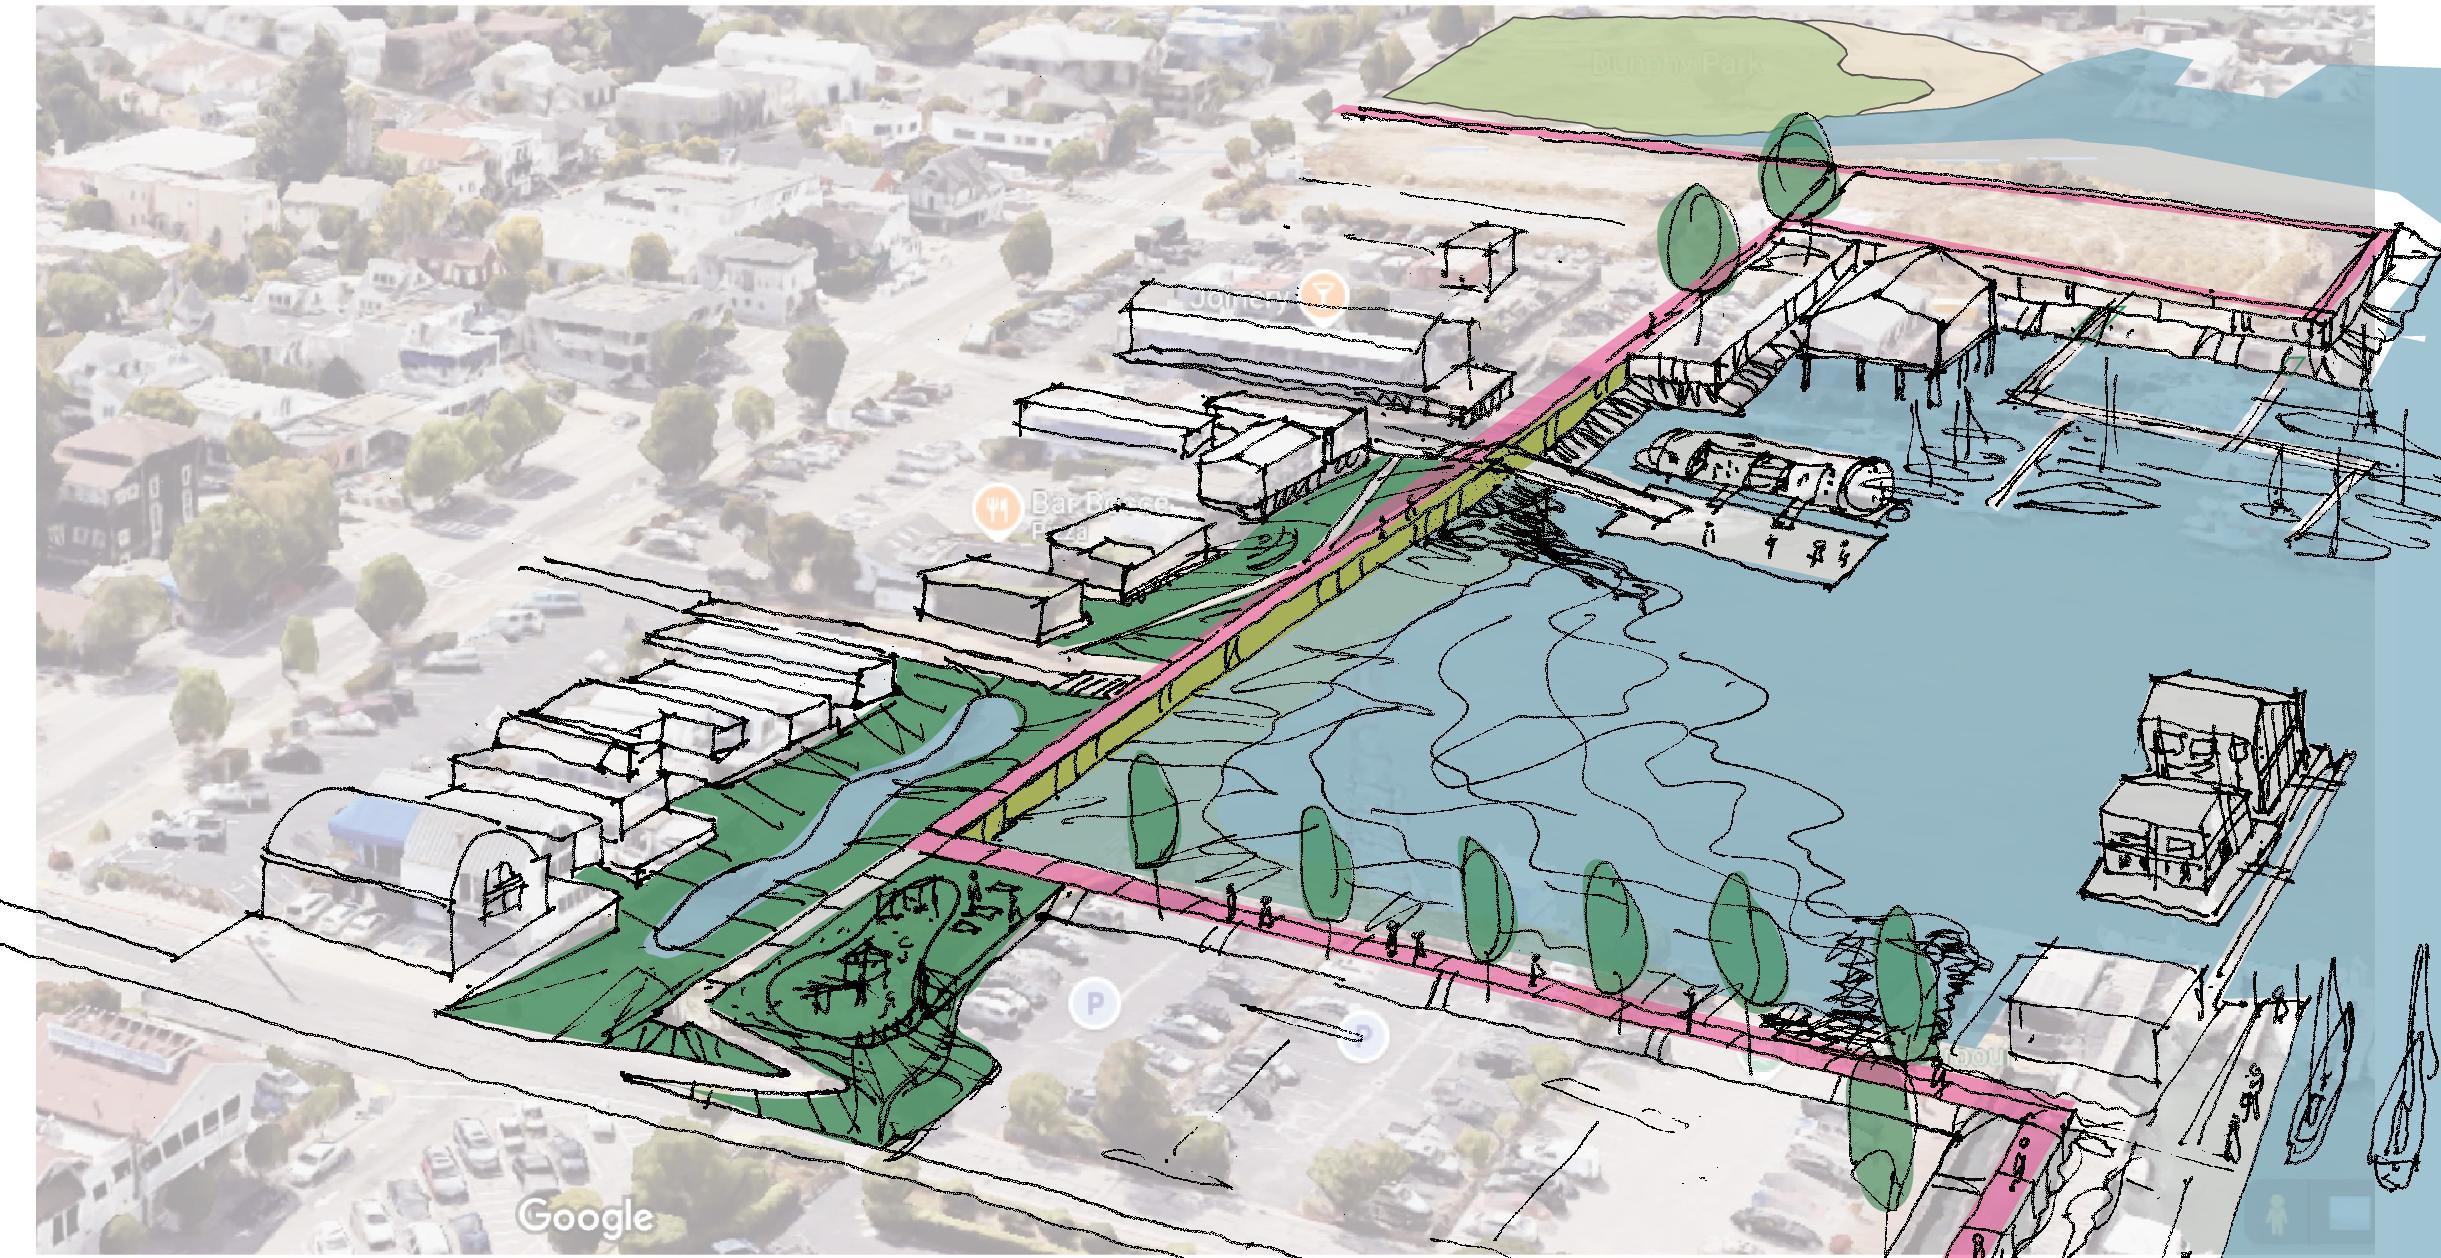
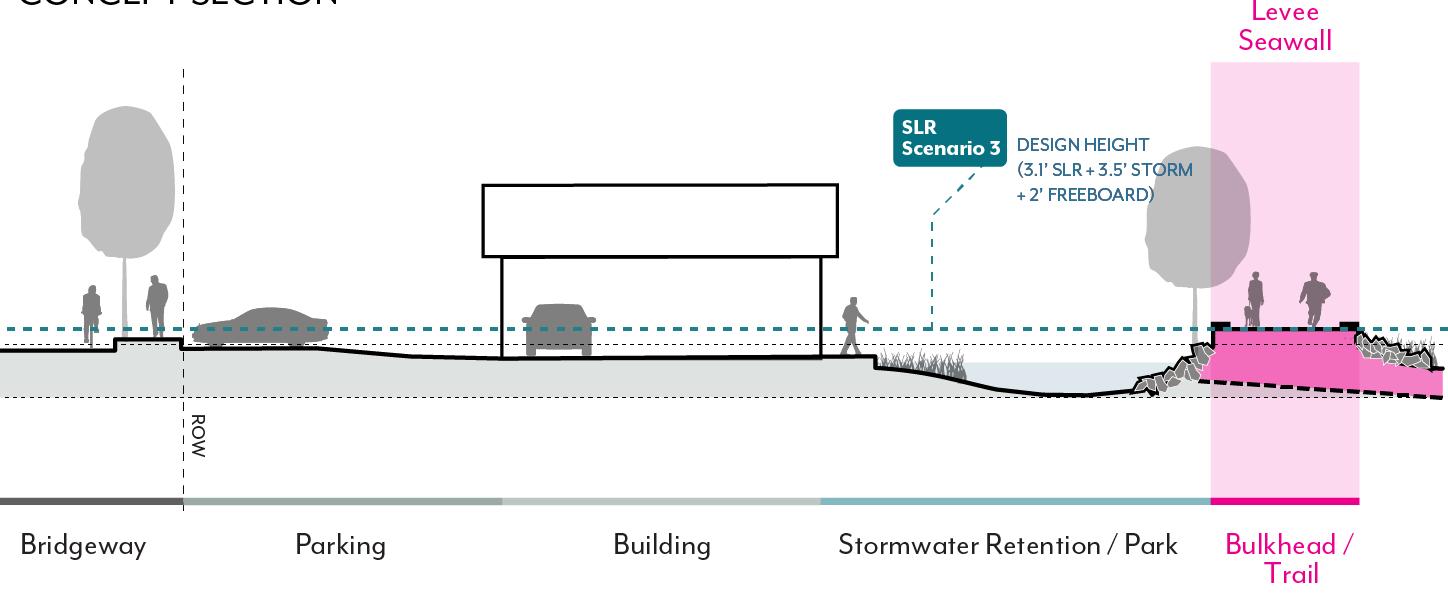
This concept exploration illustrates a levee built offshore along the City right-of-way to protect inland areas. Areas include existing buildings like the Joinery, parking areas, Bridgeway, and the buildings that face Bridgeway. Stormwater detention and pump systems are required behind the wall to manage excess volumes from flooding behind the levee. Public access is provided along the top of the levee and boat ramps are constructed up and over the levee. Buildings and docks on the water side need to be adapted – using various strategies such as raising land, floating buildings, and erecting piers. Buildings that were once located over the shoreline are now behind the levee, protected from flooding and overlooking stormwater detention features, but losing their direct connection with the Bay. Habitat opportunities exist along the levee edge that can help reduce impacts from waves.
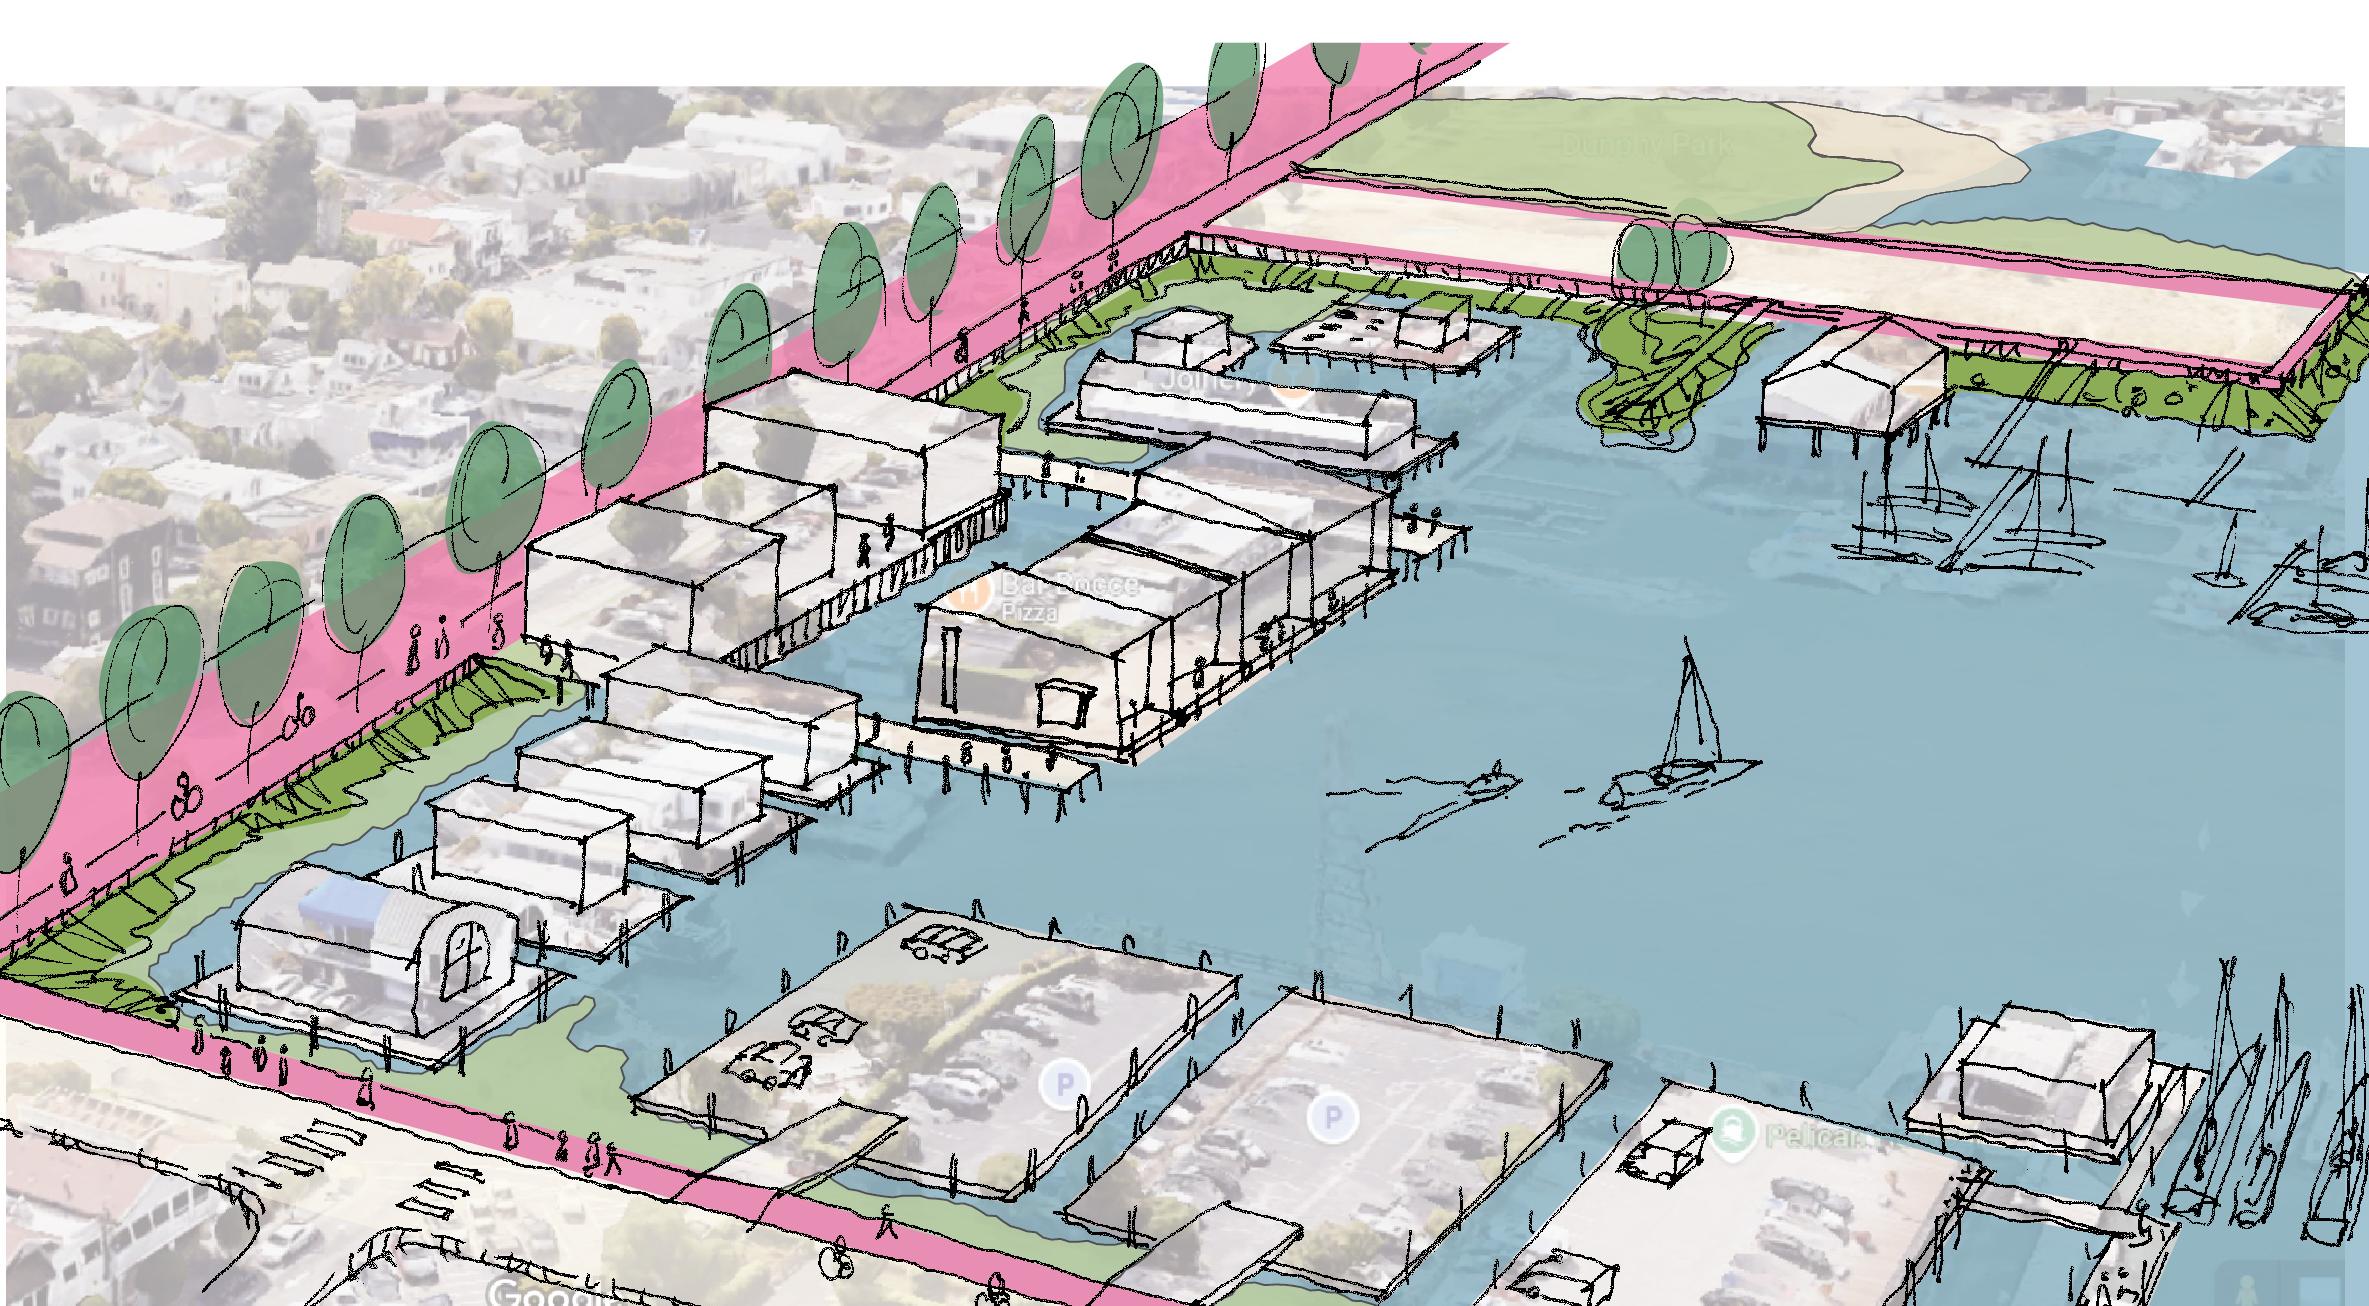
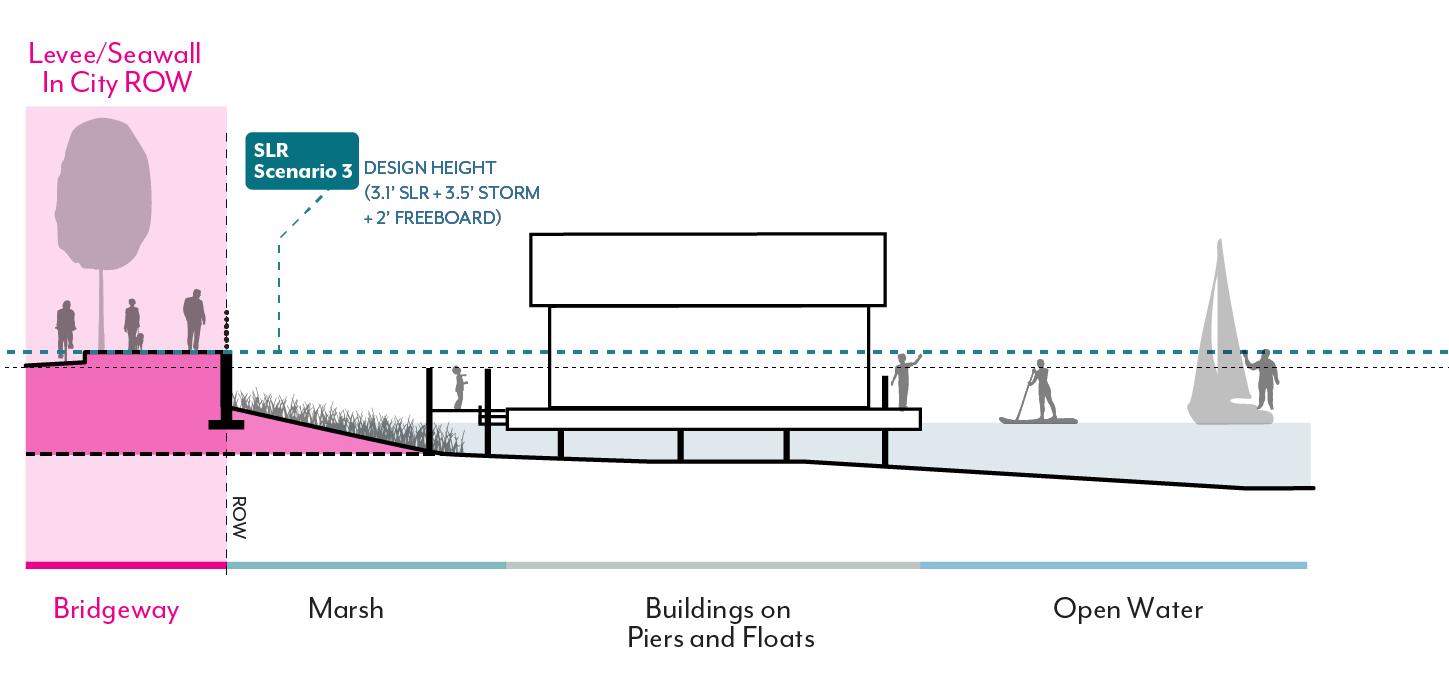
In this concept exploration, Bridgeway is elevated and reinforced with an integrated seawall like the Embarcadero in San Francisco. Existing buildings and functions on the waterside of Bridgeway are adapted individually by owners to be on fixed piers or on floating barges. Some shoreline properties may be filled and elevated to stay dry. The connections between buildings would evolve over time as they adapt to new elevations. New piers and walkways around floating buildings provide a unique water edge experience for the public. Water access encourages personal watercraft access to buildings and the greater Bay. Bridgeway is reimagined as a multi-modal, complete street with widened sidewalks, a Bay Trail promenade for bikes, and access to businesses and the water. Some existing land areas may become submerged and support aquatic habitats.
Buildings along the landside of Bridgeway are raised or rebuilt by owners to meet the new elevation of the street. This occurs over time, however, buildings that remain at a low level are subjected to flooding and challenging access.
Concept explorations that maintained closer adjacency between businesses and the water are believed to better support community character. The takeaway from community input is that access to water is key to character. Existing businesses and buildings are valued. Bridgeway is an important spine to be protected. Adapting shoreline buildings as piers or floating structures is supported. Surface parking lots are seen as an eyesore to some and encouraged to be de-emphasized on the waterfront. No action results in degradation of existing buildings and permanent flooding of Bridgeway.
While Concept A offers opportunities for a new shoreline trail, there is a greater concern about blocking bay access and views from Bridgeway and existing shoreline buildings. Concept B creates a stronger connection between Bridgeway and the Bay edge. The Turney Street ramp and public docks are highly valued and noted to be currently in poor condition. The City is currently developing plans for a redesigned ramp and dock.
Eelgrass beds are encouraged along with
any tidal marsh migration between buildings as afforded by setting the resilient edge back. Some concerns about the loss of potential aquatic habitat are noted if new buildings are built over water where they do not currently exist.
Bridgeway should be protected to preserve access through the city and to local businesses. Concept A raised concern about risk to businesses due to catastrophic failure to the levee or the associated pump systems, resulting in flooding of buildings and Bridgeway. The no action scenario degrades buildings and obstructs access, reducing economic vitality.
Priority is given to preserving arts and cultural events on the waterfront such as those held at Dunphy Park.
Cost estimates for the two proposed adaptation options in this focus area were not developed, but from a preliminary evaluation Concept A was assessed to be more effort than Concept B in terms of cost/ constructibility as reflected in the table. The City may have more opportunity to pursue Concept B due to ownership of some areas currently in open water and local expertise in building floating structures. This unique capability sets it apart from many coastal communities, where such features are not
present. The constructability challenges associated with Bay fill and raising onshore infrastructure may surpass those of developing floating infrastructure on the water.
Between the two adaptation options explored, Concept A would have more significant permitting concerns than Concept B; the shoreline moves outward, extending land area into the Bay, requiring fill. This project would need to address environmental concerns and meet BCDC’s expectations for approval.
Collective Action Opportunities/CostBenefit
Both options explored for this focus area incorporate collective action to address SLR risks. For both concepts, the resilient edge would be located in City right-of-way, either offshore (Concept A) or along Bridgeway (Concept B). Concept B would require more individual action from the private sector to adapt buildings, which might include floodproofing, elevating, or floating.
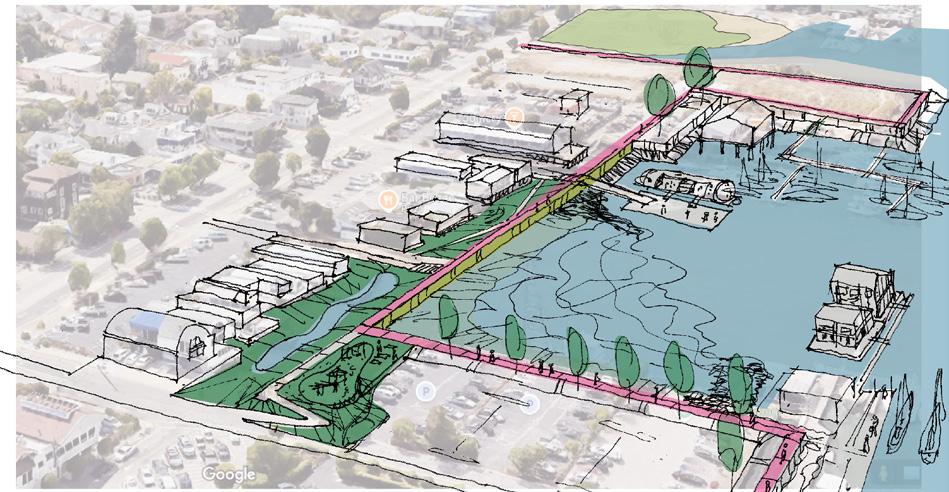
B. BRIDGEWAY AS THE RESILIENT EDGE
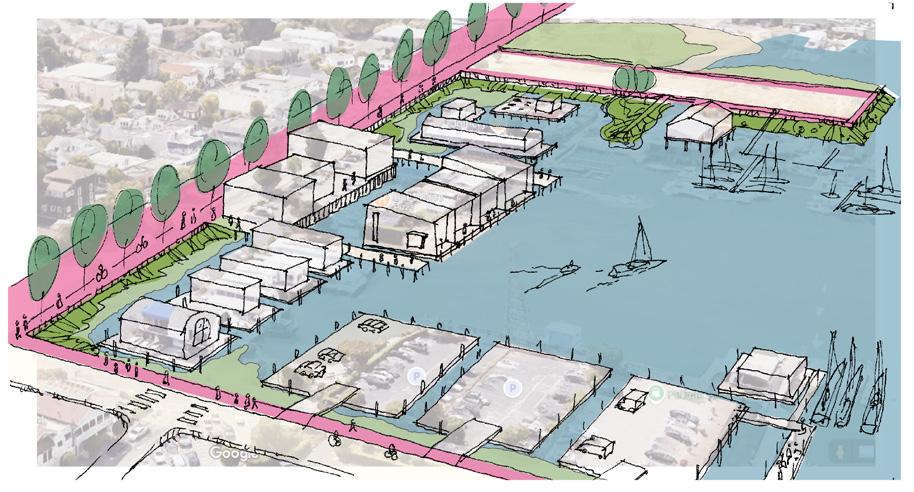
The Community Feedback Summary Table provides a relative evaluation per option on a scale from + to +++ for each of the evaluation criteria. Concepts with +++ indicate greater beneficial impacts and opportunities when compared to those with only + , which signifies relatively fewer positive impacts and opportunities.
TABLe 13: Community Feedback Summary of Focus Area 2: New Town Concept Explorations
RESILIENT EDGE OFFSHORE
BRIDGEWAY AS THE RESILIENT EDGE
COMMUNITY CHARACTER SHORELINE CONNECTION
ECOLOGICAL OPPORTUNITIES ECONOMIC VITALITY
ARTS AND CULTURE COST/ CONSTRUCTABILITY
PERMITABILITY
COLLECTIVE ACTION / COSTBENEFIT
The Marinship district was established during World War II as a shipyard that produced Liberty ships and tankers. The shoreline was rapidly changed by excavating hillsides and filling the Bay to create the developed area east of Bridgeway we know today. The wartime boom brought a diverse workforce to Sausalito and nearby Marin City and laid the foundation for a vibrant, mixeduse waterfront. After the war, Marinship transitioned into a creative and industrial enclave, attracting artists, maritime trades, and houseboat communities that continue to define its character today.
Character in the Marinship is rooted in its historic working waterfront that continued post war as the shipyards were closed. The manufactured shoreline supported facilities to pull ships onto land for repairs. These services are valued locally and serve a much larger western regional market. These
uses are concentrated near Wateree Street and the north end of Gate 5 Road. Active boatyards like Spaulding Marine Center and Bob’s Boatyard keep maritime trades alive, offering boat repair, woodworking, and apprenticeship programs. Other marinerelated businesses like Keefe Kaplan Maritime Inc. (KKMI), Maritime Welding, and various small fabricators—often operating out of low-slung, metal-sided structures that speak to the area’s functional, unpolished charm – are also found in the Marinship. Current flooding and future SLR projections may be a factor to limit reinvestment, or it may be that the uses don’t require updated facilities. In contrast, newer buildings are maintained at a level typical for market rate commercial businesses. Today the district is a blend of maritime workshops, commercial retail, office, and marinas. The character varies by block with some parts feeling rustic and funky while other parts appear planned with curbside sidewalks, parking lots, and office buildings. Arts and culture is present with public art and galleries contributing to a sense of place. Industrial Center Building (ICB), once a wartime machine shop, now houses over 100 artists and creative professionals, blending industrial heritage with cultural production.
Today, Marinship remains one of the few working waterfronts in the Bay Area that supports active maritime industries alongside light industrial uses, restaurants,
offices, creative businesses, and liveaboard communities. The district features a patchwork of building types—from industrial metal-clad warehouses and boat yards to modern office buildings and floating homes—reflecting its layered evolution over time.
Land use per the 2021 General Plan is a mix of Industrial, Waterfront, Public Parks, Public Institutional, and Commercial Waterfront. The Marinship Specific Plan also describes land uses and preservation policies. Policies support working waterfront uses such as ship repair. Vacant and underutilized parcels are encouraged to be studied for redevelopment.
The generally low lying area is increasingly vulnerable to sea level rise, tidal flooding, groundwater rise flooding, and aging infrastructure. Gate 5 Road and the adjacent properties experience monthly flooding. Aging and insufficient infrastructure is noted. Some current flooding is assumed to be related to sea water traveling up the storm drain pipes from the Bay at high tides. Land settlement is occurring and exacerbates flooding.
The following section explores a range of adaptation alternatives explored in response to both the physical vulnerabilities and the values of the community.
Refer to Vulnerability Chapter 1, Section 4.3 for more detailed analysis on vulnerable assets and cost of no action.
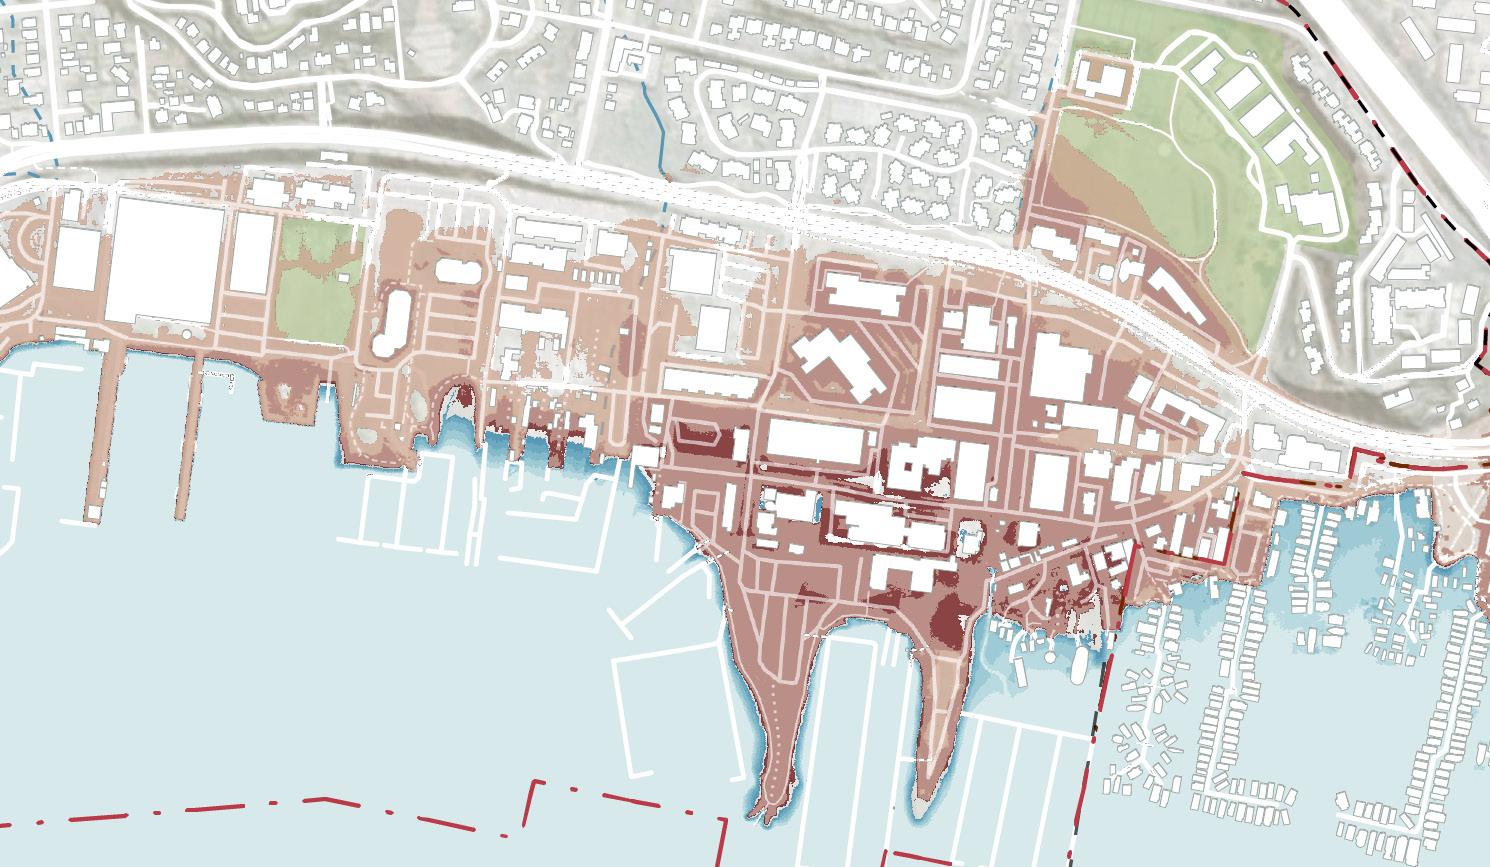
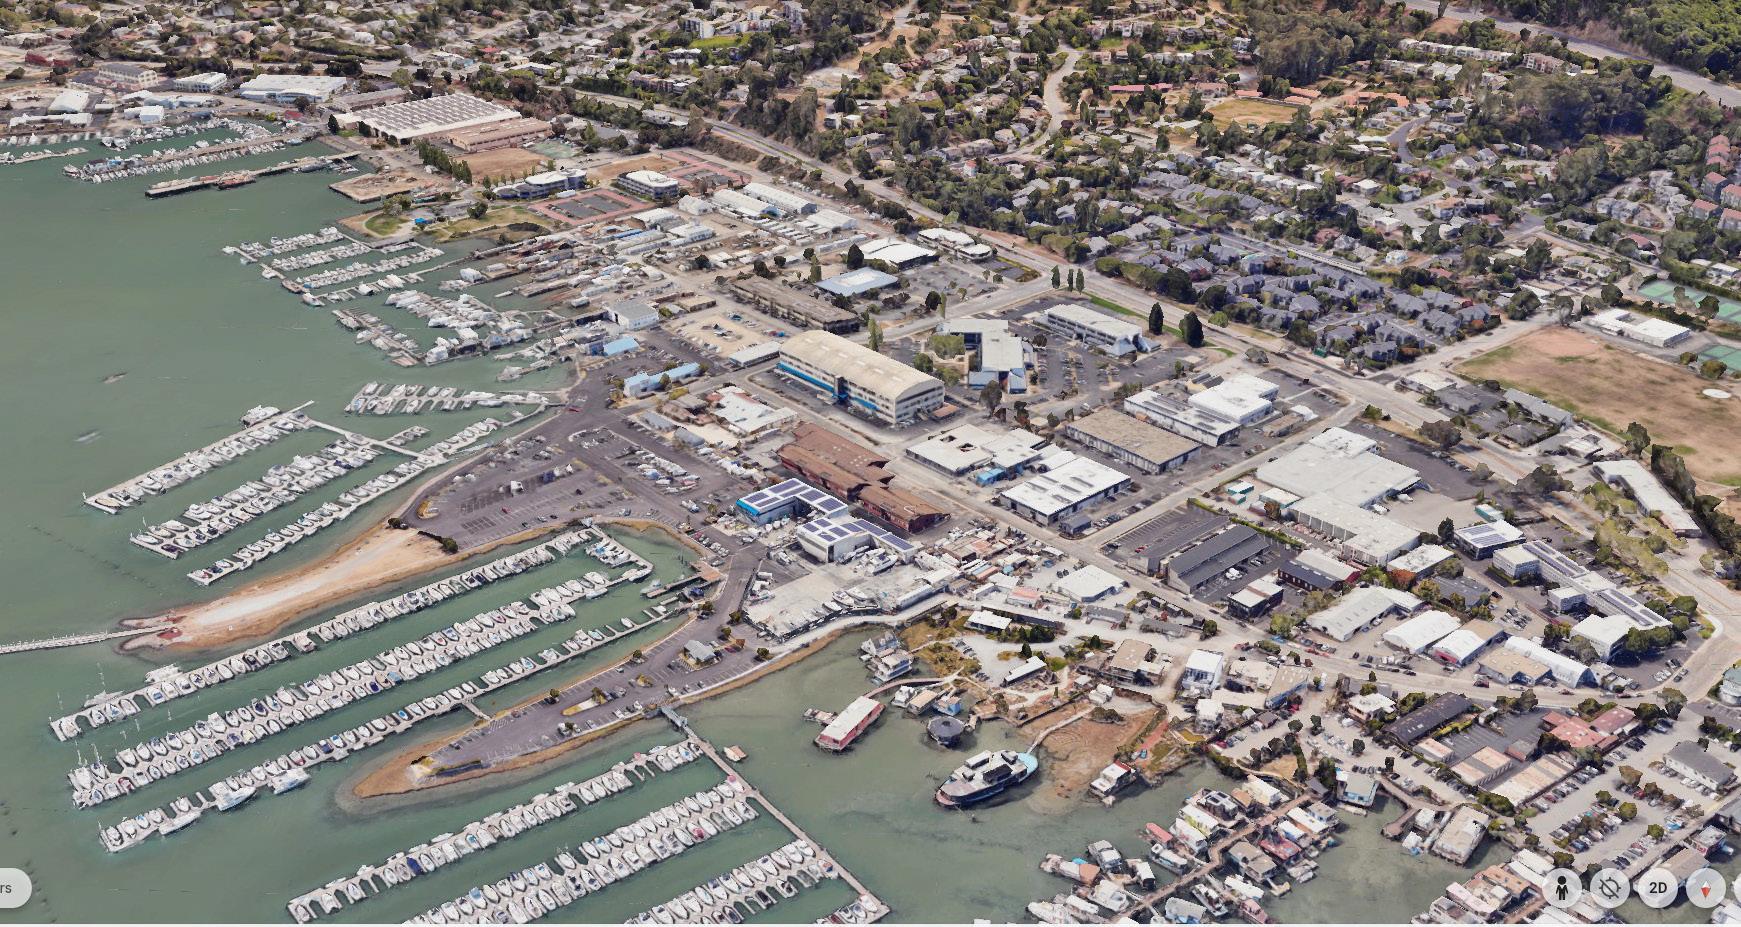
Local roads such as Gate 5 and many floating facilities in Varda Landing will experience a major impact in mid-century scenario of SLR (scenario 1) with its low-lying topography.
Most of the coastal zones east to the Bridgeway will be inundated in the end-of-century scenario with storm surge (scenario 3).
Access and circulation can be constrained due to narrow roads and limited public transit options, posing potential evacuation challenges. Flooding is compounded by emergent ground water and fluvial sources.
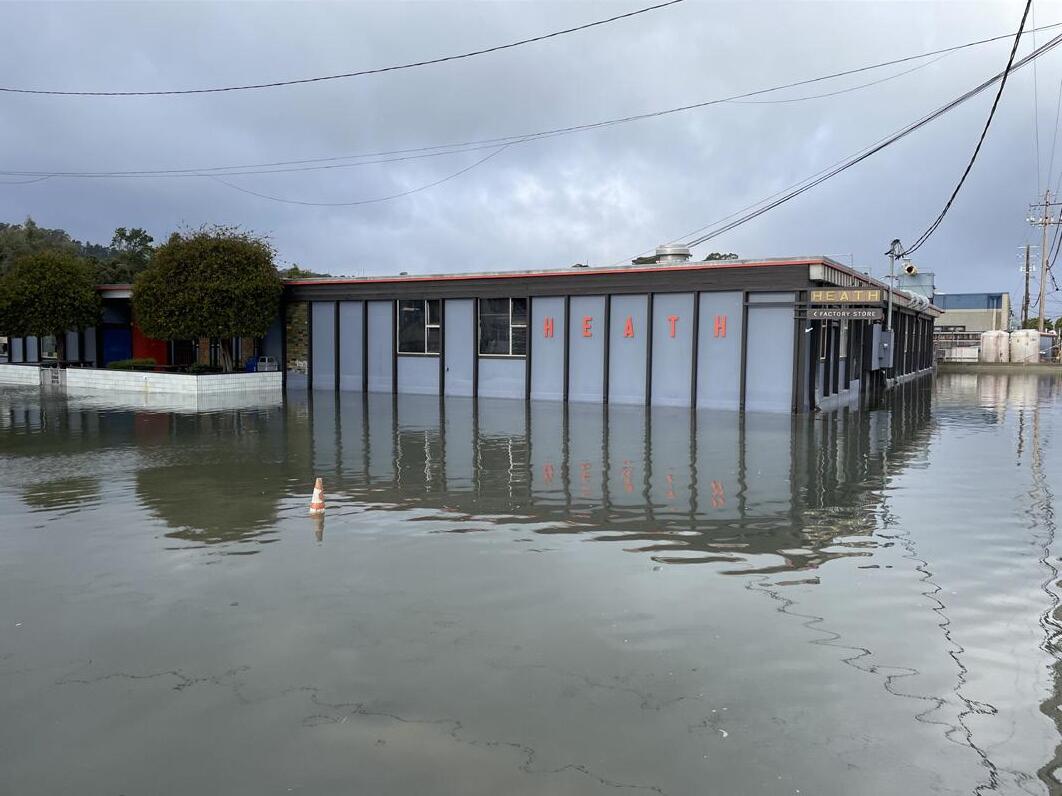
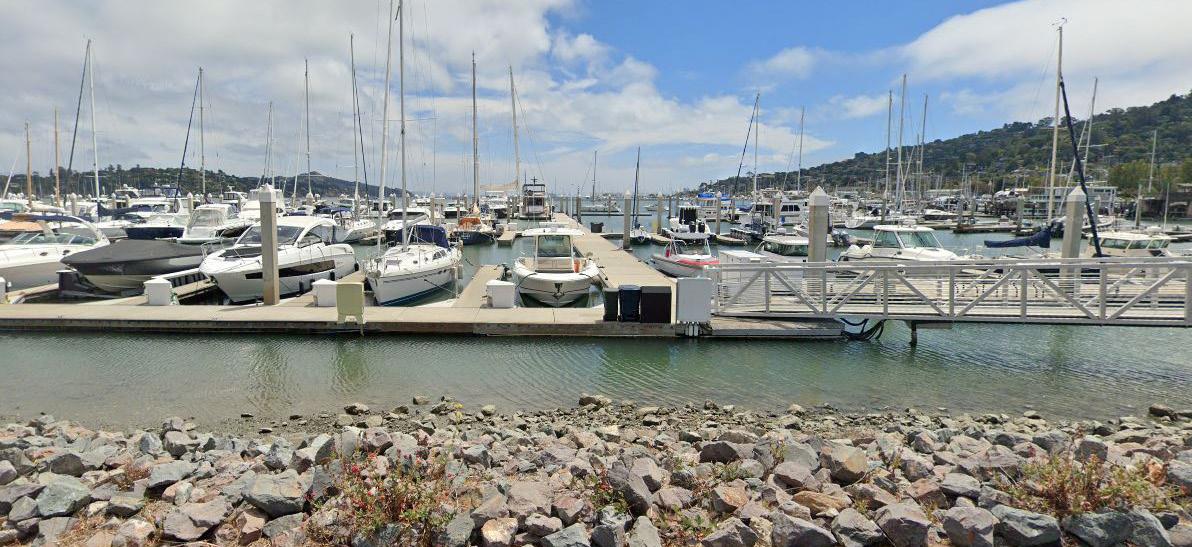
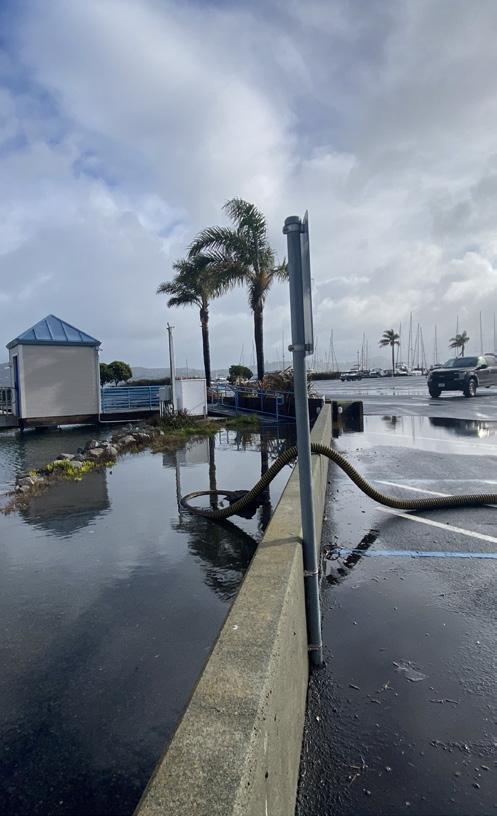
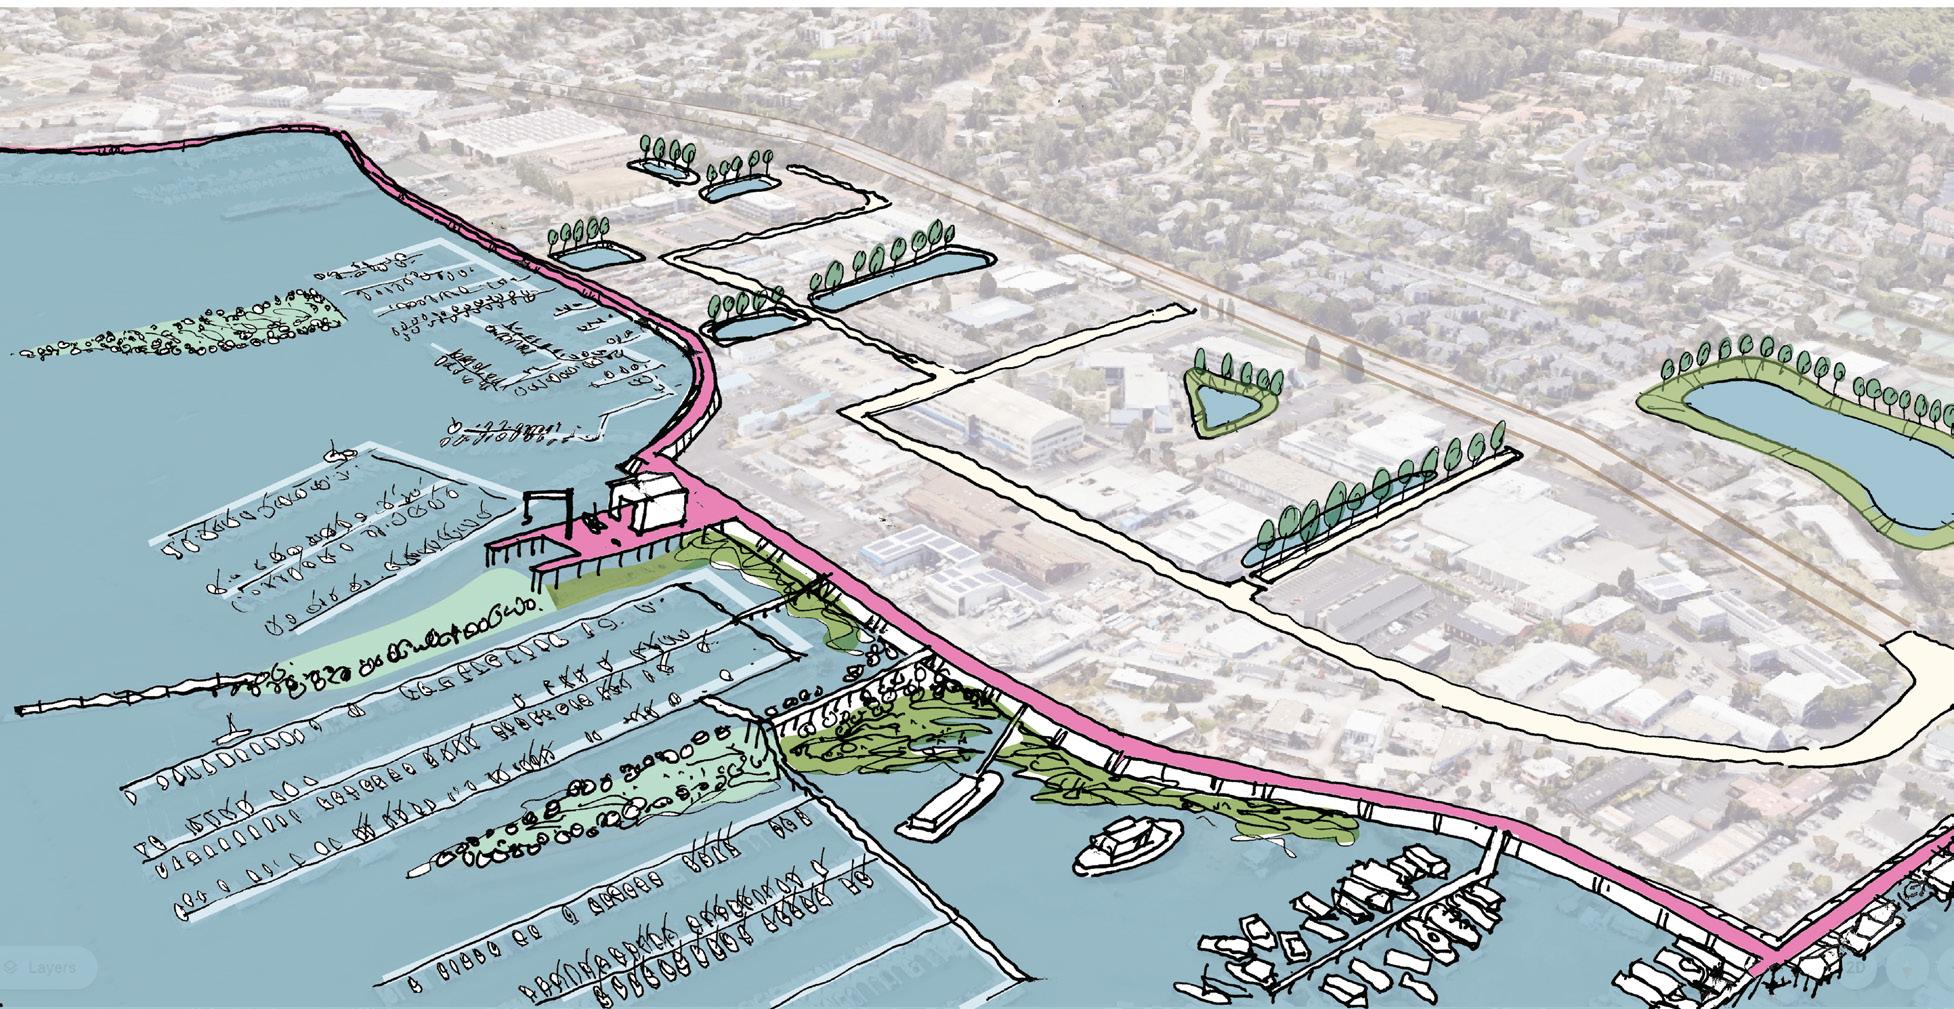
In this concept exploration, a seawall/levee structure integrated with a multi-modal promenade is constructed along shoreline, weaving through both off-shore and dryland segments. Exact alignment is not determined at the conceptual level to allow room for discussion and further adjustment. Protection would be a collective action taken by the City and other partners to implement regardless of property ownership.
Refer to Implementation Chapter 6.2, Table 16 for a more detailed breakdown of the costs associated with a collective approach to adaptation vs. individual actions.
Buildings and operations on the water side would adapt by raising piers or floating structures, led by individual effort of the landowners. Water access and boat ramps are built up and over the elevated edge. Some existing restaurants and businesses – such as Fish - might lose their initial water view and access due to the shifting shoreline edge which necessitates relocation or other adaptive measures. Existing land below the resilient edge could be transformed into living breakwaters to reduce wave action and enhance habitats. Detention ponds are added behind the levee for increased stormwater capacity.
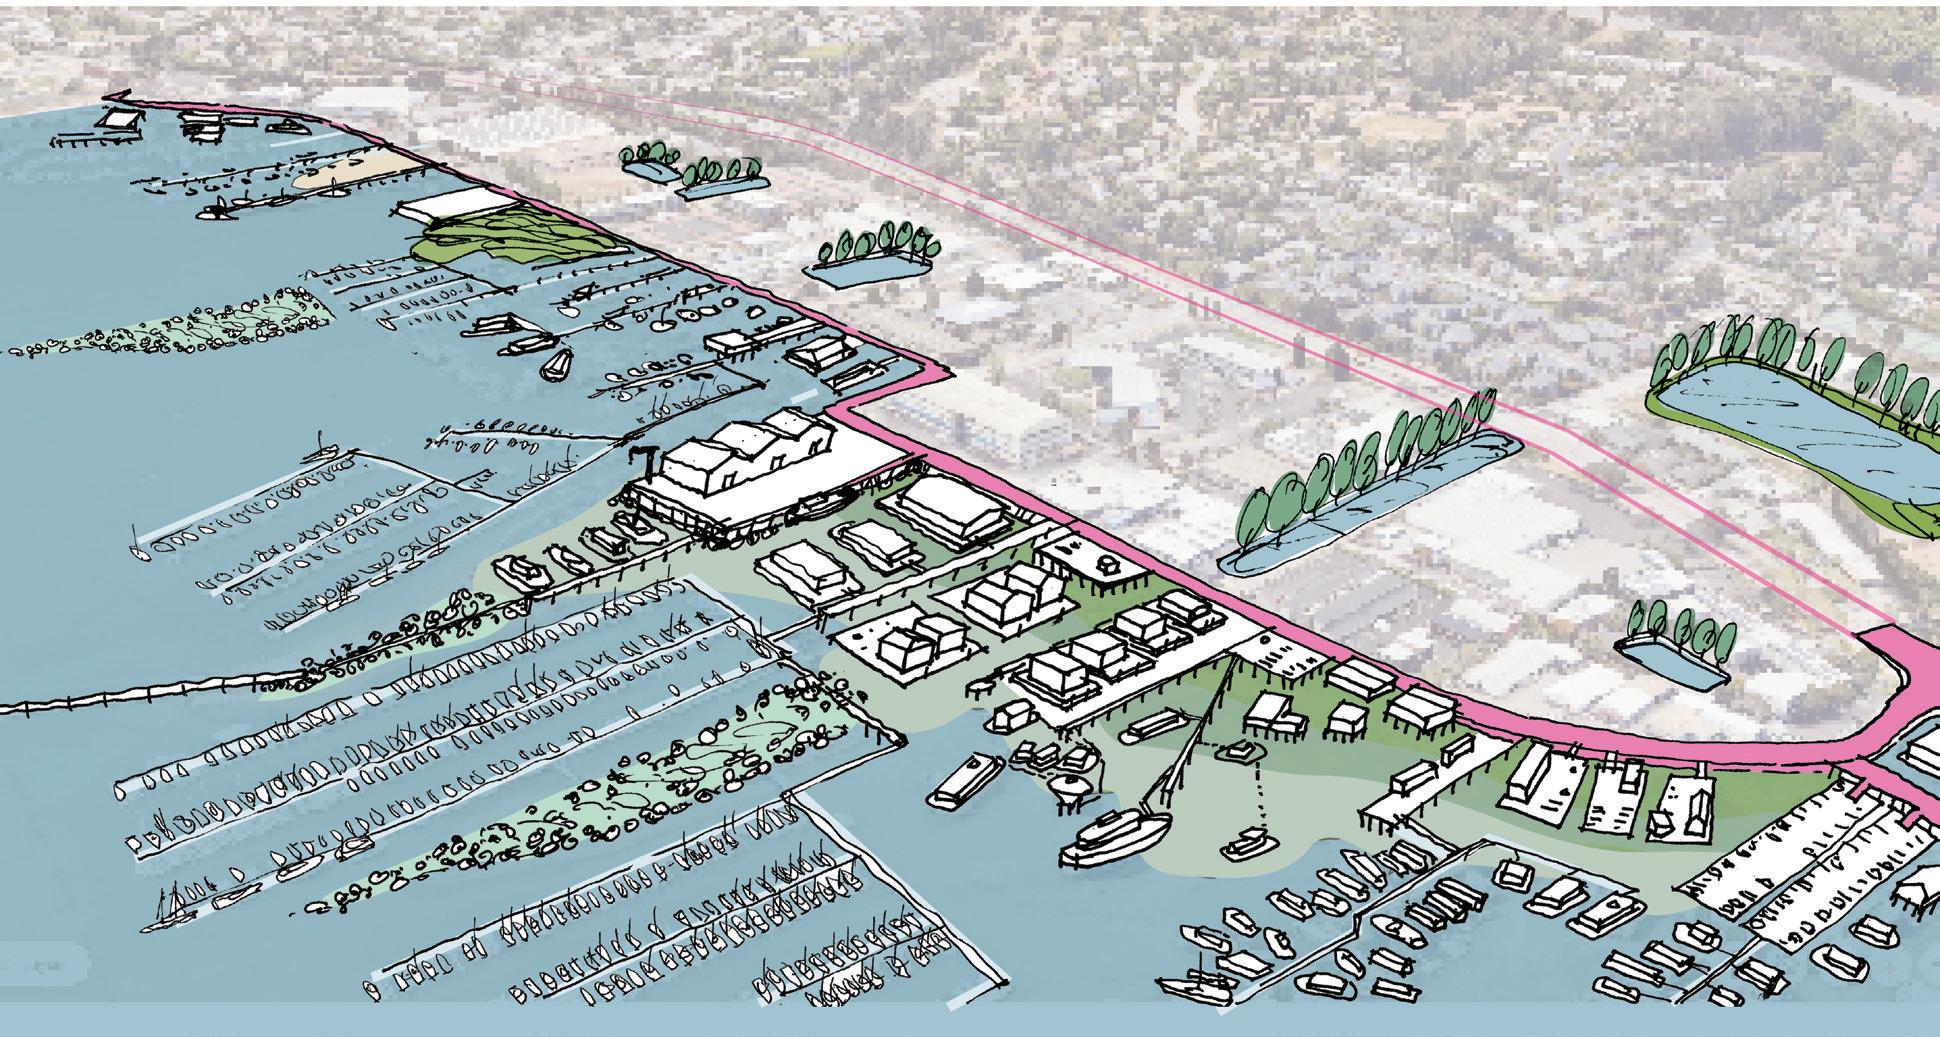
In this concept exploration, a seawall/levee structure is constructed and integrated into raised road improvements along inland road alignments like Gate 5 Road. Compared to Concept A, Concept B allows for more area immediately along the shoreline to gradually adapt independently as sea levels rise. Exact alignment is not determined at the conceptual level and needs a more detailed parcel-by-parcel study. Protection would be a collective action taken by the City and other agencies to implement regardless of property ownership. There’s potential to improve public access south towards Liberty Ship Way where gaps exist today. Driveway access to private buildings would require ramps down.
Buildings and operations on the water side would adapt by raising piers or floating structures. Those actions are taken by each landowner. Existing land lying on the water side of the resilient edge could be adapted into living breakwaters to reduce wave action and enhance aquatic habitats and recreational value. Detention ponds are added behind the levee for increased stormwater capacity.
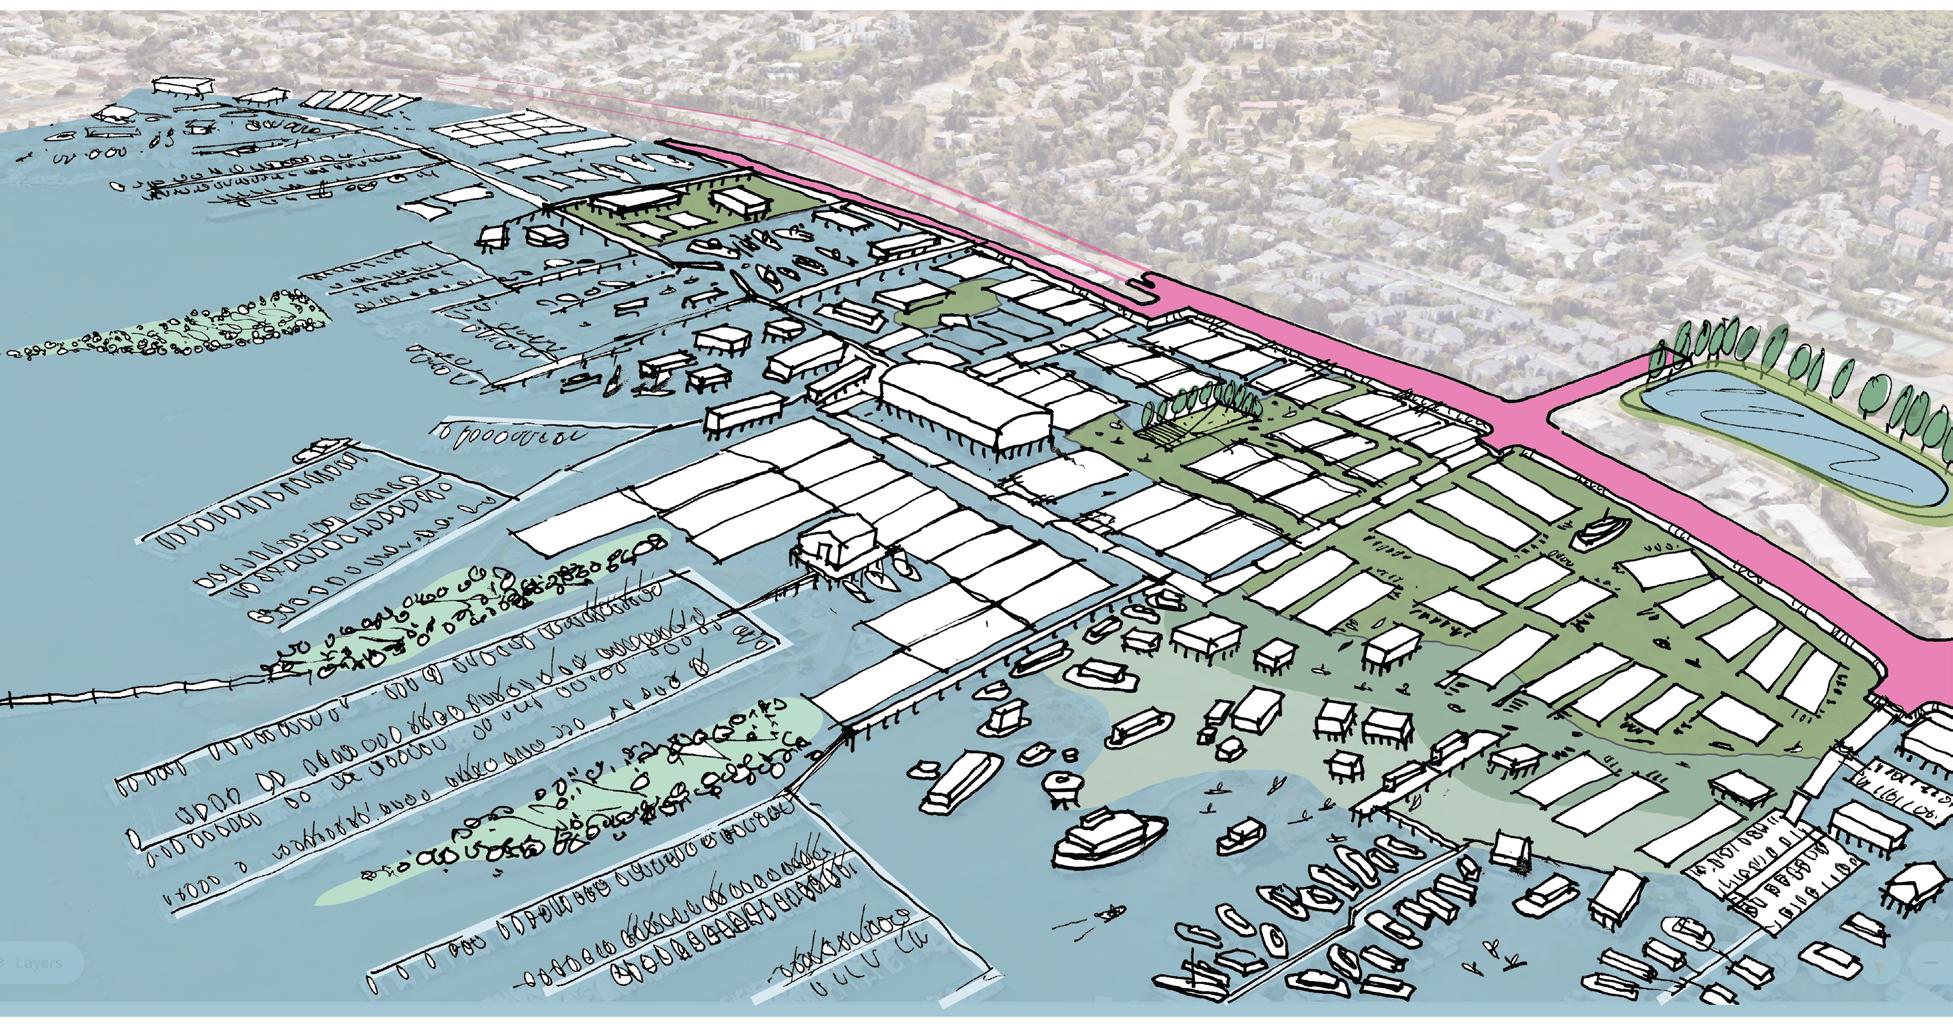
This concept exploration illustrates an example where no significant seawall/levee structure is collectively built in the Marinship area and individual property owners adapt independently through a combination of methods. Bridgeway is raised slightly to keep the road dry and protect a few retail buildings near MLK park such as the salon, pizza shops, and the spa. Collective action would be coordinated to elevate roads and important evacuation routes. Buildings and operations would adapt independently by raising piers or floating structures. This concept explores extensive adaptation with new innovations and international models. Individual actions would need to be taken by each landowner. Existing land submerged outside of the resilient edge could be transformed into living breakwaters to reduce wave action and enhance habitat.
MLK park would be modified to store stormwater. Few additional retention basins are required due to the high elevation of the inland areas.
Community Character
Participants supported measures to protect the focus area from flooding and were supportive of ideas that maintained shoreline access for shipyards and marinas who depend on being adjacent to the Bay. There is concern that the large seawalls in Concept A: Shoreline may disrupt shipyard uses and change Marinship’s authentic, working waterfront feel. Placing the resilient edge back at Gate 5 Road, as illustrated in Concept B, is seen to offer a more balanced solution that preserves character while adding resilience. This option for the resilient edge introduces floating structures at the shoreline zone and allows existing operators to adapt their buildings according to their needs and impacts from water. Properties behind the resilient edge are noted to be flexible to remain as-is or redevelop.
Concept C to use Bridgeway as the resilient edge and rely on floating in the majority of the district is viewed as too radical, risking a loss of identity and overall function. Concept C is seen as too similar to the no action scenario where the entire district floods and property owners address their own needs. Several participants also noted that the Marinship is a large and diverse area. A more fine-grained study might integrate a resilient edge at the shoreline in some areas and in other areas set it back in public
rights-of-way or through private properties. This approach would be possible if property owners acted as a collective to plan, fund, and implement adaptation solutions. It might yield an interesting complexity of waterfront adaptations. In all concepts explored, concerns for gentrification and loss of working waterfront function are made clear.
Public opinion about future land use varies widely. While the Shoreline Adaptation Plan does not make land use recommendations, future changes to land use may influence character. Also, adaptation strategies related to where the resilient edge is placed and how it is funded may well influence character. Some members of the public prioritize preserving an affordable working waterfront for ship repair and other shoreline adjacent industrial uses. Others promote a blended set of uses where new commercial, housing, parks, and waterfront industrial uses are comprehensively planned. The City’s current General Plan and Housing Element largely preserve existing uses. Future planning in the Marinship should continue to explore how new uses and investment can occur in balance with the existing working waterfront and industrial uses located there.
Shoreline Connection
Shoreline hardening, like in Concept A, risks impacting visual and physical access to the Bay. There are questions voiced about how existing boat repair operations can access the water if a levee or seawall is
placed between the bay and the boatyard. In other areas, examples that show new facilities built on top of the levee, on piers, or floating, do not raise concern since those operators would adapt their facilities over time to maintain operations. Gate 5 Road is favored as a raised transportation route in order to preserve near water access for district function including employees, visitors, recreational users, and deliveries. Locating the resilient edge at a mid-point in the district, like in Concept B, gives comfort to existing shipyard users who could imagine adapting the property to a higher elevation while maintaining operations. One idea expressed included inland canals for water-based mobility and stormwater detention. Responding to Concept C where Bridgeway becomes the resilient edge and existing roads like Gate 5 become floating infrastructure, responders raise concerns about safety, emergency access, and longterm usability.
Nature-based strategies, like eelgrass restoration (also opportunities for eelgrass migration with sea level rise) and living breakwaters, are viewed by the public to be better supported by Concept B: Gate 5 and Concept C: Bridgeway, which allow more room for ecological adaptation. There is strong excitement for offshore oyster habitat restoration. Shoreline hardening is seen as too limiting for habitat resilience.
Protecting maritime uses are a priority. Flooding is estimated by some community members to jeopardize over 500 jobs and likely over $1 billion in assessed land and business value. Impacts would shrink the tax base and shift costs onto hillside residents, many of whom are seniors on fixed incomes. Many view existing shoreline protection to offer short-term security but also to hinder flexibility of future adaptation. Concept B: Gate 5 as the resilient edge is seen as enabling thoughtful redevelopment, while Concept C: Bridgeway poses risks to continuity and viability for many existing businesses. Marina operators are adamant that individual property adaptation be supported regardless of levee locations. Access from land and water is critical to their function. Some owners believe armoring and raising the existing shoreline is part of a phased, low-disruption approach. Building, utility, parking, and walkway elevation could be accomplished over time. Permit and CEQA streamlining is beneficial to working waterfront operators. District scale design and planning can determine actionable outcomes and associated regulatory pathways. Participants also see opportunity to grow green jobs through R&D and manufacturing of aquatic restoration materials such as fabricated reefs to be applied to breakwaters and piers, and oyster balls.
Preserving Marinship’s creative spaces is important. Concept B: Gate 5 Road as the resilient edge offered the best opportunities to retain cultural assets such as the Industrial Center Building, while adapting to sea level rise in the district. Concept A: Shoreline hardening may isolate key community spaces, and Concept C: Bridgeway as the resilient edge risked displacing artistic infrastructure. Heath Ceramics is noted as a cultural treasure to be preserved. In any scenario, some voices welcomed a makeover of the Marinship district that was based on a resilient future rather than a military ship building facility from long past era.
Shoreline structures require permits from BCDC and other regulatory agencies. These processes involve evaluating environmental impacts and ensuring public access to the shoreline, which can lead to longer timelines due to multi-agency coordination and public review requirements. In many cases, these projects may also trigger more extensive environmental review under laws like CEQA or NEPA. In contrast, adaptation measures located further inland—such as elevating Gate 5 Road—typically require permits from the City of Sausalito and may involve a shorter and more straightforward review process. While shoreline projects can be more complex to permit, early coordination with regulatory agencies and alignment with regional policies may help streamline approvals and reduce delays.
A simplified cost-benefit ratio exercise was applied to the Marinship focus area to understand the balance between the cost of the protection strategy and the value of the areas to be protected. Under a “No Action” scenario, sea level rise threatens $80M-$290M in assets by 2050, increasing to over $1B by 2100, establishing a baseline for comparison. Three adaptation approaches, blending collective and individual actions, were evaluated with estimated costs ranging from $30M-$220M. Given the scale of assets at risk, investment in protecting Marinship yields positive net benefits, with “No Action” proving more costly than adaptation. One collective approach, hardening the shoreline edge, is estimated at $30M-$110M and offers a strong cost-benefit ratio through 2100. A more individualized approach focused on elevating buildings and roads between Bridgeway and the shoreline, ranges from $60M-$220M and also delivers favorable returns across the century. Some waterfront property owners noted successful experience implementing cost effective flood barriers and raising of infrastructure on their properties at small scale.
In Marinship, the benefits of collective and individual action outweigh the costs associated with lost assets. When benefits outweigh the costs, the adaptation option has positive net benefits. To read more about this exercise for all of Sausalito, see Chapter 6 (page 150).
The cost of no action was estimated by assuming all assets within the future SLR footprint were considered a total loss. This loss was estimated as the capital cost to replace each asset if it were to be damaged beyond repair. Rough order of magnitude (ROM) costs are useful to compare the relative value of assets and the costs of interventions to protect those assets. When addressing existing assets, ROM estimates are a capital cost to replace asset if it were to be damaged beyond repair. This is a replacement value based on the type and count of assets. To estimate future potential adaptation measures adaptation measures, the ROM estimates are a capital cost to implement an intervention to mitigate the impacts of flooding and/or sea level rise. The following are excluded from the ROM cost exercise: Cost escalation (increases dollar value), discount rate (decreases dollar value), and wider implications of the SLR scenarios, including economic analysis, property tax revenue implications, and additional costs and benefits (e.g., ecological co-benefits).
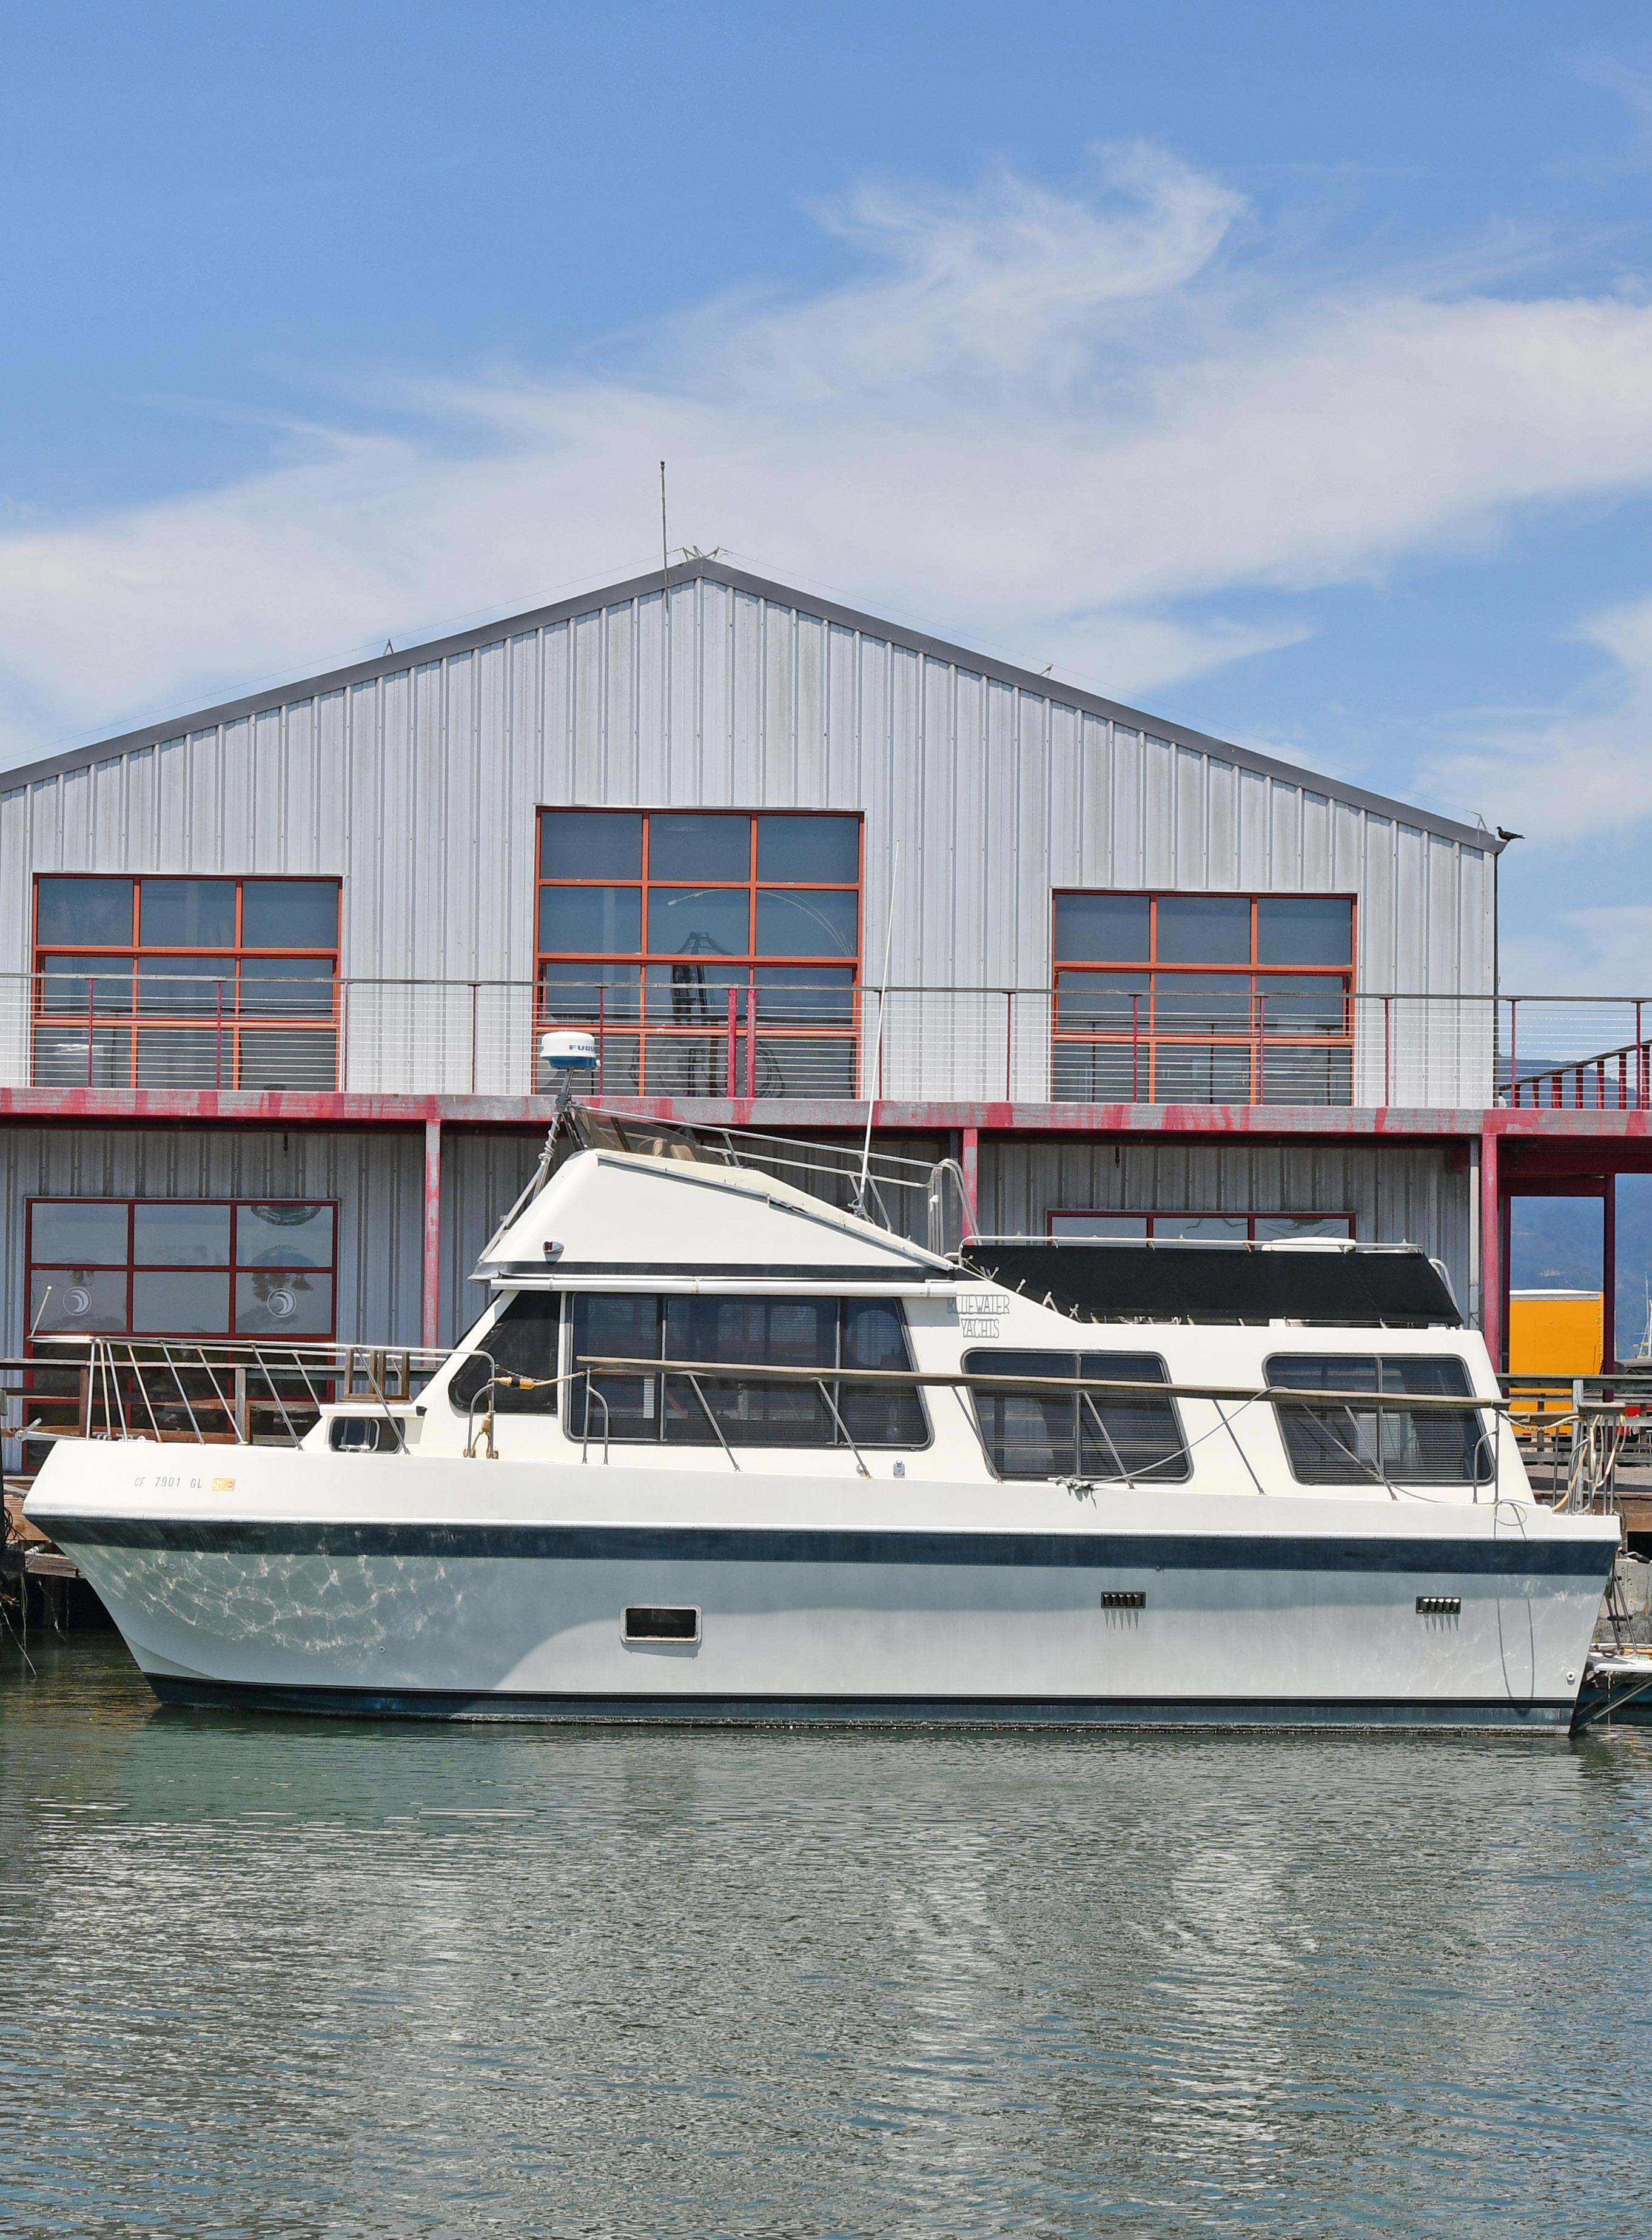
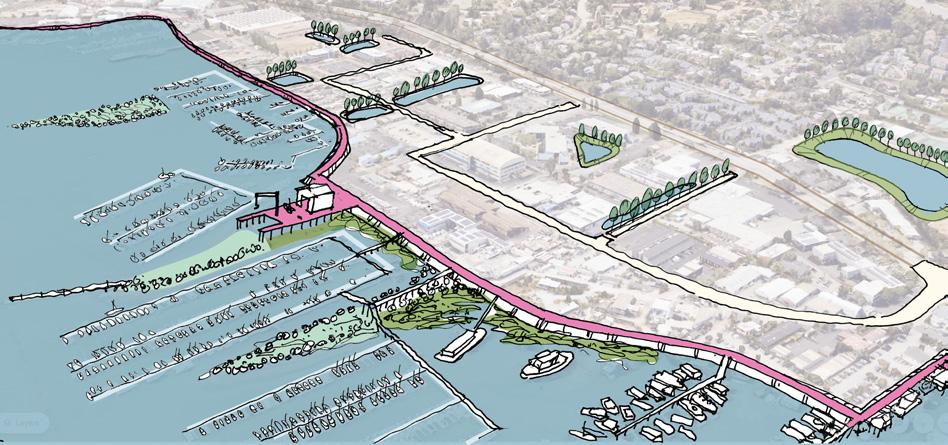
B. GATE 5 RD. AS THE RESILIENT EDGE
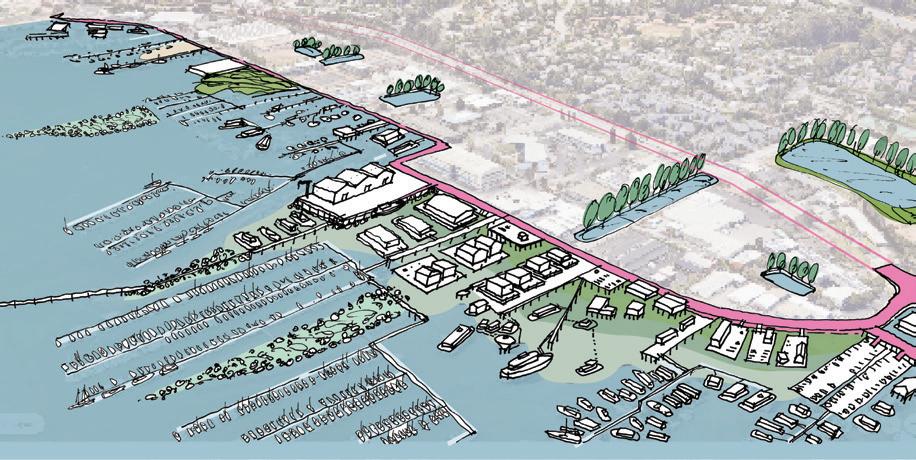
C. BRIDGEWAY AS THE RESILIENT EDGE
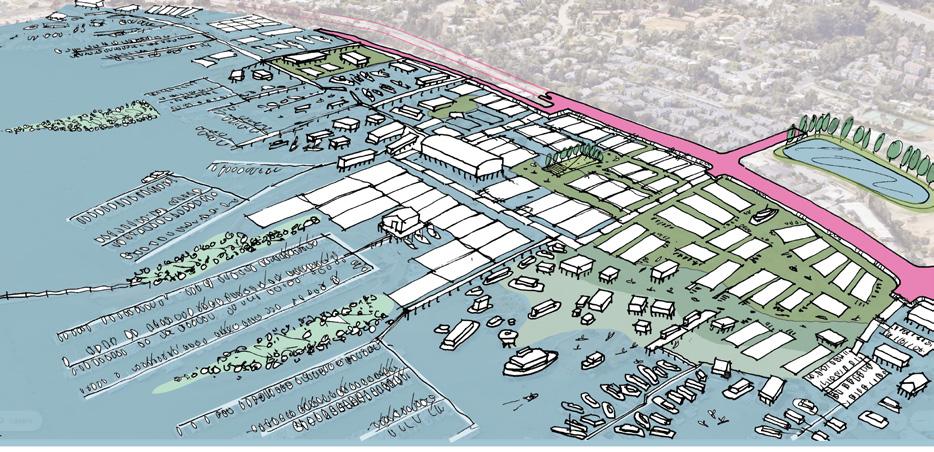
The Community Feedback Summary Table provides a relative evaluation per option on a scale from + to +++ for each of the evaluation criteria. Concepts with +++ indicate greater beneficial impacts and opportunities when compared to those with only + , which signifies relatively fewer positive impacts and opportunities.
TABLe 14: Community Feedback Summary of Focus Area 3: Marinship Concept Explorations
COMMUNITY CHARACTER SHORELINE CONNECTION
ECOLOGICAL OPPORTUNITIES ECONOMIC VITALITY
ARTS AND CULTURE COST/ CONSTRUCTABILITY PERMITABILITY
COLLECTIVE ACTION / COSTBENEFIT Concept A
Concept B
SHORELINE AS THE RESILIENT EDGE
GATE 5 RD. AS THE RESILIENT EDGE
BRIDGEWAY AS THE RESILIENT EDGE
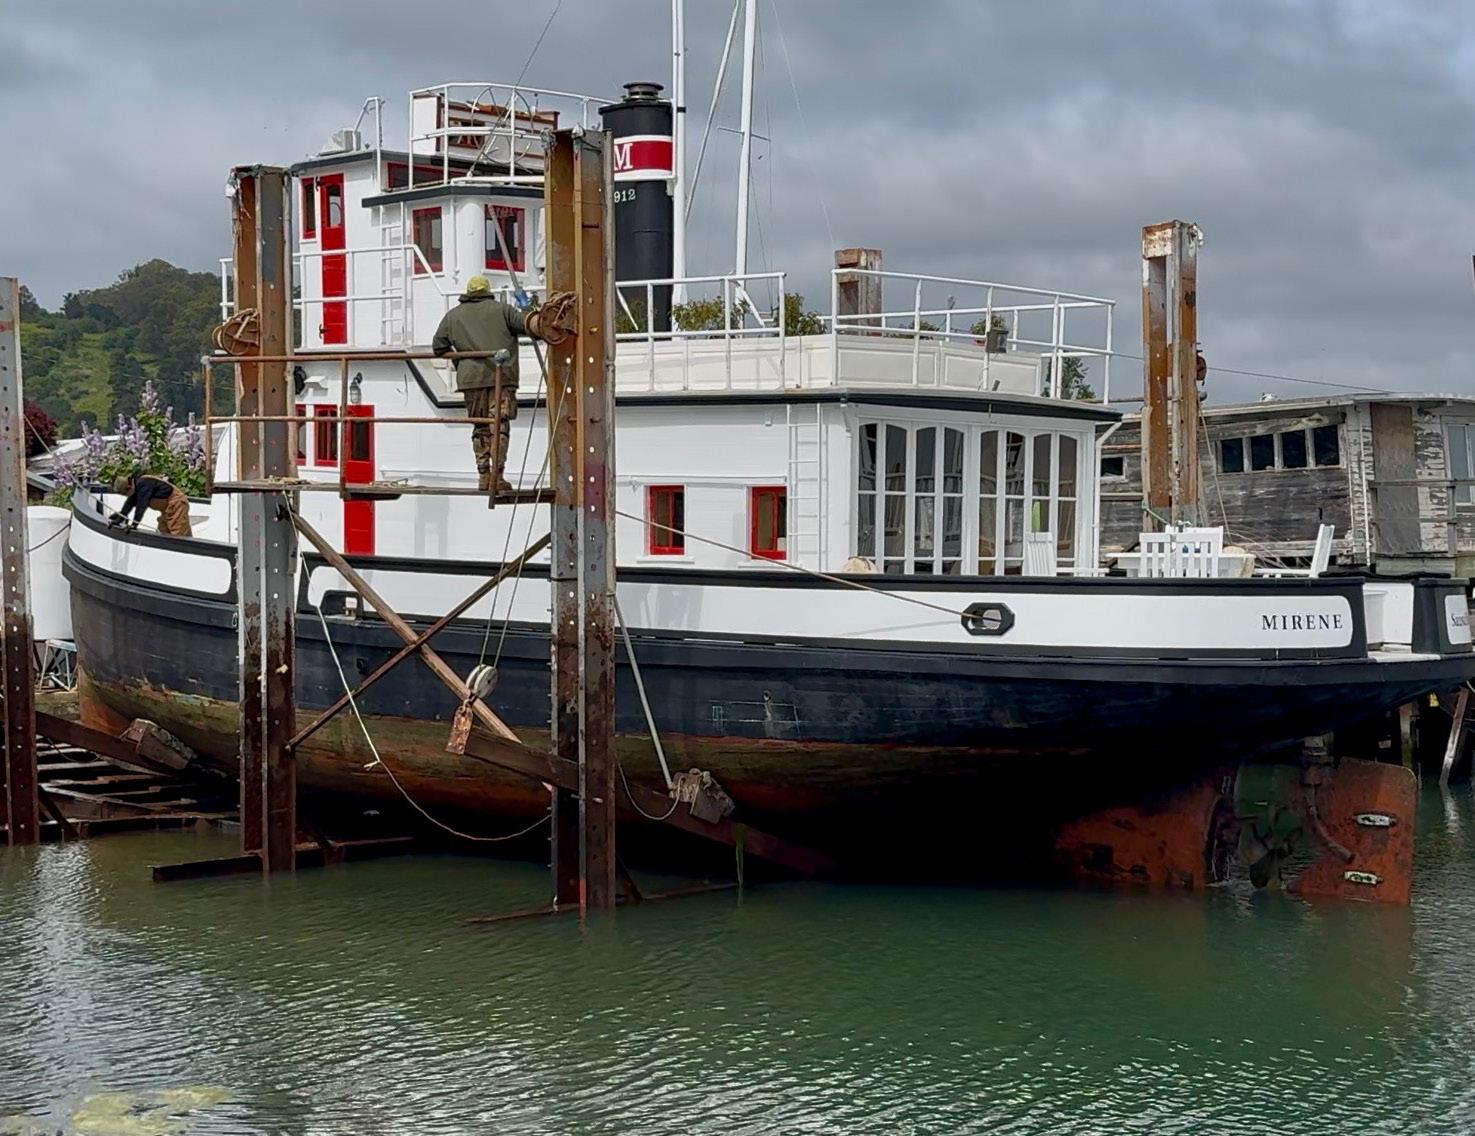
The Floating Homes Focus Area has deep roots in Marin County, and is recognized as a haven for creativity, independence, and alternative ways of living. Floating Homes is included in the study area, despite not being part of the City of Sausalito, by request of County and residents to ensure cohesive shoreline planning. What began in the mid20th century as an informal collection of converted boats, barges, and houseboats has become a vibrant and legally recognized residential community on the water. This area’s transformation—from a countercultural enclave to a permitted and regulated
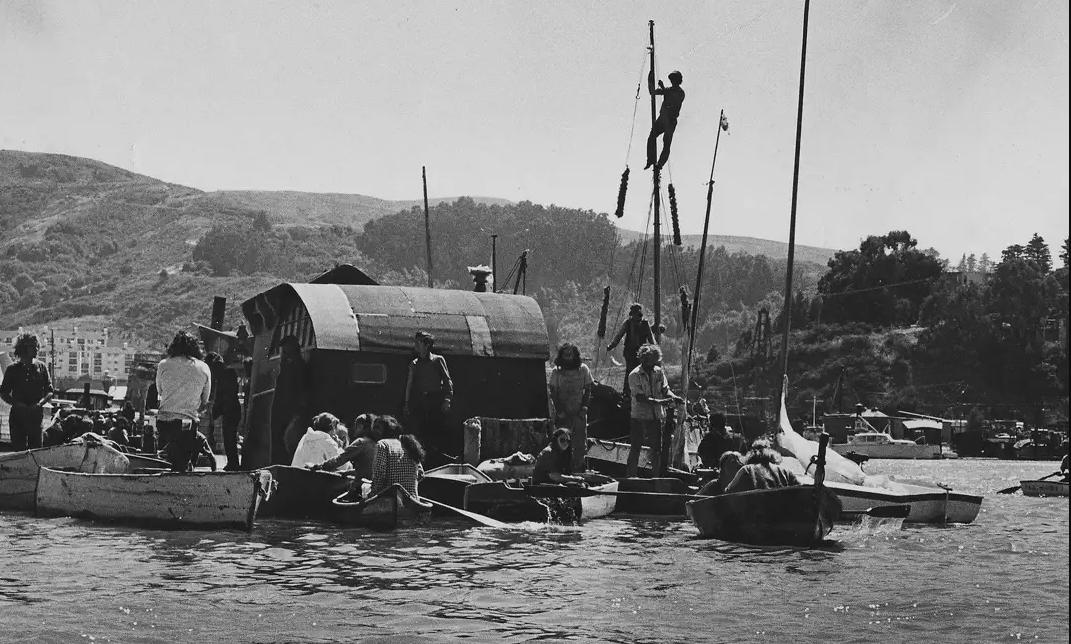
live-aboard neighborhood—reflects the resilience of waterfront residents. The floating home community has played a key role in the broader Bay Area cultural history, attracting artists, musicians, boat builders, and free thinkers who helped shape Sausalito’s unique coastal spirit.
The character of the Floating Homes area is defined by its eclectic, hand-built architecture, its strong sense of community, and its connected relationship with the Bay. From Waldo Point Harbor, located just south of Van Damme Park, to the clusters at Kappas Marina, this focus area features narrow docks lined with colorful homes, lush container gardens, and communal gathering spaces – all floating. Despite its unorthodox form, it is a highly organized and resilient neighborhood, with co-ops and harbor operators managing utilities, access, and shoreline improvements.
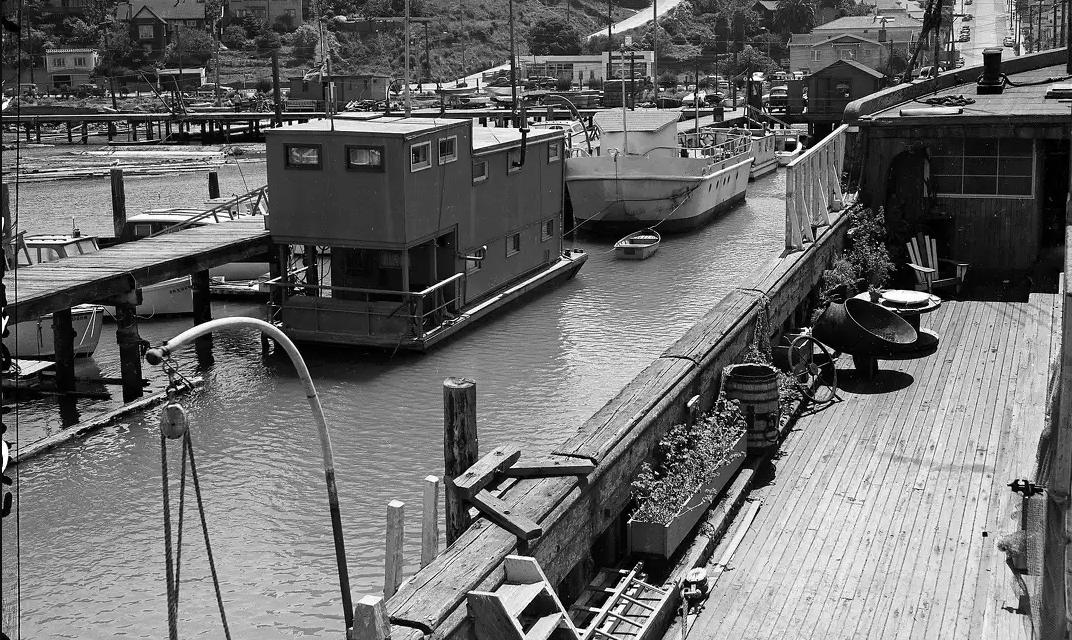
The area is in County jurisdiction, just north of the Sausalito City limit. Access is off of Bridgeway at roads Gate 5 and Gate 6. The Mill Valley – Sausalito Bike Path (Bay Trail) follows Bridgeway and is parallel to the US 101 highway on-ramp at Gate 6 Road. Land areas for roads, parking lots, and parks were created by artificial fill. Shoreline treatments include engineered rock armoring, bulkhead walls, and sloping embankments. Private access to floating homes is primarily via fixed piers. A traditional marina operates at the far north end with fixed docks and breakwaters. Other important context is US 101, the highway interchange, and Marin County’s Marin City neighborhood. While outside the boundaries of this study, these areas and their owners/jurisdictions are important partners in adaptation planning of Kappas Marina. This area is entirely waterbased and highly vulnerable to sea level rise and storm events. While the homes themselves float and can adapt to tidal changes, shoreline access, utilities, parking areas, and dock infrastructure remain tied to fixed land elevations As sea levels rise, these supporting systems—not the homes themselves—are the greatest points of vulnerability.
Refer to Vulnerability Chapter 1, Section 4.3 for more detailed analysis on vulnerable assets and cost of no action.
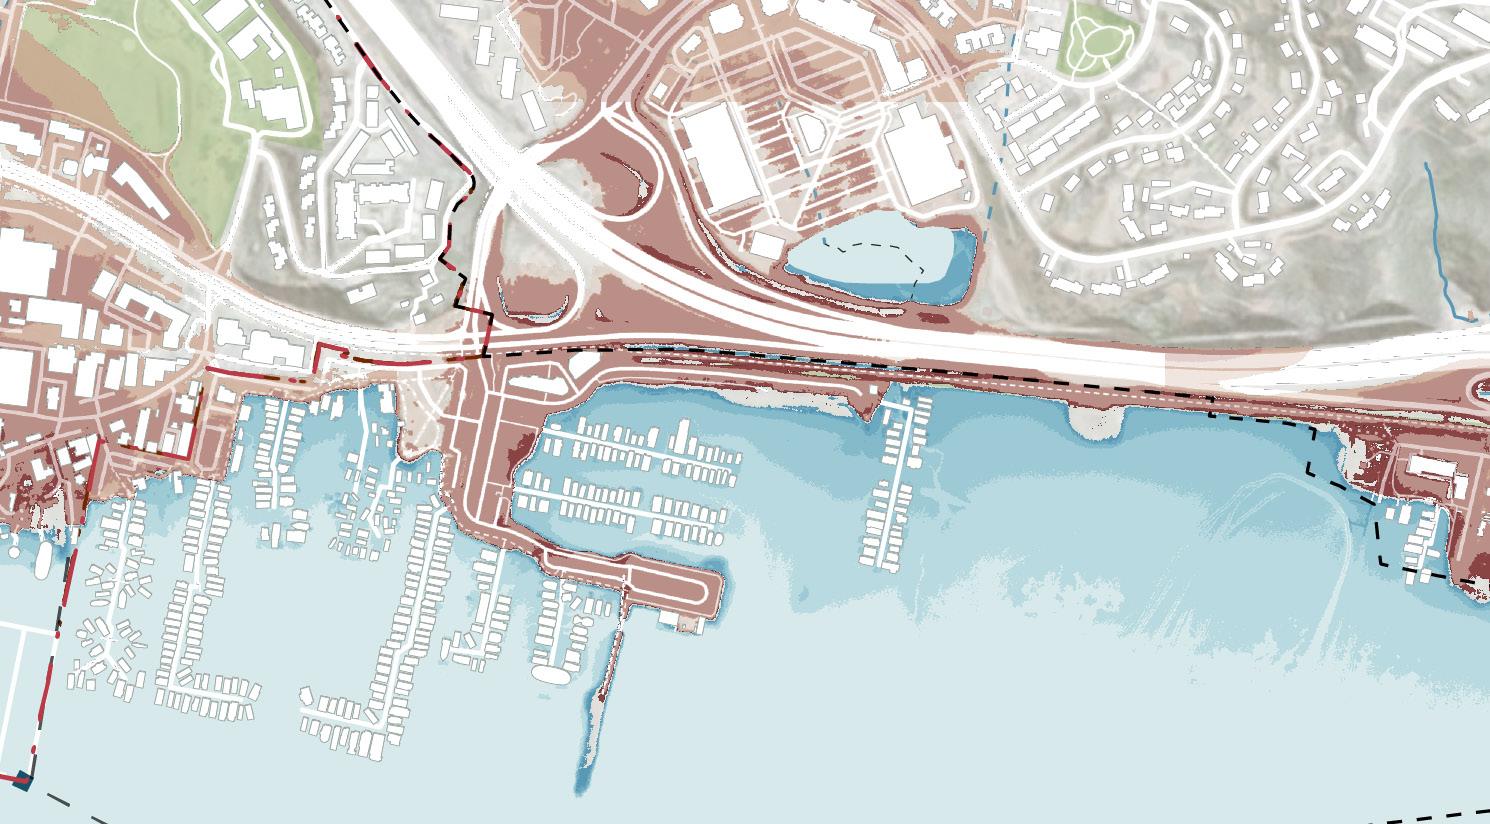
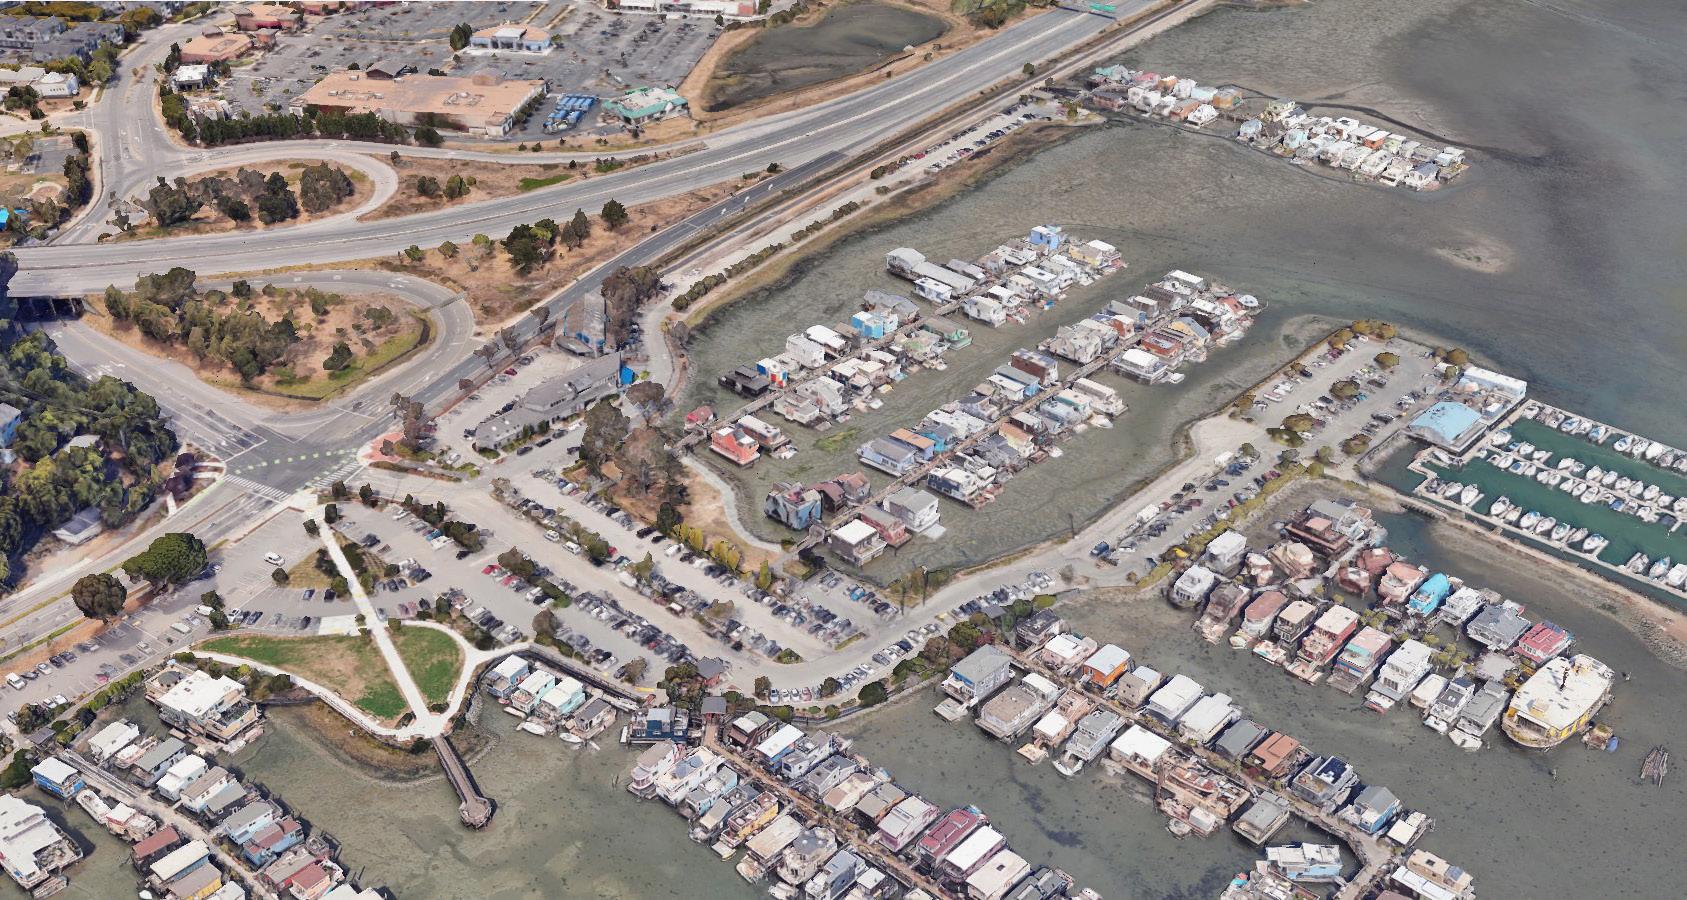
In mid-century without storm scenario (Scenario 1), Gate 6 road is partially impacted while Gate 6 1/2 road experience regular flooding. In mid-century with storm scenario (Scenario 2), the rising water fully inundates Gate 6 road and exposes Bridgeway and access roads to US Highway 101 to permanent flooding.
In end-of-century scenario (Scenario 3), the US Highway 101 on-ramp and Marin Gateway Shopping Center parking lots are inundated.
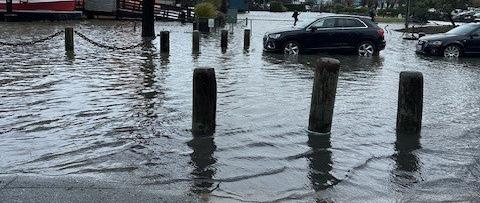
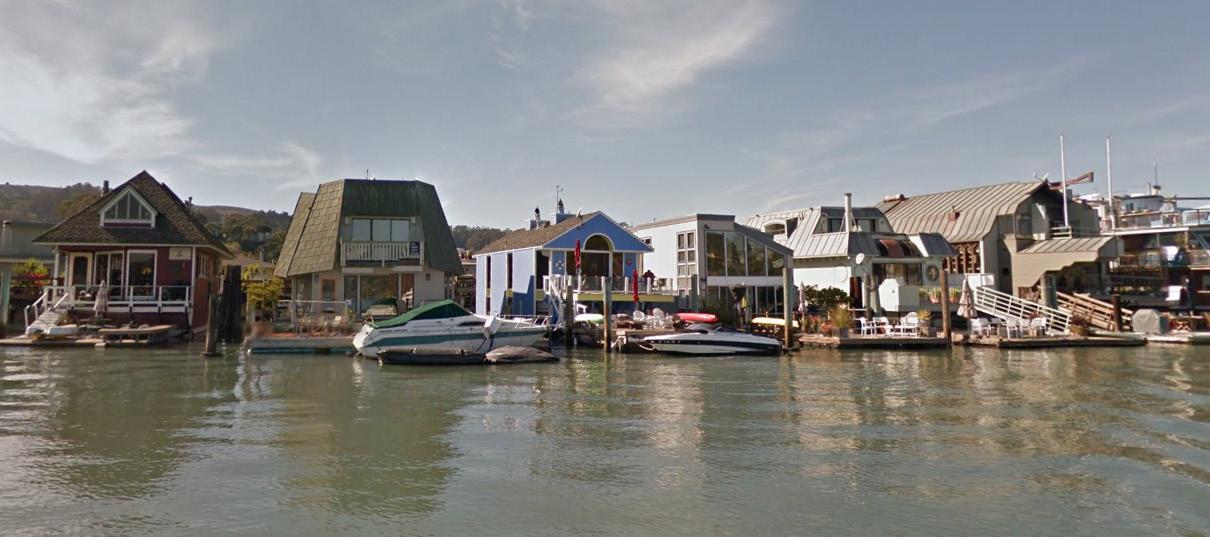
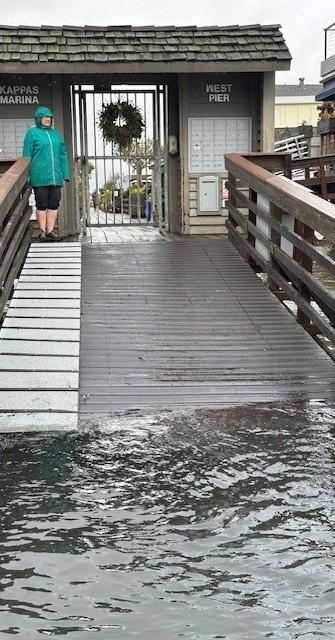
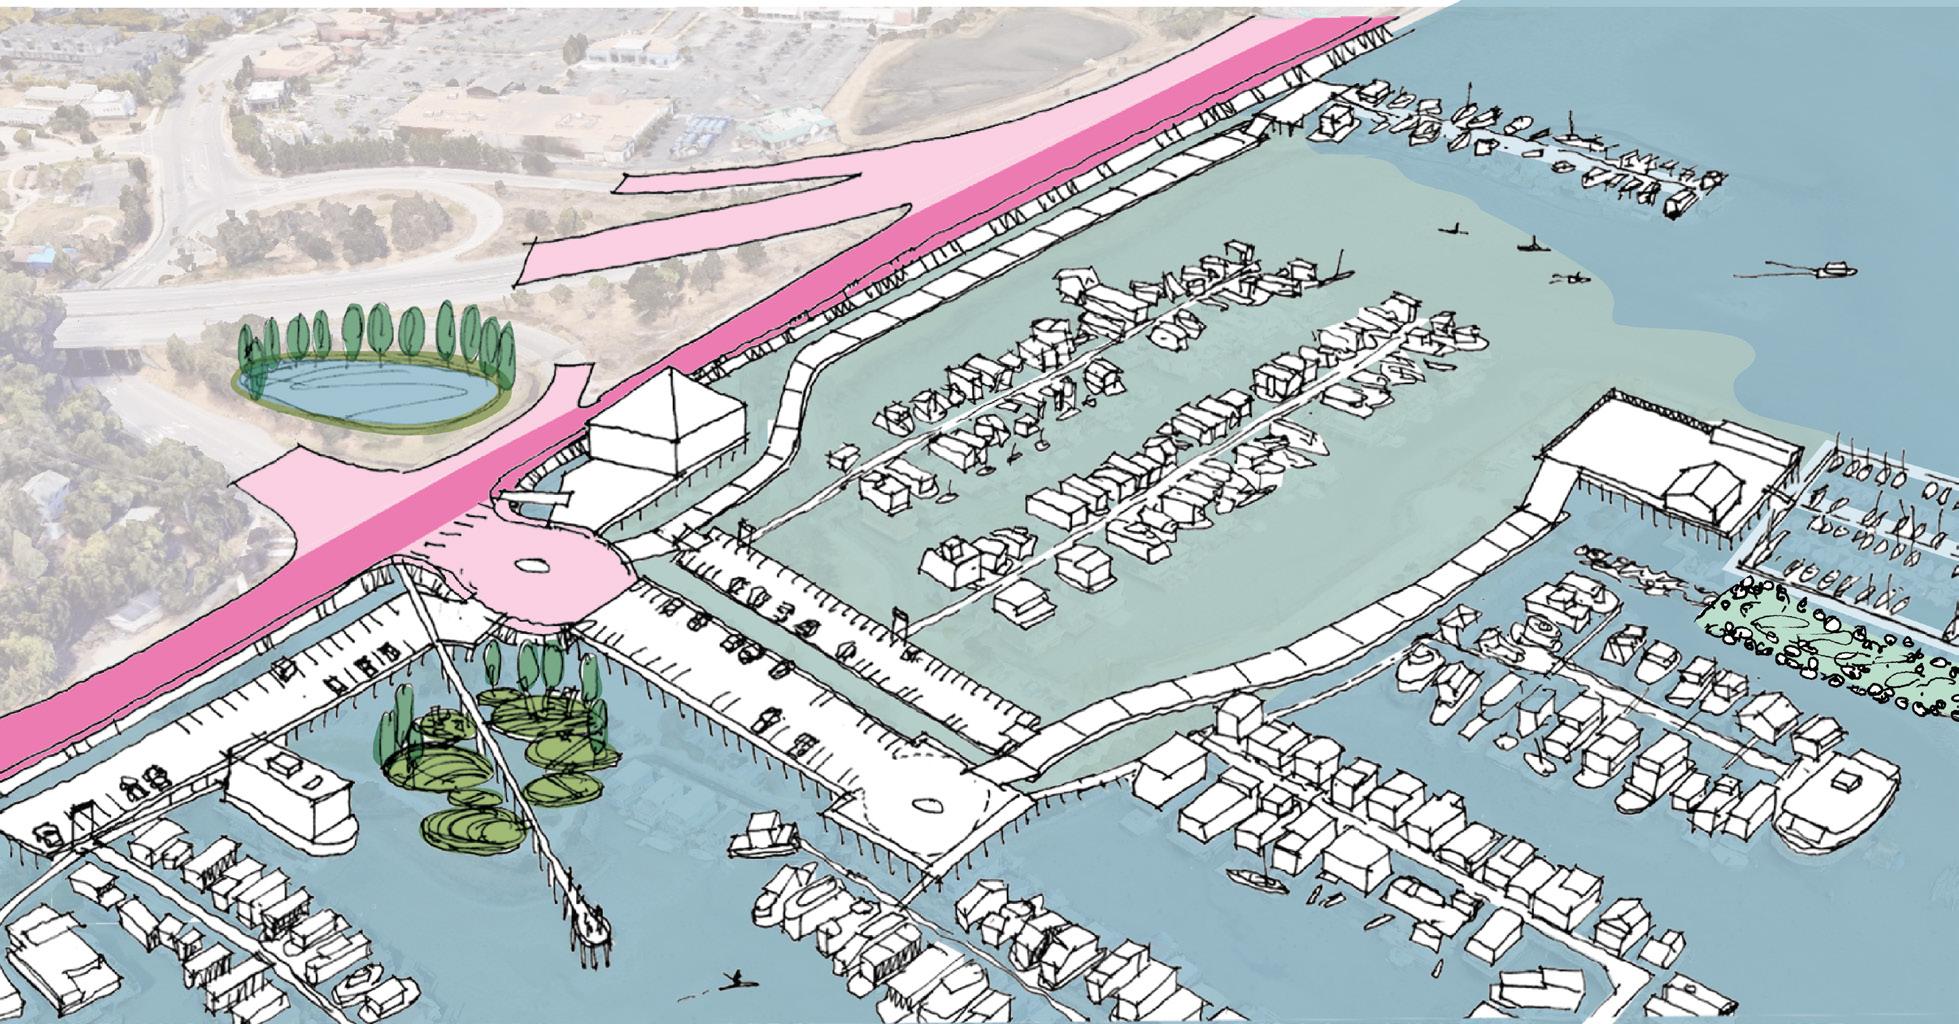
In this concept exploration, Bridgeway, US Highway 101, and the Bay Trail are elevated to maintain transportation and to protect inland areas. Exact alignment of a seawall/ levee structure is not determined at the conceptual level and more detailed study of local vulnerability is needed. This action may protect transportation assets including Bridgeway, the Bay Trail, and US 101.
Protection would be a collective action taken by the County, Caltrans, and other agencies to implement across property lines.
Visualization shows additional action to raise Gate 6 ½ Road access to private properties. This is similar to the actions taken by Clipper Yacht Harbor in Marinship to elevate their parking lot.
In Concept A, Buildings, parking and operations on the water side would adapt by raising land or converting to piers or floating structures for access and parking. These improvements would require private actions by the property owners. Van Damme Park is adapted to be on piers or floating. Detention ponds are added behind the resilient edge in Caltrans property.
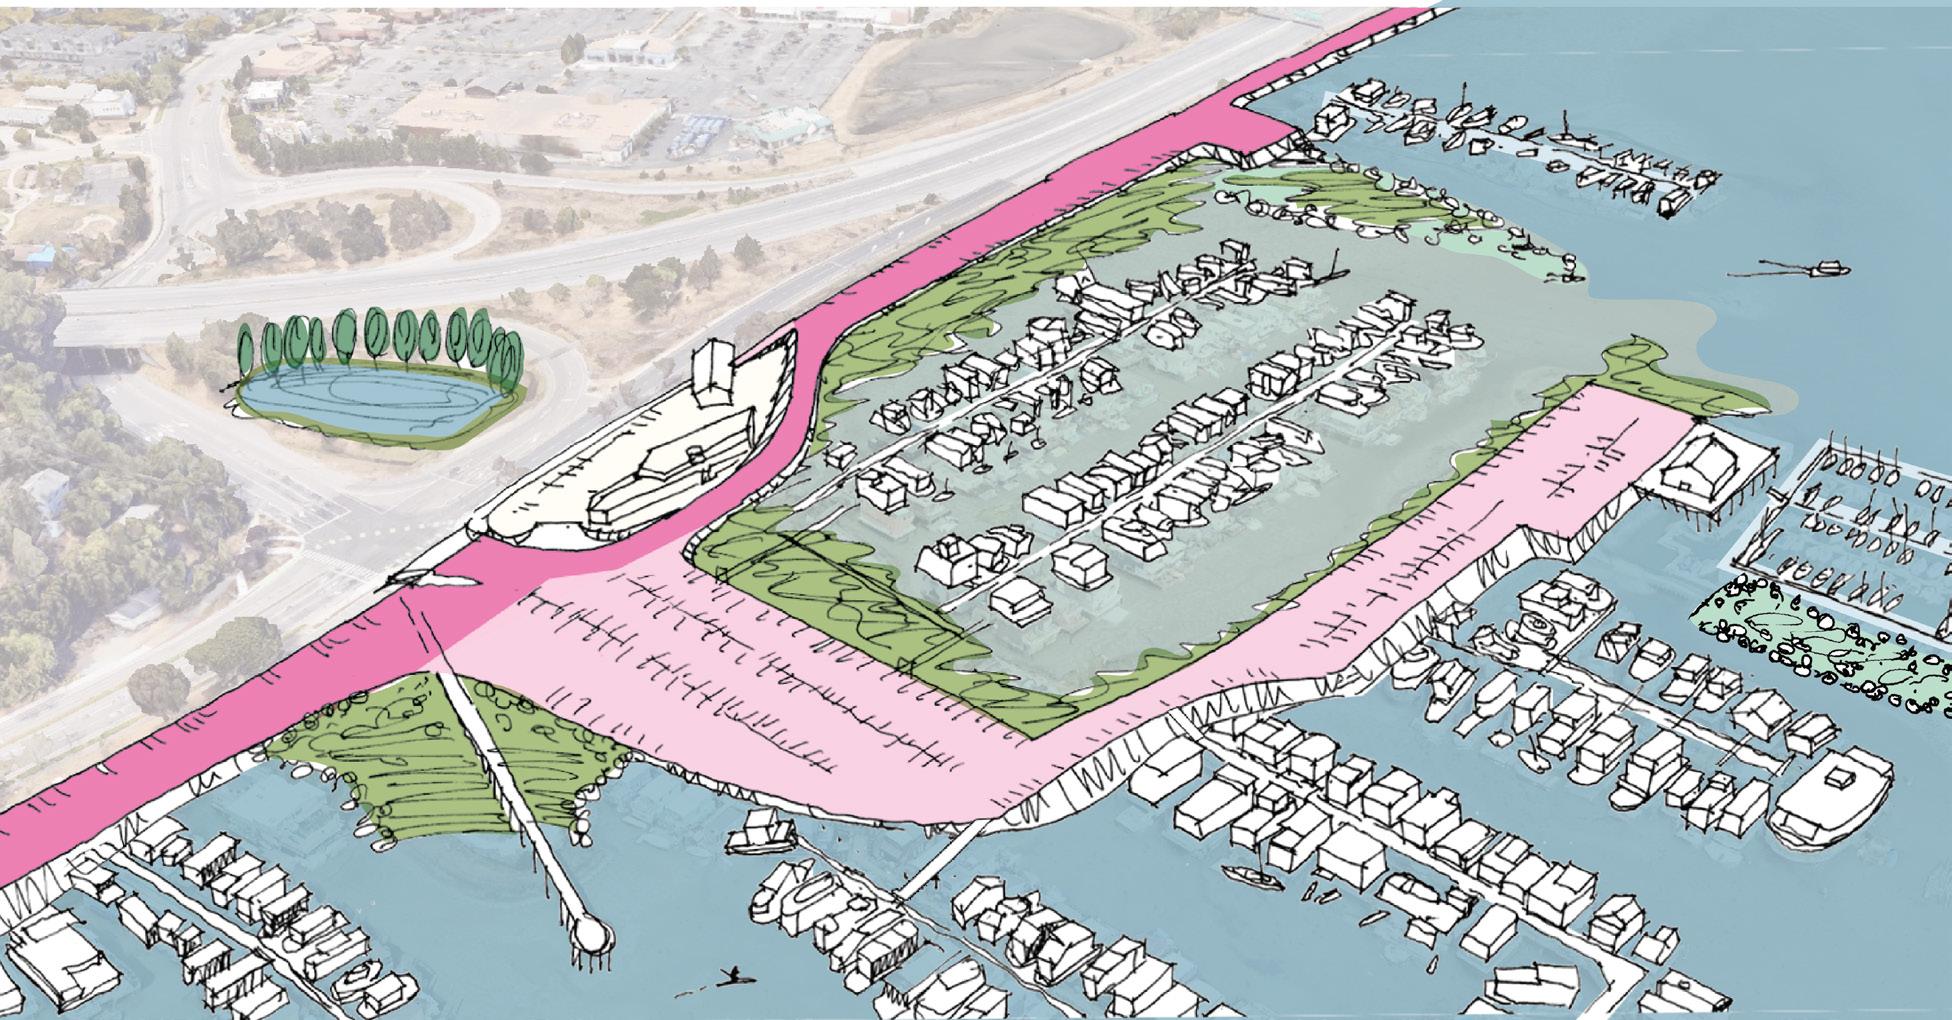
In this concept exploration, a seawall/levee structure is integrated along the edge of local roads which are raised and adapted to protect inland areas. These actions maintain access to private properties while also protecting inland areas including US Highway 101 and the interchange connecting to Marin City. The option studied does not preclude raising the shopping center, intersection, and highway. The question of who pays and who benefits is evident. Stormwater detention areas are still needed in this concept exploration and are shown in the Caltrans interchange median.
Visualization shows additional action to raise Gate 6 Road access to private properties. This is similar to the actions taken by Waldo Pt. Harbor and Clipper Yacht Harbor in Marinship to elevate their parking lot. Buildings, parking and operations on the water side would adapt by raising land or converting to piers for access and parking. Raising land would require perimeter containment structures (e.g. sheetpile walls or engineered embankments) whose footprint will either fill into the bay or reduce the usable surface area. These would be private actions by the property owner. Existing land and shallow aquatic zones could be transformed into living breakwaters to reduce wave action and enhance ecological habitat. Van Damme Park is shown to convert to a beach with upland areas and features a pier.
Community Character
Preserving the way of life in the floating home community is the priority. No action would jeopardize access and impact infrastructure. Both concepts generally preserved the community. As shown in Concept A, floating access and roads is viewed as appropriate to the community however concern is raised about ease of mobility for seniors. Also relevant to community character is the function of parks and places to gather. Picnics, dog walking, birthday parties, and socializing is important and those spaces are needed to persist in the future. Participants seek physical connections to adjacent communities of Sausalito, Marin City, and Tam Junction. The Mill Valley – Sausalito Path (Bay Trail) is essential. Access under the highway to Marin City is also needed.
Shoreline Connection
Living on the water provides maximum opportunity for shoreline connection for participants. The threat from sea level rise is to vehicular access and support facilities, not to the floating homes themselves. Parking is essential to keep, including accessible stalls used by those with mobility challenges and the elderly. Any reduction in parking quantity due to adaptation actions could cause a challenge for current operations. Access paths for walking along the shore and places to gather near the Bay are valued.
Any concept that preserves eelgrass and offers opportunity for tidal marsh is supported. Concept A requires less Bay fill, preserves more open water and eelgrass habitat. This concept also allows for better water quality due to greater circulation. Concept B includes tidal marsh creation, which has potential to offset impacts associated with greater Bay fill. Concept A could also be configured to include conversion of shallow water to marsh in select locations along the edges of fill and as islands. Expanded eelgrass should not impede functions of the floating homes.
The costs of adaptation actions are of great interest to participants. Opportunities to partner on multi-benefit projects that protect assets across ownership and jurisdiction are supported due to the ability to share costs. Some participants are open to increasing the number of floating homes and increase investment into the properties. While flooding has become more common, resilience is tested during emergencies. Stocking food and advancing technology so that floating structures withstand storms is critical.
Innovation in floating was tied to arts and culture by participants. Concept A is seen as more innovative while Concept B appears to favor paved areas without trees and green spaces.
Cost estimates for the two concept explorations in this focus area were not developed, but it was assumed that the challenges associated with infill and raising onshore infrastructure may surpass those of developing floating infrastructure.
In this focus area, the Bay Trail (Mill Valley - Sausalito Path), Gate 6 and Gate 6 1/2 Road fall within BCDC’s jurisdiction and any elevation of or changes to them would require coordination and proper permits. At this time, changes to Bridgeway would likely not require BCDC permits given its inland location. To certify any structures so that changes in the FEMA flood zones were reflected in official maps, additional permitting and involvement from FEMA would be required.
Adaptation Concept A involves a major public project to elevate Bridgeway as a resilient edge, requiring significant partnership and funding to complete this project. For privately-owned assets not protected by Bridgeway, including Gate 6 1/2 Road, costs may be borne by owners. Concept B focuses on elevating local roads and assets like Gate 6 Road and the Bay Trail in this focus area, which suggest more coordination and shared costs for stakeholders.
A. BRIDGEWAY AS THE RESILIENT EDGE
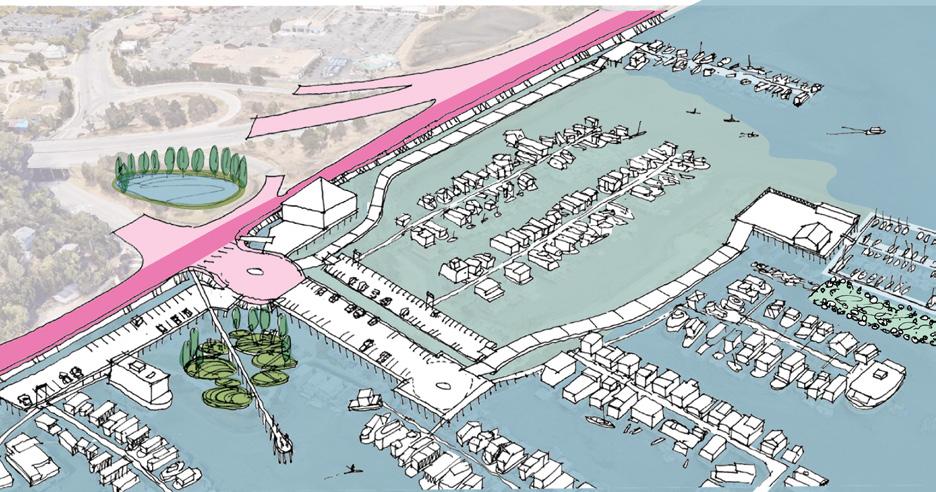
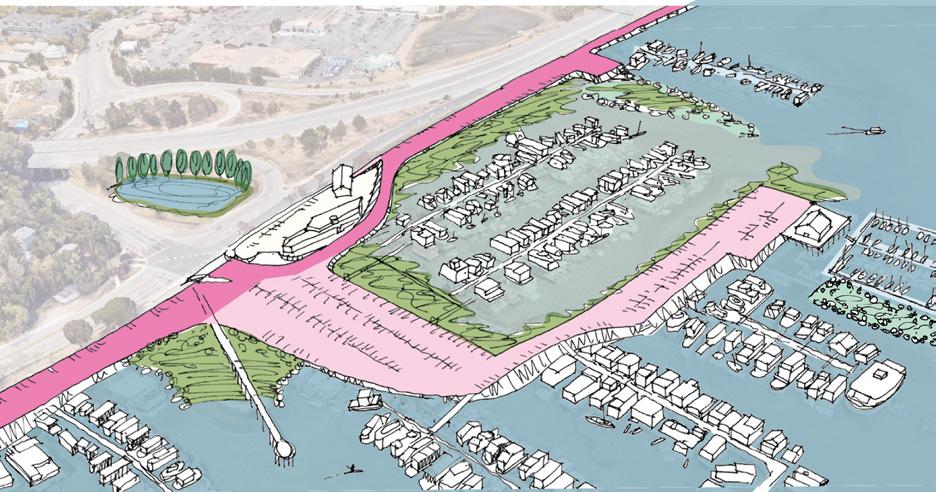
The Community Feedback Summary Table provides a relative evaluation per option on a scale from + to +++ for each of the evaluation criteria. Concepts with +++ indicate greater beneficial impacts and opportunities when compared to those with only + , which signifies relatively fewer positive impacts and opportunities.
TABLe 15: Community Feedback Summary of Focus Area 4: Floating Homes Concept Explorations
BRIDGEWAY AS THE RESILIENT EDGE
LOCAL ROADS AS THE RESILIENT EDGE
COMMUNITY CHARACTER SHORELINE CONNECTION
ECOLOGICAL OPPORTUNITIES ECONOMIC VITALITY
ARTS AND CULTURE COST/ CONSTRUCTABILITY
PERMITABILITY
COLLECTIVE ACTION / COSTBENEFIT
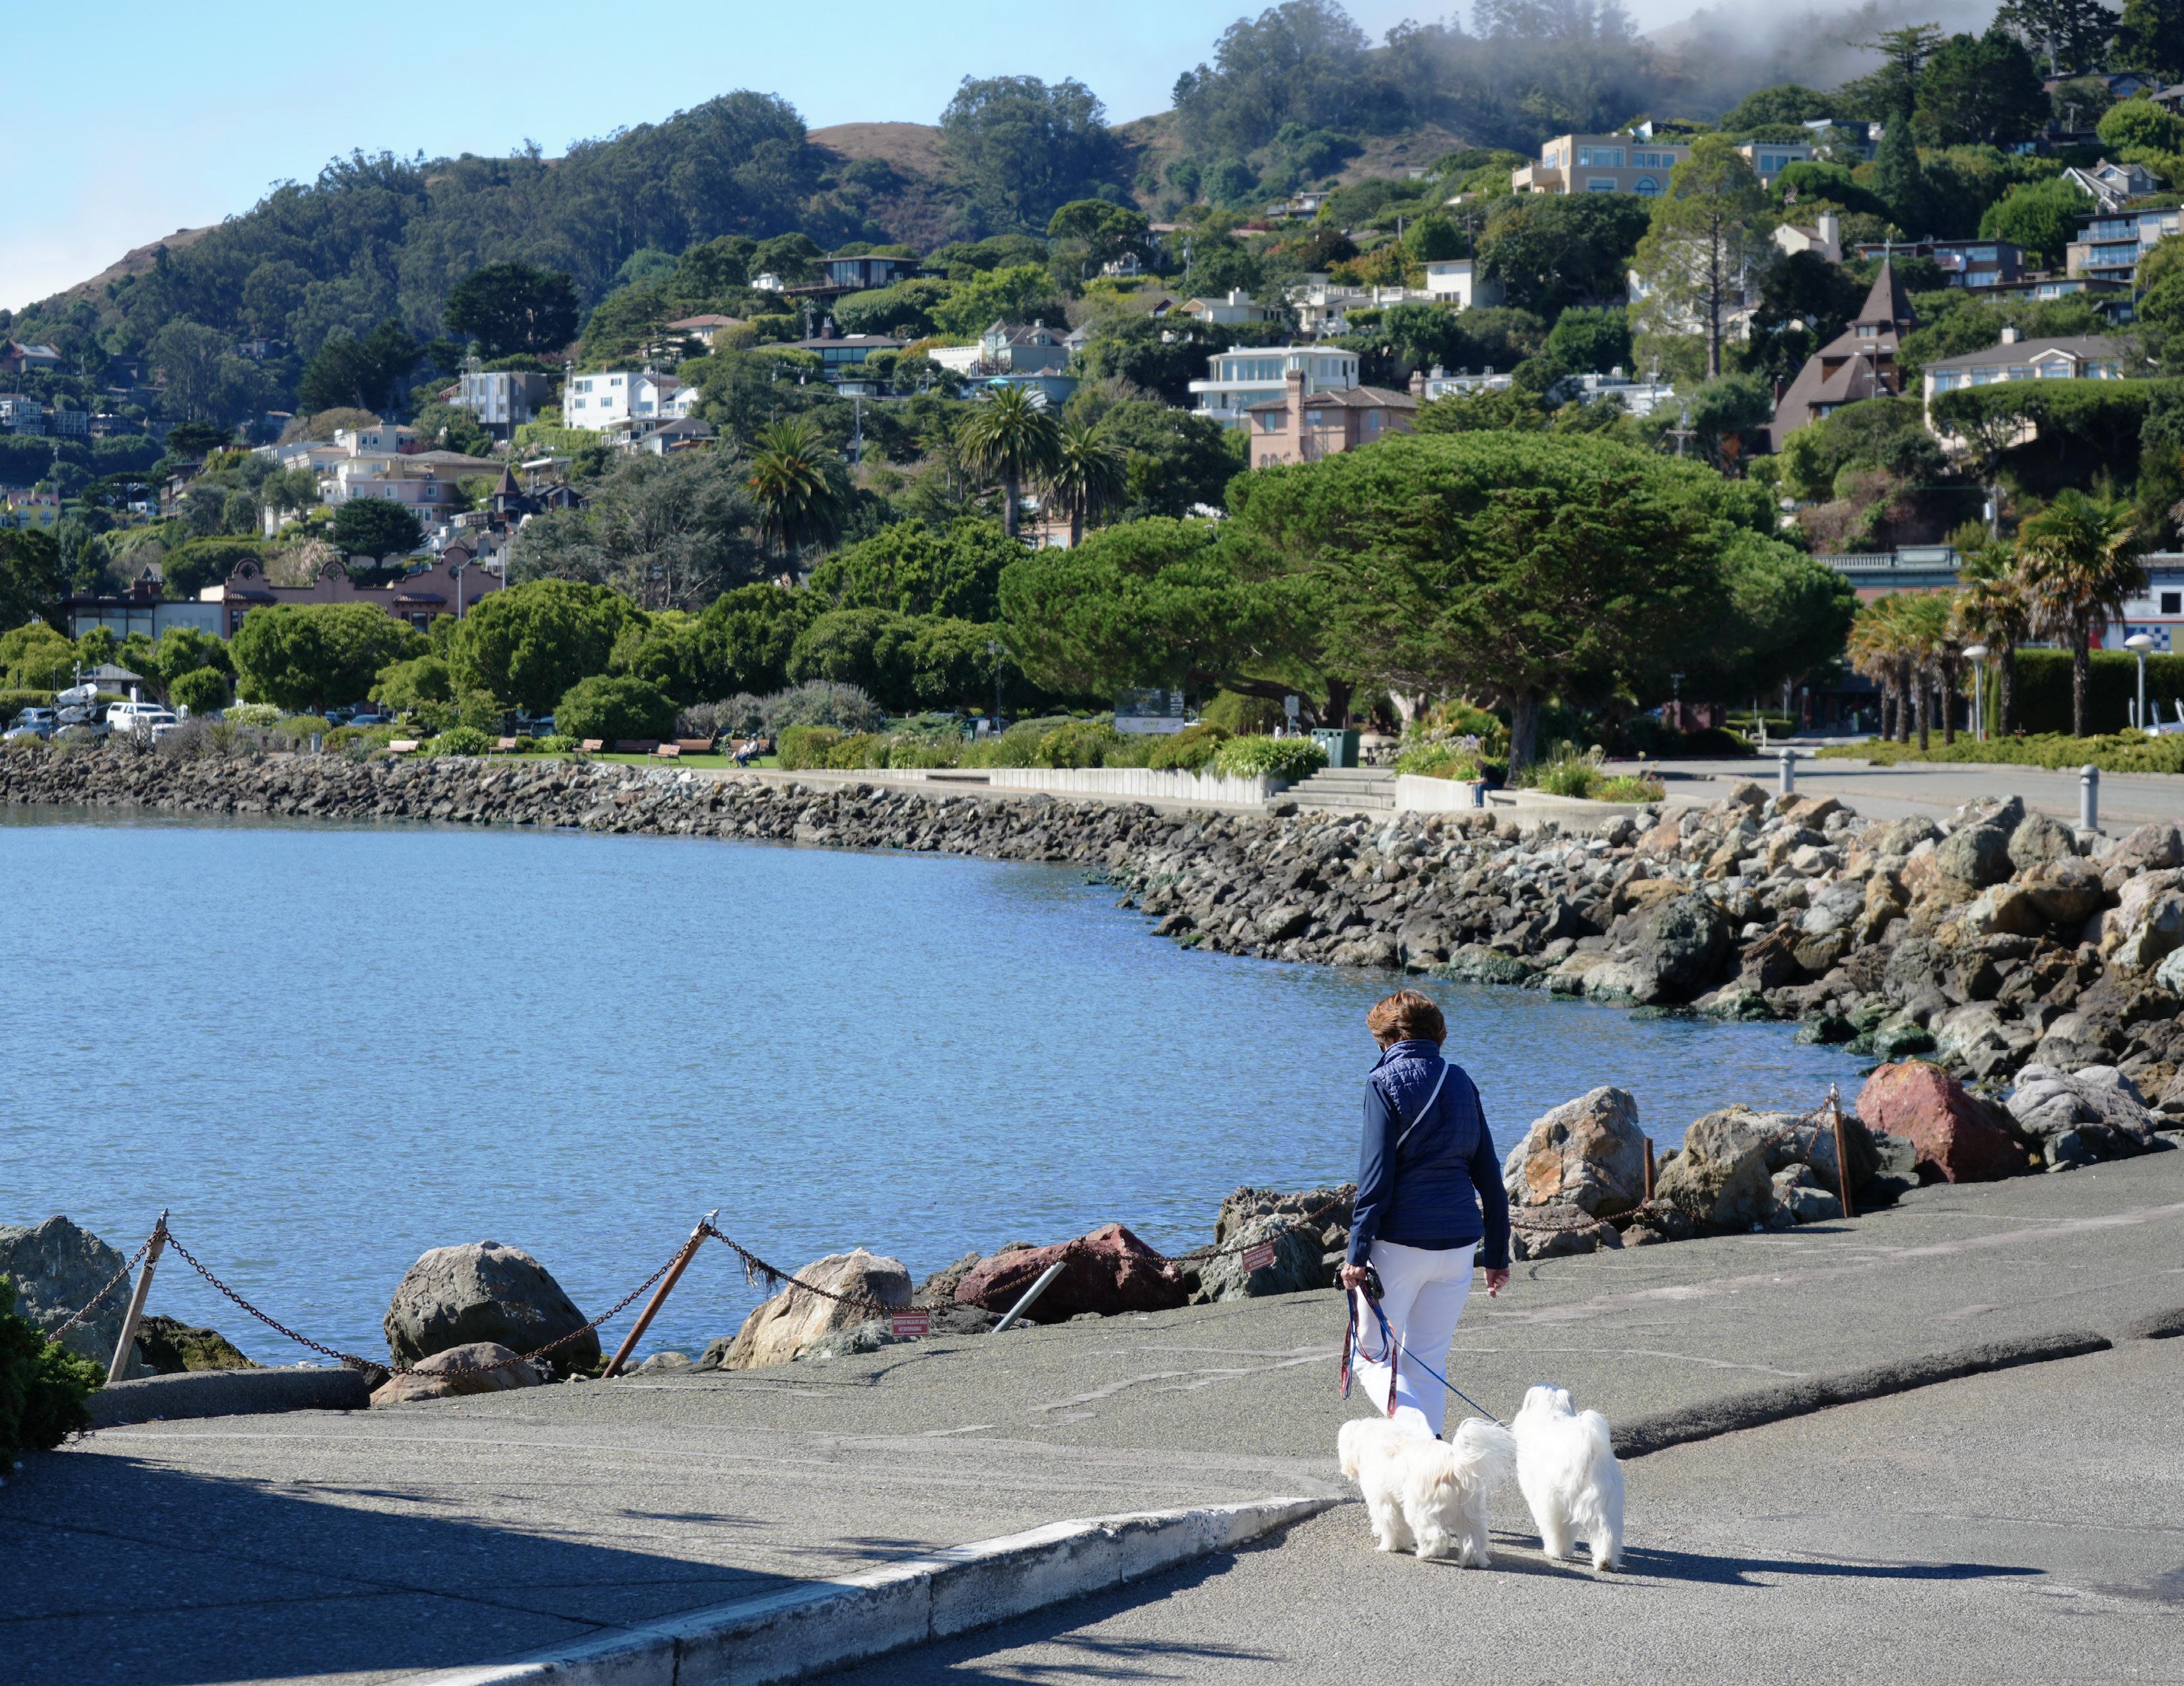
Adaptation strategy recommendations have been developed based on community input and technical review to address nearterm and long-term challenges. Near-term recommendations align with mid-century sea level rise projections that are more certain, and will help the City and local stakeholders
plan for the next ten to twenty years. The long-term recommendations included in this chapter include two alternatives that reflect the range of possibilities based on end-ofcentury sea level rise projections which are less certain. It’s helpful to maintain multiple alternatives and options for long-term planning that will extend thirty to seventy years into the future.
In this chapter, recommendations are organized by geographically distinct areas called reaches and delineated by their major stakeholders and shoreline. Reaches are further divided into sub-areas allowing for a more detailed description of potential
adaptation strategies. Sub-areas also help identify the stakeholders needed to continue planning and to take collective action.
The four reaches are:
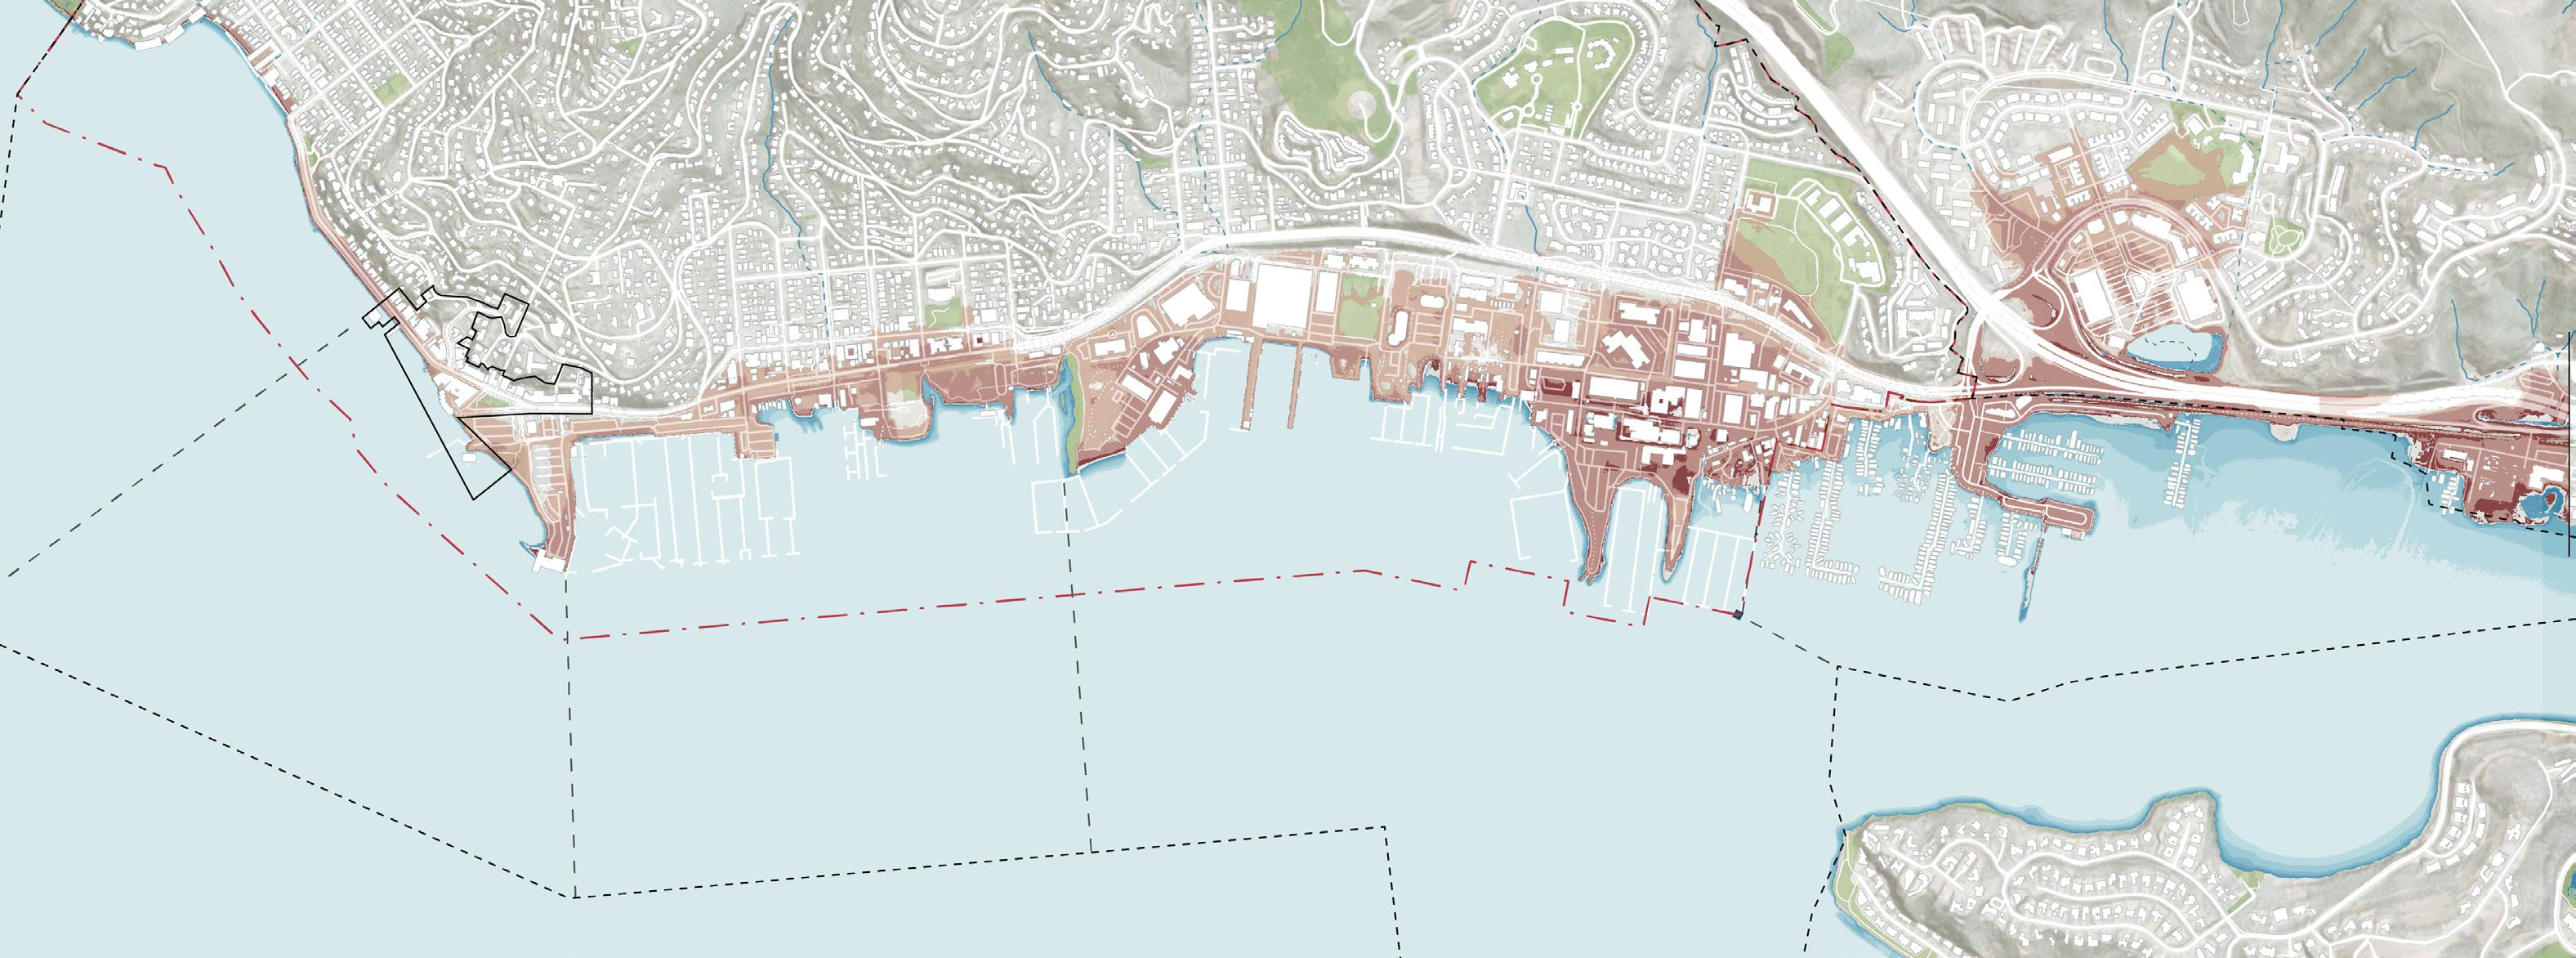
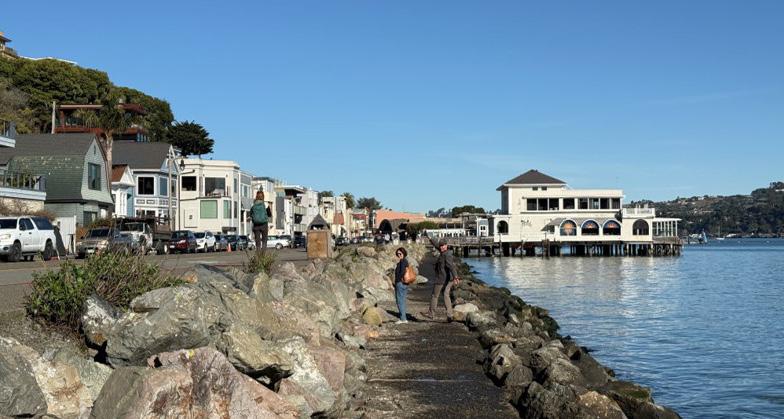
SW1 – South St/ Alexander Ave Shoreline
SW2 – Swede’s Beach
SW3 – Bridgeway Promenade
SW4 – Inn and Ferry Terminal
SW5 – Spinnaker
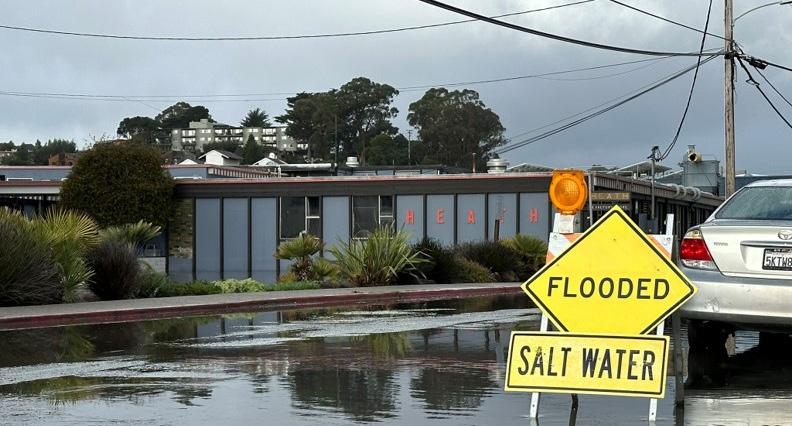
MS1 – Schoonmarker’s Beach
MS2 – Liberty Ship Way Shoreline
MS3 – Bay Model
MS4 – Marina Plaza, Sausalito Shipyard and Marina
MS5 – Clipper Yacht Harbor
MS6 – Gate 5 Road Shoreline (Harbor Drive to Coloma Street)
MS7 – Varda Landing
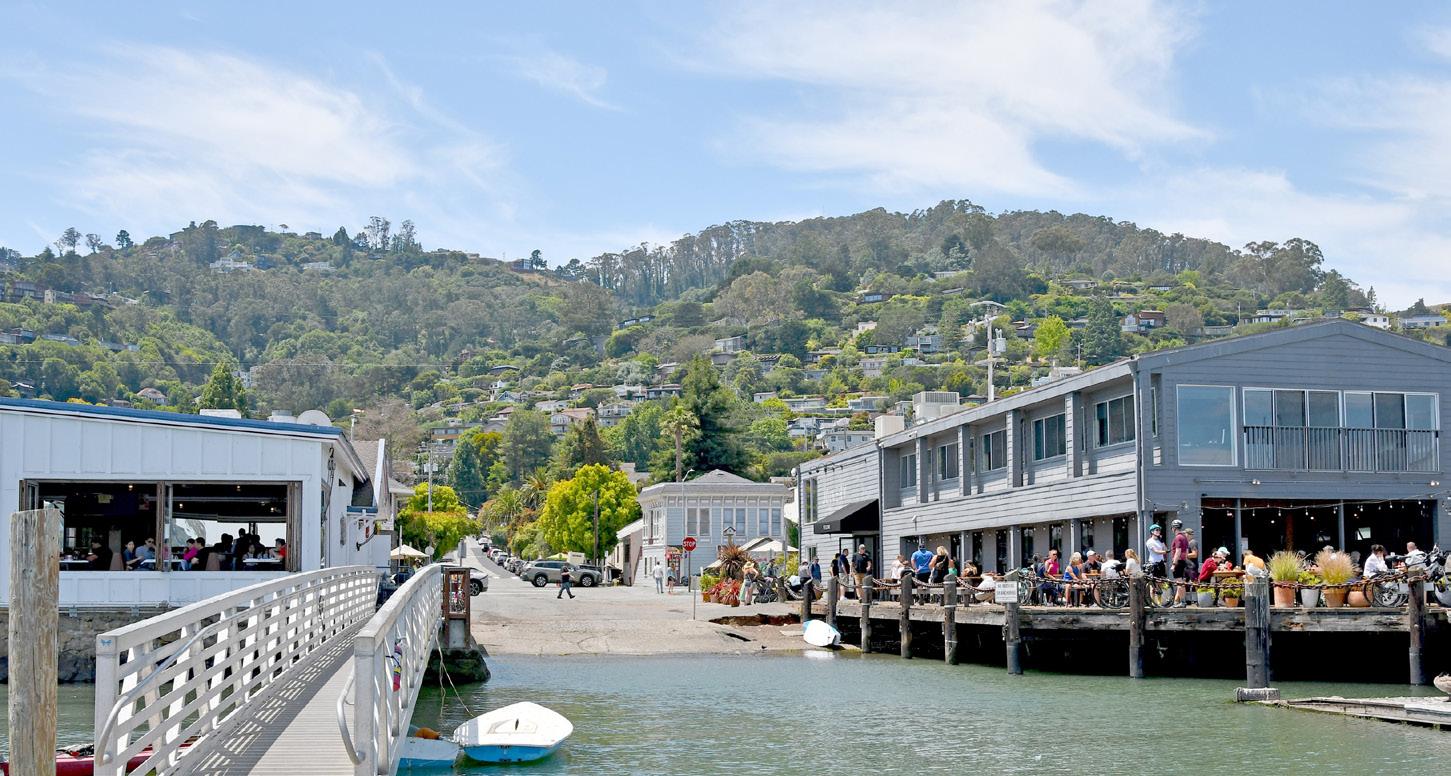
NT1 – Yacht Harbors (Bay St–Johnson St)
NT2 – Bridgeway New Town
NT3 – Joinery Beer Garden
NT4 – Dunphy Park
NT5 – Galilee Harbor
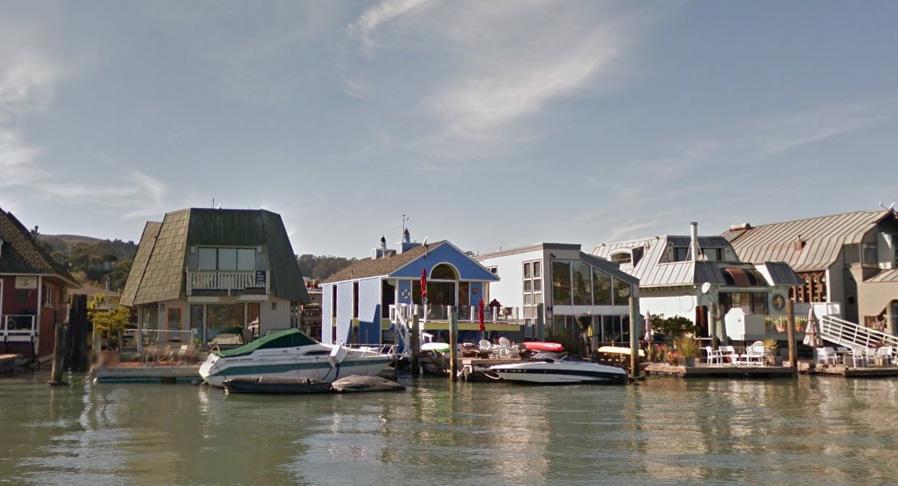
FH1 – Kappas Marine, Waldo Point Harbor, and Yellow Ferry FH2 – Gate 6-1/2 Road and Pier
– Highway 101 Shoreline
The toolkit of adaptation strategies is reintroduced in this chapter as the basis of
specific recommendations for the shoreline. Graphic icons are accompanied by a short description to create a glossary. Strategies range from traditional engineering to naturebased solutions. Each reach or subarea may reference multiple strategies, sometimes in combination. As was described earlier as the
“resilient edge,” a shoreline may be planned to meet multiple goals such as raising infrastructure, building seawalls, floating buildings, and expanding tidal wetlands. This chapter applies these tools to near- and long-term solutions for the entire shoreline. Harden the Edge
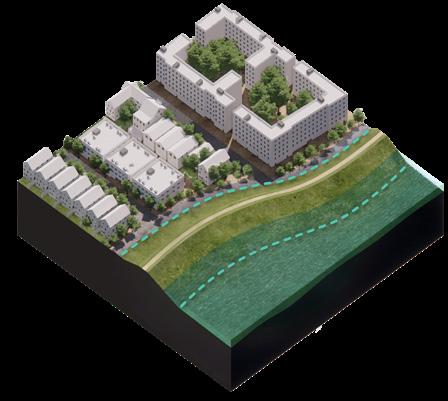
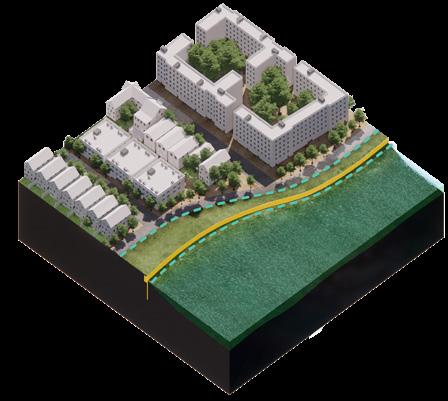
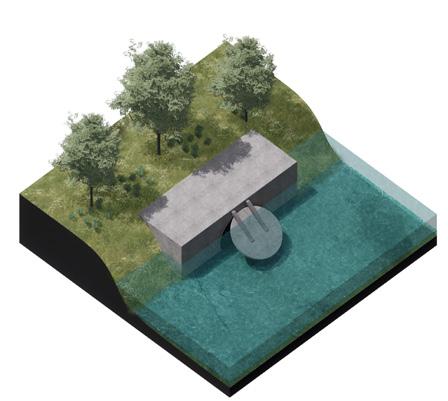
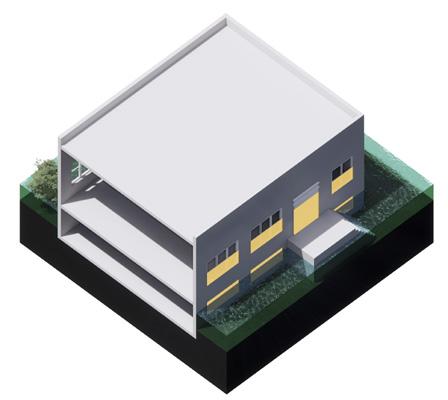
Berms
Seawall / Bulkheads
A levee or berm is a reinforced earthen structure, often running parallel to the course of a river or along low-lying coastlines, that physically blocks water from entering protected spaces while retaining vegetated banks and water access. Seawalls and Bulkheads are retained earthen structures built out parallel to coastlines in order to raise the ground level and protect from rising waters, currents and wave action, and to hold back land and prevent erosion
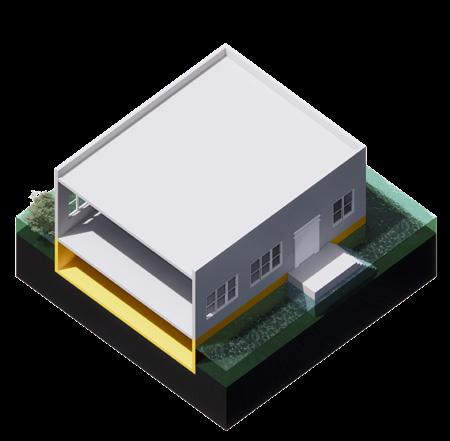
Raise Infrastructure
Dry floodproofing
Dry floodproofing lower floors of a structure provides both permanent and operable barriers to keep water out of structures during flood events. Structures are protected from water damage but are subject to increased lateral loads.
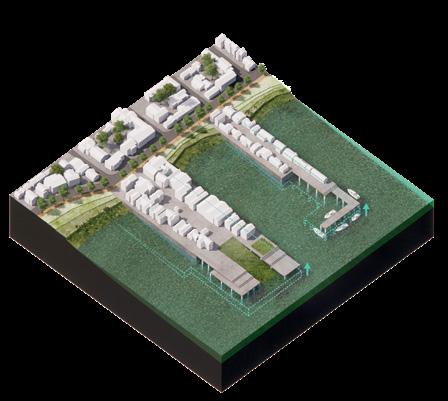
Adaptive Piers
Backflow preventers
Temporary flood barriers
Backflow preventers stop floodwaters from backing up into storm drains or buildings, protecting properties from sewer flooding during high tides or heavy rains.
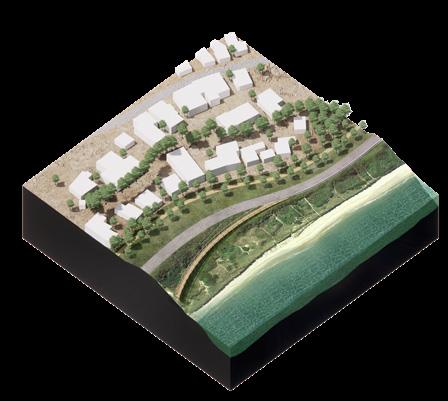
Raised infrastructure
Floating or adjustable pier structures that rise with water levels, maintaining access during floods and high tides. These piers use flexible connections, floating docks, or hydraulic systems to accommodate changing water heights while preserving waterfront functionality.
Temporary barriers provide both individual protection to keep water out of structures during flood events. Equipped with the flood gates they can be closed during flood events to protect from inundation, while being open at other times to retain waterfront access and usage.
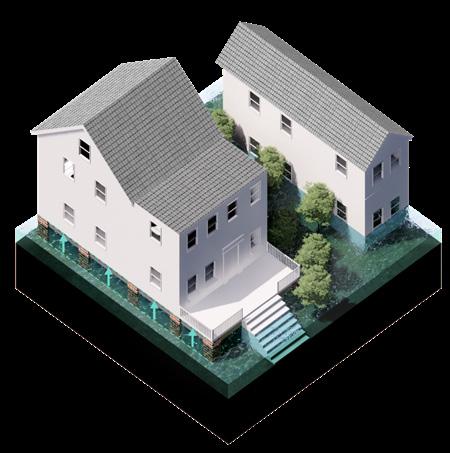
Elevated homes / assets
Elevating roadways above projected flood levels through embankments, bridges, or fill to maintain transportation access during coastal flooding. Includes upgraded drainage systems and resilient materials to withstand saltwater exposure.
Elevating the lowest floor of a building above the design flood elevation can offer protection from floods while retaining current occupation and usage.
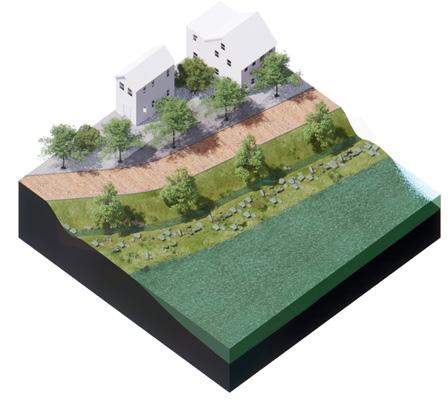
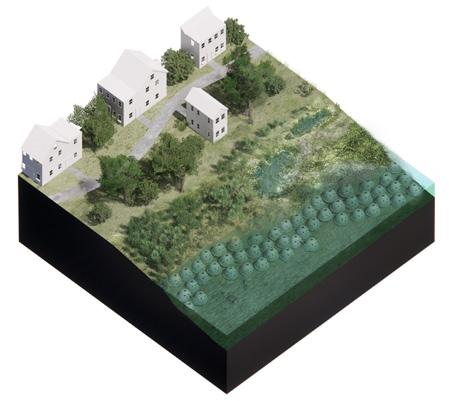
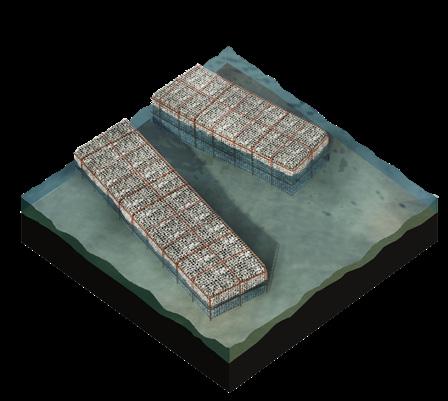
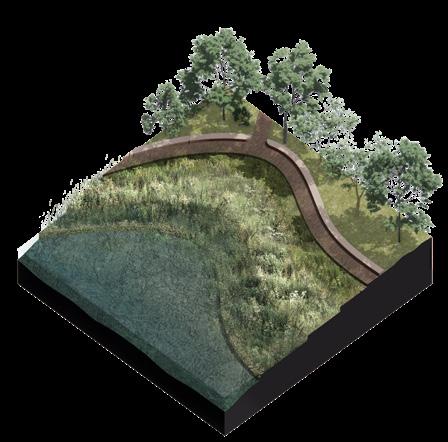
Levees set back from the shoreline, combined with native vegetation, increase flood buffering by reconnecting historic floodplains. They reduce flood velocity and stages while restoring habitat and improving ecosystem resilience.
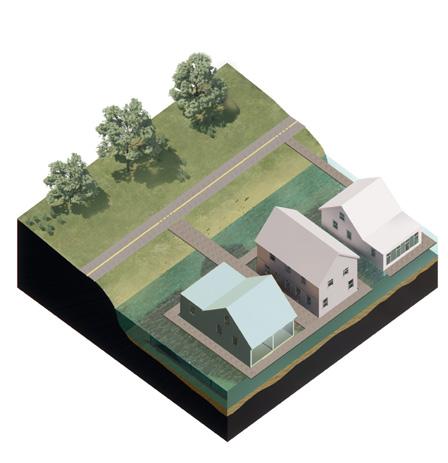
Vegetated setback levees Salt marsh development
Homes and facilities designed or upgraded to float on pontoons, rising and falling with tides and floods. They maintain function during high water levels and reduce flood damage by adapting to changing water elevations.
Living shorelines
Natural shoreline stabilization using plants, sand, and shell to reduce erosion, absorb wave energy, and provide habitat. Living shorelines adapt dynamically to rising seas while enhancing coastal water quality.

Constructed habitats
Engineered habitats like oyster reefs and marsh platforms built to restore ecological function and reduce flood risks by attenuating wave energy and providing natural flood storage.
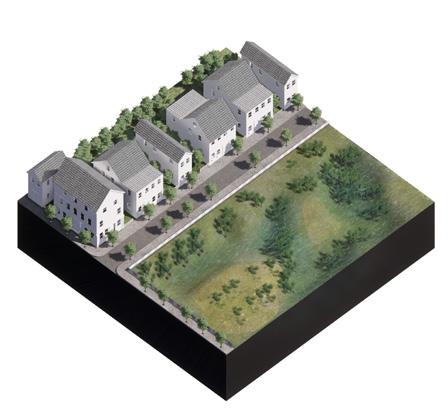
Wetland restoration
Creating and enhancing marshlands that \ buffer storm surges, absorb floodwaters, and provide critical habitat. Salt marshes improve shoreline stability and water quality while adapting naturally to rising seas.
Rebuilding degraded wetlands to increase flood storage and reduce wave energy. Restored wetlands support biodiversity, improve water filtration, and enhance coastal resilience to flooding and sea-level rise.
Tidal Park/ levee system
A multifunctional levee combined with tidal wetlands and public park space that buffers flooding while offering recreational benefits, supporting wildlife, and adapting flexibly to sea level changes.
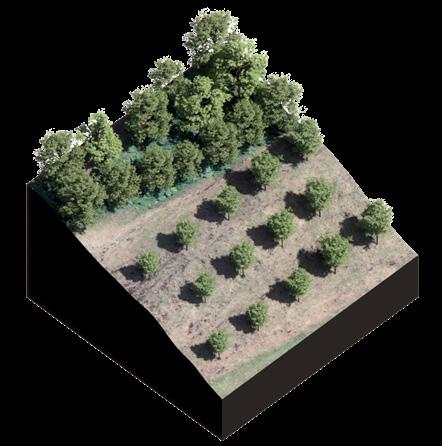
Reforestation
Planting coastal forests or buffer trees that stabilize soils, reduce erosion, and absorb stormwater runoff. Coastal reforestation contributes to long-term flood mitigation and ecosystem health.
Each area includes a set of near-term recommendations and two longterm alternative options. Near-term recommendations address 2050 sea level rise projections of 0.8 feet with storm surge, which totals 4.3 feet. Long-term alternatives address 2100 sea level rise projections of 3.1 feet with storm surge, which totals 6.6 feet.. These are followed by a more detailed description of environmental opportunities.
Near-term recommendations typically involve retrofits to existing infrastructure, further planning, and technical studies. These actions reduce near-term impacts while serving as the foundation of long-term strategies.
Each reach includes two long-term alternatives. The first long-term alternative is often focused on individual, asset-byasset adaptation, and a second alternative describes a collective approach at a larger scale. All solutions are conceptual in nature. Long-term concepts are limited in accuracy and specificity (i.e. the alignment of shoreline protection). They intend to inform further study by the City and land owners. The first alternative allows incremental solutions
for the localized risks, and the second is focused on consensus-building around shared cultural and environmental values.
This approach to adaptation diagram visualizes three potential options for implementation.
Approach 1 starts with a near-term, low elevation adaptation, knowing that it may need to be replaced by a higher-level protection.
In Approach 2, the infrastructure is designed such that it can, at a later stage, be further elevated.
In Approach 3, a distinct near-term adaptation is passed over in favor of a direct investment in higher level adaptation.
CAPACITY
ADAPTATION PATHWAYS


Near-term Recommendations
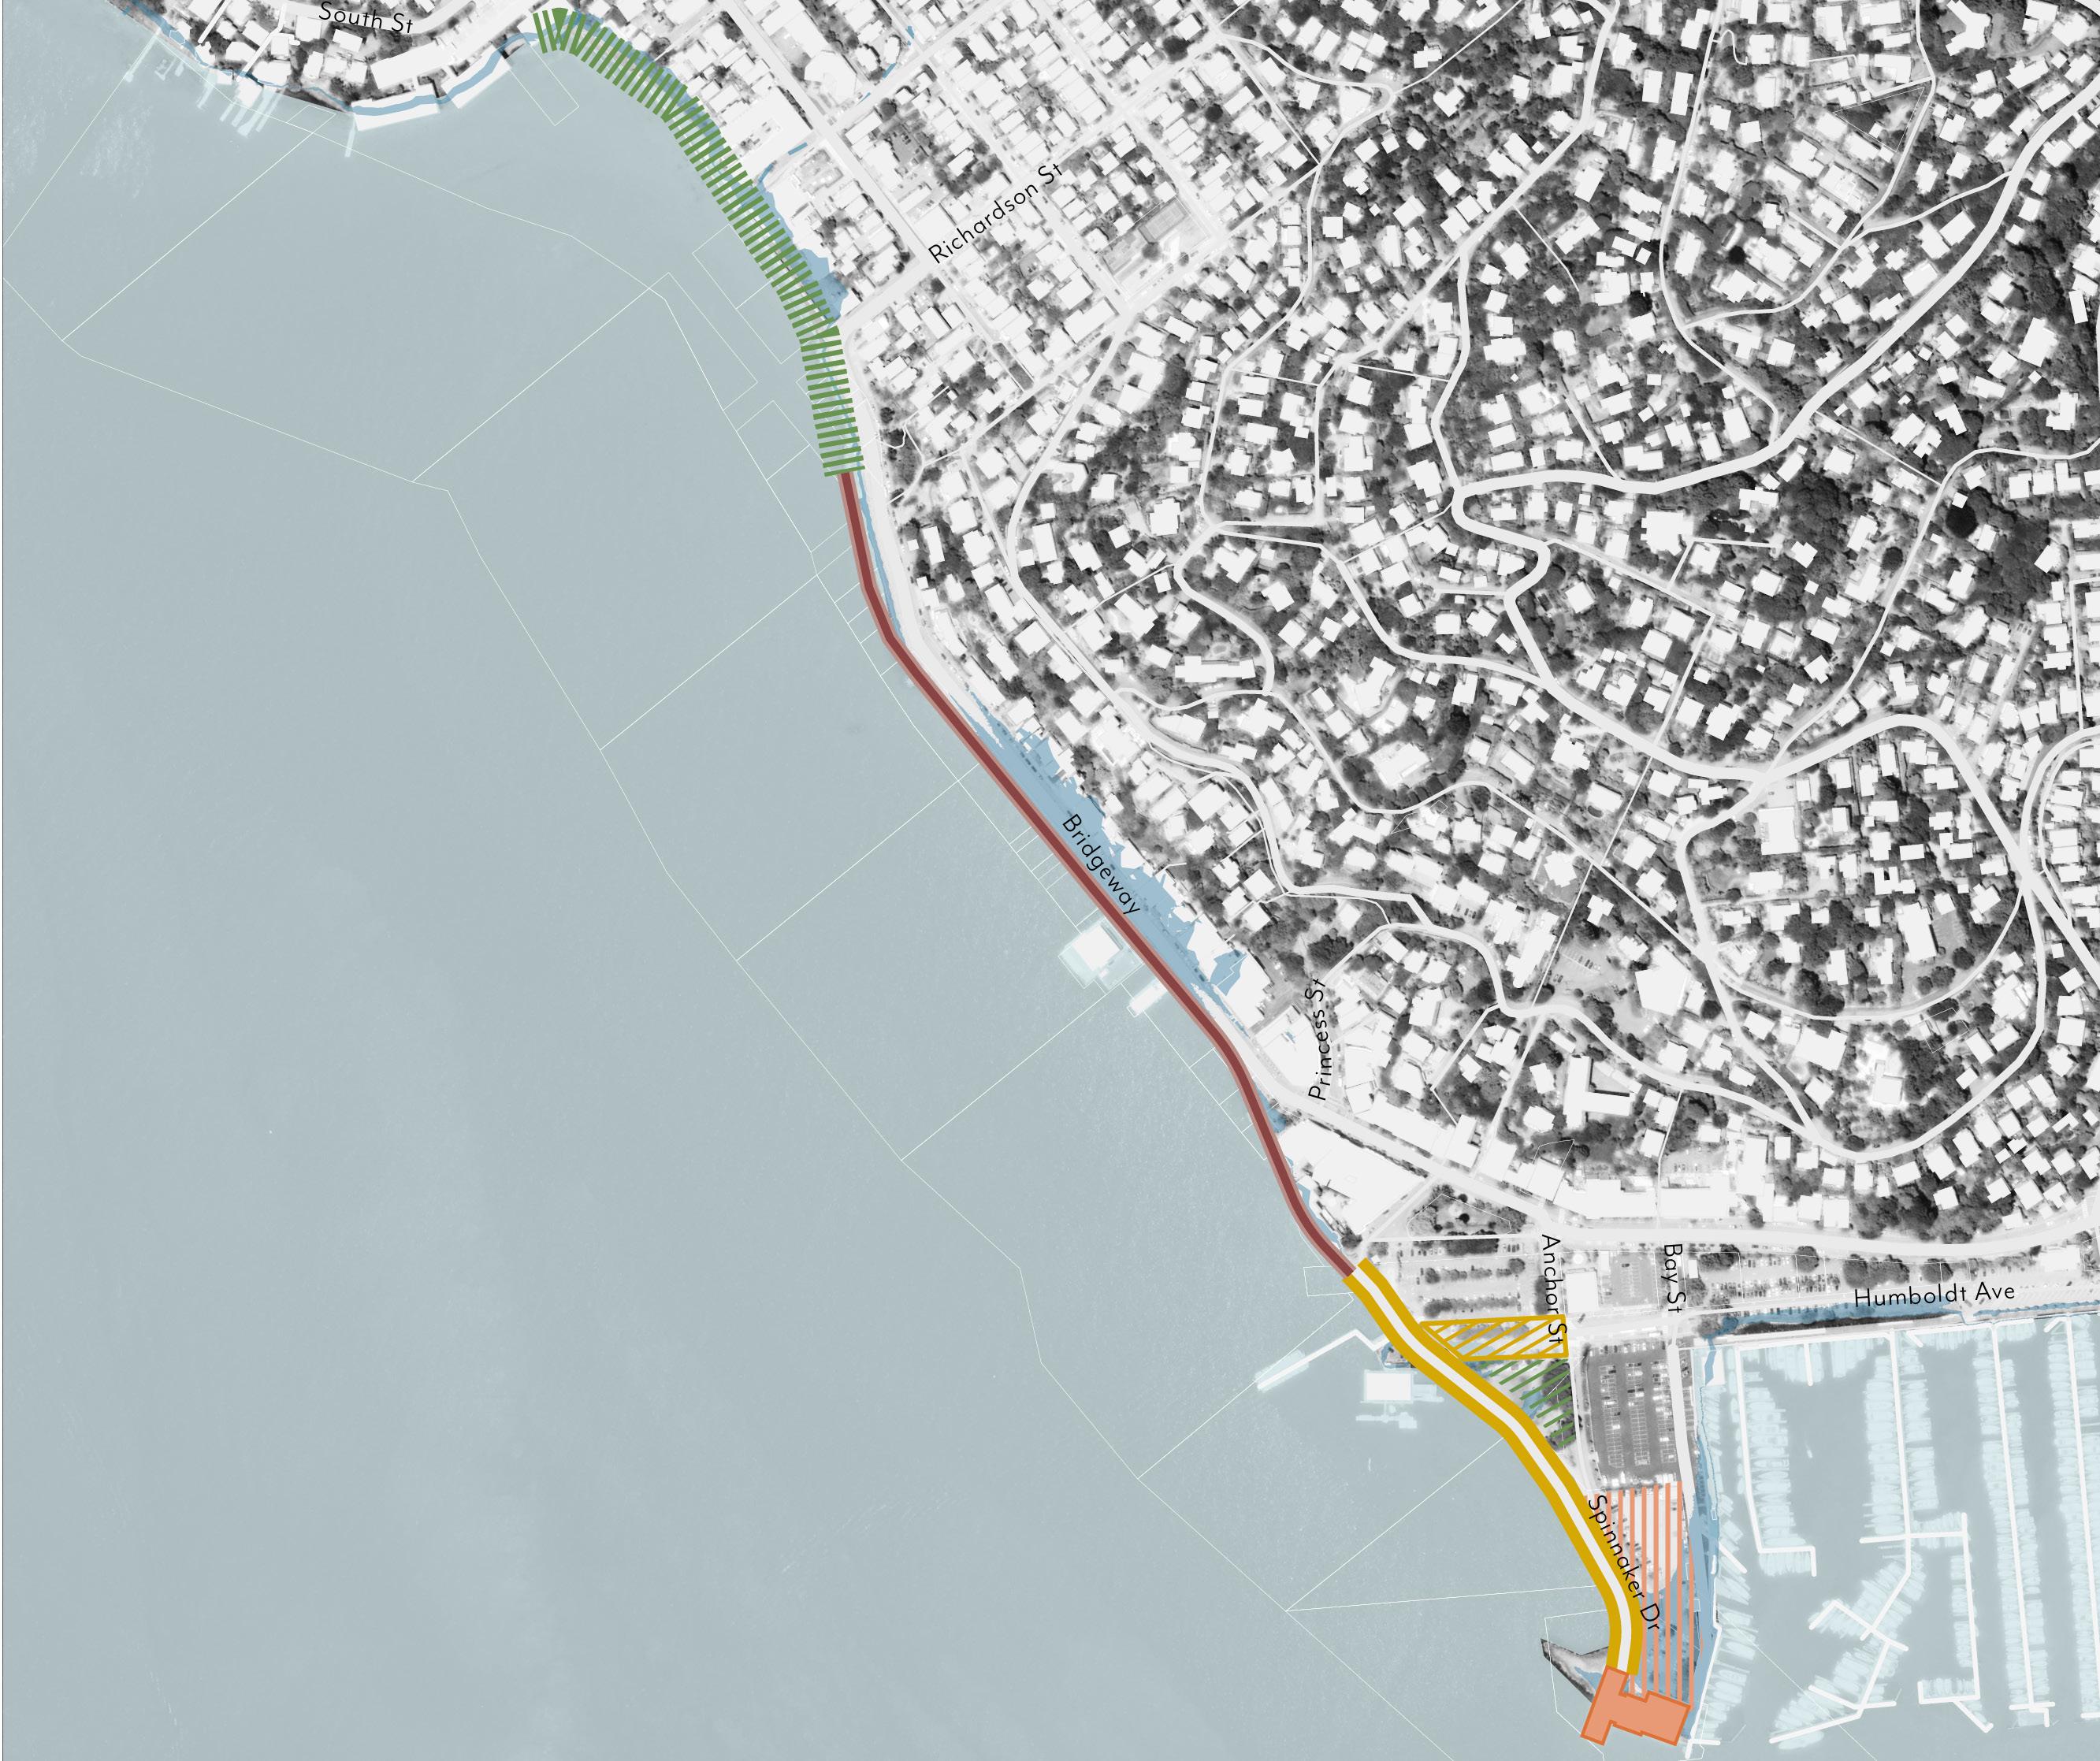


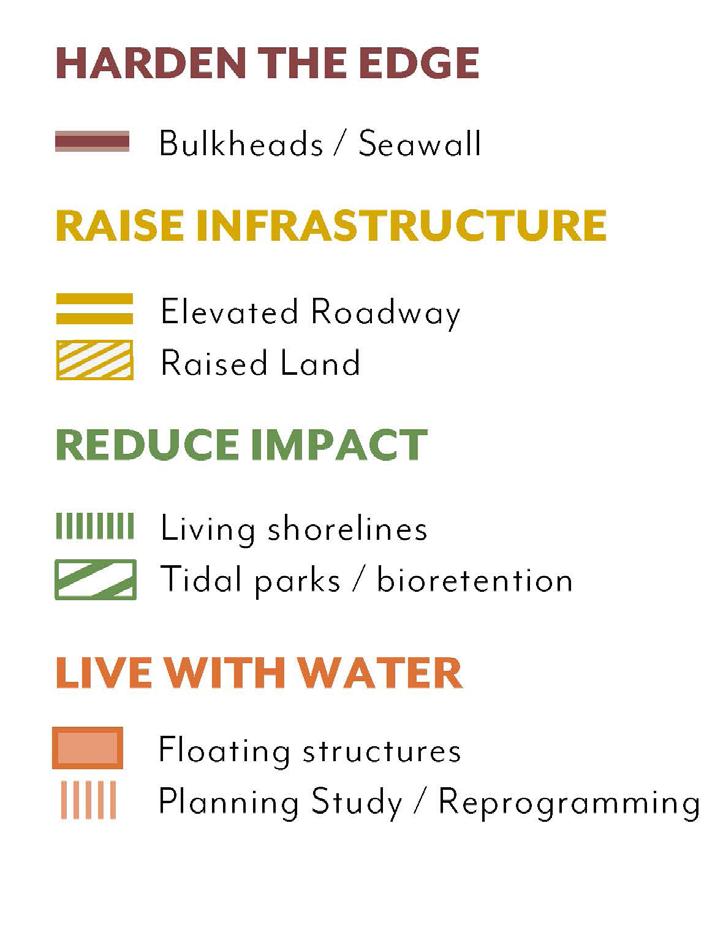


Near-term actions for the Southern Waterfront and Bridgeway are focused on detailed technical studies that will inform long-term adaptation alternatives for roads, utilities, and private properties. Light touch repairs, nature-based improvements and enhancement of rocky shorelines are also noted.
• No near-term impacts to existing homes are observed, however, continue monitoring of shoreline erosion and geotechnical conditions.
• Offshore habitat and rocky subtidal enhancements to establish near-term and future habitat development over time.
• Swede’s Beach presents an opportunity for coarse beach enhancement to reduce wave impacts.
• Structural improvements to be evaluated for the boardwalk to maintain access.
• Property owners should study feasibility for future building retrofits as sea level rises.
• Complete minor repairs to existing armoring along Bridgeway
• Low concrete walls that add protection and offer seating along the Bridgeway sidewalk can be built in coordination with local businesses and scenic views.
• Deploy temporary barriers and pumps during high wave events.
• Further study of the existing seawall condition, vulnerability of utilities, and private property adaptation should be completed.
• Explore building codes to incentivize adaptive buildings in flood prone areas.
• Implement minor elevation of low areas of sidewalks and parking lot near Ferry Terminal during general improvement projects.
• Raise Gabrielson Park and shoreline walkways as part of redesign.
• Parking lot and driveway to Spinnaker is raised or protected with a low wall to reduce nuisance flooding. Consider temporary barriers in lieu of permanent barriers that may be abandoned in the long-term.
• Study feasibility to raise and save existing City Spinnaker building, build new, or abandon.
ADAPTATION STRATEGY RECOMMENDATIONS CONTINUED
Long-term Option 1 (Keep Bridgeway Dry)
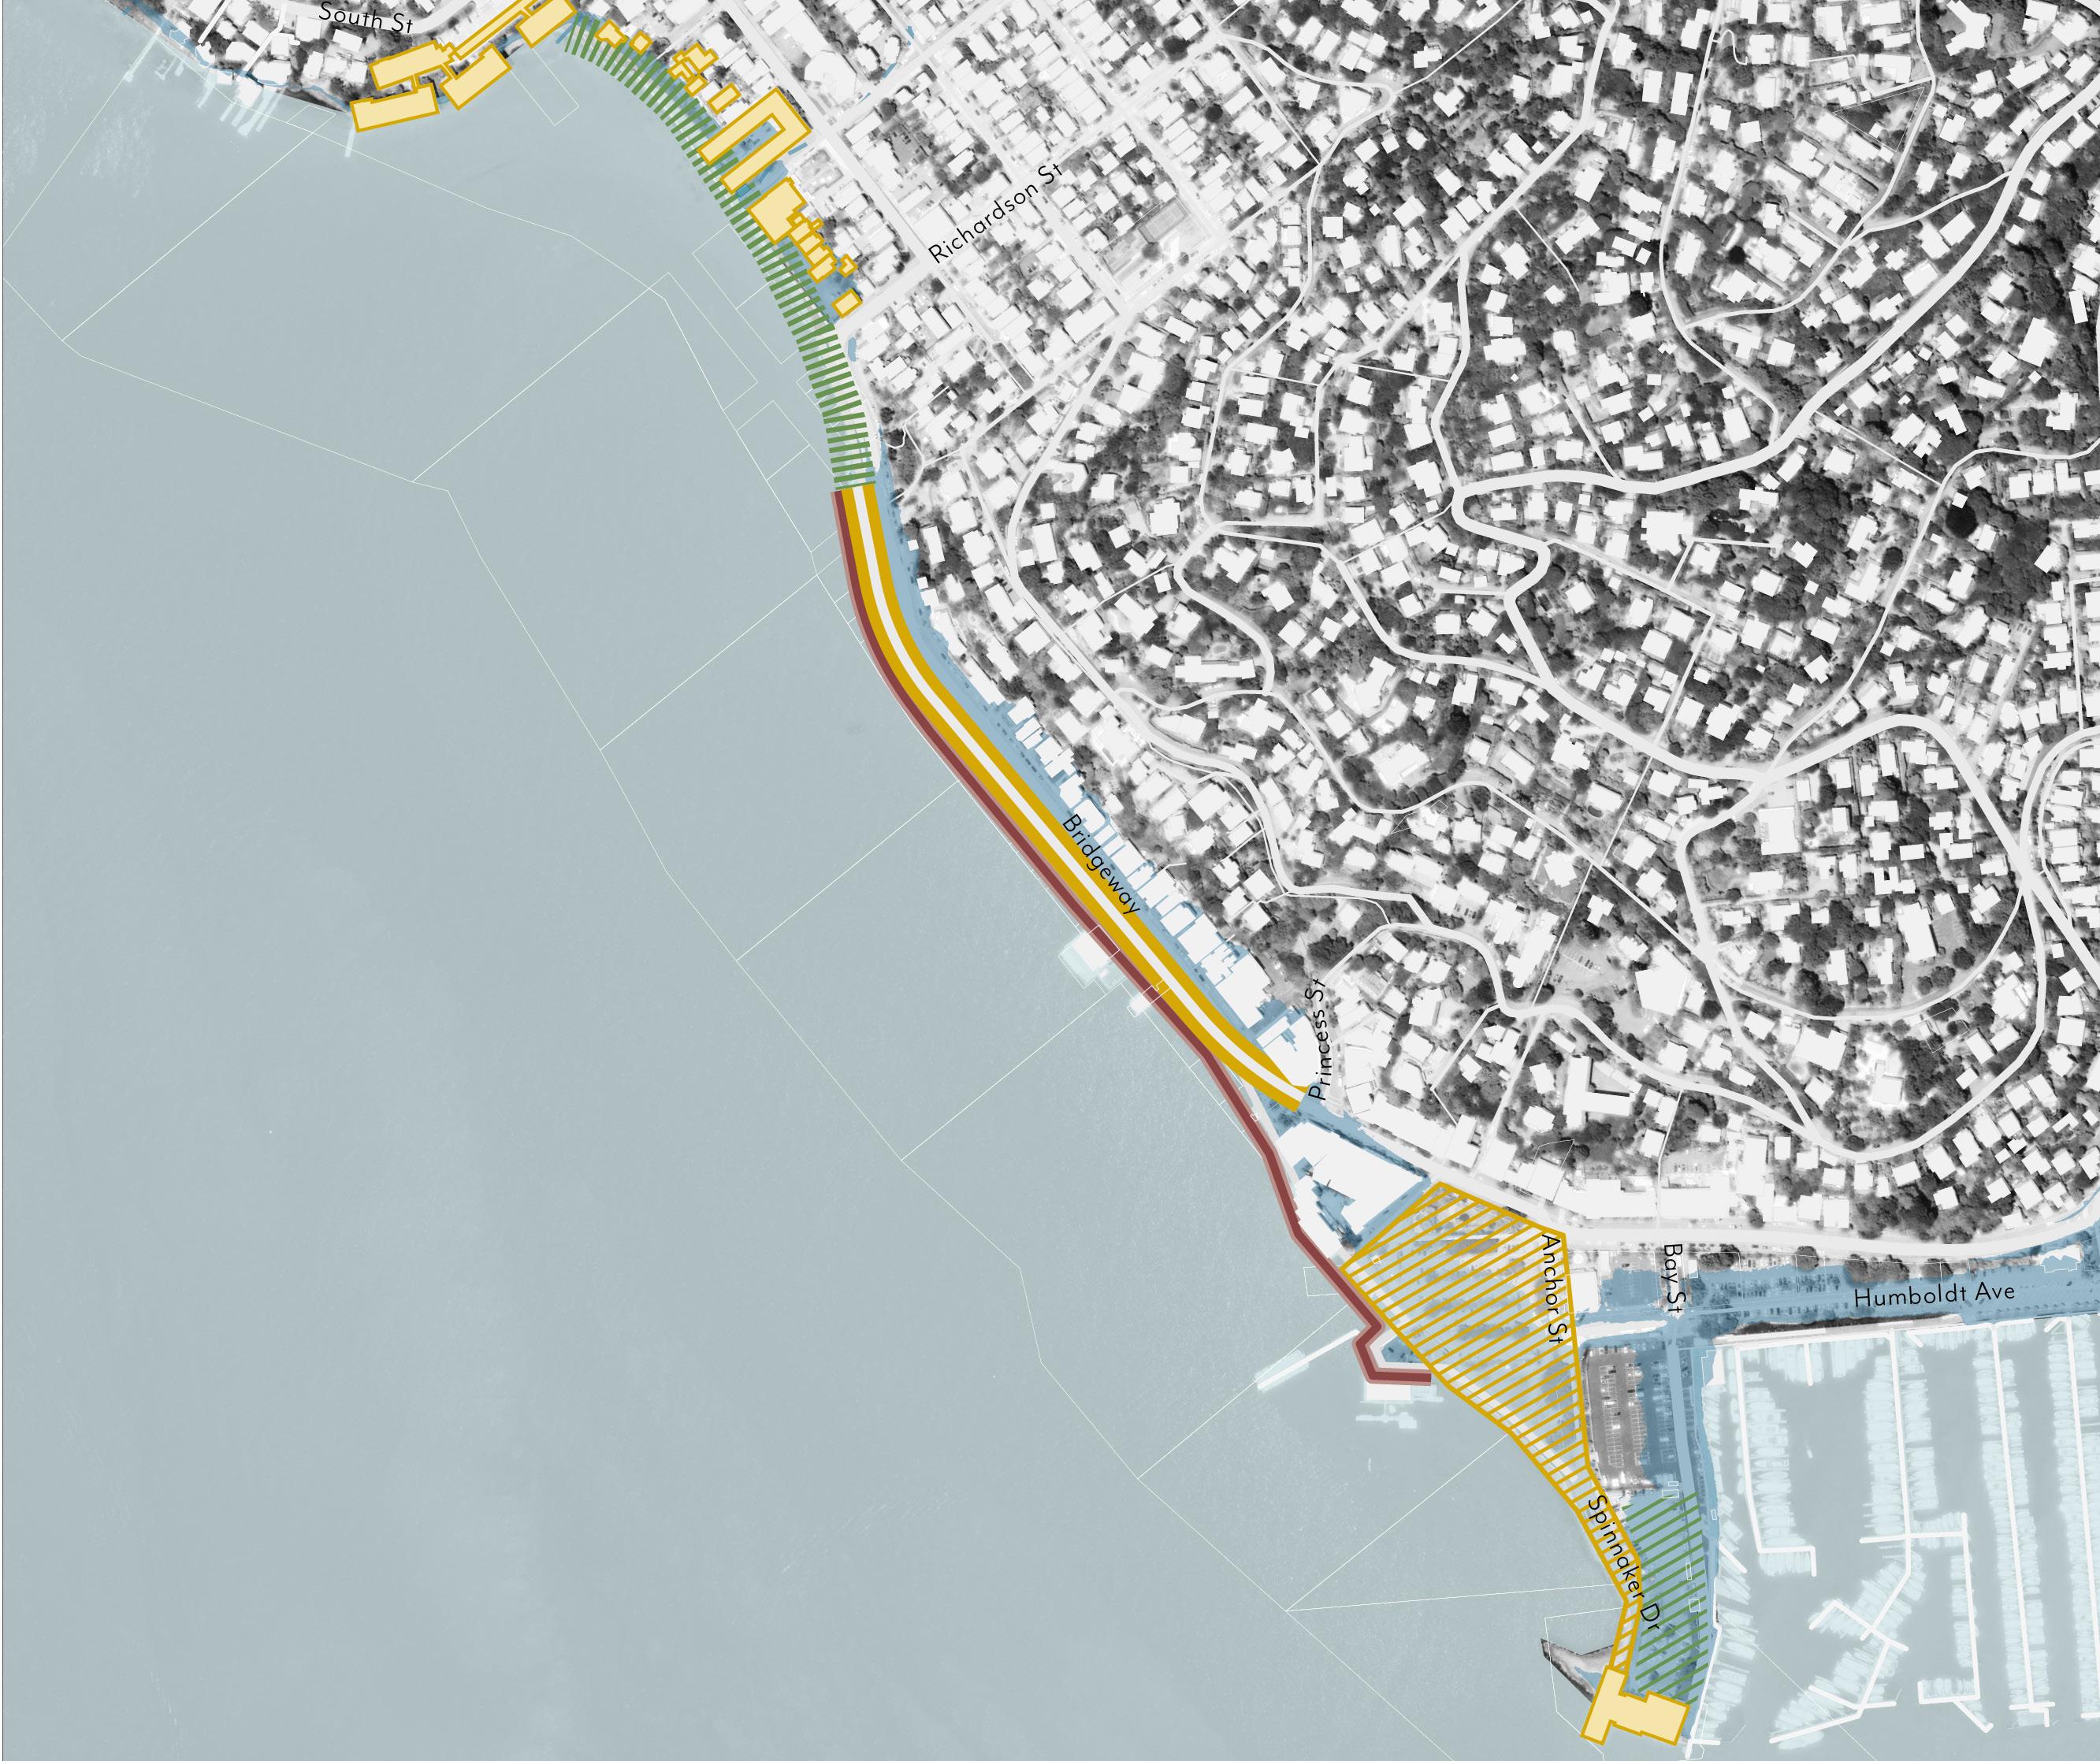
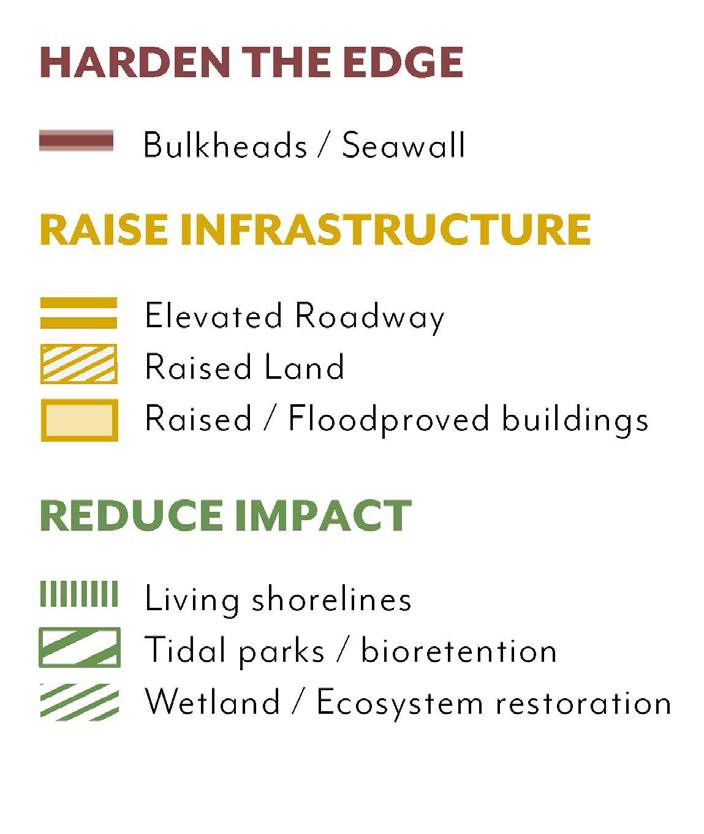
Long-term individual adaptation prioritizes targeted elevation of the commercial corridor and evacuation routes by the City and individual property owners. There are opportunities to identify locations for green infrastructure interventions combined with drainage upgrades to manage stormwater.
• Continue monitoring of shoreline and bluff stability.
• Extend pier piles as needed to maintain waterfront access from homes.
• Integrate shoreline stabilization and beach nourishment at Swede’s Beach to help protect structure foundations. Public boardwalks are retrofitted as needed.
• Retrofit individual structures as needed.
• Raise the Bridgeway and sidewalk promenade in combination with a major seawall if the near-term elevation was minimal (i.e. low wall for seating). This can be combined with upgrades to the roadway including widening to address multi-modal goals, and expanding sidewalks to create an attractive public
promenade and commercial frontage.
• Raise existing buildings on the land side of Bridgeway to street level or retrofit at the ground floor to be flood proofed.
• Protect utilities and enhance drainage systems.
• Strengthen seawall at Ferry plaza and bulkheads at existing buildings. Raise Ferry Plaza and parking area as needed with long-term renovation/conversion to multi-functional plaza or consider at later phase.
• Elevate Spinnaker building, abandon, or rebuild new.
• Raise access and parking to building as needed. Consider pier structure for service and conversion of existing land area to tidal habitat.
ADAPTATION STRATEGY RECOMMENDATIONS CONTINUED
Long-term Option 2 (Corridor Redevelopment)
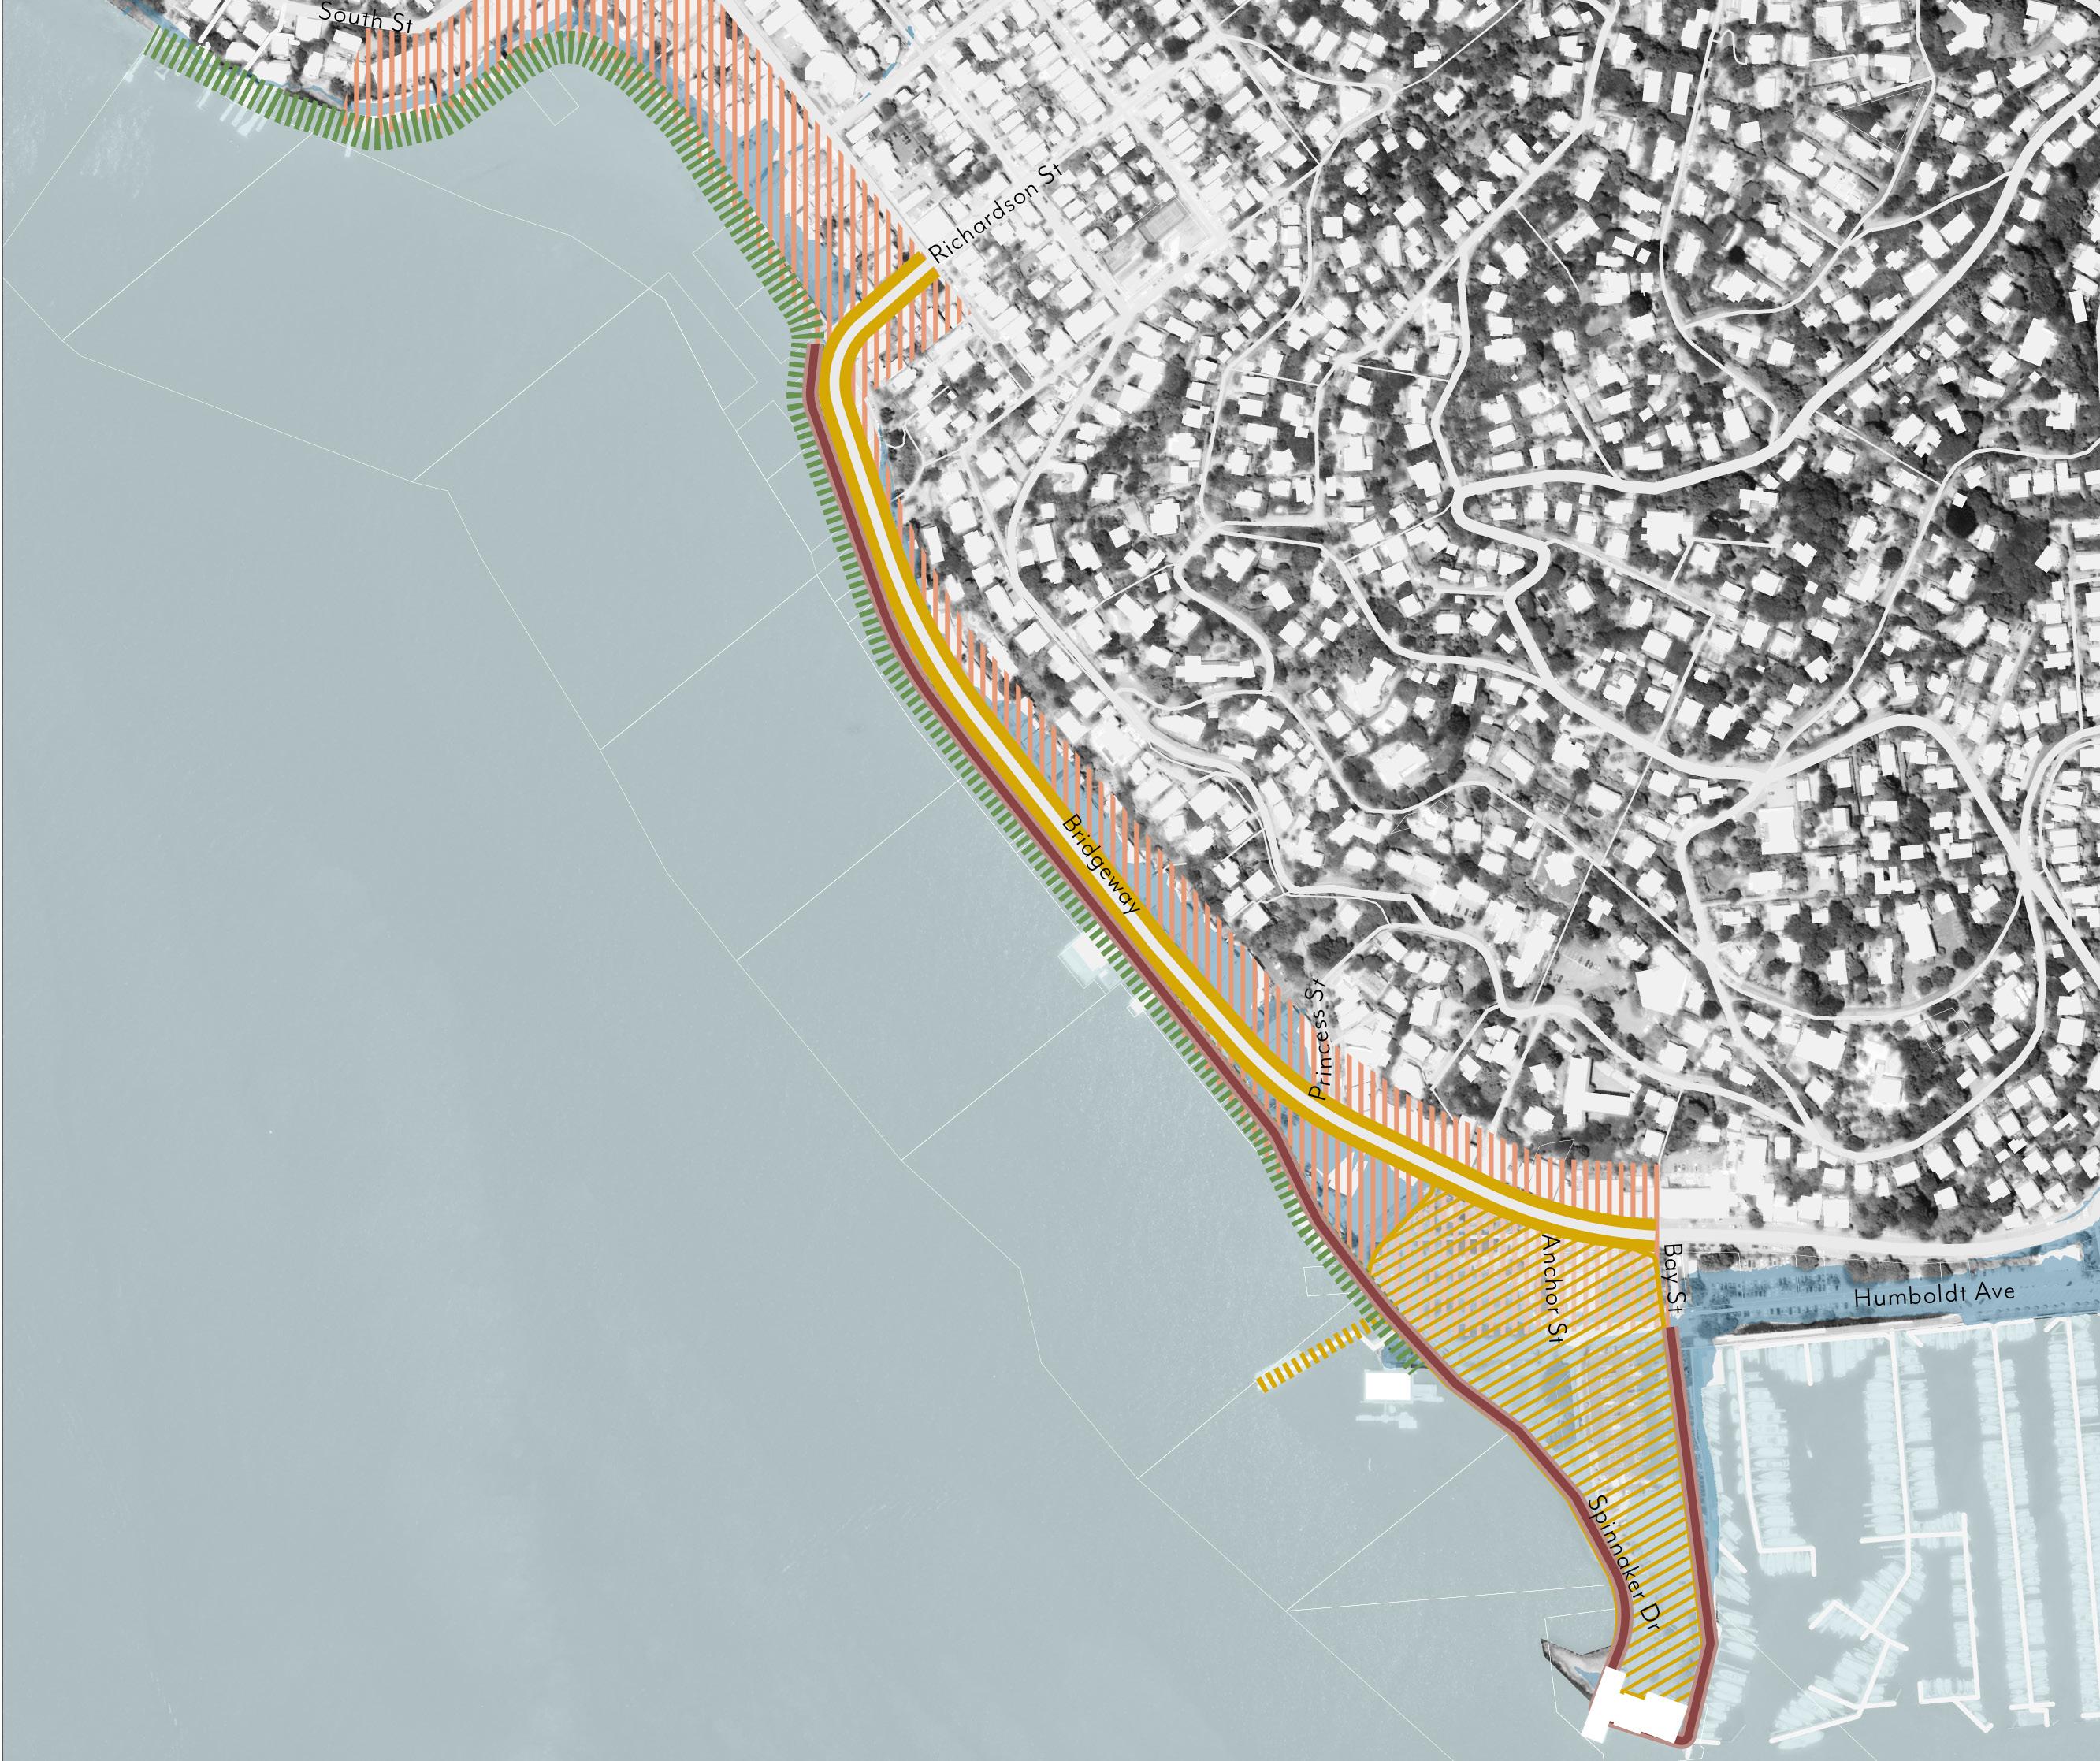
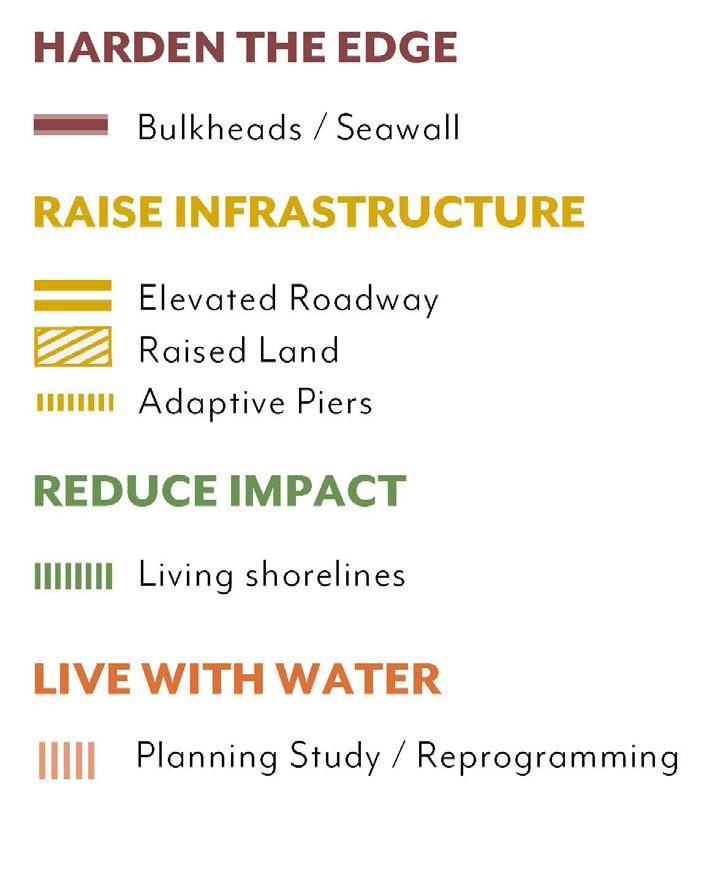
A long-term collective strategy centers on a more robust project to reenvision and reconstruct the Bridgeway corridor, Ferry Plaza, and Spinnaker peninsula with large scale raising of access routes and redevelopment of buildings in an integrated manner. This could include a more extensive public promenade and street redesign connecting Swede’s Beach to Gabrielson Park including the Ferry Plaza and areas near the Arts Center. A project of this scale and magnitude may be able to address parking needs in areas other than the shoreline. Coarse Beach and subtidal rocky habitat are expanded. A large-scale project as described will require decades of planning and alignment of property owners toward shared goals. The project cost would be high, funded through multiple sources including grants, private development, and district-based financing.
The Southern Waterfront & Bridgeway corridor offers opportunities for naturebased long-term adaptation by building on existing beach and rocky intertidal habitats. At Swede’s Beach and Bridgeway Promenade, coarse beaches and rocky shoreline enhancements can improve shoreline protection while supporting marine biodiversity. Pockets of potential wetland restoration further strengthen natural flood buffers, improve water quality, and create vital habitat for fish and birds. Integrating these ecological strategies with infrastructure upgrades—such as the multi-use event stage over the seawall at Gabrielson Park—can deliver resilient waterfront protection, enhance recreational spaces, and reduce the erosion of Swede’s Beach under the end of century flood scenario.
Pathways are described for near and long-term actions at each sea level rise scenario. Near-term actions are prioritized at Bridgeway Promenade and Spinnaker where flood impacts are seen today.
Raising Bridgeway and building a seawall is the major long-term action. Based on vulnerability and critical infrastructure, the choice is when, not if.
Phased Bridgeway and access roads elevation at the ferry terminal ensure transportation connectivity. Coordinated upgrades include stormwater infrastructure, raised parking areas, and flood-tolerant hubs that maintain connectivity during floods while preserving waterfront character.
Nature-based strategies leverage existing beach and rocky intertidal habitats. These strategies adapt dynamically to changing coastal conditions.
Individual property retrofits, commercial corridor elevation, and flood-adaptive homes are the urgent measures. Strategic investments include expanding the promenade as a world-class destination, adapting historic buildings, and relocating parking.
The two groups of adaptation actions –infrastructure + nature-based solutions, and assets – rely respectively on the public and private stakeholders’ involvement and leadership. In Southern Waterfront & Bridgeway, infrastructure and assets at risk that require coordinated actions are:
• Elevated Multifamily Homes at Swede’s beach
• Bridgeway commercial corridor
• Ferry Terminal site
Residential clusters and the beach at Elevated Homes and Swede’s beach will need property-specific and neighborhoodscale adaptation. Key stakeholders here:
• Private property owners
• Homeowners’ associations
• Swede’s Beach Club
• City’s Sustainability Commission
• City’s Department of Public Works
• Sausalito-Marin City Sanitary District
• Emergency planning and management
• Southern Marin Fire Protection District
The Bridgeway Promenade is a mixed-use corridor central to Sausalito’s identity. Both local businesses and citywide organizations need to be engaged to coordinate floodproofing of the buildings and raising the promenade and roadway, promoting design
solutions to maintain waterfront access and character:
• Sausalito Chamber of Commerce
• Downtown Business Improvement District
• Non-Profit Organizations
• City of Sausalito Parks and Recreation
The ferry terminal site and upgrades will involve more citywide organizations and regulatory agencies to ensure coordinated adaptation.
• Golden Gate Ferry Service
• Marin Transit
• City Engineering Department
• The Ferry Riders Coalition
• Utility companies to protect their assets by adapting buildings
At Spinnaker & Gabrielson Park waterfront business and public realm is well-positioned for community-driven adaptation efforts to protect the access to the water. Potential partners involve city agencies and community organizations:
• Parks & Recreation
• Sausalito Center for the Arts
• Sausalito Yacht Club
• The Spinnaker Restaurant
• Downtown Business Improvement District
• Downtown Bussinesses
Additionally, a number of resilience-focused and environmental organizations citywide or at other parts of the waterfront can be strategic partners and share their experience in adaptation with the local stakeholders at this reach. Sausalito partners with residents and schools for shoreline cleanups, citizen science, and educational events that promote stewardship of piloted artificial reefs and living breakwaters. These are:
• Sausalito Community Boating Center
• Sausalito-Marin School district
• Save The Bay
• Sausalito Beautiful
• Sausalito Pedestrian and Bicycle Advisory Committee
• Richardson Bay Regional Authority
• Richardson Bay Audubon Center
• Marine Mammal Center
• Marin County Bicycle Coalition
• Environmental educators from Bay Model Visitor Center and the Coastal Conservancy
• Downtown Business Improvement District and Chamber of Commerce are instrumental in mobilizing commercial properties for phased elevation
• Chamber of Commerce
• San Francisco Bay Area Water Emergency Transportation Authority (WETA)
• San Francisco State University
• Galilee Harbor Community Association
• Sausalito Sustainability Commission

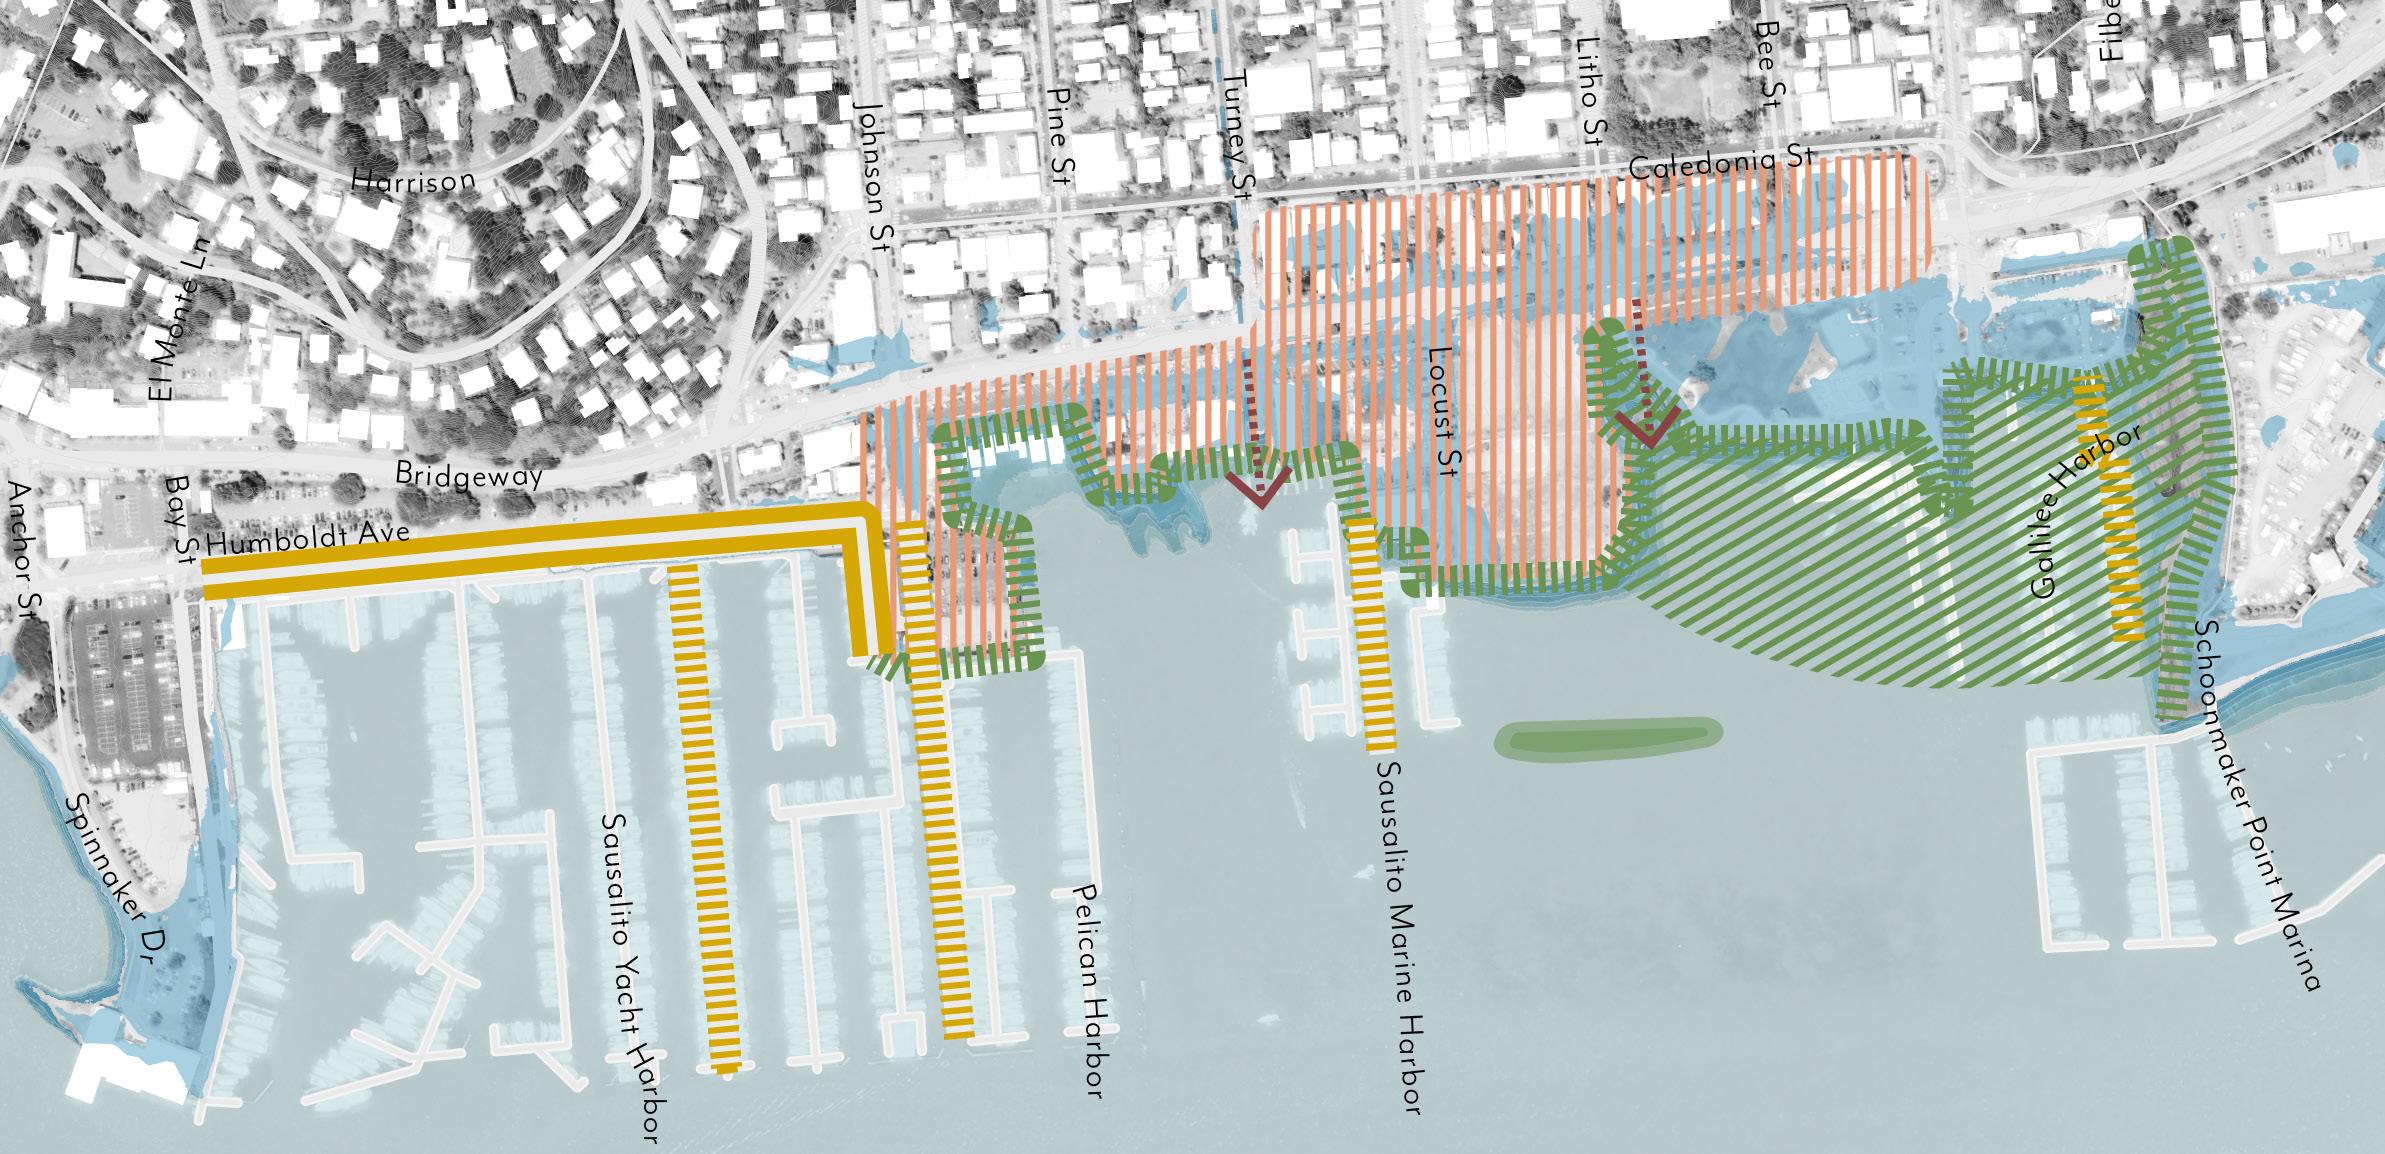

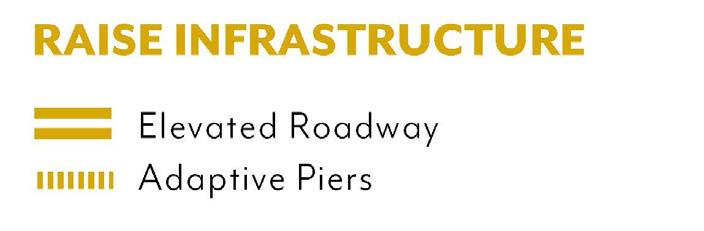
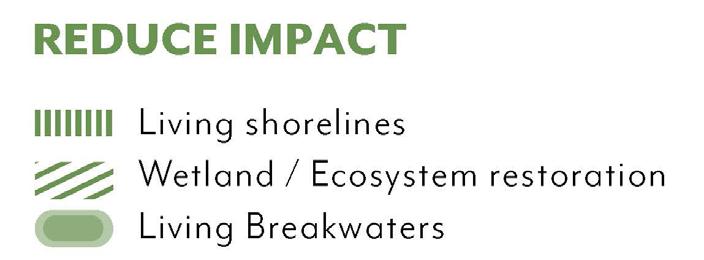

The priority community project in the near term is studying the raising of Bridgeway and private properties, and retrofitting drainage systems at NT-2, where it is at risk of future frequent flooding. Private property owners also need to study options for adapting their buildings. In this area, wetland migration and habitat enhancements to wave attenuation structures can be explored. Eelgrass beds offshore are the focus of continued augmentation with provisions for migration as sea level rises.
• Elevate access points to the waterfront at yacht harbors and at Turney Street and prepare the piers of the marinas for higher elevation.
• Near-term improvements to the Turney Street ramp and docks to improve public use may still be a good investment. Long-term recommended strategies that maintain the boat ramp can incorporate the improvements.
• Individual owners of assets and buildings should start exploring options to elevate or implement localized flood protection (i.e. temporary barriers, flood proof buildings, floodable ground floors) depending on the economics, risk tolerance, or investment cycles.
• City and property owners should study options for adaptation of existing buildings on the landside of Bridgeway in the long-term based on building type, ownership pattern, and current zoning. Cost should be considered. Options may seek to look beyond current zoning and recommend changes that encourage adaptive measures and expansion of public realm.
• Explore BCDC permitting for adaptive floating structures in areas that are dry today but will be inundated in the future.
• There are opportunities for naturebased solutions (NbS) to enhance coarse beaches or to develop offshore measures to attenuate waves. Early experimentation with NbS and the ability to have the ecosystems grow and strengthen over time is critical for successful adaptation in the early stages.
Long-term Option 1 (Raised Bridgeway and Local Adaptation)
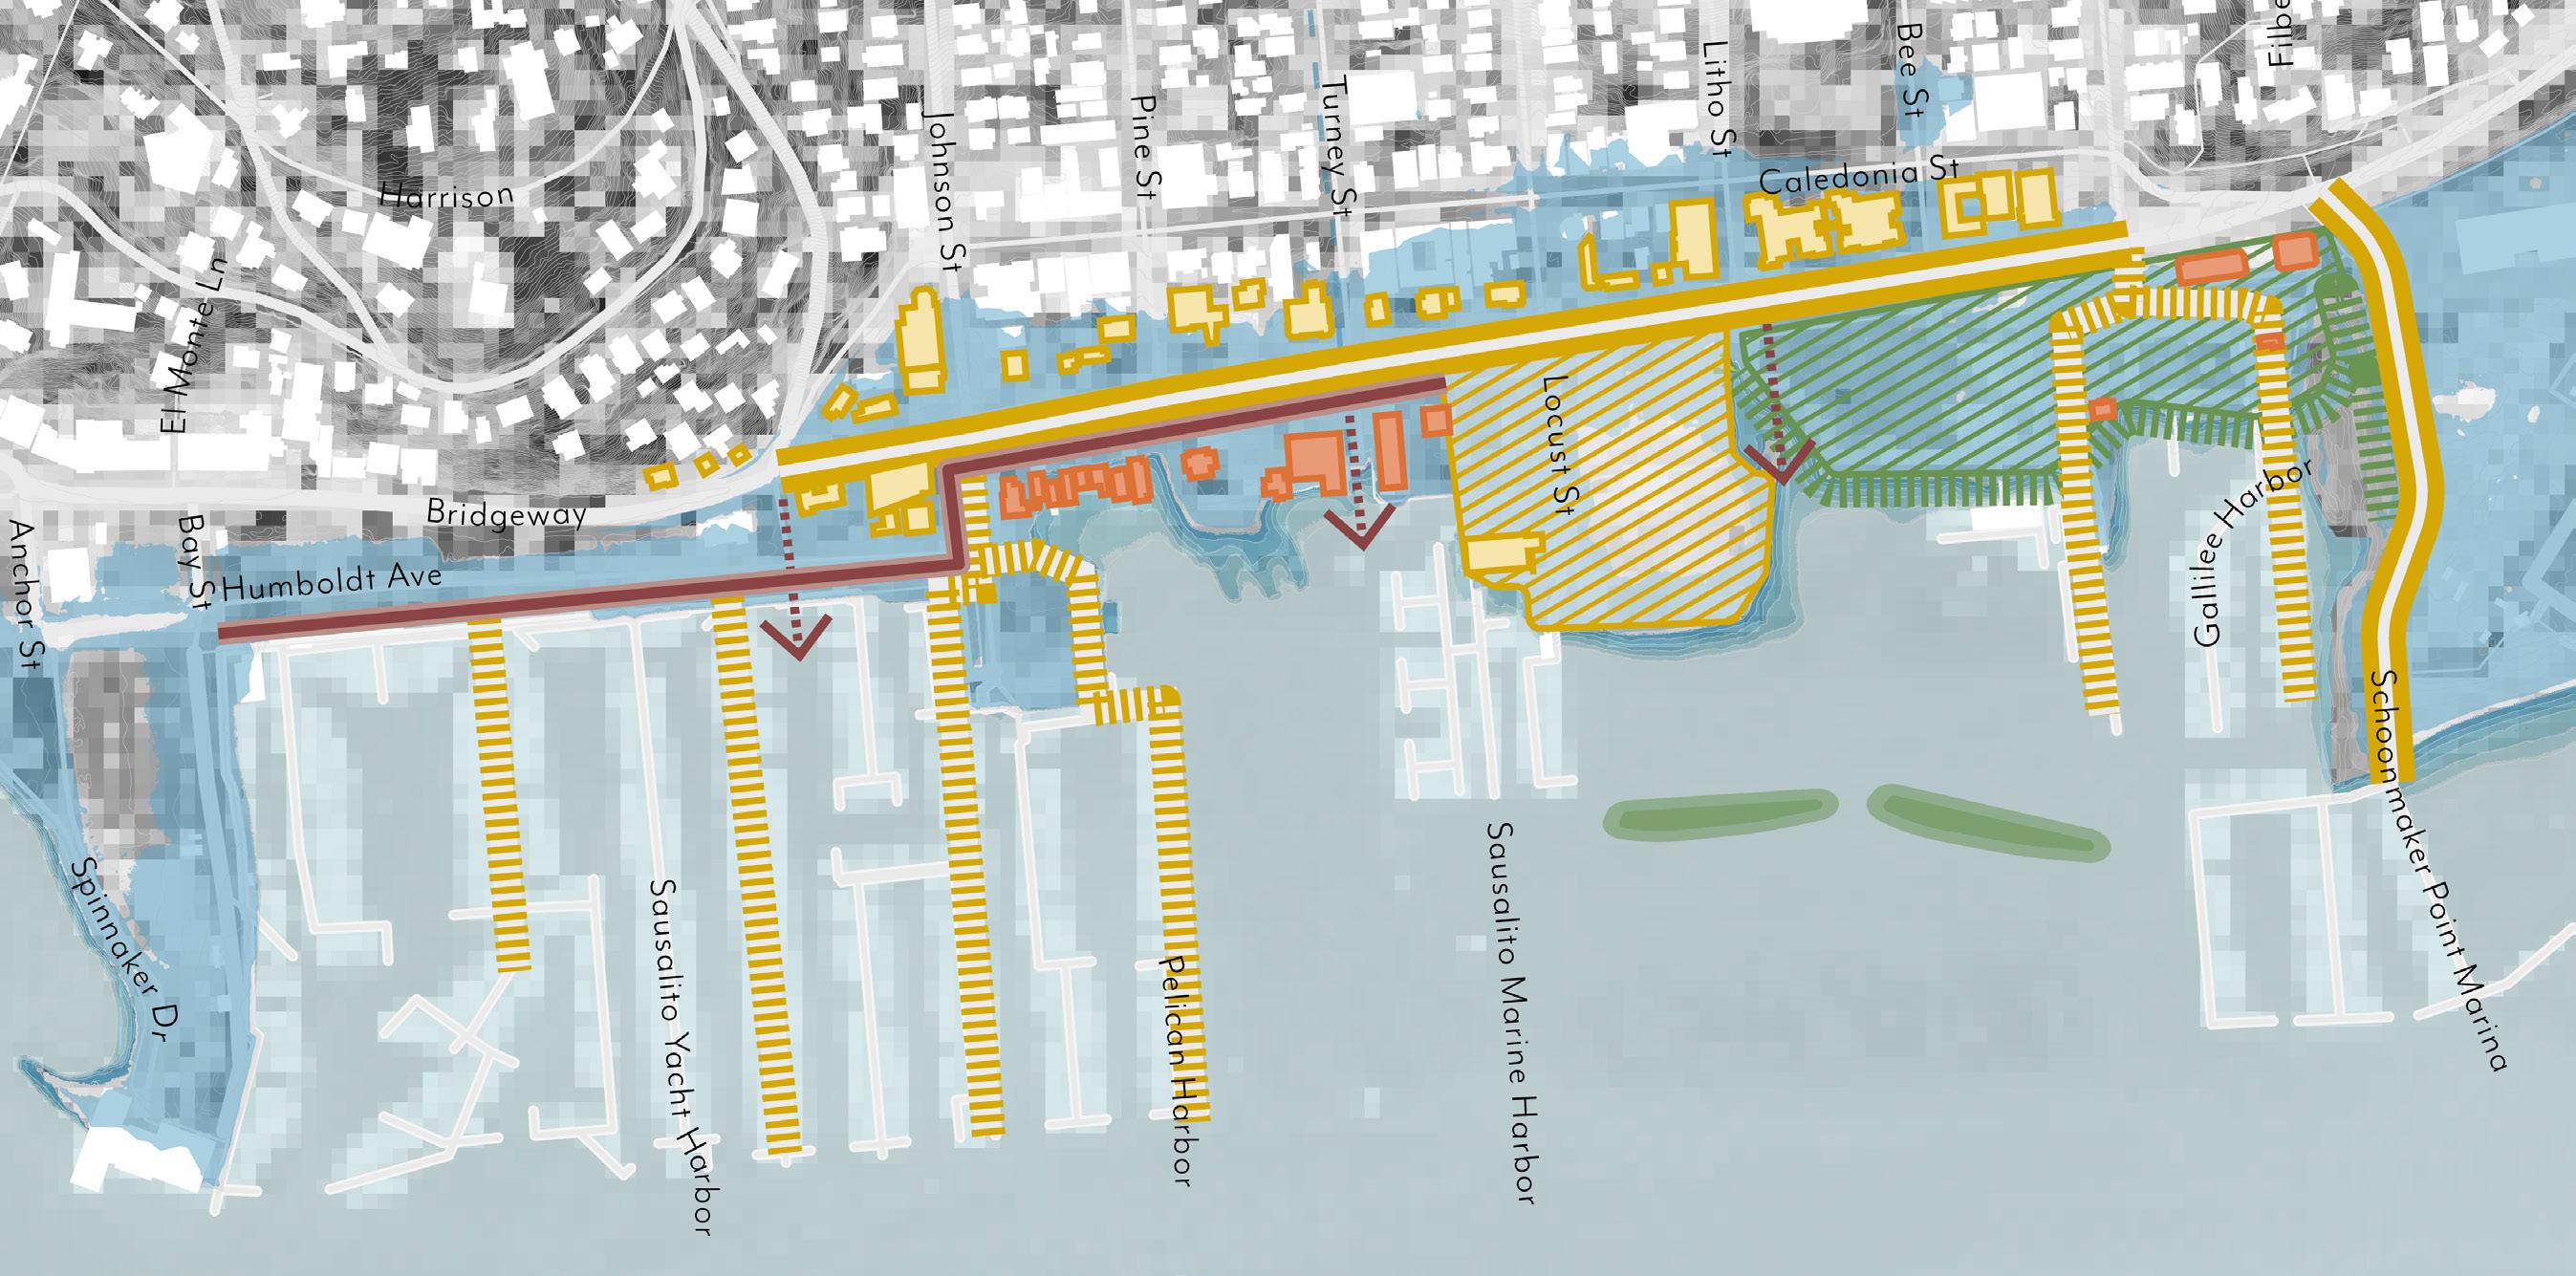
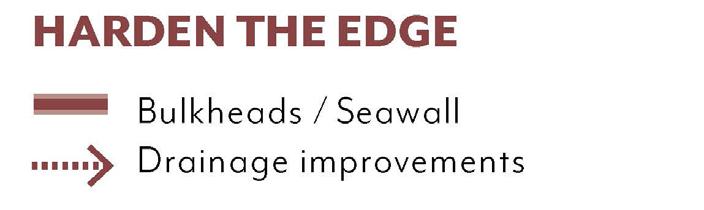
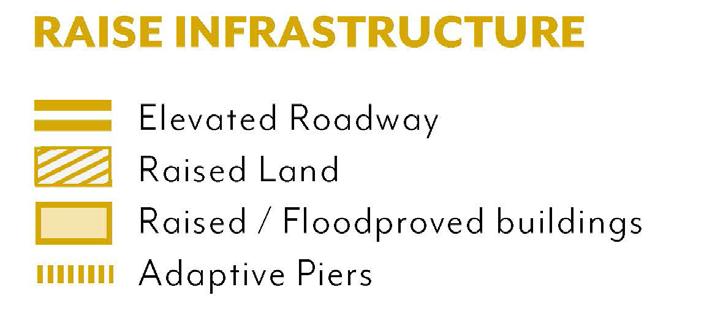
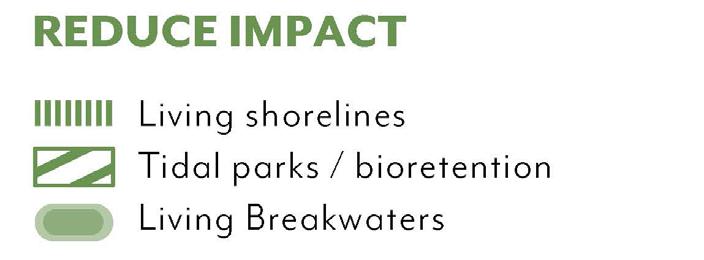

In this long-term option alternative, Bridgeway is raised between San Carlos/ Caledonia and Napa Streets. Private properties adapt individually.
• At Yacht Harbors, strengthen and raise the bulkhead with storm drainage improvements. This intervention should improve recreation quality of the peninsula, with added vegetation and waterfront access.
NT-3 and NT-4: Bridgeway from San Carlos/Caledonia St to Napa St
• Elevate Bridgeway and redesign as a complete street with a promenade and seawall integrated into the waterside of the street. This may occur at one time or construction may be phased by building the seawall and promenade first. Rebuild storm drainage systems with storage and pumps.
• On the landside of Bridgeway, individual building owners should retrofit their buildings to conform the new sidewalk elevation.
• Any buildings that remain low need to be protected against infrequent flood events with deployable barriers, floodable ground floors, and or the elevation of critical systems.
• Prepare buildings, access points, and piers on the waterside of Bridgeway for more frequent inundation. Private owners should float their buildings or elevate their property and access points on piers. Integrate public access points into the Bridgeway public access promenade.
• Property owners should raise and protect undeveloped land with public access provided on the shoreline as a continuous walkway.
• Adapt the shoreline into a ‘living shoreline,’ connecting through Dunphy Park, which will also be adapted to function as a tidal park. Upland areas can be maintained for recreational use. Expand offshore structures with naturebased features to keep pace with sea level rise.
• Habitat enhancement projects focus on migration of eelgrass and tidal marsh.
• Continue pile extension and wave attenuation project with habitat enhancements at Galilee Harbor. Raise or move existing support buildings near the shore to higher ground. Access routes are raised or elevated on piers.
• Habitat enhancement projects should focus on migration of eelgrass and tidal marsh.
Long-term Option 2 (New Town Shoreline Promenade and Park)
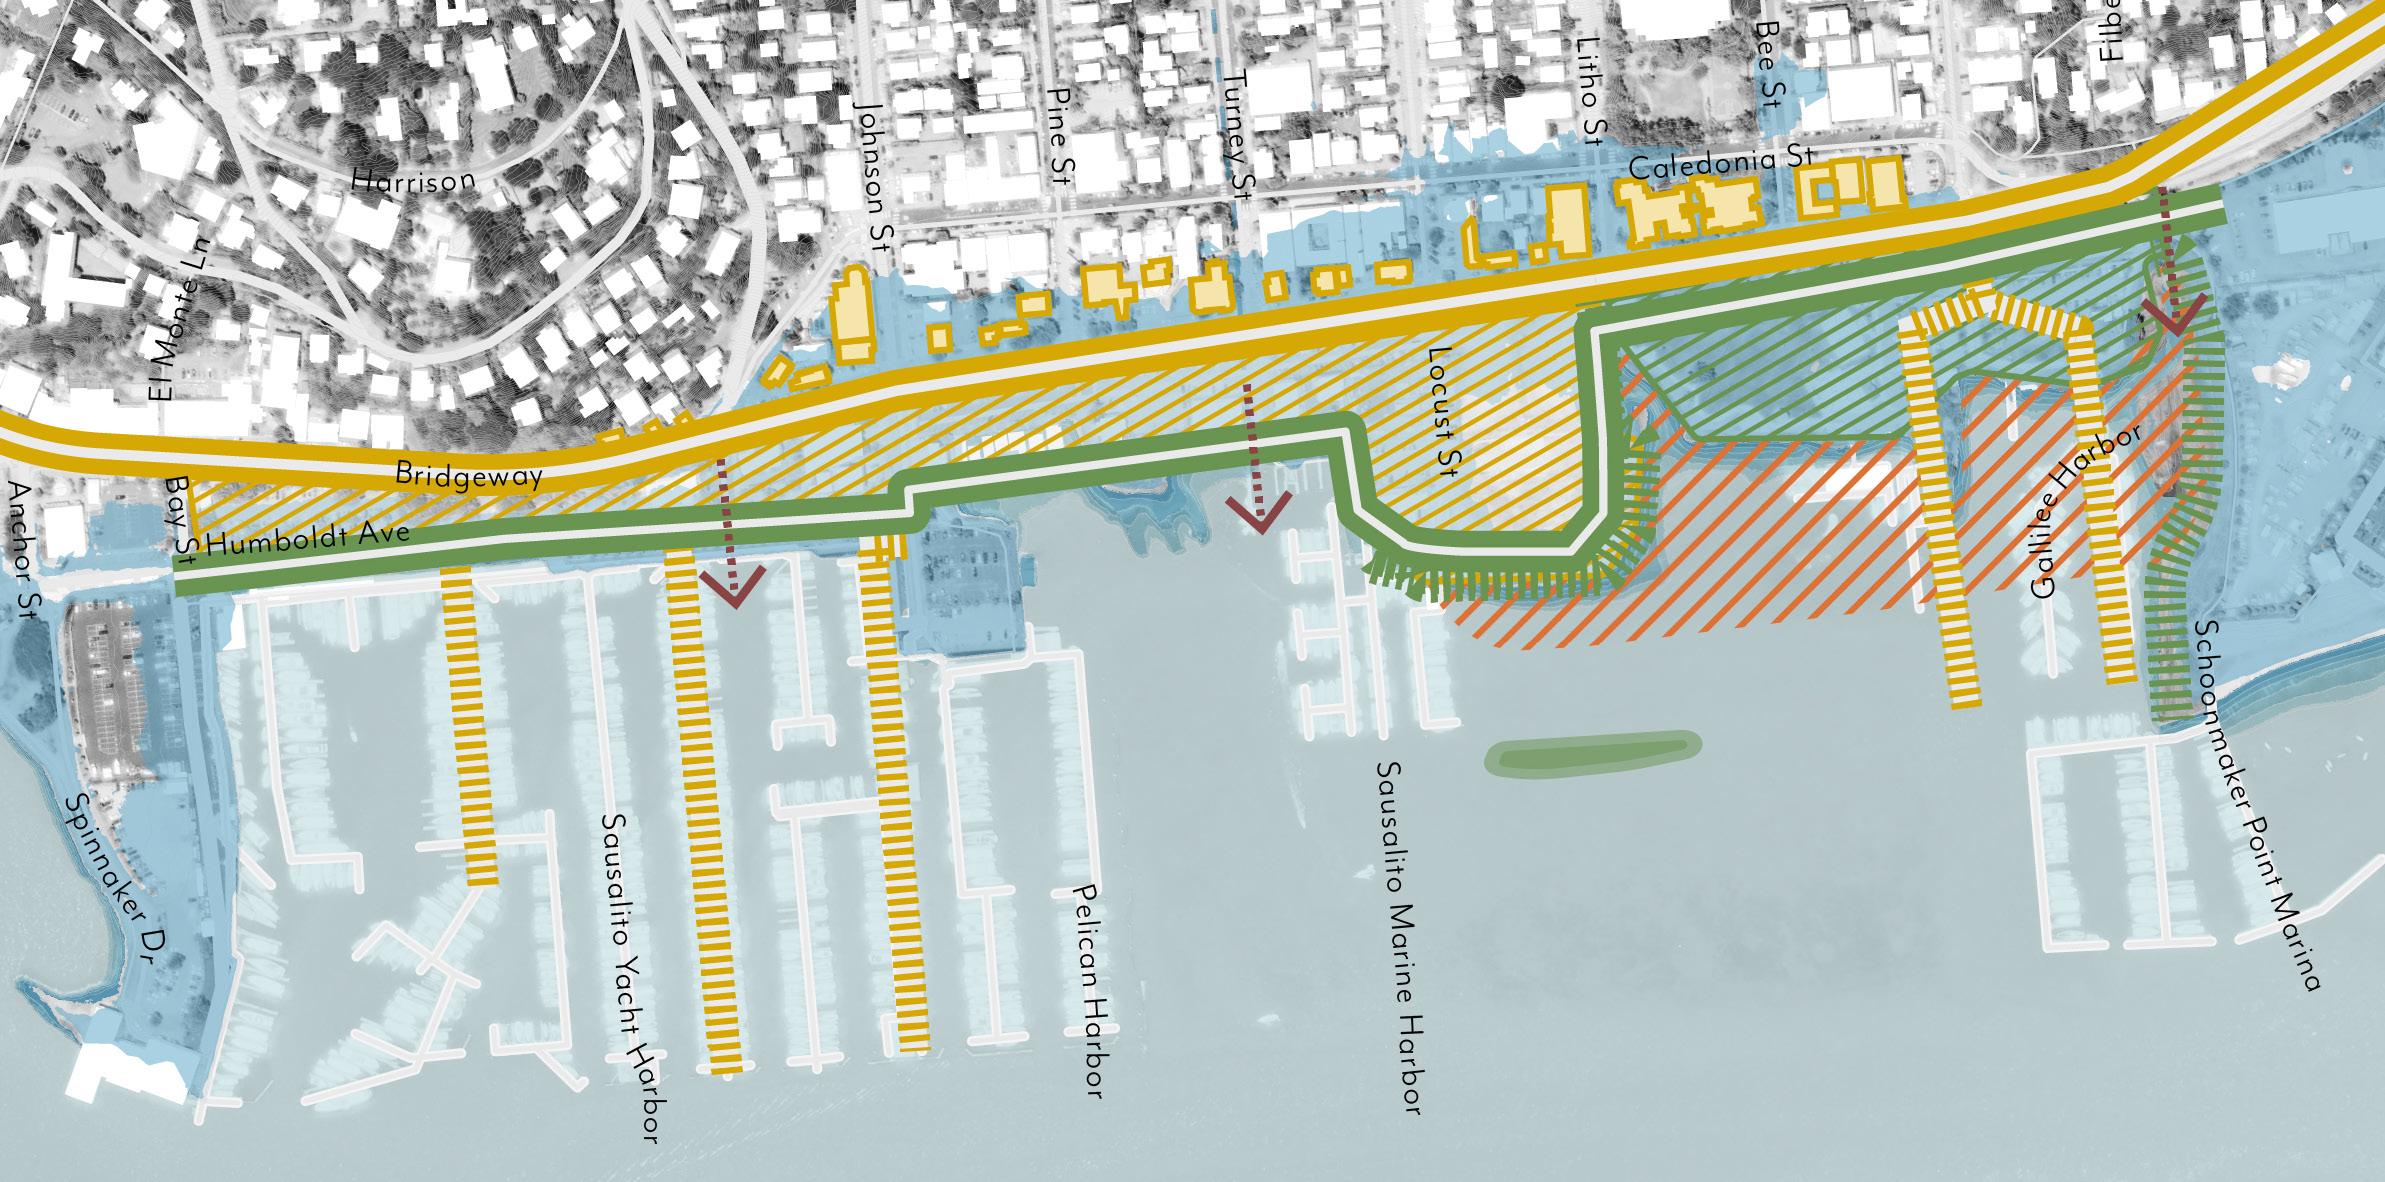
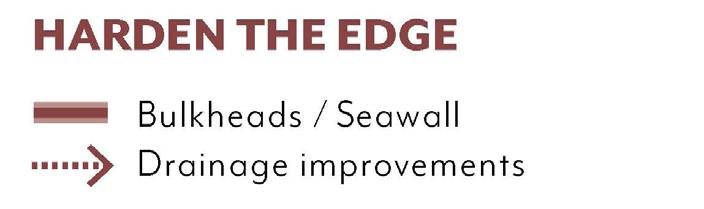
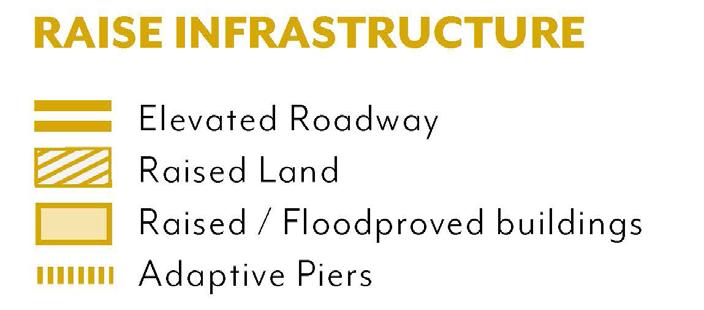
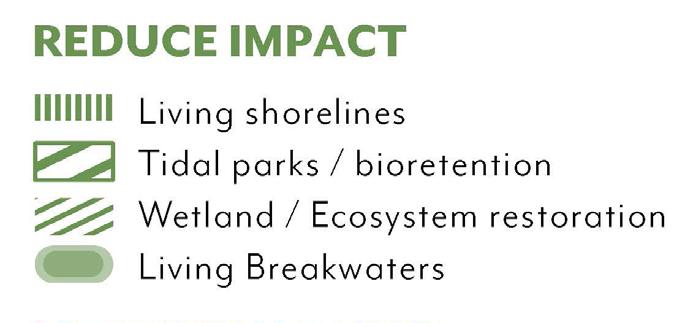

The second long-term alternative entails a larger, more integrated, collective approach to prevent both frequent flood events and significantly reduce flood risk from bigger storms, by moving the protected edge into the shallows of the Bay and re-designing the shoreline zone in New Town into a new urban waterfront experience.
In this alternative, the entire area in NT-1 and NT-2, including Bridgeway and all land waterside, is raised and protected, while in NT-4 and NT-5, Bridgeway continues to be elevated (to protect against sea-level rise and storms), with the newly created land behind the edge is converted to a managed stormwater detention wetland, combined with floating or fixed on pier buildings. In this alternative, NT-3 is a bridging area where the new “dry” waterfront experience park transitions into a “wetter” tidal park. Current waterfront-related functions, such as restaurants, bars and nautical functions, are to be located behind the bulkhead and redesigned as part of this collective reenvisioning of the waterfront.
At Galilee Harbor (NT-5), this strategy will leverage the ongoing offshore wave attenuator integrating nature-based features
and street improvements at Dunphy Park. This segment of the new linear strategy can become a model for scaling up collective adaptation in other reaches.
There are significant environmental opportunities in New Town. In the near term those opportunities center around Dunphy Park and Galilee Harbor (NT-4 and NT-5), where pilot projects could be envisioned to reduce wave action, restore coarse beaches and marshes, and increase biodiversity.
In the longer term, alternative 2 there are real opportunities to include in the design a living shoreline along the southern part of the area (NT-1, NT-2, NT-3), with eelgrass habitats migrating into new areas of shallow open water as waters rise. The northern part, current Dunphy Park and Galilee Harbor (NT4 and NT-5), offers the opportunity to create a unique intertidal landscape, connecting the Bay across the tidal park to green infrastructure upland (partly along the former creek). In water, bulkheads and wave breaks can be enhanced with surfaces that create shellfish habitat. Sediment placement may be used to prevent the loss of existing marsh near Galilee Harbor.
On land, in the newly elevated areas (NT-1, NT-2, NT-3), green infrastructure solutions for
stormwater management and heat mitigation can be imagined as part of the waterfront experience promenade and park.
The near-term strategies in New Town prioritize incremental, low-regret actions focused on access continuity by addressing chronic flooding of community assets and emergency routes such as Bridgeway.
Individual asset owners can choose to adapt their assets. The resulting pattern of buildings at different elevations with some elevated, some on piers, and others floating, will create an eclectic sense of place.
Ecosystem restoration pilots at Dunphy Park and Galilee Harbor establish natural buffers against higher flood levels.
For the long-term, there is a choice between a more individual approach to adaptation, or a more collective approach resulting in a more seamless pattern of buildings. A near-term planning study focused on the long-term future of Bridgeway should begin to inform a decision about which direction to take.
For Sausalito’s New Town, the individual approach elevates Bridgeway in phases, starting with NT-2 then extending along the corridor. The collective approach integrates ROW elevation into the comprehensive Resilience Promenade and Park.
From living shorelines (NT-1 to NT-3) to tidal parks, eelgrass, and enhanced breakwaters (NT-4toNT-5) — naturebased solutions are being built on the pilot sites at Dunphy Park and Galilee Harbor. Coordinated planning of these strategies boosts their positive impact.
Elevating or flood-proofing assets for sea-level rise is up to each owner and depends on their investment capacity. Timely risk info and guidance support proactive action. In the individual approach, more floating solutions are expected in NT-2 and NT-3.
New Town shoreline adaptation alternatives rely on partnerships with local community-based organizations that bring neighborhood knowledge and engagement capacity. The first long-term adaptation alternative – “Raised Bridgeway and local adaptation” – integrates a hybrid model with individual property protection supported by common spaces and infrastructure upgrades. The collective longterm adaptation alternative – “New Town Coastal Promenade and Park” – suggests a transformative vision integrating adaptive waterfronts and nature-based strategies.
The partial raising of Bridgeway and upgrades to drainage systems are municipal tasks. Nature-based solutions pilots could be organized by community or environmental organizations with city agencies support to provide affordable water access through education and sea level rise adaptation stewardship programs.
The first adaptation alternative requires coordinated efforts among asset owners, stakeholders, and government partners through an integrated planning process, with the municipality likely taking the lead. From this process, individual sub-projects can be distilled under different ownership structures to facilitate implementation.
The more transformative intervention on
the New Town waterfront, with significant investment in nature-based solutions, can be shepherded by strong county-wide resilience advocacy organizations including:
• Marin City Climate Resilience and Health Justice
• Marin Climate Action Network
• Canal Alliance
• Multicultural Center of Marin
• Sausalito Community Boating Center
• Sausalito Beautiful
• Rise Up 94965 Foundation
• Marin Conservation League
• Richardson Bay Audubon
• San Francisco State University
For infrastructure upgrades such as raising Bridgeway, multiple funding sources are available:
• U.S. DOT Rebuilding American Infrastructure with Sustainability and Equity (RAISE) Grants
• FEMA funding programs
• Caltrans Active Transportation Program (ATP)
• California Transportation Commission Local Partnership Program (LPP)
Adapting private assets should be integrated into real-estate capital and operations planning. For asset owners affected by disasters or unable to afford upgrades, available funding includes:
• FEMA Hazard Mitigation Grant Program (HMGP)
• California Department of Housing and Community Development – Community Development Block Grant (CDBG)
The City should consider establishing assistance and capacity building programs through the California Coastal Conservancy Climate Ready Program. Ultimate implementation requires multiple funding sources beyond resilience funding alone. As an economic development project, capturing created value through tax increment financing, special assessments, or publicprivate partnerships will be critical.
Both adaptation alternatives require coordination with regional partners who provide regulatory oversight and habitat connectivity extending benefits beyond New Town’s immediate shoreline. Intergovernmental coordination supports creation of large infrastructural elements and integrated flood protection in both long-term alternatives through partnerships with:
• Richardson Bay Regional Agency
• MTC/ABAG Bay Trail
• San Francisco Bay Conservation and Development Commission (BCDC)
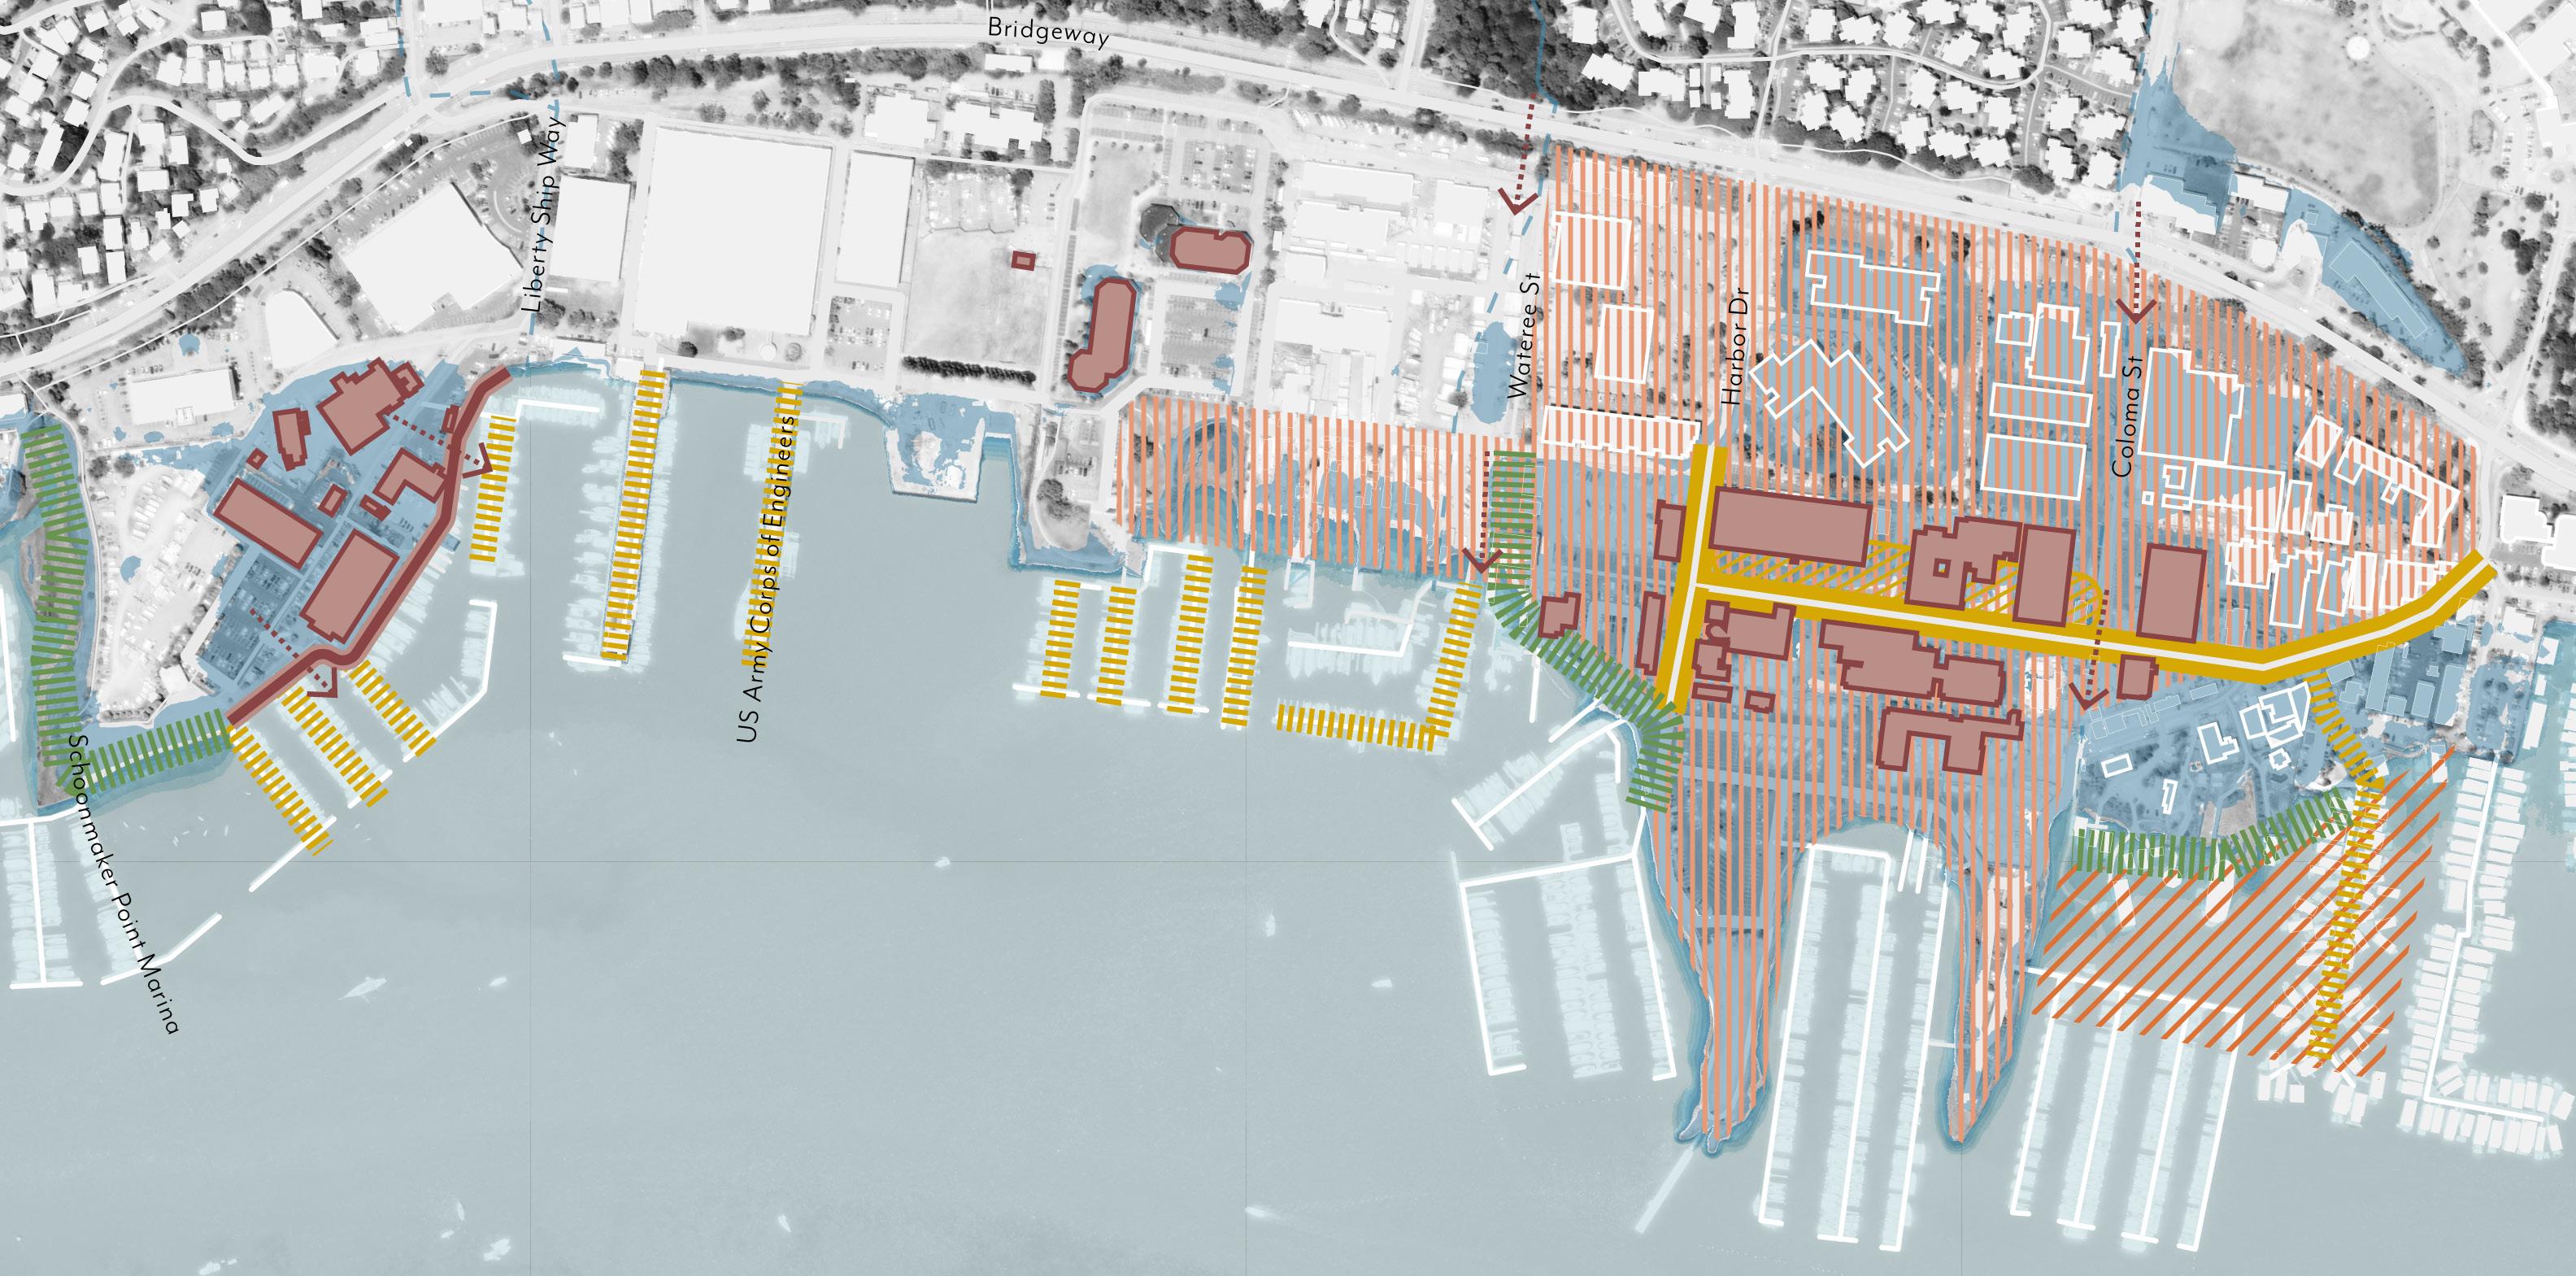
Long-term adaptation planning in the Marinship will require further coordination with property owners. These diagrams are not intended to limit property owners from implementing flood protections that preserve operations, increase public access, benefit adjacent owners, and meet the implementation principles of this plan.
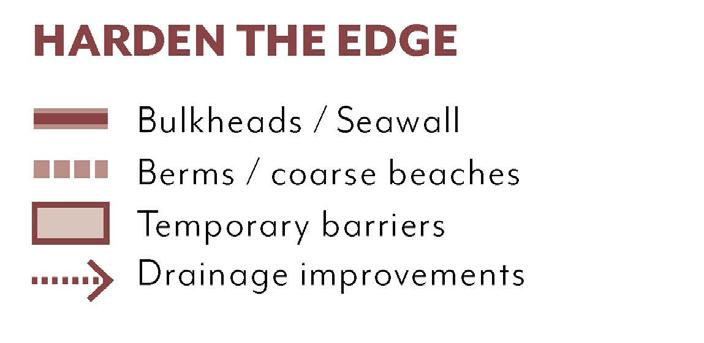
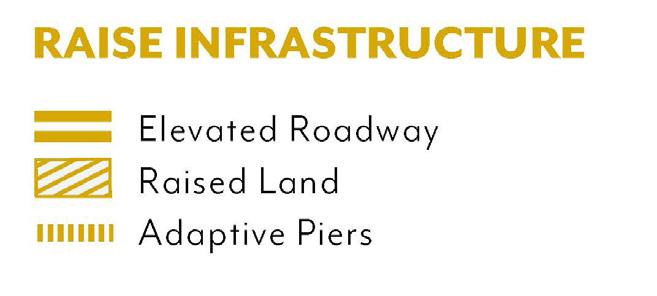
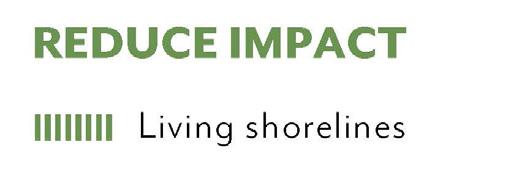

Planning and technical engineering studies are required to position for long-term adaptation actions in the Marinship. If large-scale collective actions are desired, organization of property owners and exploration of financing strategies are urgently needed. District-scale studies should explore community vision for character, land use, and public access. Property specific studies should explore cost benefit of retrofitting individual buildings vs redevelopment to expand the findings of this study. With the high potential for change in Marinship, the community should consider attributes and uses to protect while it also evolves. City should provide detailed design guidance to streets, buildings, parks, and public access corridors, incentives for properties to adapt collectively, clear permitting pathways, and advanced environmental review to streamline projects. Consideration should be given to the creation of a finance district leveraging tax increment capitalization for bonding, hiring staff, and securing construction funding.
• Near-term recommendations for Schoonmaker’s Beach prioritize expanding public access while maintaining rip rap and dock structures, coupled with dredging and wave attenuation to safeguard recreational assets.
• Raise bulkheads and flood proof buildings in the Liberty area as tidal and storm flood elevations threaten buildings.
• Extend caps and piles at floating docks to future-proof dock infrastructure, enabling adaptive elevation strategies.
• Elevate piers at Bay Model to reduce inundation risks to operations.
• Adaptation focus on adaptive reuse of heritage structures through pier elevation and flood-proofing, preserving maritime functions and character.
• Consider future public pedestrian and bicycle access routes that traverse the shoreline area, connecting Bay Model to Gate 6 and the Bay Trail.
• Explore BCDC permitting for adaptive floating structures in areas that are dry today but will be inundated in the future.
• Prioritize drainage improvements, shoreline protection, and habitat migration at Clipper Yacht Harbor.
• Deploy temporary flood barriers and pumps with greater frequency.
• Explore BCDC permitting for adaptive
floating structures in areas that are dry today but will be inundated in the future.
(Harbor Drive to Coloma Street)
• Address groundwater flooding in the area around Gate 5 Road via targeted elevation of piers/roads, guided by hydrological planning.
• Explore storm drainage retrofits such as flap gates and pump stations.
• Property owners may evaluate cost/ benefit of retrofitting existing structures to future flood elevation, subsidence and geotechnical conditions, compared to new construction that addresses known risks.
• Explore BCDC permitting for adaptive floating structures in areas that are dry today but will be inundated in the future.
• Explore opportunities for floating home resilience through pier and infrastructure elevation.
• Property owners should work together to study adaptation options and funding of future retrofits that allow living with water while maintaining needed neighborhood access and utility function.
• Explore ecological enhancements to piers and rocky shorelines as well as potential marsh migration.
• Explore BCDC permitting for adaptive floating structures in areas that are dry today but will be inundated in the future.
ADAPTATION ACTIONS STRATEGY
CONTINUED
Long-term Option 1 (Gate 5 Rd. Levee)
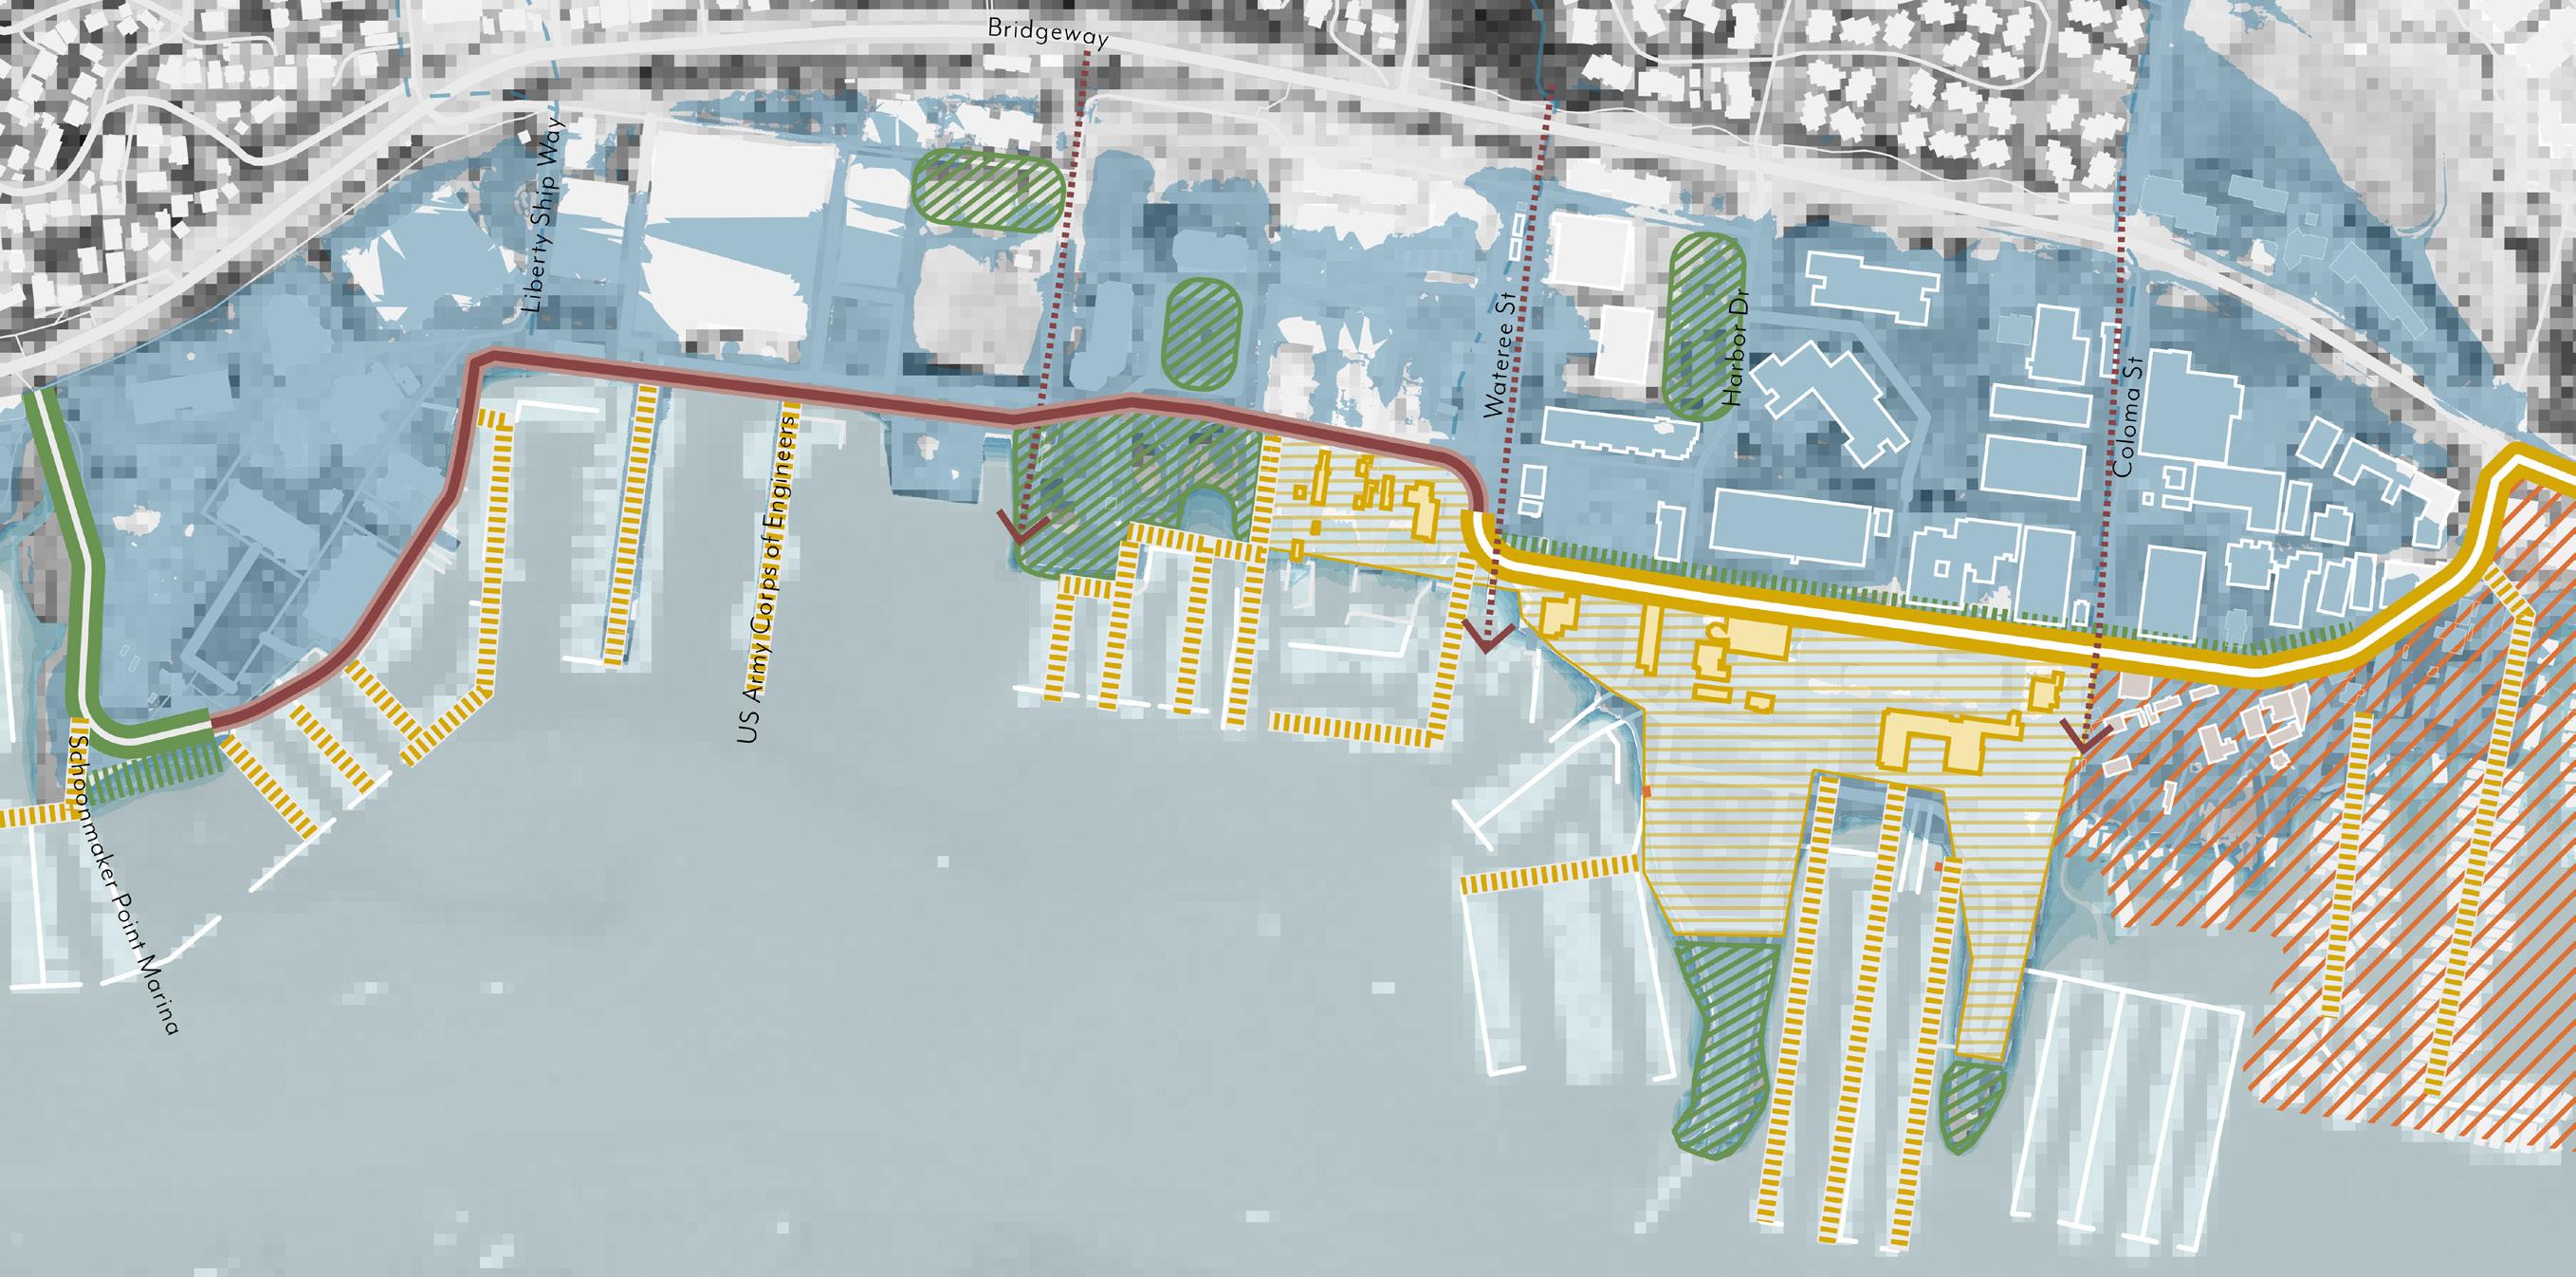
Long-term adaptation planning in the Marinship will require further coordination with property owners. These diagrams are not intended to limit property owners from implementing flood protections that preserve operations, increase public access, benefit adjacent owners, and meet the implementation principles of this plan.
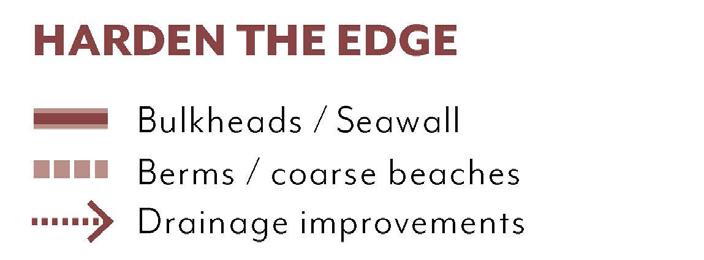
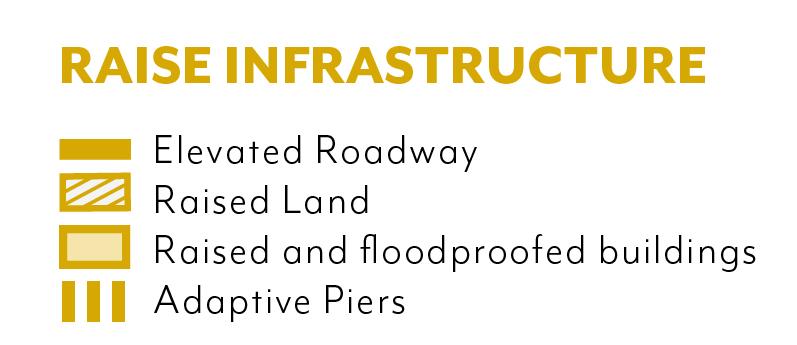
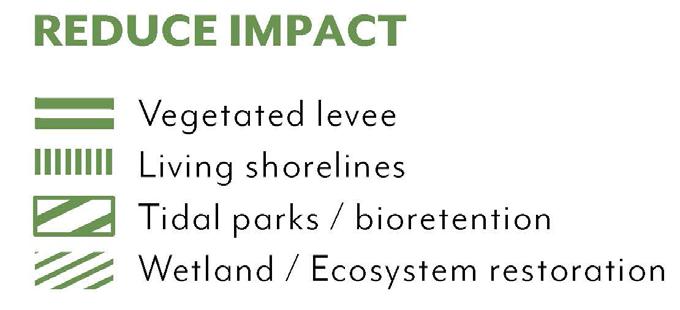
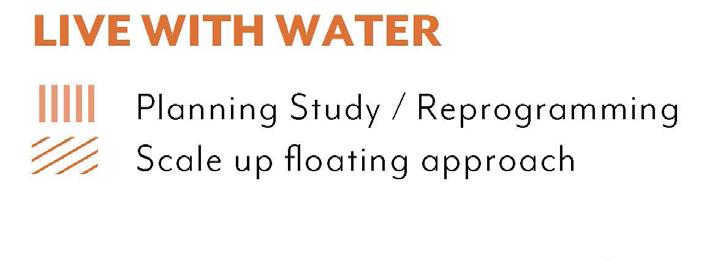
In this option alternative, a flood protection system likely led by the City elevates a continuous public access route from Liberty to Gate 5 Road, that joins two areas of the district. On the dry landside, land uses can be re-imagined and optimized while subsidence and stormwater is managed. On the waterside, larger water dependent uses adapt individually through raising land, elevating on piers, or floating. While the action is considered an individual action by property owners both public and private, coordinated efforts to plan adaptation across property boundaries and fund improvements is beneficial. Habitat areas such as tidal marsh and eelgrass beds offshore benefit from migration areas to move toward land as seas rise.
• Explore beach nourishment and toe berm improvements to contain beach sediment and limit erosion over time.
• Raise and stabilize the shoreline with enhancements to rocky shorelines while enabling incremental adaptation of bulkheads and piers.
• Improve drainage systems to collect, store, and pump stormwater to the Bay.
• Retrofit individual buildings to elevate critical systems or redeveloped to a higher elevation.
• Raise the shoreline from the Bay Model to the south end of Gate 5 Road. Gate 5 Road should continue as the resilient edge north near Varda Landing, where it can tie-back to an elevated Bridgeway.
• The resilient edge follows a community planning process to protect land uses with water dependence and historic or character rich buildings on the waterside of the flood protection. Consideration of new uses, public access, and water access is addressed through the process. Formalize the Bay Trail.
• Maritime functions are outboard to the resilient edge and adapted to rising sea levels. This may include combinations of traditional elevated shoreline floodwalls and armoring with raised sites or floating and pier structures. On the landside of the resilient edge, manage stormwater and groundwater flooding with new infrastructure such as detention systems, pumps, and geotechnical treatments.
• Flood parks should be located within the district to collect and detain stormwater before it is pumped to the Bay over the levee. Exact locations and shared maintenance agreements require further study and coordination with property ownership.
• Elevate access from Gate 5 Road to Varda Landing via levees or piers to support resilient floating home communities.
• Marsh migration is accommodated in the formerly dry areas of the neighborhood along with eelgrass offshore.
• Formalize the Bay Trail through this area.
Long-term Adaptation Option 2 (Shoreline Levee)
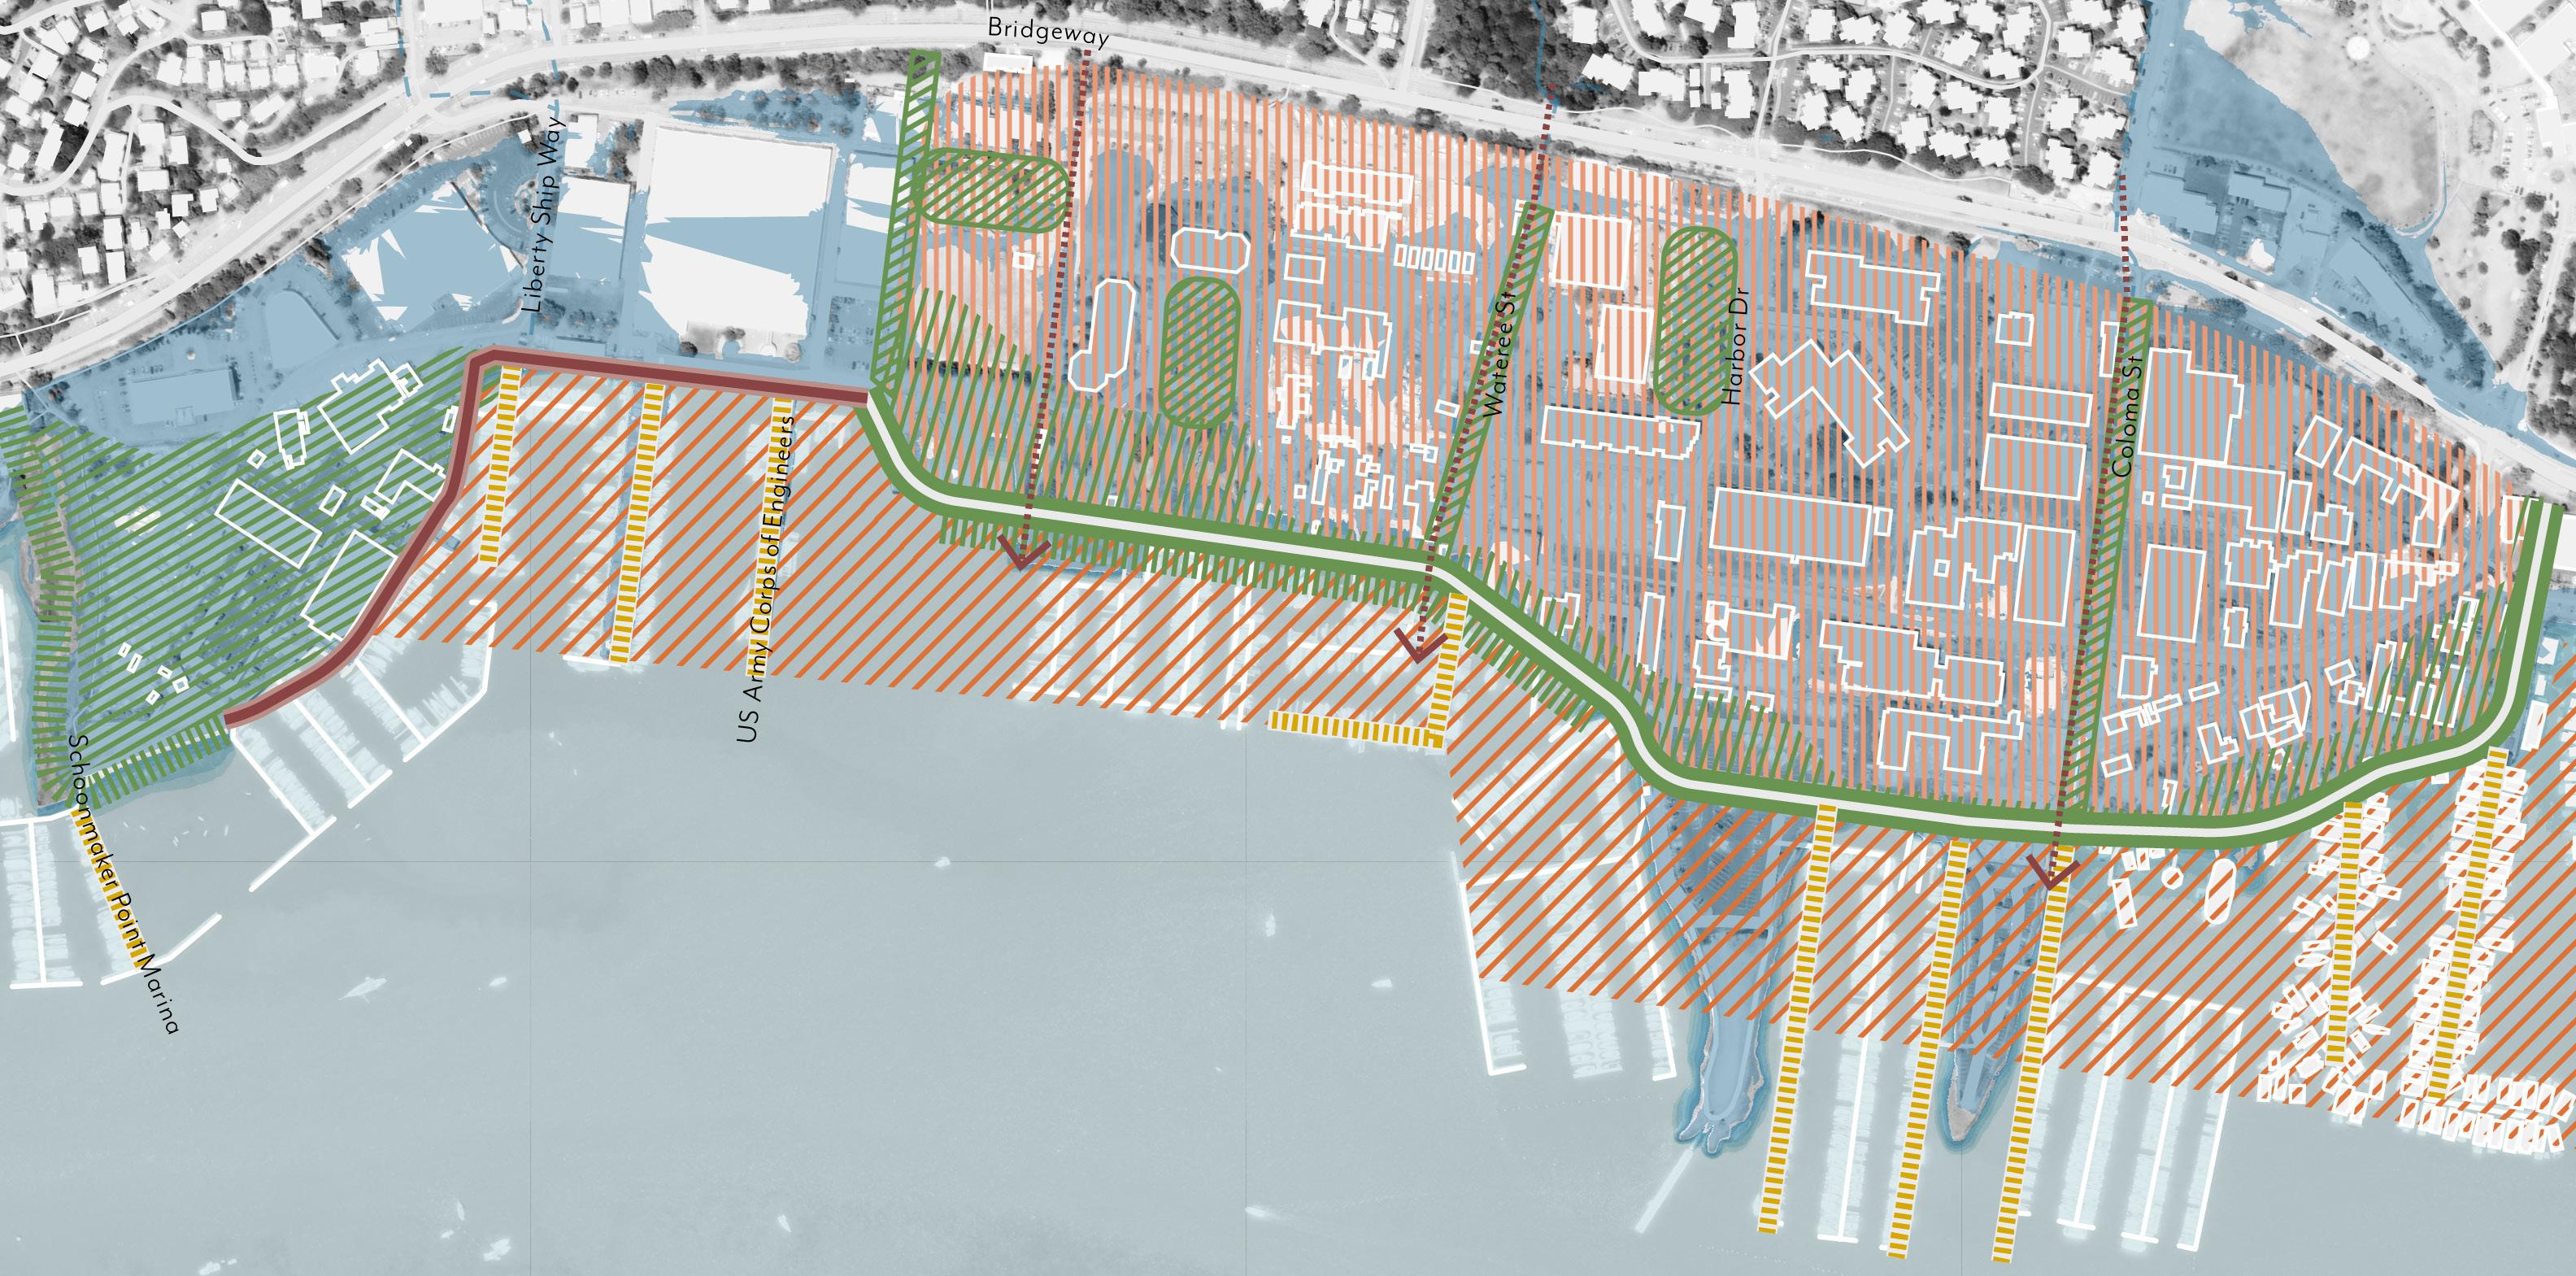
Long-term adaptation planning in the Marinship will require further coordination with property owners. These diagrams are not intended to limit property owners from implementing flood protections that preserve operations, increase public access, benefit adjacent owners, and meet the implementation principles of this plan.
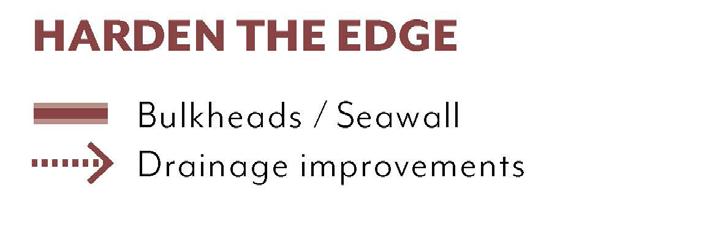
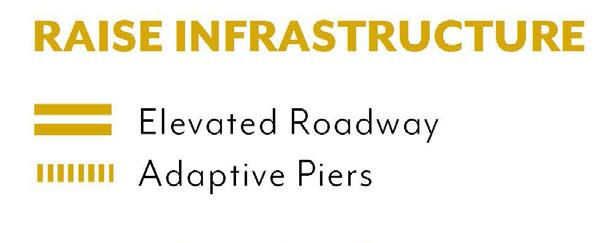
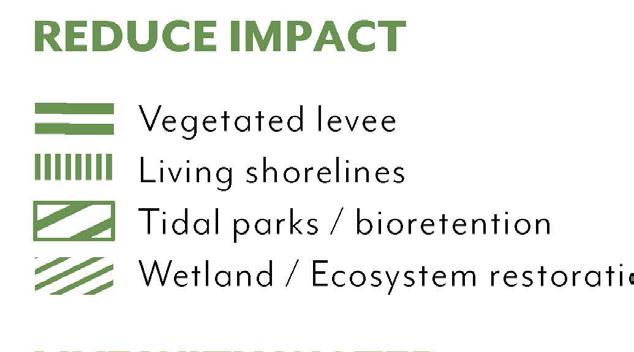
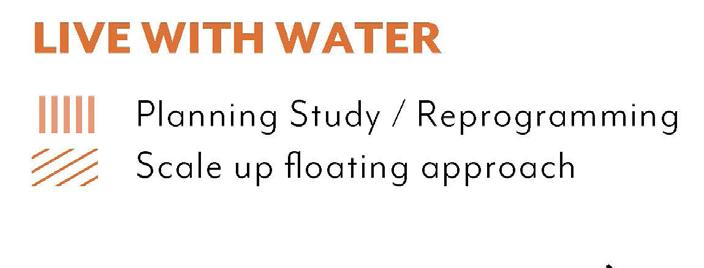
In this alternative, the resilient edge is a wide berm or levee with public access and maritime functions on top that connect the community to the water while providing flood protection to the entire Marinship district. On the berm, a limited number of maritime or visitor serving commercial functions can be located. The resilient edge is located at or near the current shoreline encouraging some water dependent uses such as ship repair operations to be relocated or reconstructed on piers and behind wharfs. For simplicity, a single feature is shown however further planning and leadership by property owners will determine the combination of protective approaches (levees, bulkheads, beaches, etc) that are appropriate. Further planning will also refine alignment. Behind the berm, land uses can be optimized and intensified. Flood parks should be located within the district to collect and detain stormwater before it is pumped bay to the Bay over the levee. The future land use program should be determined in a community planning process. This is completed as a major collective action with coordinated planning, design, funding and implementation. Planning addresses goals for redevelopment, storm drainage, geotechnical mitigations, and public access. The cost of this action may require private financing as part of a redevelopment plan.
The southern reaches at MS-1 are adapted through wharf and bulkhead reconstruction that may be led by individual property owners. Floating dock systems are adapted, enabling flexible responses to rising water levels. Schoonmaker Beach is preserved, nourished and allowed to migrate upward and landward, with public access.
As the new levee is constructed, water dependent uses in MS-4 to MS-7 are adapted to maintain operation on top of the levee and on both sides as needed. Some properties may elevate entirely to the same level as the levee. Piers and floating operations occur on the waterside. Inland flood detention areas are incorporated into overall district planning. The berm integrates marsh, rocky shoreline enhancements, and living seawall components alongside it, with access points to adaptive floating functions.
At MS-3, the shoreline is raised. Building on Eelgrass restoration and monitoring per the BCDC Settlement Agreement, nature-based strategies here offer hybrid protections, enhancing ecological performance and infrastructure resilience.
In MS-5, the Clipper Marina will be expanded, elevated, and integrated into the wide berm with the organized culverts and blueways to accommodate Willow Creek daylighting. This action is aligned with the City’s and USACE’s potential work on daylighting Willow Creek through the Marinship.
The critical environmental opportunities for the near-term actions in Marinship are centered around inland green stormwater infrastructure and tidal vegetation to mitigate the chronic floods around the core facilities of the historic working waterfront. Perpendicular “blueways” or flood parks are organized to enhance stormwater infiltration and conveyance along the underground creeks migrating into new areas of shallow open water as waters rise.
In the longer term, the MS-1 and MS-2 shoreline strategies should focus on protecting and enhancing the existing habitats of tidal flats and eelgrass with the living shoreline strategies and beach renourishment.
In a collective alternative, marine structures can include living seawalls and pilings, supporting shellfish and other marine life.
Marinship adaptation presents a flexible approach to adaptation in this critical area. Near-term actions focus on advanced
Marinship individual approach is focused on creating a new resilient edge by raising Gate 5 Rd and floating or raising waterside uses on piers. In a collective alternative, the entire working waterfront is adapted as a linear resilient park with recreational and maritime opportunities integrated in the edge.
Active use of the waterfront in Marinship limits the NbS mainly to green stormwater infrastructure at stormwater detention areas, ecological enhancement of breakwaters, and marsh restoration at MS-4 and MS-5. Tidal habitat strategies are explored in waterfront communities at MS-7.
Critical community and cultural assets in the flooded areas are elevated in a timely manner to protect the character of place. In the long run, currently water-facing communities of MS-6 and MS-7 are envisioned to scale up floating approaches.
studies and community organizing for largescale collective actions to follow. The Gate 5 Road Drainage Study will inform near term actions in that area. The long-term living with water option is elevating Gate 5 road and connecting it to a working waterfront while enhancing perpendicular access points.
Elevate Gate-5 Rd
Upgrade drainage system
improvements
shorelines at MS-1 and MS-2
park at MS-6
Reprogramming for maritime uses Berm at Working waterfront Elevation and floating in MS - 7
shoreline pilots
infrastructure pilots
Adaptation of the piers
Identify floating opportunities
shoreline
edge / waterfront park
Tailored adaptation and relocation
and elevate the assets
breakwaters
floating and tailored relocation
Both Marinship shoreline adaptation alternatives rely on active partnerships with local community-based organizations that bring deep neighborhood knowledge and resident engagement capacity. The first long-term adaptation alternative – Working Waterfront Piers – emphasizes a hybrid model balancing individual asset protection with collective infrastructure investment. The more integrated, collective longterm adaptation alternative – “Marinship Working Waterfront Berm” – imagines a more transformative, collective vision embracing “living with water” approach. This approach calls for collaboration with floating communities and a Working Waterfront Alliance that could include maritime businesses, boat builders, and harbor operators committed to adaptive maritime uses. The critical community assets and spaces at risk to be protected in coordination with the local organizations include:
• Schoonmaker’s Beach
• Bay Model
• Historic Working Waterfront
• Varda Landing
At Schoonmaker’s Beach and Floating Docks diverse communities intersect with waterfront access needs. Community engagement, outreach, and stewardship
programs are required to gain informed decision-making about the vegetated levee location or the long-term strategic relocation and habitat restoration. Adaptation implementation and maintenance will require workforce development and skills training. Partner organizations ensure that adaptation strategies address historical environmental burdens and prioritize community health outcomes, particularly for residents in adjacent Marin City who rely on Marinship’s waterfront for recreation and economic opportunities:
• Multicultural Center of Marin
• The Canal Alliance
• Marin City Climate Resilience and Health Justice
• Marin Climate Action Network
The Bay Model Visitor Center serves as an educational hub for demonstrating climate science and adaptation technologies to school groups and residents.
At the Historic Working Waterfront, partnerships with the artists community create opportunities for creative placemaking, cultural programming and public art installations. Nature-based solutions integrate habitat restoration with infrastructure improvements such as elevating piers and shorelines. The mix of public agencies and private tenants around Marinship Studios, can champion adaptive reuse of historic buildings while maintaining the area’s working waterfront character:
• Sausalito Chamber of Commerce
• Sausalito Working Waterfront Coalition
• Sausalito Sustainable Waterfront Alliance
• Save the Bay
• Richardson Bay Audubon
• Marin Conservation League
• Friends of Willow Creek
• Floating Homes Association
• Waldo Point Harbor
Additionally, regional partners provide regulatory coordination and habitat connectivity that extends adaptation benefits beyond Marinship’s immediate shoreline. Intergovernmental coordination will support creation of the large infrastructural objects and integrated flood protection in both longterm alternatives:
• Marin County Parks
• US Army Corp of Engineers
• Marin Conservation League
• Friends of Willow Creek
• Marin Countywide Stormwater Pollution Prevention Program
• Richardson Bay Regional Agency
• MTC/ABAG Bay Trail
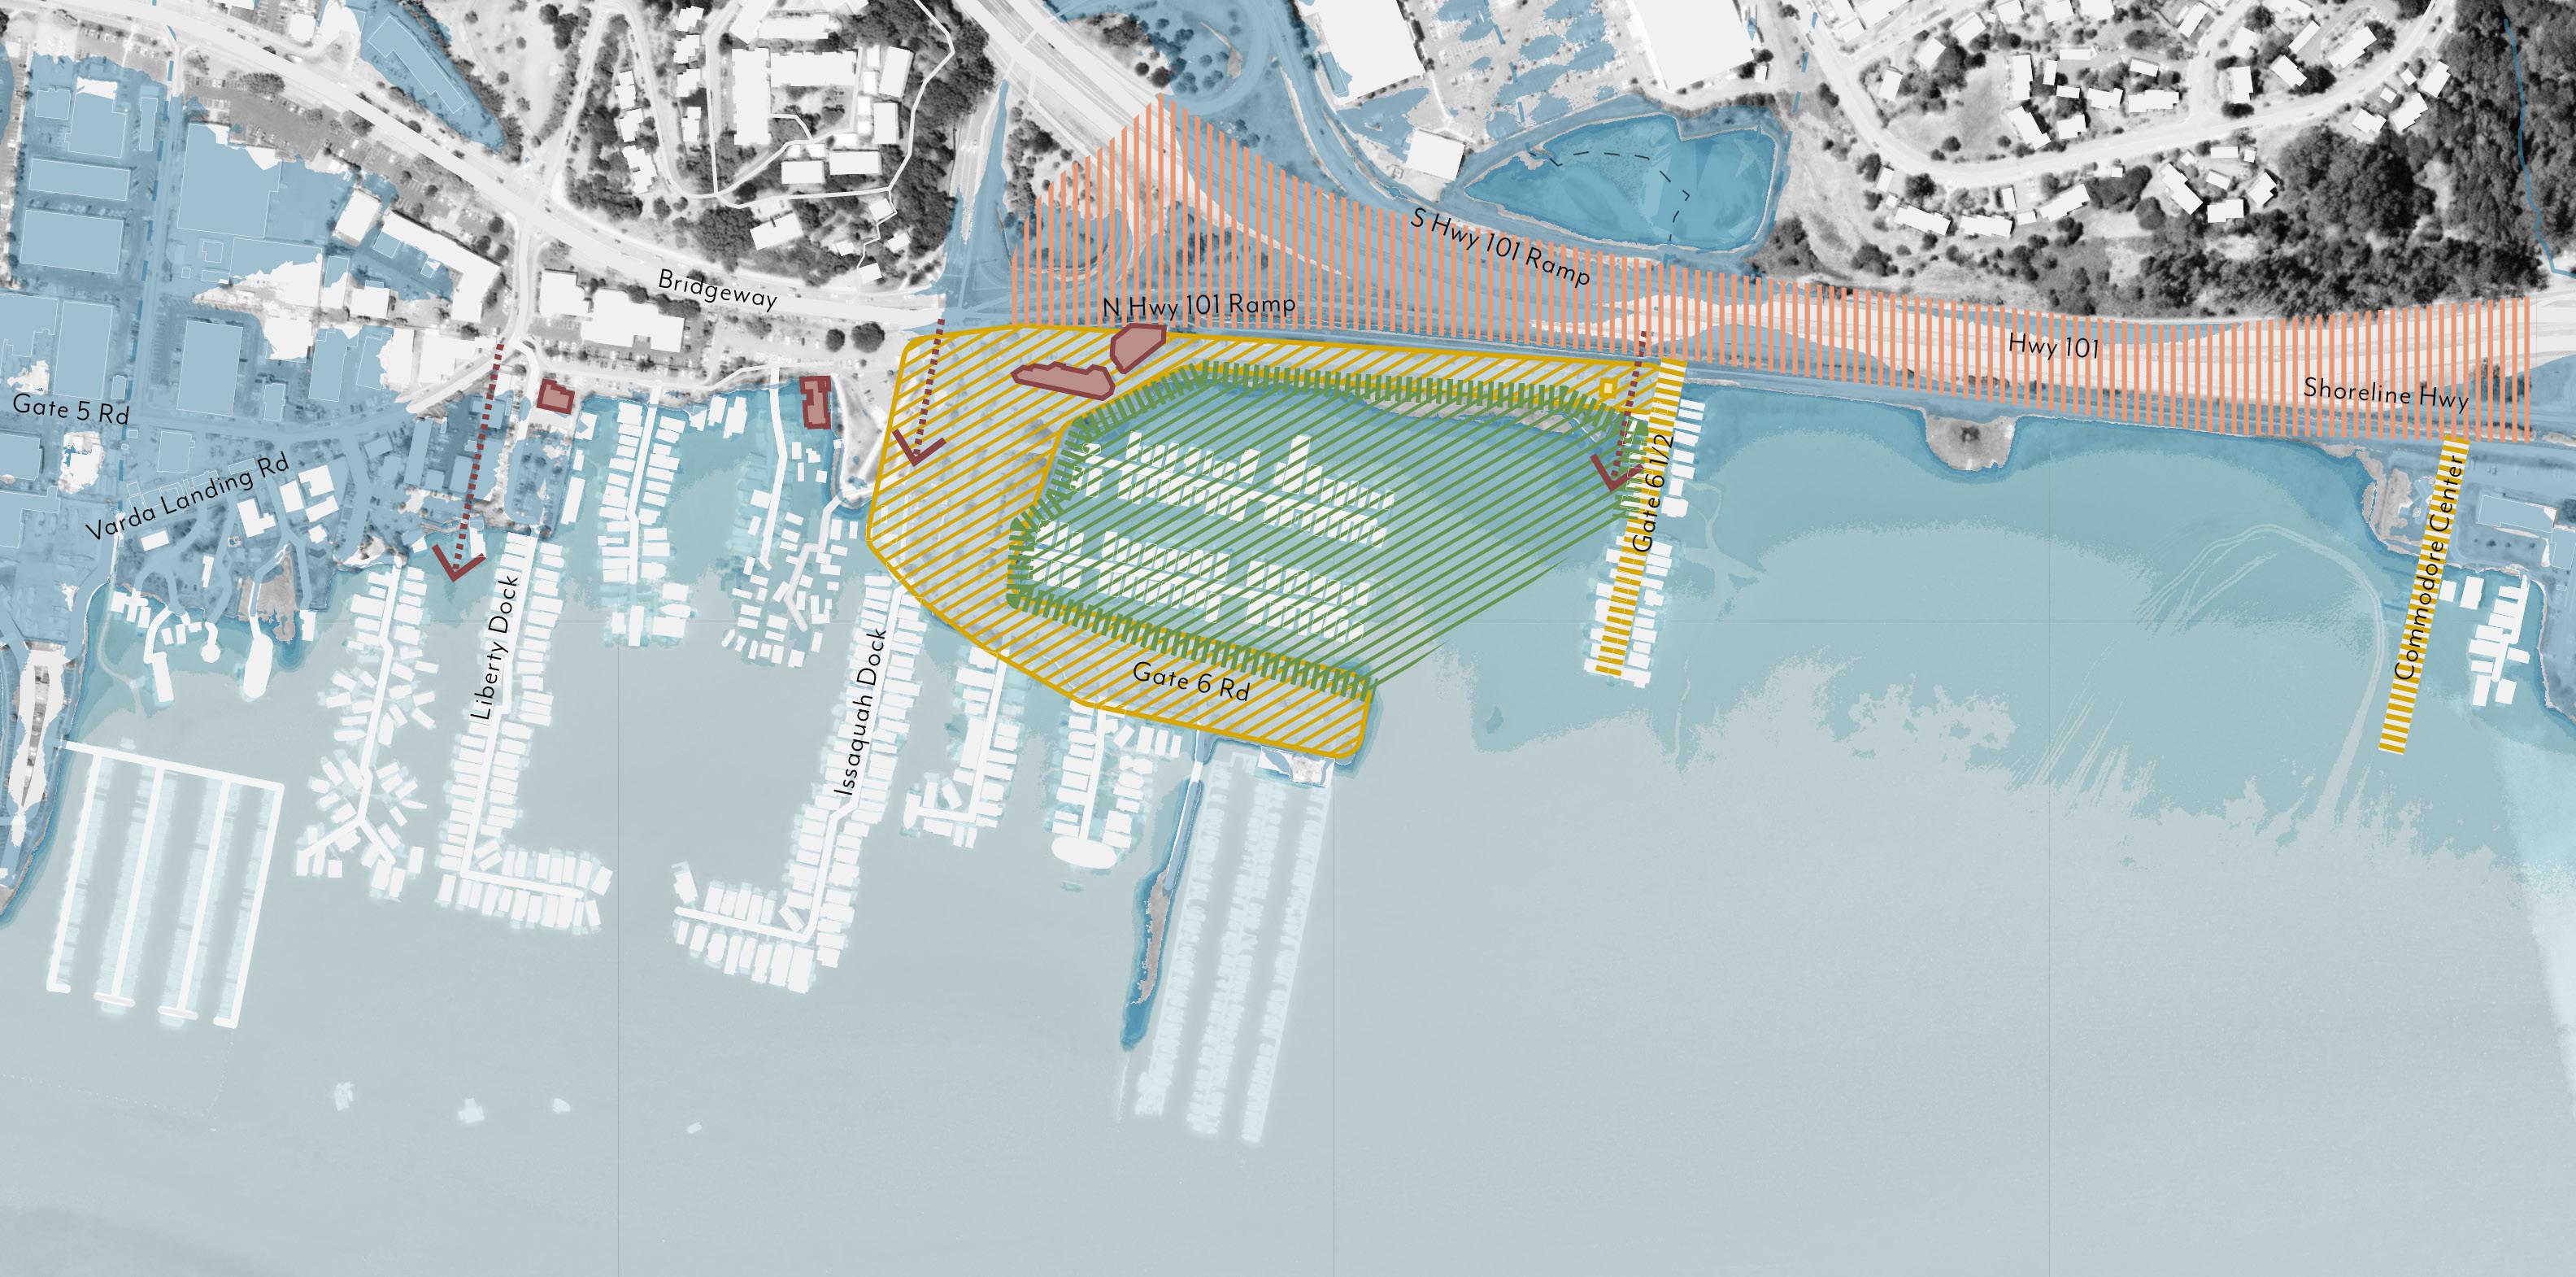

The near-term recommendations are focused on protecting road and private access infrastructure affected by chronic floods to set the stage for long-term resilience. Owners and residents explore community-based organizing to support collective actions such as financing, habitat enhancement, retrofit, and land raising.
• Pursue temporary seawalls and retrofit of existing buildings at risk to ensure safety and enable expansion of floating approach.
• Convert utilities as appropriate for future floating conditions.
• County, City, and private property owners should study options for how existing buildings on the waterside of Bridgeway could be adapted or reconstructed in the long term based on building type, ownership pattern, and current zoning. Cost should be considered. Options may seek to look beyond current zoning and recommend changes that encourage adaptive measures and expansion of public realm.
• Explore BCDC permitting for adaptive floating structures in areas that are dry today but will be inundated in the future.
• Focus on raising low points and retrofitting storm drains. Low walls and temporary flood barriers may also provide near-term protection during storms.
• Explore commercial building cost/benefit of retrofit to flood proof or reconstruction later.
• Deploy habitat enhancement pilots in the harbor to enhance community stewardship for long-term nature-based resilience actions.
• Elevate piers and retrofit utilities.
• Elevate Gate 6 ½ Road and unpaved parking areas with fill to reduce storm impacts.
• Engage Caltrans during study of the 101 Highway long term resilience to address needed culvert adjustments addresses drainage-scour and current impacts on floating homes.
ADAPTATION STRATEGY RECOMMENDATIONS CONTINUED
Long-term Option 1 (Raise Gate 6 Road and Access Points)
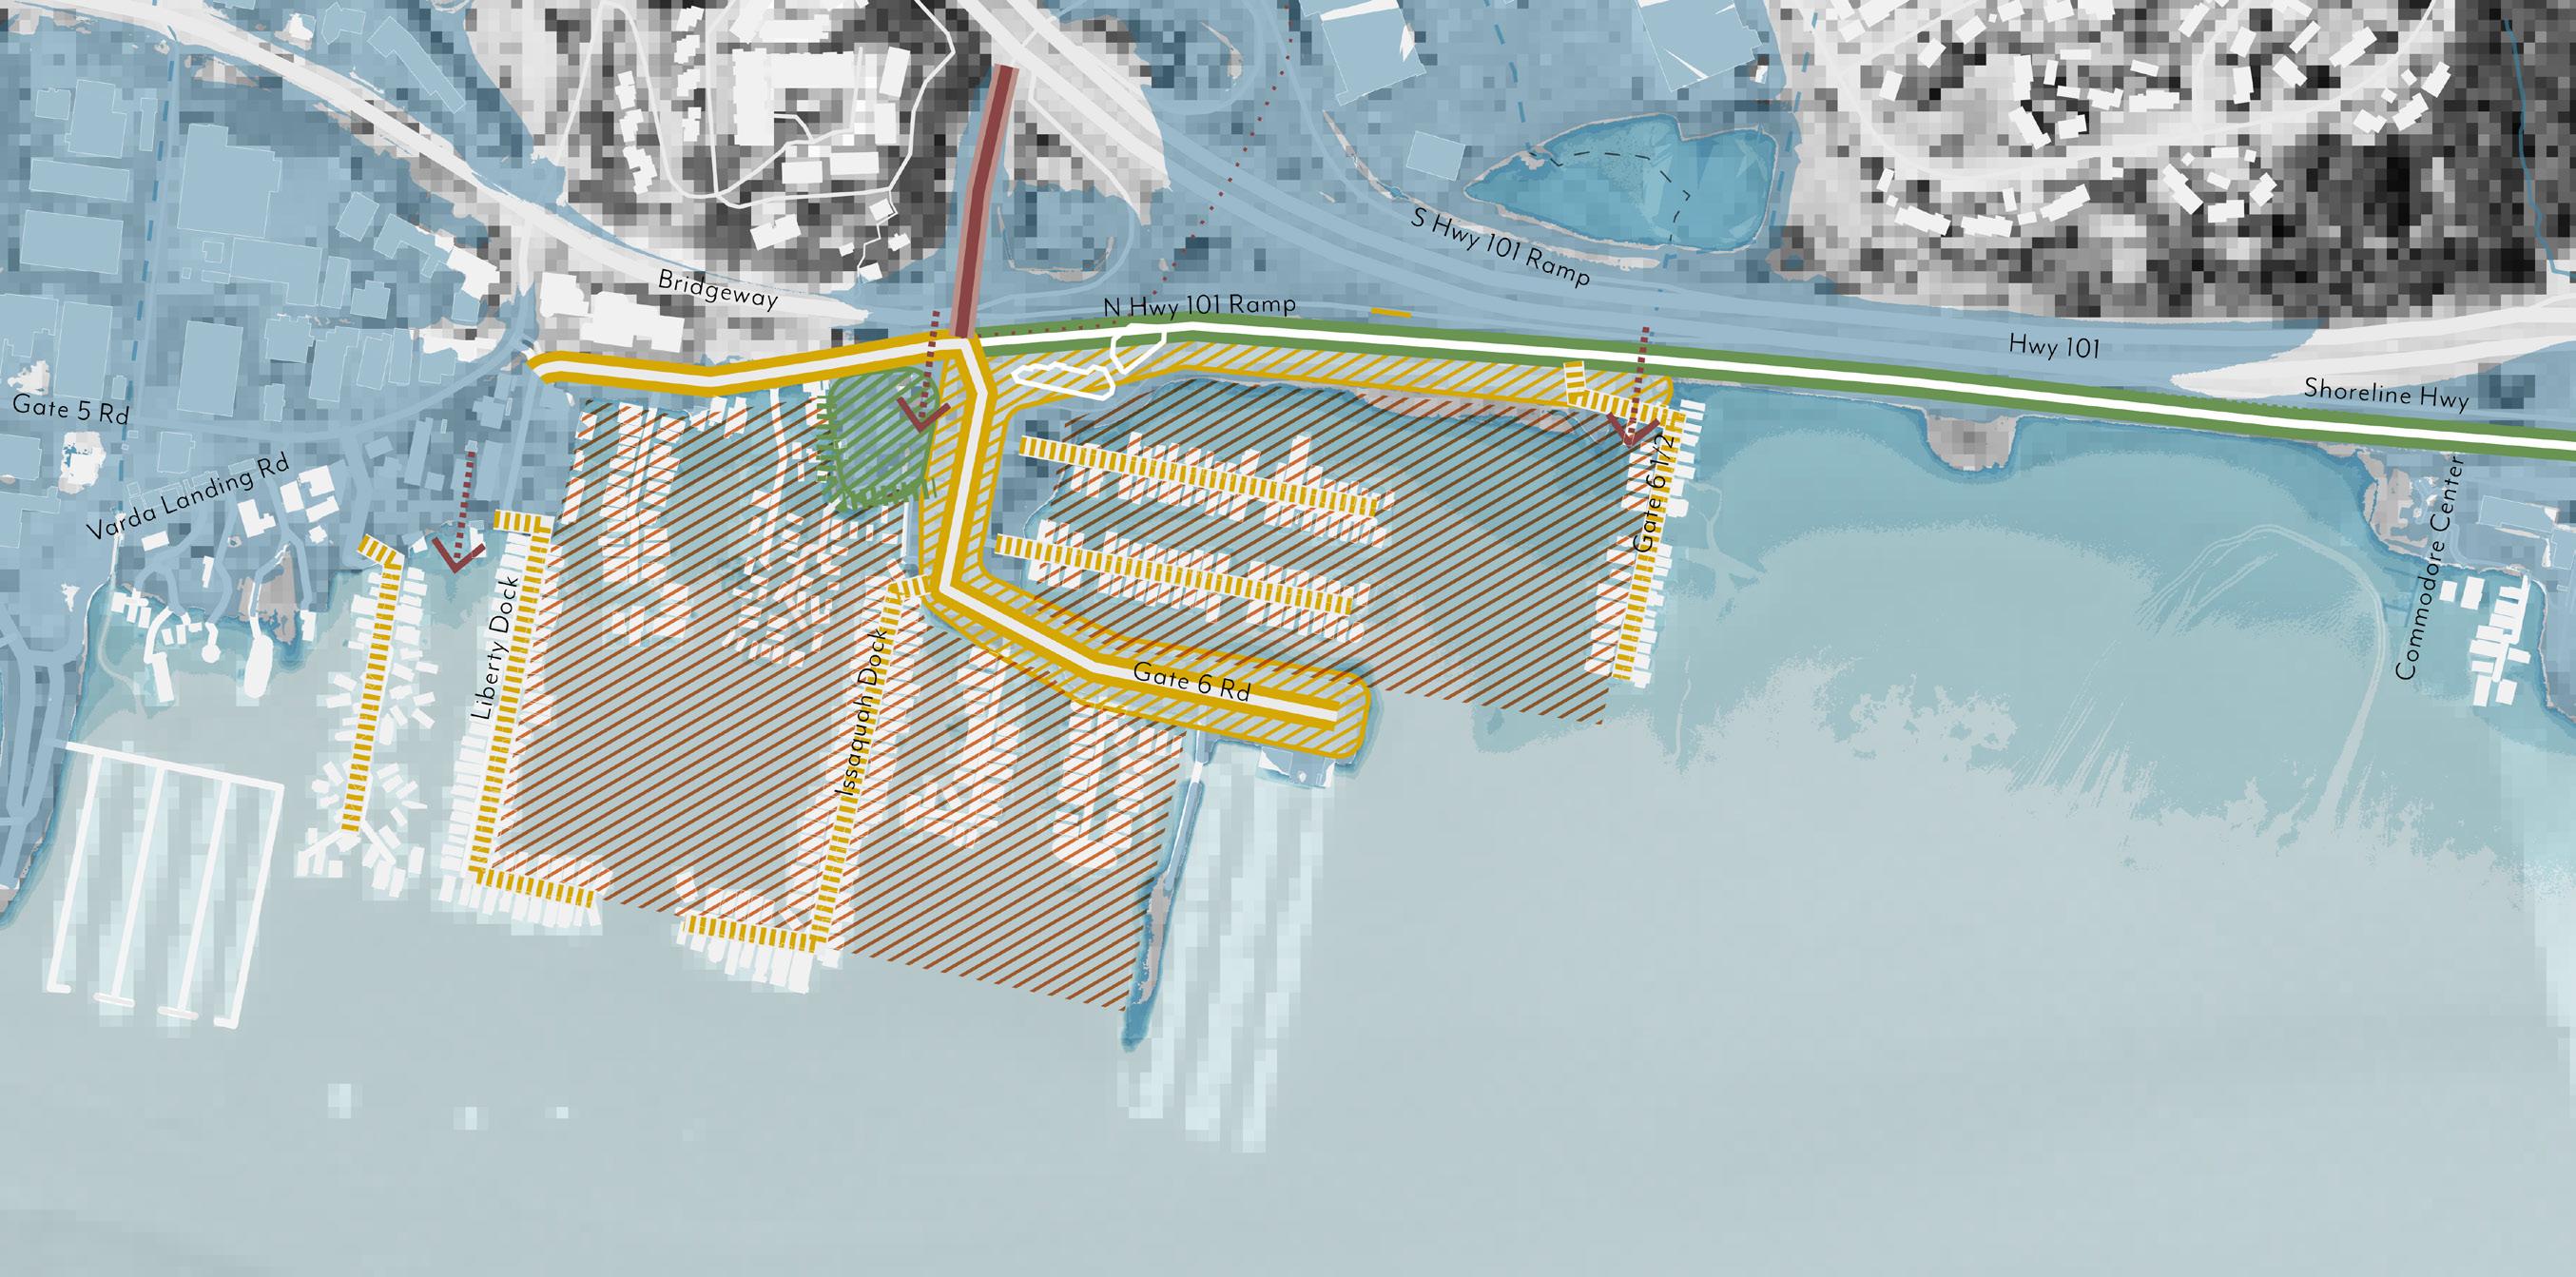
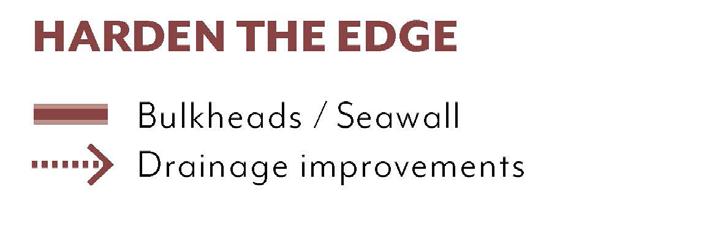
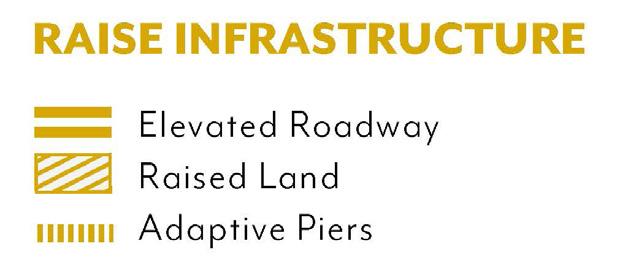
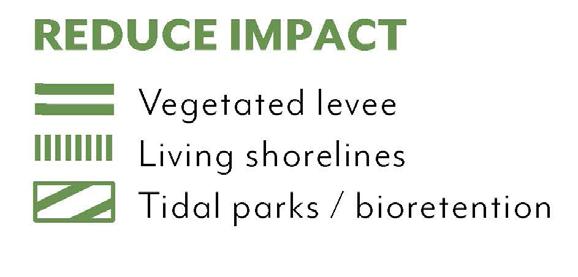

This long-term alternative for the Floating Homes community and County roads blends individual and collective adaptation building on the near-term measures incrementally. Efforts focus on elevating Bridgeway, the Bay Trail, and the Highway to protect inland areas. Private parking areas and access corridors are raised or float.
• Raise Bridgeway and the Bay Trail by connecting it south to the flood protection in Marinship, and tying in the north to higher ground.
• Ensure access to highway, Marin City, and floating home neighborhoods are maintained into the future.
• Raise private piers and apply wave attenuation strategies.
• Adapt community parks and shoreline access points such as Van Damme Park and Otis Redding Dock.
• In Waldo Point Harbor, expand floating home infrastructure, while maintaining vehicle access and universal accessibility.
• In the vicinity of Gate 6, efforts should prioritize raised or floating parking areas and the strengthening of a resilient outboard community housing to accommodate current and future residents.
• Integrate raised access points to parking areas servicing floating home communities.
• Adapt the commercial building site by elevating the land, rebuilding on piers, or floating.
• Explore sites for stormwater detention behind the resilient edge are needed.
• For Gate 6-1/2 and areas north, the focus is coordination with the regional efforts to upgrade the culverts and raised access roads to mitigate compound flooding and improve stormwater retention. Continuous flood-proofing of the US Highway 101 and Bay Trail will entail location of the tie in.
ADAPTATION STRATEGY RECOMMENDATIONS CONTINUED
Long-term Option 2 (Elevate Floating Communities and Bay Trail)
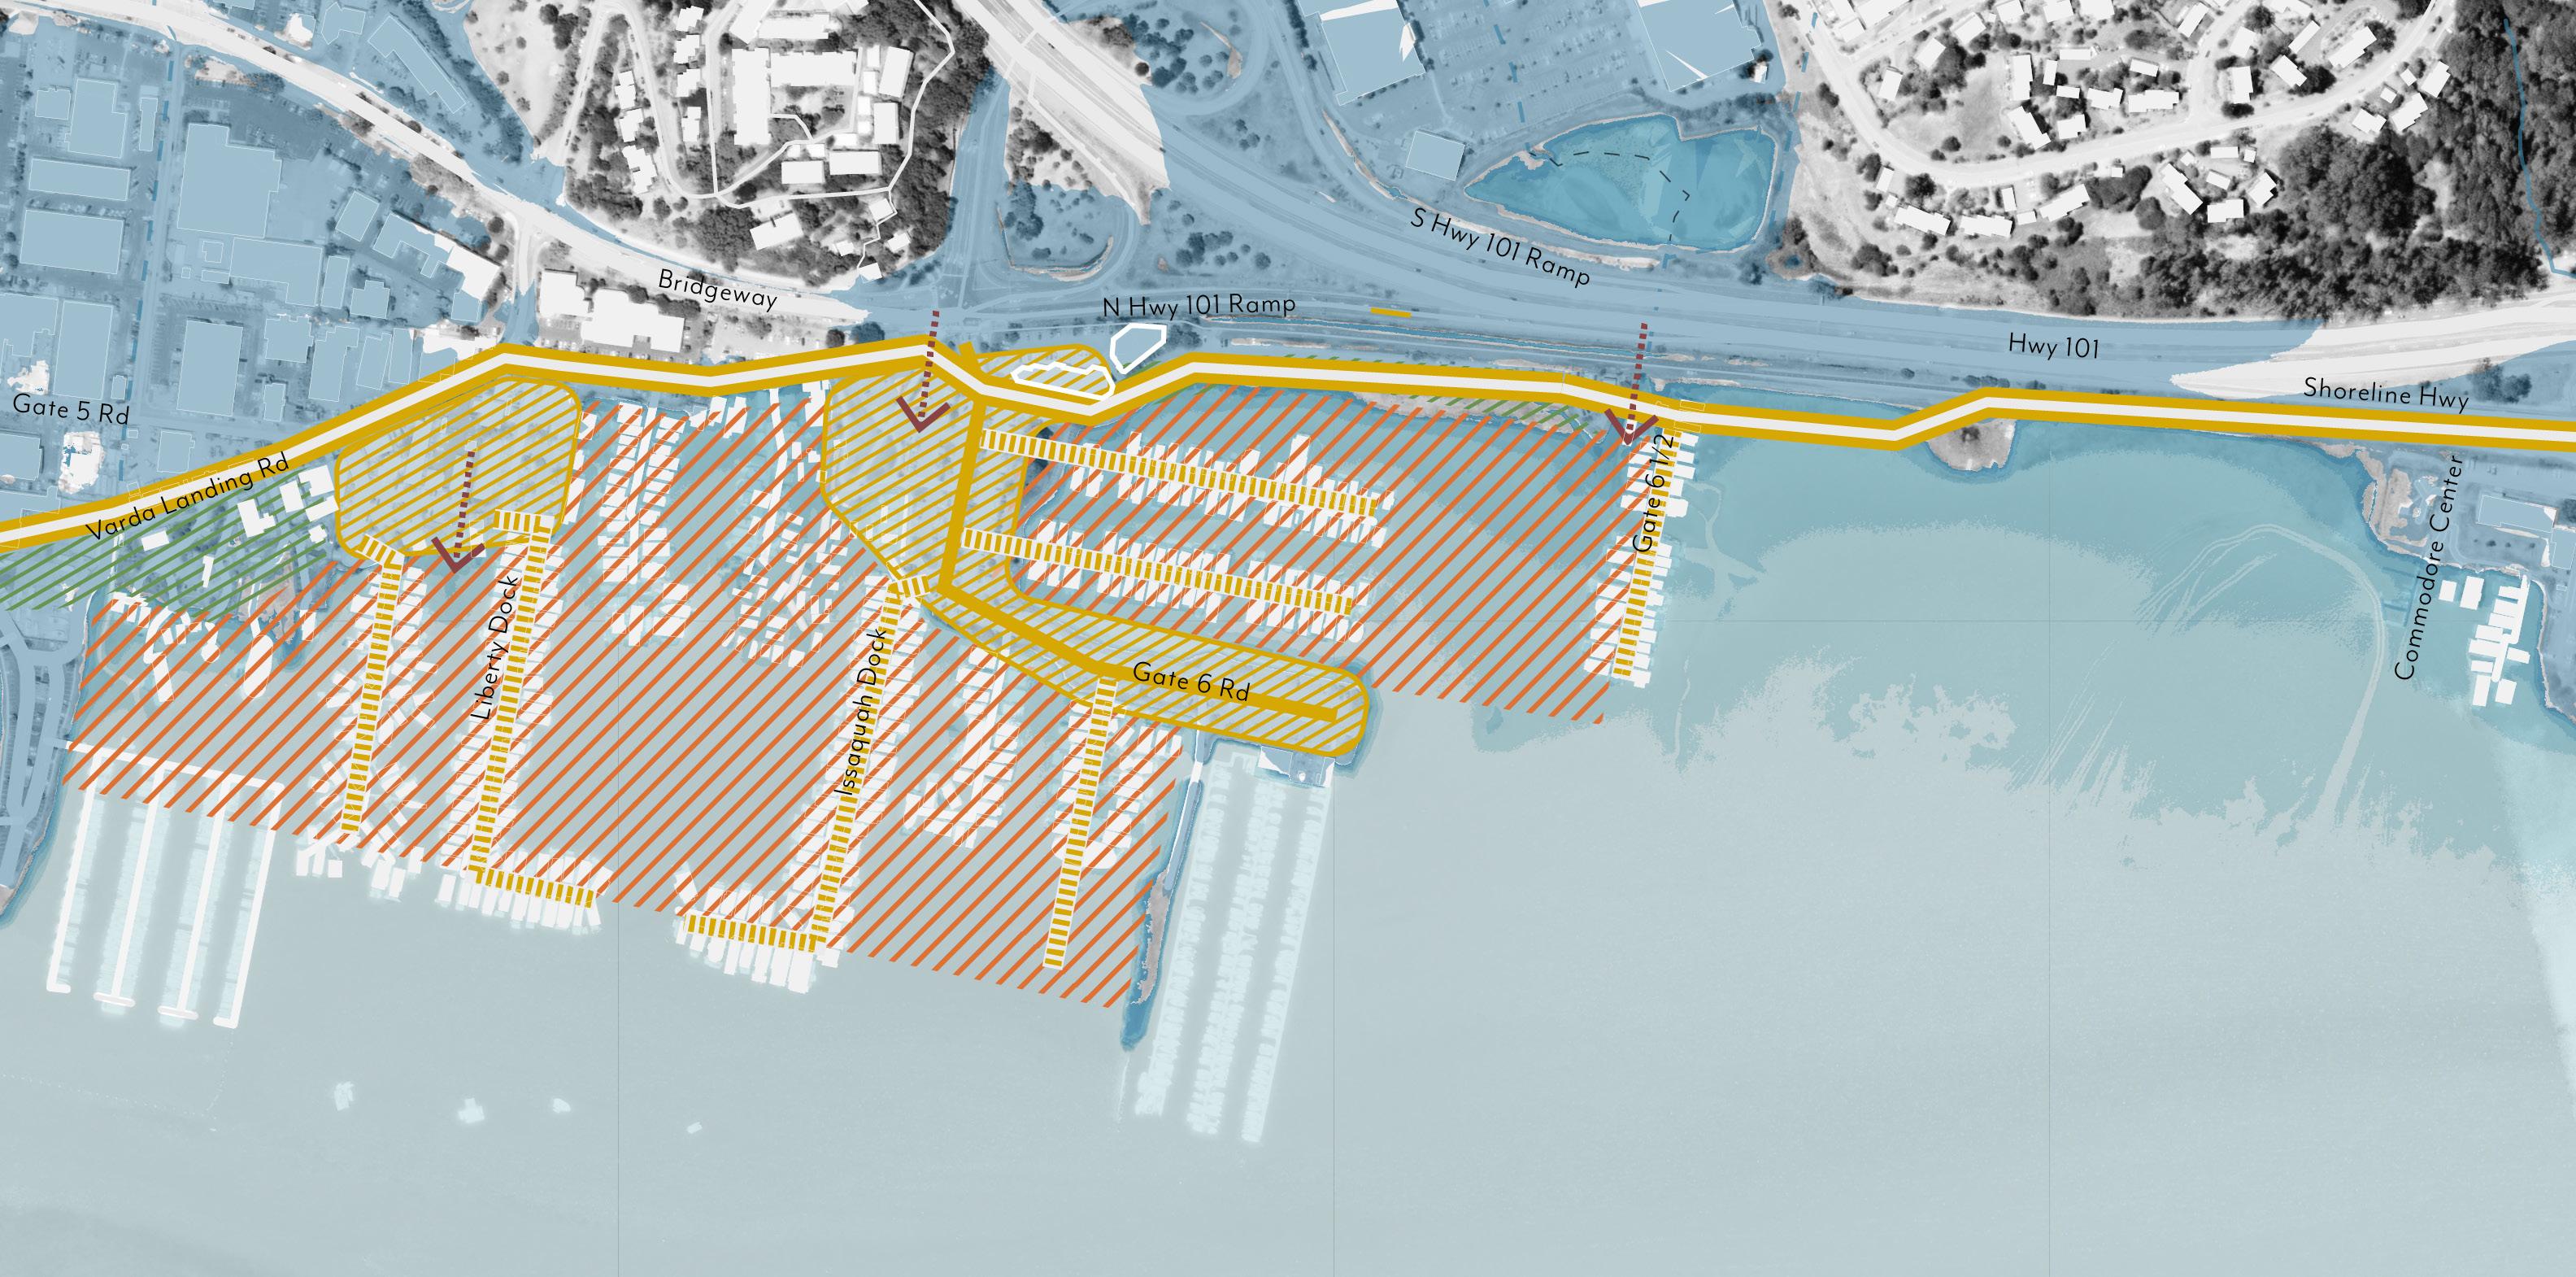

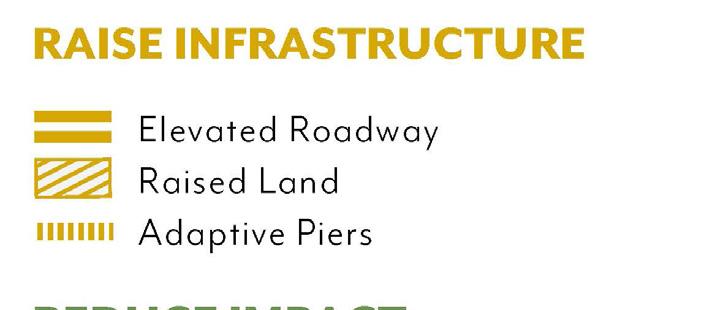
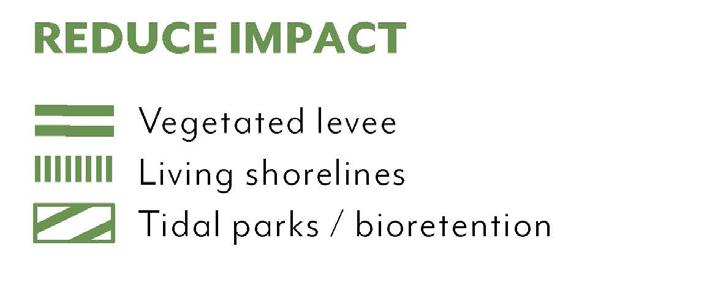

This option alternative prioritizes County and private roads (Gate 6, Gate 6 ½) and the Bay Trail as the resilient edge to protect regional roads, highways, and inland communities including Marin City. Existing floating communities are retrofitted to elevate or float and conduct coordinated ecological restoration. Identify sites for stormwater detention behind the resilient edge. Floating home capacity is expanded to include new homes and investment that fosters a thriving waterfront community. Parking areas are raised with fill and perimeter walls or floated to ensure those with limited mobility can still access homes. Existing piers are raised and wave attenuation strategies are applied. Integrate parks and community gathering spaces into the adapted floating home access areas.
Elevate Gate 6-1/2 Road as the resilient edge with a seawall or similar structure to ensure community access is preserved and the adjacent highway is protected. Caltrans’ Highway 101culvert investment should be leveraged redesign drainage and engage multi-agency partnerships for enhancing connectivity. Habitat restoration
at Van Damme Park and new fringe marsh along Gate 6 Road and Gate 6-1/2 Road can provide ecological benefits.
Nature-based strategies for Sausalito’s Floating Homes leverage environmental opportunities focused on providing space for upslope migration of Richardson Bay’s eelgrass beds. Eelgrass beds improve water quality and create essential habitat for fish and bird species, enhancing biodiversity and ecosystem resilience, especially in the face of rising sea levels and consequent loss of this habitat if there’s no space for eelgrass to migrate to with sea level rise.
Integrating marsh along raised areas and adding textural elements supportive of shellfish to hard surfaces offers a sustainable, cost-effective complement to engineered flood defenses, fostering a harmonious balance between community protection and environmental stewardship.
Near-term actions prioritize individual property retrofits in Waldo Point Harbor
Resilient infrastructure focuses on elevating the roadways and ramps, raised parking systems, and adapting access points to accommodate frequent flooding and sea-level rise. Coordinated projects with Caltrans will address drainage issues, ensuring safe mobility and continuity.
Ecosystem enhancements leverage existing tidal flats and eelgrass to create living shorelines and restore wetlands in the harbors. Vegetated breakwaters integrated with existing wetland habitats organize buffers against storms and tidal activity.
Scaled up floating of community facilities allow for phased investment in adaptation. Local regulations and upgrades will ensure safe aging-inplace by increased access to parking for senior floating homes.
and protective berm in coordination with Caltrans’ culvert project to address compound flooding from highway drainage. The long-term hybrid approach balances individual adaptation like raising assets and right-of-way with collective “living with water” alternatives like scaled floating infrastructure, raised parking and
coordinated retreat strategies. The collective “living with water” alternative envisions scaled floating infrastructure, raised parking and coordinated retreat strategies. The alternatives maintain space for marsh and eelgrass to migrate landward, and integrate vegetation and shellfish enhancements along the hardened edges.
The Floating Homes, Gate 6 Road and the US-101 interchange demand early alignment among the regional transportation agencies, Marin County, city agencies, environmental, and other local coalitions. This coordination ensures that elevated access ramps meet residential loading limits and emergencyservice clearances, and provides design guidance for safe multimodal detours during construction of the Bay Trail and provide continuity throughout the reach. Equityfocused groups can help refine outreach to adjacent Marin City residents who rely on the car-free commuting. Strategic partners for the coordinated adaptation include:
• Metropolitan Transportation Commission (MTC)
• Caltrans District 4 (culvert expansion sponsor)
• Transportation Authority of Marin
• Marin County Parks
• Marin County Flood Control District
• MTC/ABAG Bay Trail
• Marin City Climate Resilience and Health Justice
• Kappas Marina
• Richardson Bay Regional Agency
• Marin County Bicycle Coalition Long-term collective strategies to protect the areas at risk in Waldo Point Harbor
and Kappas Marina include retreat or the realignment of shoreline properties. The collective adaptation alternative requires collaboration between environmental groups and regular coordination with local communities throughout the planning process, focused on identifying opportunities for extended floating of homes and community assets. Adapting for end of century SLR, this adaptation alternative can benefit from diverse collaborations to enhance habitat restoration and maintain essential non-motorized access during extreme tides:
• National Park Service’s Golden Gate National Recreation Area
• Save The Bay
• Coastal Conservancy
• Marin Conservation League
• San Francisco State University
• Floating Homes association
• Ducks Unlimited
• Mill Valley–Sausalito Pathway Stewards
• Bay Trail
• Marin County
• BayWave
Nature-based solutions can be integrated as a community stewardship activity, both involving the Bay Trail at the linear part of the shoreline at Waldo Point Harbor. . Coordinated stewardship days—organized under RBRA’s beach-cleanup framework— can integrate citizen science, debris removal, and native planting, reinforcing the harbor’s
social fabric and ecological resilience. Environmental partners could be:
• Richardson Bay Audubon Center
• Save The Bay
• Galilee Harbor’s cooperative community (outreach programming)
• Richardson Bay Regional Authority
Individual long-term alternative will benefit from a coalition that pairs the homeowners with harbor management to coordinate the phased adaptation actions. Down-bay of the Drake Culvert, floating-home owners face compound flooding from highway outflows. Partnering on flow-diffusion baffles, scour protection, and adaptive dock moorings can mitigate high-velocity discharge impacts. The FHA’s technical committee can pilot sensor arrays that log turbidity, salinity, and hull stresses for broader ecological insight. The potential partners in this strategy include:
• Richardson Bay Marina
• Kappas Marina
• Marin County
• Waldo Point LLC (overseeing recent parking-lot elevation and utilities upgrades)
• Sausalito Community Boating Center (hands-on training in tide-adaptive construction and oyster-reef monitoring):
• Waldo Point Harbor
• Floating Homes Association (FHA)
• Caltrans
Many of the adaptation strategy recommendations documented in the previous chapter rely on a combination of collective and individual actions to be implemented over a long period of time. Near-term actions are also required. One of the most challenging aspects of adaptation planning is the commitment and ongoing coordination by City Council, local and regional agencies, individual landowners and community members. The goal of the community visioning effort and documentation of the tradeoffs is to advance the understanding of the range of what is possible if collective action is embraced.
By setting a clear vision for a resilient edge, including location and design heights for mid-century and end-of century, the City and community can initiate, support and review shoreline project proposals with confidence.
This chapter contains a summary of principles for adaptation in Sausalito developed through the community visioning process, a summary of high level costbenefit understanding, a summary of funding opportunities, and future planning efforts needed to advance the City of Sausalito’s approach to sea level rise resilience.
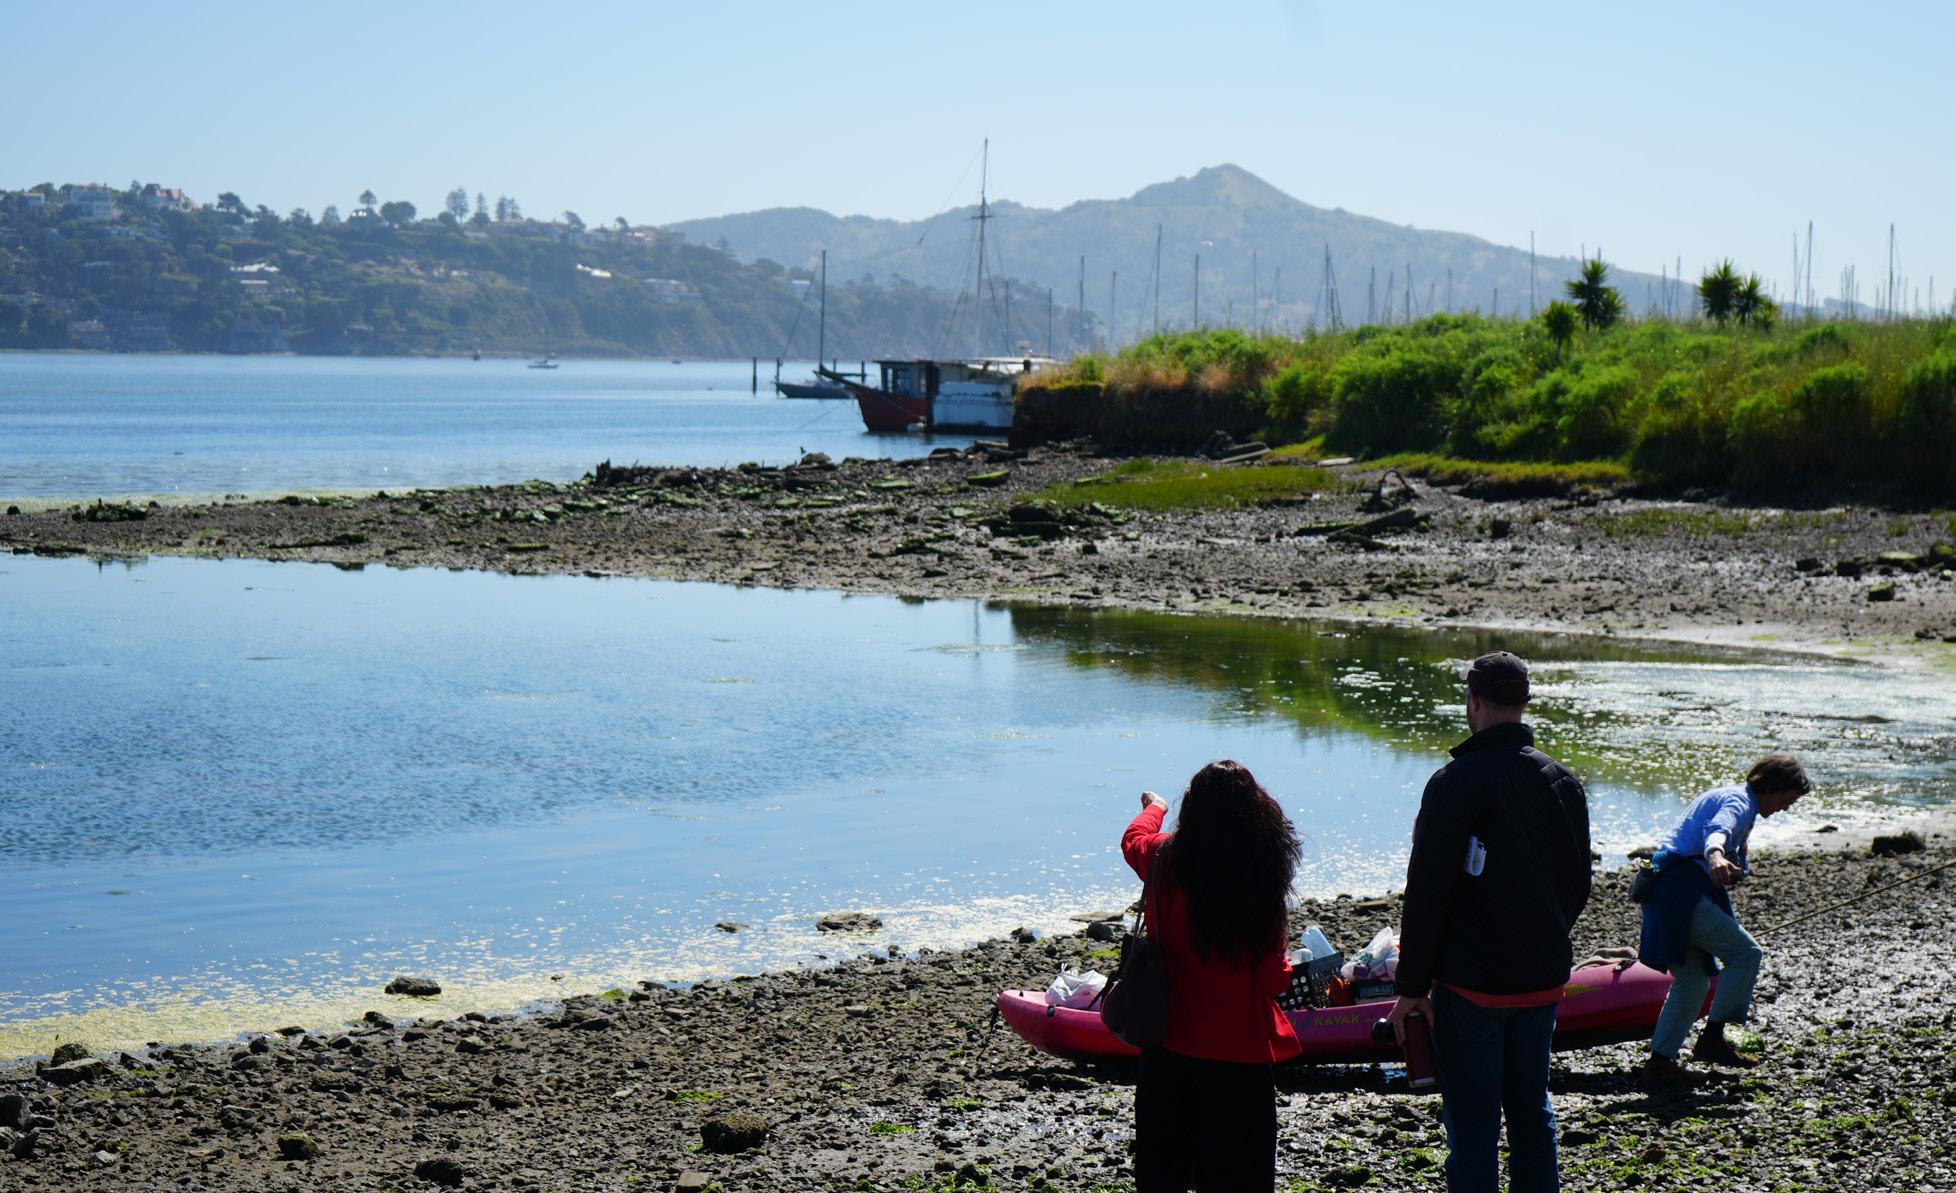
Key principles emerged during the planning process that can serve to guide design and decision making throughout the future development of shoreline adaptation projects. Documented below are areas of knowledge that can be advanced going forward, and that reflect the range of interests present across the community.
The character of Sausalito’s shoreline and the community’s connection to the water is fundamental to successful adaptation in the future. Throughout the community visioning efforts, the options that maintained access and pedestrian views to the water were most preferred, even when compared to large sea walls and levees examples that provide obvious protection but also reduce views and limit access to the water. Adaptation projects that celebrate public access to the water and foster authentic maritime uses and public access amenities are preferred.
The floating homes along Sausalito’s shoreline are celebrated as a part of Sausalito’s history and represent a tested, resilient approach to living with water. The communities along the water are planning for infrastructure improvements needed to maintain the existing floating structures as sea levels rise. There is also interest in exploring floating adaptation strategies at properties on the shoreline that may be below base flood elevations by end of century. Buildings, roads, and trails can be placed on floating devices such as barges. While not all uses are compatible with a floating approach, there are other alternatives for fixed pier structures or elevated foundations that are compatible with neighbors on the shoreline who may choose to explore floating options. The future shoreline may include an integration of all strategies in way that is familiar to patterns seen today.
Many of the industrial areas along the shoreline, especially in Marinship, will face increasing risk of flooding and associated damages to structures and property. Today, many maritime businesses serving marinas, artisans, and other local manufacturing are located in these high-risk shoreline zones. Many in the community value these local businesses and advocate for their support
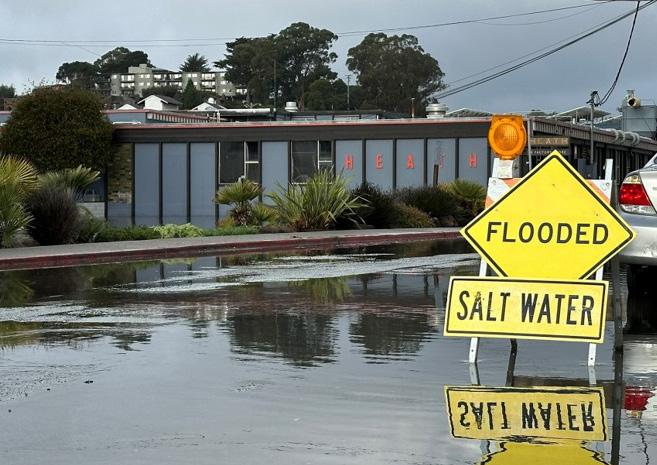
throughout future adaptation planning. Models for maintaining affordable industrial use areas within major adaptation areas can be explored.
The Richardson Bay area provides regionally-important habitat for eelgrass communities which in turn support herring spawning and other important ecological benefits, including support for many charismatic mammals like Harbor seals that visit the Sausalito shoreline. The subtidal areas along the Sausalito shoreline have historically provided the
ideal depths for eelgrass. Intensive efforts have been undertaken by local municipalities, regulatory agencies and resource managers over time to remove structures that impact eelgrass beds. As sea levels rise and the water depth at subtidal areas that support eelgrass today get deeper, there is an opportunity to find and protect future subtidal areas with suitable depths to encourage eelgrass migration. As shoreline adaptation projects develop it will be important to highlight areas where nature-based features like eelgrass and reef structures are suitable and implement strategies for monitoring ecosystem services provided by these features. Incorporating these features can reduce impacts from sea level rise and increased storm intensity.
Many of the local groups along the shoreline are already taking proactive measures to improve resilience. One example comes from the Galilee Harbor community which has demonstrated success to restore the shoreline, improving the habitat by planting cordgrass and in turn reducing erosion impacts. The community has taken measures to extend pile caps along the docks to prepare for rising tides and more frequent large storm events. The group has received a grant to explore the potential for naturebased wave break features in the bay to protect the community from large waves that cause damage during storms.
The sea level rise planning scenarios developed through this study (see Table 11) quantify the anticipated water levels and necessary elevations of protective measures when adapting the shoreline. This study identifies the ideal resilient edge and assigns clear design heights associated with each sea level rise scenario.
The location of the “resilient edge,” as its been illustrated across various concept explorations in this study, can lead to differing types of impacts and tradeoffs for community members. If the resilient edge is situated along the existing shoreline, the design intervention results in a relatively larger feature than if it were situated on higher ground. By locating the resilient edge in upland areas, the design of the public realm, like a street, sidewalk, or seating element, can more easily be incorporated into the design to maintain a seamless connection to the waterfront. By evaluating shoreline projects in relation to the planned “resilient edge,” the City can help ensure that all new projects are aware of and align with long term adaptation efforts.
In order to plan for the series of projects needed to adapt and protect Sausalito’s future shoreline, Adaptation Pathway Options illustrate potential sequences of planning, design and life cycle. Considerations to develop these options include:
• Planning and permitting of projects takes time. Each project has a lead time of several years for planning and community consensus-building, regulatory and permitting approvals, and construction mobilization. With sea levels rising over time, it’s helpful to compare those lead times with projected levels to understand when project should start, how long it will have a useful life, and when to plan for the next stages.
• Choosing between gradual implementation versus big moves can be tricky. Big moves are costly, but many small moves may require more ongoing construction and may be ultimately more costly over time. Setting up pathways can help compare costs and impacts to help inform planning decisions.
• Managing uncertainty for the longterm future requires flexible solutions. While we have clear guidance for what to expect by 2050, 2100 sea level rise projects still vary quite a bit. Using the Adaptation Pathways Options tool can
help identify what triggers to look for and when to start planning longer-term projects and to avoid building stranded assets.
• Ultimately, the community planning efforts for near-term or mid-century concepts will benefit from clear documentation through a district or subdistrict plan that can undergo environmental impact analysis to comply with CEQA. Streamlining the environmental impact analysis at a subdistrict level can help streamline the approval and implementation process.
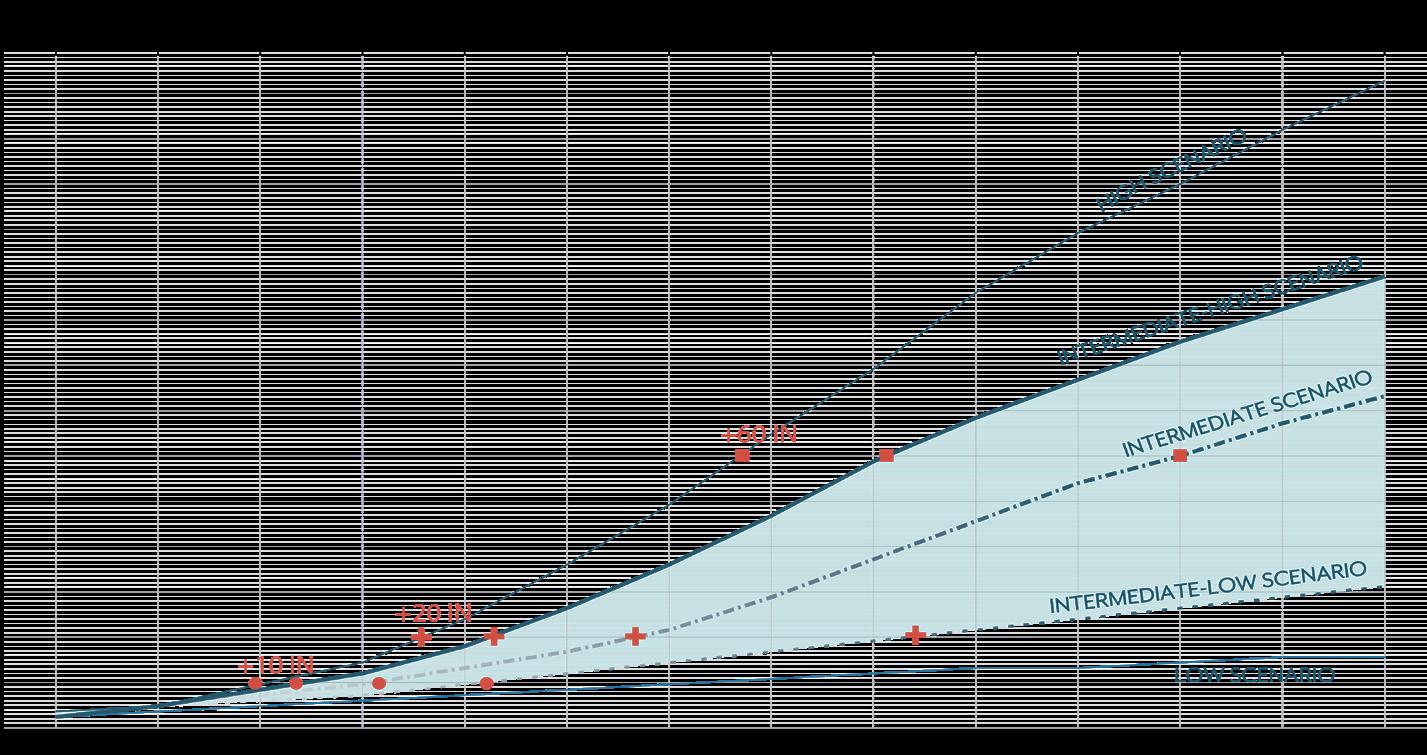
Planning Trigger
Lead Time (Planning, Permitting, Construction)
Implementation Threshold
Project in Place
Adaptation Pathway diagrams are useful to document multiple phases of a project over time. By documenting the intended time of project implementation and identifying the level of sea level rise anticipated at each stage, planners can track and make decisions about how and when to invest in improvements. In these examples, a project designed to make large improvements over time is compared to a project that maybe be implemented in shorter more frequent projects. Comparing these two options by tracking costs and impacts over time can help decision makers and communities decide how to invest in sea level rise adaptation.
Planning Trigger
Lead Time (Planning, Permitting, Construction)
Implementation Threshold
Project in Place
The cost of no action was estimated by assuming all assets within the future SLR footprint were considered a total loss. This loss was estimated as the capital cost to replace each asset if it were to be damaged beyond repair. Rough order of magnitude (ROM) costs are useful to compare the relative value of assets and the costs of interventions to protect those assets.
Due to the scale of impacts identified in the vulnerability assessment, Marinship costs were studied in further detail. In Marinship, the benefits of collective and individual action outweigh the costs associated with lost assets as shown in Table 16. When benefits outweigh the costs, the adaptation option has positive net benefits.
The same trend was observed when evaluating all of Sausalito. Using simplified collective and individual action scenarios, the cost of adaptation was estimated. The simplified collective scenario assumed a waterfront floodwall along the length of Sausalito and the simplified individual scenario assumed each building would be flood-proofed or elevated and each road
Note on Cost Assumptions: ROM costs were developed following AACEI guidelines for a Class 5 cost estimate. This exercise did not include the escalation of construction costs nor a discount rate, which have opposing effects on the cost value and are difficult to estimate given future uncertainty.
This exercise focused on the losses of physical assets and not wider economic implications, like property tax revenue for example. For storm scenarios, we expect buildings and infrastructure to experience some damage, but the cost of this damage would be lower than replacing the entire asset like we assume for SLR.
would be raised. In all cases, the adaptation scenarios had positive net benefits for 2050 and 2100.
In the near-term 2050 scenario under sea level rise alone, individual action offers a lower cost to adaptation, in part because there are fewer individual assets to protect. When you consider damaging storms or even higher SLR amounts, a tipping point
is passed and it is more cost effective to implement a collective solution, like a levee or a floodwall, to protect the exposed assets.
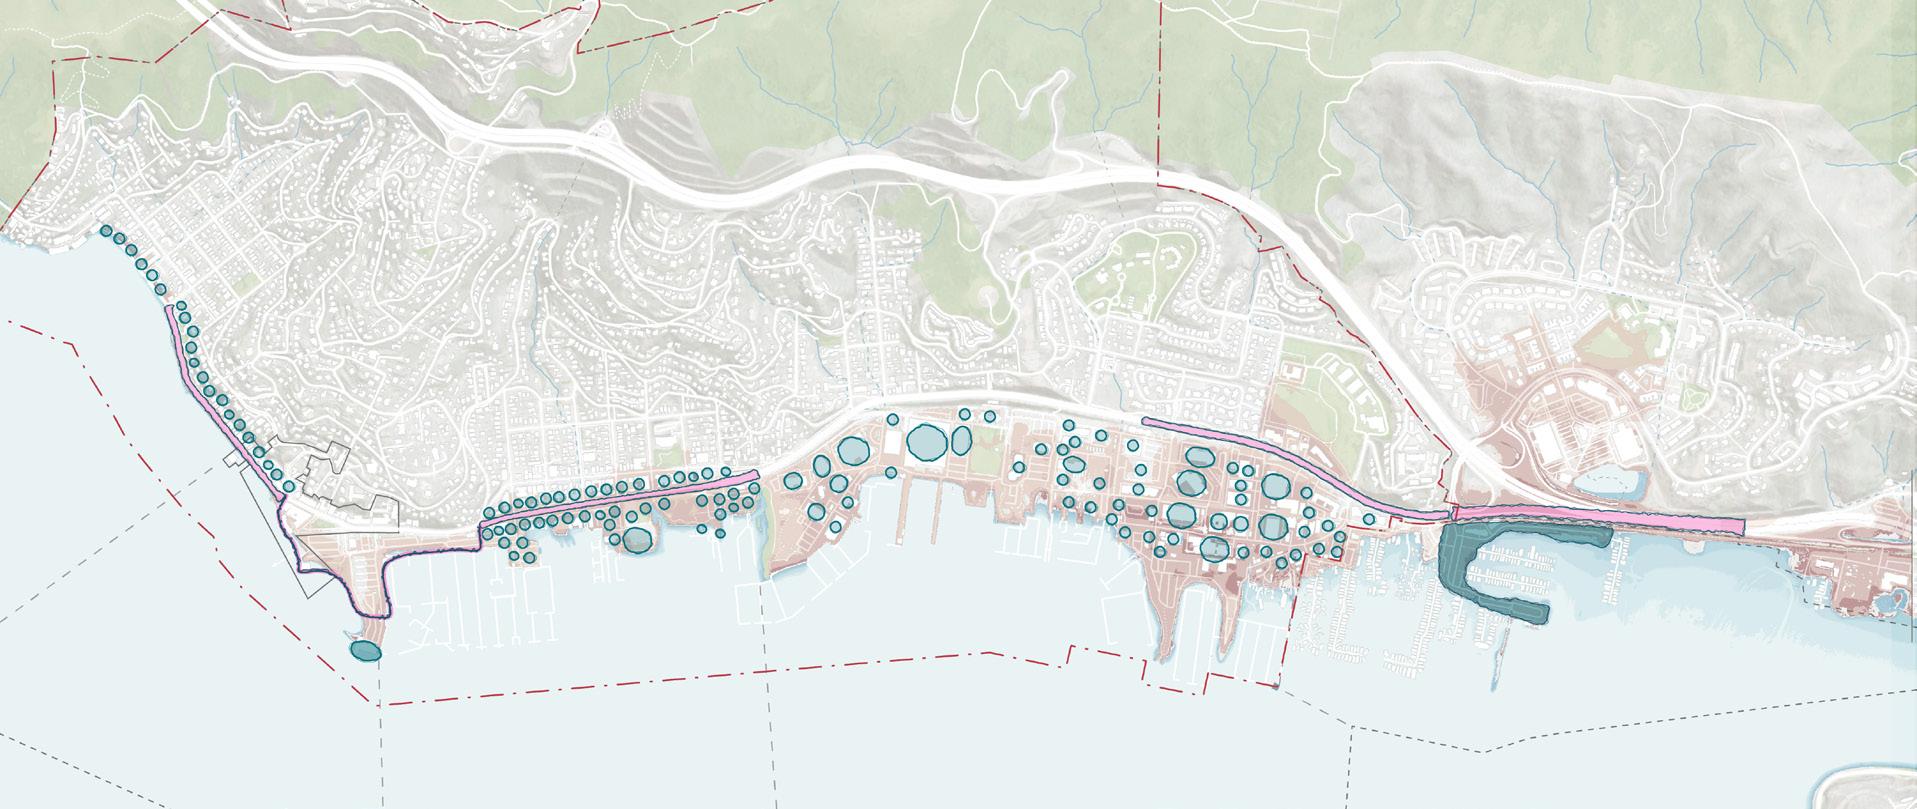
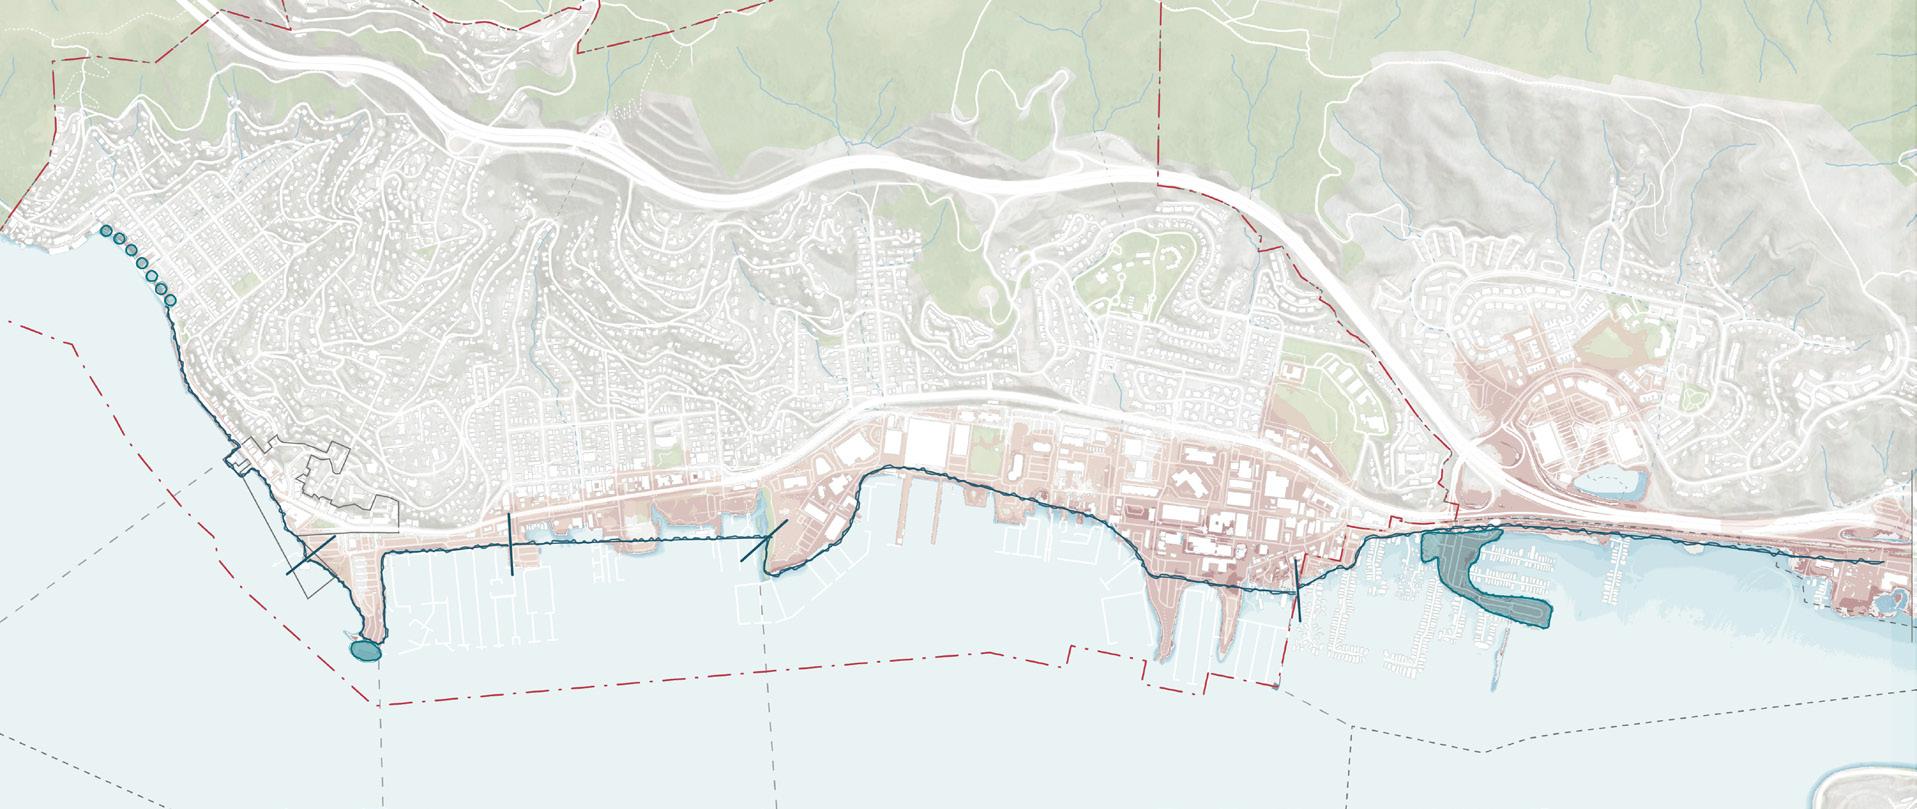
30:
High-level concepts were developed to compare costs between an “individual action” approach which would include adaptation of individual buildings, and a “collective action” approach which would include coordinated infrastructure improvements across multiple properties. These sketches inform the “cost of adaptation” estimates in Table 16 on the opposite page.
The costs of adaptation for the Bay Area as a region are projected to be very high, estimated to be $110B to address risks through 2050 according to regional agencies, but the costs of no action are even greater, exceeding $200B for the region (2023 MTC/ABAG and BCDC Sea Level Rise Adaptation Funding and Investment Framework Final Report). Along with its bayside neighbors, the City must explore a multi-layered approach to funding for planning and construction projects needed to take action on sea level rise adaptation.
Available funding sources described below provide opportunities to develop this approach.
• TAM Measure AA: SLR Program
• Climate Resilience District (SB 852)
• Enhanced Infrastructure Financing District (2014 SB 628, 2017 AB 733)
• City Bonds or Taxes
• Business or Development Fees
• Public-Private Partnerships (PPP): Development agreements
• Marin Community Fund: Buck Family Fund for Building Resilient Communities Transportation
• TAM Measure A: Local Transportation Infrastructure, Major Roads & Related Infrastructure
• TAM Safe Routes to Schools
State
Climate and Resilience
• Ocean Protection Council (OPC) (SB 1): Sea Level Rise Adaptation Planning Grant Program
• MTC One Bay Area Grant 3 (OBAG 3)
• CA Proposition 4: Climate Bond
• CA State Coastal Conservancy: Climate Ready Program, Sea Level Rise Program, & Multi-benefit Nature-Based Climate Adaptation Program
• CA State Water Resources Control
Board: Clean Water State Revolving Fund Program
• CA Infrastructure and Economic Development Bank: Infrastructure State Revolving Loan Fund, Climate Incentives Bridge Loans, Green Bonds Transportation
• CA Transportation Commission (SB 1): Active Transportation Program, Local Streets and Roads Program
• Local Transportation Climate Adaptation Program (LTCAP) (SB 198) Restoration and Conservation
• San Francisco Bay Restoration Authority (Measure AA): Grant Program
• OPC Proposition 68 Grant Program: Advancing 30x30 in Parks and Open Space
• CA State Parks: Land and Water Conservation Fund (LWCF) Grant Program
• CA Natural Resources Agency (CNRA): Environmental Enhancement & Mitigation Program, Tribal Nature-based Solutions Program
Climate and Resilience
• FEMA: Building Resilient Infrastructure and Communities (BRIC), Flood Mitigation Assistance (FMA), Hazard Mitigation Grant Program, Pre-Disaster Mitigation Grant Program, Safeguarding
Tomorrow Revolving Loan Fund Program
• US Army Corps of Engineers (USACE): Corps Water Infrastructure Financing Program (CWIFP)
• US EPA: Green Infrastructure Funding Program
• U.S. Economic Development Administration
• National Fish and Wildlife Fund (NFWF): National Coastal Resilience Fund, Emergency Coastal Resilience Fund Transportation
• Federal Highway Administration (FHWA): Promoting Resilient Operations for Transformative, Efficient, and CostSaving Transportation (PROTECT) Program, Culvert Aquatic Organism Passage (AOP) Program
• US Department of Transportation (DOT): Safe Streets and Roads for All (SS4A) Grant Program, Rebuilding American Infrastructure with Sustainability and Equity (RAISE) Grant Program
As part of SB 272, communities are required to develop a Subregional Shoreline Adaptation Plan for review by BCDC by 2034. The goal is for each community to develop an approach to sea level rise adaptation over time. The Vulnerability Assessment, Community Priorities, and Adaptation Strategies developed through this planning effort are aligned with the BCDC RSAP Guidelines published in December 2024 and will form the basis of Elements B, C and D. The next steps for the City in the RSAP process will include engagement with BCDC to formally begin the RSAP development process as described in Element A. Additional efforts will be needed to complete Elements E: Land Use and Policy Plan, F: Implementation and Funding, and G: Project List.
Future planning efforts will need to consider the relationship between land use and adaptation strategies since this study does not address land use. Rather, observations are noted through the course of study. Community character is a central theme of the plan and relates to the kinds of uses present. The following questions can be further explored through comprehensive plans, district plans, and property specific proposals.
• Can all land uses adapt equally, or will future climate conditions impact some uses more than others?
• Does reduced access due to road and parking lot closures affect some land uses more than others?
• What types of buildings and uses can better accommodate periodic ground level flooding?
• Will the cost of adaptation to private property owners prompt intensification of uses to increase yield and pay for infrastructure costs?
• Which mix of land uses can best generate the tax revenue needed to support critical infrastructure improvements?
• Are existing financing mechanisms such as Enhanced Infrastructure Financing Districts (EIFDs) and Community Revitalization Investment Areas (CRIAs) appropriate to fund technical studies
and ongoing implementation? For this or should other strategies be explored? Specifically, would a Climate Resilience District (CRD) support collective actions? How?
• What incentives are needed to facilitate action by property owners to implement parcel-based adaptation strategies?
• Potential approaches include easing site development standards—such as density, floor area ratio (FAR), building height, allowable uses, open space requirements, and parking—to improve the financial feasibility of new development.
• For existing development, additional incentives could include tax relief, financial assistance, and allowances for building additions or modifications to support the integration of adaptation measures.
The City’s future ability to encourage adaptation and regulate proposals effectively will require updates to design standards. Floating buildings, amphibious utilities, and adaptable buildings present entirely new conditions.
• How are height and FAR limits calculated for a building that floats?
• If parking is centralized in a district or replaced by dingy and SUP, how is that regulated for a property?
• What minimum finish floor elevations should be required for new construction?
• What development incentives are needed to encourage appropriate adaptation features to be constructed? Can this strategy be used to protect desired uses that typically generate less income?
Actions in water, on the shore, and within the shoreline band are highly regulated by federal, state, and regional jurisdictions. Even small, incremental near-term actions to adapt such as building low seawalls or retrofitting piers, can be onerous to individual property owners. Waterfront owners and businesses seek support to streamline permitting.
• How can individual property owners work together to identify incremental adaptation actions and address permitting needs more efficiently?
• What role can the City play to support district planning and permitting?
• Would a Climate Resilience District fund staff to help facilitate planning and permitting?
• What City or County support could be available to engage permitting agencies and to complete environmental review (CEQA)?
While the Shoreline Adaptation Plan documents many of the concepts and recommendations explored throughout the community-informed planning process, the development and refinement of future implementation projects is still ahead.
In the coming months, the City will proceed with a detailed facilities assessment of City-owned properties to assess the need for structural and utilities improvements as sea levels rise. The City will also proceed with an evaluation of present-day and anticipated mid-century flooding in the Gate 5 Road Drainage Area that will result in recommended improvements to reduce impacts to roads and adjacent properties.
As additional improvements are made along the shoreline, City review will be needed to ensure that projects support the advancement of the resilient shoreline concepts needed to minimize future sea level rise impacts.