
Status of the Fisheries 2022
The Western Pacific Regional Fishery Management Council promotes sustainable fisheries and provides stewardship of marine resources seaward of the state waters of Hawai‘i, American Samoa, Guam, the Commonwealth of the Northern Mariana Islands (CNMI) and the Pacific Remote Island Areas (PRIA). The Council’s authority over commercial and non-commercial fisheries is mandated by the Magnuson-Stevens Fishery Conservation and Management Act (MSA).

The Council publishes annual reports for each of its five Fishery Ecosystem Plans that are maintained through periodic amendments. This publication summarizes and highlights some of the interannual changes described in the annual reports. For the full reports, please visit www. wpcouncil.org/annual-reports.
Fishery statistics can be influenced by numerous factors, including environmental changes and socioeconomic variables. In recent years, the impacts and subsequent recovery from the COVID-19 pandemic also affected fisheries in multiple ways. Some of these effects are shown through the summary trends below, in addition to recent stock statuses and management measures.
Internationally Managed Pelagic Species: Western and Central Pacific Fisheries Commission (WCPFC) stock assessments indicate Western and Central Pacific Ocean (WCPO) skipjack, yellowfin, bigeye and South Pacific albacore tunas are sustainably harvested. Stock assessments by the International Scientific Committee for Tuna and TunaLike Species in the North Pacific Ocean (ISC) found North Pacific (NP) blue sharks, blue marlin, NP swordfish and NP
albacore are not overfished and not experiencing overfishing. However, NP striped marlin in the WCPO are overfished and experiencing overfishing, primarily due to foreign landings.
Domestic Pelagic Management: In 2022, the Council initiated a project to conduct a preliminary evaluation of seabird interaction risks in the Hawai‘i shallow-set longline fishery. The study tests the use of tori (bird scaring) lines with gear setting starting at dusk, instead of the current requirements to start setting one hour after sunset, use bluedyed bait and strategically discharge offal. The alternative methods are intended to maintain effectiveness of seabird deterrence while providing operational flexibility during setting.


Continued on page 2
Tori lines comprise a series of streamers suspended above the water, positioned over baited hooks as the fishing gear is deployed to deter the accidental hooking or entanglement of albatross and other seabirds. The Council has worked with the commercial fishing industry since the early 2000s to minimize impacts on protected species, including seabirds.
1
Photo: IKE Solutions.
A commercial longline vessel heads out to sea from Honolulu Harbor. Hawai'i longline vessels target bigeye tuna and North Pacific swordfish, producing more than 90% and 50% of the U.S. domestic supply, respectively. Photo: Joshua DeMello.
Average Unleaded Fuel Price in Western Pacific Region
Fishery Trends in the Wake of COVID-19: During 2020 and 2021, the COVID-19 pandemic caused numerous direct and indirect impacts to fisheries and related industries. Most National Marine Fisheries Service (NMFS) field surveys were canceled, and pandemic-related restrictions and logistical issues resulted in reduced observer coverage in the region’s longline fisheries. In 2022, the region’s fisheries began returning to normalcy, with field surveys reinitiating, observer coverage returning to more typical levels and fisheries data collection resuming in pre-pandemic fashion. Operations of local fisheries were no longer hampered to the same extent by government imposed pandemicrelated limitations, although reported difficulties in staffing fishing crews and crowded fishing access points continued. Indirectly, there have been rebounds associated with alleviated restrictions on tourism, travel, gatherings and commerce.
Fishing Costs: A factor impacting fishing behavior in 2022 was the increase in fuel prices. All island areas experienced high fuel costs, ranging from ~$5-6/gallon on average. In parts of the CNMI, fishers reported unleaded fuel costs reaching well over $8/gallon, with diesel prices from

$9-10/gallon. Fishers frequently waited for good conditions or for information about favorable fishing conditions or areas from others, at times leading to less fishing than normal.
Fisher Observations: Stemming from initial investigations into impacts from the COVID-19 pandemic, the Council partnered with the NMFS Pacific Islands Fisheries Science Center (PIFSC) to document empirical, “on-the-water” fisher observations to supplement current fisheries data with traditional, local ecological knowledge. In 2022, these efforts continued and have been refined to collect this information from fishers in a standardized manner. While scientific fisheries data can be used to verify fisher observations, frequently the observations also provide meaningful context to fishery-dependent data streams.
Environmental Changes: Greenhouse gases in the atmosphere continued increasing exponentially and sea surface temperatures in the waters around the U.S. Pacific Islands persisted in their warming trend in 2022, further emphasizing climate change impacts. In most areas of the Pacific, tropical cyclone activity was below average.
2 CNMI Guam Hawai‘i American
Price ($/gallon) Year
Samoa
Credit: PIFSC, with data from the Hawai’i Department of Business, Economic Development and Tourism.
Summary of 2022 Fishery Performance for

Hawai‘i, American Samoa, the CNMI and Guam
Trends compare 2022 performance against 2020 and 2021. Data differences between this report and previous publications could be explained by the way the data are extrapolated or adjustments made to improve accuracy. Green text indicates the interannual value increased 25% or more from the preceding year and red text indicates the value decreased 25% or more. Some data cannot be reported because of confidentiality concerns.
Hawai‘i
Fishery performance was mixed across Hawai‘i fisheries, with no clear trends when considering all fishing sectors. Local fisheries continued rebounding from pandemic impacts as restrictions on tourism and fishing operations were removed, but deepset longline fishery performance in 2022 was slightly reduced compared to the previous year. Conversely, the shallow-set longline fishery landings increased by ~800,000 pounds, and ex-vessel revenue increased to a greater extent by approximately $4.5 million due to elevated average prices for swordfish.

Swordfish for sale at the Honolulu Fish Auction. In 2004, the Council pioneered the use of large circle hooks and fish bait (instead of squid) to reduce incidental interactions with sea turtles in the Hawai’i shallow-set longline fishery that targets swordfish. The measures reduced interactions by nearly 90%.

3
Hawai‘i (continued)
Consistent with recommendations from the Council, in 2022 NMFS finalized a rule to prohibit the use of wire leaders in the Hawai‘i deepset longline fishery and require the removal of fishing gear from any oceanic whitetip shark caught to increase its post-hooking survival. In the two prior years, the Honolulu-based longline fisheries had voluntarily begun the transition from wire leaders to monofilament leaders due to considerations associated with the survivorship of this species.

In November 2022, the Council organized the first in a series of longline fishery management workshops to help negotiate a tropical tuna and management measure under the WCPFC that would allow an increased catch limit for the Hawai‘i-based fleet. There is an opportunity for an increase given that the tuna stocks are healthy and the U.S. fishery has the highest level of compliance and monitoring.
Pelagic Revenue by Species

4
Top: Hawai’i’s unique geography and oceanic conditions create a prime environment for catching yellowfin tuna or ‘ahi. Photo: Gil Kuali’i.
Right: Prohibiting wire leaders in the Hawaiʻi deep-set longline fishery is estimated to increase the survival of threatened oceanic whitetip sharks by more than 30%.
Pelagic (commercial) 2020 2021 2022 • Licenses 1,709 1,871 9% 1,873 0% • Deep-Set Longline Vessels 146 146 0% 147 1% • Deep-Set Trips 1,643 1,689 3% 1,531 9% • Shallow-Set Longline Vessels 14 17 21% 22 29% • Shallow-Set Trips 36 57 58% 69 21% • Landings (millions of pounds) 30.4 31.0 2% 29.6 5% Other Pelagics 5 8 5 Other PMUS* 7,098 12,156 10,723 Billfish 5,695 11,105 15,720 Tuna 70,615 109,814 103,394 *Pelagic management unit species
Photo: Andy Mann.
Revenue (thousand dollars) 0 20,000 40,000 60,000 80,000 100,000 120,000 140,000 202020212022 2021 Total = 1,871 2022 Total = 1,873 32% 18% 50% 31% 18% 51% Primary Fishing Method and Gear of Hawai'i Pelagic Fishermen Licensed in 2021 & 2022 Longline Troll Handline
Hawai‘i (continued)
Bottomfish restricted fishing areas in State waters opened in February. Fishers noted slow catches leading to a relative scarcity in the market for portions of the year, and those in West Hawai‘i noted abnormal currents were still impacting typical fish aggregations. Commercial fishing data from the State of Hawai‘i indicate an increase in active fishers, fishing trips, and landings of Deep 7 bottomfish species compared to the previous three years. However, catch and effort statistics were still lower than 10- and 20-year averages by ~12 to 19% amid a relative decline since 2014. The minor increases in catch and effort indicate that there may still be limiting factors associated with competing fisheries, decreased highliner activity and overall declining commercial participation. Conversely, commercial fishing data for uku (gray snapper) showed a slight decline in fishing trips and catches for the species compared to last year, and 2022 statistics were 28 to 41% lower than historical trends. This may be attributable to short-term impacts of competing fisheries, frustrations stemming from shark depredation and the long-term impacts of an aging fleet struggling to find replacement highliners.
Uku catches boomed when it was determined overfishing was occurring the Main Hawaiian Islands Deep 7 bottomfish fishery in the late 2000s. Since then, uku has increased in prominence in restaurants and homes.
Also driving uku catches up in the MHI was the establishment of the Marine National Monument in the Northwestern Hawaiian Islands, which closed the bottomfish fishery in the area that produced about half of the annual uku landings in Hawai’i.
Commercial and non-commercial fishers sometimes describe uku as a “gateway fish” – one that lures people into the world of fishing because it is relatively easy to catch, a challenge to reel in, and delicious to eat.

5
Uku Catch Landings (pounds) 0 10,000 20,000 30,000 40,000 50,000 60,000 70,000 2020 2021 2022 48,038 60,363 52,966 Uku (commercial) 2020 2021 2022 • Licenses 253 233 8% 234 0% • Fishing Trips 1,031 1,006 2% 894 11% • Fish Caught (# of individuals) 5,952 7,440 25% 6,723 10% • Deep-Sea Handline Landings 26,454 38,004 44% 35,170 7% (pounds) • Revenue (dollars) 181,116 311,246 72% 341,529 10%
Photo: Jeremy Martins.
Deep
Onaga (longtail red snapper) are caught primarily with the vertical hook-and-line method, where weighted and baited lines are lowered and raised with electric, hydraulic or hand-powered reels. It is seen as a good luck fish and is served at weddings and New Year celebrations in the Hawaiian Islands.

Deep 7 Bottomfish Catch by Species
Note: Totals don’t include confidential data from the inshore handline gear type.
Council staff “talk story” on the Go Fish! radio show with Mike Buck on important fishery issues. Community outreach is integral to everything the Council does.

*top 3 ECS caught are ranked according to 2022 values •
(mackerel scad, Decapterus macarellus) (pounds)
o
6
2020 2021 2022 • Licenses 334 320 4% 379 18% • Fishing Trips 1,843 2,092 14% 2,115 1% • Fish Caught (# of individuals) 45,903 52,050 13% 57,775 11% • Landings (pounds) 161,713 164,171 2% 189,093 15% • Deep-Sea Handline 159,501 160,012 0% 185,440 16% Landings (pounds) • Revenue (dollars) 1,147,410 1,218,739 6% 1,631,151 34% Gindai 5,123 5,647 5,935 Hapu‘upu‘u 5,602 4,065 4,458 Lehi 8,765 9,434 7,174 Kalekale 11,041 11,170 11,787 Ehu 25,005 29,286 31,701 Onaga 41,436 45,358 47,507 ‘Ōpakapaka 6 4,663 59,128 80,331
7 Bottomfish (commercial)
Landings (pounds) 0 20,000 40,000 60,000 80,000 100,000 120,000 140,000 160,000 180,000 200,000
Photo: Joshua DeMello.
2020 2021 2022
Ecosystem Component Species (ECS) (commercial)
Total Pounds Caught for Top 10 Harvested 560,221 496,137 11% 538,869 9% o Top Caught ECS - akule 268,290 231,700 14% 243,382 5% (bigeye scad, Selar crumenophthalmus) (pounds) o Second Most Caught ECS - ‘Ōpelu 70,990 83,171 17% 70,417 15%
Third Most Caught ECS - ta‘ape (pounds) 30,937 24,188 22% 65,451 171% • Total Pounds Sold for Top 10 Harvested ECS 505,044 459,506 9% 478,726 4% • Total Revenue for Top 10 Harvested ECS (dollars) 1,809,225 1,686,786 7% 1,847,202 10% 2020 20212022
Crab
2020 2021 2022 • Licenses 12 18 50% 19 6% • Fishing Trips 60 69 15% 53 23% • Crabs Caught (# of individuals) 3,190 2,688 16% 1,941 28% • Landings (pounds) 4,265 3,946 7% 2,533 36% • Crustaceans Total Revenue 26,795 25,881 3% 47,626 84% (Crab + Shrimp) (dollars)
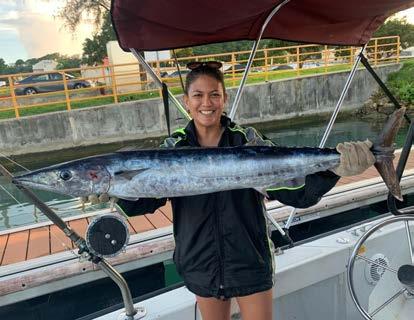
Photo: Capt. Amanda Padilla/Kapa Sungear.
Kona
(commercial)
Hawai‘i (continued)
American Samoa

Fishers in American Samoa were still dealing with pandemic-related lockdowns and mandates at the beginning of the year. Many people reported associated effects from the slow rollout of pandemic relief funding under the CARES Act. Fishers also reported difficulties related to fish spoilage because of the lack of available ice, and aging infrastructure like the marina and boat ramps. Despite these hardships, fisher observations suggested 2022 was a relatively good fishing year, especially for pelagic species such as yellowfin tuna and mahimahi. Available 2022 pelagic species data agree with fisher observations. While there was a decrease in total longline sets and a decrease in the total estimated number of pelagic trolling trips, total pelagic landings generally increased. This increase was primarily driven by the good fishing year for albacore, the primary target of the American Samoa longline fishery, with a 28% increase in catch and 59% increase in catch per unit effort. Catches of mahimahi and blue marlin also had notable increases.
Larger purse seine and longline fishing vessels (shown offloading their catch on right), and smaller traditional double hulled catamarans called alia (above) supply tuna to the StarKist Samoa cannery. One of the principle tuna canneries in the world, StarKist is American Samoa’s largest private employer and can process up to two million cans per day.


7
The American Samoa-based longline fishery targets albacore tuna (in photo) and also catches bigeye, skipjack and yellowfin.
Photo: Clay Archambault.
Pelagic (commercial) 2020 2021 2022 • Active Longline Vessels 11 11 0% 11 0% • Longline Trips 90 40 56% 42 5% • Longline Sets 1,322 1,552 17% 1,219 21% • Active Trolling Vessels 8 5 38% 9 80% • Trolling Trips 128 101 21% 50 50% • Revenue from Trolling (dollars) 9,869 n.d. n.d. 10-yr avg = 4.2 Pelagic Catch Landings (million pounds) 202020212022 0 1 2 3 4 5 2 2.7 3 Pelagic Revenue from
Revenue (million dollars) 202020212022 0 1 2 3 4 5 2.7 3.5 3.8
Photos: Nate Ilaoa (above) and Amy Vandehey (right).
Longline Vessels
American Samoa (continued)
The American Samoa bottomfish fishery continued to operate at low levels in 2022 with total estimated landings slightly above 2021 levels, but greatly reduced from prior years and historical averages. This is part of a decreasing trend in fishery catches since 2015. The American Samoa 11-species bottomfish complex was identified as overfished and experiencing overfishing according to a 2019 NMFS assessment, leading to a relatively low annual catch limit (ACL) of 5,000 pounds as part of a fishery rebuilding plan. However, a more recent stock assessment on each of the individual species concluded that they are being harvested sustainably. Again in 2022, commercial bottomfish data were confidential due to a relative lack of reporting from local vendors. This aligns with observations from fishers that there were very few local bottomfish in the markets, and most bottomfish sold in stores were from Samoa. Some community members reported relying more heavily on roadside sales than buying at the markets.

Bottomfish
King tides severely impacted coastal roads on the island of Tutuila in July 2022. Infrastructure in American Samoa is extremely vulnerable to sea level rise due to the steep terrain of its islands and relatively narrow coastlines. The Council has worked with NMFS to develop a Pacific Islands Regional Action Plan that identifies steps to promote climate resilient fisheries. Photo: Felix Penalosa.

Estimated Bottomfish Catch from Shore and Boats
The bottomfish fishery primarily targets a complex of 11 species including emperors, snappers, groupers and jacks. Most (85%) bottomfish habitat is in territorial waters (from the shoreline to 3 nautical miles offshore), with the rest in federal waters (from 3 to 200 nm offshore). Photo: Amy Vandehey.
8
(commercial and non-commercial) 2020 2021 2022 • Commercial Landings (pounds) 336 n.d. n.d. • Vessels 7 3 57% 5 67% • Commercial Revenue (dollars) 1,395 n.d. n.d.
Landings (pounds) 0 2,000 4,000 6,000 8,000 10,000 12,000 14,000
7,697 2,063 2,583 10-yr avg = 11,576 20-yr avg = 13,118
American Samoa (continued)
Ecosystem Component Species (ECS) (commercial)
caught are ranked according to 2022 values
CNMI
There was a strong run for atulai (bigeye scad), and Saipan-based fishers noted high numbers of ti’ao (juvenile goatfish) and mañahak (juvenile rabbitfish) being caught with talaya (throw nets). Fishers also reported continued challenging market conditions exacerbated by high fuel costs, but some were able to sell their catch door-to-door.


After a substantial increase of 64% in total estimated bottomfish landings in 2021, there was a subsequent decrease in catch and associated revenues in 2022 back to levels observed in 2020. Pelagic landings follow a similar pattern. The decreases in the troll fishery were from reduced catches of skipjack and yellowfin tuna, which was also seen in Guam in 2022. However, this reduction was lessened because of increases in catch for mahimahi
wahoo.

9
and
An excellent sport fish, mahimahi are commonly caught around fish aggregating devices.
Photo: Shutterstock.
2020 2021 2022
3 ECS
• Total Pounds Caught/Sold for Top 10 Harvested ECS 23,229 12,229 47% 3,087 75% o Top Caught ECS - blue-banded surgeonfish (Acanthurus lineatus) (pounds) 4,822 4,372 9% 1,089 75% o Second Most Caught ECS - spotted reef crab (pounds) - - 434 o Third Most Caught ECS - parrotfishes (pounds) 1,792 2,000 12% 427 79% • Total Revenue for Top 10 Harvested ECS (dollars) 45,666 27,702 39% 12,310 56%
*top
Left: Fuamai Tago cleans a batch of coral plugs for a restoration project. Tago is fulfilling her work commitment with the Department of Marine and Wildlife Resources as part of the requirements for the Council’s U.S. Pacific Territories Fishery Capacity-Building Scholarship Program. Photo: Fuamai Tago.
Blue-banded surgeonfish. Photo: Gaell Mainguy/iNaturalist.
CNMI (continued)

Despite the decrease in landings for both the bottomfish and pelagic fisheries, revenue did not decline to the same extent due to an increase in average fish prices for both bottomfish and pelagic species. It is notable that revenue values in 2021 were at a historical high, perhaps associated with a rebound in fishing after the COVID-19 pandemic and related restrictions hampered not only fishing but the typical avenues by which fishers would sell their catch. An increase in commercial reporting was linked to a recently implemented regulation requiring fish dealers and vendors to report their sales.

10 Pelagic 2020 2021 2022 (commercial and non-commercial) • Active Commercial Fishers 73 83 14% 92 11% • Commercial Fishing Trips 1,325 2,132 61% 1,789 16% • Trolling Hours 20,631 17,460 15% 14,427 17% • Commercial Revenue (dollars) 369,819 776,625 110% 721,579 7%
Estimated Pelagic Trolling Trips Number of Trips
The Council has been a longtime supporter of fishing community events like the annual Saipan International Fishing Tournament organized by the Saipan Fishermen’s Association.
Photo: Floyd Masga.
The Council shares outreach resources with local fish vendors in the CNMI such as traditional annual lunar calendars and fish species identification guides.
Photo: Floyd Masga.
0 500 1,000 1,500 2,000 2,500 3,000 3,500 4,000 4,500 202020212022 4,193 3,072 2,973
Landings (pounds) 202020212022 10-yr avg 365,025 0 50,000 100,000 150,000 200,000 250,000 300,000 350,000 400,000 450,000 305,252 388,492 237,440
Estimated Pelagic Catch
CNMI (continued)
The Council partners with the nonprofit organization Tasi to Table to build capacity for sustainable fishing practices. High school students organize and lead a few fishing tournaments each year, among other activities.


Ecosystem Component Species (ECS) (commercial)
*top 3 ECS caught are ranked according to 2022 values •
11
Bottomfish (commercial and non-commercial) 2020 2021 2022 • Commercial Landings (pounds) 20,071 38,946 94% 32,161 17% • Vessels 27 58 115% 20 66% Estimated Bottomfish Catch from Shore and Boats Landings (pounds) 0 10,000 20,000 30,000 40,000 50,000 60,000 70,000 80,000
Photos: Floyd Masga.
Left: Atulai is an important fish in the local diet and culture of the Mariana Islands.
Photo: Sea Kangaroo/iNaturalist.
2020 2021 2022
Total Pounds Caught/Sold for Top 10 Harvested ECS 38,167 66,754 75% 67,301 1% o Top Caught ECS - atulai (bigeye scad) (pounds) - 3,456 20,295 487% o Second Most Caught ECS - misc. parrotfishes (pounds) 5,599 14,046 151% 15,342 9% o Third Most Caught ECS - misc. surgeonfishes (pounds) 7,750 10,007 29% 7,429 26% • Total Revenue for Top 10 Harvested ECS (dollars) 114,539 223,949 96% 244,011 9% 10-yr avg 33,075 20-yr avg 40,222 45,583 74,600 47,564 Bottomfish Commercial Revenue Revenue (dollars) 0 50,000 100,000 150,000 200,000 250,000 99,862 217,051 180,672
Guam
Market fish prices were relatively low caused by an excess supply of species like mahimahi, making it difficult for fishers to get fair prices and recoup their fishing trip costs. From August to September, many hook-and-line atulai fishers were fishing under the new moon. Although the atulai were abundant, heavy rains and hot sun prevented many of them from being caught.
Pelagic fisheries landings in Guam increased from 2020 to 2021 before decreasing in 2022. Similar to the CNMI, there were strong fishing years for mahimahi and wahoo that alleviated the large reductions in catch seen for yellowfin and skipjack tuna. Revenue data for the pelagic and bottomfish fisheries cannot be disclosed in 2022 because fewer than three vendors and/or dealers reported their fish sales. The Council’s Plan Teams have recommended that additional outreach be performed to capture this data. Similar to the previous year, bottomfish landings in Guam remained high in 2022, representing a nearly triple increase in total estimated catch values compared to 2020. The catch value is still under review by PIFSC scientists, as the amount surpasses the federal ACL.
According to a 2019 NMFS stock assessment, Guam bottomfish are overfished but not experiencing overfishing, likely due to the data-poor nature of the fishery. The Council developed a rebuilding plan with a 31,000-pound ACL starting in fishing year 2022 to allow the bottomfish stock to replenish in nine years.


Number of Hours
Estimated Pelagic Trolling Hours
12
Fishermen use artificial lures with a head that has holes in it called jets to create a stream of bubbles that attracts wahoo.
Photo: Amber San Gil.
Trolling for pelagic species off the Guam coast.
Photo: Felix Reyes.
(commercial and non-commercial) 2020 2021 2022 • Active Trolling Vessels 459 546 19% 449 18% • Fishing Trips 9,218 10,719 16% 9,895 18%
Right: The Council-sponsored a film showing archeological evidence for open ocean fishing dating back 3,000 years and continuing to today. “Open Ocean Fishing in the Mariana Archipelago” was screened at the Guam Museum in summer 2022. Several fishermen featured in the video shared their fishing knowledge and traditions with the audience. Photo: Felix Reyes.
Pelagic
42,000 44,000 46,000 48,000 50,000 52,000 54,000 56,000 58,000 Estimated Pelagic Catch Landings (pounds) 10-yr avg 776,023 0 100,000 200,000 300,000 400,000 500,000 600,000 700,000 800,000 900,000 1,000,000 47,516 612,672 56,373 858,372 48,297 629,837
Guam (continued)


Landings (pounds)

13
Bottomfish (commercial and non-commercial) 2020 2021 2022 • Vessels 35 55 57% 63 15% • Commercial Revenue (dollars) 45,264 24,869 45% n.d.
Bottomfish Catch
Shore
Boats
Estimated
from
and
Component Species (ECS) (commercial) 2020 2021 2022
3 ECS caught
2021 values
Total Pounds Caught/Sold for Top 10 Harvested ECS 19,687 2,952 85% n.d. o Top Caught ECS - assorted reef fishes (pounds) 8,047 914 89% n.d. o Second Most Caught ECS - mafute (misc.emperors) 5,129 547 89% n.d. (pounds)
Third Most Caught ECS - misc. groupers (pounds) 901 526 42% n.d. • Total Revenue for Top 10 Harvested ECS (dollars) 66,477 10,883 84% n.d.
outreach tables and shares recognition items for the winners. Photo: Felix Reyes.
Ecosystem
*top
are ranked according to
•
o
A future fisherwoman-in-training at the Guam ladies fishing derby.
0 10,000 20,000 30,000 40,000 50,000 60,000 10-yr avg 26,877 20-yr avg 28,437 *Total still undergoing final review 16,844 50,864
Photo: Monique Amani.
2022 ADMINISTRATIVE AND REGULATORY ACTIONS
For the Federal Register notices for these actions, go to www.federalregister.gov
Jan. 20 (87 FR 3045) Final 021-22, 2022-23 and 2023-24 annual catch limit (ACL) and accountability measure (AM) for main Hawaiian Islands (MHI) Deep 7 bottomfish. The National Marine Fisheries Service (NMFS) specified a 492,000-pound annual catch limit (ACL) for each of the three fishing years. The fishing year begins September 1 and ends August 31 of the following year. As an in-season AM, if NMFS projects that the fishery will reach the ACL in any given fishing year, NMFS will close the commercial and non-commercial sectors of the fishery for the remainder of that fishing year. As a post-season AM, if the total annual catch exceeds the limit during a fishing year, NMFS would reduce the ACL for the following fishing year by the amount of the overage. The ACL and AM support the long-term sustainability of Hawai‘i bottomfish. The rule was effective Feb. 22, 2022.
Feb. 18 (87 FR 9271) Final rule to implement Amendment 6 to the Mariana Archipelago Fishery Ecosystem Plan and the rebuilding plan for the Guam bottomfish stock complex. The rule included a 31,000-pound ACL. As an in-season AM, if NMFS projects that the fishery will reach the ACL in any given fishing year, NMFS will close the fishery for the remainder of that year. As a post-season AM, if the total annual catch exceeds the ACL during a fishing year, NMFS will close the fishery until NMFS and the Guam government implement a coordinated management regime that allows the stock to rebuild. This action was necessary to rebuild the overfished stock consistent with the requirements of the Magnuson-Stevens Fishery Conservation and Management Act (MSA) and was effective March 21, 2022. NMFS and the Council will review the rebuilding plan every two years and modify it, as necessary, per section 304(e)(7) of the MSA.
March 24 (87 FR 15383) Experimental fishing permit (EFP) for the Hawai‘i Longline Association (HLA) to evaluate the risk of seabird interactions in the Hawai‘i shallow-set longline fishery. The intent of the EFP is to conduct a preliminary evaluation of alternative methods of discouraging seabird interactions while providing operational flexibility during setting in the shallow-set longline fishery. The permit is valid until Sept. 24, 2023, or for a maximum of 80 fishing sets, whichever occurs first, unless revoked, suspended or modified.
March 28 (87 FR 17195) Final rule to implement 2022–2025 ACL of 295,419 pounds, annual catch target (ACT) of 291,010 pounds and AMs for MHI uku (gray snapper). The ACLs and ACTs apply to the total combined commercial and non-commercial catch. As an in-season AM, if NMFS projects that the total catch will reach the ACT in any given fishing year, NMFS will close commercial and non-commercial sectors of the fishery for the remainder of that fishing year. As a post-season AM, if NMFS determines that the most recent three-year average total catch exceeded the ACL in a fishing year, NMFS will reduce the ACL and ACT for the following fishing year by the amount of overage. The ACL, ACT and AMs support the longterm sustainability of Hawai‘i bottomfish. The rule was effective April 27, 2022.
April 13 (87 FR 21812) NMFS temporary specifications to extend the effective date of Western and Central Pacific Fisheries Commission (WCPFC) intersessional decisions related to the COVID-19 pandemic on purse seine observer coverage and at-sea transshipment observers.
April 28 (87 FR 25153) Final rule to prohibit use of wire leaders in the Hawai‘i deep-set longline fishery and require the removal of fishing gear from any oceanic whitetip shark caught in the region’s domestic longline fisheries. The rule is intended to increase post-hooking survival of the sharks and was effective May 31, 2022.
May 2 (87 FR 25590) Final rule for Amendment 5 to the American Samoa Archipelago Fishery Ecosystem Plan to implement a rebuilding plan for overfished bottomfish that includes a 5,000-pound ACL starting in 2022. As an in-season AM, if NMFS projects that the fishery will reach the ACL in any year, then NMFS will close the fishery for the remainder of that year. If the total annual catch exceeds the limit during a year, NMFS will close the fishery until NMFS and the American Samoa government implement a coordinated management regime to ensure that the catch is maintained at levels that allow the stock to rebuild. This action was necessary to rebuild the overfished stock consistent with the requirements of the MSA and was effective June 1, 2022. NMFS and the Council will review the rebuilding plan every two years and modify it, as necessary, per section 304(e) (7) of the MSA.
Aug. 29 (87 FR 52704) Valid specified fishing agreement that allocates up to 1,500 metric tons of 2022 bigeye tuna limit for the Territory of American Samoa to identified U.S. longline fishing vessels. The agreement, valid as of July 20, 2022, supports the longterm sustainability of fishery resources of the U.S. Pacific Islands, and fisheries development in American Samoa. The start date for attributing 2022 bigeye tuna catch to American Samoa under the agreement was Aug. 25, 2022.
Dec. 7 (87 FR 74991) Valid specified fishing agreement that allocates up to 1,500 metric tons of the 2022 bigeye tuna limit for the Commonwealth of the Northern Mariana Islands (CNMI) to identified U.S. longline fishing vessels. The agreement, valid as of July 20, 2022, supports the long-term sustainability of fishery resources of the U.S. Pacific Islands, and fisheries development in the CNMI. The start date for attributing 2022 bigeye tuna catch to the CNMI under the agreement was Nov. 21, 2022.
14
2022 PUBLICATIONS
2023 Amerika Samoa Lunar Calendar
2022. Honolulu: Western Pacific Regional Fishery Management Council. ISBN 9781-950193-23-3
2023 Eskaleran Pulan Chamorro/2023 Refaluwasch Pápáál Maram (Chamorro/ Refaluwasch Lunar Calendar). 2022. Honolulu: Western Pacific Regional Fishery Management Council. ISBN 9781-950193-22-6.
2023 Fanha’aniyan Pulan CHamoru (Chamorro Lunar Calendar). 2022. Honolulu: Western Pacific Regional Fishery Management Council. ISBN 978-1-950193-21-9
2023 Kaulana Mahina (Hawaiian Lunar Calendar). 2022. Honolulu: Western Pacific Regional Fishery Management Council.
(classroom version). ISBN 978-1-95019319-6;
(fishermen version). ISBN 978-1-95019320-2
Fougner, S, Fitchett M. July 2022. Western and Central Pacific Fisheries Commission The Second Decade: Evolution of Modern Management.
Pacific Islands Fishery Monographs No. 15. Honolulu: Western Pacific Regional Fishery Management Council. ISBN 9781-944827-66-3
Markrich M, Spalding S. 2022. U.S. Pacific Islanders and the Sea: A History of the Western Pacific Regional Fishery Management Council (1976-2020)
Honolulu: Western Pacific Regional Fishery Management Council. (hardback). ISBN 978-1-944827-80-9; (softcover). ISBN 978-1-944827-81-6; (electronic book). ISBN 978-1-94482782-3
Pacific Islands Fishery News. Winter, Spring, Summer and Fall issues.
Honolulu: Western Pacific Regional Fishery Management Council. ISSN: 2151-2329 (print); ISSN 2151-2337 (online)
The Rise of China in Pacific Tuna Fisheries (informational paper). 2022.
Honolulu: Western Pacific Regional
Fishery Management Council. ISBN 9781-950193-24-0
Western Pacific Region Status of the Fisheries 2020-21. 2022. Honolulu: Western Pacific Regional Fishery Management Council. ISBN 978-1950193-08-0
WPRFMC, 2022. Annual Stock Assessment and Fishery Evaluation (SAFE) Report for the American Samoa Archipelago Fishery Ecosystem Plan 2021. T Remington, M Sabater, M Seeley, A Ishizaki (Eds.). Honolulu: Western Pacific Regional Fishery Management Council. ISBN 978-1-950193-09-7
WPRFMC, 2022. Annual SAFE Report for the Hawai‘i Archipelago Fishery Ecosystem Plan 2021. T Remington, M Sabater, M Seeley, A Ishizaki (Eds.). Honolulu: Western Pacific Regional Fishery Management Council. ISBN 9781-950193-10-3
WPRFMC, 2022. Annual SAFE Report for the Mariana Archipelago Fishery Ecosystem Plan 2021. T Remington, M Sabater, M Seeley, A Ishizaki (Eds.). Honolulu: Western Pacific Regional Fishery Management Council. ISBN 9781-950193-11-0
WPRFMC, 2022. Annual SAFE Report for the Pacific Pelagic Fisheries Fishery Ecosystem Plan 2021. T Remington, M Fitchett, A Ishizaki, J DeMello (Eds.). Honolulu: Western Pacific Regional Fishery Management Council. ISBN: 9781-950193-12-7
WPRFMC, 2022. Annual SAFE Report for the Pacific Remote Island Areas Fishery Ecosystem Plan 2021. T Remington, M Sabater, M Seeley, A Ishizaki (Eds.). Honolulu: Western Pacific Regional Fishery Management Council. ISBN 978-1-950193-13-4
2022 COUNCIL AND ADVISORY BODY MEETINGS
Western Pacific Regional Fishery Management Council (chair Archie Taotasi Soliai):
190th meeting, March 21-24, virtual; 191st meeting, June 20-23, Honolulu; 192nd meeting, Sept. 19-22, virtual; 193rd meeting, Dec. 5-8, Honolulu
-include standing committee mtg dates Scientific and Statistical Committee (chair James Lynch):
143rd meeting, March 15-17, virtual; 144th meeting, June 14-16, Honolulu; 145th meeting, Sept. 13-15, Honolulu; 146th meeting, Nov. 29-30, virtual Advisory Panel (chair Clay Tam)
• American Samoa (chair Nathan Ilaoa): March 8, June 7, Sept. 6
• Hawai‘i (chair Gil Kuali‘i): March 11, June 10, Aug. 18, Nov. 22
• Marianas Joint (chairs Richard Farrell and Kenneth Borja): March 9, June 9, Sept. 7, CNMI; March 9, June 8, Sept. 7, Guam
Plan Teams: Archipelagic (chair T. Todd Jones): Feb. 22, virtual; Apr. 19-21, virtual; Pelagic (chair Don Kobayashi): May 3-5, virtual
Education Committee (chair Craig Severance): Education Committee
Subgroup: May 26, virtual
Fishery Data Collection and Research Committee (no chair): June 16, Honolulu
Fishery Data Collection and Research Committee—Technical Committee (no chair): April 27-28, virtual
Fishery Data Collection and Research Committee—Technical Committee: Data Collection Subpanel: no meeting
Fishing Industry Advisory Committee (no chair): March 10, virtual; June 6, virtual; Sept. 6, virtual
Hawai‘i Bottomfish Advisory Review Board (no chair): no meeting
Non-Commercial Fisheries Advisory Committee (no chair): June 9, virtual; Sept. 8, virtual
Protected Species Advisory Committee (no chair): no meeting
Regional Ecosystem Advisory Committee
• American Samoa (chair Archie Soliai): no meeting
15
• CNMI (chair John Gourley): no meeting
• Guam (chair Manuel Dueñas): no meeting
• Hawai‘i (chair Roger Dang): no meeting
Social Science Planning Committee (Chair Craig Severance): April 14, virtual
2022 WORKSHOPS AND EVENTS
Hawai‘i Pelagic Small-boat Fisheries Public Scoping Meetings, Feb. 5-11, Kaua‘i, Maui, Hawai‘i Island
Western Pacific Stock Assessment Review (WPSAR) 2020 Benchmark Stock Assessments for Hawai‘i Gray Jobfish (Uku) Meeting, Feb. 24-28, Honolulu
Fishers Forum—Hawai‘i Pelagic Fisheries, March 10, Honolulu
WPSAR Steering Committee Meeting, April 30, virtual
Council Coordination Committee Meeting, May 27-28, virtual
Hawai‘i Small-Boat Fisheries Management Virtual Scoping Meeting, Aug. 27, virtual
Council Coordination Committee Meeting, Sept. 23-24, virtual
WPSAR 2020 Stock Assessment Update for Seven Deep-Water Bottomfish Species in the Main Hawaiian Islands, Dec. 16-17, virtual
2022 WORKSHOPS AND EVENTS
Western Pacific Stock Assessment Review (WPSAR) Steering Committee, April 26, virtual
WPSAR for Level 1 & 2 EFH Models for the Main Hawaiian Islands Uku (Aprion virescens), July 12-14, Honolulu
Public meetings to review fishing regulations for the Northwestern Hawaiian Islands Monument Expansion Area, Nov. 1, Kaua‘i; Nov. 3, Maui; Nov. 4, Hilo, Hawai‘i Island; Nov. 5, KailuaKona, Hawai‘i Island; Nov. 8, Molokai; Nov. 10, O‘ahu
2022 COUNCIL MEMBERS
Secretary of Commerce appointees from nominees selected by American Samoa, CNMI, Guam and Hawai‘i governors: Archie Soliai, Department of Marine and Wildlife Resources (DMWR) (American Samoa) (chair); Monique Amani, business owner (Guam); Roger Dang, Fresh Island Fish Co. (Hawai‘i) (vice chair); Manuel Dueñas II, Guam Fishermen’s Cooperative Association (Guam) (vice chair); Howard Dunham, commercial fisherman (American Samoa) (January-August); John Gourley, Micronesian Environmental Services (CNMI) (vice chair); Judith Guthertz, University of Guam (Guam) (August-December); Shaelene Kamaka‘ala, Hawaiian Islands Land Trust (Hawai‘i) (August-December); Matthew Ramsey, Conservation International (Hawai‘i); McGrew Rice, charter boat captain (CNMI); William Sword, Pacific Energy South-West Pacific Ltd. (American Samoa) (vice chair)
Designated state officials: Anthony Benavente, CNMI Department of Lands and Natural Resources; Suzanne Case, Hawai‘i Department of Land and Natural Resources; Chelsa Muña-Brecht, Guam Department of Agriculture; Archie Soliai, American Samoa DMWR
Designated federal official (voting): Michael Tosatto, NMFS Pacific Islands Regional Office (January–August); Sarah Malloy, (acting) (August–December)
Designated federal officials (nonvoting): Charles Brinkman, U.S. Department of State; Brian Peck, U.S. Fish and Wildlife Service; RADM Matthew A. Sibley (January–August), RADM Mike Day, U.S. Coast Guard 14th District (August–December)
2022 COUNCIL STAFF
Kitty Simonds, executive director; Loren Bullard, technical assistant; Maria Carnevale, National Environmental Policy Act coordinator; Joshua DeMello, fisheries analyst, data coordinator, aquaculture specialist; Mark Fitchett,
pelagic fisheries ecosystem scientist; Elysia Granger, administrative officer; Bella Hirayama, travel and administrative clerk; Randy Holmen, fiscal officer; Asuka Ishizaki, protected species coordinator; Diana Kitiona, American Samoa island coordinator; Floyd Masga, CNMI island coordinator; Mark Mitsuyasu, insular program officer; Felix Reyes, Guam island coordinator; Marlowe Sabater, marine ecosystem scientist; Matthew Seeley, ecosystem fishery specialist; Amy Vandehey, education and outreach coordinator; and Zach Yamada, fisheries analyst
2022 US PACIFIC TERRITORIES FISHERY CAPACITY-BUILDING SCHOLARSHIP RECIPIENTS
Katelynn Delos Reyes (CNMI–attending Hawai‘i Pacific University); Jude Lizama (CNMI–attending University of Guam); and Leilani Sablan (Guam–attending University of Guam graduate school)
Connect with the Council on social media
@wpcouncil @wp_council
@wpcouncil wpcouncil
Western Pacific Regional Fishery Management Council
ternional
Western Pacific Regional Fishery Management Council

1164 Bishop Street, Suite 1400
Honolulu, Hawai‘i 96813 USA
ISBN 978-1-950193-34-9
Published in the United States by the Western Pacific Regional Fishery Management Council under NOAA Award NA20NMF4410013.
16