Setting the new world record of deep-water oil in 1999 Designing of a new concept of building floating platforms on a single column in 2005 Presalt discoveries in 2007.
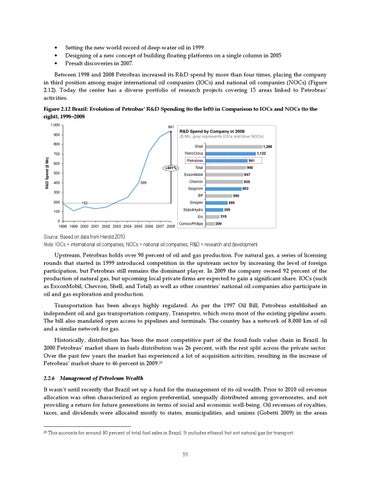
Between 1998 and 2008 Petrobras increased its R&D spend by more than four times, placing the company in third position among major international oil companies (IOCs) and national oil companies (NOCs) (Figure 2.12). Today the center has a diverse portfolio of research projects covering 15 areas linked to Petrobras’ activities. Figure 2.12 Brazil: Evolution of Petrobas’ R&D Spending (to the left) in Comparison to IOCs and NOCs (to the right), 1998–2008 1,000
941
R&D Spend by Company in 2008 ($ Mn, grey represents IOCs and blue NOCs)
900 800
Shell
R&D Spend ($ Mn)
1,266 1,122
PetroChina
700
Petrobras
600
941
Total
+401%
900
500
ExxonMobil
847
400
Chevron
835
399
803
Gazprom
300 200
BP Sinopec
152
100
495
StatoilHydro Eni
0 1998 1999 2000 2001 2002 2003 2004 2005 2006 2007 2008
595
ConocoPhillips
395 318 209
Source: Based on data from Herold 2010. Note: IOCs = international oil companies; NOCs = national oil companies; R&D = research and development.
Upstream, Petrobras holds over 90 percent of oil and gas production. For natural gas, a series of licensing rounds that started in 1999 introduced competition in the upstream sector by increasing the level of foreign participation, but Petrobras still remains the dominant player. In 2009 the company owned 92 percent of the production of natural gas, but upcoming local private firms are expected to gain a significant share. IOCs (such as ExxonMobil, Chevron, Shell, and Total) as well as other countries’ national oil companies also participate in oil and gas exploration and production. Transportation has been always highly regulated. As per the 1997 Oil Bill, Petrobras established an independent oil and gas transportation company, Transpetro, which owns most of the existing pipeline assets. The bill also mandated open access to pipelines and terminals. The country has a network of 8,000 km of oil and a similar network for gas. Historically, distribution has been the most competitive part of the fossil-fuels value chain in Brazil. In 2000 Petrobras’ market share in fuels distribution was 26 percent, with the rest split across the private sector. Over the past few years the market has experienced a lot of acquisition activities, resulting in the increase of Petrobras’ market share to 46 percent in 2009.23 2.2.6 Management of Petroleum Wealth
It wasn’t until recently that Brazil set up a fund for the management of its oil wealth. Prior to 2010 oil revenue allocation was often characterized as region preferential, unequally distributed among governorates, and not providing a return for future generations in terms of social and economic well-being. Oil revenues of royalties, taxes, and dividends were allocated mostly to states, municipalities, and unions (Gobetti 2009) in the areas
23
This accounts for around 80 percent of total fuel sales in Brazil. It includes ethanol but not natural gas for transport.
53