Figure 1.4 Governanced Indicators in Angola Compared to the OECD Average Voice and Accountability 100 80
Political Stability/Absence of Violence
60
Control of Corruption
40 20
Angola 2010
0
Angola 2000 OECD 2010 Government Effectiveness
Rule of Law
Regulatory Quality
Source: Adapted from Kaufmann, Kraay, and Mastruzzi 2011.
1.2 The Petroleum Sector 1.2.1 The Petroleum Sector in the Economy
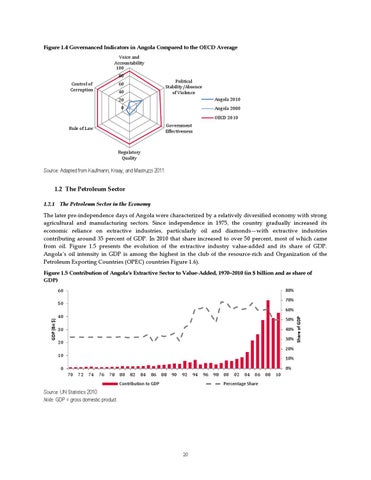
The later pre-independence days of Angola were characterized by a relatively diversified economy with strong agricultural and manufacturing sectors. Since independence in 1975, the country gradually increased its economic reliance on extractive industries, particularly oil and diamonds—with extractive industries contributing around 35 percent of GDP. In 2010 that share increased to over 50 percent, most of which came from oil. Figure 1.5 presents the evolution of the extractive industry value-added and its share of GDP. Angola’s oil intensity in GDP is among the highest in the club of the resource-rich and Organization of the Petroleum Exporting Countries (OPEC) countries Figure 1.6). Figure 1.5 Contribution of Angola’s Extractive Sector to Value-Added, 1970–2010 (in $ billion and as share of GDP) 60
80% 70%
50
50%
30
40% 30%
20
20% 10
10%
0
0% 70
72
74
76
78
80
82
84
86
88
90
92
Contribution to GDP
94
96
98
00
02
04
06
Percentage Share
Source: UN Statistics 2010. Note: GDP = gross domestic product.
20
08
10
Share of GDP
GDP (Bn $)
60% 40
