reserves and ranking fourth largest amongst the Asia-Pacific countries (BP 2011). The current gas reserves are at almost the same levels as of 1996. Under current production rates, oil and gas reserves are expected to last for 28 and 39 years, respectively. Overall, maintaining the reserve base has been a key pillar in Malaysia’s oil and gas sectoral policy, which is centered on ensuring long-term supply security while providing affordable fuel to the growing population and consumption (EIA 2011). Table 5.5 provides a snapshot of the oil and gas industry in Malaysia. Table 5.5 Snapshot of the Oil and Gas Industry in Malaysia (2010) % Change 2011 Oil proved reserves, billion bbl Oil production, mmbpd Oil consumption, mmbpd Gas proved reserves, tcf Gas production, bcfd Gas consumption, bcfd Primary energy consumption, million toe
5.9 573.0 608.3 86.0 6.0 2.8 69.2
% of world 0.4% 0.7% 0.7% 1.2% 1.9% 0.9% 0.6%
Global rank 23 46 29 15 45 27 31
1 yr
3 yrs
5 yrs
10 yrs
0.0% -10.9% 0.7% 0.0% -1.3% -10.5% -2.1%
0.0% -13.0% 2.6% 1.6% -3.6% -15.3% 0.3%
7.3% -16.1% 2.1% 2.2% -4.3% -14.7% 2.3%
29.1% -17.9% 17.0% -3.4% 27.9% 9.0% 32.6%
Source: Based on data from BP 2012. Note: bbl = barrels; bcfd = billion cubic feet per day; boe = barrel of oil equivalent; mmbpd = million barrels per day; tcf = trillion cubic feet; toe = tons of oil equivalent.
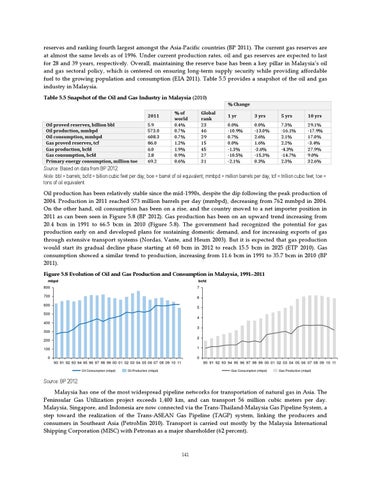
Oil production has been relatively stable since the mid-1990s, despite the dip following the peak production of 2004. Production in 2011 reached 573 million barrels per day (mmbpd), decreasing from 762 mmbpd in 2004. On the other hand, oil consumption has been on a rise, and the country moved to a net importer position in 2011 as can been seen in Figure 5.8 (BP 2012). Gas production has been on an upward trend increasing from 20.4 bcm in 1991 to 66.5 bcm in 2010 (Figure 5.8). The government had recognized the potential for gas production early on and developed plans for sustaining domestic demand, and for increasing exports of gas through extensive transport systems (Nordas, Vante, and Heum 2003). But it is expected that gas production would start its gradual decline phase starting at 60 bcm in 2012 to reach 15.5 bcm in 2025 (ETP 2010). Gas consumption showed a similar trend to production, increasing from 11.6 bcm in 1991 to 35.7 bcm in 2010 (BP 2011). Figure 5.8 Evolution of Oil and Gas Production and Consumption in Malaysia, 1991ď€2011 mbpd
bcfd
800
7
700
6
600
5
500 4 400 3 300 2
200
1
100 0
0
90 91 92 93 94 95 96 97 98 99 00 01 02 03 04 05 06 07 08 09 10 11 Oil Consumption (mbpd)
90 91 92 93 94 95 96 97 98 99 00 01 02 03 04 05 06 07 08 09 10 11
Oil Production (mbpd)
Gas Consumption (mbpd)
Gas Production (mbpd)
Source: BP 2012.
Malaysia has one of the most widespread pipeline networks for transportation of natural gas in Asia. The Peninsular Gas Utilization project exceeds 1,400 km, and can transport 56 million cubic meters per day. Malaysia, Singapore, and Indonesia are now connected via the Trans-Thailand-Malaysia Gas Pipeline System, a step toward the realization of the Trans-ASEAN Gas Pipeline (TAGP) system, linking the producers and consumers in Southeast Asia (PetroMin 2010). Transport is carried out mostly by the Malaysia International Shipping Corporation (MISC) with Petronas as a major shareholder (62 percent).
141