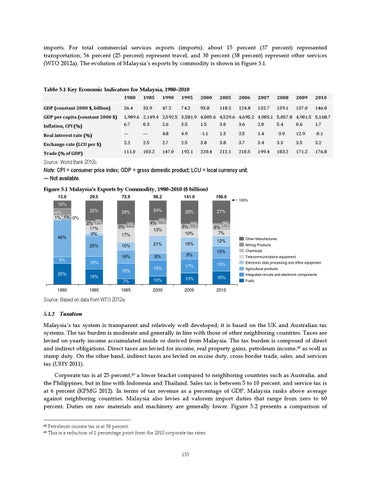
imports. For total commercial services exports (imports), about 15 percent (37 percent) represented transportation, 56 percent (25 percent) represent travel, and 30 percent (38 percent) represent other services (WTO 2012a). The evolution of Malaysia’s exports by commodity is shown in Figure 5.1.
Table 5.1 Key Economic Indicators for Malaysia, 1980–2010 1980
1985
1990
1995
2000
2005
2006
2007
2008
2009
2010
GDP (constant 2000 $, billion)
26.4
33.9
47.2
74.2
93.8
118.2
124.8
132.7
139.1
137.0
146.8
GDP per capita (constant 2000 $)
1,909.6 2,149.4 2,592.5 3,581.9 4,005.6 4,529.6 4,695.2 4,905.1 5,057.8 4,901.5 5,168.7
Inflation, CPI (%)
6.7
0.3
2.6
3.5
1.5
3.0
3.6
2.0
5.4
0.6
1.7
Real interest rate (%)
—
—
4.8
4.9
-1.1
1.3
2.5
1.4
-3.9
12.9
-0.1
Exchange rate (LCU per $)
2.2
2.5
2.7
2.5
3.8
3.8
3.7
3.4
3.3
3.5
3.2
Trade (% of GDP)
111.0
103.2
147.0
192.1
220.4
212.1
210.5
199.4
183.2
171.2
176.8
Source: World Bank 2012c.
Note: CPI = consumer price index; GDP = gross domestic product; LCU = local currency unit. — Not available. Figure 5.1 Malaysia’s Exports by Commodity, 1980–2010 ($ billion) 13.0
29.5
73.9
98.2
141.0
198.6
25%
29%
24%
28%
27%
13%
1% 5% 10%
2% 6% 7%
21%
16%
100%
10% 10% 1% 1% 0%
46%
2% 2% 11% 2% 25%
8%
25%
1980
3% 1%
4% 1%
17% 10% 16%
8%
15%
Chemicals Telecommunications equipment
19%
17%
7%
10%
13%
16%
1995
2000
2005
2010
18%
Other Manufactures Mining Products
15%
15%
18%
1990
9%
12%
Electronic data processing and office equipment Agricultural products Integrated circuits and electronic components Fuels
Source: Based on data from WTO 2012a. 5.1.2 Taxation
Malaysia’s tax system is transparent and relatively well developed; it is based on the UK and Australian tax systems. The tax burden is moderate and generally in line with those of other neighboring countries. Taxes are levied on yearly income accumulated inside or derived from Malaysia. The tax burden is composed of direct and indirect obligations. Direct taxes are levied for income, real property gains, petroleum income,68 as well as stamp duty. On the other hand, indirect taxes are levied on excise duty, cross-border trade, sales, and services tax (UHY 2011). Corporate tax is at 25 percent,69 a lower bracket compared to neighboring countries such as Australia, and the Philippines, but in line with Indonesia and Thailand. Sales tax is between 5 to 10 percent, and service tax is at 6 percent (KPMG 2012). In terms of tax revenue as a percentage of GDP, Malaysia ranks above average against neighboring countries. Malaysia also levies ad valorem import duties that range from zero to 60 percent. Duties on raw materials and machinery are generally lower. Figure 5.2 presents a comparison of
68 69
Petroleum income tax is at 38 percent. This is a reduction of 1 percentage point from the 2010 corporate tax rates.
133