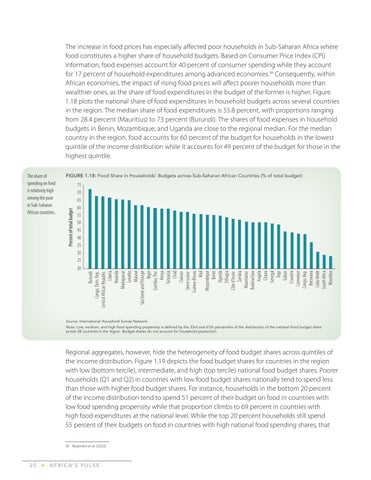
The increase in food prices has especially affected poor households in Sub-Saharan Africa where food constitutes a higher share of household budgets. Based on Consumer Price Index (CPI) information, food expenses account for 40 percent of consumer spending while they account for 17 percent of household expenditures among advanced economies.36 Consequently, within African economies, the impact of rising food prices will affect poorer households more than wealthier ones, as the share of food expenditures in the budget of the former is higher. Figure 1.18 plots the national share of food expenditures in household budgets across several countries in the region. The median share of food expenditures is 55.8 percent, with proportions ranging from 28.4 percent (Mauritius) to 73 percent (Burundi). The shares of food expenses in household budgets in Benin, Mozambique, and Uganda are close to the regional median. For the median country in the region, food accounts for 60 percent of the budget for households in the lowest quintile of the income distribution while it accounts for 49 percent of the budget for those in the highest quintile.
75 70 65 60 55 50 45 40 35 30 25 20
Burundi Congo, Dem. Rep. Central African Republic Liberia Rwanda Madagascar Lesotho Malawi São Tomé and Príncipe Niger Gambia, The Kenya Tanzania Chad Guinea Sierre Leone Guinea-Bissau Mali Mozambique Benin Uganda Ethiopia Côte d'Ivoire Zambia Maurtiania Burkina Faso Angola Ghana Senegal Togo Gabon Eswatini Cameroon Congo, Rep. Botswana Cabo Verde South Africa Mauritius
FIGURE 1.18: Food Share in Households’ Budgets across Sub-Saharan African Countries (% of total budget)
Percent of total budget
The share of spending on food is relatively high among the poor in Sub-Saharan African countries.
Source: International Household Survey Network. Note: Low, medium, and high food spending propensity is defined by the 33rd and 67th percentiles of the distribution of the national food budget share across 38 countries in the region. Budget shares do not account for household production.
Regional aggregates, however, hide the heterogeneity of food budget shares across quintiles of the income distribution. Figure 1.19 depicts the food budget shares for countries in the region with low (bottom tercile), intermediate, and high (top tercile) national food budget shares. Poorer households (Q1 and Q2) in countries with low food budget shares nationally tend to spend less than those with higher food budget shares. For instance, households in the bottom 20 percent of the income distribution tend to spend 51 percent of their budget on food in countries with low food spending propensity while that proportion climbs to 69 percent in countries with high food expenditures at the national level. While the top 20 percent households still spend 55 percent of their budgets on food in countries with high national food spending shares, that 36 Bogmans et al. (2022).
30
>
A F R I C A’ S P U L S E