REALITY CHECK: FORECASTING GROWTH IN THE MIDDLE EAST AND NORTH AFRICA IN TIMES OF UNCERTAINTY
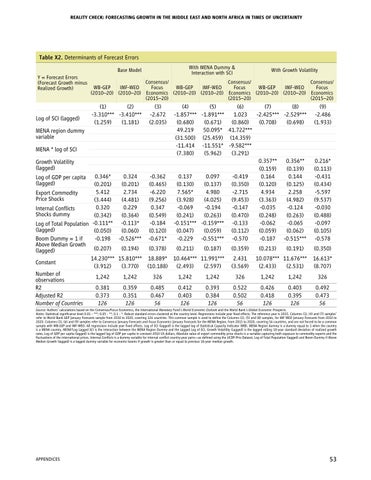
Table X2. Determinants of Forecast Errors With MENA Dummy & Interaction with SCI
Base Model Y = Forecast Errors (Forecast Growth minus Realized Growth)
Log of SCI (lagged) MENA region dummy variable MENA * log of SCI Growth Volatility (lagged)
Consensus/ Consensus/ Consensus/ WB-GEP IMF-WEO Focus WB-GEP IMF-WEO Focus WB-GEP IMF-WEO Focus (2010–20) (2010–20) Economics (2010–20) (2010–20) Economics (2010–20) (2010–20) Economics (2015–20) (2015–20) (2015–20)
(1) (2) -3.310*** -3.410*** (1.259) (1.181)
(3) -2.672 (2.035)
(4) (5) (6) (7) (8) -1.857*** -1.891*** 1.023 -2.425*** -2.529*** (0.680) (0.671) (0.860) (0.708) (0.698) 49.219 50.095* 41.722*** (31.500) (25.459) (14.359) -11.414 -11.551* -9.582*** (7.380) (5.962) (3.291) 0.357** 0.356** (0.159) (0.139) 0.137 0.097 -0.419 0.164 0.144 (0.130) (0.137) (0.350) (0.120) (0.125) 7.565* 4.980 -2.715 4.934 2.258 (3.928) (4.025) (9.453) (3.363) (4.982) -0.069 -0.194 -0.147 -0.035 -0.124 (0.241) (0.263) (0.470) (0.248) (0.263) -0.151*** -0.159*** -0.133 -0.062 -0.065 (0.047) (0.059) (0.112) (0.059) (0.062) -0.229 -0.551*** -0.570 -0.187 -0.515***
0.216* (0.113) -0.431 (0.434) -5.597 (9.537) -0.030 (0.488) -0.097 (0.105) -0.578
(0.359)
(0.350)
0.346* 0.324 -0.362 (0.201) (0.201) (0.465) 5.412 2.734 -6.220 Export Commodity Price Shocks (3.444) (4.481) (9.256) 0.320 0.229 0.347 Internal Conflicts Shocks dummy (0.342) (0.364) (0.549) -0.184 Log of Total Population -0.111** -0.113* (lagged) (0.050) (0.060) (0.120) Boom Dummy = 1 if -0.198 -0.526*** -0.671* Above Median Growth (0.207) (0.194) (0.378) (0.211) (0.187) (lagged) 14.230*** 15.810*** 18.889* 10.464*** 11.991*** Constant (3.912) (3.770) (10.188) (2.493) (2.597) Number of 1,242 1,242 326 1,242 1,242 observations R2 0.381 0.359 0.485 0.412 0.393 Adjusted R2 0.373 0.351 0.467 0.403 0.384 Number of Countries 126 126 56 126 126 Log of GDP per capita (lagged)
With Growth Volatility
2.431 (3.569)
(0.213)
(0.191)
10.078*** 11.676*** (2.433) (2.531)
(9) -2.486 (1.933)
16.613* (8.707)
326
1,242
1,242
326
0.522 0.502 56
0.426 0.418 126
0.403 0.395 126
0.492 0.473 56
Source: Authors’ calculations based on the Consensus/Focus Economics, the International Monetary Fund’s World Economic Outlook and the World Bank’s Global Economic Prospects. Notes: Statistical significance level 0.01 - ***; 0.05 - **; 0.1 - *. Robust standard errors clustered at the country level. Regressions include year fixed effects. The reference year is 2015. Columns (1), (4) and (7) samples’ refer to World Bank GEP January Forecasts sample from 2010 to 2020, covering 126 countries. This common sample is used to define the Columns (2), (5) and (8) samples, for IMF WEO January Forecasts from 2010 to 2020. Columns (3), (6) and (9) samples refer to Consensus January Forecasts and Focus Economics January Forecasts for the MENA Region, from 2015 to 2020, covering 56 countries, and are not forced to be a common sample with WB-GEP and IMF-WEO. All regressions include year fixed effects. Log of SCI (lagged) is the lagged log of Statistical Capacity Indicator (WB), MENA Region dummy is a dummy equal to 1 when the country is a MENA country, MENA*Log Lagged SCI is the interaction between the MENA Region Dummy and the Lagged Log of SCI, Growth Volatility (Lagged) is the lagged rolling 10-year standard deviation of realized growth rates, Log of GDP per capita (lagged) is the lagged log of GDP per capita in constant 2010 US dollars, Absolute value of export commodity price shocks is a variable capturing both exposure to commodity exports and the fluctuations of the international prices, Internal Conflicts is a dummy variable for internal conflict country-year pairs—as defined using the UCDP-Prio Dataset, Log of Total Population (lagged) and Boom Dummy if Above Median Growth (lagged) is a lagged dummy variable for economic booms if growth is greater than or equal to previous 10-year median growth.
Appendices
53
