Char t i n g t h e C o u r s e t o A N e w N o r m a l
Fourth, the model assumes flat (perfectly elastic) supply curves, an absence of general equilibrium effects, and no changes in international fuel prices that might result from multiple countries introducing mitigation policies at the same time. See also further discussion of these issues in IMF (2019b) and Parry, Mylonas, and Vernon (2021).
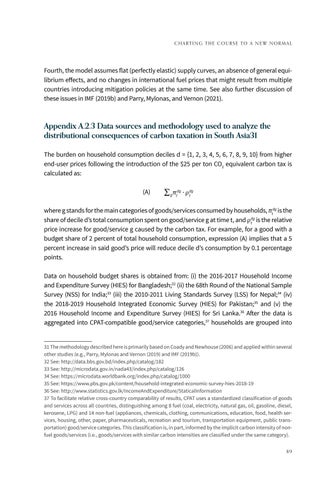
Appendix A.2.3 Data sources and methodology used to analyze the distributional consequences of carbon taxation in South Asia31 The burden on household consumption deciles d = {1, 2, 3, 4, 5, 6, 7, 8, 9, 10} from higher end-user prices following the introduction of the $25 per ton CO2 equivalent carbon tax is calculated as: (A) ∑ gπtdg ∙ ρtdg is the where g stands for the main categories of goods/services consumed by households, πtdg dg share of decile d’s total consumption spent on good/service g at time t, andρt is the relative price increase for good/service g caused by the carbon tax. For example, for a good with a budget share of 2 percent of total household consumption, expression (A) implies that a 5 percent increase in said good’s price will reduce decile d’s consumption by 0.1 percentage points. Data on household budget shares is obtained from: (i) the 2016-2017 Household Income and Expenditure Survey (HIES) for Bangladesh;32 (ii) the 68th Round of the National Sample Survey (NSS) for India;33 (iii) the 2010-2011 Living Standards Survey (LSS) for Nepal;34 (iv) the 2018-2019 Household Integrated Economic Survey (HIES) for Pakistan;35 and (v) the 2016 Household Income and Expenditure Survey (HIES) for Sri Lanka.36 After the data is aggregated into CPAT-compatible good/service categories,37 households are grouped into
31 The methodology described here is primarily based on Coady and Newhouse (2006) and applied within several other studies (e.g., Parry, Mylonas and Vernon (2019) and IMF (2019b)). 32 See: http://data.bbs.gov.bd/index.php/catalog/182 33 See: http://microdata.gov.in/nada43/index.php/catalog/126 34 See: https://microdata.worldbank.org/index.php/catalog/1000 35 See: https://www.pbs.gov.pk/content/household-integrated-economic-survey-hies-2018-19 36 See: http://www.statistics.gov.lk/IncomeAndExpenditure/StaticalInformation 37 To facilitate relative cross-country comparability of results, CPAT uses a standardized classification of goods and services across all countries, distinguishing among 8 fuel (coal, electricity, natural gas, oil, gasoline, diesel, kerosene, LPG) and 14 non-fuel (appliances, chemicals, clothing, communications, education, food, health services, housing, other, paper, pharmaceuticals, recreation and tourism, transportation equipment, public transportation) good/service categories. This classification is, in part, informed by the implicit carbon intensity of nonfuel goods/services (i.e., goods/services with similar carbon intensities are classified under the same category). 89


