TABLE 2.2
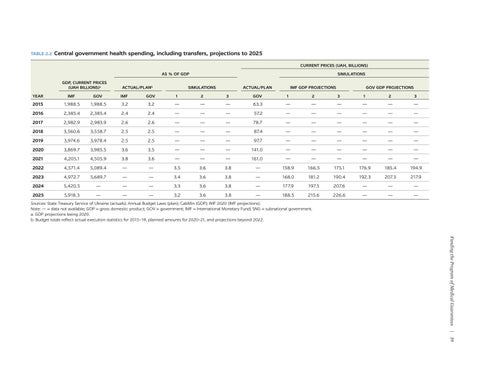
Central government health spending, including transfers, projections to 2025 CURRENT PRICES (UAH, BILLIONS) AS % OF GDP GDP, CURRENT PRICES (UAH BILLIONS)a
ACTUAL/PLANb
SIMULATIONS
SIMULATIONS
ACTUAL/PLAN
IMF GDP PROJECTIONS
GOV GDP PROJECTIONS
YEAR
IMF
GOV
IMF
GOV
1
2
3
GOV
1
2
3
1
2
3
2015
1,988.5
1,988.5
3.2
3.2
—
—
—
63.3
—
—
—
—
—
—
2016
2,385.4
2,385.4
2.4
2.4
—
—
—
57.2
—
—
—
—
—
—
2017
2,982.9
2,983.9
2.6
2.6
—
—
—
78.7
—
—
—
—
—
—
2018
3,560.6
3,558.7
2.5
2.5
—
—
—
87.4
—
—
—
—
—
—
2019
3,974.6
3,978.4
2.5
2.5
—
—
—
97.7
—
—
—
—
—
—
2020
3,869.7
3,985.5
3.6
3.5
—
—
—
141.0
—
—
—
—
—
—
2021
4,205.1
4,505.9
3.8
3.6
—
—
—
161.0
—
—
—
—
—
—
2022
4,571.4
5,089.4
—
—
3.5
3.6
3.8
—
158.9
166.5
175.1
176.9
185.4
194.9
2023
4,972.7
5,689.7
—
—
3.4
3.6
3.8
—
168.0
181.2
190.4
192.3
207.3
217.9
2024
5,420.5
—
—
—
3.3
3.6
3.8
—
177.9
197.5
207.6
—
—
—
2025
5,918.3
—
—
—
3.2
3.6
3.8
—
188.5
215.6
226.6
—
—
—
Sources: State Treasury Service of Ukraine (actuals); Annual Budget Laws (plan); CabMin (GDP); IMF 2020 (IMF projections). Note: — = data not available; GDP = gross domestic product; GOV = government; IMF = International Monetary Fund; SNG = subnational government. a. GDP projections being 2020. b. Budget totals reflect actual execution statistics for 2015–19, planned amounts for 2020–21, and projections beyond 2022.
Funding the Program of Medical Guarantees | 39