Improving Effective Coverage in Health

Page 98

IMPROVING EFFECTIVE COVERAGE IN HEALTH

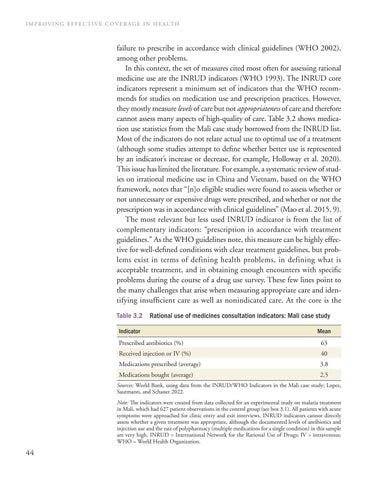
failure to prescribe in accordance with clinical guidelines (WHO 2002), among other problems. In this context, the set of measures cited most often for assessing rational medicine use are the INRUD indicators (WHO 1993). The INRUD core indicators represent a minimum set of indicators that the WHO recommends for studies on medication use and prescription practices. However, they mostly measure levels of care but not appropriateness of care and therefore cannot assess many aspects of high-quality of care. Table 3.2 shows medication use statistics from the Mali case study borrowed from the INRUD list. Most of the indicators do not relate actual use to optimal use of a treatment (although some studies attempt to define whether better use is represented by an indicator’s increase or decrease, for example, Holloway et al. 2020). This issue has limited the literature. For example, a systematic review of studies on irrational medicine use in China and Vietnam, based on the WHO framework, notes that “[n]o eligible studies were found to assess whether or not unnecessary or expensive drugs were prescribed, and whether or not the prescription was in accordance with clinical guidelines” (Mao et al. 2015, 9). The most relevant but less used INRUD indicator is from the list of complementary indicators: “prescription in accordance with treatment guidelines.” As the WHO guidelines note, this measure can be highly effective for well-defined conditions with clear treatment guidelines, but problems exist in terms of defining health problems, in defining what is acceptable treatment, and in obtaining enough encounters with specific problems during the course of a drug use survey. These few lines point to the many challenges that arise when measuring appropriate care and identifying insufficient care as well as nonindicated care. At the core is the Table 3.2

Rational use of medicines consultation indicators: Mali case study

Indicator

Mean

Prescribed antibiotics (%)

63

Received injection or IV (%)

40

Medications prescribed (average)

3.8

Medications bought (average)

2.5

Sources: World Bank, using data from the INRUD/WHO Indicators in the Mali case study; Lopez, Sautmann, and Schaner 2022. Note: The indicators were created from data collected for an experimental study on malaria treatment in Mali, which had 627 patient observations in the control group (see box 3.1). All patients with acute symptoms were approached for clinic entry and exit interviews. INRUD indicators cannot directly assess whether a given treatment was appropriate, although the documented levels of antibiotics and injection use and the rate of polypharmacy (multiple medications for a single condition) in this sample are very high. INRUD = International Network for the Rational Use of Drugs; IV = intravenous; WHO = World Health Organization.

44


Turn static files into dynamic content formats.

Create a flipbook

Articles inside

References

2min
pages 288-291

Building a forward-looking research agenda

1min
page 287

strategic purchasing

2min
page 286

Message 2: Support the four facility financing tenets Message 3: Understand PBF incentives in a broader health

5min
pages 281-283

Message 1: Recognize that sustainability is about more than just money

3min
pages 279-280

at the clinic

10min
pages 258-262

antenatal care

5min
pages 263-265

Conclusion

2min
page 269

PBF as a health system reform

6min
pages 266-268

7.3 Efficiency of effective coverage provision

7min
pages 254-257

coverage tree

5min
pages 250-252

financial incentives

3min
pages 248-249

Introduction Provision of nonindicated treatment in the context of

1min
page 247

6A.2 PBF and DFF interventions, by country, in the five countries in the pooled analysis of PBF versus DFF (Cameroon, Nigeria, Rwanda, Zambia, and Zimbabwe): Comparison of alternative financing approaches

10min
pages 229-236

Results from the meta-analysis

2min
page 213

PBF, DFF, and baseline effort

4min
pages 210-211

PBF, DFF, and institutional deliveries

2min
page 208

Discussion and conclusions

7min
pages 217-220

6.7 In Focus: PBF and equity

2min
page 206

consultations in Cameroon and Nigeria B6.7.1 Patient socioeconomic status, PBF, DFF, and know-can-do gaps

1min
page 205

6.2 Description of the PBF and DFF arms in Nigeria

1min
page 203

6.1 Geographic coverage of studies included in the meta-analysis

1min
page 195

interventions

3min
pages 189-190

6.1 Inclusion criteria for the systematic review and meta-analysis

4min
pages 191-192

preventive screening for noncommunicable diseases in Armenia

2min
page 188

Systematic review and meta-analysis of demand- and supply-side financial incentives

1min
page 187

6.1 In Focus: Kyrgyz Republic PBF pilot

2min
page 186

Introduction

1min
page 185

Conclusions

1min
page 178

know-can-do gap—in Cameroon and Nigeria

1min
page 177

5.3 In Focus: Measurement of worker motivation and satisfaction

2min
page 170

Results

1min
page 171

PBF, quality of care, and idle capacity

1min
page 176

paying for performance

6min
pages 167-169

six countries

1min
page 166

performance-based financing: The case of Argentina and Plan Nacer and Programa Sumar

6min
pages 163-165

Cameroon and Nigeria

1min
page 162

PBF, health system performance, and health worker effort in theory

1min
page 155

Evidence of the impact of PBF on the quality and quantity of health service delivery in LMICs Impact of PBF on health worker motivation and satisfaction in

2min
page 161

Introduction

7min
pages 151-154

health: An illustration

8min
pages 156-160

References

7min
pages 146-150

4A.3 Correlates of the know-can-do gap

2min
pages 137-138

Conclusions

6min
pages 132-134

4.2 In Focus: Does discrimination contribute to poor effort?

2min
page 130

of care

2min
page 123

countries

3min
pages 127-128

Why antenatal care?

1min
page 113

Results

3min
pages 117-118

Introduction

1min
page 111

Conclusions

1min
page 103

Mali case study

6min
pages 98-100

and maternal care

3min
page 97

Conclusions

1min
page 86

3.1 Summarizing the three gaps

1min
page 94

Theoretical framework for assessing quality of care

6min
pages 91-93

Introduction

3min
pages 89-90

effective coverage

1min
page 85

coverage and quality

1min
page 71

Empirical applications Expanding the work on effective coverage by using data collected in

1min
page 73

1 In Focus: Combining technological innovations to facilitate

2min
page 62

medical conditions

1min
page 74

References

4min
pages 64-66

Conclusions

1min
page 63

2.2 Coverage, quality, effective coverage, and the care cascade

1min
page 69

Introduction

1min
page 67
Issuu converts static files into: digital portfolios, online yearbooks, online catalogs, digital photo albums and more. Sign up and create your flipbook.
Improving Effective Coverage in Health by World Bank Publications - Issuu