Improving Effective Coverage in Health

Page 195

POLICY ALTERNATIVES TO PERFORMANCE-BASED FINANCING
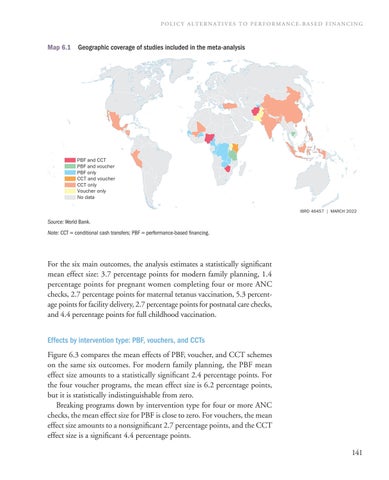
Map 6.1

Geographic coverage of studies included in the meta-analysis

PBF and CCT PBF and voucher PBF only CCT and voucher CCT only Voucher only No data IBRD 46457 | MARCH 2022

Source: World Bank. Note: CCT = conditional cash transfers; PBF = performance-based financing.

For the six main outcomes, the analysis estimates a statistically significant mean effect size: 3.7 percentage points for modern family planning, 1.4 percentage points for pregnant women completing four or more ANC checks, 2.7 percentage points for maternal tetanus vaccination, 5.3 percentage points for facility delivery, 2.7 percentage points for postnatal care checks, and 4.4 percentage points for full childhood vaccination. Effects by intervention type: PBF, vouchers, and CCTs Figure 6.3 compares the mean effects of PBF, voucher, and CCT schemes on the same six outcomes. For modern family planning, the PBF mean effect size amounts to a statistically significant 2.4 percentage points. For the four voucher programs, the mean effect size is 6.2 percentage points, but it is statistically indistinguishable from zero. Breaking programs down by intervention type for four or more ANC checks, the mean effect size for PBF is close to zero. For vouchers, the mean effect size amounts to a nonsignificant 2.7 percentage points, and the CCT effect size is a significant 4.4 percentage points. 141


Turn static files into dynamic content formats.

Create a flipbook

Articles inside

References

2min
pages 288-291

Building a forward-looking research agenda

1min
page 287

strategic purchasing

2min
page 286

Message 2: Support the four facility financing tenets Message 3: Understand PBF incentives in a broader health

5min
pages 281-283

Message 1: Recognize that sustainability is about more than just money

3min
pages 279-280

at the clinic

10min
pages 258-262

antenatal care

5min
pages 263-265

Conclusion

2min
page 269

PBF as a health system reform

6min
pages 266-268

7.3 Efficiency of effective coverage provision

7min
pages 254-257

coverage tree

5min
pages 250-252

financial incentives

3min
pages 248-249

Introduction Provision of nonindicated treatment in the context of

1min
page 247

6A.2 PBF and DFF interventions, by country, in the five countries in the pooled analysis of PBF versus DFF (Cameroon, Nigeria, Rwanda, Zambia, and Zimbabwe): Comparison of alternative financing approaches

10min
pages 229-236

Results from the meta-analysis

2min
page 213

PBF, DFF, and baseline effort

4min
pages 210-211

PBF, DFF, and institutional deliveries

2min
page 208

Discussion and conclusions

7min
pages 217-220

6.7 In Focus: PBF and equity

2min
page 206

consultations in Cameroon and Nigeria B6.7.1 Patient socioeconomic status, PBF, DFF, and know-can-do gaps

1min
page 205

6.2 Description of the PBF and DFF arms in Nigeria

1min
page 203

6.1 Geographic coverage of studies included in the meta-analysis

1min
page 195

interventions

3min
pages 189-190

6.1 Inclusion criteria for the systematic review and meta-analysis

4min
pages 191-192

preventive screening for noncommunicable diseases in Armenia

2min
page 188

Systematic review and meta-analysis of demand- and supply-side financial incentives

1min
page 187

6.1 In Focus: Kyrgyz Republic PBF pilot

2min
page 186

Introduction

1min
page 185

Conclusions

1min
page 178

know-can-do gap—in Cameroon and Nigeria

1min
page 177

5.3 In Focus: Measurement of worker motivation and satisfaction

2min
page 170

Results

1min
page 171

PBF, quality of care, and idle capacity

1min
page 176

paying for performance

6min
pages 167-169

six countries

1min
page 166

performance-based financing: The case of Argentina and Plan Nacer and Programa Sumar

6min
pages 163-165

Cameroon and Nigeria

1min
page 162

PBF, health system performance, and health worker effort in theory

1min
page 155

Evidence of the impact of PBF on the quality and quantity of health service delivery in LMICs Impact of PBF on health worker motivation and satisfaction in

2min
page 161

Introduction

7min
pages 151-154

health: An illustration

8min
pages 156-160

References

7min
pages 146-150

4A.3 Correlates of the know-can-do gap

2min
pages 137-138

Conclusions

6min
pages 132-134

4.2 In Focus: Does discrimination contribute to poor effort?

2min
page 130

of care

2min
page 123

countries

3min
pages 127-128

Why antenatal care?

1min
page 113

Results

3min
pages 117-118

Introduction

1min
page 111

Conclusions

1min
page 103

Mali case study

6min
pages 98-100

and maternal care

3min
page 97

Conclusions

1min
page 86

3.1 Summarizing the three gaps

1min
page 94

Theoretical framework for assessing quality of care

6min
pages 91-93

Introduction

3min
pages 89-90

effective coverage

1min
page 85

coverage and quality

1min
page 71

Empirical applications Expanding the work on effective coverage by using data collected in

1min
page 73

1 In Focus: Combining technological innovations to facilitate

2min
page 62

medical conditions

1min
page 74

References

4min
pages 64-66

Conclusions

1min
page 63

2.2 Coverage, quality, effective coverage, and the care cascade

1min
page 69

Introduction

1min
page 67
Issuu converts static files into: digital portfolios, online yearbooks, online catalogs, digital photo albums and more. Sign up and create your flipbook.