How to Harness the Power of Data and Inference | 399
BOX 6.6 (continued)
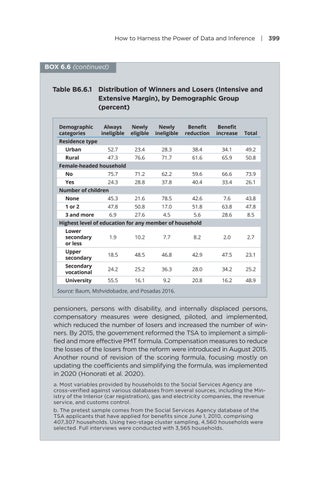
Table B6.6.1 Distribution of Winners and Losers (Intensive and Extensive Margin), by Demographic Group (percent) Demographic categories
Always ineligible
Newly eligible
Newly ineligible
Benefit reduction
Benefit increase
Total
Urban
52.7
23.4
28.3
38.4
34.1
49.2
Rural
47.3
76.6
71.7
61.6
65.9
50.8
Residence type
Female-headed household No
75.7
71.2
62.2
59.6
66.6
73.9
Yes
24.3
28.8
37.8
40.4
33.4
26.1
Number of children None
45.3
21.6
78.5
42.6
7.6
43.8
1 or 2
47.8
50.8
17.0
51.8
63.8
47.8
3 and more
6.9
27.6
4.5
5.6
28.6
8.5
Highest level of education for any member of household Lower secondary or less
1.9
10.2
7.7
8.2
2.0
2.7
Upper secondary
18.5
48.5
46.8
42.9
47.5
23.1
Secondary vocational
24.2
25.2
36.3
28.0
34.2
25.2
University
55.5
16.1
9.2
20.8
16.2
48.9
Source: Baum, Mshvidobadze, and Posadas 2016.
pensioners, persons with disability, and internally displaced persons, compensatory measures were designed, piloted, and implemented, which reduced the number of losers and increased the number of winners. By 2015, the government reformed the TSA to implement a simplified and more effective PMT formula. Compensation measures to reduce the losses of the losers from the reform were introduced in August 2015. Another round of revision of the scoring formula, focusing mostly on updating the coefficients and simplifying the formula, was implemented in 2020 (Honorati et al. 2020). a. Most variables provided by households to the Social Services Agency are cross-verified against various databases from several sources, including the Ministry of the Interior (car registration), gas and electricity companies, the revenue service, and customs control. b. The pretest sample comes from the Social Services Agency database of the TSA applicants that have applied for benefits since June 1, 2010, comprising 407,307 households. Using two-stage cluster sampling, 4,560 households were selected. Full interviews were conducted with 3,565 households.