OVERCONFIDENT: HOW ECONOMIC AND HEALTH FAULT LINES LEFT THE MIDDLE EAST AND NORTH AFRICA ILL-PREPARED TO FACE COVID-19
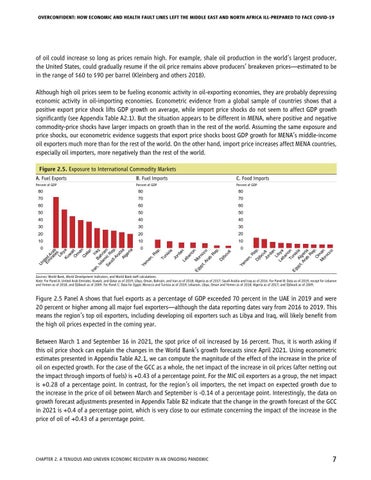
of oil could increase so long as prices remain high. For example, shale oil production in the world’s largest producer, the United States, could gradually resume if the oil price remains above producers’ breakeven prices—estimated to be in the range of $60 to $90 per barrel (Kleinberg and others 2018). Although high oil prices seem to be fueling economic activity in oil-exporting economies, they are probably depressing economic activity in oil-importing economies. Econometric evidence from a global sample of countries shows that a positive export price shock lifts GDP growth on average, while import price shocks do not seem to affect GDP growth significantly (see Appendix Table A2.1). But the situation appears to be different in MENA, where positive and negative commodity-price shocks have larger impacts on growth than in the rest of the world. Assuming the same exposure and price shocks, our econometric evidence suggests that export price shocks boost GDP growth for MENA’s middle-income oil exporters much more than for the rest of the world. On the other hand, import price increases affect MENA countries, especially oil importers, more negatively than the rest of the world. Figure 2.5. Exposure to International Commodity Markets C. Food Imports
Percent of GDP
Percent of GDP
60
50
50
50
40
40
40
30
30
30
20
20
20
10
10
10
0
0
0
,R
jib
en Ye m
jib D
D
ou
ti
ep
co
R ab
Eg
yp
t,
Ar
M
or
oc
no
n
an
ba Le
ia
ep
is
rd Jo
Tu n
,R en Ye m
ep
60
ou
70
60
.
80
70
.
80
70
U ni Emted iraAra te b s Li by Ku a w a O it m an Q at ar Ira n, B Iraq Is ah la ra m Sa ic in ud Re i A p. ra b Al ia ge ria
80
.
B. Fuel Imports
Percent of GDP
Jo ti rd an Li Le bya ba n Tu on ni Eg yp A sia t, lg Ar er ab ia R ep O . m M an or oc co
A. Fuel Exports
Sources: World Bank, World Development Indicators, and World Bank staff calculations. Note: For Panel A: United Arab Emirates, Kuwait, and Qatar as of 2019; Libya, Oman, Bahrain, and Iran as of 2018; Algeria as of 2017; Saudi Arabia and Iraq as of 2016. For Panel B: Data as of 2019, except for Lebanon and Yemen as of 2018; and Djibouti as of 2009. For Panel C: Data for Egypt, Morocco and Tunisia as of 2019; Lebanon, Libya, Oman and Yemen as of 2018; Algeria as of 2017; and Djibouti as of 2009.
Figure 2.5 Panel A shows that fuel exports as a percentage of GDP exceeded 70 percent in the UAE in 2019 and were 20 percent or higher among all major fuel exporters—although the data reporting dates vary from 2016 to 2019. This means the region’s top oil exporters, including developing oil exporters such as Libya and Iraq, will likely benefit from the high oil prices expected in the coming year. Between March 1 and September 16 in 2021, the spot price of oil increased by 16 percent. Thus, it is worth asking if this oil price shock can explain the changes in the World Bank’s growth forecasts since April 2021. Using econometric estimates presented in Appendix Table A2.1, we can compute the magnitude of the effect of the increase in the price of oil on expected growth. For the case of the GCC as a whole, the net impact of the increase in oil prices (after netting out the impact through imports of fuels) is +0.43 of a percentage point. For the MIC oil exporters as a group, the net impact is +0.28 of a percentage point. In contrast, for the region’s oil importers, the net impact on expected growth due to the increase in the price of oil between March and September is -0.14 of a percentage point. Interestingly, the data on growth forecast adjustments presented in Appendix Table B2 indicate that the change in the growth forecast of the GCC in 2021 is +0.4 of a percentage point, which is very close to our estimate concerning the impact of the increase in the price of oil of +0.43 of a percentage point.
Chapter 2. A Tenuous and Uneven Economic Recovery in an Ongoing Pandemic
7
