shifting gears
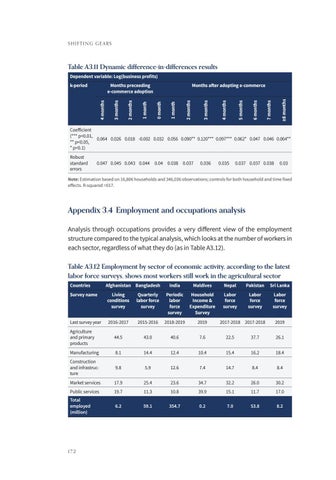
Table A3.11 Dynamic difference-in-differences results Dependent variable: Log(business profits)
≥8 months
7 months
6 months
5 months
4 months
3 months
2 months
1 month
Months after adopting e-commerce 0 month
1 month
2 months
3 months
Months preceeding e-commerce adoption 4 months
k-period
Coefficient (*** p<0.01, 0.064 0.026 0.018 -0.002 0.032 0.056 0.090** 0.120*** 0.097*** 0.062* 0.047 0.046 0.064** ** p<0.05, * p<0.1) Robust standard errors
0.047 0.045 0.043 0.044 0.04 0.038 0.037
0.036
0.035
0.037 0.037 0.038
0.03
Note: Estimation based on 16,806 households and 346,036 observations; controls for both household and time fixed effects. R-squared =017.
Appendix 3.4 Employment and occupations analysis Analysis through occupations provides a very different view of the employment structure compared to the typical analysis, which looks at the number of workers in each sector, regardless of what they do (as in Table A3.12). Table A3.12 Employment by sector of economic activity, according to the latest labor force surveys, shows most workers still work in the agricultural sector Countries
Afghanistan Bangladesh
India
Maldives
Nepal
Pakistan
Sri Lanka
Labor force survey
Labor force survey
Labor force survey
Survey name
Living conditions survey
Quarterly labor force survey
Periodic labor force survey
Household Income & Expenditure Survey
Last survey year
2016-2017
2015-2016
2018-2019
2019
Agriculture and primary products
44.5
43.0
40.6
7.6
22.5
37.7
26.1
Manufacturing
8.1
14.4
12.4
10.4
15.4
16.2
18.4
Construction and infrastructure
9.8
5.9
12.6
7.4
14.7
8.4
8.4
Market services
17.9
25.4
23.6
34.7
32.2
26.0
30.2
Public services
19.7
11.3
10.8
39.9
15.1
11.7
17.0
Total employed (million)
6.2
59.1
354.7
0.2
7.0
53.8
8.2
172
2017-2018 2017-2018
2019


