Assessing the Global Value Chain Links between Asia and Sub-Saharan Africa 197
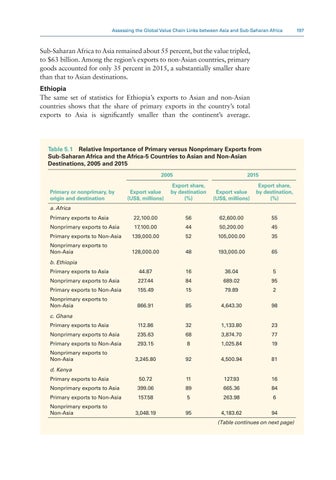
Sub-Saharan Africa to Asia remained about 55 percent, but the value t ripled, to $63 billion. Among the region’s exports to non-Asian countries, primary goods accounted for only 35 percent in 2015, a substantially smaller share than that to Asian destinations. Ethiopia The same set of statistics for Ethiopia’s exports to Asian and non-Asian countries shows that the share of primary exports in the country’s total exports to Asia is significantly smaller than the continent’s average.
Table 5.1 Relative Importance of Primary versus Nonprimary Exports from Sub-Saharan Africa and the Africa-5 Countries to Asian and Non-Asian Destinations, 2005 and 2015 2005 Primary or nonprimary, by origin and destination
2015
Export value (US$, millions)
Export share, by destination (%)
Export value (US$, millions)
Export share, by destination, (%)
a. Africa Primary exports to Asia
22,100.00
56
62,600.00
55
Nonprimary exports to Asia
17,100.00
44
50,200.00
45
Primary exports to Non-Asia
139,000.00
52
105,000.00
35
Nonprimary exports to Non-Asia
128,000.00
48
193,000.00
65
b. Ethiopia Primary exports to Asia
44.87
16
36.04
5
Nonprimary exports to Asia
227.44
84
689.02
95
Primary exports to Non-Asia
155.49
15
79.89
2
Nonprimary exports to Non-Asia
866.91
85
4,643.30
98
Primary exports to Asia
112.86
32
1,133.80
23
Nonprimary exports to Asia
235.63
68
3,874.70
77
Primary exports to Non-Asia
293.15
8
1,025.84
19
3,245.80
92
4,500.94
81
Primary exports to Asia
50.72
11
127.93
16
Nonprimary exports to Asia
399.06
89
665.36
84
Primary exports to Non-Asia
157.58
5
263.98
6
3,048.19
95
4,183.62
94
c. Ghana
Nonprimary exports to Non-Asia d. Kenya
Nonprimary exports to Non-Asia
(Table continues on next page)

