118 Africa in the New Trade Environment
food exports to the United States increased at the same pace, but from a much lower base (US$350 million in 2000, less than a quarter of the value of exports to the EU). Similarly, ECOWAS countries’ exports of chemicals to the EU increased from US$100 million in 2000 to US$810 million in 2013 (figure 3.3, panel c), and their exports of plastics to the EU increased from US$110 million in 2000 to US$910 million in 2011 (figure 3.3, panel d), posting average annual growth rates of 17 percent and 22 percent, respectively. ECOWAS exports of vehicles and automobile parts to the EU increased from US$350 million in 2000 to US$1.5 billion in 2007, before plunging to less than US$150 million by 2012 (figure 3.3, panel d). However, ECOWAS exports of apparel to the EU consistently decreased, from US$210 million in 2000 to US$67 million in 2015 (an average annual negative growth rate of 6 percent) (figure 3.3, panel f). Nonmineral exports to the US, by sector. By contrast, ECOWAS exports of these categories of goods to the United States have been very low, with less-marked trends except for food and plastic products (figure 3.3, panels b and d). ECOWAS exports of food to the United States increased from US$350 million in 2000 (less than one-fourth the exports to the EU) to US$1.2 billion in 2015 (one-fifth the exports to the EU), posting an average annual growth rate of 9 percent. ECOWAS exports of plastics to the United States increased from US$50 million in 2000 to a maximum of US$360 million in 2011, before declining and stabilizing at around US$100 million in 2015. The rest of this chapter assesses whether these differences (in volume and composition) in ECOWAS exports to the EU and the US result from differences in the design and implementation of the AGOA and EBA. The chapter also makes inferences about the potential impacts on ECOWAS countries of redesigning these two preferential trade agreements.
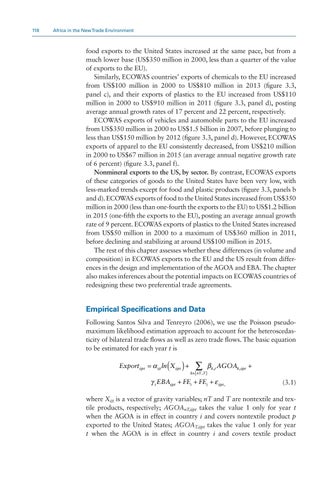
Empirical Specifications and Data Following Santos Silva and Tenreyro (2006), we use the Poisson pseudomaximum likelihood estimation approach to account for the heteroscedasticity of bilateral trade flows as well as zero trade flows. The basic equation to be estimated for each year t is
(
) {∑ }β
Export ijpt = α ijt ln Xijpt +
k∈ nT ,T
k ,t
AGOAk,ijpt +
γ t EBAijpt + FEi + FEj + ε ijpt ,
(3.1)
where Xijt is a vector of gravity variables; nT and T are nontextile and textile products, respectively; AGOAnT,ijpt takes the value 1 only for year t when the AGOA is in effect in country i and covers nontextile product p exported to the United States; AGOAT,ijpt takes the value 1 only for year t when the AGOA is in effect in country i and covers textile product


