Population-Wide Interventions to Prevent NCDs | 137
settings—have found no beneficial effect and no reduction in calories purchased due to calorie labeling on restaurant menus. The lack of effectiveness may be because consumers are not clear about what to do with calorie information. This is similar to the problem raised by the NIP. Therefore, instead of calorie labeling, simple FOP symbols indicating which foods to consume or avoid may be more effective. One randomized control trial compared restaurant menus with either no sodium label (control) or 1 of 13 simple sodium warning labels that varied the text, icons, and colors used. The results suggest that logos—both traffic lights and red stop signs—significantly reduce sodium ordered compared to the controls (Musicus et al. 2019). Whereas the literature suggests that the introduction of nutrition standards in schools is effective, little is known about the impact of banning unhealthy foods and beverages from hospitals and public health facilities (table 7.13). Setting nutrition standards in schools has been shown to reduce the sale of unhealthy foods and drinks and to decrease the consumption of high-sugar drinks and unhealthy snacks. Little evidence exists on setting nutrition standards in hospitals and public facilities. Small pilot programs and citywide programs encouraging hospitals to implement nutrition standards have been implemented, but no major national efforts have been evaluated as yet. Evidence suggests that product reformulation—both voluntary and mandatory—can be effective in improving the nutritional quality of the food supply (table 7.14). After labeling requirements for trans fatty acids (TFAs) went into effect in the United States, some food manufacturers reduced or removed TFAs from packaged foods (Otite et al. 2013). A reformulation program in Canada that imposed voluntary TFA limits on vegetable oils and margarine was associated with a decline in TFA consumption (Ratnayake et al. 2009). A mandate limiting TFA content in take-out food restaurants in New York City was associated with lower TFA intake per purchase (Angell et al. 2012). In response to pressure from governments and public health organizations such as the WHO, food manufacturers—including Kellogg’s, Nestlé, and Unilever—voluntarily reduced the amount of sodium in their products (Kloss et al. 2015). A voluntary sodium
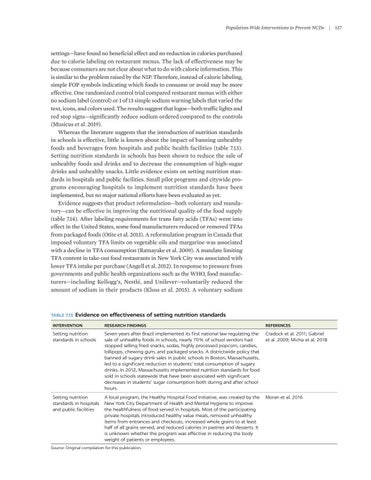
TABLE 7.13 Evidence
on effectiveness of setting nutrition standards
INTERVENTION
RESEARCH FINDINGS
REFERENCES
Setting nutrition standards in schools
Seven years after Brazil implemented its first national law regulating the sale of unhealthy foods in schools, nearly 70% of school vendors had stopped selling fried snacks, sodas, highly processed popcorn, candies, lollipops, chewing gum, and packaged snacks. A districtwide policy that banned all sugary drink sales in public schools in Boston, Massachusetts, led to a significant reduction in students’ total consumption of sugary drinks. In 2012, Massachusetts implemented nutrition standards for food sold in schools statewide that have been associated with significant decreases in students’ sugar consumption both during and after school hours.
Cradock et al. 2011; Gabriel et al. 2009; Micha et al. 2018
Setting nutrition standards in hospitals and public facilities
A local program, the Healthy Hospital Food Initiative, was created by the New York City Department of Health and Mental Hygiene to improve the healthfulness of food served in hospitals. Most of the participating private hospitals introduced healthy value meals, removed unhealthy items from entrances and checkouts, increased whole grains to at least half of all grains served, and reduced calories in pastries and desserts. It is unknown whether the program was effective in reducing the body weight of patients or employees.
Moran et al. 2016
Source: Original compilation for this publication.
