94 | Noncommunicable Diseases in Saudi Arabia
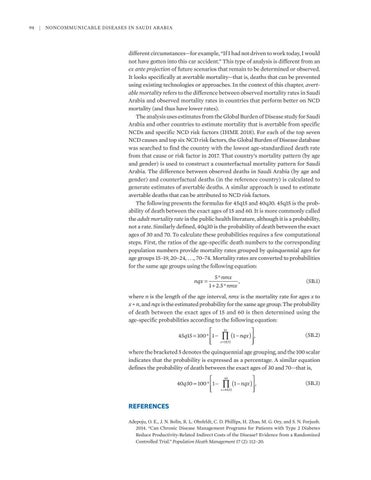
different circumstances—for example, “If I had not driven to work today, I would not have gotten into this car accident.” This type of analysis is different from an ex ante projection of future scenarios that remain to be determined or observed. It looks specifically at avertable mortality—that is, deaths that can be prevented using existing technologies or approaches. In the context of this chapter, avertable mortality refers to the difference between observed mortality rates in Saudi Arabia and observed mortality rates in countries that perform better on NCD mortality (and thus have lower rates). The analysis uses estimates from the Global Burden of Disease study for Saudi Arabia and other countries to estimate mortality that is avertable from specific NCDs and specific NCD risk factors (IHME 2018). For each of the top seven NCD causes and top six NCD risk factors, the Global Burden of Disease database was searched to find the country with the lowest age-standardized death rate from that cause or risk factor in 2017. That country’s mortality pattern (by age and gender) is used to construct a counterfactual mortality pattern for Saudi Arabia. The difference between observed deaths in Saudi Arabia (by age and gender) and counterfactual deaths (in the reference country) is calculated to generate estimates of avertable deaths. A similar approach is used to estimate avertable deaths that can be attributed to NCD risk factors. The following presents the formulas for 45q15 and 40q30. 45q15 is the probability of death between the exact ages of 15 and 60. It is more commonly called the adult mortality rate in the public health literature, although it is a probability, not a rate. Similarly defined, 40q30 is the probability of death between the exact ages of 30 and 70. To calculate these probabilities requires a few computational steps. First, the ratios of the age-specific death numbers to the corresponding population numbers provide mortality rates grouped by quinquennial ages for age groups 15–19, 20–24, . . ., 70–74. Mortality rates are converted to probabilities for the same age groups using the following equation:
nqx =
5* nmx , (5B.1) 1 + 2.5* nmx
where n is the length of the age interval, nmx is the mortality rate for ages x to x + n, and nqx is the estimated probability for the same age group. The probability of death between the exact ages of 15 and 60 is then determined using the age-specific probabilities according to the following equation:
45q15 = 100* 1 −
55
x =15( 5)
∏ (1 − nqx ) , (5B.2)
where the bracketed 5 denotes the quinquennial age grouping, and the 100 scalar indicates that the probability is expressed as a percentage. A similar equation defines the probability of death between the exact ages of 30 and 70—that is,
40q30 = 100* 1 −
65
x =30( 5)
∏ (1 − nqx ) , (5B.3)
REFERENCES Adepoju, O. E., J. N. Bolin, R. L. Ohsfeldt, C. D. Phillips, H. Zhao, M. G. Ory, and S. N. Forjuoh. 2014. “Can Chronic Disease Management Programs for Patients with Type 2 Diabetes Reduce Productivity-Related Indirect Costs of the Disease? Evidence from a Randomized Controlled Trial.” Population Heath Management 17 (2): 112–20.

