Employment in Crisis

Page 66

Employment in Crisis

Transition rate

Transition rate

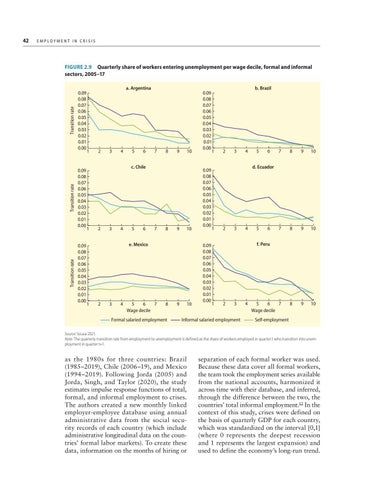
FIGURE 2.9  Quarterly share of workers entering unemployment per wage decile, formal and informal sectors, 2005–17

Transition rate

42

0.09 0.08 0.07 0.06 0.05 0.04 0.03 0.02 0.01 0.00

0.09 0.08 0.07 0.06 0.05 0.04 0.03 0.02 0.01 0.00

0.09 0.08 0.07 0.06 0.05 0.04 0.03 0.02 0.01 0.00

a. Argentina

1

2

3

4

5

6

7

8

9

10

c. Chile

1

2

3

4

5

6

7

8

9

10

e. Mexico

1

2

3

4

5 6 7 Wage decile

8

Formal salaried employment

9

10

0.09 0.08 0.07 0.06 0.05 0.04 0.03 0.02 0.01 0.00 1

0.09 0.08 0.07 0.06 0.05 0.04 0.03 0.02 0.01 0.00

0.09 0.08 0.07 0.06 0.05 0.04 0.03 0.02 0.01 0.00

b. Brazil

2

3

4

5

6

7

8

9

10

7

8

9

10

5 6 7 Wage decile

8

9

10

d. Ecuador

1

2

3

4

5

6

f. Peru

1

2

3

Informal salaried employment

4

Self-employment

Source: Sousa 2021. Note: The quarterly transition rate from employment to unemployment is defined as the share of workers employed in quarter t who transition into unemployment in quarter t+1.

as the 1980s for three countries: Brazil (1985–2019), Chile (2006–19), and Mexico (1994–2019). Following Jorda (2005) and Jorda, Singh, and Taylor (2020), the study estimates impulse response functions of total, formal, and informal employment to crises. The authors created a new monthly linked employer-employee database using annual administrative data from the social security records of each country (which include administrative longitudinal data on the countries’ formal labor markets). To create these data, information on the months of hiring or

separation of each formal worker was used. Because these data cover all formal workers, the team took the employment series available from the national accounts, harmonized it across time with their database, and inferred, through the difference between the two, the countries’ total informal employment.12 In the context of this study, crises were defined on the basis of quarterly GDP for each country, which was standardized on the interval [0,1] (where 0 represents the deepest recession and 1 represents the largest expansion) and used to define the economy’s long-run trend.


Turn static files into dynamic content formats.

Create a flipbook

Articles inside

References

23min
pages 151-159

Notes

6min
pages 149-150

Conclusion

6min
pages 147-148

4.18 Tackling structural issues that worsen the impacts of crises on workers

1min
page 146

4.12 Employment and reemployment policies, by the nature of the shock causing displacement

5min
pages 130-131

4.4 Permanent, systemic shocks: Responses to job dislocation caused by structural changes

3min
page 132

4.6 Evidence on the effects of place-based policies on mobility and labor market outcomes

3min
page 145

4.17 Labor market regulation instruments and the duration of unemployment

15min
pages 139-143

4.11 Positive effects of welfare transfers on local formal employment

5min
pages 126-127

4.5 How well have regional policies performed at strengthening economic opportunities?

3min
page 144

4.1 Family allowances as de facto unemployment insurance

3min
page 123

4.8 Insufficient support, with many left behind

2min
page 122

selected LAC countries

2min
page 121

Aggregate: Stronger macroeconomic stabilizers

6min
pages 106-107

4.1 Landscape of formal unemployment income support in the LAC region

2min
page 112

4.1 How adjustment works and a triple entry of policies to smooth it

1min
page 105

4.1 Unemployment insurance throughout the world

1min
page 113

Introduction

8min
pages 101-103

Three key policy dimensions

3min
page 104

References

11min
pages 96-100

Notes

3min
page 95

Places: The role of local opportunities and informality

6min
pages 92-93

Introduction

5min
pages 75-76

Workers: A bigger toll on the unskilled

6min
pages 77-78

Conclusion

3min
page 68

3.1 Effect on wages of displacement caused by plant closings in Mexico

3min
page 79

and informal sectors, 2005–17

1min
page 66

A changing employment structure and the disappearance of good jobs

3min
page 65

2.2 Cyclicality of net flows across sectors and out of employment, 2005–17

6min
pages 55-56

Key insights

15min
pages 29-33

References

5min
pages 42-43

Labor market flows: Unemployment versus informality

2min
page 50

Introduction

8min
pages 47-49

Notes

3min
page 41

1.4 Addressing crises’ impacts and preparing workers for change: Policy reforms

1min
page 39

1.3 Stabilizers and macroeconomic frameworks: Policy reforms

7min
pages 36-38

Rationale for this report

1min
page 25
Issuu converts static files into: digital portfolios, online yearbooks, online catalogs, digital photo albums and more. Sign up and create your flipbook.