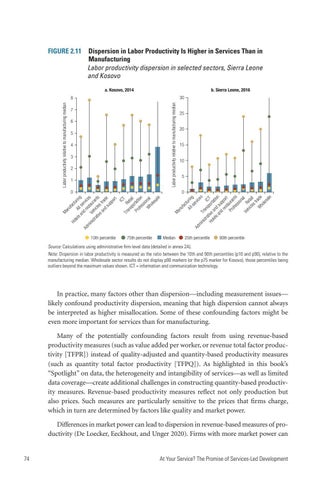
FIGURE 2.11 Dispersion in Labor Productivity Is Higher in Services Than in Manufacturing Labor productivity dispersion in selected sectors, Sierra Leone and Kosovo a. Kosovo, 2014
b. Sierra Leone, 2016 30 Labor productivity relative to manufacturing median
Labor productivity relative to manufacturing median
8 7 6 5 4 3 2 1 0
20 15 10 5
ct All urin se g r vi Ad ce mi s nis Tra tra ns IC p t T i Ho ve ort tel an ati s a d s on nd up res por ta t Pr ura ofe nt ss s ion a Ve R l hic eta les il tr W ade ho les ale
Ho
tel
Ma nu fa
fac
tu s a All ring nd ser Ad res vice mi nis Ve taur s tra hic an tiv les ts ea nd trad su e pp ort ICT Tr an Ret sp ail o Pr rtat ofe ion ss i W onal ho les ale
0
nu Ma
25
10th percentile
75th percentile
Median
25th percentile
90th percentile
Source: Calculations using administrative firm-level data (detailed in annex 2A). Note: Dispersion in labor productivity is measured as the ratio between the 10th and 90th percentiles (p10 and p90), relative to the manufacturing median. Wholesale sector results do not display p90 markers (or the p75 marker for Kosovo), those percentiles being outliers beyond the maximum values shown. ICT = information and communication technology.
In practice, many factors other than dispersion—including measurement issues— likely confound productivity dispersion, meaning that high dispersion cannot always be interpreted as higher misallocation. Some of these confounding factors might be even more important for services than for manufacturing. Many of the potentially confounding factors result from using revenue-based productivity measures (such as value added per worker, or revenue total factor productivity [TFPR]) instead of quality-adjusted and quantity-based productivity measures (such as quantity total factor productivity [TFPQ]). As highlighted in this book’s “Spotlight” on data, the heterogeneity and intangibility of services—as well as limited data coverage—create additional challenges in constructing quantity-based productivity measures. Revenue-based productivity measures reflect not only production but also prices. Such measures are particularly sensitive to the prices that firms charge, which in turn are determined by factors like quality and market power. Differences in market power can lead to dispersion in revenue-based measures of productivity (De Loecker, Eeckhout, and Unger 2020). Firms with more market power can 74
At Your Service? The Promise of Services-Led Development
