h alt He
rat Re ive tai Ot l an he d rs su Ar a pp nd oc ts, ort p ial en ter erso , com na m tai ls u nm erv nit en ice y, t, an s dr ec rea tio Tr n an Ac sp co or mm tat od ion ati on an Inf df orm oo d ati on W an h o dc l om esal mu e t n Pr ofe echn icat o io ss ion logy n al, an sc d t ie ec nti hn fic ica , l Fin an ce Ed uc ati on
45 40 35 30 25 20 15 10 5 0
Ad m
ini st
Share of services employment (%)
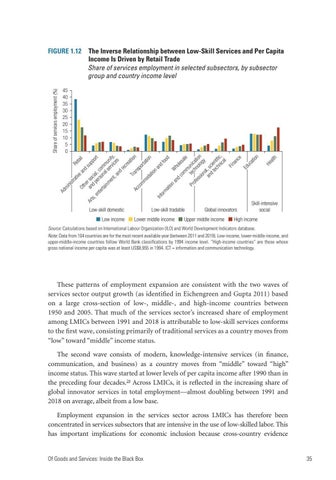
FIGURE 1.12 The Inverse Relationship between Low-Skill Services and Per Capita Income Is Driven by Retail Trade Share of services employment in selected subsectors, by subsector group and country income level
Low-skill domestic Low income
Low-skill tradable Lower middle income
Global innovators
Upper middle income
Skill-intensive social
High income
Source: Calculations based on International Labour Organization (ILO) and World Development Indicators database. Note: Data from 104 countries are for the most recent available year (between 2011 and 2019). Low-income, lower-middle-income, and upper-middle-income countries follow World Bank classifications by 1994 income level. “High-income countries” are those whose gross national income per capita was at least US$8,955 in 1994. ICT = information and communication technology.
These patterns of employment expansion are consistent with the two waves of s ervices sector output growth (as identified in Eichengreen and Gupta 2011) based on a large cross-section of low-, middle-, and high-income countries between 1950 and 2005. That much of the services sector’s increased share of employment among LMICs between 1991 and 2018 is attributable to low-skill services conforms to the first wave, consisting primarily of traditional services as a country moves from “low” toward “middle” income status. The second wave consists of modern, knowledge-intensive services (in finance, communication, and business) as a country moves from “middle” toward “high” income status. This wave started at lower levels of per capita income after 1990 than in the preceding four decades.29 Across LMICs, it is reflected in the increasing share of global innovator services in total employment—almost doubling between 1991 and 2018 on average, albeit from a low base. Employment expansion in the services sector across LMICs has therefore been c oncentrated in services subsectors that are intensive in the use of low-skilled labor. This has important implications for economic inclusion because cross-country evidence Of Goods and Services: Inside the Black Box
35
