At Your Service?

Page 48

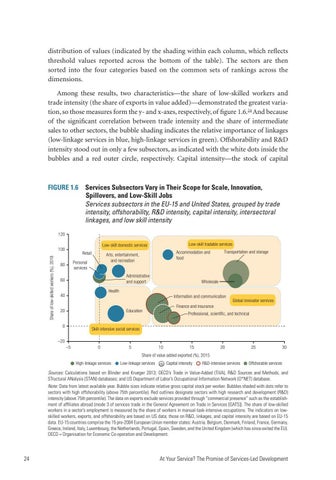
distribution of values (indicated by the shading within each column, which reflects threshold values reported across the bottom of the table). The sectors are then sorted into the four categories based on the common sets of rankings across the dimensions. Among these results, two characteristics—the share of low-skilled workers and trade intensity (the share of exports in value added)—demonstrated the greatest variation, so those measures form the y- and x-axes, respectively, of figure 1.6.24 And because of the significant correlation between trade intensity and the share of intermediate sales to other sectors, the bubble shading indicates the relative importance of linkages (low-linkage services in blue, high-linkage services in green). Offshorability and R&D intensity stood out in only a few subsectors, as indicated with the white dots inside the bubbles and a red outer circle, respectively. Capital intensity—the stock of capital

FIGURE 1.6  Services Subsectors Vary in Their Scope for Scale, Innovation, Spillovers, and Low-Skill Jobs Services subsectors in the EU-15 and United States, grouped by trade intensity, offshorability, R&D intensity, capital intensity, intersectoral linkages, and low skill intensity 120

Share of low-skilled workers (%), 2018

Low-skill tradable services

Low-skill domestic services

100

Retail

Arts, entertainment, and recreation

Personal services

80

Accommodation and food

Administrative and support

60

Transportation and storage

Wholesale

Health

40

Information and communication

20

Education

0

Global innovator services

Finance and insurance Professional, scientific, and technical

Skill-intensive social services

–20 –5

0

5

10

15

20

25

30

Share of value added exported (%), 2015 High-linkage services

Low-linkage services

Capital intensity

R&D-intensive services

Offshorable services

Sources: Calculations based on Blinder and Krueger 2013; OECD’s Trade in Value-Added (TiVA), R&D Sources and Methods, and STructural ANalysis (STAN) databases; and US Department of Labor’s Occupational Information Network (O*NET) database. Note: Data from latest available year. Bubble sizes indicate relative gross capital stock per worker. Bubbles shaded with dots refer to sectors with high offshorability (above 75th percentile). Red outlines designate sectors with high research and development (R&D) intensity (above 75th percentile). The data on exports exclude services provided through “commercial presence” such as the establishment of affiliates abroad (mode 3 of services trade in the General Agreement on Trade in Services [GATS]). The share of low-skilled workers in a sector’s employment is measured by the share of workers in manual-task-intensive occupations. The indicators on lowskilled workers, exports, and offshorability are based on US data; those on R&D, linkages, and capital intensity are based on EU-15 data. EU-15 countries comprise the 15 pre-2004 European Union member states: Austria, Belgium, Denmark, Finland, France, Germany, Greece, Ireland, Italy, Luxembourg, the Netherlands, Portugal, Spain, Sweden, and the United Kingdom (which has since exited the EU). OECD = Organisation for Economic Co-operation and Development.

24

At Your Service? The Promise of Services-Led Development


Turn static files into dynamic content formats.

Create a flipbook

Articles inside

Inform the Priorities in the 4Ts Agenda

1hr
pages 279-309

Highest Forward Linkages across Sectors

3min
pages 273-274

Practices Is Associated with Higher Sales per Employee

1min
page 269

Countries with Higher Tertiary Enrollment Rates

3min
pages 267-268

Their Lack of ICT Skills Is a Constraint to Employment or Higher Earnings

1min
page 266

B5.2.2 Product Market Regulation in Network and Professional Services Is Higher in LMICs Than in HICs—and Highest in Rail Transportation and Legal Services in Both Groups of Countries

10min
pages 261-265

Can Be Mapped to Each of the 4Ts, but Some of the Relationships Overlap

1min
page 252

Forward and Backward Linkages to Other Sectors Are Included

23min
pages 240-251

Intensity Have Both Roughly Tripled

5min
pages 235-237

Attributable to Services Inputs

7min
pages 231-234

Subsector Groups to Serve Domestic Intermediate Demand

3min
pages 225-226

Exports from LMICs

1min
page 213

Services Exports

1min
page 212

Skill-Intensive Social Services, Especially through FDI

32min
pages 192-206

Labor Productivity

8min
pages 188-191

Industrialization

6min
pages 208-210

B3.3.1 COVID-19 Has Accelerated the Use of Digital Technologies and Home-Based Work Most among Firms in Global Innovator Services

4min
pages 186-187

4.4 Services That Predominantly Serve Final Demand Are Less Exported

2min
page 211

of the Largest English-Language Online Freelancing Platforms Live in LMICs B3.2.1 Most ICT Firms Predict an Increase in Employment for Highly Skilled

12min
pages 177-182

Discernible Increase among Firms in Global Innovator Services

1min
page 173

3.9 AI or ML Software Is Used More Widely in High-Income Countries

3min
pages 170-171

Services and Skill-Intensive Social Services

1min
page 168

in the Number of Online Freelancers

5min
pages 160-162

S.1 Examples of More Careful Price Measurement for Services

10min
pages 138-142

2B.1 Alternative Measures of Scale Confirm That Scale Is Lower in Most Services Subsectors Than in Manufacturing, Except in Administrative and Support Services

26min
pages 126-137

2A.1 Overview of Firm-Level Data

2min
pages 124-125

2.19 Services Are More Likely Than Manufacturers to Be Intensive in ICT Capital

1min
page 112

Men and Women

7min
pages 119-121

B2.2.2 Household Surveys Show That, on Average, 38 Percent of Services Workers Stopped Working in 2020

2min
page 109

B2.1.2 The Importance of Informality in Services Relative to Manufacturing Is Most Pronounced When Comparing Shares of Employment and Value Added

4min
pages 89-90

2.11 Dispersion in Labor Productivity Is Higher in Services Than in Manufacturing

6min
pages 98-100

Average ICT and Manufacturing Establishments Are Close in Size

1min
page 87

B2.1.1 Most Informal Enterprises Operate in Retail Services

1min
page 88

1A.1 Service Subsectors, by UN ISIC Rev. 4 Classification

32min
pages 67-82

Income Is Driven by Retail Trade

1min
page 59

“Commercial Presence” Abroad, but “Cross-Border Supply” and “Consumption Abroad” Matter for Some Subsectors

4min
pages 51-52

Employ Informal Workers

4min
pages 61-62

Lower in Services Than in Manufacturing

4min
pages 44-45

Industry to Aggregate Labor Productivity Growth since the 1990s

12min
pages 34-39

Goods in Their Implications for Productivity and Jobs, but These Are Changing with the Advent of Digital Technologies

8min
pages 40-43

and Low-Skill Jobs

6min
pages 48-50

the 1990s

1min
page 32
Issuu converts static files into: digital portfolios, online yearbooks, online catalogs, digital photo albums and more. Sign up and create your flipbook.