20
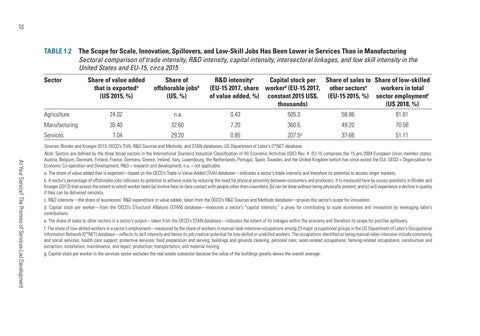
TABLE 1.2 The Scope for Scale, Innovation, Spillovers, and Low-Skill Jobs Has Been Lower in Services Than in Manufacturing Sectoral comparison of trade intensity, R&D intensity, capital intensity, intersectoral linkages, and low skill intensity in the United States and EU-15, circa 2015 Sector
R&D intensityc Share of sales to Share of low-skilled Capital stock per workers in total (EU-15 2017, share workerd (EU-15 2017, other sectorse of value added, %) constant 2015 US$, (EU-15 2015, %) sector employmentf thousands) (US 2018, %)
Share of value added that is exporteda (US 2015, %)
Share of offshorable jobsb (US, %)
Agriculture
24.02
n.a.
0.43
505.3
Manufacturing
35.40
32.60
7.20
360.6
7.04
29.20
0.85
207.5
Services
g
58.86
91.81
49.20
70.58
37.66
51.11
At Your Service? The Promise of Services-Led Development
Sources: Blinder and Krueger 2013; OECD’s TiVA, R&D Sources and Methods, and STAN databases; US Department of Labor’s O*NET database. Note: Sectors are defined by the three broad sectors in the International Standard Industrial Classification of All Economic Activities (ISIC) Rev. 4. EU-15 comprises the 15 pre-2004 European Union member states: Austria, Belgium, Denmark, Finland, France, Germany, Greece, Ireland, Italy, Luxembourg, the Netherlands, Portugal, Spain, Sweden, and the United Kingdom (which has since exited the EU). OECD = Organisation for Economic Co-operation and Development; R&D = research and development; n.a. = not applicable. a. The share of value added that is exported—based on the OECD’s Trade in Value-Added (TiVA) database—indicates a sector’s trade intensity and therefore its potential to access larger markets. b. A sector’s percentage of offshorable jobs indicates its potential to achieve scale by reducing the need for physical proximity between consumers and producers. It is measured here by survey questions in Blinder and Krueger (2013) that assess the extent to which worker tasks (a) involve face-to-face contact with people other than coworkers; (b) can be done without being physically present; and (c) will experience a decline in quality if they can be delivered remotely. c. R&D intensity—the share of businesses’ R&D expenditure in value added, taken from the OECD’s R&D Sources and Methods database—proxies the sector’s scope for innovation. d. Capital stock per worker—from the OECD’s STructural ANalysis (STAN) database—measures a sector’s “capital intensity,” a proxy for contributing to scale economies and innovation by leveraging labor’s contributions. e. The share of sales to other sectors in a sector’s output—taken from the OECD’s STAN database—indicates the extent of its linkages within the economy and therefore its scope for positive spillovers. f. The share of low-skilled workers in a sector’s employment—measured by the share of workers in manual-task-intensive occupations among 23 major occupational groups in the US Department of Labor’s Occupational Information Network (O*NET) database—reflects its skill intensity and hence its job creation potential for low-skilled or unskilled workers. The occupations identified as being manual-labor-intensive include community and social services; health care support; protective services; food preparation and serving; buildings and grounds cleaning; personal care; sales-related occupations; farming-related occupations; construction and extraction; installation, maintenance, and repair; production; transportation; and material moving. g. Capital stock per worker in the services sector excludes the real estate subsector because the value of the buildings greatly skews the overall average.
