At Your Service?

Page 208

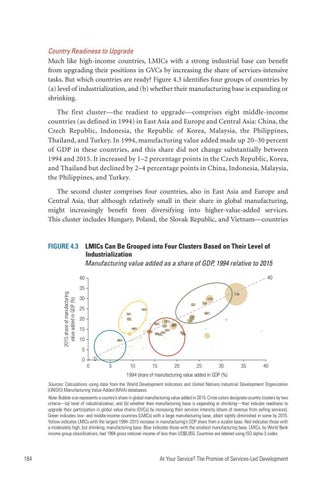
Country Readiness to Upgrade Much like high-income countries, LMICs with a strong industrial base can benefit from upgrading their positions in GVCs by increasing the share of services-intensive tasks. But which countries are ready? Figure 4.3 identifies four groups of countries by (a) level of industrialization, and (b) whether their manufacturing base is expanding or shrinking. The first cluster—the readiest to upgrade—comprises eight middle-income countries (as defined in 1994) in East Asia and Europe and Central Asia: China, the Czech Republic, Indonesia, the Republic of Korea, Malaysia, the Philippines, Thailand, and Turkey. In 1994, manufacturing value added made up 20–30 ­percent of GDP in these countries, and this share did not change substantially between 1994 and 2015. It increased by 1–2 ­percentage points in the Czech Republic, Korea, and Thailand but declined by 2–4 ­percentage points in China, Indonesia, Malaysia, the Philippines, and Turkey. The second cluster comprises four countries, also in East Asia and Europe and Central Asia, that although relatively small in their share in global manufacturing, might increasingly benefit from diversifying into higher-value-added services. This cluster includes Hungary, Poland, the Slovak Republic, and Vietnam—countries

FIGURE 4.3  LMICs Can Be Grouped into Four Clusters Based on Their Level of Industrialization Manufacturing value added as a share of GDP, 1994 relative to 2015 40

40 2015 share of manufacturing value added in GDP (%)

35 CHN

30

KOR THA

CZE

25

HUN SVK

20

POL

15

VNM

10

MYS

IDN PHL TUR MEX BGD ARG EGY IND PER RUS PAK ZAF IRNCOL CHL

NGA

5 0

0 0

5

10

15

20

25

30

35

40

1994 share of manufacturing value added in GDP (%) Sources: Calculations using data from the World Development Indicators and United Nations Industrial Development Organization (UNIDO) Manufacturing Value Added (MVA) databases. Note: Bubble size represents a country’s share in global manufacturing value added in 2015. Circle colors designate country clusters by two criteria—(a) level of industrialization, and (b) whether their manufacturing base is expanding or shrinking—that indicate readiness to upgrade their participation in global value chains (GVCs) by increasing their services intensity (share of revenue from selling services). Green indicates low- and middle-income countries (LMICs) with a large manufacturing base, albeit sightly diminished in some by 2015. Yellow indicates LMICs with the largest 1994–2015 increase in manufacturing’s GDP share from a sizable base. Red indicates those with a moderately high, but shrinking, manufacturing base. Blue indicates those with the smallest manufacturing base. LMICs, by World Bank income group classifications, had 1994 gross national income of less than US$8,955. Countries are labeled using ISO alpha-3 codes.

184

At Your Service? The Promise of Services-Led Development


Turn static files into dynamic content formats.

Create a flipbook

Articles inside

Inform the Priorities in the 4Ts Agenda

1hr
pages 279-309

Highest Forward Linkages across Sectors

3min
pages 273-274

Practices Is Associated with Higher Sales per Employee

1min
page 269

Countries with Higher Tertiary Enrollment Rates

3min
pages 267-268

Their Lack of ICT Skills Is a Constraint to Employment or Higher Earnings

1min
page 266

B5.2.2 Product Market Regulation in Network and Professional Services Is Higher in LMICs Than in HICs—and Highest in Rail Transportation and Legal Services in Both Groups of Countries

10min
pages 261-265

Can Be Mapped to Each of the 4Ts, but Some of the Relationships Overlap

1min
page 252

Forward and Backward Linkages to Other Sectors Are Included

23min
pages 240-251

Intensity Have Both Roughly Tripled

5min
pages 235-237

Attributable to Services Inputs

7min
pages 231-234

Subsector Groups to Serve Domestic Intermediate Demand

3min
pages 225-226

Exports from LMICs

1min
page 213

Services Exports

1min
page 212

Skill-Intensive Social Services, Especially through FDI

32min
pages 192-206

Labor Productivity

8min
pages 188-191

Industrialization

6min
pages 208-210

B3.3.1 COVID-19 Has Accelerated the Use of Digital Technologies and Home-Based Work Most among Firms in Global Innovator Services

4min
pages 186-187

4.4 Services That Predominantly Serve Final Demand Are Less Exported

2min
page 211

of the Largest English-Language Online Freelancing Platforms Live in LMICs B3.2.1 Most ICT Firms Predict an Increase in Employment for Highly Skilled

12min
pages 177-182

Discernible Increase among Firms in Global Innovator Services

1min
page 173

3.9 AI or ML Software Is Used More Widely in High-Income Countries

3min
pages 170-171

Services and Skill-Intensive Social Services

1min
page 168

in the Number of Online Freelancers

5min
pages 160-162

S.1 Examples of More Careful Price Measurement for Services

10min
pages 138-142

2B.1 Alternative Measures of Scale Confirm That Scale Is Lower in Most Services Subsectors Than in Manufacturing, Except in Administrative and Support Services

26min
pages 126-137

2A.1 Overview of Firm-Level Data

2min
pages 124-125

2.19 Services Are More Likely Than Manufacturers to Be Intensive in ICT Capital

1min
page 112

Men and Women

7min
pages 119-121

B2.2.2 Household Surveys Show That, on Average, 38 Percent of Services Workers Stopped Working in 2020

2min
page 109

B2.1.2 The Importance of Informality in Services Relative to Manufacturing Is Most Pronounced When Comparing Shares of Employment and Value Added

4min
pages 89-90

2.11 Dispersion in Labor Productivity Is Higher in Services Than in Manufacturing

6min
pages 98-100

Average ICT and Manufacturing Establishments Are Close in Size

1min
page 87

B2.1.1 Most Informal Enterprises Operate in Retail Services

1min
page 88

1A.1 Service Subsectors, by UN ISIC Rev. 4 Classification

32min
pages 67-82

Income Is Driven by Retail Trade

1min
page 59

“Commercial Presence” Abroad, but “Cross-Border Supply” and “Consumption Abroad” Matter for Some Subsectors

4min
pages 51-52

Employ Informal Workers

4min
pages 61-62

Lower in Services Than in Manufacturing

4min
pages 44-45

Industry to Aggregate Labor Productivity Growth since the 1990s

12min
pages 34-39

Goods in Their Implications for Productivity and Jobs, but These Are Changing with the Advent of Digital Technologies

8min
pages 40-43

and Low-Skill Jobs

6min
pages 48-50

the 1990s

1min
page 32
Issuu converts static files into: digital portfolios, online yearbooks, online catalogs, digital photo albums and more. Sign up and create your flipbook.
At Your Service? by World Bank Publications - Issuu