At Your Service?

Page 126

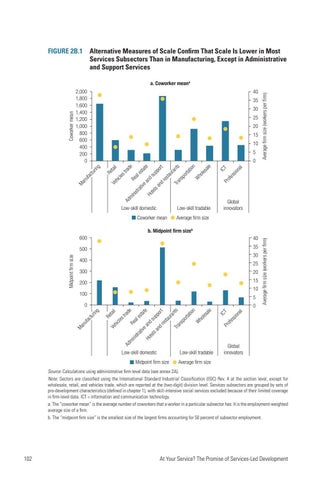
FIGURE 2B.1  Alternative Measures of Scale Confirm That Scale Is Lower in Most Services Subsectors Than in Manufacturing, Except in Administrative and Support Services

35 30 25 20 15 10 5

al ss

ion

ICT

ofe Pr

ale

W

ho

les

on ati

ts

ort sp

Tra n

tau

ran

ort pp

Ad

mi

Ho

nis

tel

tra

sa

tiv

nd

ea

nd

res

su

es al

Re

Ve h

Ma

tat e

de tra

es

Re

icl

tur fac nu

tai l

0

Average firm size (workers per firm)

40

2,000 1,800 1,600 1,400 1,200 1,000 800 600 400 200 0

ing

Coworker mean

a. Coworker meana

Low-skill domestic

Low-skill tradable

Coworker mean

Global innovators

Average firm size

40

500

35 30

400

25

300

20

200

15 10

100

5

0

na l ss io

ICT

Pr ofe

ds up

tel sa

Ho

str ati

ve

an

al Re

Ad

mi ni

po nd rt res tau ran ts Tra ns po rta tio n W ho les ale

e es tat

de

es

tra

l tai Re

Ve hic l

Ma n

ufa c

tur

ing

0

Average firm size (workers per firm)

Midpoint firm size

b. Midpoint firm sizeb 600

Low-skill domestic

Low-skill tradable

Midpoint firm size

Global innovators

Average firm size

Source: Calculations using administrative firm-level data (see annex 2A). Note: Sectors are classified using the International Standard Industrial Classification (ISIC) Rev. 4 at the section level, except for wholesale, retail, and vehicles trade, which are reported at the (two-digit) division level. Services subsectors are grouped by sets of pro-development characteristics (defined in chapter 1), with skill-intensive social services excluded because of their limited coverage in firm-level data. ICT = information and communication technology. a. The “coworker mean” is the average number of coworkers that a worker in a particular subsector has. It is the employment-weighted average size of a firm. b. The “midpoint firm size” is the smallest size of the largest firms accounting for 50 percent of subsector employment.

102

At Your Service? The Promise of Services-Led Development


Turn static files into dynamic content formats.

Create a flipbook

Articles inside

Inform the Priorities in the 4Ts Agenda

1hr
pages 279-309

Highest Forward Linkages across Sectors

3min
pages 273-274

Practices Is Associated with Higher Sales per Employee

1min
page 269

Countries with Higher Tertiary Enrollment Rates

3min
pages 267-268

Their Lack of ICT Skills Is a Constraint to Employment or Higher Earnings

1min
page 266

B5.2.2 Product Market Regulation in Network and Professional Services Is Higher in LMICs Than in HICs—and Highest in Rail Transportation and Legal Services in Both Groups of Countries

10min
pages 261-265

Can Be Mapped to Each of the 4Ts, but Some of the Relationships Overlap

1min
page 252

Forward and Backward Linkages to Other Sectors Are Included

23min
pages 240-251

Intensity Have Both Roughly Tripled

5min
pages 235-237

Attributable to Services Inputs

7min
pages 231-234

Subsector Groups to Serve Domestic Intermediate Demand

3min
pages 225-226

Exports from LMICs

1min
page 213

Services Exports

1min
page 212

Skill-Intensive Social Services, Especially through FDI

32min
pages 192-206

Labor Productivity

8min
pages 188-191

Industrialization

6min
pages 208-210

B3.3.1 COVID-19 Has Accelerated the Use of Digital Technologies and Home-Based Work Most among Firms in Global Innovator Services

4min
pages 186-187

4.4 Services That Predominantly Serve Final Demand Are Less Exported

2min
page 211

of the Largest English-Language Online Freelancing Platforms Live in LMICs B3.2.1 Most ICT Firms Predict an Increase in Employment for Highly Skilled

12min
pages 177-182

Discernible Increase among Firms in Global Innovator Services

1min
page 173

3.9 AI or ML Software Is Used More Widely in High-Income Countries

3min
pages 170-171

Services and Skill-Intensive Social Services

1min
page 168

in the Number of Online Freelancers

5min
pages 160-162

S.1 Examples of More Careful Price Measurement for Services

10min
pages 138-142

2B.1 Alternative Measures of Scale Confirm That Scale Is Lower in Most Services Subsectors Than in Manufacturing, Except in Administrative and Support Services

26min
pages 126-137

2A.1 Overview of Firm-Level Data

2min
pages 124-125

2.19 Services Are More Likely Than Manufacturers to Be Intensive in ICT Capital

1min
page 112

Men and Women

7min
pages 119-121

B2.2.2 Household Surveys Show That, on Average, 38 Percent of Services Workers Stopped Working in 2020

2min
page 109

B2.1.2 The Importance of Informality in Services Relative to Manufacturing Is Most Pronounced When Comparing Shares of Employment and Value Added

4min
pages 89-90

2.11 Dispersion in Labor Productivity Is Higher in Services Than in Manufacturing

6min
pages 98-100

Average ICT and Manufacturing Establishments Are Close in Size

1min
page 87

B2.1.1 Most Informal Enterprises Operate in Retail Services

1min
page 88

1A.1 Service Subsectors, by UN ISIC Rev. 4 Classification

32min
pages 67-82

Income Is Driven by Retail Trade

1min
page 59

“Commercial Presence” Abroad, but “Cross-Border Supply” and “Consumption Abroad” Matter for Some Subsectors

4min
pages 51-52

Employ Informal Workers

4min
pages 61-62

Lower in Services Than in Manufacturing

4min
pages 44-45

Industry to Aggregate Labor Productivity Growth since the 1990s

12min
pages 34-39

Goods in Their Implications for Productivity and Jobs, but These Are Changing with the Advent of Digital Technologies

8min
pages 40-43

and Low-Skill Jobs

6min
pages 48-50

the 1990s

1min
page 32
Issuu converts static files into: digital portfolios, online yearbooks, online catalogs, digital photo albums and more. Sign up and create your flipbook.