At Your Service?

Page 124

But potential exists even in some of the lower-productivity services. The existence of productivity gaps between low- and high-income countries in the productivity of low-skill services (highlighted in chapter 1) provides some hope that a productivity catch-up is possible. The next chapters will look more deeply at the potential contribution of digital technologies to productivity and jobs and at the role of services firms as upstream enablers and downstream complements of the activities to which they are linked. Finally, as chapters 3 and 4 will explore, the growing importance of digital technologies can increase opportunities for scale and innovation among low-skill services, while increased linkages of the global innovator services with other sectors can spread the productivity benefits more widely.

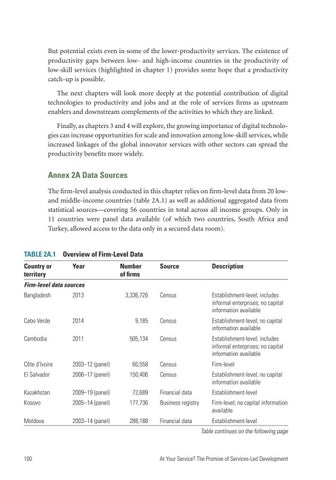
Annex 2A Data Sources The firm-level analysis conducted in this chapter relies on firm-level data from 20 lowand middle-income countries (table 2A.1) as well as additional aggregated data from statistical sources—covering 56 countries in total across all income groups. Only in 11 countries were panel data available (of which two countries, South Africa and Turkey, allowed access to the data only in a secured data room). TABLE 2A.1  Overview of Firm-Level Data Country or territory

Year

Number of firms

Source

Description

Firm-level data sources Bangladesh

2013

3,336,726

Census

Establishment-level; includes informal enterprises; no capital information available

Cabo Verde

2014

9,185

Census

Establishment-level; no capital information available

Cambodia

2011

505,134

Census

Establishment-level; includes informal enterprises; no capital information available

Côte d’Ivoire

2003–12 (panel)

60,558

Census

Firm-level

El Salvador

2006–17 (panel)

150,406

Census

Establishment-level; no capital information available

Kazakhstan

2009–19 (panel)

72,689

Financial data

Establishment-level

Kosovo

2005–14 (panel)

177,736

Business registry

Firm-level; no capital information available

Moldova

2003–14 (panel)

288,188

Financial data

Establishment-level

Table continues on the following page

100

At Your Service? The Promise of Services-Led Development


Turn static files into dynamic content formats.

Create a flipbook

Articles inside

Inform the Priorities in the 4Ts Agenda

1hr
pages 279-309

Highest Forward Linkages across Sectors

3min
pages 273-274

Practices Is Associated with Higher Sales per Employee

1min
page 269

Countries with Higher Tertiary Enrollment Rates

3min
pages 267-268

Their Lack of ICT Skills Is a Constraint to Employment or Higher Earnings

1min
page 266

B5.2.2 Product Market Regulation in Network and Professional Services Is Higher in LMICs Than in HICs—and Highest in Rail Transportation and Legal Services in Both Groups of Countries

10min
pages 261-265

Can Be Mapped to Each of the 4Ts, but Some of the Relationships Overlap

1min
page 252

Forward and Backward Linkages to Other Sectors Are Included

23min
pages 240-251

Intensity Have Both Roughly Tripled

5min
pages 235-237

Attributable to Services Inputs

7min
pages 231-234

Subsector Groups to Serve Domestic Intermediate Demand

3min
pages 225-226

Exports from LMICs

1min
page 213

Services Exports

1min
page 212

Skill-Intensive Social Services, Especially through FDI

32min
pages 192-206

Labor Productivity

8min
pages 188-191

Industrialization

6min
pages 208-210

B3.3.1 COVID-19 Has Accelerated the Use of Digital Technologies and Home-Based Work Most among Firms in Global Innovator Services

4min
pages 186-187

4.4 Services That Predominantly Serve Final Demand Are Less Exported

2min
page 211

of the Largest English-Language Online Freelancing Platforms Live in LMICs B3.2.1 Most ICT Firms Predict an Increase in Employment for Highly Skilled

12min
pages 177-182

Discernible Increase among Firms in Global Innovator Services

1min
page 173

3.9 AI or ML Software Is Used More Widely in High-Income Countries

3min
pages 170-171

Services and Skill-Intensive Social Services

1min
page 168

in the Number of Online Freelancers

5min
pages 160-162

S.1 Examples of More Careful Price Measurement for Services

10min
pages 138-142

2B.1 Alternative Measures of Scale Confirm That Scale Is Lower in Most Services Subsectors Than in Manufacturing, Except in Administrative and Support Services

26min
pages 126-137

2A.1 Overview of Firm-Level Data

2min
pages 124-125

2.19 Services Are More Likely Than Manufacturers to Be Intensive in ICT Capital

1min
page 112

Men and Women

7min
pages 119-121

B2.2.2 Household Surveys Show That, on Average, 38 Percent of Services Workers Stopped Working in 2020

2min
page 109

B2.1.2 The Importance of Informality in Services Relative to Manufacturing Is Most Pronounced When Comparing Shares of Employment and Value Added

4min
pages 89-90

2.11 Dispersion in Labor Productivity Is Higher in Services Than in Manufacturing

6min
pages 98-100

Average ICT and Manufacturing Establishments Are Close in Size

1min
page 87

B2.1.1 Most Informal Enterprises Operate in Retail Services

1min
page 88

1A.1 Service Subsectors, by UN ISIC Rev. 4 Classification

32min
pages 67-82

Income Is Driven by Retail Trade

1min
page 59

“Commercial Presence” Abroad, but “Cross-Border Supply” and “Consumption Abroad” Matter for Some Subsectors

4min
pages 51-52

Employ Informal Workers

4min
pages 61-62

Lower in Services Than in Manufacturing

4min
pages 44-45

Industry to Aggregate Labor Productivity Growth since the 1990s

12min
pages 34-39

Goods in Their Implications for Productivity and Jobs, but These Are Changing with the Advent of Digital Technologies

8min
pages 40-43

and Low-Skill Jobs

6min
pages 48-50

the 1990s

1min
page 32
Issuu converts static files into: digital portfolios, online yearbooks, online catalogs, digital photo albums and more. Sign up and create your flipbook.